Embed Size (px)
Citation preview
IMPROVEMENT OF WHEAT PRODUCTIVITY BY USING
SOME BIOFERTILIZERS AND ANTIOXIDANTS
BY
REDA MOHAMMED YOSEEF ZEWAIL B. Sc. Agric. Sci. (Plant pathology), Moshtohor
Faculty of Agriculture, Zagazig Univ., 2004
A THESIS
Submitted in Partial Fulfillment of The
Requirements for the Degree of
MASTER OF SCIENCE
IN
AGRICULTURE BOTANY
AGRICULTURAL BOTANY DEPARTMENT
FACULY OF AGRICULTURE
BENHA UNIVERSITY
2007
Abstract
Two filed experiment were conducted from Res. Expt . Cent., Fac. Agric.,
Moshtohor Benha. Univ. during 2005/2006 and 2006/2007 growing seasons. To study
the effect of bio and mineral NPK levels(Complete strength C.S, half strength and
quarter strength) and antioxidants treatments (0, Vit. C, Vit E and mixture Vit. C+E)
on growth, yield and yield component and chemical composition of wheat plants Cv
sakha 93.Results showed that. Studied wheat characters (i.e. growth, yield and yield
component and chemical composition) were positively affected increased with
increasing mineral NPK fertilizer up to CS and combination with biofertilizers in both
seasons. Wheat grains soaking and spraying with Vit.C at 150 mg/l increased growth
parameters, grain yield components and chemical composition in wheat plants during
in both seasons. The interaction between CS mineral NPK and biofertilizer with Vit.C
increased growth, yield and yield components and chemical composition of wheat
plants during first and second seasons.
ACKNOWLEDGEMENT
Firstly my unlimited thanks to “ALLAH”
The author wishes to express his deepest gratitude and sincere appreciation to
Prof. Dr. Said Ali El- Desouky, Prof. Dr. Zakaria M. Khedr and associate. Prof. Dr.
Amira A. El- Nabraway professors of Botany, Faculty of Agriculture, Benha University
for their valuable supervision, continuous help and constructive criticism throughout
the course of this study. Their guidance and encouragement during the stage of writing
this manuscript were outstanding and memorable.
Extended thank to staff and members of Botany department Faculty of
Agriculture, Benha University, for providing by the all required things in executing
this manuscript. Their keen friendly feeling and help during of great help, especially
Prof. Dr. Hosny M. Ebd-El-Dayem Professor of plant physiology, and Head of Botany
Dept. Faculty of Agriculture, Benha University, Dr Mohamed Mady Lecture of
Botany Dept. Fac. Agric Benha Univ. and thanks a lot of prof. Dr. Mohamed N. Omar
Head research in research institute at Agriculture ministure on help me of the practical
part of this study.
At last but not the last my heartily thanks are devoted to my parents for their
excellent and incredible care during me entire life. Some lovely feeling goes to
brothers and sisters.
Reda Zewail.
INTRODUCTION
Wheat plant (Triticum aestivum. L) is the most important plant in family
poaceae, from cereal crops because it has an international nutritional human feeding.
The wheat plants considered one of the main cereal crops not only in Egypt but also all
over the world.
In Egypt, the production of wheat grains is insufficient for local consumption.
Egyptian Ministry of Agriculture is trying to close up or reduce the increasing
gap between production and consumption of wheat grains. That is could be
achieved by increasing wheat yield per unit area either by introducing high
yielding variets and/ or using new methods to increase the yield for example by
using biofertilizers and antioxidants.
Biofertilizers one of the important management that assist to increase
productivity and the reduction of using chemical fertilizers and alteration by
biofertilizer treatments.
Nitrogen, phosphorus and potassium are a major essential macronutrients for
plant growth and development and soluble p and k fertilizers are commonly applied to
replace removed minerals. When phosphate is added into soils as a fertilizer in
relatively soluble and plant available forms, it is easily converted into insoluble
complexes with calcium carbonate, aluminum silicate consequently, to achieve
optimum crop yields either by soluble phosphate fertilizers or biofertilizers have to be
applied at high rates which cause unmanageable excess of phosphate application and
environmental and economic problems.
Biofertilizers mean that some microorganisms to be added to the soil as
inoculum during plant growth. Biofertilizers increase growth characteristics (e.g. plant
height, tillers number and leaf area) by active biosynthesis of growth regulators and
production of growth regulators by many microorganisms especialy those being fixing
nitrogen ( Zaghloul et al. 1996; Vessey, 2003 and Han et al, 2006).
Bacteria solubilizing phosphate is one important in Egyptian soil because that
bacteria provide the soil to change in the alkaline case to acidity one thereby assay
phosphorus uptake by the plant.
Bacteria solublizing potassium to assay the potassium uptake by the roots. All
microorganisms solublizing phosphorus and potassium produced of Glycolic acid
thereby could decrease alkalinity.
On the other hand, antioxidants is one of new methods to assist the plant to
tolerate any environmental conditions and increased plant growth, cell cycle through
plant growth and plant protect of any ROS (Reactive Oxygen Spices ) and increased
Rubisco sub unit, photosynthetic pigments thereby increased chlorophyll contents ,
increased photosynthetic rate, increased productivity by plants (Chen and Gallie,
2006 and Inskbashi and Iwaya, 2006 ).
In this respect, ascorbic acid (Vit.C ) is the major antioxidant in plant known
to increase the productivity. Also, alpha tocopherol is the major antioxidant that play a
role to protect the plant in environmental stress conditions.
The main objectives of the present study are:
The first objective is the minimizing of using chemical fertilizers and exchange
that by biofertilizer treatments.
-Reduction of using chemical fertilizers because they cause pollution of soil and
human food and exchange that with fixing nitrogen bacteria (Azospirillum brasilense)
Decrease amount of applied phosphorus fertilizer and exchange that by using
the bacteria that solublize phosphorus compounds (Bacillus megaterium vr
phosphaticum) loading to decrease soil alkalinity and assay phosphorus uptake by
plant.
Minimizing the amouant of potassium fertilizer and exchange that by (Bacillus
circulans) and increase mineral uptake by plant.
The second objective of this study:
Increase the growth and yield by using certain antioxidants, i.e., ascorbic acid
(Vit. C) and alpha tocopherol (Vit. E) to stimulate the growth and grain yield in wheat
plants.
MATERIAL AND METHODES
Two filed experiments were carried out at the Experimental farm station of the faculty of
Agriculture, Moshtohor, Benha University during the two growing including winter
seasons of 2006 and 2007.
To find out the response of wheat (Triticum aestivum L) sakha 93 cv to some
biofertilizers treatment (Azospirillum brasilense, Bacillus megaterium vr
phosphaticum and Bacillus circulanus) ,chemical fertilizers including nitrogen,
phosphorus and potassium at strength of 1/4, 1/2 and full recommended rates (i.e.
100kg N/ fed, 23.5 kg P2O5/ fed and 48 kg K2O/fed) with four levels of antioxidants
(i.e. Vit.C, (Ascorbic acid) at 150 mg /l, Vit.E+selinum (α Tocopherole) 150 mg
/lSel(600µg/l) and mixter of Vit.C+E 150 mg / l respectively on wheat productivity.
The Experimental design split plot design with three replications was followed. The main
plot of biofertilizers with chemical fertilizers (six treatments) and the sub plot included the
antioxidants (four treatments) the plot area used was 1/400 fed 3 x 3.5 m2 (i. e.10.5 m2).
The Experimental treatments:
A- Bio and chemical fertilizers
1- Control.
2- Biofertilizers (i.e. A. brasilense, B. megaterium and B. circulanus).
3- Recommended rates of chemical fertilizers (i. e. N, P and K full recommended.
4- 1/4 strength with biofertilizers ( i. e. A. brasilense, B. megaterium and B.
circulanus).
5- 1/2 strength with biofertilizers (i. e. A. brasilense, B. megaterium and B.
circulanus).
6- Complete strength of N, P and K as recommended for wheat cultivation with
biofertilizers ( i.e. A. brasilense, B. megaterium and B. circulanus).
B-Antioxidants :
A-Zero
B- Vit.C (Ascorbic acid) at 150 mg /l.
C-Mixture of Vit. E (α Tocopherole) at 150 mg /L +Sel 600µg/l).
D- Mixture of Vit C 150 mg /l.+VE (α Tocopherole) 150 mg /l +Sel 600µg/l).
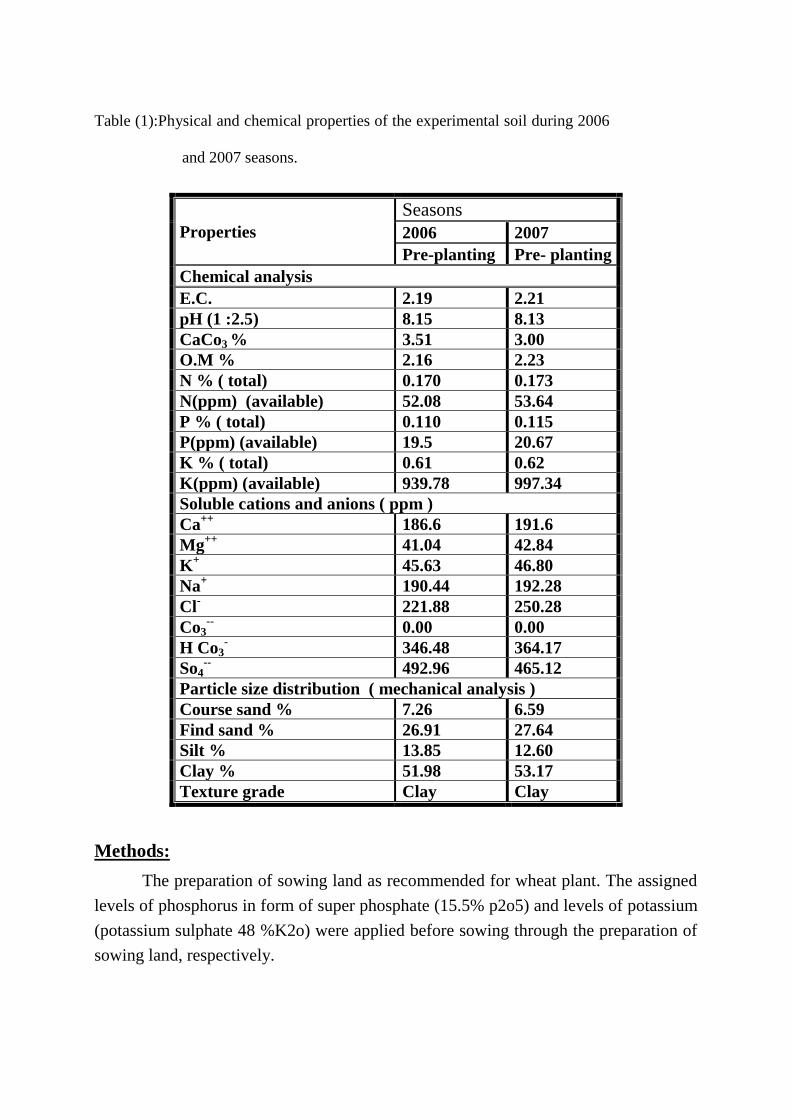
Table (1):Physical and chemical properties of the experimental soil during 2006
and 2007 seasons.
Properties
Seasons
2006 2007
Pre-planting Pre- planting
Chemical analysis
E.C. 2.19 2.21
pH (1 :2.5) 8.15 8.13
CaCo3 % 3.51 3.00
O.M % 2.16 2.23
N % ( total) 0.170 0.173
N(ppm) (available) 52.08 53.64
P % ( total) 0.110 0.115
P(ppm) (available) 19.5 20.67
K % ( total) 0.61 0.62
K(ppm) (available) 939.78 997.34
Soluble cations and anions ( ppm )
Ca++
186.6 191.6
Mg++
41.04 42.84
K+
45.63 46.80
Na+
190.44 192.28
Cl-
221.88 250.28
Co3--
0.00 0.00
H Co3-
346.48 364.17
So4--
492.96 465.12
Particle size distribution ( mechanical analysis )
Course sand % 7.26 6.59
Find sand % 26.91 27.64
Silt % 13.85 12.60
Clay % 51.98 53.17
Texture grade Clay Clay
Methods:
The preparation of sowing land as recommended for wheat plant. The assigned
levels of phosphorus in form of super phosphate (15.5% p2o5) and levels of potassium
(potassium sulphate 48 %K2o) were applied before sowing through the preparation of
sowing land, respectively.
Sowing took place on November 27th and 25th in the first and second seasons;
respectively. Wheat seeds were drilled in rows apart at seeding rate of 70 kg/ fed in the
two seasons.
Grains soaking and inoculation:
The grains weight per plot was 175 g and soaking time was 3 hours with 70 ml
of antioxidant treatments (Vit.C, Vit..E and mixture of Vit.C+E). After soaking grains
were inoculated by biofertilizers ( inoculation with A. brasilense, B. megaterium and
B. circulanus at 10 g/175 g seeds (plot) respectively, that gave a concentration of 109
cell/g).Source of inoculum was Agriculture ministry, Agriculture Research Center,
Giza. Egypt. Inoculated and soaked grains were sow at the same time.
Managements through growth:
Nitrogen was added in form of ammonium nitrate (33.5 %N) two time before
first and second irrigation after sowing, respectively. The bacterial inoculation was
mixed with sand and it was also added before first and second irrigation. The
antioxidants treatments were added as foliar spray at 60 and 100 days after sowing
with rates 500 ml / plot and 2.2 L/ plot, respectively, in the first and second foliar
sprays.
All treatments were replicated in the
first and second seasons, respectively. Sampling and collecting data
Morphological, photosynthetic pigments, spikeling stage and yield
characteristics:
1- External morphology :
Different morphological characteristics of wheat plants at 70, 110 days after sowing and at
harvest were measured and/ or calculated. Nine plants from each treatment were randomly
taken for the following measurements.
- Plant height (cm).
- Number of tillers/ plant.
- Number of leaves/ plant.
- Total fresh weight of shoots (g)/ plant.
- Total leaf area (cm2
/plant) using the disk methods according to Derieux et al.
(1973).
The samples then were dried in oven at 70o C for 48 hours till weight stability, the dry
weight of tillers (including main stem) and leaves were estimated.
Also, the percentages of dry matter distribution in different plant organs were
calculated.
2- Photosynthetic pigments:
Chlorophyll a, b and carotenoids were calorimetrically determined in fresh
leaves of wheat plants at 70 and 110 days after sowing during two seasons according
to the methods described by Wettstein (1957) and calculated as mg/g fresh weight.
3- Heading stage characteristics at 110 days:
For studying the heading stage behavior of various treatments ten plants per
each treatment were randomly taken, labeled and the following data were recorded.
-Spike length (cm)/ spike.
- Number of spikelets /spike.
- Number of spikes/ plant.
4- Yield characteristics:
At harvest, three plants randomly were taken /plot from each treatment for
estimation of the following yield parameters:.
- Number of spikes/ plant
- Spike weight (g)/ (main spike).
- Number of grains /main spike.
- Number and weight of spikelets in the lower (basic), medium (middle) and upper
(terminal) second and third of the spike.
- Number and weight of fully grains / main spike (g).
- Number and weight of semi fully grain / main spike (g).
- Number and weight of the lowest fully grain / main spike (g).
- Grain yield (g)/ plant.
- Straw yield (g)/ plant.
- Number of grains/ gram.
- Weight of 1000 grains (g)
- Harvest Index (H.I)
H.I = Economical yield
Gardner et al (1985) Biological yield
At harvest, on area of 1/4 m2 wheat plants /plot from each treatment with three
replicates were taken for estimation of the following :-
- Grain yield kg/ fed.
- Straw yield kg/ fed.
- Biological yield ( the dry weight of shoots including spikes)*
* Biological yield did not included the dry weight of roots.
5- Chemical analysis:
Dry shoots at the age of 70 days, flag leaf at110 days after sowing and the
produced grains at harvest time in 2007 season were taken to determine their chemical
constituents.
I- Total Nitrogen and crude protein:
Total nitrogen was determined in the dry matter of wheat plants at 70,110 day
after sowing and grains at harvest by using wet digestation according to Piper (1947),
using microkjedahl as described by Horneck and Miller (1998), then calculated as
mg/g dry weight. Then the crude protein was calculated according to the following
equation:
Crude protein= Total nitrogen x 5.75 by A.O.A.C. (1990)
II- Phosphorus:
It was determined calorimetrically by using ammonium molybdate and ascorbic
acid indicator according to the methods of Sandell (1950) and calculated as mg/g dry
weight.
III- Potassium:
It was determined by the flame photometer model carlzeiss according to the
methods described by Horneck and Hanson (1998) and calculated as mg/g dry
weight.
IV-Nutrient uptake:
NPK uptake were evaluated after determination of NPK by Dry matter x
concentration according to Chapman and pratt (1961)
V- Total carbohydrate:
Total carbohydrate was determined in dry matter of shoots and flag leaf of
wheat plants at 70,110 days after sowing and grains at harvest in 2007 season by
using phenol-Sulphoric acid method described by Dubois et al. (1956) and calculated
as mg/g dry weight.
6- Endogenous Phytohormones:
Endogenous Phytohormones were quantitatively determined in wheat leaves at
70 days after sowing at 2007 season. The method of Koshioka et al. (1983) was used
for HPLC {High- Performance Liquid Chromatography} determination of auxin
(IAA), gibberellic acid (GA3) and absicic, (ABA) and Cytokinins were determined by
HPLC according to Nicander et al. (1993)
Extraction procedure:
For hormonal analysis, 10 g of the fresh weight of leaves were cut to small
pieces and macerated, extracted twice with 96 % methanol then twice with 40 %
methanol, each for 24 hours Shindy and Smith (1975) . The methanolic extract was
filtered and evaporated in a rotary evaporator at 40 o C to an aqueous solution. The
solution was adjusted to pH 8.6 and extracted 4 times with 100 ml ethyl acetate. The
alkaline ethyl acetate solution were mixed together and purified with an hydrous
sodium sulphate (one tea spoon / 100 ml). The ethyl acetate fraction was filtered and
evaporated to dryness, the residue dissolved in 4 ml absolute methanol. This extraction
was used for determination of cytokinine, according to Nicander et al. (1993) . The
aqueous solution was acidified to pH 2.6 -2.8 and extracted as described above, this
extraction was used for the determination of gibberellic acid (GA3), indole -3-acetic
acid (IAA) , absicic acid (ABA) by HPLC according to the methods described by
Koshioka et al. (1983). The identification of Phytohormones was accomplished by
comparing the peaks retention times with the retention times of authentic substances.
The quality of individual plants hormones was determined by comparing the peak area
produced by a known weight of the plant material with the standard curves of the
authentic substances which expressed the relation between the different concentration
and their peak areas.
All results for endogenous Phytohormone were calculated as mg/100g F.W.
Statistical analysis:

Data of morphological, heading and yield characteristics were statistically
analyzed by using the least significant differences test (L.S.D) according to Sendecor
and cochran (1980).
RESULTS AND DISCUSSIONS
A- Effect of biofertilizers and NPK mineral fertilizers on growth:
1- Plant height :
Data in Table (2) show the effect of biofertilizers (bio) and mineral NPK
fertilizer levels on plant height. It could be noticed that different applied bio and
mineral NPK fertilizer levels increased this trait at 70,110 and 155 days (i.e. at
harvest) of plant age during 2006 and 2007 seasons, That increase was parally with the
advancing of plant age since reached its maximum at 155 days of plant age (i.e. at
harvest). The highest value was existed with the combination of bio and complete
strength CS of mineral NPK fertilizer (at 155 days) in both seasons . This value was
reached 88.91 and 91.5 cm/ plants in 2006 and 2007 seasons, respectively . Also ,
clearly, it could be noticed that this final obtained increase of plant height was
preceded with the same in first and second samples of measurements with bio and half
strength of mineral NPK fertilizer. That maximum increase was obtained with the half
strength of mineral NPK chemical fertilizers combined with bio during 70 and 110
days of plant age in 2006 and 2007 seasons. On the other hand, separated applications
of each of bio and mineral NPK increased plant height but with less extent.
In this respect, the obtained increase of this trait could be attributed to the high
merestematic activity and cell elongation by different growth promoters and the
reduction of growth inhibitors as well as more oration of nutrient availabity by
different applied microorganisms that reversed upon improving plant growth including
plant height. This interpretation will be confirmed after words in the part of hormones
determination (Table 21) Other studies on wheat plants also nearly got similar results
by Atia and Aly, (1998) ,Toaima et al.(2000) ,Ghallab and Salem, (2001), Hassan et
al, (2002), Saleh , (2003) and Abdel-Hamed (2005) .
2-Number of tillers/ plant:-
Data in Table (3) show that number of tillers /plant was increased with the
increasing of mineral NPK fertilizers Level (i.e. CS ,half and Quarter levels) and also
when combined with bio fertilizers at 70 and 155 days (i.e. at harvest ) during 2006
and 2007 seasons. The highest value was existed with combination of bio and CS of
mineral NPK fertilizers that reached high significant level of increase in this trait. In
other words this value with C.S of mineral NPK combined with bio reached to 155.2
and 148.1 % more than the control (100%) during first and second samples of
measurements in both seasons. It could also be noticed that this final obtained
increase in this trait was preceded with the same in first and second samples of
measurements, but maximum increase was obtained with the half strength of mineral
NPK fertilizer combined with biofertilizers at 155 days of plant age ( i.e. at harvest).
In this respect, the obtained increase in this trait could be attributed to the high
formation and activity of endogenous cytokinins and other growth promoters as well
as the reduction of growth inhibitors (as well as mentioned in Table 21) and

nutrient availability existed by different applied microorganisms. That beneficial
effects reversed upon the increase in the number of tillers / plant
In this respect also Zaghloul et al., (1996), Ghallab and Nesime (1999),
Ghallab and Salem (2001), Mashhor et al (2002) and Abdel-Mawly and El-
Sharkawy (2005) nearly got similar results on wheat plants.
3- Number of leaves / plant
As shown in Table (4) indicated that different applied bio and mineral NPK
fertilizer levels and combination of bio and mineral NPK levels increased number of
leaves / plant at 70 and 110 days of plant age during 2006 and 2007 seasons . That
increased was parally with the advancing of plant age. The highest value was existed
with combination of bio and CS of mineral NPK fertilizers that reached to the high
significant levels of increase in this trait during 70 and 110 days of plant age in both
seasons . In the other words C.S. of mineral NPK fertilizer with bio reached to
142.4,114.7,121.1 and 110.2 % in first and second samples of measurements in both
seasons, respectively more than value of control (100%). However separately
applications of each bio and mineral NPK fertilizers also, increased this trait but with
less extent.
In this respect the obtained increase in this trait could be attributed to that
encouragement of different aspects of wheat growth and development especially the
increase of each of plant height and the number of tillers as well.
In this respect, Zeidan et al. (2005) reported that combination of bio and
mineral NPK increased number of leaves
/plant. Also, Ali, et al, (2004) and Abdel Hamed, (2005) nearly got similar results
on wheat.
4-Fresh weight of shoots :-
As shown in Table (4) fresh weight of shoots was signifigntly increased with
the increasing of mineral NPK fertilizers levels (i.e. CS, half strength and quarter
strength) and combination with biofertilizers at 70 and 110 days of plant age during
2006 and 2007 seasons. The highest value was existed with combination of bio with
C.S of mineral NPK fertilizers in first and second samples of measurements. This
value was reached to 173.2, 129.2, 148.1 and 142.9 % in first and second samples of
measurements in both seasons, respectively.
This significantly favorable effects of combination between mineral NPK
fertilizers and biofertilizers may be explained on the basis that the beneficial effects of
bacteria on the nutrient availability, vital enzymes hormonal stimulating effects on
plant growth or the increasing of the photosynthetic activity may provide pricipal
evident for this view.
In this respect Bashan and Levanonry (1990) and Zeidan et al. (2005)
nearly got similar results on wheat plants
5- Dry weight of shoots :-
Data in Table (5) show that dry weight of shoots significantly increased with
application of each mineral NPK fertilizer levels ( i.e. CS strength and quarter
strength levels) and biofertilizers and combination of bio and mineral NPK levels at 70
and 110 days of plant age during 2006 and 2007 seasons . The highest value was
existed with combination of bio and C.S. mineral NPK fertilizers, this value was
reached to 250,118,158
and 149 % during first and second samples of measurements in both seasons,
respectively.
In this respect the obtained increased of this trait it could be attributed that
beneficial effects of the combination of CS mineral NPK and biofertilizers may be
explained on effects of bacteria on the nutrient availability vital enzymes and
hormonal stimulating effects on plant growth and accumulation of dry mater thereby
increased dry matter of wheat plants. In this respect also Ghallab and Salem, (2001),
Koreish et al. (2004) and Abdel- Hamed, (2005) nearly, got similar results on wheat
plant.
6- Total leaf area/ plant :-
Data in Table (5) indicate that combination of bio and complete strength. CS of
mineral NPK fertilizers increased total leaf area / plant in first and second samples of
measurements during 2006 and 2007 seasons. This value reached to 140, 129.6; 145.3
and 143.9 % at the 70 and 110 days of plant age, respectively more than value of
control (100%). Meanwhile each of bio and mineral NPK independently increased
this trait but by less extent.
This increase may be due to the superiority of using biofertilizer combined with
mineral NPK CS recommended that provide beneficial effects in nutrient availability
and synthesis of different elements to increase this trait. Mengel and Kirkby, (1979).
That could be reflected upon more expanded formed Leaves and the vigorous
vegetative growth as well as improvement of photosynthetic formation, partitioning
allocation and translocation as well as. Banziger et al, (1994) and Sabry et al, (1994)
and many others.
In this respect also Sharma et al , (1994) and Frederick and Comberato, (1995)
nearly got similar results on wheat plants. The above mentioned results are also
being more clear when calculated as a percentage of control (Tables of growth
behavior).
II - Yield characteristics:
1- Number of spikelets.
As Shown in Table (6) non significant differences was the dominant results of
all applied treatments on number of spikelets /main spike during first and second
samples in 2006 and 2007 seasons. This results are in agreement with Sabry et al,
(1994 ).
2- Spike Length:-
As shown in Table (6) spike Length cm/ main spike increased with increasing
mineral NPK fertilizers during first and second samples in both seasons. The
highest value was existed with the combination of bio and complete strength CS
mineral NPK fertilizers in both seasons. On the other hand separately application
of each bio and mineral NPK fertilizer levels increased this trait but to less extent.
In this respect, the obtained increase of this trait may be due to that increase in
plant height and the number of leaves and area as well; that could be accompanied
with the increase in spike lengths. This could also be attributed to the encouragement
of different aspects and development of wheat growth including


this trait. In this respect also Sushila and Gajendra, (2000) and many others nearly
got similar results on wheat.
3- Number and weight of second and third basic spikelets/ main spike:-
Data in Table (7) show the effect of bio and mineral NPK fertilizer levels on
number and weight of second and third basic spikelets. It could be noticed that
different applied of each bio and mineral NPK fertilizers and their combination
increased this trait during 2006 and 2007 seasons. The highest value was existed with
combination of bio and complete strength of mineral NPK fertilizers during both
seasons.
This value was reached to 3.6 and 3.6 grains / spikelet in second basic spikelet
and weight of 0.19 and 0.22 g/ grains in first and second seasons, respectively. The
meanwhile third spikelet gave 3.25 and 3.42 grains / spiklet and weight of 0.23 and
0.22 g /grains during. Both seasons, respectively. Meanwhile, control value of second
basic spikelet was reached 2.75 and 3.25 grains/spiklet and weight of 0.18 and 0.17 g/
grains in first and second seasons , respectively. Meanwhile control of third basic
spiklet / was reached. 2.75 and 3.25 grains/spikelet and weight of 0.14 and 0.18
g/grains during both seasons, respectively. On the other hand separately application of
each bio and mineral NPK fertilizer levels also increased this trait but by less extent.
In this respect, the obtained increase of this trait may be due to increase of total
leaf area of wheat plant, that logically to be reversed upon both photosynthesis
efficiency and

photosynthetic translocation into grains (sink) thereby that could be increase fully
grain and grain weight as well.
4-Number and weight of second and third middle spikelets/ main spike:-
As shown in Table (8) different applied of each bio and NPK chemical
fertilizers significantly increased number and weight of second and third middle
spiklet during 2006 and 2007 seasons. The highest value was existed with combination
of bio with complete strength NPK chemical fertilizers in second middle spiklet this
value was gave 3.83 and 4.00 grain / spiklet and weight of 0.19 and 0.21 g/ grains in
first and second seasons, respectively. Meanwhile, control value was reached 3.25 and
3.85 grains/ spikelets and weight of 0.16 and 0.18 g / grains in both seasons,
respectively. However third middle spiklet increased with combination of bio and CS
mineral NPK fertilizer during 2006 and 2007 seasons; gave 3.67 and 3.45 grains /
spikelet and weight of 0.19 and 0.19 g / grains during first and second seasons,
respectively.
Yet, control value gave 3.05 and 3.00 g / spikelet and weight of 0.15 and 0.14 g
/ grains during first and second seasons, respectively.
In this respect the obtained increase of this trait may be due to increase in total
leaf area of wheat plants (Table 5) and photosynthetic allocation into middle grains as
sink organs.
5- Number and weight of second and third terminal spikelets/ main spike:-
Data in Table (9) show the effect of bio and mineral NPK fertilizer levels on
number and weight of second and third

terminal spiklet during 2006 and 2007 seasons. It could be noticed that different
applied of bio and mineral NPK chemical fertilizers levels increased this trait
during 2006 and 2007 seasons. Also, combination of bio and CS mineral NPK
fertilizer showed the greatest increased of this trait. This number of second
terminal spiklet was reached to 2.77 and 2.88 grain / spiklet and weight of 0.18
and 0.18 g / grains during first and second seasons, respectively. Also, third
terminal spiklet was reached 2.67 and 2.33 grains / spikelet and weight of 0.18
and 0.14 g / grains during first and second seasons, respectively. Meanwhile,
control value was reached to 2.50 and 2.58 grains / spiklet and weight of 0.09 and
0.11 g/ grains and the third terminal spiklet number was reached 2,- and 2.08
grains / spiklet and weight of 0.11 and 0.12 g / grains spikelet during first and
second seasons, respectively.
In this respect the obtained increased of this trait may be due to that high
photosynthetic translocation i into grains and direct beneficial effects of
microorganism with CS mineral NPK fertilizers to the nutrient availability and
vital enzymes to assistant increased of this trait.
6- Number and weight of fully grains / Main spike :-
Data in Table (10) clearly show that number and weight of fully grains/ main
spike increased with increasing NPK fertilizers level. It could be noticed that
combination of bio with CS mineral NPK fertilizer high significantly increased
this trait in first season but in second seasons no significant. This value was
reached 32,- and 25.389 grains / main spike and weight of 1.88 and 1.51 g/ main
spike. Meanwhile control value reached

18.177 and 19.67 g/ main spike during first and second seasons, respectively.
Increases of this trait with combination of biofertilizer and CS mineral NPK may
be due to that beneficial effects of increasing total leaf area/ plant and preceded
with an increase of leaves number (Table 4 and 5) that could increase
photosynthetic rate and photosynthates translocation into grains and increased
fully grains. Also, with the effect of microorganisms on nutrient availability, vital
enzymes and stimulating any material to development of wheat grain and
increased of fully grains in this respect Here, El-Dsouky (2005) nearly got similar
results on wheat plants.
7- Number and weight of semi fully grains/ main spike:-
As shown in Table (10) different applied bio and mineral NPK fertilizers and
their combination increased number and weight of middle fully grains / main
spike during 2006 and 2007 seasons. The highest value was existed with the
combination of bio with CS mineral NPK fertilizers in both seasons. This value
was reached 25.67 and 23.16 grains per main spike and weight was reached 1.99
and 1.154 g / main spike during 2006 and 2007 seasons , respectively. Meanwhile
control value was reached to 21.667 and 18.417 grains / main spike and weight
gave reached 1.595 and 0.942 g /main spike during 2006 and 2007 seasons ,
respectively.
It is of interest to note that the obtained increase of this trait was a direct
response of mineral and biofertilizer to increase translocation rate of
photosynthate into grains.
8-Number and weight of lowest filled grains / main spike.
Data in Table (11) showed that number and weight of weak filled grains
decreased with increasing mineral NPK fertilizers levels and combined with bio
fertilizers. Also, combination of bio and CS mineral NPK fertilizers showed
lowest decrease of this trait during 2006 and 2007 seasons. This trait since it
reached 15.33 and 17.67 grain / main spike and weight 0.47 and 0.57 g/main spike
during 2006 and 2007 seasons, respectively. Meanwhile, control value was
reached 20.50 and 20.25 grains/main spike and weight was reached 0.67 and 0.74
g/main spike during first and second seasons, respectively.
9-Spike fertility.
Data in Table (11) show the effect of bio and mineral NPK fertilizer levels on spike
fertility during 2006 and 2007 season. It could be noticed that different applied bio and
mineral NPK fertilizers increased this trait during both seasons. The highest value was existed
with combination of bio and half strength mineral NPK fertilizers at harvest during the tow
seasons. The above mentioned results are also being more clear when calculated as a
percentage of control (Table 11) It is of interest to note that the obtained increase of this trait
could be consider as a direct response to the combination of bio and half strength mineral
NPK fertilizers on fertility of tillers and that increased number of spikes / plant and the
beneficial effects may be due to the known physiological effects of this from on increasing of
the endogenous Cytokinins Smicklas and Below, (1992) and Wang & Below, (1995). Also,
in this respect other studies have been got nearly similar effects of this treatment on the
spike formation of wheat plant. Mohamed, (1994) and El-Bana, (1999).

10- Number of grains per gram:-
Data in Table (12), showed that each of bio and mineral NPK fertilizers levels
decreased number of grains during 2006 and 2007 seasons. Also bio and CS of
mineral NPK fertilizers slightly decreased this trait, this value reached 19.17 and
19.92 grains / one gram during first and second seasons , respectively.
Increment of this trait, during both seasons could be increased the number of
fully grain (Table 10).
11- Weight of 1000 grains:-
As shown in Table (12) the weight of thousand grains was increased with
increasing of mineral NPK fertilizers levels, bio and combination of bio and
mineral NPK levels during 2006 and 2007 seasons. The highest value existed with
bio and CS mineral NPK fertilizers. This value reached to 52.98 and 50.37 g /
thousand grains during 2006 and 2007 seasons, respectively. Meanwhile control
value was 49.16 and 43.05 g / thousand grains during first and second seasons ,
respectively.
In this respect, the obtained increase of this trait could be attributed to the
increase in number and weight of grains( Table 10) due to that increase 1000
grain weight. Other studies also , nearly got similar results on wheat plants
Abdel-Hamed, (1999), Ghallab and Nesium, (1999), Ali, et al, (2004, El-Dsouky
(2005) and Han, et al(2006) and many others.
12- Grain weight / main spike:-
As for weight of grains per main spike; Table (13) indicates that different applied
of bio and mineral NPK fertilizer levels and their combination increased weight
of grains / main


spike during 2006 and 2007 seasons. Also, combined of bio and CS of mineral
NPK fertilizers showed the greatest increase of this trait during first and second
seasons, but that increase during second seasons reached to the high level of
significance. This value was 4.361 and 3.233 g /main spike during first and second
seasons , respectively. Meanwhile control value was 3.56 and 2.55 g/ main spike
during first and second seasons , respectively.
Increase of grains weight could be partially attributed to the increase of grains
number / main spike and increase of Thousand grain weight (Table 12) as well as
to that increase in chlorophyll biosynthesis (Table 15 and 16 ) and increases of
total leaf area (Table 5). All of that could reversed on both photosynthesis
efficiency and photosynthates translocation into grains (i.e. sink organs).Similar
results were obtained on wheat plants by Mohamed,(1994), Sushila and Gajendra ,
(2000) Ghallab and Salem, (2001), Abdel- Hamed, (2005) and Han, et al (2006).
13-Number of grains / main spike:-
As shown in Table (13) number of grains /main spike was positively responsed to
different applied bio and mineral NPK fertilizer levels during 2006 and 2007
seasons.
In this respect bio combined with CS mineral NPK showed increase of this trait
since this value was 70.83 and 65.75 grains/main spike during first and second
seasons, respectively. On the other hand lowest increase was obtained with single
biofertilizers since value reached 66.40 and 62.50 grains / main spike during first
and second seasons , respectively.
The obtained results could be attributed to the role of bio and mineral NPK
fertilizers on spike fertility and increase of grains weight/ main spike and
increased number of spiklet/ main spike (Table, 6) may be due to increased
number of grains/ main spike. Other studies also nearly got similar results by
Mohamed, (1994) and Ali , et al,( 2004) on wheat plants.
14- Grain and straw yield:-
a-Grain yield:-
Data in Table (12) and (13) show that different applied of bio and mineral NPK
levels increased grain yield g / plant and grain yield per fed during 2006 and 2007
seasons. The highest value was existed with combined bio and CS mineral NPK
fertilizers during 2006 and 2007 seasons. This value reached to 21.613 and 19.442
g / plant and 2153 and 2712 kg Per fed during first and second seasons,
respectively .Meanwhile control value reached 11.75and 12.242 g/plant and 1836
and 2318 kg per fed during first and second seasons, respectively.
In this respect, the obtained increase of this trait could be attributed to there
beneficial effects and direct response of biofertilizers and complete strength of
mineral NPK fertilizers and their combination on increase of photosynthetic and
translocation rates into grains as well as increased spike fertility/plant (Table 11),
total leaf area, increase of photosynthates production (Table 15 and 16) and their
translocation into grains and increase fully grains and number and weight of
grains/ spike (Table, 10 and 13). Other studies, nearly got similar results Sushila
and Gajendra, (2000), Ghallab and Salem, (2001) and Ali, et al, ( 2004) on wheat.
b-Straw yield:-
Data in Table (13) and (14) also clearly indicate that straw yield was similarly
responded as well as in case of grain yield. Since, combination of bio and C.S
mineral NPK fertilizers increased straw yield per plant and per fed as well.
In this respect also Sushila and Gajendrya,(2000) reported that straw yield
increased with combined bio and CS mineral NPK fertilizers.
15- Biological Yield:
Data in Table (14) indicate that combination of bio with CS mineral NPK
fertilizers increased biological yield per plant and per fed during 2006 and 2007
seasons. This value reached 48.10 and 49.57 and 5893.2 and 7676.1 kg/fed during
first and second seasons, respectively. Meanwhile control value reached 34.12 and
30.14 g/plant and 5139.4 and 5812.1 kg/fed during first and second seasons
respectively. On the other hand, application of bio and NPK levels also increased
this trait but by less extent. Although, existed increase of this trait was obtained
either with combination or separately treatments. In this respect also Ghallab and
Salem, (2001) and Ali, et al, ( 2004) nearly got similar results on wheat. The above
mentioned results are also being more clear when calculated as a percentage of
control (Tables of yield characters).

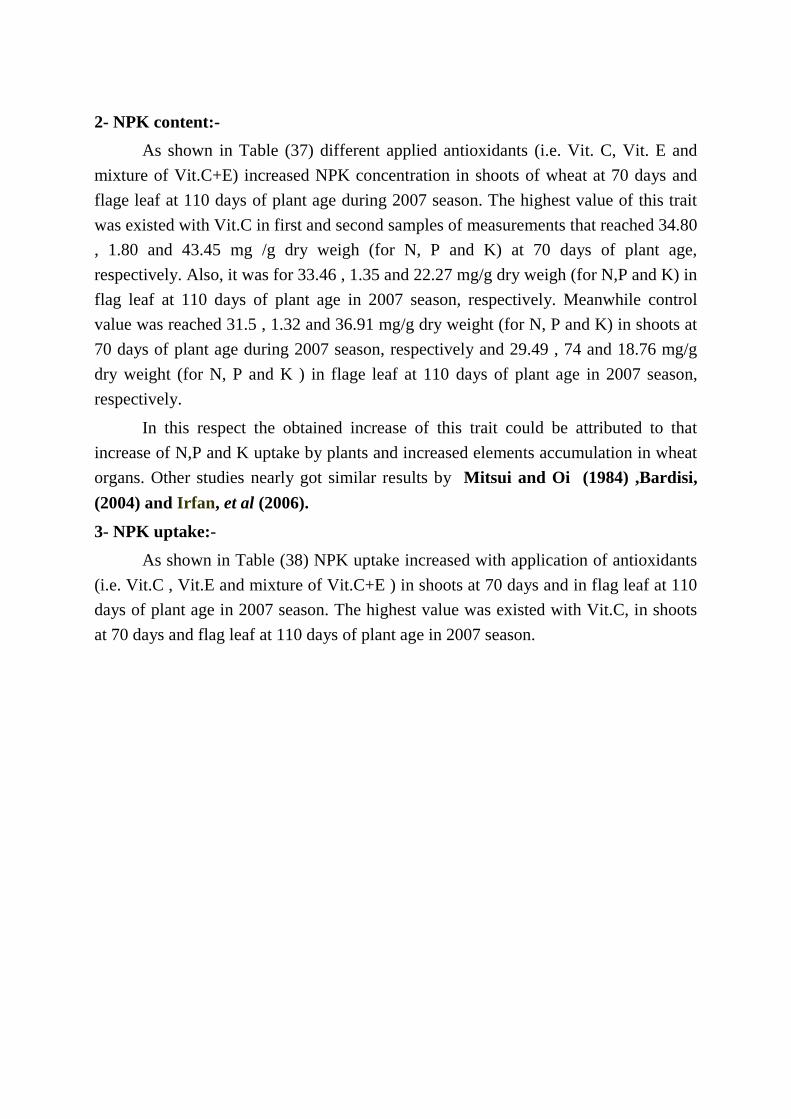
0
500
1000
1500
2000
2500
3000
C B ch 0.25 ch+B 0.50ch+B ch+B
treatments
1st season
2nd season
grain
yield
(kg/
fed)
Fig (1) Show the effect of bio and NPK mineral fertilizer on grain yield (kg/ fed).
Ab: C-Control B-Biofertilizers Ch:-Chemical fertilizer
1/2 Ch+B:- half complete strength+ Biofertilizers Ch+B:-Chemical fertilizer
+Biofertilizers
II- Chemical analysis of wheat plants:
1- Photosynthetic Pigments:-
Data in Table (15) and (16) indicate that different photosynthetic pigments i.e.,
chlorophyll a, b and carotenoids were positively responded to the different
applied bio and mineral NPK fertilizer levels and their combination during 2006
and 2007 seasons. Also, combination of bio and CS mineral NPK fertilizer gave
the highest value in tow seasons.
Also, the simulation of photosynthetic pigments formation could be attributed to
the vigours growth obtained in (Tables 2,3 ,4 and 5) . Hence increasing of
chlorophylls and carotenoids content enhanced photosynthetic efficiency and
increased dry matter accumulation.
Also, this enhancement could be indicator for expectable high grain yield. In this
respect also Ghallab and Salem, (2001) and Abdel- Hamed, (2005), EL- Dsouky
(2005) and Han et al, (2006). nearly got similar results on wheats and Cucumber
and Pepper plants respectively.
2- NPK content:-
Data in Table (17) clearly indicate NPK content in shoots of wheat at 70 days of
plant age and flag leaf at 110 days of plant age during 2007 season. Different
applied of bio and mineral NPK fertilizer levels obviously increased nitrogen
concentration in shoots and flag leaf at 70 and 110 days of plant age. Also, it
could be noticed that this positive effect nearly was the same with different levels.
The highest value existed with combined of bio and CS mineral NPK. This value
reached 42.72 and 41.27


mg/g dry weight at first and second samples of measurements during 2007 season,
respectively. Meanwhile control value was 25.03 and 27.3 mg/g dry weight at first
and second samples of measurements during 2007 season, respectively.
As for P content in shoots at 70 days and flag leaf at 110 days of plant age during
2007 season, this content showed an increase with different applied of bio and
mineral NPK levels. This trait was increased with increasing mineral NPK levels
sime the highest value existed with combined of bio and CS mineral NPK
fertilizers this value reached 2.14 and 1.61 mg/g dry weight in the first and second
sample of measurements during 2007 season, respectively. Meanwhile control
value reached 1.07 and 1.09 mg/g dry weight at first and second samples of
measurements during 2007 season, respectively.
As for K content in shoots at 70 days and flag leaf at 110 days of plant age during
2007 season; different applied bio and mineral NPK levels positively affected K
content. The highest value was existed with bio combined of with CS mineral
NPK in first and second samples of measurements. This value reached 49.58 and
22.99 mg/g dry weight at first and second samples of measurements during 2007
season, respectively.
It could be noticed that NPK concentrations in shoots at 70 and flag leaf at 110
day of plant age during 2007 seasons was increased. That was accompanied with
an increase in the rate of wheat growth under the applied of different bio and
mineral NPK levels.
In this respect , the obtained increase of this trait could be attributed to that
beneficial effects of combination of bio and CS mineral NPK fertilizers on
nutrient availability, vital enzymes and accumulation of essential nutrients in
both samples and increased NPK concentration in shoots and flage leaf. Other
studies, also nearly got similar results on wheat Abdel-Azeem, (1998), Faid, (2000),
Ghallab and salem, (2001), Yassen, (2002) and Han et al, (2006).
3- NPK uptake :
As shown in Table (18) different applied bio and mineral NPK fertilizer levels
increased NPK uptake in shoots and flage leaf at 70 and 110 days of plant age
during 2007 seasons, respectively. The highest value was existed with combined
bio and CS mineral NPK fertilizers in first and second samples of measurements
during 2007 seasons, respectively.
The obtained increase of this trait could be attributed to the positive effect of bio
and CS mineral NPK upon nutrient availability and uptake by plant thereby
increased uptake of NPK.
In this respect also Abdel-Azeem, (1998), Abdel- Hamed, (1999), Faid, (2000),
Sonbol et al, (2000), Ghallab and salem, (2001), Yassen, (2002) and Abdel- Hamed,
(2005) nearly got similar results on wheat plants and Cucumber and Pepper
plants respectively..
4- Total carbohydrate:
Data in Table (19) show that total carbohydrates was increased with increasing
mineral NPK fertilizer levels and biofertilizers treatments in shoots and flage leaf
at 70 and 110 days of plant age during 2007 season.


The highest value was existed with combined bio and CS mineral NPK. This
value was 285.00 and 594.30 mg/ g dry weight at first and second samples of
measurements during 2007 seasons, respectively. Meanwhile control value was
127.90 and 574 mg /g dry weight during first and second samples of
measurements during 2007 season, respectively.
In this respect the obtained increase of this trait could be attributed to that
increase in total leaf area, (Table 5) photosynthetic pigments (Table 15 and
16),photosynthates rate and increase of translocation rate of different
photosynthate produced from source organs (i.e. leaves) to the sink organs during
plant growth. carbohydrates synthesis and enhanced plant growth. Also,
application could simulative. In this respect also Abdel-Hamed, (1999), Abdel-
Hamed,( 2005) and Han et al, (2006). Nearly got similar results on wheats.
5- Crude protein
With regard to the content of crude protein in shoots and flag leaf at 70 and 110
days of plant age during 2007 season. As indicated in Table (19) it could be
noticed that a strict increase of this content (245.64 and 237.27 mg/g dry weight)
at first and second samples of measurement during 2007 seasons, was achieved.
The highest value was existed with combination of bio and CS mineral NPK
fertilizers application. Meanwhile, control value was 143.73 and 156.98 mg/g dry
weight in shoots and flag leaf at 70 and 110 days of plant age during 2007 seasons,
respectively. Also it could be noticed that different levels of each NPK and
biofertilizers increased of this trait during first and second samples of
measurement during 2007 season.
The above mentioned results about content of crude protein and photosynthates
production and stimulating effects on plant growth by applied microorganisms
and CS mineral NPK fertilizers could increase crude protein in wheat grains.
In this respect , also Banziger et al, (1994) and Ghallab and Salem, ( 2001) nearly
got similar results on wheat plants.
IV-Chemical composition of wheat grains :-
1- NPK content:-
As shown in Table (20) different applied bio and mineral NPK fertilizers
increased NPK contents in grain wheat during 2007 season. The highest value
existed with bio combined with CS mineral NPK fertilizers this value was 28.59,
1.56 and 6.32 mg/g dry weight N,P and K, during 2007 season, respectively.
Meanwhile control value was 25.0, 0.68 and 4.9 mg/g dry weight N,P and K
during 2007 season, respectively. Also. data of the present study could be
attributed to that increase of translocation into sink (grains) and beneficial effects
of bacteria on NPK availability hence grain content and increase NPK contents in
grains.
Other studies nearly got similar results of these studies are Hanafy, et al , (1995),
Ghallab and Salem, (2001) and Abdel- Hamed, (2005) .
2- Total carbohydrate and crude protein:-
Data in Table (20) show the effect of bio and mineral NPK fertilizer levels and
their combination on total carbohydrate and crude protein contents in grains at
2007 seasons. It could be noticed that different applied bio and mineral NPK
fertilizer

levels (i.e. Quarter strength, half strength and CS levels) and combination with
biofertilizers increase total carbohydrates and crude protein contents in grains
during 2007 season. The highest value was existed with combination of bio and
CS mineral NPK this value was 798.3 mg/g total carbohydrate and 164.4 mg/g
dry weight crude protein in wheat grains during 2007season, respectively
.Meanwhile control value gave 671.9 mg/g total carbohydrate and 148.93 mg/g
dry weight crude protein during 2007 season, respectively.
In this respect, the obtained increase of this trait could be attributed to that
increase of total leaf area, (Table 5) photosynthetic pigments (Table 15 and 16)
thereby an increase photosynthates production, photosynthetic rate and
translocation into grains. All of that reversed upon an increase total
carbohydrates and crude protein in grains. In this respect also Ghallab and Salem,
(2001), Ali, et al, (2004) and Abdel- Hamed, (2005) nearly got similar results on
wheat plants. The above mentioned results are also being more clear when
calculated as a percentage of control (Tables of chemical composition of wheat
plant and grains ).
V- Endogenous Phytohormones content:-
Data in Table (21) show that Phytohormones content (i.e. Auxin, Gibberellins,
cytokinines) was increased with combination of bio and complete strength CS of
mineral NPK fertilizers. But reduced growth inhibitor (Absisic acid)
concentration in wheat leaves at 70 days of plant age. Although, separately
application of bio and mineral NPK fertilizers increased this content but by less
extent. The above mentioned results are also being more clear when calculated as
a percentage of control (Table 21).


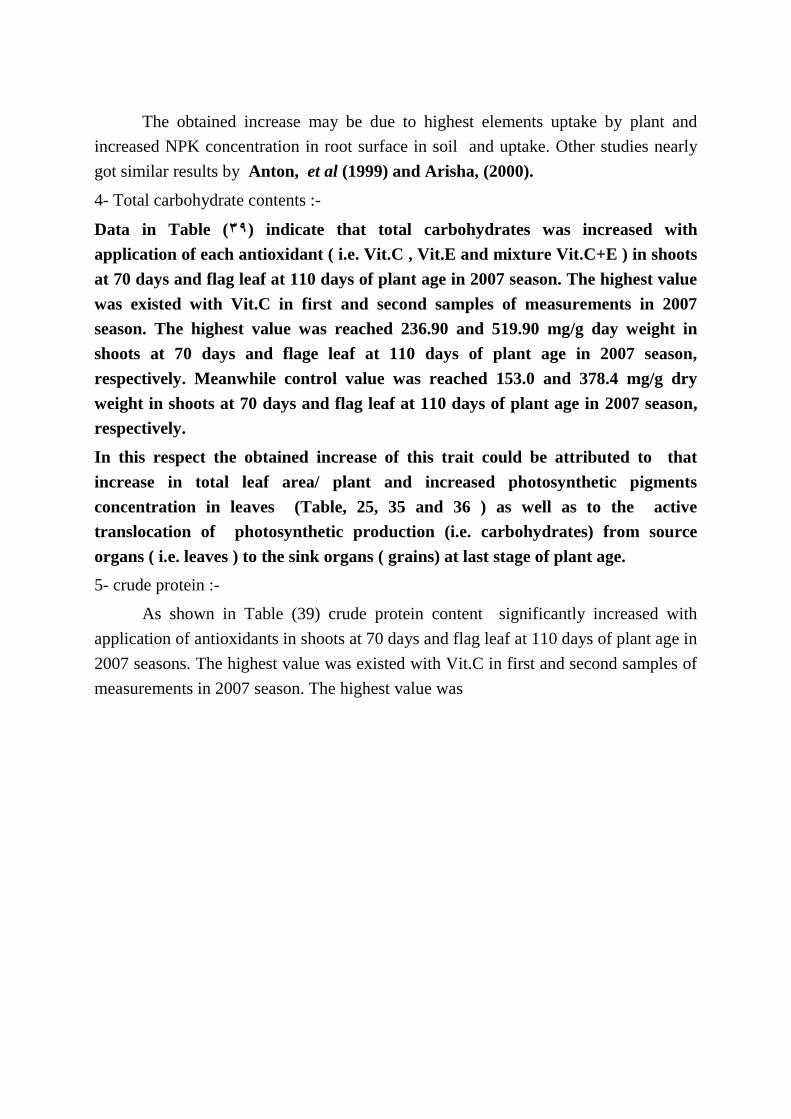
0
50
100
150
200
250
300
350
400
450
con mg/100
f.w.
auxin GA cyt ABA pro/ inh
types of phytohormones
control
Bio
Ch
Ch+Bio
Fig (2) Show the effect of bio and mineral fertilizers on Phytohormones contents
C:- control B:- Biofertilizers Ch:- Chemical fertilizers
Ch+Bio:- Chemical fertilizers +Biofertilizers
GA- Gibberellins Cyt:- Cytokinins
ABA:- Absisic acid Pro/inh:- promoter/ to inhibitor
In this respect the obtained increase of this content may be due to beneficial
effects of bio and mineral NPK to improve different aspects of wheat growth,
including production of more photosynthates and a greate part of them to be allocate
for grains. Thereby, economic yield was increased ( i. e. weight of yielded grains).
B -Effect of Antioxidants
I-Growth characteristics:-
1- Plant height:-
Data in Table (22) show the effect of antioxidant treatments ( i.e. o, vitamin C ,
vitamin E and mixture of vitamin C+ E ) on plant height at 70, 110 and 155 ( i.e.
at harvest ) days of plant age during 2006 and 2007 seasons . It could be noticed
that different applied antioxidants increased plant height at 70,110 and 155 days
of plant age in both seasons. The highest value was existed with vitamin C( Vit.C)
in both seasons. Vit.C at 110 days of plant age high significantly increased plant
height during both seasons. Yet, the other two samples did not reach to the level
of significance.
In this respect, the obtained increase of this trait may be due to the stimulating
effect of Vit C on vegetative growth and regarded in attract amount to maintain
normal growth to increase plant growth including increase plant height.
Other studies ,nearly got similar results by Anton, et al, (1999), Arisha, (2000),
Bardisi, (2004) and Inskbashi and Iwaya (2006).
2- Number of tillers/ plant:-
Data in Table (23) indicate that different applied antioxidants increased number
of tillers/ plants at 70,110 and155 days ( at harvest) of plant age during 2006 and
2007 seasons . The highest value was existed with Vit.C at 70,110 and 155 days (
i.e. at harvest ) of plant age during 2006 and 2007 seasons. It could be noticed that
the 2nd
sample of measurements and at harvest showed high significantly increase
of this trait compared with the control in both seasons.
The obtained increase of this trait could be attributed to induce many stimulating
effects on plant growth and some physiological processes and cytokinines
synthesis and enhancing cell division to increased plant growth leading to an
increase of tillering plants. This interpretation will be confirmed in the part of
hormone determination (Table,41). The obtained results are in accordance with
those of Anton and Bassiem, (1998) and Ishibash and Iwaya (2006).
3- Number of leaves/ plant:-
As shown in Table (24) different applied antioxidants, high significantly increased
number of leaves / plant at 70 and 110 days of plant age during 2006 and 2007
seasons .It could be noticed that highest value was existed with Vit.C in first and
second samples during both seasons. Meanwhile the mixture of Vit.C+E ranked
the second in this respect when compared with the control.
The simulative effect of Vit.C on number of leaves may be due to that Vit. C is
regarded in a tract amount to mention normal growth Oertill, (1987) including
this trait

(leaves/plant) and increased plant height and tillers number/ plant (Table
22,23) may be due to that of increase this trait. Other studies nearly got
similar results by Anton, et al, (1999).
4-Fresh weight of shoots
Data in Table (24) clearly indicate that different applied antioxidants treatment
increased fresh weight during 2006 and 2007 seasons. The highest value was
existed with Vit.C this value reached to the level of high significantly increase of
this trait at first sample in second season
In this respect, the obtained increase of this trait could be attributed to that
induce of many stimulating effects on growth and activation of some
physiological processes to increase plant growth and increase plant height,
number of tillers/plant, number of leaves/ plant (Table,22,23 and 24) and due to
increase fresh weight of shoots / plant. Other studies nearly got similar results by
Anton and Bassiem, (1998), Bardisi, (2004), El-Bassuonay, (2005) and Inskbashi and
Iwaya (2006).
5- Dry weight of shoots :-
As shown in Table (25) different applied antioxidants increased dry weight of
shoots / plant at 70, 110 days of plant age during 2006 and 2007 seasons. The
highest value was existed with Vit.C. This value reached to the level of high
significantly increase of dry weight of shoots in first and second samples of
measurements during both seasons.
The above mentioned positive effect of Vit. C could be attributed to the simulative
effect of Vit.C on photosynthetic production, dry matter accumulation and leaf
carbohydrates
content Dhopte and lall, (1987) and Bardisi, (2004) Therefore dry weight of shoots
was increase and that increased was preceeded with vegetative growth (Table,
22,23 and 24). Other studies nearly got similar results by Anton, et al. (1999) and
Inskbashi and Iwaya (2006).
6- Total leaf area/ plant:-
Data in Table (25) indicated that different applied antioxidants increased total
leaf area / plant at 70 and 110 day of plant age during 2006 and 2007 seasons. The
highest value was existed with Vit.C that reached 1142.,1324.8,1149.1 and 1321.8 cm/
plant at first and second samples of measurements during first and second seasons,
respectively. is value high significantly increased at first samples in both seasons.
Meanwhile control value only was reached 837.8, 1081.9, 837.8 and 1074.4 cm/ plant
at first and second samples of measurements during first and second seasons,
respectively.
In this respect, Vit.C one of the most important vitamin having stimulation
effects on plant growth, cell division in different plants Thereby increased plant
growth including total leaf area/ plant and increased plant height, tillers number and
leaves number could be expected (Table, 22,23 and 24) and that may be due to
increased total leaf area/plant. Other studies nearly got similar results by Bardies,
(2004) and El-Bassuonay, (2005). The above mentioned results are also being more
clear when calculated as a percentage of control (Tables of growth behavior).
11- Yield characteristics :-
1- Number of spikelets/ Main spike :-
Data in Table (26) show that different applied antioxidants increased number of
spiklet / main spike at 110 and 155 days (at harvest) of plant age during 2006 and
2007. seasons. It could be noticed that highest value was existed with Vit.C that
reached to high significantly level during second samples in both seasons.
In this respect, the obtained increase of this trait may be due to that induced
stimulating effects on plant growth and role of Vit.C on spike fertility due to
increased spikelets number/ spike.
Other studies nearly, got similar results by Anton et al, (1999), Bardisi, (2004) and
Inskbashi and Iwaya (2006).
2- spike length:

As shown in Table (26) different applied antioxidants (i.e.Vit.C, Vit .E and
mixture of Vit.C+E) increased spike length during 2006 and 2007 seasons. The
highest value was existed with Vit.C that reached to high significantly level in
first season but in second season no significant existed.
The obtained increase of this trait may be due to the enhancement and
stimulating some growth factors to increase plant growth and increased plant
height (Table, 22) due to that increase of spike length Anton and Bassiem, (1998).
3- Number and weight of second and third basic spikelets/ main spike (in first
spike third, basal one):-
Data in Table (27) indicated that different applied antioxidants significantly
increased number and weight of second and third basic spikelets in 2006 and
2007 seasons. The highest value was existed with Vit.C in both seasons.
In this respect, the obtained increased of this trait it could be attributed to that
role of Vit.C on fertility and increased fully grain of wheat plants. Other studies,
nearly ,got similar results by Anton and Bassiem (1998) and Bardisi, (2004) .
4- Number and weight of second and third middle spikelets/ main spike (in second
spike third, middle one):-
As shown in Table (28) all antioxidants treatment (i.e. Vit.C, Vit. E and mixture
of Vit.C+ E) increased number and weight of second and third middle spikelets in
2006 and 2007 seasons . It could be noticed that the highest value was existed with
Vit.C in both seasons.
The obtained increase of this trait it could be attributed to the high activity of
photosynthetic rate and increased total leaf area/ plant (Table, 25),hence increase
photosynthates production and their translocation into sink (grains) of wheat
plants.
5- Number and weight of second and third terminal spikelets/ main spike (in third
spike third upper one):-
Data in Table (29) show that numbers and weight of second and third terminal
spikelets positive affected by application of each antioxidants (i.e. Vit.C, Vit.E and
mixture of Vit.C+E ) in 2006 and 2007 seasons The highest value was existed with
Vit.C in both seasons.


In this respect, Vit.C induced many stimulating effect, on fullfility of grains and
increased grains weight.
6- Number and weight of fully grains / Main spike:-
Data in Table (30) different applied antioxidants treatment showed high
significantly increase in number and weight of fully grain/ main spike in 2006 and
2007 seasons. The maximum increase of this trait was existed with Vit.C in both
seasons. The highest value was reached 35.60 and 28.70 gains/ main spike and
1.74 and 1.38 g/ main spike in both seasons. .Meanwhile control value was
reached 24.60 and 20.20 grains/ main spike and 1.39 and 0.99 g in both seasons,
respectively.
The obtained increase of this trait it could by attributed to the role of Vit.C on
increasing photosynthetic rate and photosynthesis production and their
translocation into grains thereby increased grains.
7-Number and weight of semi fullfility grains / Main spike:-
As shown in Table (30) all antioxidants application increased number and weight
of middle fully grains /main spike during 2006 and 2007 seasons. The highest
value of this trait was existed with Vit.C compared with the control.
The highest increase of this value may be due to that increment on plant growth
brought more photosynthesis and photosynthates production in which
translocated to the grain and increased grains fullfility.
8- Number and weight of lowest fullfility grains /main spike:-
Data in Table (31) show that number and weight of lowest fullfility of grains /
main spike decreased with application of


antioxidants treatments (i.e. Vit.C, Vit.E and mixture of Vit C+E) in 2006 and
2007 seasons. The highest reduction of this trait was existed with Vit.C.
The obtained decrease of this trait may be due to the role of Vit. C to the
increment of plant growth and translocation photosynthesis production in into
grains. Thereby decreased weak grain / mean spike.
9- Spike fertility/ plant:-
Data in Table (31) show that different antioxidants treatments (i.e. Vit.C , Vit.E
and mixture of Vit.C+E ) affected spike fertility in 2006 and 2007 seasons. It
could be noticed that different applied antioxidants increased this trait in both
seasons. The highest value was existed with Vit.C that reached to the high
significantly level in first season but in second season did not reach the level of
significance.
It is of interest to note that the obtained increase of this trait at the harvest time
was a direct response to the effect of Vit.C on spike fertility of wheat plant and
increased spike number/ plant. Other studies nearly got similar results by Anton
et al, (1999).
10- Number of grains per gram:-
Data in Table (32) show that number of grain /g was decreased with application
of each antioxidant during 2006 and 2007 seasons. The highest reduction value
was existed with Vit.C during both seasons.

In this respect, the obtained decrease of this trait could by attributed to that
increase of fully grains / main spike (Table, 30) and also may be due to reduction in
number of grains per gram.
11- Weight of 1000 grains:-
Data in Table (32) indicated that weight of 1000 grains was increased with
application of each antioxidant in 2006 and 2007 seasons. The highest value was
existed with Vit.C compared with the control.
The obtained increased of this trait could be attributed to that increase of fully
grains (Table, 30) and increase grains weight thereby could increase the weight of
1000 grains.
12- Number of grains /main spike :-
As shown in Table (33) different applied antioxidants increased number of
grains/ main spike in 2006 and 2007 seasons The highest value was existed with
Vit.C in both seasons.
In this respect, the obtained increased of this trait may be due to that role of
Vit.C on grain fertility and increased number of spikelets/ main spike (Table, 26)
may be due to that increase of grain number/ main spike.
13-Grain weight/ main spike :-
As shown in Table (33) Vit.C increased grain weight / main spike in 2006 and
2007 seasons. Also, other separately application of all antioxidants increased this
trait but by les extent. Although, existed increase of grain weight either with
Vit.C or separately treatments did not reach the significant level.

The obtained increase of this trait may by due to that role of Vit.C on fullfility of
grains and increased fully grains number/main spike, number of grain/ main
spike and 1000 grain weight (Table,30,32 and 33) thereby increased grains weight
/ main spike
14-Grain and straw yields:-
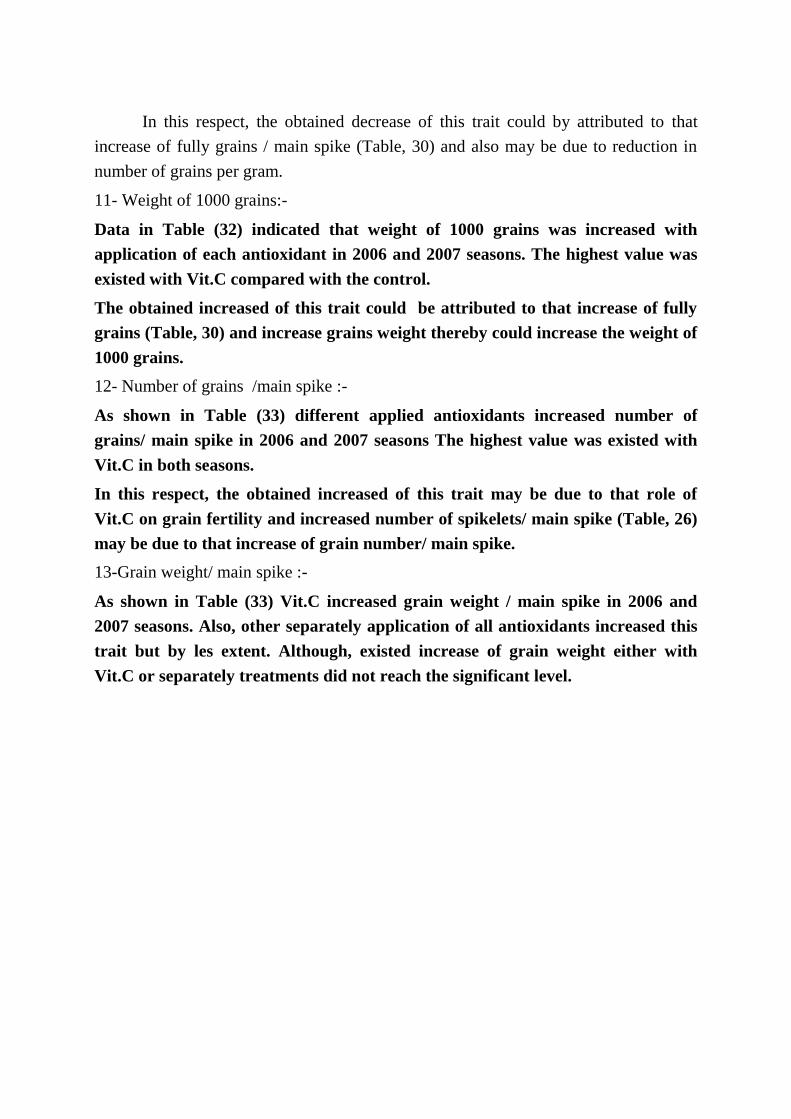
a- Grain yield :
As shown in Table (32) and (33) grain yield/ plant and grain yield / fed
significantly were increased with application of each antioxidant in 2006 and 2007
seasons. The highest value was existed with Vit.C that reached 16.28 and 18.84 g/
plant in 2006 and 2007 seasons, respectively and that means 2265 and 3255 kg /
fed in first and second seasons, respectively. Meanwhile control value was
reached 11.269 and 11.362 g / plant and gave 1710 and 2445 kg / fed in first and
second seasons, respectively.
In this respect, the obtained increased of this trait it could be attributed to
increment of plant growth. That gave more photosynthesis products which
translocated to the grains and increased fully grains and number and weight of
grains (Table, 30,33) due to increase of grain yield/ plant and / fedan thereby
increased total grain yield .
b- Straw yield :-
Data in Table (32) and (33) show that straw yield / plant and / fed were increased
with application of each antioxidant (i.e. Vit.C ,Vit.E and mixture of Vit. C+.E)
during 2006 and 2007 seasons The highest value was existed with Vit.C+E. This
value was reached 31.13 and 27.43 g/plant and 3987.39 and 4644.4 Kg / fed in first
and second seasons, respectively. Meanwhile control value was only 23.29 and
22.92 g/ plant and 3080.1 and 4142 Kg/ fed in first and second seasons,
respectively.
15- Biological yield :-
Data in Table (34) indicate that different applied antioxidants increased
Biological yield / plant during 2006 and 2007 seasons, The highest value was
existed with Vit. C+E in both seasons. The above mentioned results are also being
more clear when calculated as a percentage of control (Tables of yield
characteres).
The obtained increase of this trait may be due to that increment of grain and
straw yields thereby increment of biological yield.
III -Chemical analysis of wheat plants :
1- Photosynthetic pigments:-
Data in Table (35) and (36) indicate that different photosynthetic pigments as
chlorophyll a, b and carotenoids were positively responded to the different applied
antioxidants treatment in first and second samples of measurements at 2006 and 2007
seasons. Also, Vit.C gave the highest value comparing with the control.
The simulative of photosynthetic pigments formation, could be attributed to the
obtained vigorous growth that stimulate chlorophylls and carotenoids formation
hence enhanced photosynthesis efficiency and increased total leaf area/ plant
(Table,25) all of that could be consider as indicator for expectable high total grain
yield. Other studies nearly got similar results by Inskbashi and Iwaya (2006) and
Irfan et al. (2006)

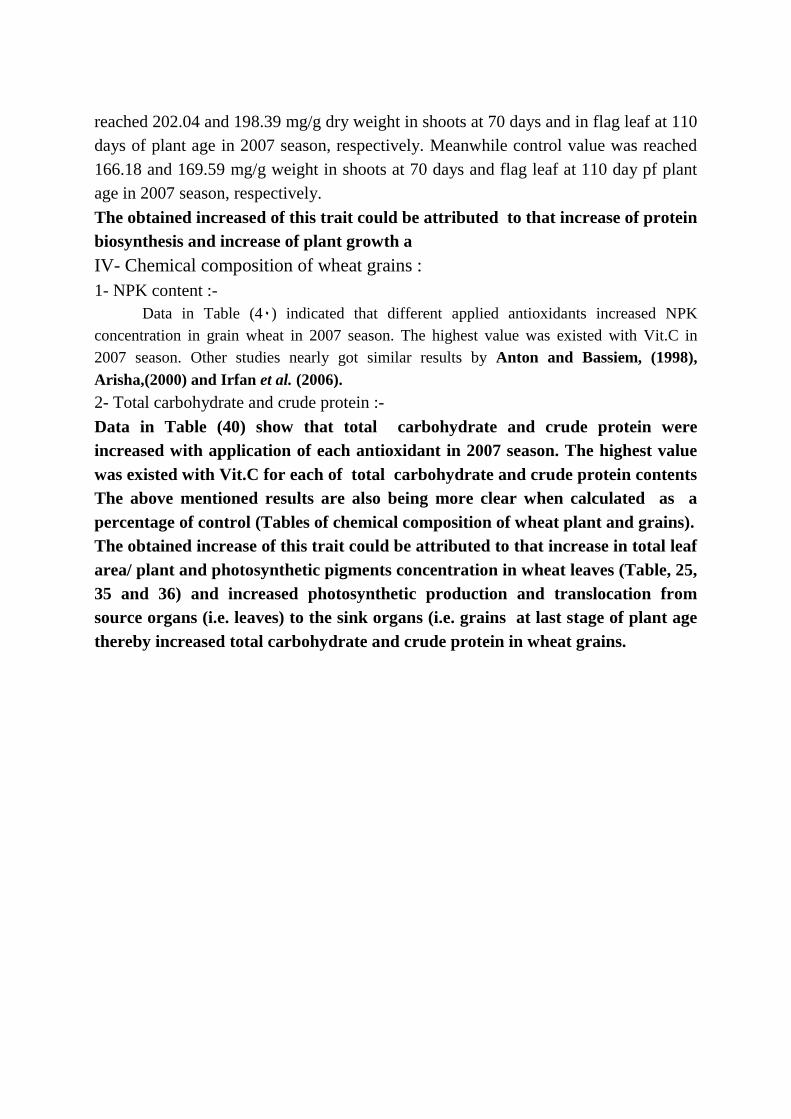
0
500
1000
1500
2000
2500
3000
3500
Grain yield
kg/ fed
zero Vit.C Vit.E Vit.C+E
treatments
1 st season
2 nd season
Fig (3) Show the effect of antioxidants treatments on grain yield (kg/fed)
Zero:- Control Vit.:-Vitamin C Vit.E:- Vitamin E
Vit C+E :-Vitamin C+E


2- NPK content:-
As shown in Table (37) different applied antioxidants (i.e. Vit. C, Vit. E and
mixture of Vit.C+E) increased NPK concentration in shoots of wheat at 70 days and
flage leaf at 110 days of plant age during 2007 season. The highest value of this trait
was existed with Vit.C in first and second samples of measurements that reached 34.80
, 1.80 and 43.45 mg /g dry weigh (for N, P and K) at 70 days of plant age,
respectively. Also, it was for 33.46 , 1.35 and 22.27 mg/g dry weigh (for N,P and K) in
flag leaf at 110 days of plant age in 2007 season, respectively. Meanwhile control
value was reached 31.5 , 1.32 and 36.91 mg/g dry weight (for N, P and K) in shoots at
70 days of plant age during 2007 season, respectively and 29.49 , 74 and 18.76 mg/g
dry weight (for N, P and K ) in flage leaf at 110 days of plant age in 2007 season,
respectively.
In this respect the obtained increase of this trait could be attributed to that
increase of N,P and K uptake by plants and increased elements accumulation in wheat
organs. Other studies nearly got similar results by Mitsui and Oi (1984) ,Bardisi,
(2004) and Irfan, et al (2006).
3- NPK uptake:-
As shown in Table (38) NPK uptake increased with application of antioxidants
(i.e. Vit.C , Vit.E and mixture of Vit.C+E ) in shoots at 70 days and in flag leaf at 110
days of plant age in 2007 season. The highest value was existed with Vit.C, in shoots
at 70 days and flag leaf at 110 days of plant age in 2007 season.


The obtained increase may be due to highest elements uptake by plant and
increased NPK concentration in root surface in soil and uptake. Other studies nearly
got similar results by Anton, et al (1999) and Arisha, (2000).
4- Total carbohydrate contents :-
Data in Table (99) indicate that total carbohydrates was increased with
application of each antioxidant ( i.e. Vit.C , Vit.E and mixture Vit.C+E ) in shoots
at 70 days and flag leaf at 110 days of plant age in 2007 season. The highest value
was existed with Vit.C in first and second samples of measurements in 2007
season. The highest value was reached 236.90 and 519.90 mg/g day weight in
shoots at 70 days and flage leaf at 110 days of plant age in 2007 season,
respectively. Meanwhile control value was reached 153.0 and 378.4 mg/g dry
weight in shoots at 70 days and flag leaf at 110 days of plant age in 2007 season,
respectively.
In this respect the obtained increase of this trait could be attributed to that
increase in total leaf area/ plant and increased photosynthetic pigments
concentration in leaves (Table, 25, 35 and 36 ) as well as to the active
translocation of photosynthetic production (i.e. carbohydrates) from source
organs ( i.e. leaves ) to the sink organs ( grains) at last stage of plant age.
5- crude protein :-
As shown in Table (39) crude protein content significantly increased with
application of antioxidants in shoots at 70 days and flag leaf at 110 days of plant age in
2007 seasons. The highest value was existed with Vit.C in first and second samples of
measurements in 2007 season. The highest value was
reached 202.04 and 198.39 mg/g dry weight in shoots at 70 days and in flag leaf at 110
days of plant age in 2007 season, respectively. Meanwhile control value was reached
166.18 and 169.59 mg/g weight in shoots at 70 days and flag leaf at 110 day pf plant
age in 2007 season, respectively.
The obtained increased of this trait could be attributed to that increase of protein
biosynthesis and increase of plant growth a
IV- Chemical composition of wheat grains :
1- NPK content :-
Data in Table (40) indicated that different applied antioxidants increased NPK
concentration in grain wheat in 2007 season. The highest value was existed with Vit.C in
2007 season. Other studies nearly got similar results by Anton and Bassiem, (1998),
Arisha,(2000) and Irfan et al. (2006).
2- Total carbohydrate and crude protein :-
Data in Table (40) show that total carbohydrate and crude protein were
increased with application of each antioxidant in 2007 season. The highest value
was existed with Vit.C for each of total carbohydrate and crude protein contents
The above mentioned results are also being more clear when calculated as a
percentage of control (Tables of chemical composition of wheat plant and grains).
The obtained increase of this trait could be attributed to that increase in total leaf
area/ plant and photosynthetic pigments concentration in wheat leaves (Table, 25,
35 and 36) and increased photosynthetic production and translocation from
source organs (i.e. leaves) to the sink organs (i.e. grains at last stage of plant age
thereby increased total carbohydrate and crude protein in wheat grains.
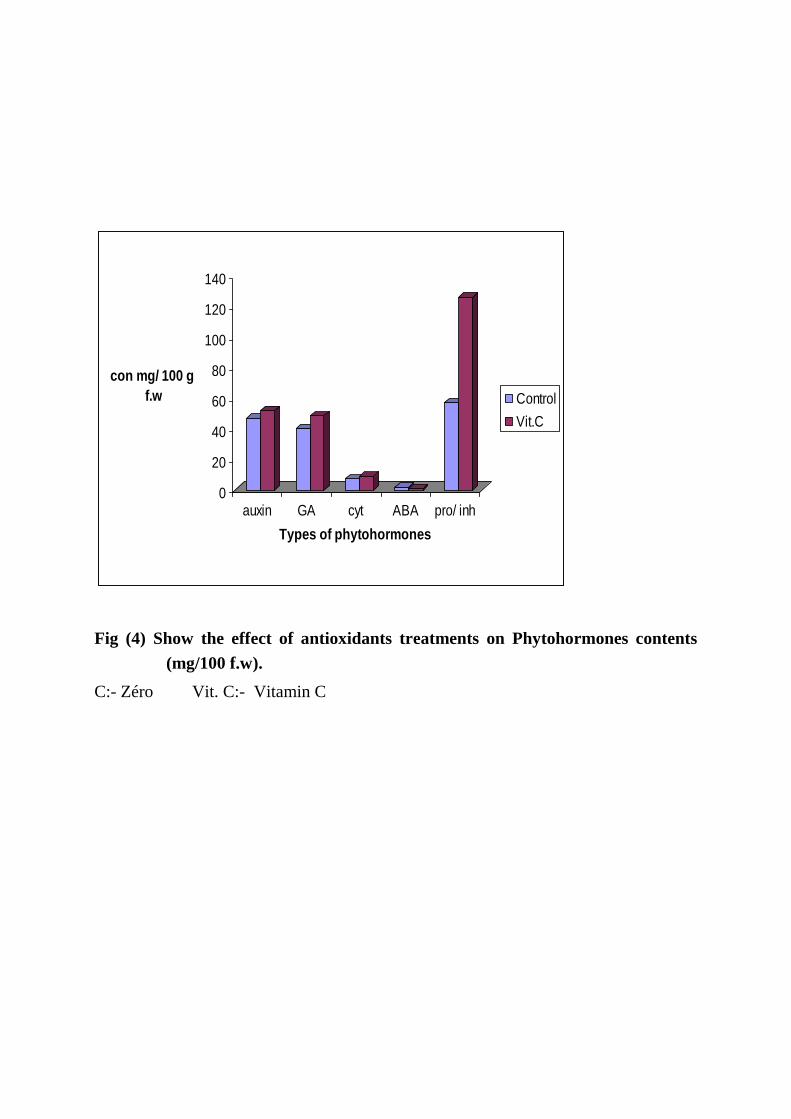
V- Endogenous Phytohormones content:
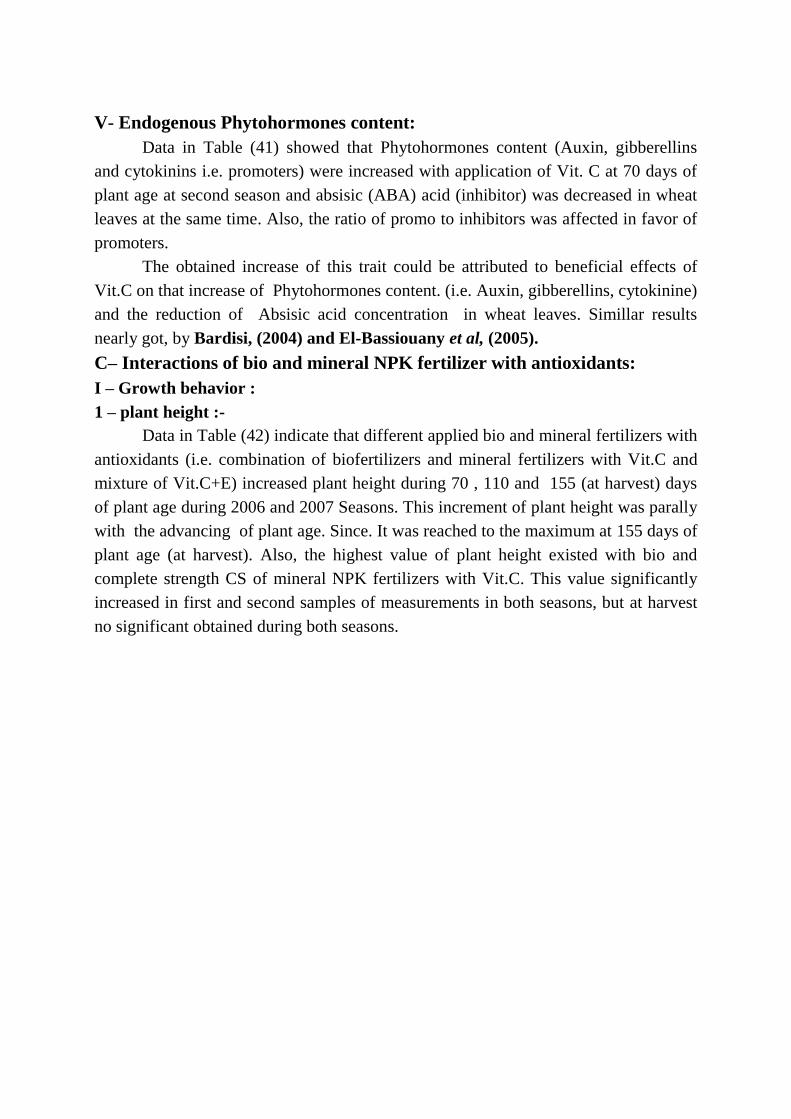
Data in Table (41) showed that Phytohormones content (Auxin, gibberellins
and cytokinins i.e. promoters) were increased with application of Vit. C at 70 days of
plant age at second season and absisic (ABA) acid (inhibitor) was decreased in wheat
leaves at the same time. Also, the ratio of promo to inhibitors was affected in favor of
promoters.
The obtained increase of this trait could be attributed to beneficial effects of
Vit.C on that increase of Phytohormones content. (i.e. Auxin, gibberellins, cytokinine)
and the reduction of Absisic acid concentration in wheat leaves. Simillar results
nearly got, by Bardisi, (2004) and El-Bassiouany et al, (2005).
C– Interactions of bio and mineral NPK fertilizer with antioxidants:
I – Growth behavior :
1 – plant height :-
Data in Table (42) indicate that different applied bio and mineral fertilizers with
antioxidants (i.e. combination of biofertilizers and mineral fertilizers with Vit.C and
mixture of Vit.C+E) increased plant height during 70 , 110 and 155 (at harvest) days
of plant age during 2006 and 2007 Seasons. This increment of plant height was parally
with the advancing of plant age. Since. It was reached to the maximum at 155 days of
plant age (at harvest). Also, the highest value of plant height existed with bio and
complete strength CS of mineral NPK fertilizers with Vit.C. This value significantly
increased in first and second samples of measurements in both seasons, but at harvest
no significant obtained during both seasons.

0
20
40
60
80
100
120
140
con mg/ 100 g
f.w
auxin GA cyt ABA pro/ inh
Types of phytohormones
Control
Vit.C
Fig (4) Show the effect of antioxidants treatments on Phytohormones contents
(mg/100 f.w).
C:- Zéro Vit. C:- Vitamin C

The enhancement of bio and CS mineral NPK fertilizers on plant height, might
due to the well established physiological roles on the increase of meristametic activity
in wheat plant as well as cell elongation .Its effect on Auxin formation and other
endogenous Phytohormones thereby, enhancement of plant growth including plant
height. This interpretation will be confirmed after words in the part of hormones
determinations (Table,61).Other studies, nearly got similar results by Wang and
Below, (1995), Abdel- Hamed, (1999), Anton, et al, (1999), Ghallab and Salem,
(2001) and Inskbashi and Iwaya (2006).
2- Number of tillers / plant:-
As shown in Table (43) number of tillers / plant was increased with
combination of bio and CS of mineral NPK fertilizers with Vit.C during 70, 110 and
155 days of plant age during 2006 and 2007 seasons. Inaddition, the application of bio
and NPK levels with Vit.C and mixture of Vit C+E increased this trait compared with
the control both Seasons.
In this respect, the obtained increase of this trait could be attributed to those
beneficial effects of bio and mineral fertilizer with Vit.C on tillers number and effect
of cytokinins production by applied microorganisms to increased formation of
endogenous Phytohormones. This interpretation will be confirmed after words in the
part of hormone determination (Table, 21). Also, in this respect Abdel-Hamed,
(2005) reported that number of tillers increased with application of bio combined with
CS mineral NPK fertilizers. Similar results were obtained by Arisha, (2000),
Ghallab and Salem, (2001) and Abdel- Hamed, (2005).

3- Number of leaves / plant:-
Data in Table (44) show that, number of leaves increased with the advancing of
plant age. Also , it Could be noticed that combination of bio with mineral NPK
fertilizer with Vit.C gave maximum increase in number of leaves / plant during 70 and
110 days of plant age in 2006 and 2007 seasons. Inaddition combination of bio and
mineral NPK fertilizers levels with Vit.C and mixture of Vit. C+E increased this
number but by less extent. Increment of this trait compared with the control was
obtained during first and second samples of measurements in both seasons.
The obtained increase of this trait may be due to the encouragement of different
aspects of wheat growth thereby increased leaves number/ plant and increased plant
height and tillers number/plant (Table, 42 and 43)
4- Fresh weight of Shoots :-
Data in Table (44) show that different applied combination of bio and mineral
NPK fertilizers with Vit.C and mixture of Vit.C+E increased fresh weight of shoots
during 70 and 110 days of plant age in 2006 and 2007 seasons. The highest Value of
this trait existed with combination of bio and CS mineral NPK fertilizers with Vit.C
during first and second samples of measurement in both seasons.
The increment of this trait may be due to the beneficial effects of bio and
mineral NPK fertilizers with Vit.C to increased vegetative growth ( Table 42, 43 and
44) due to stimulation of plant growth including fresh weight of shoots in wheat
plants. Other studies nearly got similar results by Anton and Bassiem (1998) and
Irfan et al. (2006).
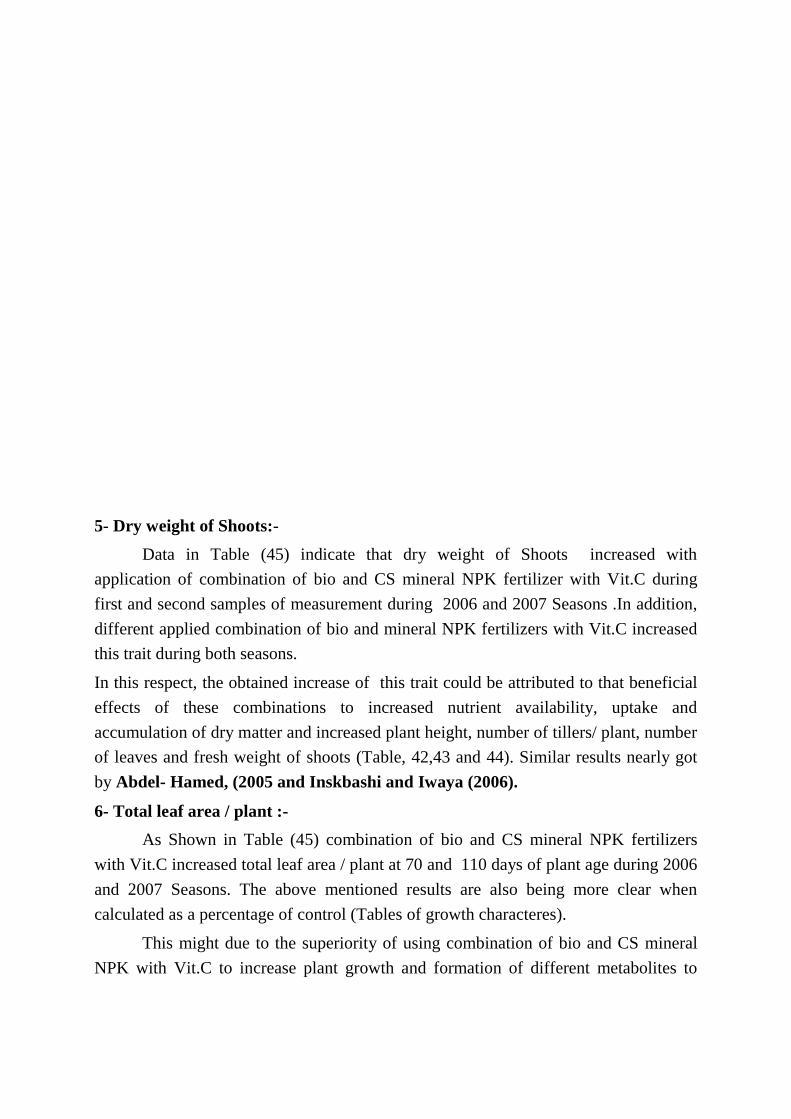
5- Dry weight of Shoots:-
Data in Table (45) indicate that dry weight of Shoots increased with
application of combination of bio and CS mineral NPK fertilizer with Vit.C during
first and second samples of measurement during 2006 and 2007 Seasons .In addition,
different applied combination of bio and mineral NPK fertilizers with Vit.C increased
this trait during both seasons.
In this respect, the obtained increase of this trait could be attributed to that beneficial
effects of these combinations to increased nutrient availability, uptake and
accumulation of dry matter and increased plant height, number of tillers/ plant, number
of leaves and fresh weight of shoots (Table, 42,43 and 44). Similar results nearly got
by Abdel- Hamed, (2005 and Inskbashi and Iwaya (2006).
6- Total leaf area / plant :-
As Shown in Table (45) combination of bio and CS mineral NPK fertilizers
with Vit.C increased total leaf area / plant at 70 and 110 days of plant age during 2006
and 2007 Seasons. The above mentioned results are also being more clear when
calculated as a percentage of control (Tables of growth characteres).
This might due to the superiority of using combination of bio and CS mineral
NPK with Vit.C to increase plant growth and formation of different metabolites to

increase total leaf area/ plant and increased plant height, number of tillers/ plant and
number of leaves/ plant due to that increase in total leaf area/ plant.
This increment of leaf area by using such combination was previously
recommeded by Mengal and Kirkby, (1979). Since, that could be reflected on the
final expanded of formed leaves and vigorous vegetative growth as well Banzigor, et
al, (1994) and many others.
II – Yield Characteristics :-
1- Number of Spikelets / main Spike :
Data in Table (46) Show the effect of combination of bio and mineral NPK with
Vit.C and mixture of Vit.C+E on number of Spiklets. It could be noticed that
combination of bio and CS mineral NPK fertilizers with Vit.C increased this trait at
110 and 155 ( at harvest) days of plant age .
In this respect the obtained increase of this trait it could be attributed to
beneficial effects of bio and mineral NPK fertilizer with Vit.C on fertility and spike
formation thereby increased this trait.
2 – Spike length :-
Data in Table (46) indicated that Spike length was increased with combination
of bio and CS mineral NPK fertilizers with Vit.C at 110 and 155 days of plant age (at
harvest) during 2006 and 2007 seasons. This Value reached to the high level of
significant at 155 days of plant age in 2006 Seasons. Inaddition Separately application
of combination of bio and mineral NPK fertilizers levels with Vit.C increased this trait
compared with the control in both Seasons.

In this respect the obtained increase of this trait may be due to the increment of
plant height (Table, 42) and that could increase spike length.
3 – Number and weight of second and third basic spikelets / main spike :-
As shown in Table (47) different applied combination of bio and mineral NPK
fertilizers with Vit.C and mixture of Vit.C+E increased number and weight of second
and third basic spiklets during 2006 and 2007 seasons. The highest value existed with
combination of bio and CS mineral NPK fertilizers with Vit.C in both seasons. This
increment reached to the high level of significance in first seasons but second seasons
no significant.
In this respect, the obtained increased of this trait may be due to increased parameters
of vegetative growth (Table, 42, 43,44 and 45) that increased photosynthetic rate and
translocation of photosynthates into grains. Other studies nearly got similar results by
Ghallab and Salem, (2001) and Abdel- Hamed, (2005) and many others.
4- Number and Weight of Second and third middle spiklets / main Spike:-
Data in Table (48) show the effect of combination of bio and mineral NPK
fertilizers with Vit.C and mixture of Vit.C+E on number and weight of Second and
third middle spiklets. It could be noticed that combination of bio and CS mineral NPK
with Vit.C increased this trait during 2006 and 2007 Seasons. In addition, different
treatments increased this trait compared with the control but by less extent in both
seasons.


In this respect, the obtained increase of this trait could be attributed to increment
of total leaf area /plant (Table, 45), due to increased photosynthates production and
translocation into grains thereby increased this trait. Simillar results nearly got, by Ali,
et al, (2004), Bardisi, (2004) and Abdel- Hamed, (2005).
5– Number and weight of second and third terminal spikelets / main spike :-
Data in Table (49) showed that number and weight of second and third terminal
spiklet was increased with combination of bio and CS mineral NPK fertilizers with
Vit.C during 2006 and 2007 seasons. Although, Separately application of combination
of bio and mineral NPK with Vit.C increased this trait but by less extent.
The obtained increase of this trait may be due to increased photo synthetic rate and
translocation of photosynthates into grains and beneficial effects of combined them.
Abdel-Hamed, (2005).
6 – Number and weight of fully grains / main Spike :-
Data in Table (50) indicated that combination of bio and complete strength CS
mineral NPK fertilizers with Vit.C increased number of fully grains and their weight
during 2006 and 2007 seasons. In addition, different combination of bio and mineral
NPK levels with Vit.C increased of this trait with increasing mineral NPK levels in
both seasons but by less extent.
In this respect, the obtained increase of this trait could be attributed to that
increase in total leaf area and increased number of spikelet/ main spike (Table, 45 and
46) due to increased

photosynthetic rate and translocation of photosynthates into grains and increased
number of grains per main spike thereby increased fully grains per main spike. Other
studies nearly got similar results by Abdel- Hamed, (2005) and Inskbashi and Iwaya
(2006).
7- Number and weight of semi fully grains / main Spike:-
As Shown in Table (50) different applied combinations of bio and mineral
NPK chemical fertilizers with Vit.C and mixture of Vit.C+E increased number and
weight of semi fully grains / main spike during 2006 and 2007 seasons. The highest
value was existed with combinations of bio and complete strength CS NPK fertilizer
with Vit.C during 2006 and 2007 Seasons.
In this respect the obtained increase of this trait could be attributed to increased
photosynthate production and their translocation into grains.
Simillar results nearly got by Ali, et al, (2004) and Abdel- Hamed, (2005).
8- Number and weight of lowest fully grains / main Spike :-
Data in Table (51) indicate that different applied combinations of bio and
mineral NPK with Vit.C and mixture of Vit.C+E decreased lowest fully grains / main
spike during 2006 and 2007 seasons. The highest decrease was obtained with the
combination of bio and CS NPK with Vit.C in both seasons.
In this respect, the obtained decrease of this trait could be attributed to
increased translocation of photosynthates produced into grains and decreased fully
grains per main spike thereby decreased number of lowest fully grains / main spike.

9 – Spike Fertility / plant :-
Data in Table (51) show that combination of bio and CS mineral NPK with
Vit.C increased spike fertility/ plant during 2006 and 2007 seasons. Although,
application of bio and mineral NPK with Vit.C and mixture of Vit.C+E increased this
trait but by less extent in both seasons.
Increase of spike fertility with this value is related to the know/ physiological
effects of there treatments on increasing of the endogenous Cytokinins Wang and
Below, (1995) and beneficial effect of this value on increment of number of spike /
plant and increased this trait.
Similar results nearly got by Abdel- Hamed, (1999), Ghallab and Salem,
(2001),Abdel- Hamed, (2005) and Irfan et al. (2006).
10 – Number of grains per gram :-
Data in Table (52) indicated that number of grains was decreased with
combination of bio and CS mineral NPK fertilizers with Vit.C during 2006 and 2007
Season . Although, separately application of bio and mineral NPK levels with Vit.C
and mixture of Vit.C+E decreased this trait but by less extent in both Seasons.
In this respect, the obtained decrease of this trait could be attributed to the
increase of translocation of produced photosynthates into grains and increased grains
fullney (Table,50) thereby increased fullney of grains and decreased number of
grains.

Similar results nearly, got by Abdel- Hamed, (1999) Abdel- Hamed, (2005)
and Inskbashi and Iwaya (2006).
11- Weight of 1000 grains :-
Data in Table (52) indicate that Thousand grains weight was increased with
combination of bio and CS mineral NPK fertilizers with Vit.C during 2006 and 2007
Seasons . Although, Separattely application of bio and mineral NPK levels with Vit.C
and mixture of Vit.C+E increased this trait but by less extent in both seasons.
In this respect the obtained increase of this trait could be attributed to that increase of
fully grains and number of grains per one gram (Table, 50 and 52) due to increased
weight of 1000 grains.
Simillar results nearly got, by Ali, et al, (2004) and Abdel- Hamed, (2005).
12- Grain weight / main Spike:
Data in Table (53) showed that combination of bio and CS mineral NPK
fertilizers with Vit .C increased grain weight per main spike during 2006 and 2007
seasons. Although , separately application of bio and mineral NPK levels with Vit.C
and mixture of Vit .C+E increased this trait but by less extent in both seasons.
This increase may be due to that increment of total leaf area (Table, 46) and
photosynthetic (Tables, 55 and 56) increased photosynthates production and
translocation of produce photosynthates into grains thereby increased fully grains,
grains weight and number of spikelets and fully grains

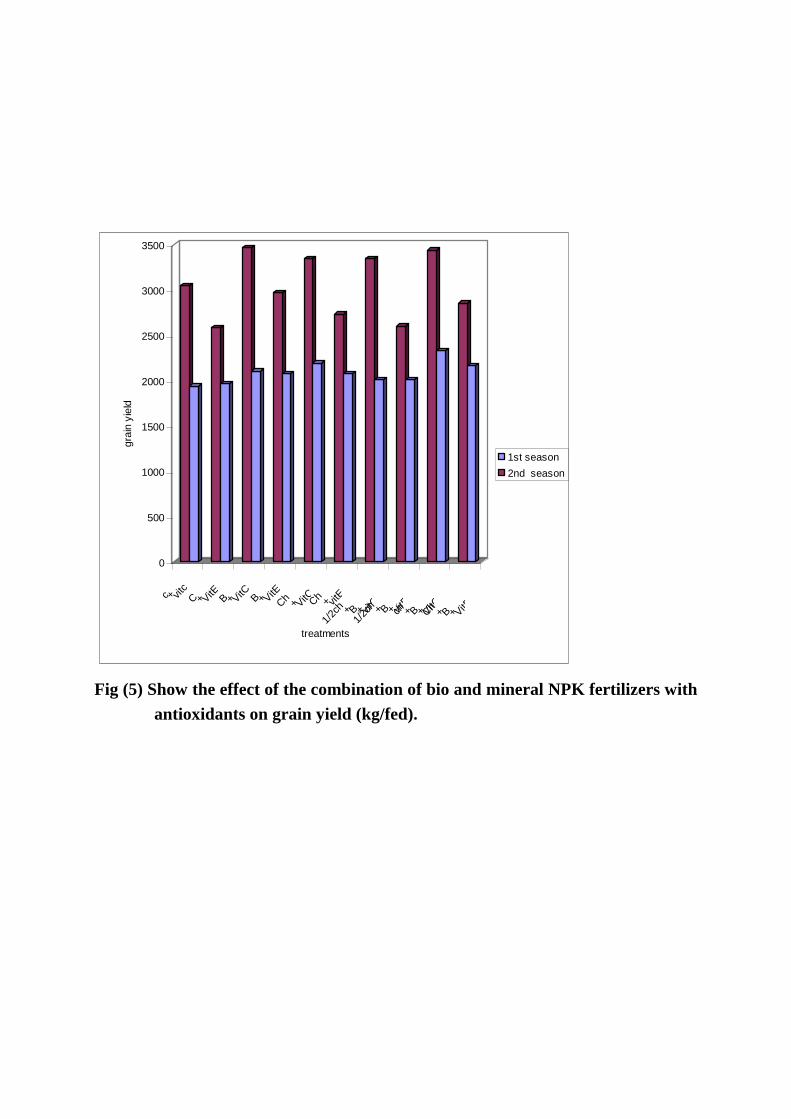
0
500
1000
1500
2000
2500
3000
3500
gra
in y
ield
( kg
/ fed
)
c + vitc
C + VitE
B + VitC B + VitE
Ch
+ VitCCh
+ vitE
1/2c
h + B + vitC
1/2c
h + B + vitE
ch + B + VitC
Ch
+ B + VitE
treatments
1st season
2nd season
Fig (5) Show the effect of the combination of bio and mineral NPK fertilizers with
antioxidants on grain yield (kg/fed).
(Tables, 47 and 50). Other studies nearly got similar results by Abdel- Hamed,
(1999), Ali et al., (2004), and Abdel- Hamed, (2005)
13 – Number of grains / main Spike :-
Data in Table (53) indicate that different applied combination of bio and
mineral NPK levels with Vit.C and mixture of Vit.C+E increased number of grains /
main spike during 2006 and 2007 seasons. The highest value was existed with
combination of bio and CS mineral NPK with Vit.C during 2006 and 2007 seasons.
In this respect the obtained increase of this trait could be attributed to the increment of
spikelets number per main spike (Table, 47) and beneficial effect of this value on
improving this trait.
Other studies, nearly got Simillar results by Mohamed, (1994), Abdel- Hamed,
(1999) and Abdel- Hamed, (2005) on wheat plants.
14- Grain and Straw Yields:-
a - Grain yield :-
As Shown in Table (52) and (53) combination of bio and CS mineral NPK with
Vit .C increased grain yield per plant and per fed during 2006 and 2007 seasons .
Although , separately application of bio and mineral NPK levels with Vit C and
mixture of Vit. C+E increased this Trait but by less extent in both seasons. The above
mentioned results are also being more clear when calculated as a percentage of control
(Table,52 and 53).
This increase of this trait could be attributed to the increase of total leaf area/
plant (Table,46) and increased photosynthetic pigments formation (Tables 55 and 56),
increased photosynthates production and their translocation into grains and increased
grains fullness, number and weight of grain/ main spike(Tables, 51 and 53), thereby
increased grain yield per plant and per fedan. Other studies nearly got similar results
by Abdel- Hamed, (1999), Ali , et al, (2004) , Bardisi, (2004) and Abdel- Hamed,
(2005 ).
b- Straw yield :-
Data in Table (52) and (53) show the effect of combination of bio and mineral
NPK levels with Vit.C and the mixture of Vit.C+E on straw weight/ plant and / fed
during 2006 and 2007 seasons.Clearly indicate that straw was similarly responded as
well as grains. The above mentioned results are also being more clear when calculated
as a percentage of control (Table, 53).
15- Biological yield :-

Data in Table (54) indicated that bio logical yield increased with combination
of bio and CS mineral NPK fertilizers with Vit. C during 2006 and 2007 seasons .
Although, separatley, application of bio and mineral NPK levels with vit C and
mixture of Vit.C+E increased this trait but by less extent in both seasons. The above
mentioned results are also being more clear when calculated as a percentage of control
(Table,54).
The obtained increase of this trait may be reverased upon increase grain and
straw yields per plant and per fedan (Table,52 and 53).
16- Harvest index:-
Data in Table (54) indicated that harvest index was increased with bio and CS
mineral NPK with Vit .C during 2006 and 2007 seasons. Although, separately
application of bio and mineral NPK levels with Vit. C and mixture of Vit.C+E
increased this trait but by less extent in both seasons. The above mentioned results are
also being more clear when calculated as a percentage of control (Tables of yield
characters).
Increased of harvest index could be attributed to increment of grain yield/
feddan.
III- Chemical analysis of wheat plants:
1- Photosynthetic pigments :
Data in Table (55) and (56) indicated that different photosynthetic pigments as
(chlorophyll a,b and carotenoides) were positively responded to the different applied
combination of bio and mineral NPK fertilizer with Vit C and mixture of Vit.C+E at
70 , 110 days of plant age during 2006 and 2007 seasons. Also, combined bio and CS
mineral NPK with Vit.C gave the highest value in this trait comparing with the control.
In addition, the simulation of photosynthetic pigments formation could be
attributed to the vigorous growth that could increase chlorophylls and carotenoides
formation were enhanced photosynthetic efficiency, and increased total leaf area/ plant
(Table,45). Other studies nearly got similar results by Abdel- Hamed, (2005) and
Inskbashi and Iwaya (2006).


2- NPK Content :-
As shown in Table (57) NPK concentration in two stages of wheat growth ( i.e.
70 and 110 days of plant age) obviously was increased in shoots at 70 days and flage
leaf at 110 days with combination of bio and CS mineral NPK with Vit.C in 2007
season. Although, separatley application of bio and mineral NPK with Vit.C and
mixture of Vit.C+E increased this trait but by less extent.
As for phosphorus and potassium concentrations, also clearly was similarly
responded as well as in caseof nitrogen concentration.
In general, as previously mentioned vegeitive growth was obviously affected
with each the combination bio and mineral NPK levels with Vit.C and mixture of
Vit.C+E. Here, it could be noticed that there is an intimate relationship between the
growth aspects and the accumulation of different determined elements in shoots and
flage leaf in wheat plants.
Other studies nearly got similar results, by Ali et al, (2004),Abdel- Hamed,
(2005) and Irfan, et al (2006).
3- NPK uptake :-
Data in Table (58) indicated that different applied combination of bio and
mineral NPK levels with Vit.C and mixture of Vit.C+E increased NPK uptake by
shoots at 70 days and flage leaf at 110 days of plant age in 2007 season. The highest
value was existed with combination of bio and CS mineral NPK with Vit.C in first and
second samples of measurements in 2007 season.


In this respect, the obtained increase of this trait may be due to beneficial
effects of bio and mineral NPK with Vit.C on increase nutrient availability and uptake
by plants.
Other studies nearly got similar results by Sonbol et al, (2000), Ali , et al, (2004) and
Abdel- Hamed , (2005).
4 Total carbohydrates :-
As shown in Table (59) total carbohydrats was increased with combination of
bio and CS mineral NPK with Vit.C at 70 and 110 days of plant age during 2007
season. Although, separately application of combination of bio and mineral NPK level
with Vit.C and mixture of Vit .C+E increased this trait but by less extent.
In this respect, the obtained increase of this trait could be attributed to that
increase of total leaf area (Table.45), photosynthetic pigment, (Tables 55 and 56) and
photosynthetic rate and photosynthates production (carbohydrates) thereby increased
carbohydrates content.
Simillar results nearly got , by Abdel- Hamed, (1999) , Ali, et al, (2004),
Abdel- Hamed, (2005) and Inskbashi and Iwaya (2006).
5- Crude protein :-
With regard to the content of crude protein in shoots at 70 days and flag leaf at
110 days of plant age in 2007 season as indicated in Table (59), a strict increase of this
content existed with combination of bio and CS mineral NPK fertilizer with Vit.C at
first and second samples of measurements. Although, separately application of
combination of bio and mineral NPK level with Vit. C and mixture of Vit .C+E
increased this trait but by less extent.

The above mentioned results could consider as a direct effect of bio , mineral
NPK and Vit C on protein content and increased photosynthetas production and
formation of protein.
Other studies nearly got similar results by Abdel- Hamed, (2005).
IV- Chemical composition of wheat grains :
1- NPK content:-
As shown in Table (60) different applied combination of bio and mineral NPK
levels with Vit.C and Vit.C+E increased mineral NPK content in wheat grains in 2007
seasons. The highest value was existed with combination of bio and CS mineral NPK
fertilizers with Vit.C in grains during 2007 season.
The obtained increase of this trait may be due to that beneficial effect of bio , mineral
NPK and Vit. C on nutrient availability, uptake and translocation into grains. Abdel-
Hamed, (2005).
2- Total carbohydrates and crude protein :-
Data in Table (60) show that combination of bio and CS mineral NPK with Vit.
C increased total carbohydrates and crude protein in wheat grains. Although,
separatley application of combination of bio and mineral NPK levels with Vit.C and
Vit C+E increased this trait but by less extent. The above mentioned results are also
being more clear when calculated as a percentage of control (Tables of chemical
composition of wheat plants and wheat grains).
In this respect , the obtained increase of total leaf area (Table 45)
photosynthetic pigments (Table, 55 and 56) and increased photosynthetic production
and translocation of

photosynthates produced from source organs (leaves) to sink organs( grains) thereby
increased total carbohydrates and crude protein in wheat grains.
Simillar results nearly got, by Abdel- Hamed, (2005).
V- Endogenous Phytohormones contents:
Data in Table (61) show that Phytohormones content (i .e. Auxins, Gibberellins
and Cytokinins) was increase with application of bio and mineral NPK level with
Vit.C in wheat leaves at 70 days of plant age. The highest value was existed with
combination of bio and CS mineral NPK with Vit.C. Meanwhile, growth inhibitors
was reduced in roots and increased in leaves at 70 days of plant agein 2007 season.
The above mentioned results are also being more clear when calculated as a
percentage of control (Table, 61).
The obtained increase of endogenous phytohormones content may be due to
beneficial effects of bio and mineral NPK with Vit.C on growth behaviour.
This results are in agreement with Ghallab and Salem, (2001).

0
50
100
150
200
250
300
350
400
450
con mg/ 100 g
f.w.
auxin GA cyt ABA pro/ inh
Types of phytohormones
control
Bio+Vit.c
Ch+Vit.C
Ch+Bio+Vi
t.c
Fig (6) Show the effect of the combination of bio and mineral NPK with
antioxidants on Phytohormones contents
Bio+Vit.C: Biofertilizers +Vit C
Ch+Vit C:- Chemical fertilizers +Vit C
Ch+B+Vit C:-Chemical fertilizer + Biofertilizer +Vitamine C
REFERANCES
A.O. A. C. (1990). Official methods of analysis, 15th
Ed., Association of official
analytical chemists, Inc., USA. manure. Annals. Agric. Res, 24 (3): 466-473.
Abdel-Azeem, H, (1998). production of biofertilizers convenient for desert soil to
limit the Environmental pollution Resu.Hed From inorgamc manuring , p . 33
, 42 and 10 E . Ph .D. Thesis. Insitit . Enllror . Studies Res . Ain-Shams . univ
.
Abdelgany, B. F. (1996). Influence of different bacterial strains as biofertilizers on
wheat crop production in new cultivated land. Desert. Inst. Bull. Egypt.,
46.No 2: pp. 215-226.
Abdel-Hamed, A. M. (2005). Some physiological effects of biofertilizers on wheat
plant grown under different levels of salinaity and mineral fertilization. Ph.
D. Fac. Agric. Cairo. Univ.
Abdel-Hamed; M, M. (1999). physiological studies on nitrogen
nutration on some economical plants ,M . Sc thesis.
Fac . Agric, Moshtohor . Zagazig .univ . Benha. Branch
Abdel-Mawly, S. E. and A. A. El-Sharkawy (2005). Effect of soil moisture and
integration of mineral and biofertilization of nitrogen on wheat (Triticum
aestivum L) Growth. Assuit.J. Agric. Res.42 (2): 237-261.
Aishwath, O. P; M. S. Dravied and P. S. Deshmukh (2003). Nitrate reductase
activity and chlorophyll content in wheat a influenced by chemical fertilizer,
biofertilizers and farmyard manure. Annals. Agric. Res, 24 (3): 466-473.
Ali, A. G, O. E. Zeiton; A. H. Bassisuny and A. R. Y. El- Bana (2004). Productivity
of wheat cultivars grown at Elkhatara and Elarash under different levels of
planting density and N fertilization. Zigzag. J. Agric. Res., 31 (4A): 1225-
1256.
Anton, N. A. and M. M. Bassiem (1998).Effect of phosphorus and potassium
fertilizers and foliar spray with ascorbic and citric acids on peanut under
sandy soils condition. Zagazig. J. Agric. Res, 25 (5): 733-742.
Anton, N. A., A. S. Abdel-Nour and El-Set and A. Abdel-Aziz (1999).Response of
barley to ascorbic, citric acids and micronutrients mixture under sandy
soils condition. Zagazig. J. Agric. Res, 26 (6): 1553-1563.
Arisha, H. M. E. (2000). Effect of vitamin C on growth, yield and tuber quality of
some potato cultivars under sandy soil condition. Zagazig. J. Agric. Res,
27 (1): 91-104.
Atia, N. A. and R. M. Aly (1998). Effect of different levels of nitrogen and
phosphorus fertilizer with the application of rabbit manure on yield
potentiality of wheat in sandy soils. Zagazig. J. Agric. Res, 25 (4): 595-617.
Avjit, S and S. Kumar (1998). Economization of NPK on wheat (Triticum aestivum.
L) through biofertilizer biozyme.Indian. Agric, 42 (4): 247-251.
Banziger, M., B. Feli and p. stamp (1994). competition between nitrogen
accumulation and groin growth for carbohydrate daring grain filling of
wheat. Crop .Sci , 34 (2) : 440-446.
Bardisi, A. (2004). Influence of vitamin C and salicylic acid foliar application on
garlic plants under sandy soils conditions. Zagazig. J. Agric. Res, 31 (4
A): 1335-1347.
Bashan, Y. and H. Levanonry (1990). current status of Azospirillum inoculation
technology .Azospirillum as achallenge for Agriculture . con .j .Microbiol 36 :
591-608.
Bhat, M. L., A. Sen and N. M. Misra (1990). Rainfed wheat as affected by cycocel,
ascorbic acid gibberillic acid seed treatments. Rachis 9 (1): 17-20.
Bhattarai, T and D. Hess (1998). Growth and yield response of a Nepalese spring
wheat cultivar to the inoculation with Nepalese Azospirillum spp at various
levels of nitrogen fertilization. Biol.fertil. Soils, 26 : 72-77.
Chapman, H. D. and F. P. Pratt (1961). Methods of analysis of soil, plant and water.
Cal. Univ., 150-200.
Chen, Z. and D. R. Gallie (2006). Dehydro ascorbate reductase affects leaf growth
development and function. Plant. Physio, 142 (2): 775-787.
Chunchun, K., M. M. Agrawal and B. R. Gupta (1998). Azospirillum and its
potential as biofertilizer. Fertiliser. News, 43(11):47, 49-50.
Das, A., M. K. Bera and M. Mohiuddin (2001).Effect of different yield attributes on
the productivity of wheat as influenced by growth regulators and
biofertilizer. Enviro and Ecology , 19 (1): 145-148.
Derieux, M., R. Krerrest and Y. Montalanty (1973).Etude dela surface foliaive et de
lactivite photosynthetique chez kulkues hybrid de mais. Ann. Amelior plants,
23: 95-107.
Dhopte, A. and S. lall (1987). Relatre efficiency of anti transparent , growth
regulators and mineral nutrients in control of leaf reddening in hirsute cotton
under dry land conditions . Ann . plant . physiology .(1): 65-71.
Dubois, M., K. A. Gilles; J. K. Hamilton; P. A. Rebens and F. Smith (1956).
Colorimetric methods for determination sugars and related substances.
Annals. Chem. Soc, 46: 1662- 1669.
Dwived, M., R. M. Upodhaya and G. K. Dwived (1990). Effect of inorganic, organic
and biofertilizers on yield, protein and amino acied contents of black
grain and wheat grown in sequence. ِ ِ Annals .Agric. Res, 11 (2): 191-
198.
Ebrahim, M. K and M. M. Ali (2004). Physiological response of wheat to foliar
application of zinc and inoculation with some bacterial fertilizers. J. Pla.
Nutrition, 27 (10): 1859-1874.
EL-Bana, A. R .Y (1999) . Response of wheat varieties to planting density and
nitrogen fertilization under newly cultivated soil conoitions M. Sc. Thesis
. Fac Agric Zigzag . Univ . Egypt .
El-Bassiouny, H.; M. S., Gobaraha; Mirvat. E. and A. Ramadan (2005). Effect of
antioxidants on growth, yield and fauvism causative agents in seeds of
(Vicia faba L.) plants grown under Reclaimed sandy soils. J. Agro, 4 (4):
281-287
El-Dsouky, M. M. (2005). Importance biofertilizer under low mineral N
fertilization in improving growth and yield of wheat. Assuit. J. Agric.
Res, 42 (1): 278-287.
El-Ghamriny, E. A.; H. M. E. Arisha and K. A. Nour (1999). Studies on tomato
flowering, fruit set yield and quality in summer seasons. Zagazig. J.
Agric. Res, 26 (5): 1345-1364.
El-Ghany, B. F. (1999). Influence of different bacteria strain as biofertilizers
wheat crop production in new cultivated land. Desert.
Institute.Bulletin.Egypt, 46(2):215-226.
El-Kased, F. A., R. N. Kamh and B. F. Abd-Elghany (1999). Wheat response to bio
and mineral fertigated in newly reclaimed sandy soil, Desert. Institute.
Bulletin. Egypt, 46 (2): 373-386.
El-Sersawy, M. M., B. F. A. El-Ghany; K. W. Khalil and S. Y. Awadalla (1997).
Interaction between organic manure mixteres, applied N levels and
biofertilization on calcalorus soil and wheat production in wadi sudr.
South Sinai. Egypt. Soil. Sci, 37 (3): 367-397.
Faid, E. (2000). Physiological studies on Halotolerant Azotobacter in desert soil
PP .33 31-33 . ph.D. Thesis Fac .Agric. Ain shams Univ. Cairo .
Fares, C. N. (1998). Growth and yield of wheat plants as effected by
biofertilization with associative, symbiotic N2 fixers and endomycrorhiza
in the presence of different p ferilizer. Annals. Agric. Sci. Cairo, 42
(1):51-60.
Fathy, El-S. L. El. S.; Z. M. A. Khedr and A. M. Moghazy (2003).Improves
metabolical and agronomical performance of eggplant under higher
temperature stress full condition (Late summer) by using some
antioxidants and mineral nutrents. Conferance of untradraditional tools
in production and improvement of agriculture crops. Agric. Res. Center
Hortic. Institute, Cairo,1-3/12/2003. Institute. Horticulture Dept.
Frederick, j. R. and j. j. Comberato (1995) . Water and nitrogen
effects on winter wheat in southestern coastal plant
Grain yield and kernel traits . Agric . j, 87 (3) 521-526.
Galal, Y. G.; I. A. El-Ghandour; S. S. Ali; S. Soliman and A. Gadalla (2000). Non
isotopic method for the quantification of biological nitrogen fixation and
wheat production under filed codition.Biology and fertility of soils, 32
(1):47-51.
Ghallab, A. M and M. R. A. Nesiem (1999). Effect of foliar application of titanium
on growth, chemical composition and productivity of soybean and wheat
plants growing under different levels of NPK fertilizer. J. Agric.
Mansura.Univ, 24 (2): 605-623.
Ghallab, A. M and S. M. Salem (2001). Effect of some biofertilizer treatments on
growth, chemical composition and productivity of wheat plants grown
under different levels of NPK fertilization. Annals.Agric.Sci.Cairo, 46 (2):
485-509.
Ghosh, D. C., B. P. Mandal and G. C. Malik (1997). Growth and yield of wheat
(Triticum aestivum) as influenced by fertility level and seed soaking
agrochemicals. Indian. J. Agric. Sci, 67 (4): 144-146.
Gardner, F. P.; R. B. Pearce and R. L. Mtchell (1985). Physiology and crop plants .3-
Transport and partitioning. Iowa state univ. Pres. Ames., pp. 75.
Hamed, A. M. and A. M. Hamada (2002). Grain soaking presowing in ascorbic acid
or thiamin versus the adverse effects of combined salinity and drought on
wheat seedling. Assuit. J. Agric. Res, 42 (2): 1101-1104.
Han, H. S.; Supanjani and K. D. Lee (2006). Effect of co inoculation with phosphate
and potassium solublizing bacteria on mineral uptake and growth of
pepper and cucumber, Plant. Siol. Env. Res, 52. (3): 130-136.
Hanafy, A., H.; F. Khelil; E. A. Abdel- latif and M. A. Amin (1995). Effect of NPK
fertilizers and foliar application of some Chemicals on the growth, Yield
and chemical composition of faba bean and wheat. Egypt. J. App . Sci ,
10 (7) . 652-676.
Hassan, A. I., N .M. Moselhy and M .Sh . Abd- EL -Ma bood (2002) .Evaluation of
some wheat cultivars under two levels of irrigation water salinity in
calcareous soils, South Sinai, Zagazig .j . Agric- Res , 29 (1 ) 1-15.
Horneck, D. A. and D. Hanson (1998). Determination of potassium and sodium by
flam Emission spectrophotometry. In hand book of reference methods for
plant analysis, e.d Kolra, Y. P.(e.d) PP. 153-155.
Horneck, D. A. and R. O. Miller (1998). Determination of total nitrogen in plant
tissue. In hand book of reference methods for plant analysis, e.d
Kolra,Y.P.(e.d) PP. 73-75.
Inskbashi, Y. and M. Iwaya (2006). Ascorbic acid suppresses germination and
dynamic states of water in wheat seeds. Plant. Production. Sci, 9 (2): 172-
175.
Irfan, A., S. M. A. Basra; F. Muhammad and A. Nawaz (2006). Alleviation of salinity
stress in spring wheat by hormonal priming with ABA, Salisalic acid and
ascorbic acid. International. J. Agric. Biology, 8 (1): 23-28.
Khalil, A. A., M. A. Nasef; F. M. Ghazal and M. A. Elemam (2004). Effect of
integrated organic and biofertilizers on growth and nutrient uptake of
wheat plants grown in diverse textured soils. Egypt .J.Agric.Res, 82(2
special issue):221- 234.
Koreish, E.A.; M. E. Elfayome; H. M. Ramadan and W. H. Mohamed
(2004).Interaction effect of organic and mineral fertilization on faba bean
and wheat productivity in calcalorus soils. Alex. J. Agric. Res, 49 (2): 101-
114.
Koshioka, M., J. Harada; M. Noma; T. Sassa,; K. Ogiama; J. S. Taylor; S. B. Rood; R.
L. Legge and R. P. Pharis (1983). Reversed phase C18 high performance
liquid Chromatography of acidic and conjugated gibberellins. J.
Chromatgr, 256: 101-115.
Mashhor, W.A., M. A. EL-Borollosy; H.. H. A A. Abdel-Azeem S. and H .M. Sehm
(2002) .Biofertization of wheat plants exposed to environmental stress
conditions .Arab. Univ.j. Agric. Sci. Ain-shams. Univ. Cairo , 10 (2) : 543-
565.
Mengel, K. and F. A. Kirkby (1979). Principal of plant nutrition. Ed.
International potash institute. Bern, Switzerland.
Mitsui, A. and Y. Oi (1984). The role of ascorbic acid in growth, differentiation
and metabolism of plants. Martinus. Nijhoff / Dr W. Junk. Publishers. pb
68.
Mohamed, A. H. M. (1994). Effect of some preceding crops and nitrogen fertilizer
on growth and yield of wheat .M Sc. Thesis . Fac. Agric, Moshtohor .
Zagazig . univ
Mohiuddin, M.; A. K. Das and D. C. Ghosh (2000). Growth productivity of wheat as
influenced integrated use of chemical fertilizer, biofertilizer and growth
regulation. Indian. J. plant. Physio, 5 (4): 334-338.
Mustafa, E. A. M. (2004). Effect of spraying with ascorbic acid vitamin b and
active dry yeast on growth, flowering, leaf mineral status yield and fruit
quality of grand nine banana plants. Annals. Agric. Sci. Cairo, 49 (2):
643-659.
Munne, S., k. Schwarz and L. Alegres (2001). Water deficit combination with
higher solar radiation leads to midday depression of alpha tocopherol in
filed grown lavender stoechas plants. Australian. J. pla. Physiol, 28 (4):
315-321.
Nasef, M. A., A.A. Khalil; F. M. Ghazal and M. A. Elemam (2004). The residual
effect of organic manure with or without biofertilizer applied to wheat
grown on sandy, calcareous and clay soils on growth and NPK uptake of
rocket plants.Egy. J. Agric. Res., 82 (2.special issue):235-246.
Namich, A. A. M. (2006). Physiological and biochemical responsed as affected by
antioxidants ( ascorbic acid ) in Giza 80 cotton cultivar. Egypt. J. Agric.
Res., 84 (5) 620-630.
Negm, A. Y., F. A. Zahran and N. S. Rizk (1996). Foliar application of ascorbic
acid, magnesium and nickel to lentil plants grown in newly reclaimed
soils. Annals. Agric. Sci. Moshtohor, 34 (4): 2015-2024.
Nicander, B.; U. Stahi; P.O. Bjorkman and E. Tillberg (1993). Immyno affinity co
purification of cytokines and analysis by high performance liquid
chromatography with ultraviolet specyrum deterction. Planta, 189: 312-
320.
Nogala, M.; M. Gogolewski and C. Musnick (2002). Changes of tocopherol and
plastochromal 8 content during growth of the spring oil seed rape plants (
Brassica napes). Rosliny. Oleiste, 23 (1): 157-164.
Nomier, S, A. (2000). Effect of some GA3, vitamins and active dry yeast
treatments on vegetative growth, yield and fruit quality of Thompson
seedless grapevines. Zagazig. J. Agric. Res, 27 (5): 1267-1286.
Oertill, j. j. (1987). Exogenous application of vitamins as regulators for growth
and development of pl Zeitschrift fur pflonzenernahrung under
bodenkunde , 150(6) : 375-391.
Omar, A. and Moujahed, H. M. (2006). Some aspects of nitrogen assimilation in
wheat plant (Triticum aestivum L.) as affected by different nitrate levels
and bacteria inoculation. Suadia. J. Bio. Sci. 13 (2): 141-151.
Padole, V. R. (1981). Effect of IAA, NAA ascorbic acid and succinic acid as seed
soaking treatments on wheat (var kalyansona). punjabrad. Krishi. Vidy
apeeth. Research. J. 5 (2): 139- 142.
Panda, B. B.; R. K. Rai and D. Aurovinda (2003). Effect of phosphorus levels and
biofertilizers on grain yield and microbial population in rizospher of
wheat (Triticum aestivum). Annals. Agric. Res, 24 (3): 631-633.
Pandey, I. B.; S. S. Thakur; S. J. Singh and S. S. Mishra (2000). Effect of fertilizer
and weed management on nutrient economy and yield of wheat (Triticum
aestivum). Indian. J. Agro, 45 (3): 596-601.
Panwar, J. D. S and S. Ompal (2000). Response of Azospirillum and Bacillus on
growth and yield of wheat under filed condition.Indian.J.of.pla.physio, 5
(1):108-110.
Patel, J. G.; D. D. Malivia; B. B. Kanpara and R. K. Mathukia (1996). Effect of N, P
and biofertilizers on yield quality and nutrients uptake in wheat.
Gujarat. Agric. Univ. Res, 22 (1): 118-120.
Patidar, M and A. Mali (2002) Residual effect of farmyard manure fertilizer and
biofertilizers on succeeding wheat (Triticum aestivum). Indian. J. Agro,
47 (1): 26-32.
Piper, G. S. (1947). Soil and plant analysis. The Univ. of Adelaide.
Pozzo, M. G.; H. Giorgetti; R. Martinez; G. Aschkar and F. pale (1993). Effect of
biofertilizer as A. brasilense on wheat growth and productivity Indian. J.,
140 (1) 120-130
Sabry, S. R., N. S. Hana and M. A. M. Eid (1994). Response of two newly released
bread wheat cultivar to nitrogen fertilizer levels under different
environment of Egypt. Egypt. J. Appl. Sci., 9 (3): 750-762.

Saleh, M. E. (2003). Response of Egyptian and Mexican Wheat cultivars
to different nitrogen fertilization levels under U.A.E
conditions . Zagazig .j. Agric-Res ., 30 (4) 1189-1201.
Sandell, R. (1950). Colorimetric determination of traces of metal 2nd Ed. Inter
since. Pub. Inc. New. York
Sendecor, G. W. and W. G. Cohran (1980). Statistical methods. 7 th Ed. Lowa state
Univ. Press. Ames. Iowa, USA.
Sharma, K., K. K. Dhingra and M.S. Dhillon (1994).
physiological indices for high yield potential in
different genotypes of wheat . Envirom . meutal and Ecology , 12 ( 3) 717-
719.
Sheng, X. F.; L. Y. He and W. Y. Huang (2002). The conditions of releasing
potassium by a silicate dissoliving bacteria strain NBT. Agric. Sci. China.
1 : 662-666.
Shindy, W.W. and O. E. Smith (1975). Identification of plant hormones from cotton
ovules. Pla. Physiology, 55: 550-554.
Shorning, B. Y.; S. V. Poleshchuk; I. Y. Gorbatenko and B. F. Vanyushin (1999).
Effect of antioxidants on plant growth and development. Biology. Bull
Russian. Academy. Sci, 26 (1): 23-29.
Smicklas, K. D and F. E. Below (1992). Role of cytokinin in enhancing
productivity of maize supplied with NH 4 and No3. plant soil., 142: 307-
313.
Sonbol, H.A.; A.A. Taha; Z. M. EL-sirafy and E.M. EL-Nggar (2000). Efficiency use
of bio and chemical Nitrogen fertilizers on wheat . Annals .Agric . Sci
spissue 3: 949-975.
Sushila, R and G. Gajendra (2000). Influence of farmyard manure, nitrogen and
biofertilizers on growth, yield attributes and yield of wheat (Triticum
aestivum) under limited water supply. Indian.J.of.Agro, 45 (3): 590-595.
Tamar, U. S.; I. S. Tomar and A. K.Badaya (1998). Response of chemical and
biofertilizers on some matric traits in wheat. Crop. Res. Hisar, 16 (3):
408- 014 .
Tema, M, A.; Amera. A. E. and M. S. A. Dahdoh (1997). Effect of inoculation with
plant growth promoting Rhizobacteria on yield and uptake of nutrients
by wheat grown on sandy soils. Egypt. J. Soil. Sci, 37 (4): 467-484.
Toaima, S. E., A . Amal . El .Hofi and H . Ashoush (2000). Yield and
technological characteristics of some wheat varietes as affected
by N fertilizer and seed rates . Mansura. J. Agric . Sci , 25 (5 ) : 2449 –
2467.
Umarov, A. A.; F. Kushaeva, U. Niyazmetov, N. K. Khidyrova, N. M. Mamatku, K.
M. Shakhido (2006). Biological evaluation of preparation L2 and its
individual components. Russian. J. Agric. Sci, (4): 5-8.
Vessey, K. J. (2003). Plant growth promoting rhizobacteria as biofertilizers. Plant
soil, 255: 571-586.
Wanas, A. L. (2006). Response of squash plants grown in winter seasons to some
natural extracts and antioxidants. Annals. Agric. Sci. Moshtohor, 44 (4):
1571-1591.
Wang, X. T. and F .E. Below (1995). Tillering nutrient accumulation and yield of
water wheat as influenced by nitrogen form .
Wang, X. Y.; W. B. Peng; J. M. Cui and H. J. Zhao (1995). The effect of organic
acids, boron and zinc on the metabolism of active oxygen during filling
and grain weight of wheat . Sci. Agric. Since, 28 (1): 69-74.
Wang, Y.; Y. Huabin and L. Kain (1997).The effect of bio organic –inorganic
compound fertilizer on yield increase in wheat. Jiangsu.Agric.Sci, 42 (2):
21-25.
and total carbohydrate
Yassen, E. (2002). Application of biofertilizers in potato cultivation. pp. 35 , 63-68.
ph . D thesis Fac. Agric. Ain shams . univ , Egypt.
Zade, K. B., D. G. Vitkare, G. N. Satpute and N. G. Zade (1995).Grain yield
improvement in wheat by foliar spray with chemicals and growth
promoters. Annals. Plant. Physio, 9 (2): 158-160.
Zaghloul, R. A., A. A. Amer and M. H. Mostafa (1996). Efficiency of some organic
manure and biofertilization with A.brasilense for wheat manuring,
Annals. Agric. Sci. Moshtohor, 34 (2):627-640.
Zeidan, E. M., A. E. A. Elkawaha; H. A. Basha and I. M. A. Elhammed (2005).
Improvement of wheat productivity in newly reclaimed soil in Egypt
.Annals. Univ. Marie. Cure. Skodowska. Sectio. E. Agric, 60:113-120.

Zhang, G. and M. Stanley (1994). Comparative studies on effect of delaying wheat
leaf senescence by some chemicals. Acta. Agric. Zhejiangensis, 6 (2): 94-
97.
Zhao, H. J. and X. W. Lin (1992). Effect of ascorbic acid on lipid peroxidation of
flag leaf of wheat during senescence. plant. Physio. Communication, 28
(5): 351-352.