Embed Size (px)
Citation preview
IMPROVEMENT OF COMPACTED GRAPHITE IRON
DRILLING OPERATIONS WITH CUSTOMIZED
CUTTING FLUID
Degree Project
Author Yaoxuan Zhu & Xiaoting Huang
Supervisor:
Qilin Fu, KTH Royal Institute of Technology
Examiner:
Amir Rashid, KTH Royal Institute of Technology
Stockholm 10/18/2017
Production Engineering and Management
Department of Production Engineering
KTH Royal Institute of Technology
1
Abstract
With its higher strength, Compacted Graphite Iron (CGI) is widely used in
automotive industry. However, the machinability of CGI is challenging, mostly
due to the high temperature in the cutting zone and the higher cutting force.
This paper studies the influence of the different cutting fluids on the
machinability of CGI material in drilling operations. The investigation
compared a few customized cutting fluids having alkaline phase and oil
phase, to a conventional cutting fluid. The oil phase of customized cutting
fluid can help reduce the friction force in the machining process. The flank
wear measurements showed there is no significant difference among the
fluids. The thrust force measurements, however, showed that the customized
cutting fluids could effectively reduce the cutting force by nearly 20%. By
using the customized cutting fluid, the machining of CGI materials could
either use higher feed rate to reduce cycle time when keeping the cutting
force same, or use the same process data while reducing energy
consumption.
2
Sammanfattning
Inom bilindustrin används ofta kompaktgrafitjärn eftersom det har hög
hållfasthet. Att bearbeta kompaktgrafitjärn är utmanade främst pga att det
krävs hög temperatur och mycket kraft för att skära/borra materialet. I den
här avhandlingen undersöks hur olika skärvätskor påverkar bearbetning av
kompaktgrafitjärn under borrning. Skärvätskor där proportionerna mellan den
alkaliska delen och oljedelen har anpassats, jämfördes mot traditionella
emulsionsvätskor. Oljan i den kundanpassade skärvätskan kan hjälpa till att
minska friktionskraften i bearbetningsoperationen. Fasförslitningsmätningen
visade att det inte finns någon signifikant skillnad mellan skärvätskorna.
Tryckraftsmätningarna visade emellertid att det kundanpassade
skärvätskorna effektivt kunde reducera skärkraften med nästan 20%. Genom
att använda de anpassade skärvätskorna kan man köra med högre
mattningshastighet, reducera cykeltiden eller använda samma
processparametrar men med mindre energianvändning.
3
Table of Content Abstract .................................................................................................................................................................... 1
Sammanfattning.................................................................................................................................................... 2 1. Introduction ................................................................................................................................................... 4
1.1 Project Research Background ............................................................................................ 4
1.1.1 Introduction to the CGI and its' Machinability ................................................. 4 1.1.2 Introduction to Cutting Fluid ................................................................................... 5
1.2 Purpose of the Thesis ............................................................................................................ 6 2. Design of Experiment............................................................................................................................... 7
2.1. Indicators of the Machinability of CGI ............................................................................. 7
2.2. Design of the Experiment Groups .................................................................................... 7 2.3. The Evaluation of Machinability......................................................................................... 8
2.3.1. Experiment Setup .................................................................................................. 8 2.3.2. CGI Test Workpiece Selection and Design .............................................. 14 2.3.3. The Measurement of Tool Wear .................................................................... 15
2.3.4. The Measurement of Thrust Force .............................................................. 15 3. Result Analysis.......................................................................................................................................... 17
3.1. Result Analysis of the Tool Wear..................................................................................... 17 3.2. Result Analysis of the Thrust Force ................................................................................ 19
3.2.1. Thrust force Analysis.......................................................................................... 19
3.3. Thrust force analysis over frequency ............................................................................. 24 4. Discussion and Conclusion ................................................................................................................. 27
4.1 Result of Hardness Measurement of CGI Test Workpieces ................................... 27 4.2 Performance of cutting fluid at different concentration ......................................... 28 4.3 Conclusion ............................................................................................................................... 29
Acknowledgement ............................................................................................................................................ 30 Reference ............................................................................................................................................................. 30
Appendix ............................................................................................................................................................... 32
4
1. Introduction
1.1 Project Research Background
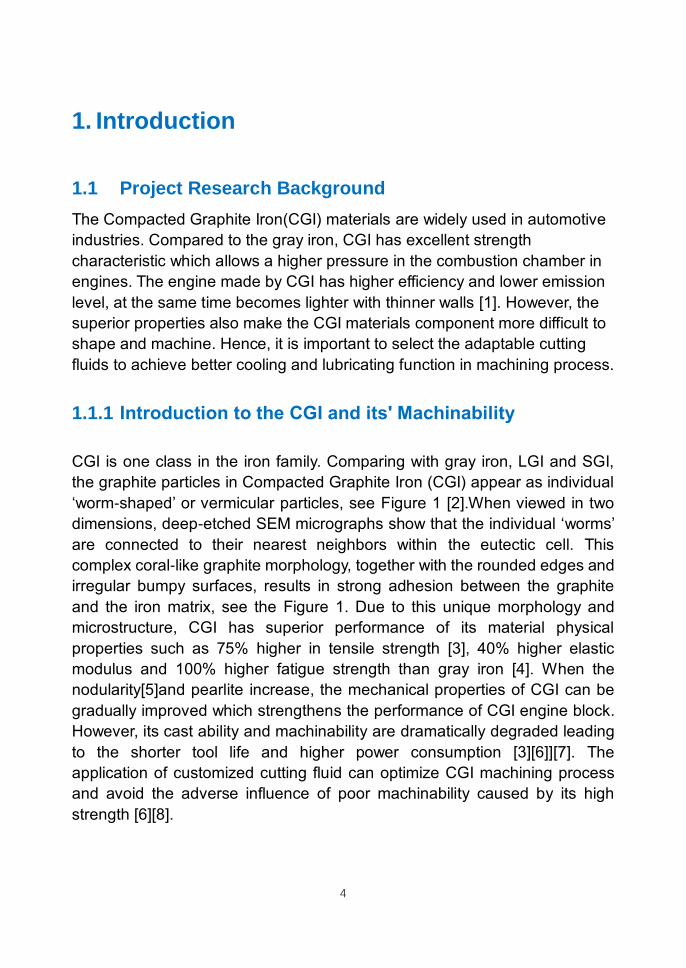
The Compacted Graphite Iron(CGI) materials are widely used in automotive
industries. Compared to the gray iron, CGI has excellent strength
characteristic which allows a higher pressure in the combustion chamber in
engines. The engine made by CGI has higher efficiency and lower emission
level, at the same time becomes lighter with thinner walls [1]. However, the
superior properties also make the CGI materials component more difficult to
shape and machine. Hence, it is important to select the adaptable cutting
fluids to achieve better cooling and lubricating function in machining process.
1.1.1 Introduction to the CGI and its' Machinability
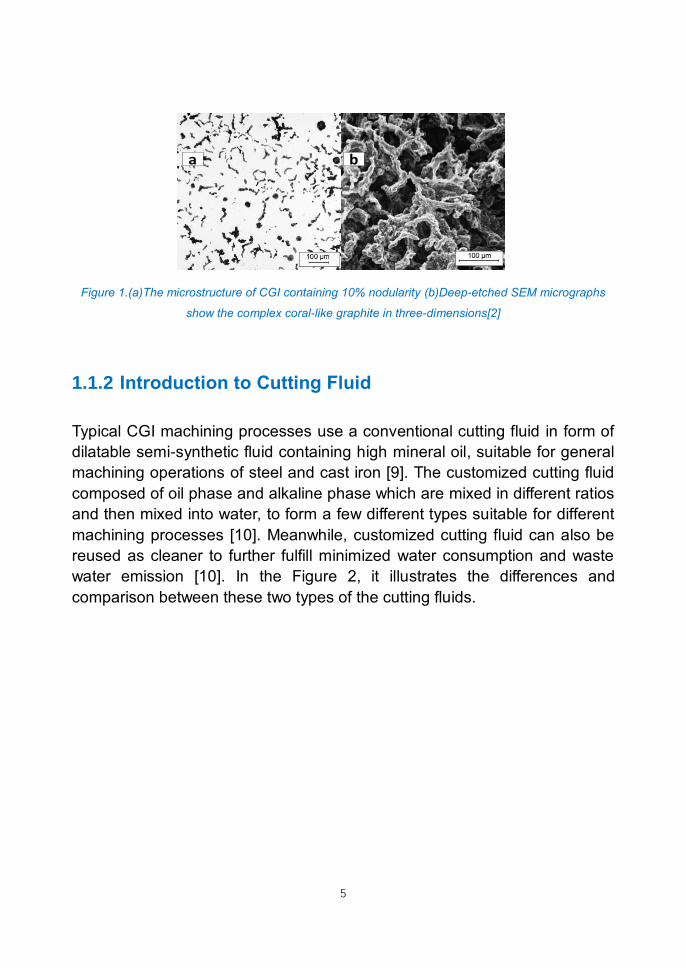
CGI is one class in the iron family. Comparing with gray iron, LGI and SGI,
the graphite particles in Compacted Graphite Iron (CGI) appear as individual
‘worm-shaped’ or vermicular particles, see Figure 1 [2].When viewed in two
dimensions, deep-etched SEM micrographs show that the individual ‘worms’
are connected to their nearest neighbors within the eutectic cell. This
complex coral-like graphite morphology, together with the rounded edges and
irregular bumpy surfaces, results in strong adhesion between the graphite
and the iron matrix, see the Figure 1. Due to this unique morphology and
microstructure, CGI has superior performance of its material physical
properties such as 75% higher in tensile strength [3], 40% higher elastic
modulus and 100% higher fatigue strength than gray iron [4]. When the
nodularity[5]and pearlite increase, the mechanical properties of CGI can be
gradually improved which strengthens the performance of CGI engine block.
However, its cast ability and machinability are dramatically degraded leading
to the shorter tool life and higher power consumption [3][6]][7]. The
application of customized cutting fluid can optimize CGI machining process
and avoid the adverse influence of poor machinability caused by its high
strength [6][8].
5
a b
Figure 1.(a)The microstructure of CGI containing 10% nodularity (b)Deep-etched SEM micrographs
show the complex coral-like graphite in three-dimensions[2]
1.1.2 Introduction to Cutting Fluid
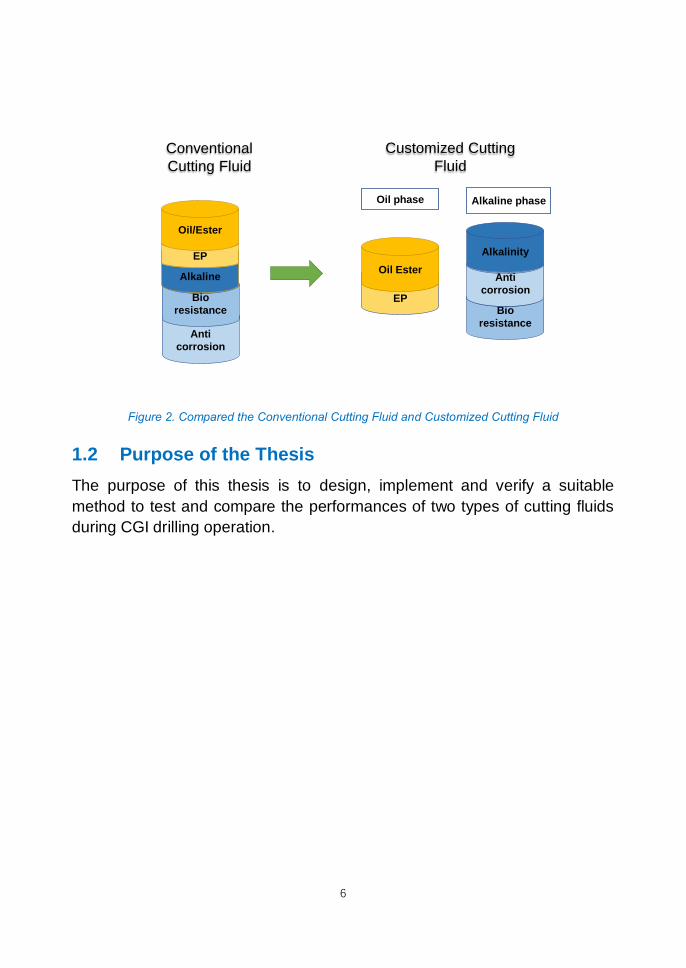
Typical CGI machining processes use a conventional cutting fluid in form of
dilatable semi-synthetic fluid containing high mineral oil, suitable for general
machining operations of steel and cast iron [9]. The customized cutting fluid
composed of oil phase and alkaline phase which are mixed in different ratios
and then mixed into water, to form a few different types suitable for different
machining processes [10]. Meanwhile, customized cutting fluid can also be
reused as cleaner to further fulfill minimized water consumption and waste
water emission [10]. In the Figure 2, it illustrates the differences and
comparison between these two types of the cutting fluids.
6
Anti
corrosion
Bio
resistance
Alkaline
EP
Oil Ester
Bio
resistance
Anti
corrosion
Alkalinity
Oil phase Alkaline phase
Customized Cutting
Fluid
Conventional
Cutting Fluid
EP
Oil/Ester
Figure 2. Compared the Conventional Cutting Fluid and Customized Cutting Fluid
1.2 Purpose of the Thesis
The purpose of this thesis is to design, implement and verify a suitable
method to test and compare the performances of two types of cutting fluids
during CGI drilling operation.
7
2. Design of Experiment
The experiment focuses on measuring and analyzing the flank wears and
thrust forces, under the conventional and customized cutting fluids.
2.1. Indicators of the Machinability of CGI
The cutting fluid performance can be reflected by the assessment of CGI
machinability which is further evaluated by numerous parameters containing
cutting force, surface roughness, tool life, chip formation and so on. In this
project work, tool wear mechanics and cutting force are selected as the main
indicators [3].
2.2. Design of the Experiment Groups
During the whole experiment, the conventional cutting fluid and few
customized cutting fluids with three mixing ratios between oil phase and
alkaline phase were tested. The complete experiment was fulfilled by four
groups’ experiments. In each group experiment, each cutting fluid was tested
for three times. During each test, a new drilling tool is deployed and then the
flank wear and thrust force were measured to assess performance of tested
cutting fluid.
The test group numbers, cutting fluid's types and constitutions are shown in
the Table 1.
Group NO.
Name of
Cutting
Fluid
Type
Specification
Constitution
Group 1 Fluid 1 Conventional
Cutting Fluid
5%-10% OIL &
ALCA
Group 2 Fluid 2
3.5% ALCA
Phase + 3.5%
OIL Phase
8
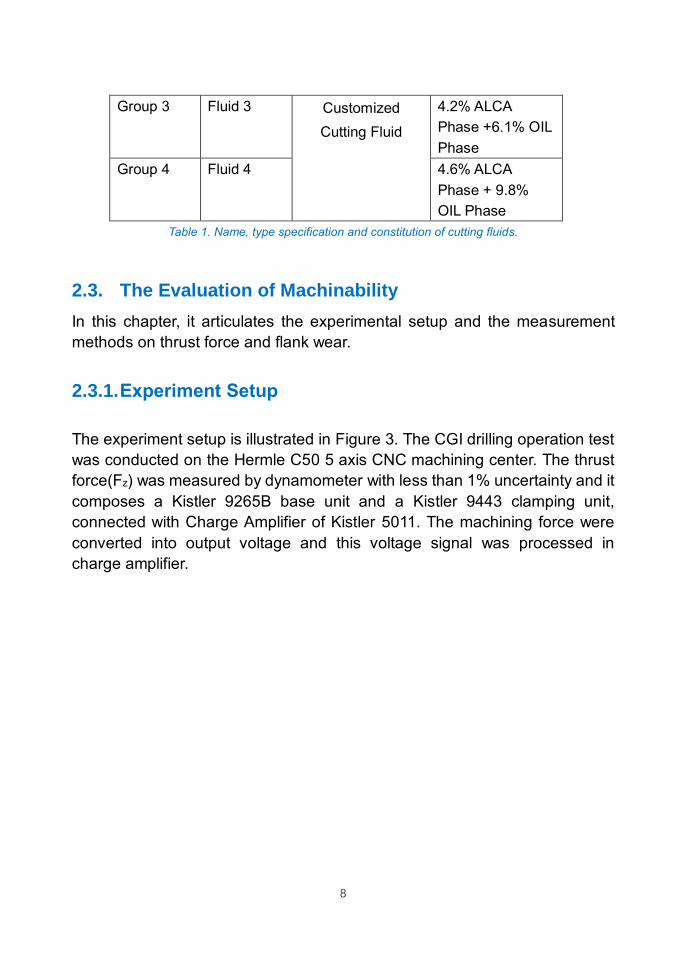
Group 3 Fluid 3 Customized
Cutting Fluid
4.2% ALCA
Phase +6.1% OIL
Phase
Group 4 Fluid 4 4.6% ALCA
Phase + 9.8%
OIL Phase
Table 1. Name, type specification and constitution of cutting fluids.
2.3. The Evaluation of Machinability
In this chapter, it articulates the experimental setup and the measurement
methods on thrust force and flank wear.
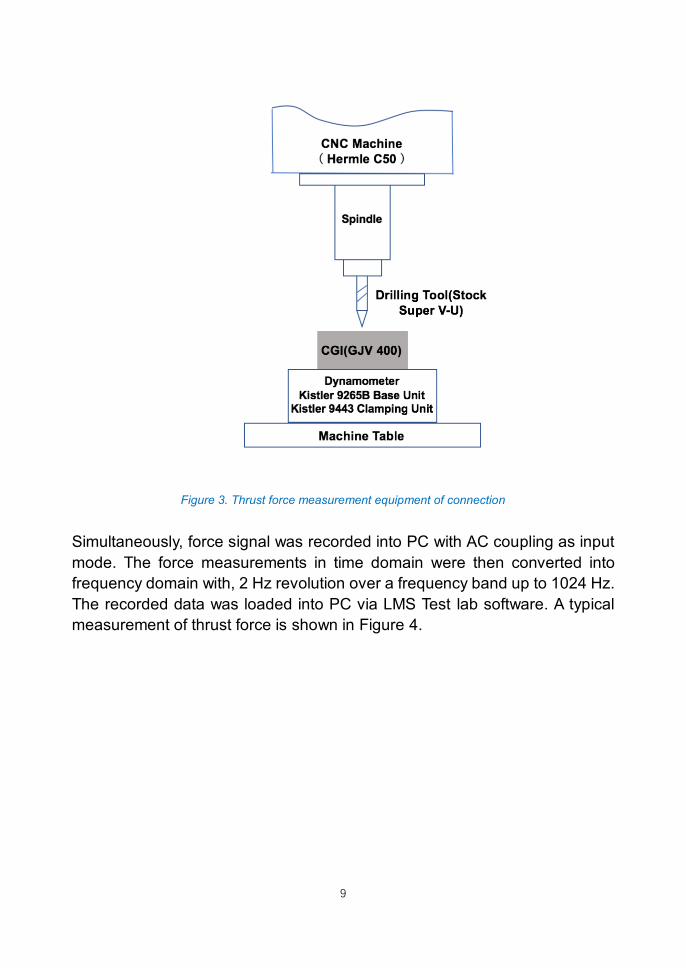
2.3.1. Experiment Setup
The experiment setup is illustrated in Figure 3. The CGI drilling operation test
was conducted on the Hermle C50 5 axis CNC machining center. The thrust
force(Fz) was measured by dynamometer with less than 1% uncertainty and it
composes a Kistler 9265B base unit and a Kistler 9443 clamping unit,
connected with Charge Amplifier of Kistler 5011. The machining force were
converted into output voltage and this voltage signal was processed in
charge amplifier.
9
Figure 3. Thrust force measurement equipment of connection
Simultaneously, force signal was recorded into PC with AC coupling as input
mode. The force measurements in time domain were then converted into
frequency domain with, 2 Hz revolution over a frequency band up to 1024 Hz.
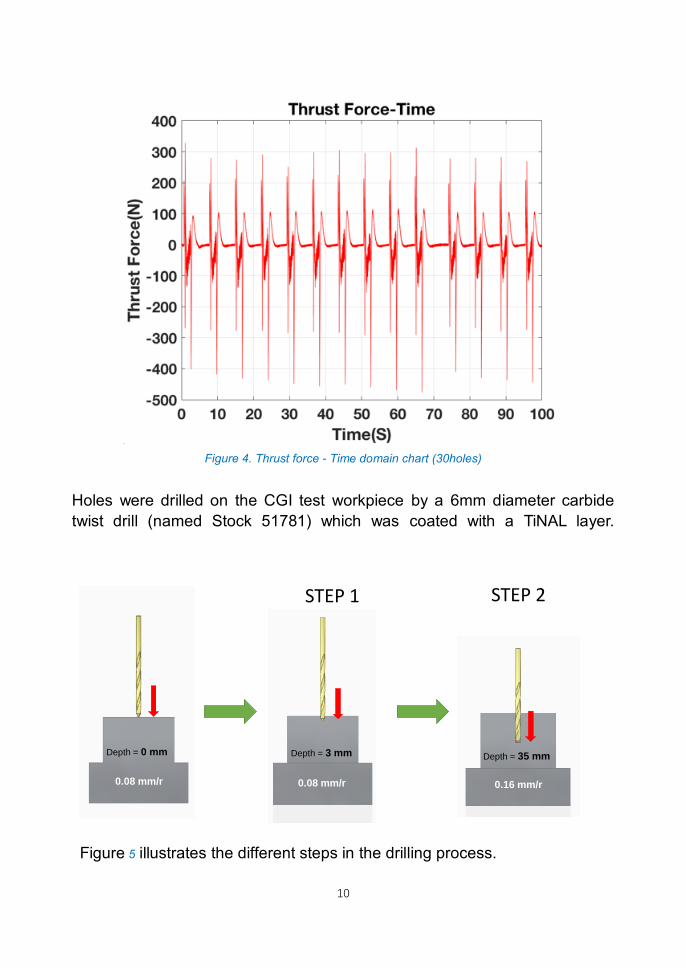
The recorded data was loaded into PC via LMS Test lab software. A typical
measurement of thrust force is shown in Figure 4.
10
Figure 4. Thrust force - Time domain chart (30holes)
Holes were drilled on the CGI test workpiece by a 6mm diameter carbide
twist drill (named Stock 51781) which was coated with a TiNAL layer.
Stage 1: 0.08 mm/r
0.08 mm/r
Depth = 3 mm Depth = 35 mmDepth = 0 mm
0.08 mm/r 0.16 mm/r
STEP 1 STEP 2
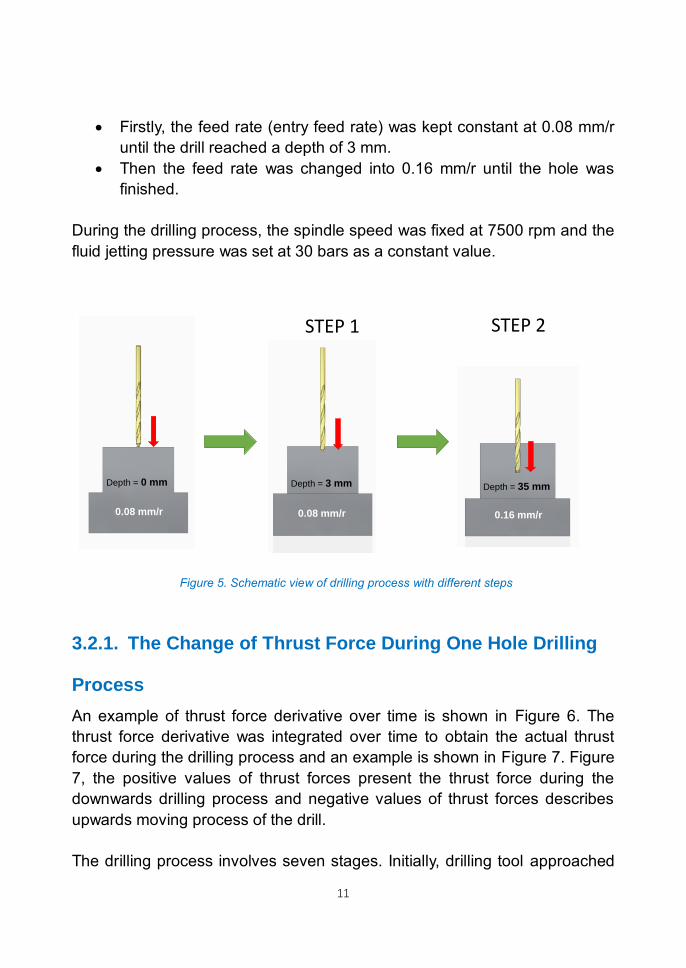
Figure 5 illustrates the different steps in the drilling process.
11
• Firstly, the feed rate (entry feed rate) was kept constant at 0.08 mm/r
until the drill reached a depth of 3 mm.
• Then the feed rate was changed into 0.16 mm/r until the hole was
finished.
During the drilling process, the spindle speed was fixed at 7500 rpm and the
fluid jetting pressure was set at 30 bars as a constant value.
Stage 1: 0.08 mm/r
0.08 mm/r
Depth = 3 mm Depth = 35 mmDepth = 0 mm
0.08 mm/r 0.16 mm/r
STEP 1 STEP 2
Figure 5. Schematic view of drilling process with different steps
3.2.1. The Change of Thrust Force During One Hole Drilling
Process
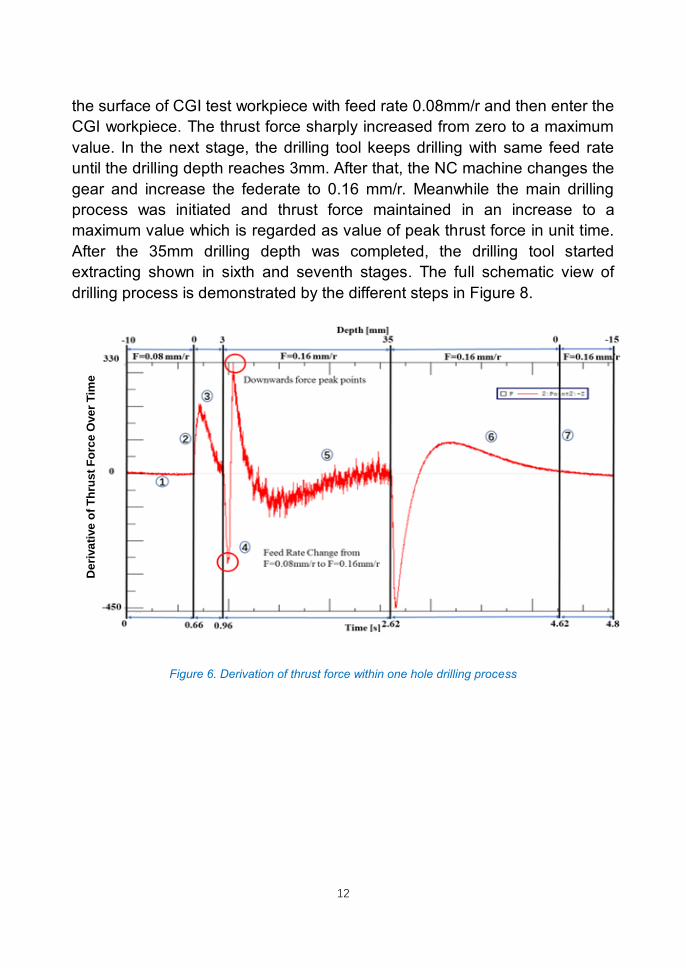
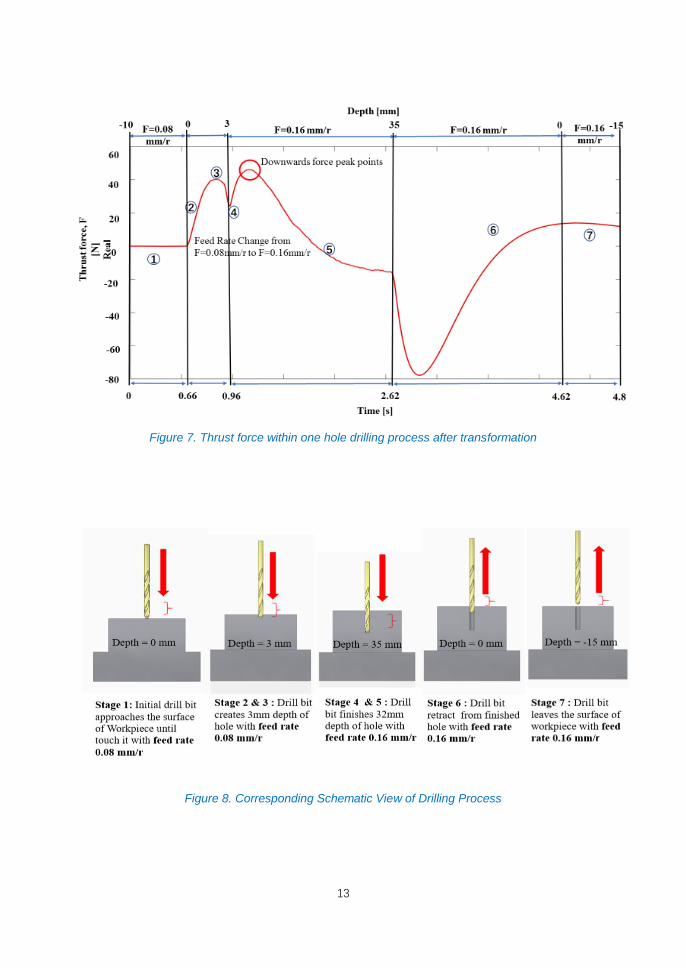
An example of thrust force derivative over time is shown in Figure 6. The
thrust force derivative was integrated over time to obtain the actual thrust
force during the drilling process and an example is shown in Figure 7. Figure
7, the positive values of thrust forces present the thrust force during the
downwards drilling process and negative values of thrust forces describes
upwards moving process of the drill.
The drilling process involves seven stages. Initially, drilling tool approached
12
the surface of CGI test workpiece with feed rate 0.08mm/r and then enter the
CGI workpiece. The thrust force sharply increased from zero to a maximum
value. In the next stage, the drilling tool keeps drilling with same feed rate
until the drilling depth reaches 3mm. After that, the NC machine changes the
gear and increase the federate to 0.16 mm/r. Meanwhile the main drilling
process was initiated and thrust force maintained in an increase to a
maximum value which is regarded as value of peak thrust force in unit time.
After the 35mm drilling depth was completed, the drilling tool started
extracting shown in sixth and seventh stages. The full schematic view of
drilling process is demonstrated by the different steps in Figure 8.
De
riva
tive
of
Th
rus
t F
orc
e O
ve
r T
ime
Figure 6. Derivation of thrust force within one hole drilling process
13
Figure 7. Thrust force within one hole drilling process after transformation
Figure 8. Corresponding Schematic View of Drilling Process
14
2.3.2. CGI Test Workpiece Selection and Design
The diverse types of CGI have separated microstructures affected by
nodularity, pearlite content, chemical composition and section effect which
determine the distinctive mechanical properties and its machinability[3]. To
avoid workpiece material differences, the experiments were conducted by
using CGI workpiece produced from the same batch.
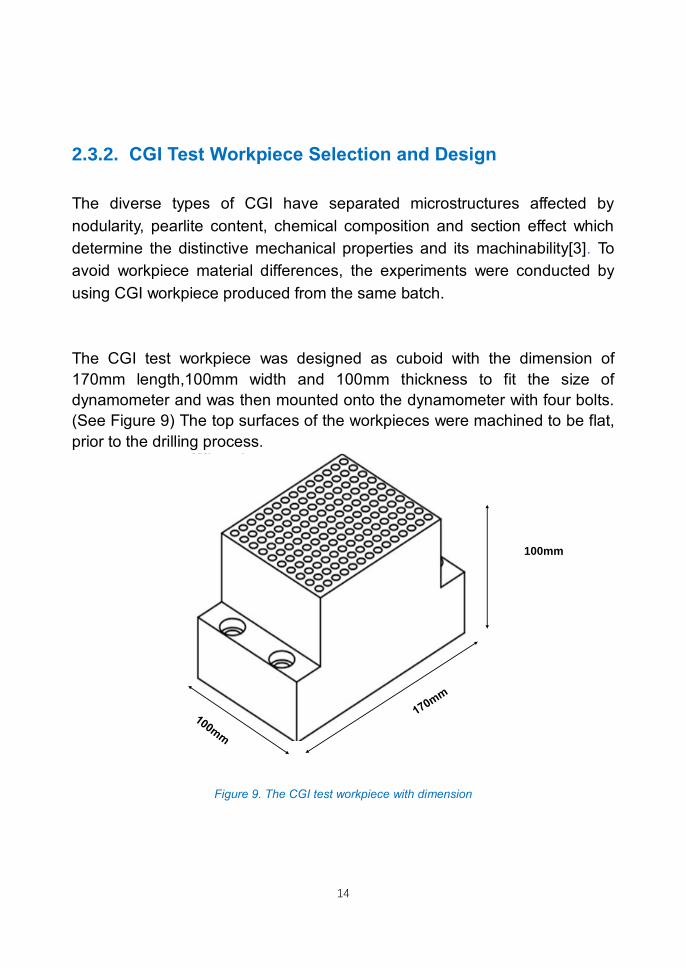
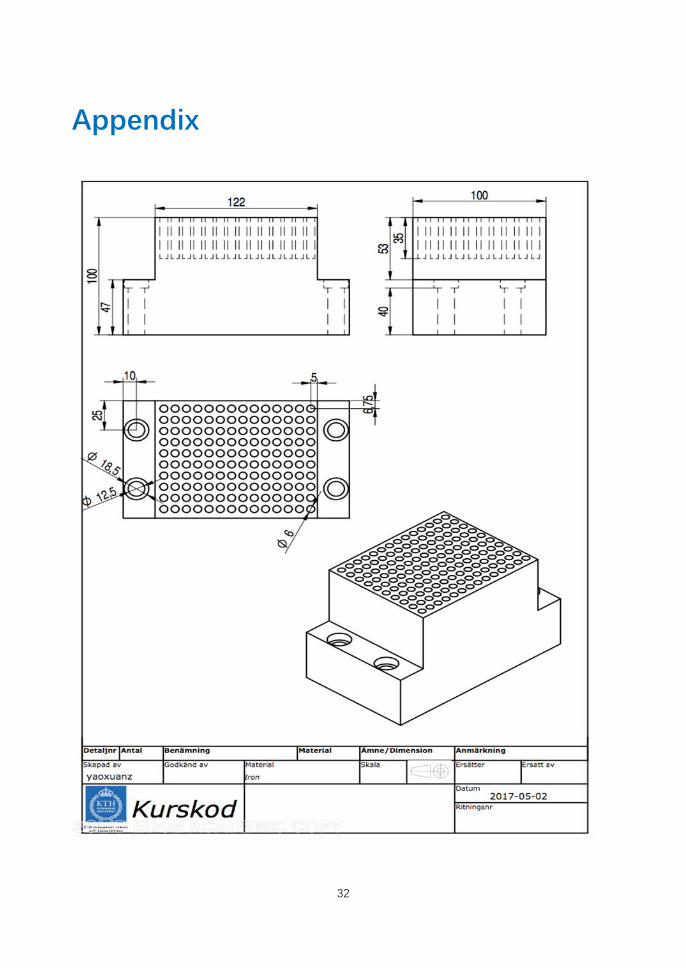
The CGI test workpiece was designed as cuboid with the dimension of
170mm length,100mm width and 100mm thickness to fit the size of
dynamometer and was then mounted onto the dynamometer with four bolts.
(See Figure 9) The top surfaces of the workpieces were machined to be flat,
prior to the drilling process.
100mm
Figure 9. The CGI test workpiece with dimension
15
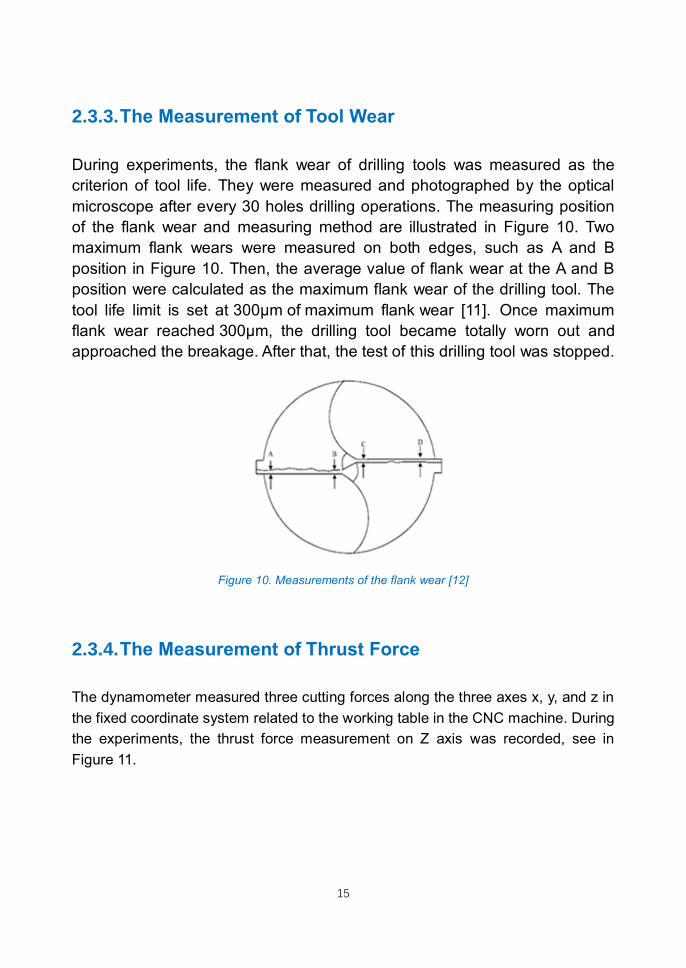
2.3.3. The Measurement of Tool Wear
During experiments, the flank wear of drilling tools was measured as the
criterion of tool life. They were measured and photographed by the optical
microscope after every 30 holes drilling operations. The measuring position
of the flank wear and measuring method are illustrated in Figure 10. Two
maximum flank wears were measured on both edges, such as A and B
position in Figure 10. Then, the average value of flank wear at the A and B
position were calculated as the maximum flank wear of the drilling tool. The
tool life limit is set at 300µm of maximum flank wear [11]. Once maximum
flank wear reached 300µm, the drilling tool became totally worn out and
approached the breakage. After that, the test of this drilling tool was stopped.
Figure 10. Measurements of the flank wear [12]
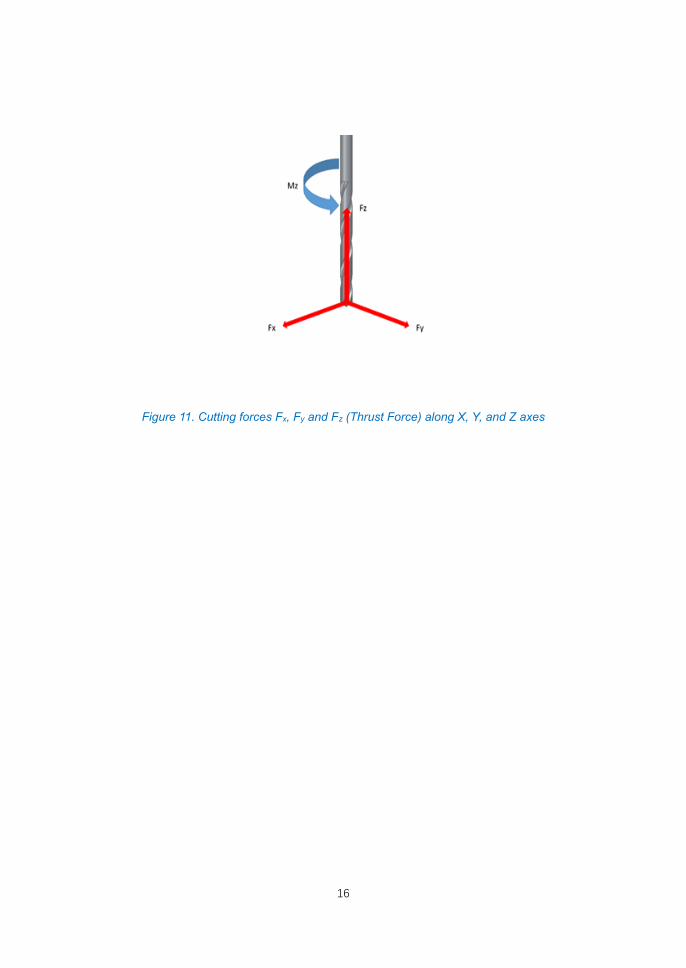
2.3.4. The Measurement of Thrust Force
The dynamometer measured three cutting forces along the three axes x, y, and z in
the fixed coordinate system related to the working table in the CNC machine. During
the experiments, the thrust force measurement on Z axis was recorded, see in
Figure 11.
16
Figure 11. Cutting forces Fx, Fy and Fz (Thrust Force) along X, Y, and Z axes
17
3. Result Analysis
The experimental results were presented by the analysis of flank wear in time
domain and thrust forces in both frequency domain and time domain.
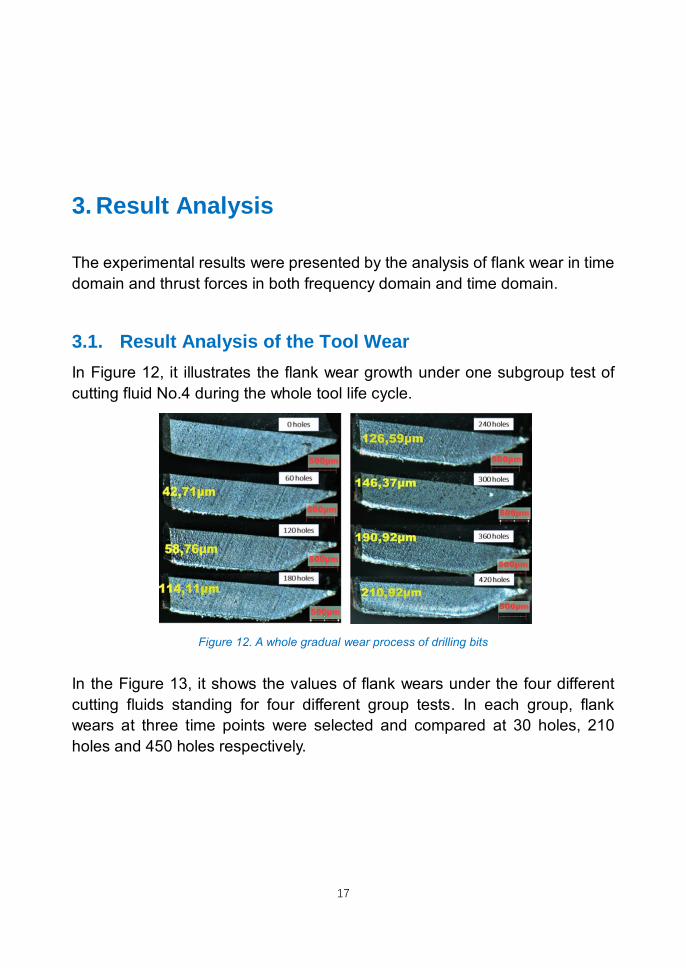
3.1. Result Analysis of the Tool Wear
In Figure 12, it illustrates the flank wear growth under one subgroup test of
cutting fluid No.4 during the whole tool life cycle.
Figure 12. A whole gradual wear process of drilling bits
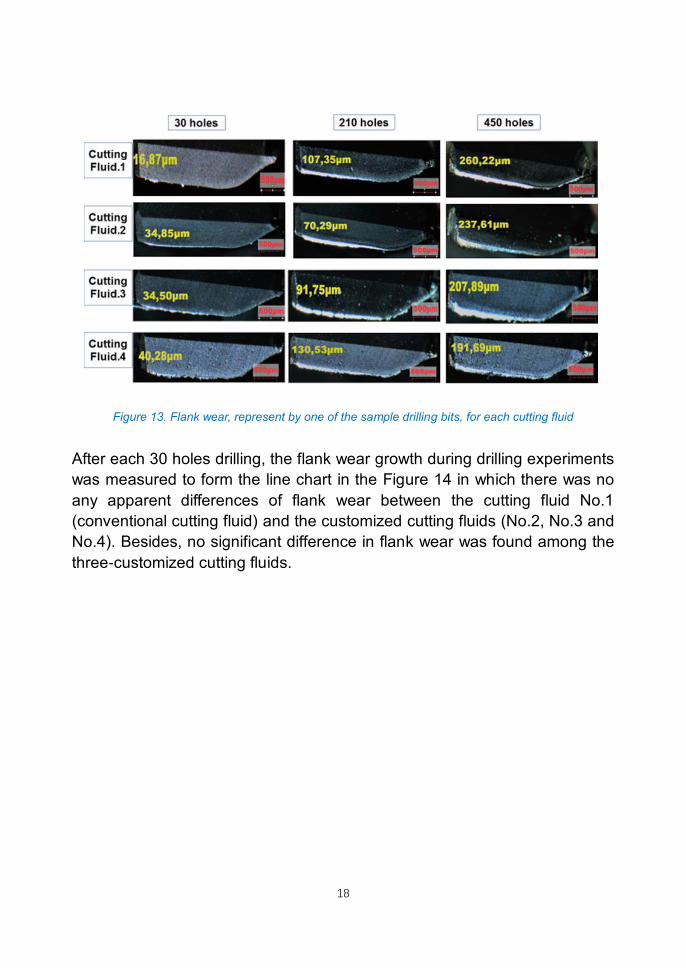
In the Figure 13, it shows the values of flank wears under the four different
cutting fluids standing for four different group tests. In each group, flank
wears at three time points were selected and compared at 30 holes, 210
holes and 450 holes respectively.
18
Figure 13. Flank wear, represent by one of the sample drilling bits, for each cutting fluid
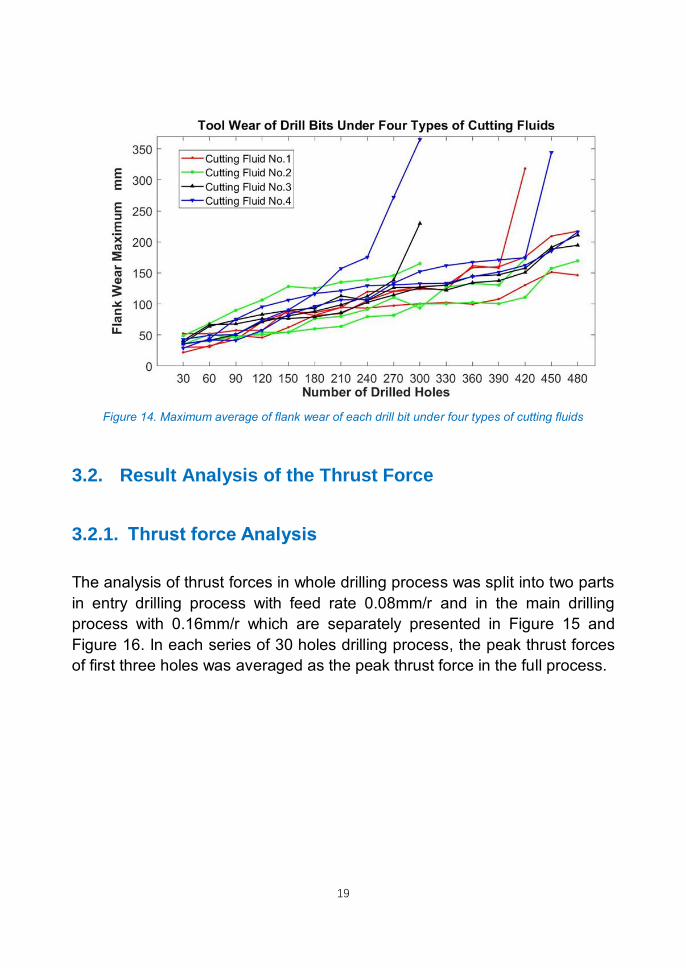
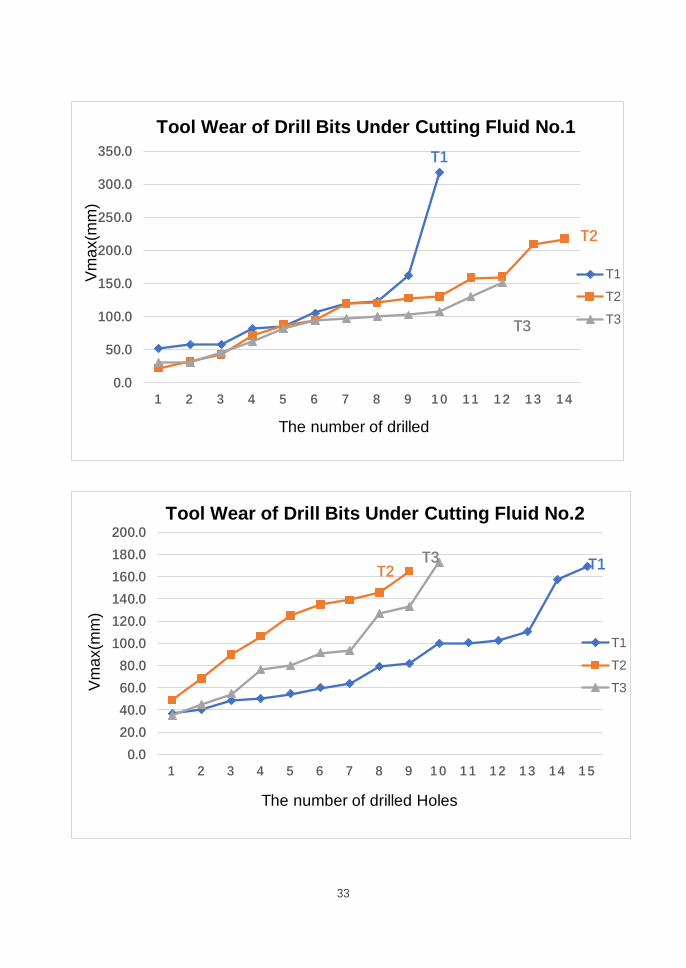
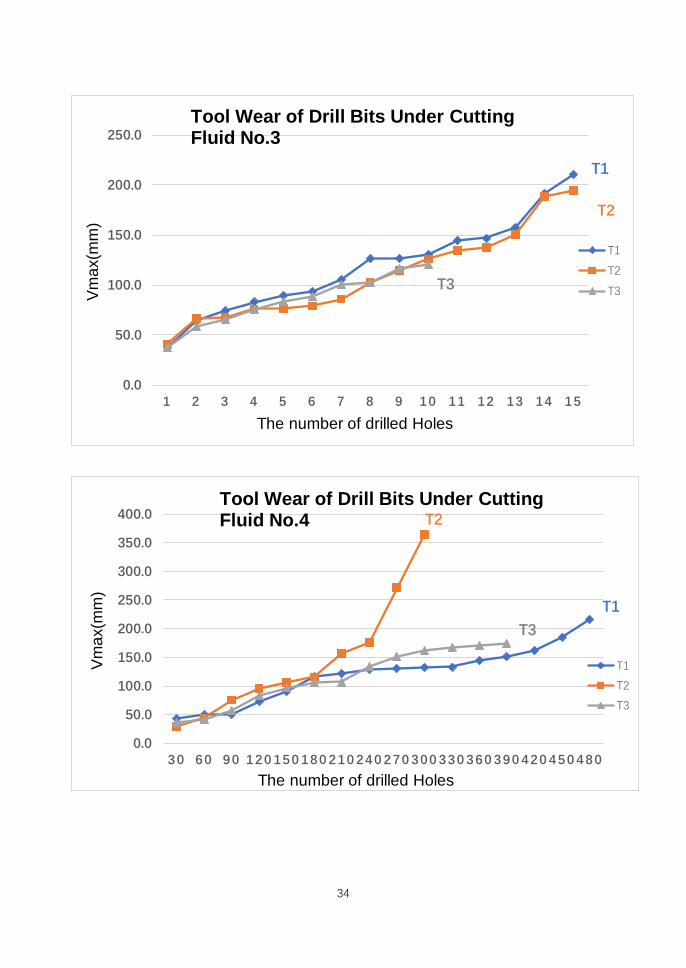
After each 30 holes drilling, the flank wear growth during drilling experiments
was measured to form the line chart in the Figure 14 in which there was no
any apparent differences of flank wear between the cutting fluid No.1
(conventional cutting fluid) and the customized cutting fluids (No.2, No.3 and
No.4). Besides, no significant difference in flank wear was found among the
three-customized cutting fluids.
19
Figure 14. Maximum average of flank wear of each drill bit under four types of cutting fluids
3.2. Result Analysis of the Thrust Force
3.2.1. Thrust force Analysis
The analysis of thrust forces in whole drilling process was split into two parts
in entry drilling process with feed rate 0.08mm/r and in the main drilling
process with 0.16mm/r which are separately presented in Figure 15 and
Figure 16. In each series of 30 holes drilling process, the peak thrust forces
of first three holes was averaged as the peak thrust force in the full process.
20
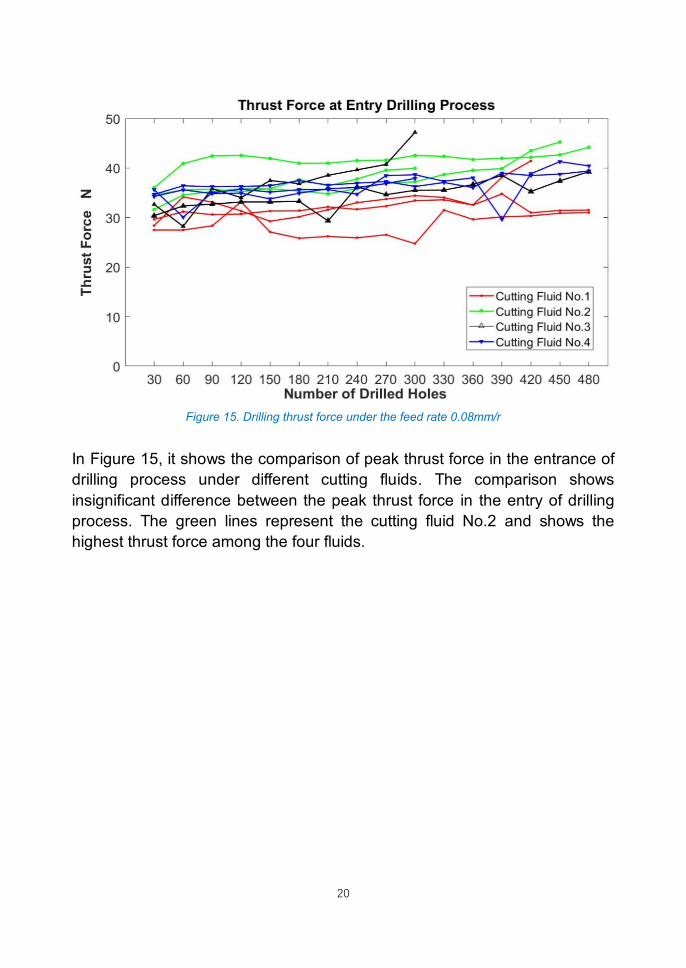
Figure 15. Drilling thrust force under the feed rate 0.08mm/r
In Figure 15, it shows the comparison of peak thrust force in the entrance of
drilling process under different cutting fluids. The comparison shows
insignificant difference between the peak thrust force in the entry of drilling
process. The green lines represent the cutting fluid No.2 and shows the
highest thrust force among the four fluids.
21
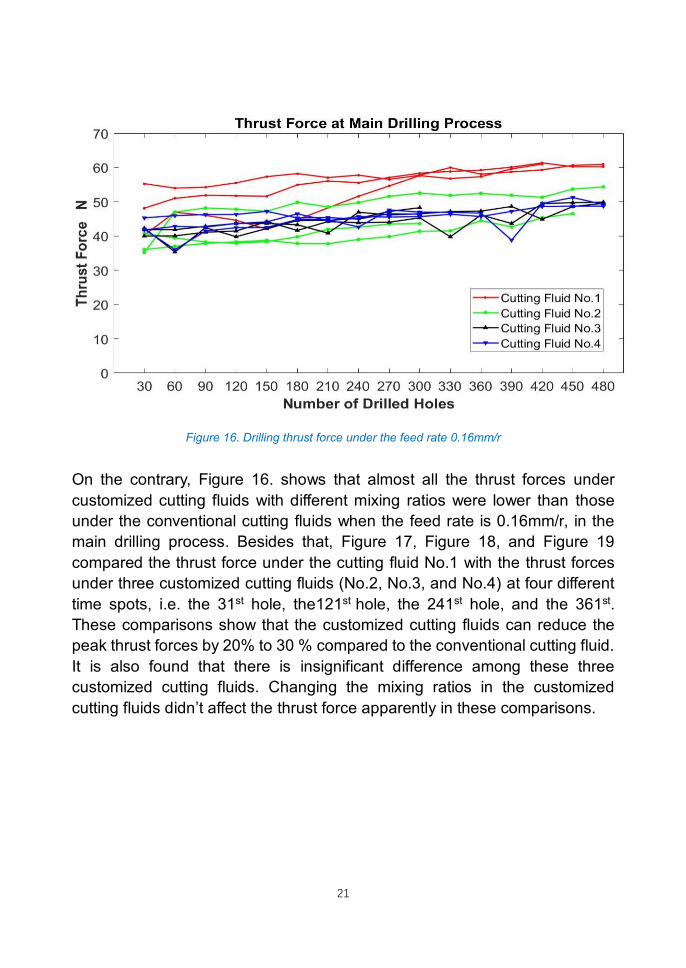
Figure 16. Drilling thrust force under the feed rate 0.16mm/r
On the contrary, Figure 16. shows that almost all the thrust forces under
customized cutting fluids with different mixing ratios were lower than those
under the conventional cutting fluids when the feed rate is 0.16mm/r, in the
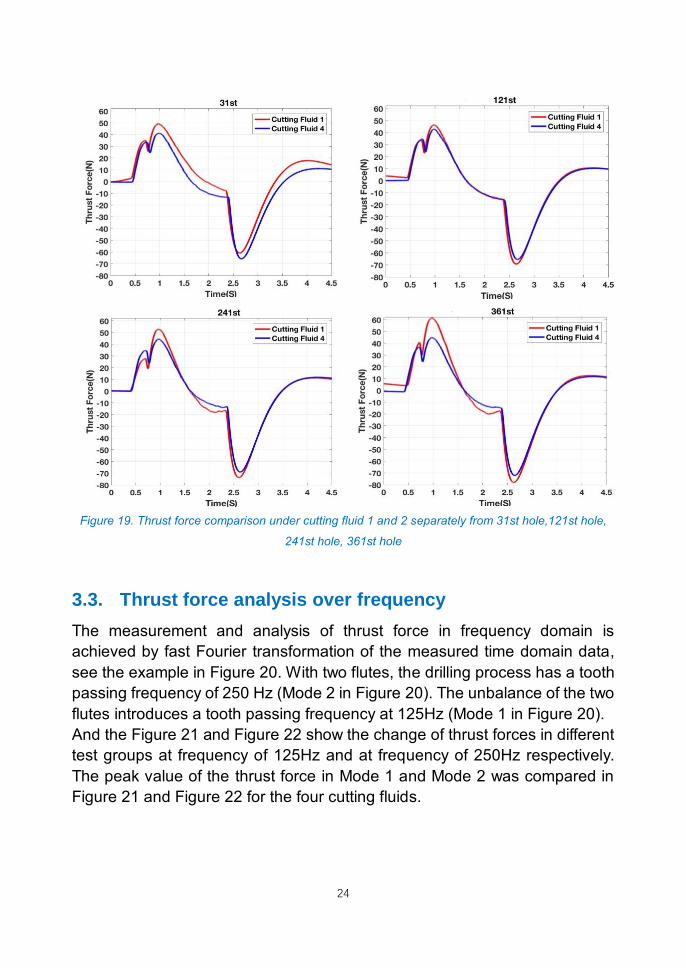
main drilling process. Besides that, Figure 17, Figure 18, and Figure 19
compared the thrust force under the cutting fluid No.1 with the thrust forces
under three customized cutting fluids (No.2, No.3, and No.4) at four different
time spots, i.e. the 31st hole, the121st hole, the 241st hole, and the 361st.
These comparisons show that the customized cutting fluids can reduce the
peak thrust forces by 20% to 30 % compared to the conventional cutting fluid.
It is also found that there is insignificant difference among these three
customized cutting fluids. Changing the mixing ratios in the customized
cutting fluids didn’t affect the thrust force apparently in these comparisons.
22
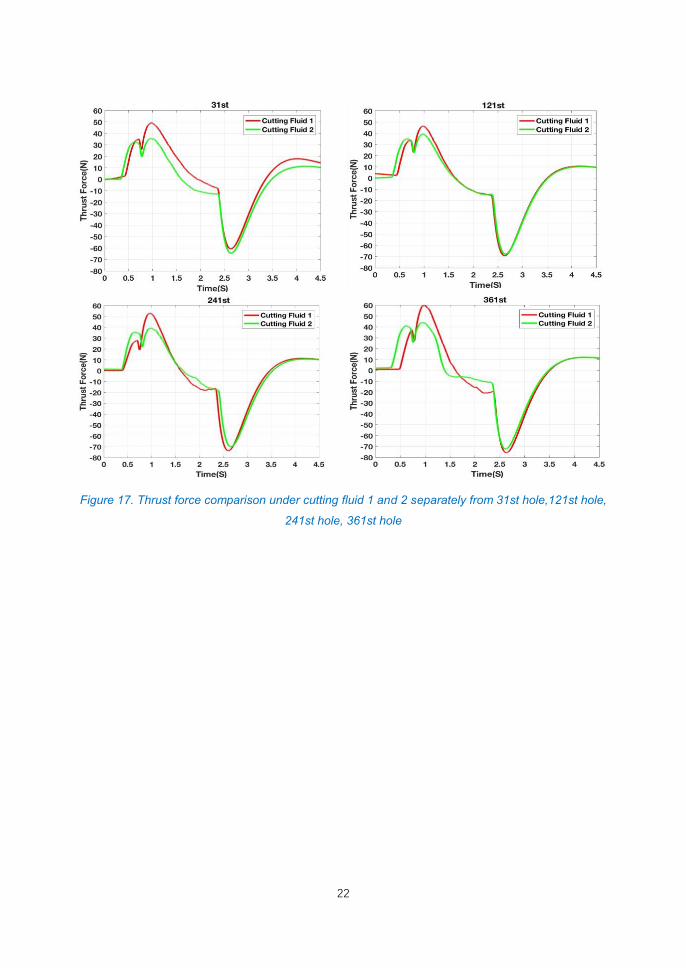
Figure 17. Thrust force comparison under cutting fluid 1 and 2 separately from 31st hole,121st hole,
241st hole, 361st hole
23
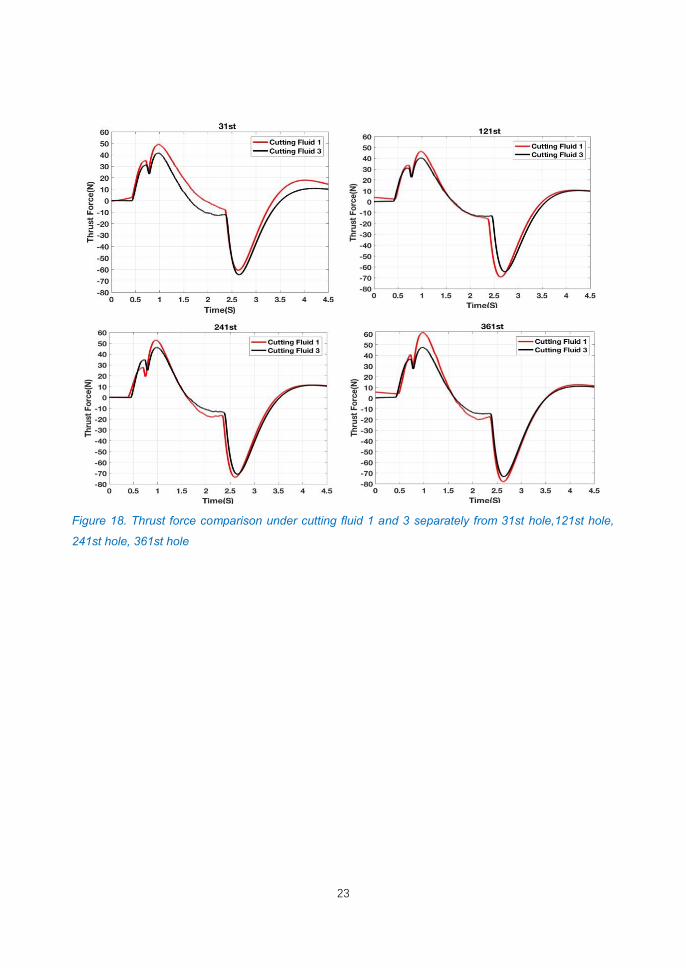
Figure 18. Thrust force comparison under cutting fluid 1 and 3 separately from 31st hole,121st hole,
241st hole, 361st hole
24
Figure 19. Thrust force comparison under cutting fluid 1 and 2 separately from 31st hole,121st hole,
241st hole, 361st hole
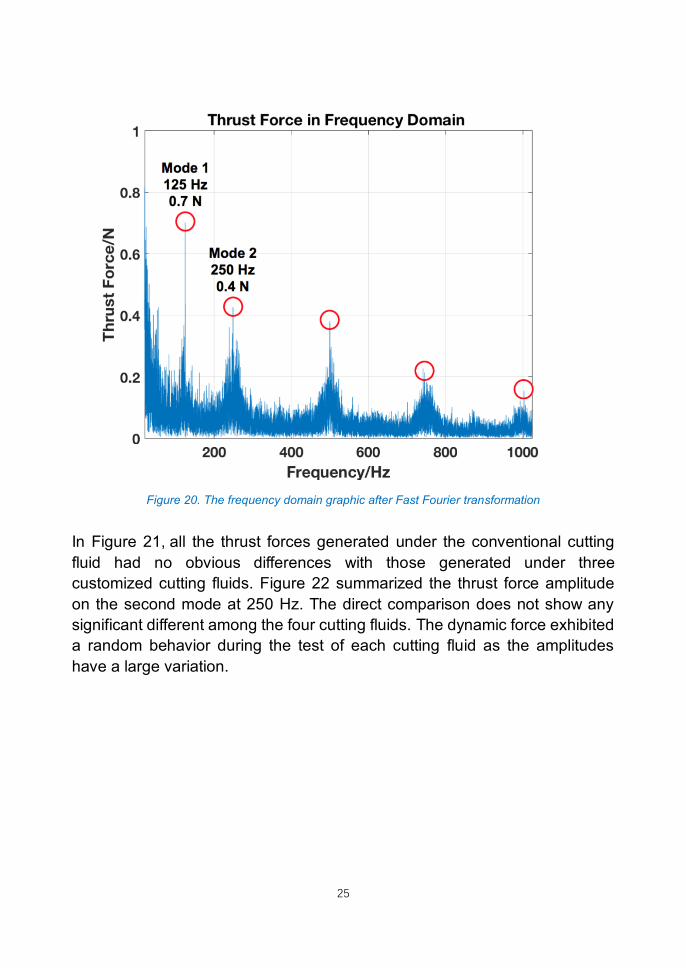
3.3. Thrust force analysis over frequency
The measurement and analysis of thrust force in frequency domain is
achieved by fast Fourier transformation of the measured time domain data,
see the example in Figure 20. With two flutes, the drilling process has a tooth
passing frequency of 250 Hz (Mode 2 in Figure 20). The unbalance of the two
flutes introduces a tooth passing frequency at 125Hz (Mode 1 in Figure 20).
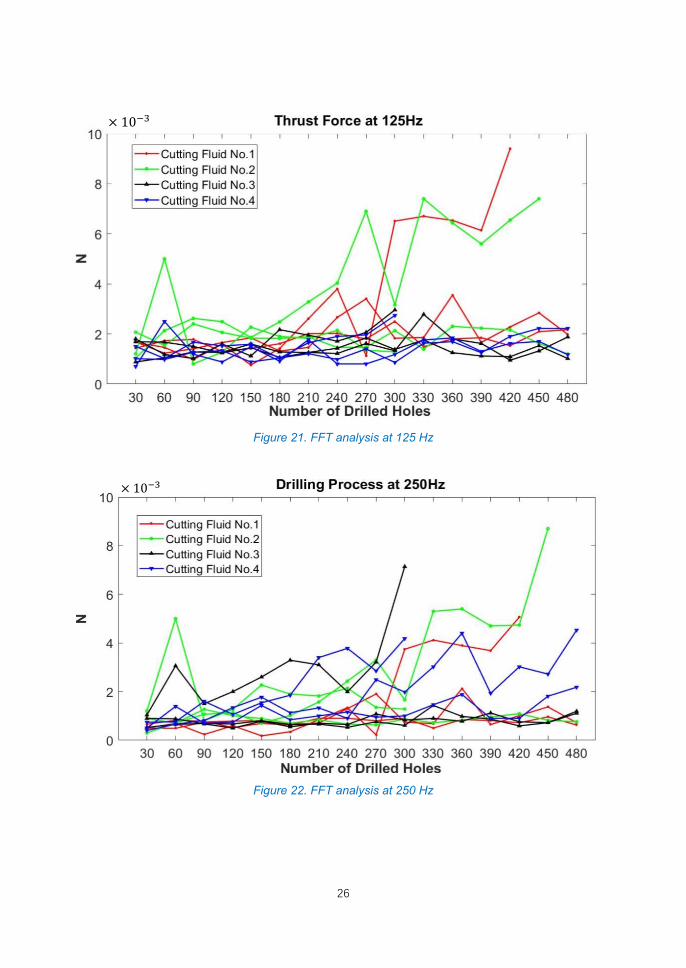
And the Figure 21 and Figure 22 show the change of thrust forces in different
test groups at frequency of 125Hz and at frequency of 250Hz respectively.
The peak value of the thrust force in Mode 1 and Mode 2 was compared in
Figure 21 and Figure 22 for the four cutting fluids.
25
Figure 20. The frequency domain graphic after Fast Fourier transformation
In Figure 21, all the thrust forces generated under the conventional cutting
fluid had no obvious differences with those generated under three
customized cutting fluids. Figure 22 summarized the thrust force amplitude
on the second mode at 250 Hz. The direct comparison does not show any
significant different among the four cutting fluids. The dynamic force exhibited
a random behavior during the test of each cutting fluid as the amplitudes
have a large variation.
26
Figure 21. FFT analysis at 125 Hz
Figure 22. FFT analysis at 250 Hz
27
4. Discussion and Conclusion
4.1 Result of Hardness Measurement of CGI Test
Workpieces
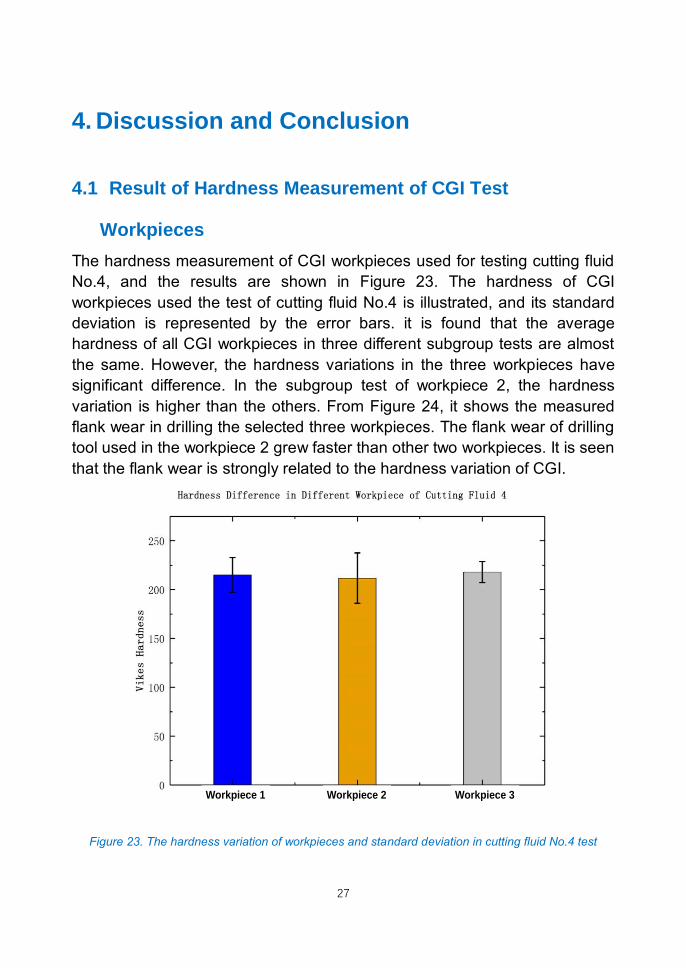
The hardness measurement of CGI workpieces used for testing cutting fluid
No.4, and the results are shown in Figure 23. The hardness of CGI
workpieces used the test of cutting fluid No.4 is illustrated, and its standard
deviation is represented by the error bars. it is found that the average
hardness of all CGI workpieces in three different subgroup tests are almost
the same. However, the hardness variations in the three workpieces have
significant difference. In the subgroup test of workpiece 2, the hardness
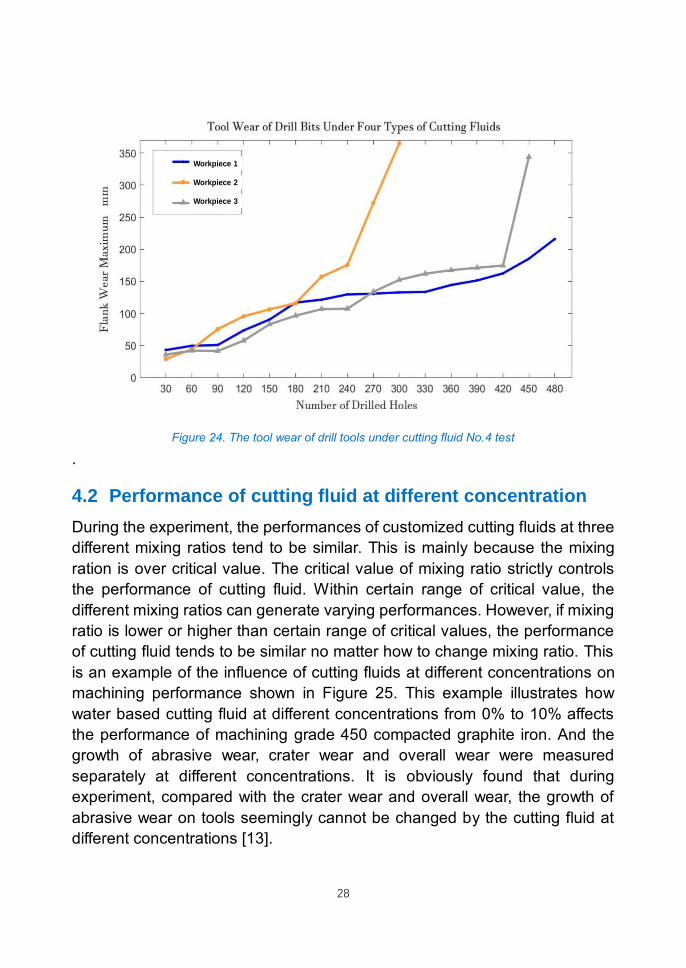
variation is higher than the others. From Figure 24, it shows the measured
flank wear in drilling the selected three workpieces. The flank wear of drilling
tool used in the workpiece 2 grew faster than other two workpieces. It is seen
that the flank wear is strongly related to the hardness variation of CGI.
Workpiece 1 Workpiece 2 Workpiece 3
Figure 23. The hardness variation of workpieces and standard deviation in cutting fluid No.4 test
28
Workpiece 2
Workpiece 1
Workpiece 3
Figure 24. The tool wear of drill tools under cutting fluid No.4 test
.
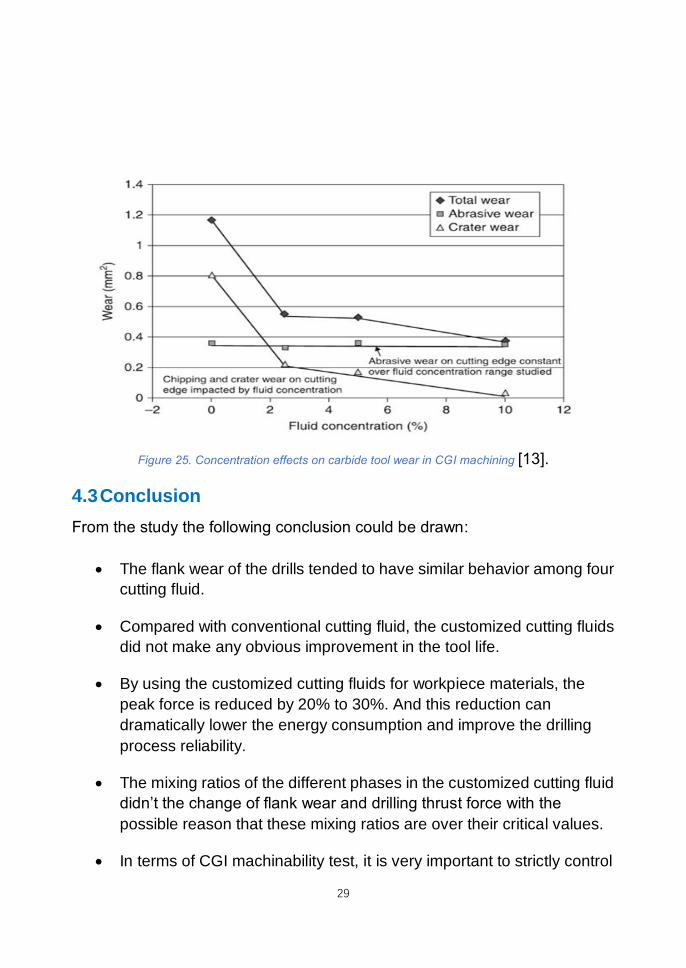
4.2 Performance of cutting fluid at different concentration
During the experiment, the performances of customized cutting fluids at three
different mixing ratios tend to be similar. This is mainly because the mixing
ration is over critical value. The critical value of mixing ratio strictly controls
the performance of cutting fluid. Within certain range of critical value, the
different mixing ratios can generate varying performances. However, if mixing
ratio is lower or higher than certain range of critical values, the performance
of cutting fluid tends to be similar no matter how to change mixing ratio. This
is an example of the influence of cutting fluids at different concentrations on
machining performance shown in Figure 25. This example illustrates how
water based cutting fluid at different concentrations from 0% to 10% affects
the performance of machining grade 450 compacted graphite iron. And the
growth of abrasive wear, crater wear and overall wear were measured
separately at different concentrations. It is obviously found that during
experiment, compared with the crater wear and overall wear, the growth of
abrasive wear on tools seemingly cannot be changed by the cutting fluid at
different concentrations [13].
29
Figure 25. Concentration effects on carbide tool wear in CGI machining [13].
4.3 Conclusion
From the study the following conclusion could be drawn:
• The flank wear of the drills tended to have similar behavior among four
cutting fluid.
• Compared with conventional cutting fluid, the customized cutting fluids
did not make any obvious improvement in the tool life.
• By using the customized cutting fluids for workpiece materials, the
peak force is reduced by 20% to 30%. And this reduction can
dramatically lower the energy consumption and improve the drilling
process reliability.
• The mixing ratios of the different phases in the customized cutting fluid
didn’t the change of flank wear and drilling thrust force with the
possible reason that these mixing ratios are over their critical values.
• In terms of CGI machinability test, it is very important to strictly control
30
the variation of workpiece hardness if tool wear is used as a
machinability indicator.
Acknowledgement
The authors are thankful to the Vinnova project 2016-02506 Testbädd för
framtidens processvätskor inom hållbar production, XPRES (Excellence in
Production Research) and appreciates the support provided by Binol AB in
Sweden for supplying of the cutting fluids and discussion.
Reference
[1] Mocellin F, Melleras E, Guesser W L and Boehs L 2004 Study of the
machinability of compacted graphite iron for drilling process J. Brazilian Soc.
Mech. Sci. Eng. 26
[2] SinterCast Compacted Graphite Iron - Material Data Sheet Sintercast. (n.d.).
Compact. Graph. Iron - Mater. Data Sheet 2–3
[3] Berglund A Criteria for Machinability Evaluation of Compacted Graphite Iron
Materials
[4] Guesser W, Schroeder T and Dawson S 2001 Production experience with
compacted graphite iron automotive components AFS Trans. 71 11
[5] StandardizationI.S.O. 2006 Compaceted(Vermicular) Graphite Cast Irons -
Classification, ISO16112:2006.
[6] Berglund A, Nicolescu C M and Svensson H 2009 The Effect of Interlamellar
Distance in Pearlite on CGI Machining World Acad. Sci. Eng. Technol. 3 27–34
[7] Dawson S, Hollinger I, Robbins M, Daeth J, Reuter U and Schulz H 2001 The
Effect of Metallurgical Variables on the Machinability of Compacted Graphite
Iron
31
[8] AndersB & N Analysis of compacted graphite iron machining by investigation of
tool temperature and cutting force 1st International Conference on Process
Machine Interaction. (Hannover: 1st International Conference on Process
Machine Interaction.)
[9] (n.d.). Q QUAKERCOOL® 3750 BFF. QUAKER. (n.d.).
[10] Laurent L (n. d. ). Forward Thinking: New Approaches to Coolants are
Dramatically Reducing Resource Use.
[11] Alves S M, Schroeter R B, Bossardi J C dos S and Andrade C L F de 2011
Influence of EP additive on tool wear in drilling of compacted graphite iron J.
Brazilian Soc. Mech. Sci. Eng. 33 197–202
[12] Rajesh S and Marimuthu K 2012 On-line drill wear state monitoring by virtual
instrumentation in machining of mild steel J. Appl. Sci. 12 1456–64
[13] Astakhov V P and Joksch S 2012 Metalworking Fluids (MWFs) for Cutting and
Grinding: Fundamentals and Recent Advances
32
Appendix
33
0.0
50.0
100.0
150.0
200.0
250.0
300.0
350.0
1 2 3 4 5 6 7 8 9 10 11 12 13 14
T1
T2
T3
T1
T2
T3
Tool Wear of Drill Bits Under Cutting Fluid No.1
The number of drilled
Vm
ax(m
m)
0.0
20.0
40.0
60.0
80.0
100.0
120.0
140.0
160.0
180.0
200.0
1 2 3 4 5 6 7 8 9 10 11 12 13 14 15
T1
T2
T3
T1T2T3
Tool Wear of Drill Bits Under Cutting Fluid No.2
The number of drilled Holes
Vm
ax(m
m)
34
0.0
50.0
100.0
150.0
200.0
250.0
1 2 3 4 5 6 7 8 9 10 11 12 13 14 15
T1
T2
T3
T1
T2
T3
The number of drilled Holes
Vm
ax(m
m)
Tool Wear of Drill Bits Under CuttingFluid No.3
0.0
50.0
100.0
150.0
200.0
250.0
300.0
350.0
400.0
30 60 90 120150180210240270300330360390420450480
T1
T2
T3
T1
T2
T3
Tool Wear of Drill Bits Under CuttingFluid No.4
Vm
ax(m
m)
The number of drilled Holes


![Graphite Structures in Cast Iron English[1]](https://img.pdfslide.us/doc/110x75/545d8292af7959be0e8b4d0b/graphite-structures-in-cast-iron-english1.jpg)