Embed Size (px)
Citation preview
IMPROVEMENT OF AFRICAN INDIGENOUS VEGETABLES FOR STABLE DELIVERY OF
MICRONUTRIENTS
By
DAVID ROHAN BYRNES
A dissertation submitted to the
School of Graduate Studies
Rutgers, The State University of New Jersey
In partial fulfillment of the requirements
For the degree of
Doctor of Philosophy
Graduate Program in Plant Biology
Written under the direction of
James E. Simon
And approved by
_____________________________________
_____________________________________
_____________________________________
_____________________________________
New Brunswick, New Jersey
October, 2018
ii
ABSTRACT OF THE DISSERTATION
Improving African indigenous vegetables for delivery of stable micronutrient content
by DAVID ROHAN BYRNES
Dissertation Director:
James E. Simon
Amaranth (Amaranthus spp.) is cultivated in over 80 countries as a preferred leafy green
vegetable crop and is often cited as having unrealized potential to reduce multiple
micronutrient deficiencies occurring at high rates in the countries where it is
cultivated. Despite widespread cultivation and a wealth of genetic resources held by USDA
GRIN and international germplasms, amaranth remains designated as an orphan crop due
to a lack of development; producers are not often provided with options of cultivars as a
leafy green vegetable. The goal of this dissertation research was to narrow the information
gap preventing an effective cultivar development platform which serves goals of both
farmers and organizations which promote Amaranthus among other indigenous vegetables
to reduce prevalence of micronutrient deficiencies. Specific objectives were to: 1) establish
breeding priorities to develop breeding lines and cultivars which can meet the needs of
farmers and goals of international development goals focusing on orphan crops, 2) screen
genetic diversity for traits of interest in entries which can either be utilized as breeding
lines or fast-tracked for cultivar development 3) confirm consistency of genotype effect for
prioritized traits and observe whether effect of genotype by environment interaction is
sufficiently low to successfully select for these traits. Genotype effect on accumulation of Fe
content was found to be substantial and consistently significant, with one entry identified
iii
which accumulated high-source quantities of Fe across multiple environments including
environments in which the mean Fe content across entries to fall well below high-source
thresholds. A screening method to verify successful outcrossing events using SSRs was
developed to facilitate breeding efforts with this crop which historically has relied on visible
markers given the high rate of self-pollination, small, and highly numerous flowers on
inflorescences of Amaranthus. The culmination of this study presents a case study of the
first characterization of a crop to reliably provide high-source levels of three essential
micronutrients which is aligned with the cultural preferences of populations often deficient
in those micronutrients where it is cultivated, providing a platform for development of
similar commodities toward alleviation of hidden hunger and wide-spread micronutrient
deficiencies.
iv
ACKNOWLEDGEMENTS
Special acknowledgement goes to my major advisor and mentor, Professor Jim
Simon. His one-of-a-kind leadership and encouragement provided me the foundation to be
a scientist and the inspiration to make an impact in the true original science, plant biology.
Dr. Simon’s boundless energy and contagious enthusiasm provided me the path to engage in
international development to create opportunities for the rural poor to improve their
income and nutrition through agriculture. His mentorship is an irreplaceable gift for which
I will always be grateful and inspired by.
Thanks also goes to Rutgers Professors Dan Hoffman, Ramu Govindasamy, Qingli
Wu, Xenia Morin, Rodolfo Juliani, Thomas Orton, and Albert Ayeni whose guidance and
support have been instrumental in my development. Thanks to the support of Josh Honig
along with Chrissy Kubik, Jen Vaiciunas, and Vinny Averello. Thanks to Joe Florentine along
with NJAES greenhouse staff, Mark Peacos, and Adam Morgan. Thanks to Ed Dager and
Snyder Research and Extension Farm staff as well as the staff of Rutgers Horticultural
Research Farm III. Thanks to Albert Ayeni and Michael Lawson for exposing me to plant
science research as an undergraduate student.
Special appreciation goes to my friends and colleagues of the World Vegetable
Center, who made Tanzania a second home for me and an irreplaceable developmental
experience through the mentorship of Dr. Fekadu Dnissa, the support of Dr. Thomas Dubois,
Nadine Kwazi, David Sarakikya. Omary Mbwambo, Raphael Mallogo, Hamis Wambura, Areth
Kibaraza, Hassan Mndiga, Upendo Laiser, and the many others who showed me unhesitant
acceptance and encouragement as well as tireless instruction in speaking Swahili. Thank
you to my adoptive family in Arusha, Mama yangu Ene Obi, dada yangu Nneka and kaka
yangu, “little” David Obi for giving me an enduring home.

v
Appreciation also goes to my colleague graduate students at Rutgers University,
from Jim Simon’s lab including William Reichert, Thomas Villani, Rob Pyne, Kelsey
Gustafson, Daniel Giurleo, Jing Zhen, Arianne Vasilatis, Emily Merchant, Mara Sanders,
Martin Zorde, Lara Brindisi and the many additional students from Rutgers. Appreciation
for the network of students and professionals associated with the National Association of
Plant Breeders (NAPB). Special thanks to the several undergraduates who have contributed
their energy and intelligence to these projects and who I have been honored to work with.
Acknowledgement goes to Steve Weller (Purdue University), a champion for the
developing world with Jim Simon and a founding-father for focusing research on developing
“orphan” crops for human health. I knew I was getting somewhere when Steve began to ask
for my professional opinion.
This study was made possible by the generous support of the American people
through the United States Agency for International Development (USAID EPA-A-00-09-
00004). The contents are the responsibility of Rutgers University and with funding from the
Horticulture Innovation Lab and do not necessarily reflect the views of USAID or the United
States Government. The assistantship provided to me allowed me to not only focus on my
own dissertation research and but to participate in a much larger holistic international
research and development project on African Indigenous Vegetables and using these
orphan crops to improve income generating opportunities and improve health and
nutrition in Kenya and Zambia. This project was done in partnerships with many
organizations which I must thank and express my appreciation and gratefulness:
AMPATH and Moi University: Naman Nyabinda and Norah Maiyo; University of Eldoret:
Prof. Linnet Gohole and Angeline Mnene; Kenya Agric. Livestock Res. Organization

vi
(KALRO): Christine Ndinya Martins Odendo; the World Vegetable Center, Dr. Fekadu Dinssa,
Thomas Debois, Justus Ochieng, Hassan Mndiga, and Director General Marco Wopereis.
Chapter two of this dissertation, “Elemental Micronutrient Content and
Horticultural Performance of Various Vegetable Amaranth Genotypes” was published in the
Journal of the American Society for Horticultural Science, July 2017, vol. 142 no. 4 265-271.

vii
DEDICATION
For my Mom, Dad, and brothers.
To my niece Ava, for affirming the power of dissent through asking honest questions.
viii
Table of Contents Abstract……….…………………………………………………………………………………………………. ii
Acknowledgements………………………………………………………………………………………….. iii
Dedication………………………………………………………………………………………………………. vii
Chapter 1 Characterizing green leafy vegetables for delivery of essential micronutrients . xv
1.1 Introduction ............................................................................. Error! Bookmark not defined.
1.2 Nutrition labeling and nutrient content claims of green leafy vegetables......... Error!
Bookmark not defined.
1.3 Characterizations of green leafy vegetables for micronutrient thresholds across
selected commodities ......................................................................... Error! Bookmark not defined.
1.3.1 Vitamin A ......................................................................... Error! Bookmark not defined.
1.3.2 Thiamin ............................................................................ Error! Bookmark not defined.
1.3.3 Riboflavin ........................................................................ Error! Bookmark not defined.
1.3.4 Niacin ................................................................................ Error! Bookmark not defined.
1.3.5 Pantothenic acid ........................................................... Error! Bookmark not defined.
1.3.6 Folate ................................................................................ Error! Bookmark not defined.
1.3.7 Vitamin C ......................................................................... Error! Bookmark not defined.
1.3.8 Vitamin K ......................................................................... Error! Bookmark not defined.
1.3.9 Calcium ............................................................................. Error! Bookmark not defined.
1.3.10 Iron .................................................................................... Error! Bookmark not defined.
1.3.11 Magnesium ..................................................................... Error! Bookmark not defined.
1.3.12 Zinc .................................................................................... Error! Bookmark not defined.
ix
1.4 Impact of consuming green leafy vegetables on health outcomes Error! Bookmark
not defined.
1.4.1 Vitamin A ......................................................................... Error! Bookmark not defined.
1.4.2 Calcium ............................................................................. Error! Bookmark not defined.
1.5 Discussion ................................................................................. Error! Bookmark not defined.
1.6 References ............................................................................................................................................. 28
Chapter 2 Elemental Micronutrient Content and Horticultural Performance of Various
Vegetable Amaranth Genotypes Introduction ........................................................................................... 34
2.1 Introduction .......................................................................................................................................... 34
2.2 Materials and Methods ..................................................................................................................... 37
2.2.1 Plant Materials ........................................................................................................................... 37
2.2.2 Experimental Locations ......................................................................................................... 38
2.2.3 Experimental Design and Layout ....................................................................................... 39
2.2.4 Data Collection ........................................................................................................................... 39
2.2.5 Statistical Analysis .................................................................................................................... 40
2.3 Results ..................................................................................................................................................... 41
2.3.1 Foliar Micronutrient Content ............................................................................................... 41
2.3.2 Horticultural Performance .................................................................................................... 42
2.4 Discussion .............................................................................................................................................. 42
2.5 References ............................................................................................................................................. 56
Chapter 3 Genotype x environment interaction for elemental micronutrient content of
vegetable amaranth, Ethiopian mustard, edible nightshade and spiderplant ............................. 60
x
3.1 Introduction .......................................................................................................................................... 60
3.2 Materials and Methods ..................................................................................................................... 66
3.2.1 Germplasm .................................................................................................................................. 66
3.2.2 Experimental design and field sites .................................................................................. 66
3.2.3 Elemental analysis. ................................................................................................................... 68
3.2.4 Statistical analysis .................................................................................................................... 69
3.3 Results and discussion- .................................................................................................................... 69
3.3.1 Iron Content ................................................................................................................................ 69
3.3.2 Calcium Content ........................................................................................................................ 70
3.3.3 Magnesium Content ................................................................................................................. 71
3.3.4 Zinc ................................................................................................................................................. 72
3.4 References ................................................................................ Error! Bookmark not defined.
Chapter 4 Selection for improved Fe content in Amaranthus ....................................................... 101
4.1 Introduction ....................................................................................................................................... 101
4.2 Materials and Methods .................................................................................................................. 102
4.2.1 Initial evaluation .................................................................................................................... 102
4.2.2 Evaluation ................................................................................................................................. 103
4.2.3 Statistical analysis ................................................................................................................. 103
4.3 Results and Discussion .................................................................................................................. 104
Chapter 5 Pure-line selection for delayed flower time to increase vegetative growth in
spideprlant (Cleome gynandra) .................................................................................................................... 113
xi
5.1 Introduction ....................................................................................................................................... 113
5.2 Materials and Methods .................................................................................................................. 115
5.2.1 Plant materials ........................................................................................................................ 115
5.2.2 Greenhouse evaluation ........................................................................................................ 116
5.2.3 Field evaluation ...................................................................................................................... 116
5.2.4 Statistics ..................................................................................................................................... 116
5.3 Results and discussion .................................................................................................................. 117
5.4 References .......................................................................................................................................... 125
Chapter 6 Progeny testing in amaranth using simple sequence repeats .................................. 130
6.1 Introduction ....................................................................................................................................... 130
6.2 Methods ............................................................................................................................................... 132
6.2.1 Plant material .......................................................................................................................... 132
6.2.2 SSR markers ............................................................................................................................. 132
6.2.3 SSR analysis .............................................................................................................................. 133
6.3 Results and discussion .................................................................................................................. 133
6.3.1 Primer selection ..................................................................................................................... 133
6.3.2 Progeny testing ....................................................................................................................... 134
6.4 Conclusions ........................................................................................................................................ 134
6.5 References .......................................................................................................................................... 141

xii
xiii
LIST OF TABLES
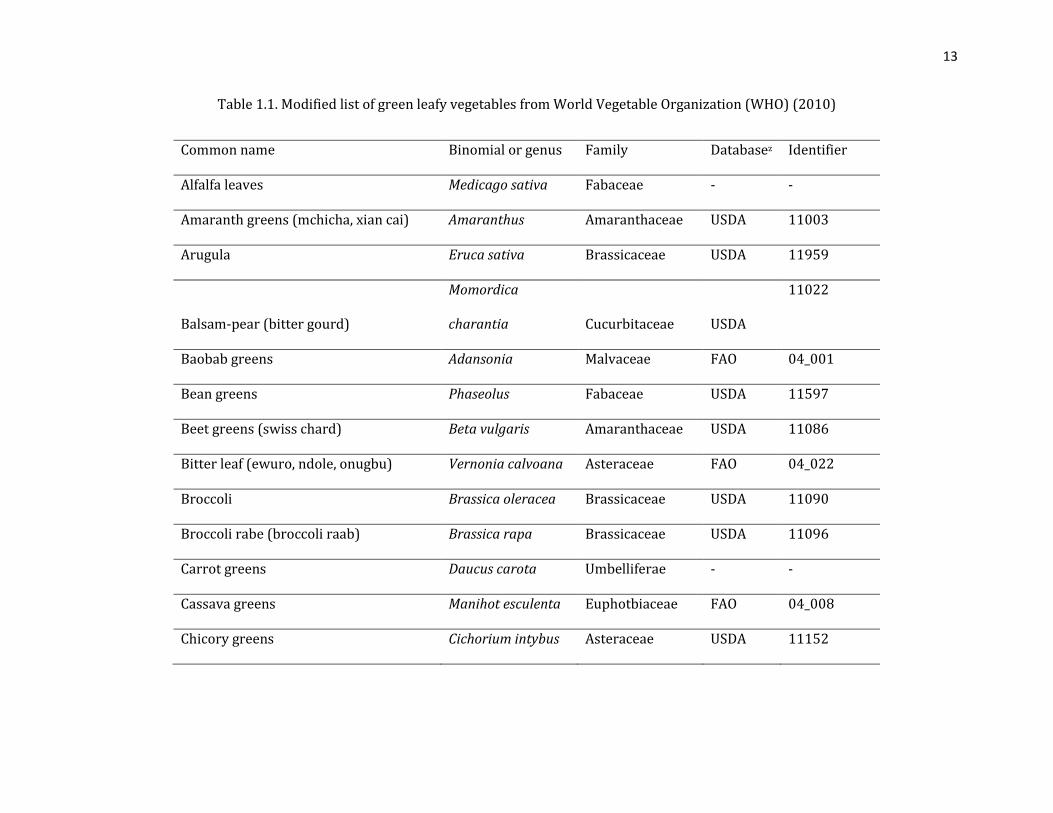
Table 1.1. Modified list of green leafy vegetables from World Health Organization (2010).
Page 13.
Table 1.2. Claim thresholds and requirements for nutrient content claims of vitamin and
mineral micronutrients. Page 17.
Table 1.3. Vitamin content of select green leafy vegetable commodities. Page 19.
Table 1.4. Mineral content of select green leafy vegetable commodities. Page 24.
Table 2.1. Listing of the vegetable amaranth (Amaranthus sp.) entries evaluated for
elemental micronutrient content and horticultural performance in each location. Scientific
name of entries described as reported. New Jersey (NJ) 2013 and 2015 trials conducted at
Snyder Research and Extension Farm in Pittstown, NJ; Arusha 2014 at World Vegetable
Center (WorldVeg) regional center of east and southern Africa, Arusha, Tanzania. Page 46.
Table 2.2 Means of micronutrient content and horticultural performance of vegetable
amaranth entries at New Jersey in 2013. Fe, Ca, Mg, and Zn reported as (mg·100 g-1); TY,
total yield of five plants; MY, marketable yield of five plants; HGT, plant height; SPR, canopy
spread. Page 49.
Table 2.3. Means of micronutrient content and horticultural performance of vegetable
amaranth entries at Arusha, Tanzania in 2014. Fe, Ca, Mg, and Zn reported as (mg·100 g-1);
TY, total yield of five plants; MY, marketable yield of five plants; MP, marketable percentage;
HGT, plant height; SPR, canopy spread. Page 51.
Table 2.4. Means of micronutrient content and horticultural performance of vegetable
amaranth entries at New Jersey in 2015. Fe, Ca, Mg, and Zn mg·100 g-1; TY, total yield of five
xiv
plants; MY, marketable yield of five plants; MP, marketable percentage; HGT, plant height;
SPR, canopy spread. Page 53.
Table 3.1 Genetic entries of amaranth, spiderplant, edible nightshade, and Ethiopian
mustard included in this study with species, accession as identified by source, and source of
material. Page 75.
Table 3.2 P values of Genetic (G), Environment (E), and genetic by environmental
interaction (G x E) effect across crops for each micronutrient observed. Page 76.
Table 3.3. Tests of effect slices genetic by environment for each genetic entry across each
crop and micronutrient observed. Page 77.
Table 4.1. Iron content observations of each individual amaranth plant from greenhouse
trial at NJAES research greenhouses, New Brunswick, NJ. Page 107
Table 4.2. Summary statistics of progeny populations from individuals selected for
improved Fe content (AM36-20 and AM36-30) and a control population not selected for Fe
content (Madiira 1). Page 108.
Table 5.1. Field trial results with mean separation of mean days to flower for progeny plots
in Arusha, Tanzania. Page 123.
Table 6.1. Twelve SSR loci used in this study and the results of amplificant in parent lines.
Page 136.
Table 6.2. PCR products using primer GB-AMM-132 across parent lines and ten putative
progenies. Page 137.
xv
LIST OF FIGURES
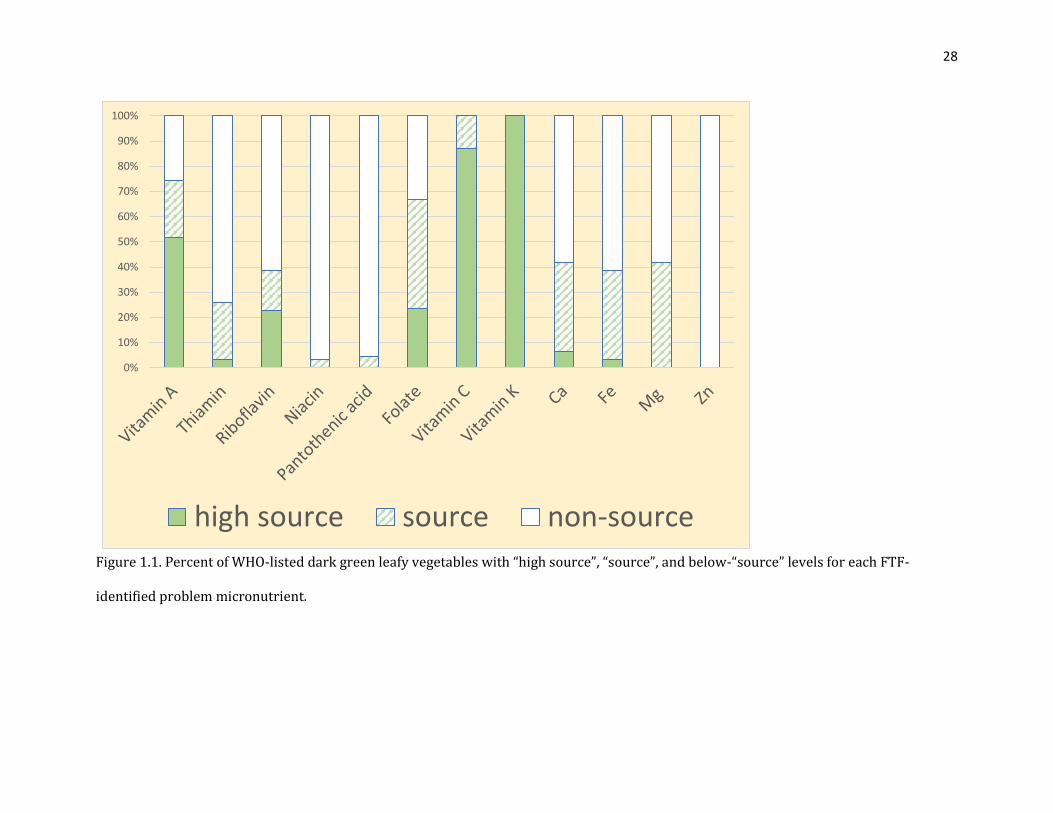
Figure 1.1. Percent of WHO-listed dark green leafy vegetables with “high source”, “source”,
and below-“source” levels for each FTF-identified problem micronutrient. Page 28.
Figure 3.1. Mean Fe content of amaranth, Ethiopian mustard, edible nightshade, and
spiderplant with all genetic entries aggregated, across multiple environments. Page 79.
Figure 3.2. Mean Fe content of genetic entries within amaranth across multiple
environments. Page 80.
Figure 3.3 Mean Ca content of amaranth, Ethiopian mustard, edible nightshade, and
spiderplant with all genetic entries aggregated, across multiple environments. Page 81.
Figure 3.4. Mean Ca content of genetic entries within amaranth across multiple
environments. Page 82.
Figure 3.5. Mean Ca content of genetic entries within Ethiopian mustard across multiple
environments. Page 83.
Figure 3.6. Mean Ca content of genetic entries within edible nightshade across multiple
environments. Page 84.
Figure 3.7. Mean Mg content of amaranth, Ethiopian mustard, edible nightshade, and
spiderplant with all genetic entries aggregated, across multiple environments. Page 85.
Figure 3.8. Mean Mg content of genetic entries within amaranth across multiple
environments. Page 86.
Figure 3.9. AMMI biplot view of PC1 (y-axis) by Mg (mg·100 g-1) (x-axis) content across
genetic entries of amaranth in five environments. Page 87.
xvi
Figure 3.10. Mean Mg content of genetic entries within Ethiopian mustard across multiple
environments. Page 88.
Figure 3.11. Mean Mg content of genetic entries within edible nightshade across multiple
environments. Page 89.
Figure 3.12. Mean Mg content of genetic entries within spiderplant across multiple
environments. Page 90.
Figure 3.13. Mean Zn content of amaranth, Ethiopian mustard, edible nightshade, and
spiderplant with all genetic entries aggregated, across multiple environments. Page 91.
Figure 4.1. Histograms of Fe content by parent line observed from trial in Arusha, Tanzania
at World Vegetable Center research station. Page 109.
Figure 4.2. Boxplots of Fe content by parent line observed from trial in Arusha, Tanzania at
World Vegetable Center research station. Page 110.
Figure 5.1. Histogram of time to flowering from individuals observed in NJAES greenhouse
trial. Page 121.
Figure 5.2. Histogram of days to flowering for field trial in Arusha, Tanzania at World
Vegetable Center field research station. Page 122.
Figure 5.3. Box plot of field trial results for days to flowering as an effect of progeny plot in
Arusha, Tanzania. Page 124.
Figure 6.1. Photograph of RUAM24 in NJAES Greenhouse used as seed parent in this study.
Page 138.

xvii
Figure 6.2. Photograph of AM101 in NJAES Greenhouse used as pollen parent in this study.
Page 139.
Figure 6.3. Photograph of resulting generation collected from mature inflorescence of seed
parent. Green-stemmed seedlings were concluded to be products of self-pollination,
samples of red-stemmed seedlings were collected for parentage analysis. Page 140.
1
Characterizing green leafy vegetables for delivery of essential
micronutrients
1.1 Introduction
Green leafy vegetables (GLV) are highlighted by the FAO and WHO among preferred
foods to be consumed for optimal nutrition especially with respect to consuming adequate
micronutrients (FAO, 2002; World Health Organization, 2004). Country-specific, food-
based dietary guidelines invariably recommend consuming plenty of vegetables (Miller &
Welch, 2013; USDA, 2015b).
Multiple micronutrient deficiencies may often occur simultaneously due to an
inadequate diet (Best et al., 2011). Iron deficiency anemia has been estimated to affect 53%
of school-age children worldwide (Rosso & Marek, 1996). Malnutrition, including vitamin A
and zinc deficiency, has been found to be underlying 53% of the 10.6 million deaths of
children under 5 years of age in sub-Sahara Africa (WHO, 2002).
Special feeding programs for women, infants, and children in the USA was found to be
one of the most cost-effective methods to preventing premature death (Tengs et al., 1995).
The UN sustainable development goal (SDG) 2, focused on food security and improved
nutrition (UN, 2016), and SDG4, quality education are being simultaneously addressed by
the home grown school meal program, which is now implemented in over 46 countries
(World Food Programme, 2018). Students in many elementary schools across the USA are
provided free produce through the United States Department of Agriculture (USDA) and
Department of Defense (DoD) Fresh Fruit and Vegetable Program, promoting fresh market
produce as “good low‐calorie, low‐fat sources of vitamins, minerals, and fiber,” (USDA,
2010).

2
While fortification of foods has been shown to reduce micronutrient deficiencies and
anemia (Best et al., 2011), decision makers addressing at-risk populations with intervention
strategies relying solely on locally produced, unfortified foods should have a basis for
inclusion of commodities to meet specific health needs. A review such as this one is needed
to consolidate and demonstrate current knowledge of GLVs within the broader class of
fresh market produce for implicitly and often explicitly being promoted for content and
efficacy of essential micronutrients to support or improve human health.
The treatment of micronutrient deficiencies including supplementation of multiple
micronutrients has been found to have a greater effect on health outcomes than targeted,
single-micronutrient supplementation alone (Best et al., 2011). Fresh produce and often
GLVs especially are prioritized to address diet inadequacy, though without a reference to
characterize which commodities may be most useful for the delivery of particular
micronutrients, a well-diversified diet consisting of multiple commodities within this class
with adequate portions may not result in dietary adequacy.
The procedure used by this review for inclusion of GLVs, data to characterize them by,
and thresholds for distinction of micronutrient content follows the same procedure used by
Feed the Future (FTF) (2016; 2014) for researchers implementing nutrition-sensitive
indicators. Both the FAO and FTF refer to an expounded list provided by the WHO (2010) to
guide researchers for including specific commodities in survey tools for making health
inferences (Feed the Future, 2016; Food and Agriculture Organization, 2007). The USDA
standard reference database is defined as the primary reference which researchers can use
to characterize commodities by Codex Alimentarius-defined thresholds for being a “high
source” of one or more micronutrients (Feed the Future, 2016). Commodities which are not
listed in the USDA standard reference nutrient database should be characterized by the
West African Food Composition Table published by the FAO (Feed the Future, 2016). Foods
3
which are not characterized by the USDA standard reference nutrient database nor the
West African Food Composition Table may be characterized by country-specific resources
(Feed the Future, 2016). The WHO list includes several cruciferous vegetables i.e. from the
mustard family (Brassicaceae), which departs from some other characterizations of GLVs
(Steinmetz & Potter, 1996), but is likely to be more aligned with consumers perception of
what a GLV is for including crops like kale, Chinese cabbage (bok choy), and other leafy
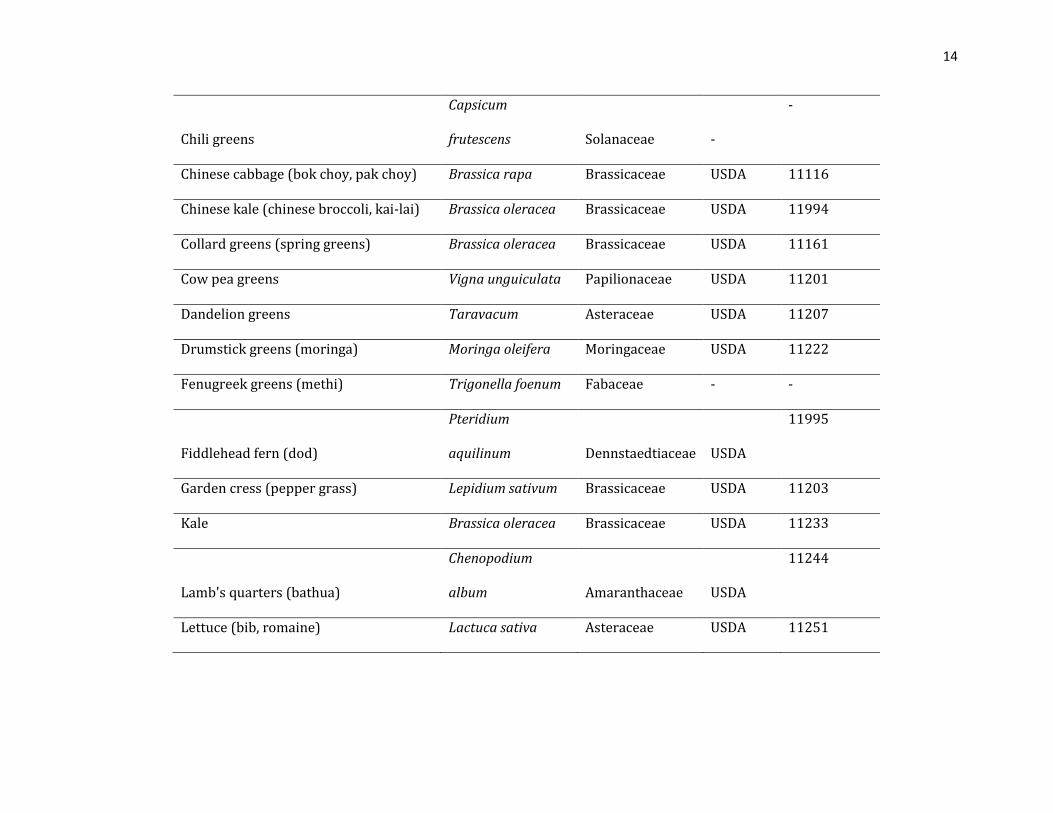
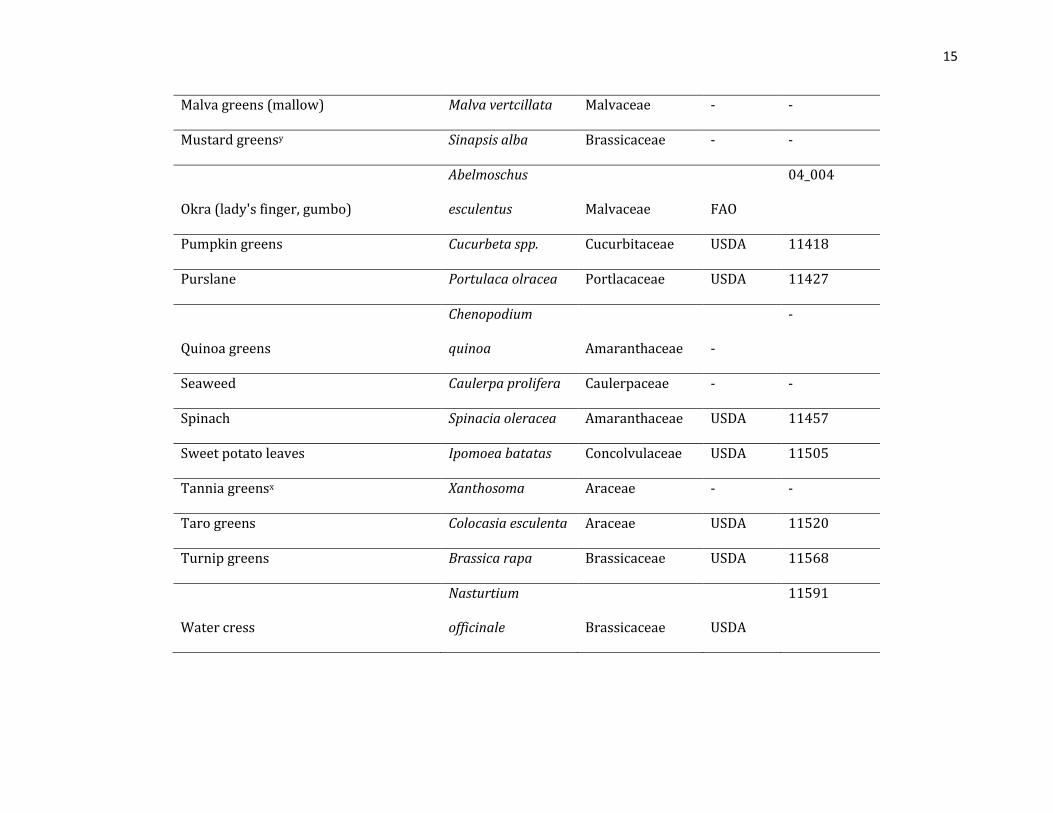
crucifers. The GLVs characterized by this review are listed in Table 1.1 with scientific name
to prevent ambiguity often created by common names, and specifies the database supplying
the information in subsequent tables.
The purpose of this review is to establish how to characterize GLVs with respect to
addressing specific micronutrients deficiencies is needed to support registered dieticians
and other health professionals to make dietary recommendations. This review is also
intended to support initiatives intending to reduce micronutrient deficiencies through the
promotion of GLVs.
A review of relevant data included the following: 1) an examination of regulations for
qualifying and identifying commodities as nutrient-rich; 2) an evaluation of the nutritional
composition of GLVs as presently reported by standard references; and 3) conclusions on
the potential impact of consuming GLVs for making inferences on health outcomes with
respect to micronutrient deficiencies.
1.2 Nutrition labeling and nutrient content claims of green leafy vegetables
Nutrient content claims are statements found on food products to distinguish foods as
a source of one or more nutrients in agreement with the nutrition label (Marinangeli et al.,
2017). Nutrient content claims have been shown to increase consumers’ perception of
healthfulness, perceived presence of healthful nutrients, and intentions to consume food
4
products (Iles, Nan, & Verrill, 2017). Nutritional labeling of fresh market produce in the
United States is voluntary at the discretion of the retailer (US Government Publishing
Office, 2002). This creates an information gap at the point of purchase for this commodity
class which is widely recommended to supplement micronutrients.
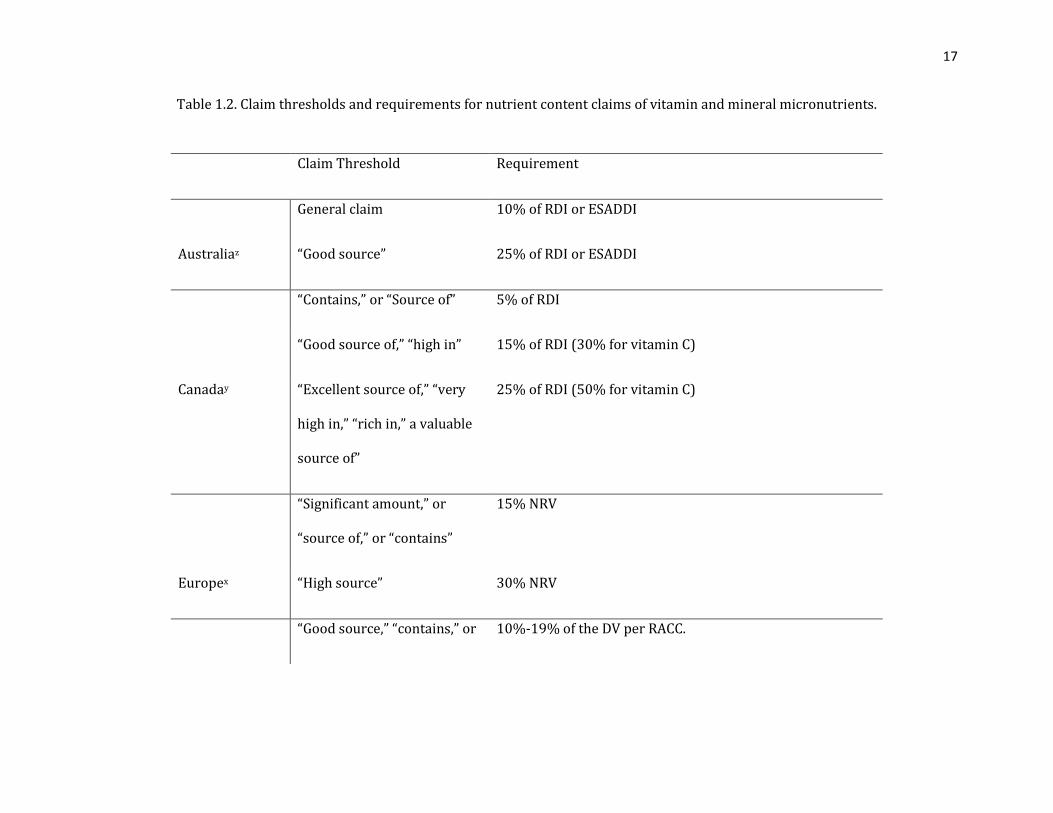
Country-specific and international labeling guidelines for nutritional content claims of
vitamins and minerals follow a similar pattern across jurisdictions, providing low and high
thresholds for characterizing foods for the expected contents of given micronutrient with
respect to jurisdiction-specific daily recommended consumption levels (Table 1.2
(Australian Government, 2016a; Canadian Food Inspection Agency, 2016; Codex
Alimentarius, 1997; European Union, 2006, 2011; Food and Drug Administration, 2013)).
Nutritional content claim criteria across jurisdictions differ slightly in threshold
requirements, though Codex Alimentarius and European requirements are the most
conservative with the exception of vitamin C requirements in Australia (Australian
Government, 2016b).
Foods which can make nutrient content claims have a greater role in public health
beyond customer influence. For studies applying FTF nutrition-sensitive indicators,
quantitative improvements of health status can be inferred by observed consumption of a
commodity which meets Codex Alimentarius high source thresholds for one or more
micronutrients identified by FTF as problem micronutrients (Feed the Future, 2016) that
has been documented as deficient in that region. The Codex Alimentarius Commission
(CAC) was established by the FAO and WHO Food Standards Programme. Feed the Future
methods for inferring health status improvement through observation of food consumption
using dietary surveys relies on thresholds described in Codex Alimentarius Guidelines for
Use of Nutrition and Health Claims.

5
The use of the most conservative international thresholds in this review should
position the considerations that follow to apply across demographics and professional
applications interested in the consumption- or consumption of GLV for health outcomes
associated with micronutrient adequacy. Codex thresholds, being inclusive of minimum
standards required to meet major regional and national requirements, may serve as a basis
for comparison of commodities.
1.3 Characterizations of green leafy vegetables for micronutrient thresholds
across selected commodities
The USDA Standard Nutrient Reference Database is the primary resource researchers
are directed to for determining whether a commodity meets this criterion (Feed the Future,
2016); in this review it is the first reference cited to characterize each of the commodities
listed on the non-comprehensive list of GLV provided by the WHO. Feed the Future further
instructs researchers to refer to the West African Food Composition Table assembled by the
FAO as needed, and then to any in-country ministry information that may be available
(Feed the Future, 2016).
The GLVs listed in the tables in this review are not comprehensive across the GLV
commodity class. Tables 1.2, 1.3, and 1.4 can be used for specifically characterizing
commodities which are included, and to a more-limited extent, for consideration as a
representative selection to consider how a randomly selected GLV might be characterized
for a given micronutrient. Micronutrients included do not include vitamin D or vitamin B12
as they are not known to occur in plants and are not assigned values other than in the case
of included “0” in databases.
“Dark green leafy vegetables” is an aggregate food category in both FAO and FTF
dietary diversity assessment survey tools (Feed the Future, 2016; Food and Agriculture
6
Organization, 2007). Green leafy vegetables as an aggregate class may be difficult to
characterize nutritionally due to including a diverse selection of commodities as well as an
effect of variety and the environment on the genetic expression relative to the accumulation
of minerals and vitamins within the edible plant part of commerce within specific
commodities (Byrnes, Dinssa, Weller, & Simon, 2017; Feed the Future, 2016). Different
cultures may often prefer different GLV commodities, making disaggregation essential.
Composition tables are known to vary widely. For analytical consistency, this review
refers primarily to USDA standard nutrient reference database and then to the FAO-
produced West African Food Composition Table to address foods from the WHO list which
are not included in the USDA database as per FTF protocols. Color-coded demonstration
(Tables 1.3 and 1.4) of “source” (light green) and “high source” (green) thresholds follows
Codex Alimentarius guidelines which can serve to inform for adherence to any of the highest
country or region thresholds, other than Vitamin C as per Australian regulations (Table 1.2),
being that it is at least as conservative as country guidelines and abides by international
organization guidelines for making health inferences (Codex Alimentarius, 1997; Feed the
Future, 2016). The following summary provides a short description of each vitamin and
mineral considered of importance for healthier diet and balanced nutrition.
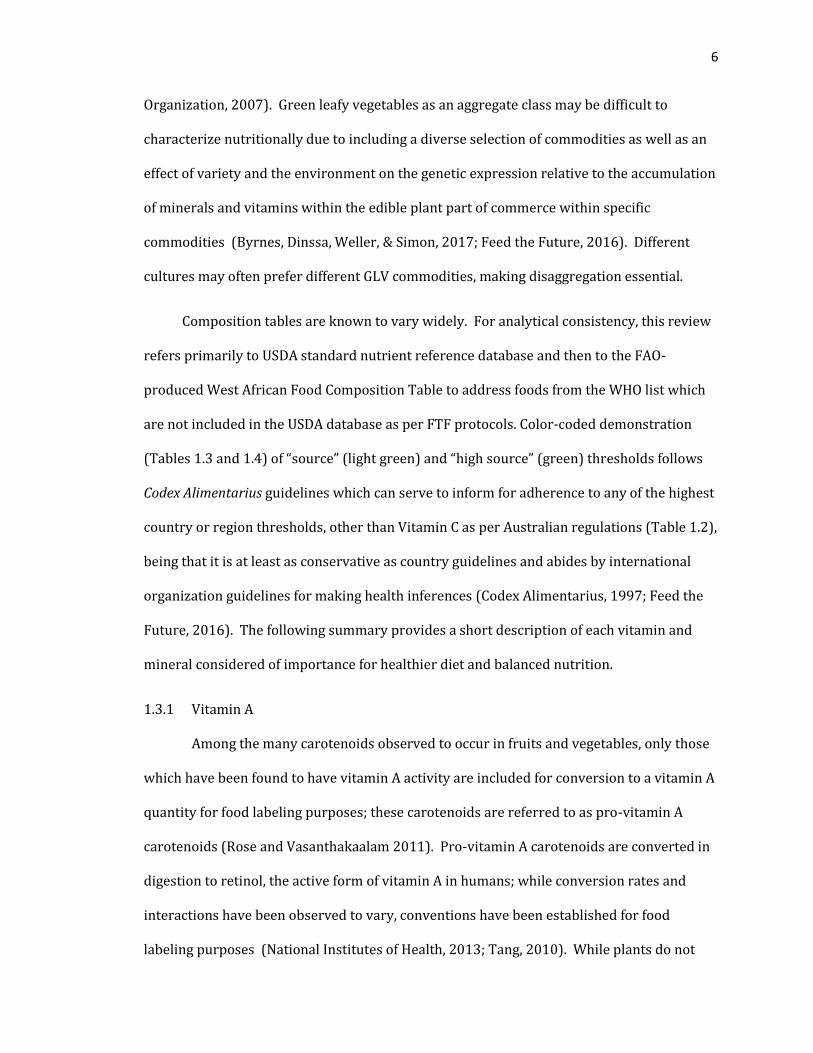
1.3.1 Vitamin A
Among the many carotenoids observed to occur in fruits and vegetables, only those
which have been found to have vitamin A activity are included for conversion to a vitamin A
quantity for food labeling purposes; these carotenoids are referred to as pro-vitamin A
carotenoids (Rose and Vasanthakaalam 2011). Pro-vitamin A carotenoids are converted in
digestion to retinol, the active form of vitamin A in humans; while conversion rates and
interactions have been observed to vary, conventions have been established for food
labeling purposes (National Institutes of Health, 2013; Tang, 2010). While plants do not
7
provide vitamin A directly, the converted quantities of pro-vitamin A carotenoids as µg
Vitamin A/100g will be discussed for consideration with international labeling conventions.
From the 31 GLV commodities with data on vitamin A, 16 commodities could be considered
high source, seven could be considered a source, and 8 did not contain enough to be
considered a source (Table 1.3).
The WHO instructs researchers who are assessing infant and young child feeding
practices to only include GLVs which can be characterized as sources of vitamin A by the
same guidelines defined for this review (World Health Organization, 2010). The FAO
explicitly describes GLVs as being rich in vitamin A, the WHO implicitly states as such (Food
and Agriculture Organization, 2007; World Health Organization, 2010), and in a review
paper with a less-inclusive definition of GLVs, all were categorized as adequately containing
carotenoids (Van Duyn & Pivonka, 2000). In partial agreement with those references, other
than for vitamin C and K, the GLVs included in this review do not meet or exceed source and
high source thresholds as frequently for any other micronutrient. However, from the list of
commodities provided by the WHO which the USDA or FAO had data to characterize for
vitamin A, only slightly greater than 50% were found to be known to contain enough pro-
vitamin A carotenoids to reasonably be expected to maintain or improve the health status of
an individual or region at risk or suffering from vitamin A deficiency i.e. exceeded the high
source threshold. Slightly under 25% were found to qualify for recognition as a source of
vitamin A at all, slightly under 25% do not meet or exceed the threshold to be recognized as
a source of vitamin A.
1.3.2 Thiamin
From the 32 commodities with data on thiamin, one could be considered high
source, seven could be considered a source, and 23 did not contain enough to be considered
a source.
8
1.3.3 Riboflavin
Out of the 32 commodities with data on riboflavin, seven could be considered high
source, 5 could be considered a source, and 19 did not contain enough to be considered a
source.
1.3.4 Niacin
Fiddlehead fern is the only standout commodity from those included in this review
to exceed the high source threshold for niacin. Bean greens (leaves of a bean plant) is the
only commodity that exceeded source threshold but was below the high source threshold
for niacin. The remaining 30 commodities with data for niacin had been found to contain an
insufficient quantity for source claims.
1.3.5 Pantothenic acid
Otherwise known as Vitamin B5 and occasionally as “pantothenate”, none of the
commodities in this review exceeded high source thresholds for pantothenic acid. Chicory
greens have been found to exceed the source threshold among the majority of commodities
well below this threshold. Eight commodities did not have data on pantothenic acid
including all which were sourced from the FAO database.
1.3.6 Folate
The GLV commodity class is often considered to be invariably rich in folate or folic
acid specifically (Van Duyn & Pivonka, 2000). Of the 31 commodities, seven were found to
exceed the high source threshold for folate, 13 were found to exceed the source threshold
but not the high source threshold, 10 contained an insufficient quantity to exceed the source
threshold. One commodity did not have data reported.
9
1.3.7 Vitamin C
All of the commodities included in this review were found to either exceed source,
or high source thresholds. Four commodities contained only enough to be considered
sources, while the remaining 27 contained enough to be considered high sources. Vitamin C
is the least stable vitamin, it degrades, before and during cooking as storage, processing,
exposure to oxygen and exposure to light are known to degrade this vitamin so the values in
Table 1.3 may not accurately indicate the amount delivered (deMan, 2000a).
1.3.8 Vitamin K
All of the commodities included in this review that had data reported for vitamin K
contained amounts substantially in excess above the high source threshold for vitamin K.
Many commodities had not been analyzed as this nutrient has become a priority in recent
years compared to many of the other micronutrients.
1.3.9 Calcium
The majority of GLVs were found not to exceed source thresholds for Ca content.
Eleven were found to exceed the source threshold for Ca and two, baobab greens and lambs
quarters have data reported which indicate these commodities to be the only two to exceed
the high source threshold.
1.3.10 Iron
The majority of GLVs contained an insufficient amount of Fe to be categorized as
either source or high source for this micronutrient. Eleven exceeded the source threshold,
but not the high source threshold. Only one commodity, cassava greens, was found to
exceed the high source threshold for Fe.
10
1.3.11 Magnesium
The majority of GLV commodities included in this review did not exceed the source
threshold, and none of the commodities exceeded the high source threshold. Thirteen
commodities were found to contain sufficient levels of Mg to be characterized as a source.
1.3.12 Zinc
None of the commodities included in this study were found to contain enough Zn to
be characterized as a source. One commodity did not have data reported. Bean greens had
the highest reported quantity of Zn, with 1.28 mg/100g, narrowly exceeding half the
quantity designated as the source threshold.
1.4 Discussion
Presently, there is disagreement between the expected and the reported
micronutrient content of GLV across commodities. Despite institutionally described
associations of GLVs with vitamins and minerals, most GLVs should not be expected to
readily deliver high source levels of any micronutrient, though the frequency of high-source
content in GLVs varies across micronutrients (Figure 1.1).
Plant traits are generally subject to genetic by environmental interactions, to this end
application of this data should be approached with skepticism without confirming
performance of a specific variety of a commodity across multiple environments, preferably
within each environment multiple times. Standard reference data and composition tables
are limited in this respect, limiting results and conclusions drawn by this review.
Green leafy vegetables are aggregated as a discrete category in survey methods used
to make health inferences on the regional, household, and individual level, indicating that
those, whether cultivated or locally harvested should include “vitamin-A rich” leaves,
although this is not explicitly defined (Feed the Future, 2016; Food and Agriculture
11
Organization, 2007; World Health Organization, 2010). The GLV commodity class is
described by FAO Dietary Diversity Questionnaire (2007) as wild and locally available,
“vitamin-A rich leaves such as amaranth, cassava leaves, kale, spinach, etc.”. Several GLVs
considered in this review would not be characterized as a source of Vitamin A, and nearly
half of the GLVs would not be considered a high source of Vitamin A. Disaggregation of
commodities in the GLV class should be considered for accurately assessing intake of
Vitamin A.
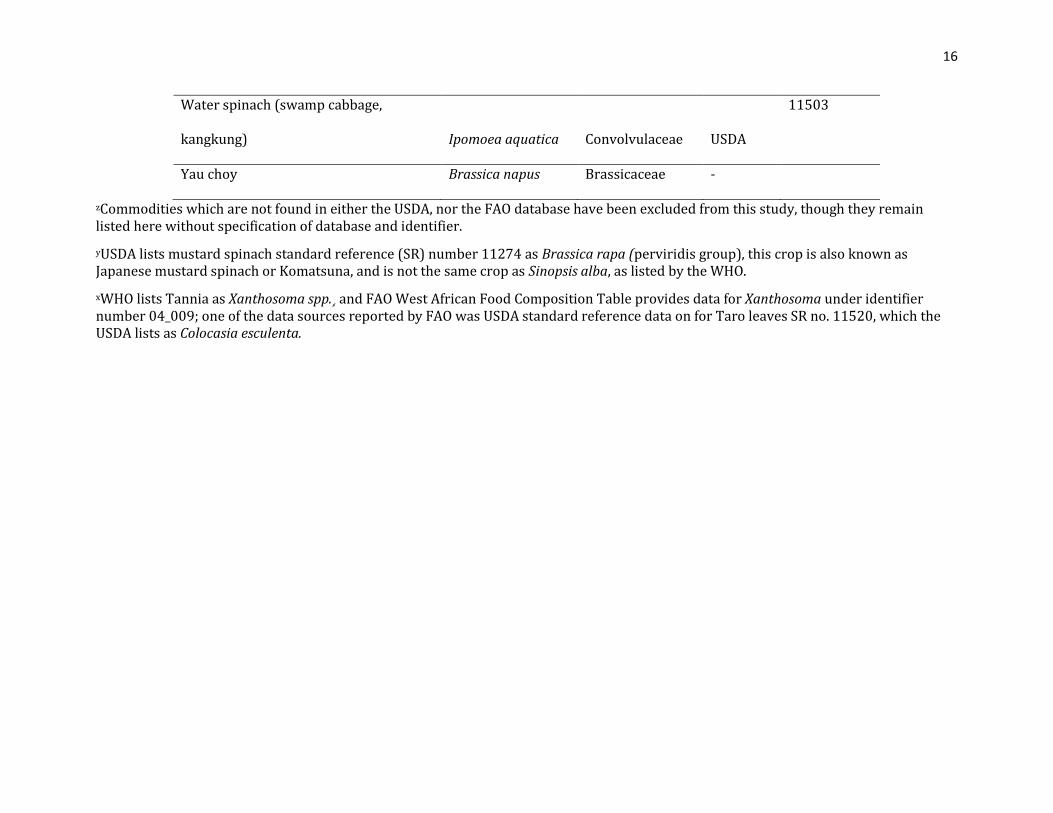
Green leafy vegetables are commonly associated with calcium content. The dietary
guidelines report from USDA highlights “mustard spinach” (Brassica rapa var. perviridis) as
a source of calcium (USDA, 2015a). This commodity was not reported in Table 1.4 as it is
not the same crop as mustard greens (Sinapsis alba) listed by the WHO (World Health
Organization, 2010). If Ca sources were judged by mg Ca/calorie, mustard spinach as
highlighted by the USDA, or other GLVs would lead this list otherwise populated largely by
dairy sources (USDA, 2015a).
1.5 Conclusions
The findings of this review indicate that substantial differences exist between GLVs.
and that these should often not be characterized as the same depending on the commodity
and micronutrient. This creates an issue when attempting to address dietary deficiencies if
incorrectly assuming a commodity has high source content of one or more micronutrients.
This may have the unintended consequence of precluding the timely development of
effective initiatives to improve health status in people with micronutrient deficiencies.
Greater consideration of the actual micronutrient content delivered is essential for
the successful implementation of programs addressing micronutrient deficiencies by
promoting the consumption of fruits and vegetables. Recognition of specific cultivars

12
selected for consistent delivery of high source levels of one or more micronutrients could
lend credibility to the current systems described in this review.
13
Table 1.1. Modified list of green leafy vegetables from World Vegetable Organization (WHO) (2010)
Common name Binomial or genus Family Databasez Identifier
Alfalfa leaves Medicago sativa Fabaceae - -
Amaranth greens (mchicha, xian cai) Amaranthus Amaranthaceae USDA 11003
Arugula Eruca sativa Brassicaceae USDA 11959
Balsam-pear (bitter gourd)
Momordica
charantia Cucurbitaceae USDA
11022
Baobab greens Adansonia Malvaceae FAO 04_001
Bean greens Phaseolus Fabaceae USDA 11597
Beet greens (swiss chard) Beta vulgaris Amaranthaceae USDA 11086
Bitter leaf (ewuro, ndole, onugbu) Vernonia calvoana Asteraceae FAO 04_022
Broccoli Brassica oleracea Brassicaceae USDA 11090
Broccoli rabe (broccoli raab) Brassica rapa Brassicaceae USDA 11096
Carrot greens Daucus carota Umbelliferae - -
Cassava greens Manihot esculenta Euphotbiaceae FAO 04_008
Chicory greens Cichorium intybus Asteraceae USDA 11152
14
Chili greens
Capsicum
frutescens Solanaceae -
-
Chinese cabbage (bok choy, pak choy) Brassica rapa Brassicaceae USDA 11116
Chinese kale (chinese broccoli, kai-lai) Brassica oleracea Brassicaceae USDA 11994
Collard greens (spring greens) Brassica oleracea Brassicaceae USDA 11161
Cow pea greens Vigna unguiculata Papilionaceae USDA 11201
Dandelion greens Taravacum Asteraceae USDA 11207
Drumstick greens (moringa) Moringa oleifera Moringaceae USDA 11222
Fenugreek greens (methi) Trigonella foenum Fabaceae - -
Fiddlehead fern (dod)
Pteridium
aquilinum Dennstaedtiaceae USDA
11995
Garden cress (pepper grass) Lepidium sativum Brassicaceae USDA 11203
Kale Brassica oleracea Brassicaceae USDA 11233
Lamb's quarters (bathua)
Chenopodium
album Amaranthaceae USDA
11244
Lettuce (bib, romaine) Lactuca sativa Asteraceae USDA 11251
15
Malva greens (mallow) Malva vertcillata Malvaceae - -
Mustard greensy Sinapsis alba Brassicaceae - -
Okra (lady's finger, gumbo)
Abelmoschus
esculentus Malvaceae FAO
04_004
Pumpkin greens Cucurbeta spp. Cucurbitaceae USDA 11418
Purslane Portulaca olracea Portlacaceae USDA 11427
Quinoa greens
Chenopodium
quinoa Amaranthaceae -
-
Seaweed Caulerpa prolifera Caulerpaceae - -
Spinach Spinacia oleracea Amaranthaceae USDA 11457
Sweet potato leaves Ipomoea batatas Concolvulaceae USDA 11505
Tannia greensx Xanthosoma Araceae - -
Taro greens Colocasia esculenta Araceae USDA 11520
Turnip greens Brassica rapa Brassicaceae USDA 11568
Water cress
Nasturtium
officinale Brassicaceae USDA
11591
16
Water spinach (swamp cabbage,
kangkung) Ipomoea aquatica Convolvulaceae USDA
11503
Yau choy Brassica napus Brassicaceae -
zCommodities which are not found in either the USDA, nor the FAO database have been excluded from this study, though they remain listed here without specification of database and identifier.
yUSDA lists mustard spinach standard reference (SR) number 11274 as Brassica rapa (perviridis group), this crop is also known as Japanese mustard spinach or Komatsuna, and is not the same crop as Sinopsis alba, as listed by the WHO.
xWHO lists Tannia as Xanthosoma spp.¸ and FAO West African Food Composition Table provides data for Xanthosoma under identifier number 04_009; one of the data sources reported by FAO was USDA standard reference data on for Taro leaves SR no. 11520, which the USDA lists as Colocasia esculenta.
17
Table 1.2. Claim thresholds and requirements for nutrient content claims of vitamin and mineral micronutrients.
Claim Threshold Requirement
General claim 10% of RDI or ESADDI
Australiaz “Good source” 25% of RDI or ESADDI
“Contains,” or “Source of” 5% of RDI
“Good source of,” “high in” 15% of RDI (30% for vitamin C)
Canaday “Excellent source of,” “very
high in,” “rich in,” a valuable
source of”
25% of RDI (50% for vitamin C)
“Significant amount,” or
“source of,” or “contains”
15% NRV
Europex “High source” 30% NRV
“Good source,” “contains,” or 10%-19% of the DV per RACC.

18
z(Australian Government, 2016a)
y(Canadian Food Inspection Agency, 2016)
x(European Union, 2006, 2011)
w(Food and Drug Administration, 2013)
v(Codex Alimentarius, 1997)
“provides”
“High,” “rich in,” or “excellent
source of”
20% or more of the DV per RACC
USAw “More,” “fortified,”
“enriched,” “added,” extra,”
or “plus”
10% or more of the DV per RACC than an appropriate
reference food.
“Source” 15% NRV
Codex
Alimentariusv
“High” 30% NRV
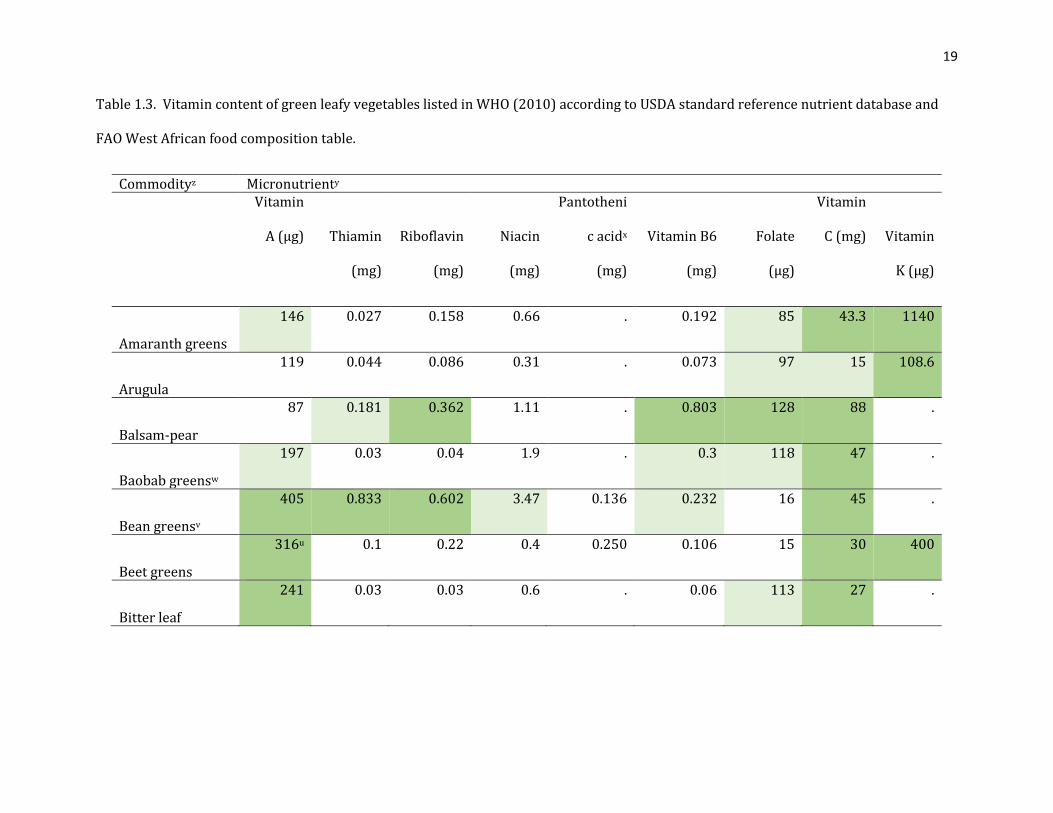
19
Table 1.3. Vitamin content of green leafy vegetables listed in WHO (2010) according to USDA standard reference nutrient database and
FAO West African food composition table.
Commodityz Micronutrienty
Vitamin
A (µg) Thiamin
(mg)
Riboflavin
(mg)
Niacin
(mg)
Pantotheni
c acidx
(mg)
Vitamin B6
(mg)
Folate
(µg)
Vitamin
C (mg) Vitamin
K (µg)
Amaranth greens
146 0.027 0.158 0.66 . 0.192 85 43.3 1140
Arugula
119 0.044 0.086 0.31 . 0.073 97 15 108.6
Balsam-pear
87 0.181 0.362 1.11 . 0.803 128 88 .
Baobab greensw
197 0.03 0.04 1.9 . 0.3 118 47 .
Bean greensv
405 0.833 0.602 3.47 0.136 0.232 16 45 .
Beet greens
316u 0.1 0.22 0.4 0.250 0.106 15 30 400
Bitter leaf
241 0.03 0.03 0.6 . 0.06 113 27 .
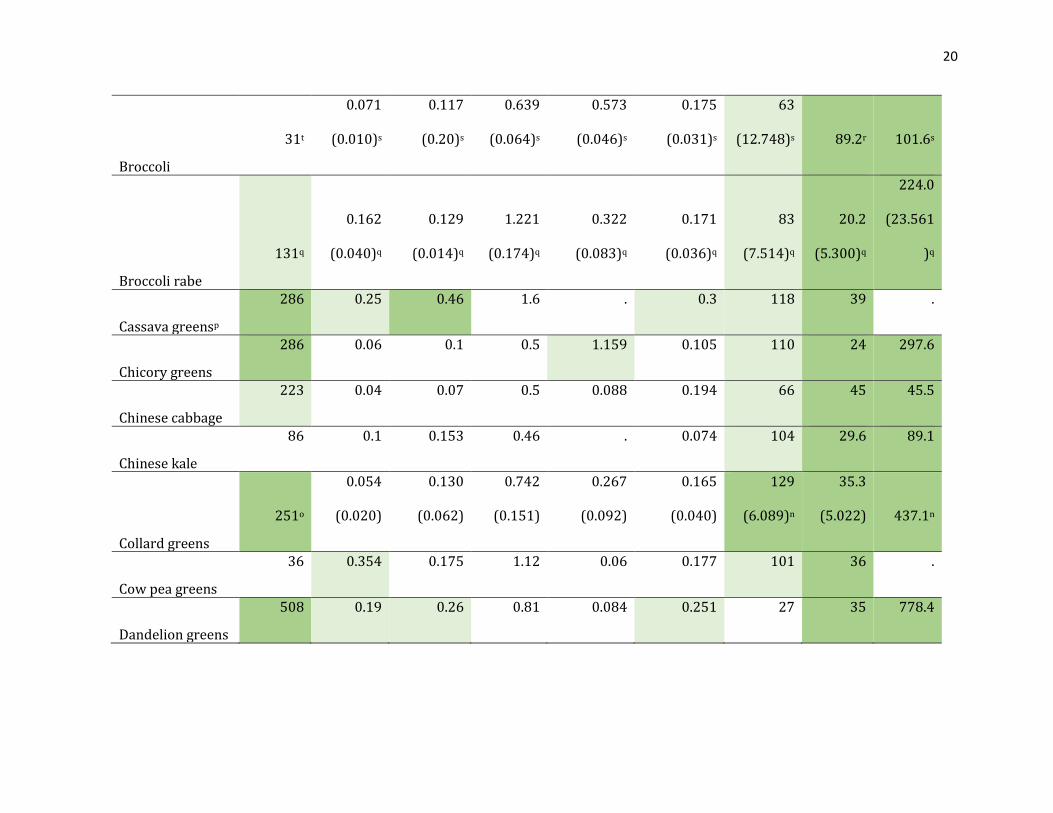
20
Broccoli
31t
0.071
(0.010)s
0.117
(0.20)s
0.639
(0.064)s
0.573
(0.046)s
0.175
(0.031)s
63
(12.748)s 89.2r 101.6s
Broccoli rabe
131q
0.162
(0.040)q
0.129
(0.014)q
1.221
(0.174)q
0.322
(0.083)q
0.171
(0.036)q
83
(7.514)q
20.2
(5.300)q
224.0
(23.561
)q
Cassava greensp
286 0.25 0.46 1.6 . 0.3 118 39 .
Chicory greens
286 0.06 0.1 0.5 1.159 0.105 110 24 297.6
Chinese cabbage
223 0.04 0.07 0.5 0.088 0.194 66 45 45.5
Chinese kale
86 0.1 0.153 0.46 . 0.074 104 29.6 89.1
Collard greens
251o
0.054
(0.020)
0.130
(0.062)
0.742
(0.151)
0.267
(0.092)
0.165
(0.040)
129
(6.089)n
35.3
(5.022) 437.1n
Cow pea greens
36 0.354 0.175 1.12 0.06 0.177 101 36 .
Dandelion greens
508 0.19 0.26 0.81 0.084 0.251 27 35 778.4
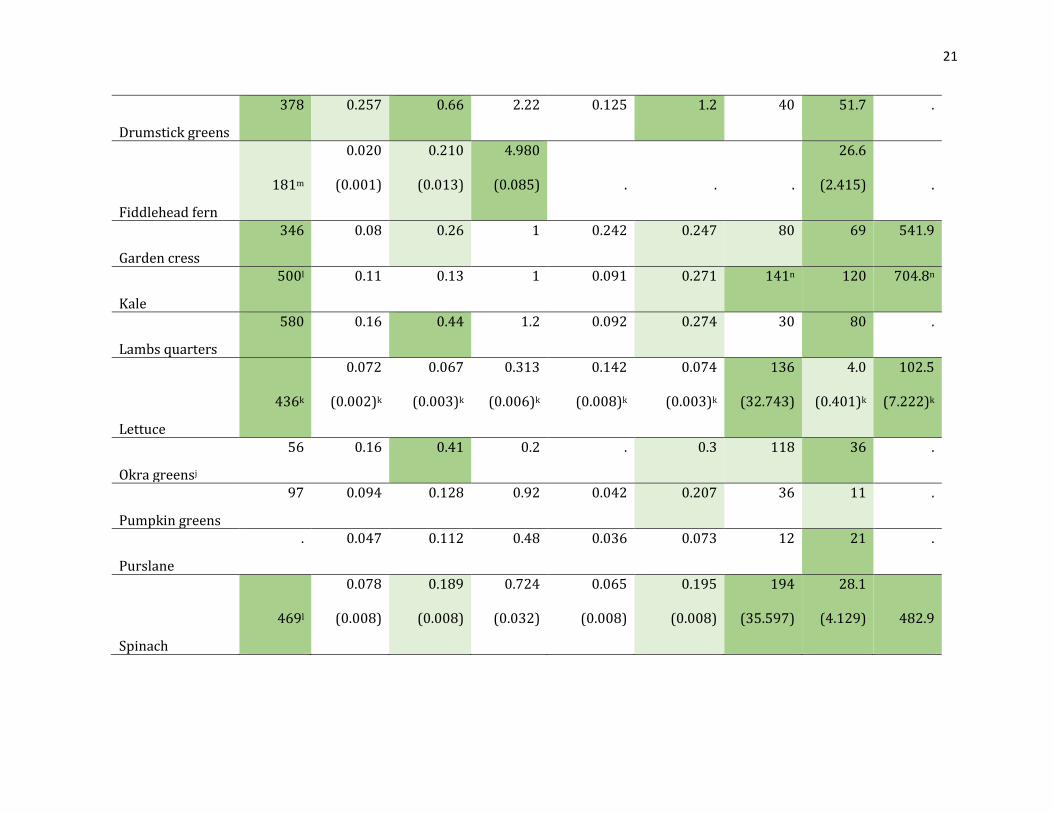
21
Drumstick greens
378 0.257 0.66 2.22 0.125 1.2 40 51.7 .
Fiddlehead fern
181m
0.020
(0.001)
0.210
(0.013)
4.980
(0.085) . . .
26.6
(2.415) .
Garden cress
346 0.08 0.26 1 0.242 0.247 80 69 541.9
Kale
500l 0.11 0.13 1 0.091 0.271 141n 120 704.8n
Lambs quarters
580 0.16 0.44 1.2 0.092 0.274 30 80 .
Lettuce
436k
0.072
(0.002)k
0.067
(0.003)k
0.313
(0.006)k
0.142
(0.008)k
0.074
(0.003)k
136
(32.743)
4.0
(0.401)k
102.5
(7.222)k
Okra greensj
56 0.16 0.41 0.2 . 0.3 118 36 .
Pumpkin greens
97 0.094 0.128 0.92 0.042 0.207 36 11 .
Purslane
. 0.047 0.112 0.48 0.036 0.073 12 21 .
Spinach
469l
0.078
(0.008)
0.189
(0.008)
0.724
(0.032)
0.065
(0.008)
0.195
(0.008)
194
(35.597)
28.1
(4.129) 482.9
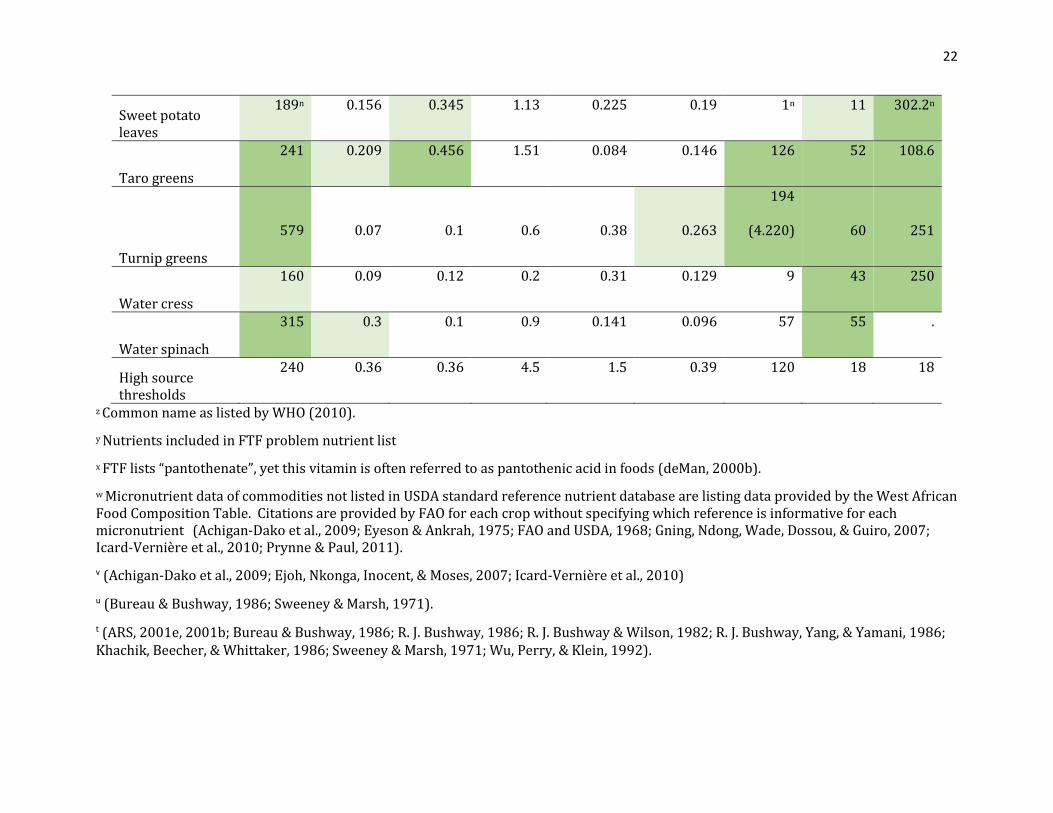
22
Sweet potato leaves
189n 0.156 0.345 1.13 0.225 0.19 1n 11 302.2n
Taro greens
241 0.209 0.456 1.51 0.084 0.146 126 52 108.6
Turnip greens
579 0.07 0.1 0.6 0.38 0.263
194
(4.220) 60 251
Water cress
160 0.09 0.12 0.2 0.31 0.129 9 43 250
Water spinach
315 0.3 0.1 0.9 0.141 0.096 57 55 .
High source thresholds
240 0.36 0.36 4.5 1.5 0.39 120 18 18
z Common name as listed by WHO (2010).
y Nutrients included in FTF problem nutrient list
x FTF lists “pantothenate”, yet this vitamin is often referred to as pantothenic acid in foods (deMan, 2000b).
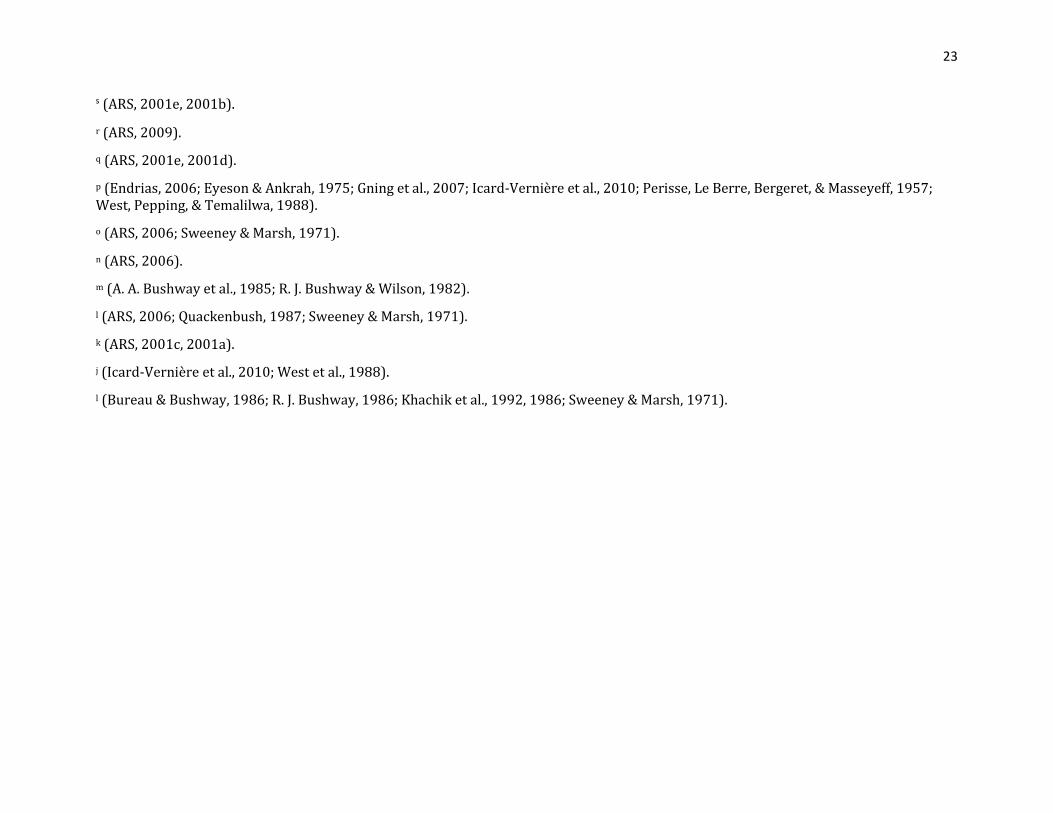
w Micronutrient data of commodities not listed in USDA standard reference nutrient database are listing data provided by the West African Food Composition Table. Citations are provided by FAO for each crop without specifying which reference is informative for each micronutrient (Achigan-Dako et al., 2009; Eyeson & Ankrah, 1975; FAO and USDA, 1968; Gning, Ndong, Wade, Dossou, & Guiro, 2007; Icard-Vernière et al., 2010; Prynne & Paul, 2011).
v (Achigan-Dako et al., 2009; Ejoh, Nkonga, Inocent, & Moses, 2007; Icard-Vernière et al., 2010)
u (Bureau & Bushway, 1986; Sweeney & Marsh, 1971).
t (ARS, 2001e, 2001b; Bureau & Bushway, 1986; R. J. Bushway, 1986; R. J. Bushway & Wilson, 1982; R. J. Bushway, Yang, & Yamani, 1986; Khachik, Beecher, & Whittaker, 1986; Sweeney & Marsh, 1971; Wu, Perry, & Klein, 1992).
23
s (ARS, 2001e, 2001b).
r (ARS, 2009).
q (ARS, 2001e, 2001d).
p (Endrias, 2006; Eyeson & Ankrah, 1975; Gning et al., 2007; Icard-Vernière et al., 2010; Perisse, Le Berre, Bergeret, & Masseyeff, 1957; West, Pepping, & Temalilwa, 1988).
o (ARS, 2006; Sweeney & Marsh, 1971).
n (ARS, 2006).
m (A. A. Bushway et al., 1985; R. J. Bushway & Wilson, 1982).
l (ARS, 2006; Quackenbush, 1987; Sweeney & Marsh, 1971).
k (ARS, 2001c, 2001a).
j (Icard-Vernière et al., 2010; West et al., 1988).
l (Bureau & Bushway, 1986; R. J. Bushway, 1986; Khachik et al., 1992, 1986; Sweeney & Marsh, 1971).
24
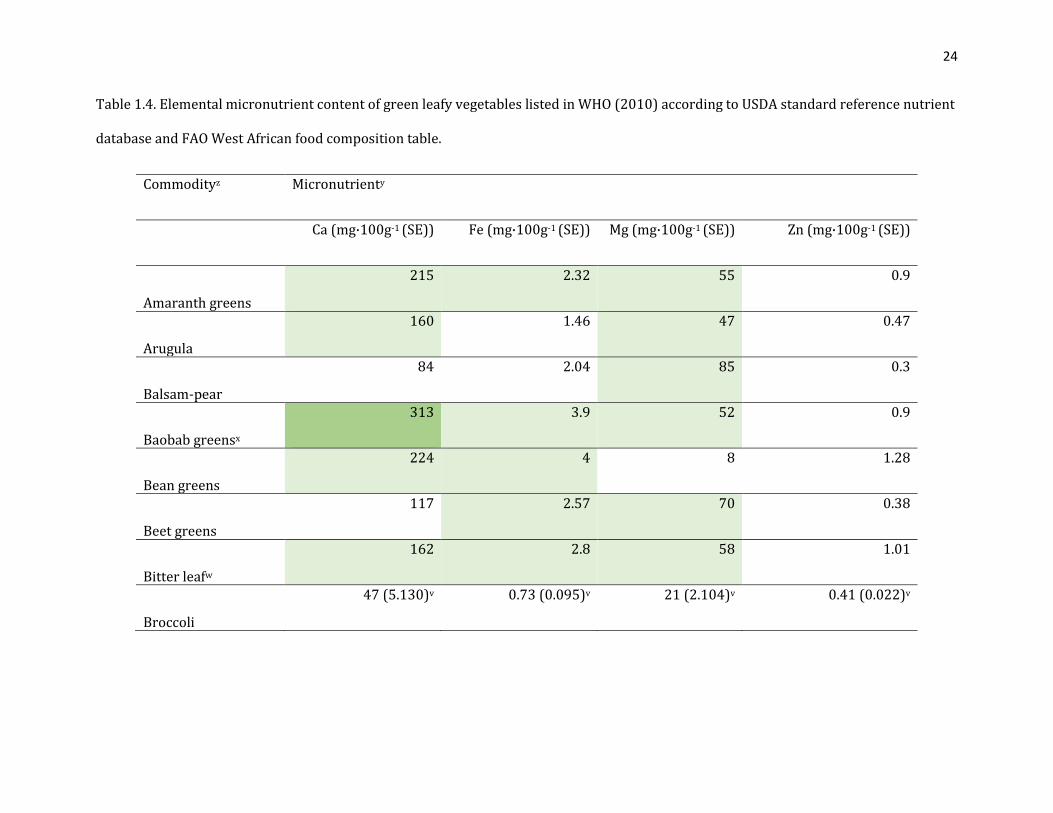
Table 1.4. Elemental micronutrient content of green leafy vegetables listed in WHO (2010) according to USDA standard reference nutrient
database and FAO West African food composition table.
Commodityz Micronutrienty
Ca (mg·100g-1 (SE)) Fe (mg·100g-1 (SE)) Mg (mg·100g-1 (SE)) Zn (mg·100g-1 (SE))
Amaranth greens
215 2.32 55 0.9
Arugula
160 1.46 47 0.47
Balsam-pear
84 2.04 85 0.3
Baobab greensx
313 3.9 52 0.9
Bean greens
224 4 8 1.28
Beet greens
117 2.57 70 0.38
Bitter leafw
162 2.8 58 1.01
Broccoli
47 (5.130)v 0.73 (0.095)v 21 (2.104)v 0.41 (0.022)v
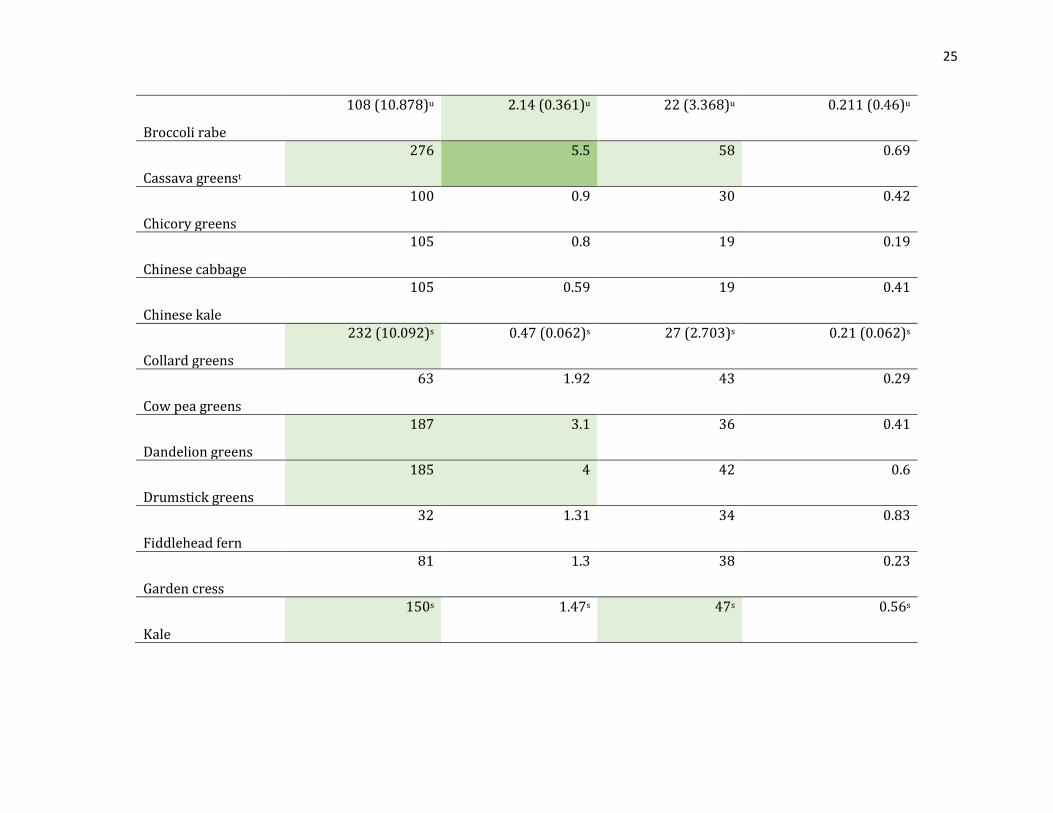
25
Broccoli rabe
108 (10.878)u 2.14 (0.361)u 22 (3.368)u 0.211 (0.46)u
Cassava greenst
276 5.5 58 0.69
Chicory greens
100 0.9 30 0.42
Chinese cabbage
105 0.8 19 0.19
Chinese kale
105 0.59 19 0.41
Collard greens
232 (10.092)s 0.47 (0.062)s 27 (2.703)s 0.21 (0.062)s
Cow pea greens
63 1.92 43 0.29
Dandelion greens
187 3.1 36 0.41
Drumstick greens
185 4 42 0.6
Fiddlehead fern
32 1.31 34 0.83
Garden cress
81 1.3 38 0.23
Kale
150s 1.47s 47s 0.56s
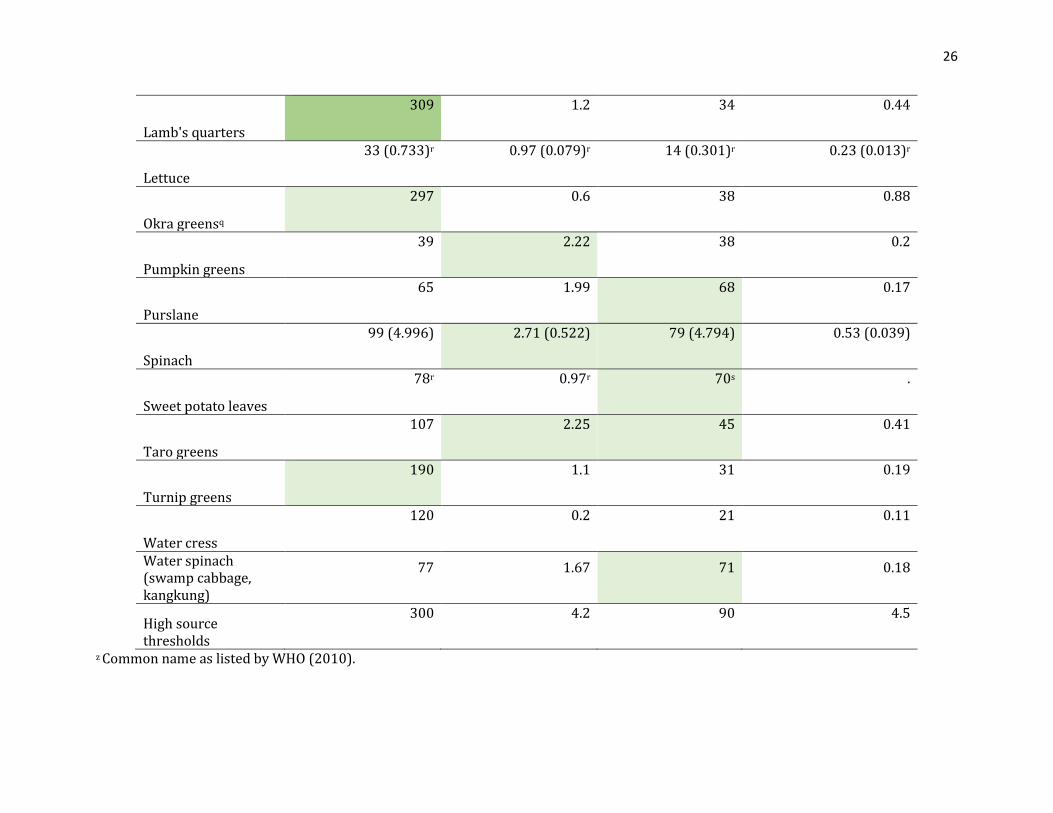
26
Lamb's quarters
309 1.2 34 0.44
Lettuce
33 (0.733)r 0.97 (0.079)r 14 (0.301)r 0.23 (0.013)r
Okra greensq
297 0.6 38 0.88
Pumpkin greens
39 2.22 38 0.2
Purslane
65 1.99 68 0.17
Spinach
99 (4.996) 2.71 (0.522) 79 (4.794) 0.53 (0.039)
Sweet potato leaves
78r 0.97r 70s .
Taro greens
107 2.25 45 0.41
Turnip greens
190 1.1 31 0.19
Water cress
120 0.2 21 0.11
Water spinach (swamp cabbage, kangkung)
77 1.67 71 0.18
High source thresholds
300 4.2 90 4.5
z Common name as listed by WHO (2010).
27
y Nutrients included in FTF problem nutrient list
x (Achigan-Dako et al., 2009; Eyeson & Ankrah, 1975; FAO and USDA, 1968; Gning et al., 2007; Icard-Vernière et al., 2010; Prynne & Paul, 2011).
w (Achigan-Dako et al., 2009; Ejoh et al., 2007; Icard-Vernière et al., 2010).
v (ARS, 2001e, 2001b).
u (ARS, 2001e, 2001d).
t (Endrias, 2006; Eyeson & Ankrah, 1975; Gning et al., 2007; Icard-Vernière et al., 2010; Perisse et al., 1957; West et al., 1988).
s (ARS, 2006).
r (ARS, 2001c, 2001a).
q (Icard-Vernière et al., 2010; West et al., 1988).
28
Figure 1.1. Percent of WHO-listed dark green leafy vegetables with “high source”, “source”, and below-“source” levels for each FTF-
identified problem micronutrient.
0%
10%
20%
30%
40%
50%
60%
70%
80%
90%
100%
high source source non-source
29
1.6 References
Achigan-Dako, E., Pasquini, M., Assogba-Comlan, F., Sognigbé, N., Dansi, A., & Ambrose-Oji, B. (2009). Traditional vegetables in Benin: Diversity, distribution, ecology, agronomy and utilisation.
ARS. (2001a). USDA National Food and Nutrient Analysis Program Wave 5d. Nutrient Data Laboratory.
ARS. (2001b). USDA National Food and Nutrient Analysis Program Wave 5f. Nutrient Data Laboratory.
ARS. (2001c). USDA National Food and Nutrient Analysis Program Wave 5g. Nutrient Data Laboratory.
ARS. (2001d). USDA National Food and Nutrient Analysis Program Wave 5i. Nutrient Data Laboratory.
ARS. (2001e). USDA National Food and Nutrient Analysis Program Wave 5n. Nutrient Data Laboratory.
ARS. (2006). USDA National Food and Nutrient Analysis Program Wave 10j. Nutrient Data Laboratory.
ARS. (2009). USDA National Food and Nutrient Analysis Program Wave 14c. Nutrient Data Laboratory.
Australian Government. (2016a). Australia New Zealand Food Standards Code – Schedule 4 – Nutrition, health and related claims. https://www.legislation.gov.au/Details/F2016C00189
Australian Government. (2016b). Australia New Zealand Food Standards Code – Schedule 4 – Nutrition, health and related claims.
Best, C., Neufingerl, N., Del Rosso, J. M., Transler, C., van den Briel, T., & Osendarp, S. (2011). Can multi-micronutrient food fortification improve the micronutrient status, growth, health, and cognition of schoolchildren? A systematic review. Nutrition Reviews, 69(4), 186–204. http://doi.org/10.1111/j.1753-4887.2011.00378.x
Bureau, J. L., & Bushway, R. J. (1986). HPLC Determination of Carotenoids in Fruits and Vegetables in the United States. Journal of Food Science, 51(1), 128–130. http://doi.org/10.1111/j.1365-2621.1986.tb10851.x
Bushway, A. A., Serreze, D. V., McGann, D. F., True, R. H., Work, T. M., & Bushway, R. J. (1985). Effect of Processing Method and Storage Time on the Nutrient Composition of Fiddlehead Greens. Journal of Food Science, 50(5), 1491–1492. http://doi.org/10.1111/j.1365-2621.1985.tb10508.x
Bushway, R. J. (1986). Determination of a-and b-carotene in some raw fruits and vegetables by high-performance liquid chromatography. J. Agric. Food Chem, 34, 409–412. https://pubs.acs.org/doi/pdf/10.1021/jf00069a006
Bushway, R. J., & Wilson, A. M. (1982). Determination of α– and β–Carotene in Fruit and Vegetables by High Performance Liquid Chromatography. Canadian Institute of Food Science and Technology Journal, 15(3), 165–169. http://doi.org/10.1016/S0315-
30
5463(82)72531-3
Bushway, R. J., Yang, A., & Yamani, A. M. (1986). Comparison of Alpha- and Beta- Carotene content of supermarket versus roadside produce. Journal of Food Quality, 9(6), 437–443. http://doi.org/10.1111/j.1745-4557.1986.tb00813.x
Byrnes, D. R., Dinssa, F. F., Weller, S. C., & Simon, J. E. (2017). Elemental Micronutrient Content and Horticultural Performance of Various Vegetable Amaranth Genotypes. Journal of the American Society for Horticultural Science, 142(4), 265–271. http://doi.org/10.21273/JASHS04064-17
Canadian Food Inspection Agency. (2016). Specific nutrient content claim requirements: Vitamin and mineral nutrient claims. http://www.inspection.gc.ca/food/labelling/food-labelling-for-industry/nutrient-content/specific-claim-requirements/eng/1389907770176/1389907817577?chap=13#s13c13
Codex Alimentarius. (1997). Guidelines for Use of Nutrition and Health Claims. Guidelines for Use of Nutrition and Health Claims, CAC/GL 23-. http://www.fao.org/fao-who-codexalimentarius/sh-proxy/en/?lnk=1&url=https%3A%2F%2Fworkspace.fao.org%2Fsites%2Fcodex%2FStandards%2FCAC+GL+23-1997%2FCXG_023e.pdf
deMan, J. M. (2000a). Principles of food chemistry. In Principles of food chemistry (3rd ed., p. 368). Gaithersburg, Marlyand: Aspen Publishers.
deMan, J. M. (2000b). Principles of food chemistry. In Principles of food chemistry (3rd ed., pp. 383–385). Gaithersburg, Maryland: Aspen Publishers.
Ejoh, R. A., Nkonga, D. V., Inocent, G., & Moses, M. C. (2007). Nutritional components of some non-conventional leafy vegetables consumed in Cameroon. Pakistani Journal of Nutrition, 712–717. http://citeseerx.ist.psu.edu/viewdoc/summary?doi=10.1.1.559.4456
Endrias, A. (2006). Bio-raffinage de plantes aromatiques et médicinales appliqué à l’Hibiscus sabdariffa L. et à l’Artemisia annua. National Polytechnic Institute of Toulouse. http://oatao.univ-toulouse.fr/7484/1/endrias.pdf
European Union. (2006). Regulation (EC) No 1924/2006 of the European parliament and of the council on nutrition and health claims made on foods. Official Journal of the European Union, 20(12). http://eur-lex.europa.eu/legal-content/EN/TXT/PDF/?uri=CELEX:32006R1924&from=en
European Union. (2011). Regulation (EC) No 1169/2011 of the European parliament and of the council on nutrition and health claims made on foods, 22(11). http://eur-lex.europa.eu/legal-content/EN/TXT/PDF/?uri=CELEX:32011R1169&from=EN
Eyeson, K. K., & Ankrah, E. . (1975). Composition of foods commonly used in Ghana. Accra, Ghana: Council for Scientific and Industrial Research.
FAO. (2002). Food-based approaches to meeting vitamin and mineral needs. In: Human vitamin and mineral requirements. Rome. http://www.fao.org/docrep/004/Y2809E/y2809e00.htm#Contents
FAO and USDA. (1968). Food composition table for use in Africa.
31
http://www.fao.org/docrep/003/X6877E/X6877E00.htm
Feed the Future. (2016). Feed the Future Indicator Handbook Definition Sheets. https://feedthefuture.gov/sites/default/files/resource/files/Feed_the_Future_Indicator_Handbook_Sept2016.pdf
Food and Agriculture Organization. (2007). Dietary Diversity Questionnaire. Nutrition and Consumer Protection Division.
Food and Drug Administration. (2013). A food labeling guide: Guidance for industry. www.fda.gov/FoodLabelingGuide
Gning, R. D., Ndong, M., Wade, S., Dossou, N., & Guiro, A. T. (2007). Valeur Nutritionnelle du Moringa oleifera, étude de la Biodisponibilite du fer, Effet de L’enrichissement de Divers Plats Traditionnels Sénégalais avec la Poudre des Feuilles. African Journal of Food, Agriculture, Nutrition and Development, 7(3), 1–17.
Icard-Vernière, C., Ouattara, L., Avallone, S., Hounhouigan, J., Amoussa, W., Kayodé, P., & Ba Hama, F. (2010). Traditional recipes of millet-, sorghum-, and maize-based dishes and related sauces frequently consumed by young children in Burkina Faso and Benin. (M.-R. C. Greffeuille V., Ed.).
Iles, I. A., Nan, X., & Verrill, L. (2017). Nutrient Content Claims: How They Impact Perceived Healthfulness of Fortified Snack Foods and the Moderating Effects of Nutrition Facts Labels. Health Communication, 1–9. http://doi.org/10.1080/10410236.2017.1351277
Khachik, F., Beecher, G. R., & Whittaker, N. F. (1986). Separation, Identification, and Quantification of the Major Car0 t enoid and Chlorophyll Constituents in Extracts of Several Green Vegetables by Liquid Chromatography’. J. Agric. Food Chem, 3(4), 603–616. https://pubs.acs.org/doi/pdf/10.1021/jf00070a006
Khachik, F., Mudlagiri, J., Goli, B., Beecher, G. R., Holden, J., Lusby, W. R., … Barrera#, M. R. (1992). Effect of Food Preparation on Qualitative and Quantitative Distribution of Major Carotenoid Constituents of Tomatoes and Several Green Vegetables. J. Agric. Food Chem, 40, 390–398. https://pubs.acs.org/doi/pdf/10.1021/jf00015a006
Marinangeli, C. P. F., Curran, J., Barr, S. I., Slavin, J., Puri, S., Swaminathan, S., … Patterson, C. A. (2017). Enhancing nutrition with pulses: defining a recommended serving size for adults. Nutrition Reviews, 75(12), 990–1006. http://doi.org/10.1093/nutrit/nux058
Miller, B. D. D., & Welch, R. M. (2013). Food system strategies for preventing micronutrient malnutrition. Food Policy, 42, 115–128. http://doi.org/10.1016/J.FOODPOL.2013.06.008
National Institutes of Health. (2013). Vitamin A: Fact Sheet for Health Professionals. Office of Dietary Supplements. http://ods.od.nih.gov/factsheets/VitaminA-HealthProfessional/
Perisse, J., Le Berre, S., Bergeret, B., & Masseyeff, R. (1957). Tables de Composition de quelques aliments tropicaux. Annales de La Nutrition et de l’Alimentation, 11(5). http://horizon.documentation.ird.fr/exl-doc/pleins_textes/pleins_textes_5/b_fdi_08-09/10438.pdf
Prynne, C. J., & Paul, A. A. (2011). Food Composition Table for use in The Gambia. Medical Research Council Human Nutrition Research. http://www.fao.org/fileadmin/templates/food_composition/documents/pdf/Gambia
32
04082011.pdf
Quackenbush, W. F. (1987). Reverse Phase HPLC Separation of Cis-and Trans-Carotenoids and Its Application to β-Carotenes in Food Materials. Journal of Liquid Chromatography, 10(4), 643–653. http://doi.org/10.1080/01483918708069015
Rosso, J. M. Del, & Marek, T. (1996). Class Action: Improving School Performance in the Developing World Through Better Health and Nutrition. Washington D.C.: The World Bank. https://books.google.com/books?hl=en&lr=&id=XeY4-Y15cCgC&pgis=1
Steinmetz, K. A., & Potter, J. D. (1996). Vegetables, Fruit, and Cancer Prevention. Journal of the American Dietetic Association, 96(10), 1027–1039. http://doi.org/10.1016/S0002-8223(96)00273-8
Sweeney, J. P., & Marsh, A. C. (1971). Journal of the American Dietetic Association. Journal of the American Dietetic Association (Vol. 59). American Dietetic Association. https://www.cabdirect.org/cabdirect/abstract/19481401107
Tang, G. (2010). Bioconversion of dietary provitamin A carotenoids to vitamin A in humans. The American Journal of Clinical Nutrition, 91(5), 1468S–1473S. http://doi.org/10.3945/ajcn.2010.28674G
Tengs, T. O., Adams, M. E., Pliskin, J. S., Safran, D. G., Siegel, J. E., Weinstein, M. C., & Graham, J. D. (1995). Five-Hundred Life-Saving Interventions and Their Cost-Effectiveness. Risk Analysis, 15(3), 369–390. http://doi.org/10.1111/j.1539-6924.1995.tb00330.x
UN. (2016). Zero hunger: Why it matters. http://www.un.org/sustainabledevelopment/wp-content/uploads/2016/08/2_Why-it-Matters_ZeroHunger_2p.pdf
US Government Publishing Office. (2002). Nutritional labeling of food-exemptions. Nutrition labeling of raw fruit, vegetables, and fish. Section 101.42. Code of Federal Regulations, 21. https://www.gpo.gov/fdsys/pkg/CFR-2002-title21-vol2/pdf/CFR-2002-title21-vol2-part101.pdf
USDA. (2010). Fresh fruit and vegetable program: A handbook for schools. https://fns-prod.azureedge.net/sites/default/files/handbook.pdf
USDA. (2015a). Dietary guidelines for Americans 2015-2020: Appendix 11. Food sources of calcium. https://health.gov/dietaryguidelines/2015/guidelines/appendix-11/
USDA. (2015b). Dietary Guidelines for Americans 2015-2020: Chatper 2. Shifts needed to align with healthy eating patterns. https://health.gov/dietaryguidelines/2015/guidelines/chapter-2/a-closer-look-at-current-intakes-and-recommended-shifts/#table-2-1
Van Duyn, M. A., & Pivonka, E. (2000). Overview of the Health Benefits of Fruit and Vegetable Consumption for the Dietetics Professional. Journal of the American Dietetic Association, 100(12), 1511–1521. http://doi.org/10.1016/S0002-8223(00)00420-X
West, C. E., Pepping, F., & Temalilwa, C. R. (1988). The composition of foods commonly eaten in East Africa. Dar es Salaam, Tanzania.
WHO. (2002). The world health report 2002: Reducing risks, promoting healthy life. Geneva.
World Food Programme. (2018). Home grown school meals. Retrieved February 23, 2018,
33
from http://www1.wfp.org/home-grown-school-meals
World Health Organization. (2010). Indicators for assessing infant and young child feeding practices. http://apps.who.int/iris/bitstream/10665/44306/1/9789241599290_eng.pdf
World Health Organization, F. and A. O. (2004). Vitamin and mineral requirements in human nutrition. http://apps.who.int/iris/bitstream/10665/42716/1/9241546123.pdf
Wu, Y., Perry, A. K., & Klein, B. P. (1992). Vitamin C and B-carotene in fresh and frozen green beans and broccoli in a simulated system. Journal of Food Quality, 15(2), 87–96. http://doi.org/10.1111/j.1745-4557.1992.tb00977.x
34
Chapter 2 Elemental Micronutrient Content and Horticultural
Performance of Various Vegetable Amaranth Genotypes†
2.1 Introduction
Vegetable amaranth (Amaranthus sp.) is a mostly self-pollinated, diploid eukaryote
with C4 photosynthesis known to be consumed in over 50 countries, primarily across sub-
Saharan Africa, South Asia, and Southeast Asia (Achigan-Dako et al., 2014; Jain et al., 1982;
National Resource Council, 2006). Vegetable amaranth is commonly cited as having
unrealized potential to deliver mineral and vitamin micronutrients as well as protein to at-
risk populations in regions with high rates of nutritional deficiencies (Weller et al., 2015).
Previous studies have shown success in selecting for increased Fe and Zn content in
rice (Oryza sativa) without consequence to yield performance; these entries of rice were
later observed to be effective as a food source for the improvement of human nutrition
(Gregorio et al., 2000; Haas et al., 2005). Sufficient variability has also been shown to exist
within the wheat (Triticum aestivum) germplasm to allow for selection of high-Fe and high-
Zn entries (Cakmak et al., 2000). The genotype x environment interaction (GEI) effect is a
potential issue in selecting for stable performance in any trait for plant breeders (Crossa,
2012; Gregorio et al., 2000). Following the observation of sufficient variability to select for
high-mineral-content entries, studies have shown sufficiently low GEI effect on mineral
content to facilitate successful selection for stable performance in maize (Zea mays) and
wheat (Feil et al., 2005; Velu et al., 2012). Observing whether sufficient variability in the
germplasm exists to select vegetable amaranth, or otherwise concluding that no further
selection is needed for these traits is the correct activity to initially assess the viability of
using this crop as a tool for improving human nutrition.
35
† This chapter was published in the Journal of the American Society for Horticultural Science, July 2017, vol. 142 no. 4 265-271.
A fundamental advantage of delivering micronutrients through staple crops is that it
is recognized as less expensive than supplementation programs (Masuda et al., 2012).
However, micronutrients are typically not accumulated in high concentrations in either seed
or root/tuber tissue, making staple crops less easily bred or selected for delivering one or
more micronutrients associated with common deficiencies; whereas leaf tissue is often
observed to contain some level of most or all micronutrients (Beyer, 2010). Leafy green
vegetables may have the inherent advantage of being readily selectable for high
accumulation of multiple micronutrients.
Codex Alimentarius Guidelines for Use of Nutrition and Health Claims have defined
“high source” thresholds to indicate the capacity to deliver daily required amounts of these
targeted micronutrients by consuming a reasonable amount of material; i.e., 30% nutrient
reference value (NRV) per 100 g (Codex Alimentarius, 1997). Crops which are recognized as
being high source by this definition for a given micronutrient are most promising to
improve nutrition status in populations with a known deficiency of that micronutrient (Feed
the Future, 2014). For the purpose of this study, breeding targets were set as the high
source thresholds per nutrient trait by Codex Alimentarius definitions: 4.2 mg/100 g Fe, 90
mg/100 g Mg, 300 mg/100 g Ca, and 4.5 mg/100 g Zn, by fresh weight basis.
Previous studies have evaluated vegetable amaranth for nutrition content and field
performance with substantial variability observed from one study to another (Achigan-
Dako et al., 2014; Luoh et al., 2014; Schönfeldt and Pretorius, 2011; Shukla et al., 2006,
2010). Variability reported among these studies may be due to environmental conditions,
genetics of lines evaluated, processing, and methods of nutritional analysis. It remains
unclear how to characterize this crop for inclusion in nutrition improvement projects,
36
especially without consideration of the most recently developed World Vegetable Center
(WorldVeg) lines and progenitors of cultivars for distribution in sub-Sahara Africa which
have been included in this study.
In this study, the effect of genotype was observed on horticultural performance and
nutrition content of four elements: Fe, Mg, Zn, and Ca, recognized as among the most
commonly deficient in humans (World Health Organization, 2002, 2009, 2017).
Horticultural traits observed include total yield, marketable yield, marketable percentage,
plant height, and canopy spread. Marketable yield is an arguable term being that this crop
is often sold with the full stem, with or without roots attached. In this study, marketable
yield was differentiated from the total yield and consists of only the leaves and tender stems
which would typically be marketed and eaten. Quantifying the marketable yield and
percentage for vegetable amaranth and other underdeveloped leafy green vegetables is an
important performance trait given the high proportion of stems that are not typically
consumed or desirable (National Resource Council, 2006). Yield observations limited to
above-ground biomass alone would fail to distinguish rank order for economic or
consumable yields which may provide greater value for both producers and consumers.
California standards allow 18% stem by mass for spinach (Spinacia oleracea) yield
reporting using a similar harvest method to allow regrowth for successive harvests (Koike
et al., 2011).
Evaluation of the materials in this study under tropical and temperate climactic
zones provides unique opportunity to understand the extent of their adaptation. This study
is intended to verify genotype effect by repeatedly observing the effect of genotype across
these environmental conditions with varying entries. Data presented in this study may be
37
considered as a speculative basis for indicating effect of GEI for entries observed in common
across trials but should not be considered conclusive.
The inclusion of advanced WorldVeg lines, commercial entries, and genetic
resources from the U.S. Department of Agriculture (USDA) in this study makes observation
of these entries particularly relevant for guiding recommendations in selections of
vegetable amaranth and future screening priorities toward utilizing vegetable amaranth for
improving human nutrition. The selection for nutritional content and horticultural
performance from advanced WorldVeg lines, breeding materials from the USDA, or both
may facilitate using vegetable amaranth as a cost-effective delivery mechanism for essential
micronutrients.
The purpose of this study was to understand the importance of screening for
micronutrient content to inform breeders how to treat micronutrient content as criteria for
selection in addition to basic horticultural performance. Given sufficient variation of
micronutrient content, the development of new lines through plant breeding is recognized
as an economic strategy to improve the nutritional status of undernourished people (Mayer
et al., 2008).
2.2 Materials and Methods
2.2.1 Plant Materials
Vegetable amaranth entries observed in this study were sourced from USDA,
WorldVeg, private seed companies, an accession (RUAM44) collected in New Jersey (NJ),
and a Rutgers University advanced breeding line (RUAM24). These entries consist of
various species of amaranth, namely, Amaranthus caudatus, A. cruentus, A. dubius, A.
hybridus, A. hypochondriacus, A. retroflexus, and A. tricolor, and were analyzed for foliar
38
micronutrient content and horticultural parameters across three field trials (Table 1).
Twenty entries were evaluated at Pittstown, NJ in 2013; 12 entries at Arusha, Tanzania in
2014; and 20 entries at Pittstown, NJ in 2015.
2.2.2 Experimental Locations
The experiment in Arusha, Tanzania was carried out on-station at WorldVeg,
eastern and southern Africa (lat. 36.8ºE, long. 3.4°S, 1290 m elevation) in 2014. The site is
characterized by well-drained clay loam soil with pH 6.4. Seedlings in Arusha, Tanzania
were grown in 72-cell trays with sterilized media composed of forest soil/compost, manure,
sand, and rice husks in a ratio of 3:2:1:1 by mass. 20N–4.4P–8.3K fertilizer was applied to
beds in Arusha at 200 kg·ha-1 prior to transplanting on 7 Aug. 2014. Furrow irrigation was
applied as needed. Urea (46N-0P-0K) was applied 3 weeks after transplanting at 120kg·ha-1.
The experiments in NJ were conducted at Snyder Research and Extension Farm in
Pittstown, NJ (lat. 40.6°N, long. 75.0°W, 116 m elevation) in 2013 and 2015. The soil at this
site is characterized as a silt loam. Seedlings used for field trials in Pittstown, NJ were
grown for 4 weeks in 72-cell trays with growing mix (Fafard Grow Mix 2; Sun Gro
Horticulture, Agawam, MA) under greenhouse conditions at the Rutgers University
Research Greenhouses in New Brunswick, NJ until transplanted in raised beds with 0.032-
mm black plastic mulch with drip irrigation applied as needed. Granular 5N–17.5P–50.2K
was applied 29 Mar. 2013 at 746 kg·ha-1, 46N–0P–0K was applied 28 May 2013 at 224 kg·ha-
1, and soluble 10N–13.1P–16.6K was applied at transplanting 6 June 2013 at 2.3 g·L-1 at
approximately 0.12 L per plant. Granular 12N–17.5P–50.2K–10S–1Zn was applied 3 Apr.
2015 at 313 kg·ha-1, 46N–0P–0K was applied 27 Apr. 2015 at 224 kg·ha-1, and soluble 10N–
22.7P–8.3K was applied at transplanting 17 June 2015 at 4.0 g·L-1 at ≈ 0.12 L/plant.
39
2.2.3 Experimental Design and Layout
All field experiments were arranged in a randomized complete block design with
three replications. Plants were grown in double rows spaced 30 cm between plants within
rows with 14 plants/plot. Plots were 2.1 m long and 1.2 m wide, spaced 1 m between plots
and 2 m between plot rows. Plants were mechanically transplanted using a water wheel in
NJ trials and by hand in Arusha. The four border plants in each plot were excluded from data
collection and five of the 10 interior plants were randomly selected for data collection at
time of harvest.
2.2.4 Data Collection
Horticultural traits were observed at the time of harvesting. Five interior plants
were randomly selected at time of harvest to obtain plant height, canopy spread and yield
data for each of the three replications in each trial. Plant height data were collected by
measuring the distance from the tallest apical shoot to the soil. Canopy spread data was
collected by measuring the distance from furthest laterally growing leaf tips. The first
harvest occurred between 21 and 28 d after transplanting into the field by cutting shoots 10
cm from the soil line to allow grow-back. Subsequent harvests occurred about every two
weeks following the initial harvest. Total yield was recorded as the mass of five plants
including all leaves and stems collected from the cutback portion of the plant. Marketable
yield was observed by recording the mass of leaves and tender stems after separating from
thicker central and axial stems. The percentage of marketable yield to total yield was
calculated by dividing the marketable yield by the total yield and multiplying by 100.
Marketable yield was only recorded in trials following NJ 2013 as this trait had not been
predicted to be significantly variable until observations made during the NJ 2013 trial.
40
An elemental micronutrient analysis was conducted on foliar subsamples of the
dried yields from each entry by inductively coupled plasma (ICP) mass spectrophotometry
at Penn State Agricultural Analytical Services Lab, University Park, PA. The elemental
analysis was performed on the first harvest in each trial, limited to the dried leaf blades, leaf
petioles, and stems of comparable diameter to that of the petioles. Samples in NJ 2013 and
NJ 2015 were dried using a walk-in tobacco dryer unit using propane-heated, forced air set
to 40 °C for ≈ 14 d. The Arusha 2014 samples were sun-dried in mesh bags on clean plastic
trays laid on a concrete surface for ≈ 14 d, samples were moved under an open-air structure
on a concrete surface during the evenings and rain events. All dried samples were
contained in paper bags until ground using a shearing-action mill. The results of the
elemental analysis are reported on a fresh weight basis by converting from an average
moisture content of 10% for the dry samples to 90% moisture, the approximate USDA-
reported water content for raw amaranth leaves (Muggeridge, 2000; U.S. Department of
Agriculture, 2016). This conversion was done to conservatively estimate the micronutrient
content as it would typically be purchased and used for preparing dishes. Furthermore,
this conversion allows direct comparison to data reported by USDA “Standard nutrient
database” and Codex Alimentarius Guidelines for Use of Nutrition and Health Claims.
2.2.5 Statistical Analysis
Analysis of variance (Proc ANOVA) and mean separation by Tukey’s Studentized range
(HSD) test was performed using SAS (version 9.4; SAS Institute, Cary, NC) for data
observations from each of the environments. Data were recorded from a single observation
of each replicate for a sample size of three for each entry across all trials for each trait. For
the traits of height and spread, the single value per replicate was recorded from the mean of
five observations within the replication. The yield traits were recorded as a single value per
replicate from the observation of weighing five plants from each replication.
41
2.3 Results
2.3.1 Foliar Micronutrient Content
All entries in each of the trials were observed to have quantities of Ca and Mg above
the breeding targets, 300 mg/100 g Ca and 90 mg/100 g Mg in all environments. Little
variation was observed in the mean and range of both Ca and Mg contents in each trial with
respect to the breeding targets, but significant differences were observed among entries for
Ca and Mg in each trial (Tables 2–4). Rank-order change was observed for Ca content
among the entries observed in common across trials. Madiira 1 was among the lowest-
scoring entries in 2013 and 2014 with 396 and 366 mg/100 g Ca, respectively, yet
performed moderately in 2015 with 426 mg/100 g; PI 566897 performed moderately in
2013 with 447 mg/100 g, yet had the lowest amount in 2015 with 386 mg/100 g. UNZA-A1
consistently contained relatively low Mg in the two trials it was observed with 124 and 174
mg/100 g Mg (Tables 2 and 4). Rank-order change in Mg content was observed between
the entries included in common across the three trials (Tables 2—4).
Differences between entries in Zn content were significant in all trials (Tables 2—4).
Variation between trials for Zn content was considerable with the means across all entries
per trial being 0.788, 0.467, and 0.565 mg/100 g Zn, in 2013, 2014, and 2015, respectively.
Ex-Zan had relatively high performance compared to the other entries in 2013 and 2014,
with 1.07 and 0.663 mg/100 g Zn, respectively. None of the entries in any trial contained
enough Zn to be recognized as high source.
The Fe content between entries was significantly different within all trials. The
range observed for Fe content included the highest-containing entries having twice as much
Fe as the lowest-containing entries in each trial. The mean Fe content of all entries were
5.56, 4.70, and 2.68 mg/100 g Fe in NJ 2013, Arusha 2014, and NJ 2015, respectively (Tables
42
2—4). All entries observed during the NJ 2013 and Arusha 2014 trials contained an amount
of Fe either above or within HSD values from the breeding target of 4.2 mg/100 g (Tables 2
and 3). None of the entries observed during the NJ 2015 trial surpassed the Fe breeding
target; half of the entries observed in NJ 2013 contained Fe within HSD value from the
target (Table 4). RUAM24 performed above the breeding target in NJ 2013 and Arusha
2014 trials with 5.1 mg/100 g Fe and 7.17 mg/100 g Fe, respectively. RUAM24 accumulated
the highest Fe content in NJ 2015 with 4.00 mg/100 g Fe (Table 4). Entries RUAM44 and PI
664489 also had relatively high Fe contents in NJ 2015 with 3.90 and 3.95 mg/100 g Fe,
respectively (Table 4).
2.3.2 Horticultural Performance
World Vegetable Center entries consistently ranked as the highest yielding in both
total yield (Tables 2—4) and marketable yield (Tables 3 and 4) yet were among the lowest
ranking by marketable percentage. Entries ranking highest in marketable percentage,
RUAM24 and PI 604669, 078% and 80%, respectively, in NJ 2015 were observed to have
marketable percentages twice as high as lower scoring entries for marketable percentage.
RUAM24 and PI 604669 had equally high marketable yields as other high-performing
entries in NJ 2015, only lower than ‘Madiira 2,’ observed to have the highest marketable
yield (Table 4).
Differences among entries in plant height and canopy spread were significant in all
trials. The furthest varying entry from the mean height and spread in all trials was PI
664489, included in the NJ 2015 trial for its shorter stature and dense architecture.
2.4 Discussion
The observation of significant differences in elemental micronutrient content among
entries in this study supports the hypothesis that vegetable amaranth can be selected for

43
improved performance in elemental micronutrient content through a breeding program.
The selection efforts for each of the four micronutrients observed in this study can be
informed differently given the results with respect to breeding targets previously described.
The significant variation on Fe content by genotype observed in this study indicates
that selection for stable, high Fe content should be a priority target. This is especially
important when selecting entries to be promoted for cultivation and marketing as a health-
improving dietary choice, which is nearly always the case with vegetable amaranth. The
relatively high Fe content in RUAM44 observed in 2015 could potentially be due to the more
pubescent leaves common to Amaranthus retroflexus collecting airborne dust, however this
would not explain the high Fe content of RUAM24 during 2015, which is not pubescent.
Despite significant differences observed among entries for Ca and Mg contents in
each trial (Tables 2—4), the performance of all entries in each trial was observed to be
above both 300 mg/100 g Ca and 90 mg/100 g Mg. This indicates that consumption of
vegetable amaranth can improve the nutrition status of individuals deficient in these
micronutrients. However, the values reported for raw amaranth in the USDA standard
nutrient database are 55 mg/100 g Mg and 215 mg/100 g Ca, below the Codex Alimentarius
high source threshold, which is the primary source of designating whether a crop may be
implemented as a delivery mechanism of a given micronutrient source in Feed the Future
initiatives (Feed the Future, 2014; U.S. Department of Agriculture, 2016). The results of this
study indicate that these vegetable amaranth entries could be used for direct release or use
in breeding programs as reliable sources of Ca and Mg. Further evaluation in other target
environments prior to use or promotion for commercial cultivation should be conducted.
Zn content above or within HSD from the breeding target of 4.5 mg/100 g Zn was
not observed in any of the entries in any trial. Significant variation was observed between
44
entries in all trials. The result of this study indicates that vegetable amaranth would not be
an effective source of Zn for reducing Zn deficiency in human diet. (Codex Alimentarius,
1997; Feed the Future, 2014). Evaluating more accessions would be necessary to
potentially identify entries with high-Zn content.
GEI analysis was not conducted because of the low number of common entries
among the three trials. The environment is likely to have substantial effect given the
observed difference of mean Fe content, particularly between NJ2013 and NJ2015 as these
trials mostly included entries in common to each other. The relative Fe content of RUAM24,
AC-NL, AH-TL, and Madiira 1 across the three trials was not consistent. RUAM24 was
observed to have relatively low variation compared to the accessions included in all trials
for Fe content with respect to the breeding target, supporting that it is possible to select for
vegetable amaranth entries with sufficiently minimal effect by GEI.
The results for yield data revealed a discrepancy between some entries which have
lower-ranking total yields yet high-ranking marketable yields, as in the case of RUAM24 and
PI 604669 in NJ 2015 (Table 4). Such observations suggest that screening by total yield
alone would potentially advance less valuable entries due to a higher proportion of inedible
stems. Entries advanced with consideration of marketable proportion may have the
economic advantage of requiring less labor for processing into bundles or improved
efficiency for post-harvest storage space when processing is not conducted prior to
marketing.
The selection for reduced height without penalty to marketable yield has potential
benefits similar to those of selection for marketable proportion in that it may facilitate
efficiency in harvesting, processing, transport, and storage of this crop, with considerably
less labor required for data collection. Entries RUAM24 and PI 604669 were among the
45
lowest ranking for height, suggesting the possibility of developing a method comparing
height to total yield for efficient selection for marketable yield, yet this is not confirmed by
the results of this study.
Significant but nominal differences among entries were observed for plant spread.
Entries which could be planted more closely within rows with no reduction in yield could
potentially make the total area for cultivation more productive. However, this was not
observed among entries in this study.
Amaranth contained high source levels of Ca and Mg but not Zn in this study. Based
on the results of this study, a breeding program to improve or increase Fe content of
vegetable amaranth is possible. The results of this study can be used to guide breeding
programs for vegetable amaranth and may provide a basis for estimating elemental
micronutrient variability in crops for which these traits have not previously been selected.
This study provides foundational information on the potential contribution of regular
vegetable amaranth consumption toward the improvement of human nutrition.
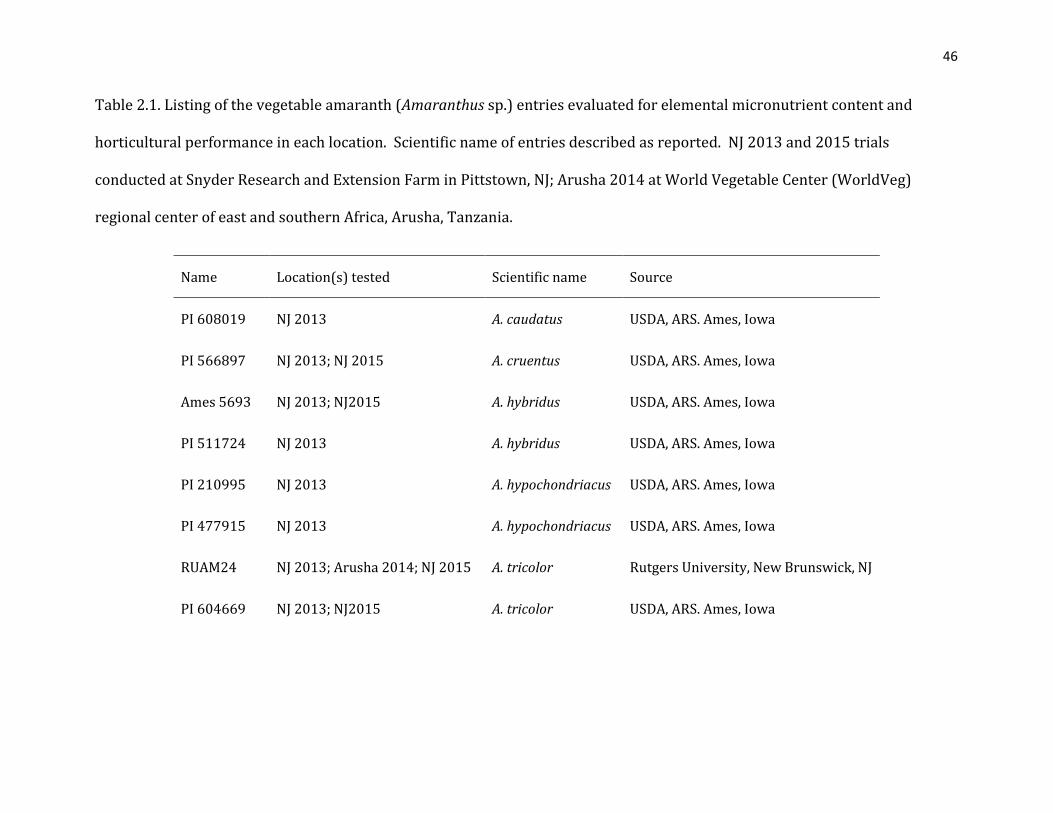
46
Table 2.1. Listing of the vegetable amaranth (Amaranthus sp.) entries evaluated for elemental micronutrient content and
horticultural performance in each location. Scientific name of entries described as reported. NJ 2013 and 2015 trials
conducted at Snyder Research and Extension Farm in Pittstown, NJ; Arusha 2014 at World Vegetable Center (WorldVeg)
regional center of east and southern Africa, Arusha, Tanzania.
Name Location(s) tested Scientific name Source
PI 608019 NJ 2013 A. caudatus USDA, ARS. Ames, Iowa
PI 566897 NJ 2013; NJ 2015 A. cruentus USDA, ARS. Ames, Iowa
Ames 5693 NJ 2013; NJ2015 A. hybridus USDA, ARS. Ames, Iowa
PI 511724 NJ 2013 A. hybridus USDA, ARS. Ames, Iowa
PI 210995 NJ 2013 A. hypochondriacus USDA, ARS. Ames, Iowa
PI 477915 NJ 2013 A. hypochondriacus USDA, ARS. Ames, Iowa
RUAM24 NJ 2013; Arusha 2014; NJ 2015 A. tricolor Rutgers University, New Brunswick, NJ
PI 604669 NJ 2013; NJ2015 A. tricolor USDA, ARS. Ames, Iowa
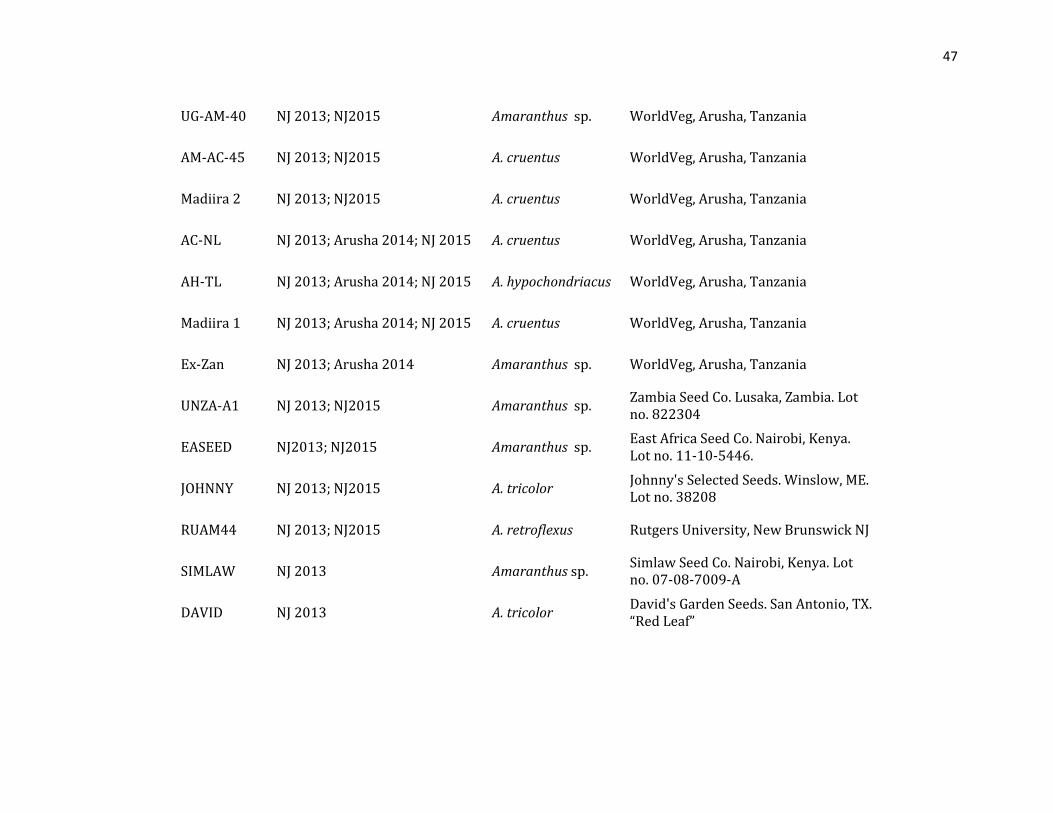
47
UG-AM-40 NJ 2013; NJ2015 Amaranthus sp. WorldVeg, Arusha, Tanzania
AM-AC-45 NJ 2013; NJ2015 A. cruentus WorldVeg, Arusha, Tanzania
Madiira 2 NJ 2013; NJ2015 A. cruentus WorldVeg, Arusha, Tanzania
AC-NL NJ 2013; Arusha 2014; NJ 2015 A. cruentus WorldVeg, Arusha, Tanzania
AH-TL NJ 2013; Arusha 2014; NJ 2015 A. hypochondriacus WorldVeg, Arusha, Tanzania
Madiira 1 NJ 2013; Arusha 2014; NJ 2015 A. cruentus WorldVeg, Arusha, Tanzania
Ex-Zan NJ 2013; Arusha 2014 Amaranthus sp. WorldVeg, Arusha, Tanzania
UNZA-A1 NJ 2013; NJ2015 Amaranthus sp. Zambia Seed Co. Lusaka, Zambia. Lot no. 822304
EASEED NJ2013; NJ2015 Amaranthus sp. East Africa Seed Co. Nairobi, Kenya. Lot no. 11-10-5446.
JOHNNY NJ 2013; NJ2015 A. tricolor Johnny's Selected Seeds. Winslow, ME. Lot no. 38208
RUAM44 NJ 2013; NJ2015 A. retroflexus Rutgers University, New Brunswick NJ
SIMLAW NJ 2013 Amaranthus sp. Simlaw Seed Co. Nairobi, Kenya. Lot no. 07-08-7009-A
DAVID NJ 2013 A. tricolor David's Garden Seeds. San Antonio, TX. “Red Leaf”
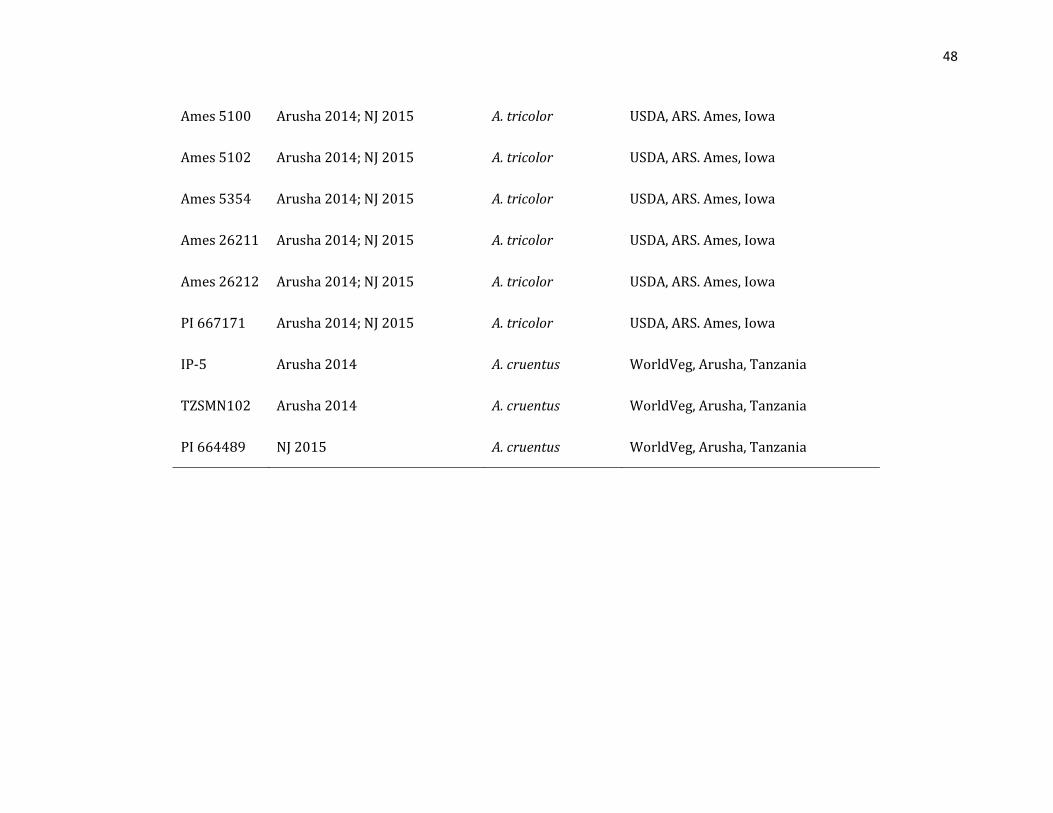
48
Ames 5100 Arusha 2014; NJ 2015 A. tricolor USDA, ARS. Ames, Iowa
Ames 5102 Arusha 2014; NJ 2015 A. tricolor USDA, ARS. Ames, Iowa
Ames 5354 Arusha 2014; NJ 2015 A. tricolor USDA, ARS. Ames, Iowa
Ames 26211 Arusha 2014; NJ 2015 A. tricolor USDA, ARS. Ames, Iowa
Ames 26212 Arusha 2014; NJ 2015 A. tricolor USDA, ARS. Ames, Iowa
PI 667171 Arusha 2014; NJ 2015 A. tricolor USDA, ARS. Ames, Iowa
IP-5 Arusha 2014 A. cruentus WorldVeg, Arusha, Tanzania
TZSMN102 Arusha 2014 A. cruentus WorldVeg, Arusha, Tanzania
PI 664489 NJ 2015 A. cruentus WorldVeg, Arusha, Tanzania
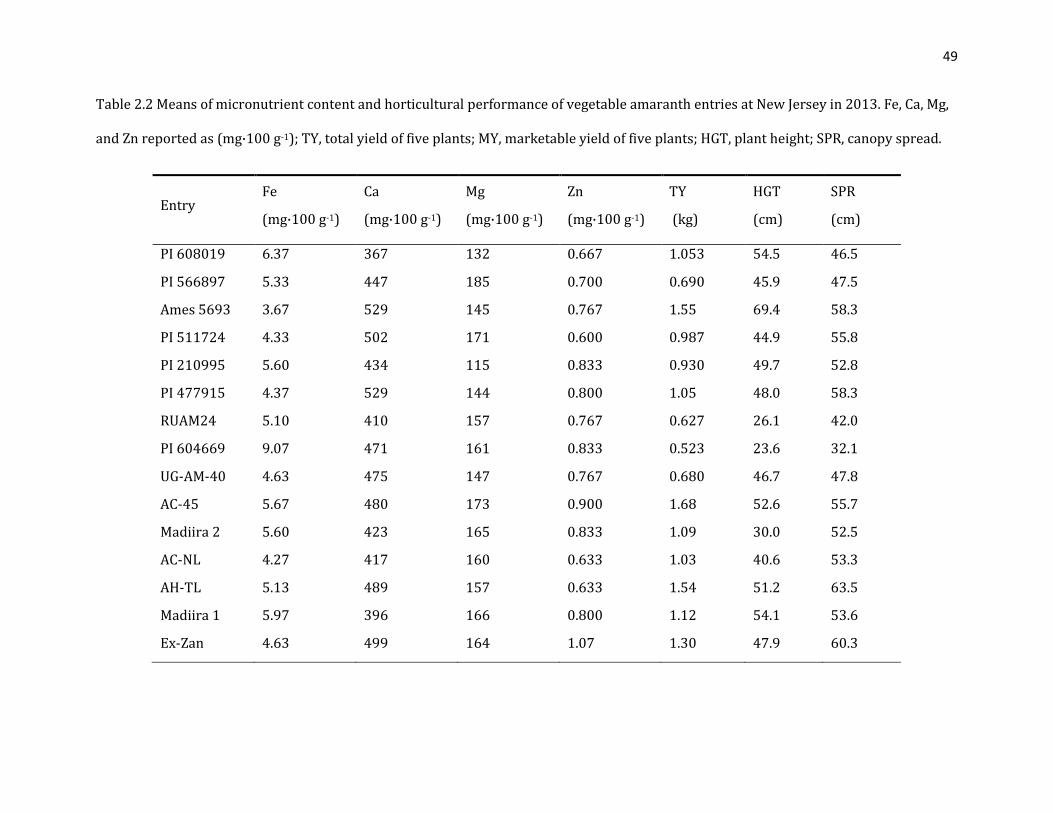
49
Table 2.2 Means of micronutrient content and horticultural performance of vegetable amaranth entries at New Jersey in 2013. Fe, Ca, Mg,
and Zn reported as (mg·100 g-1); TY, total yield of five plants; MY, marketable yield of five plants; HGT, plant height; SPR, canopy spread.
Entry Fe
(mg·100 g-1)
Ca
(mg·100 g-1)
Mg
(mg·100 g-1)
Zn
(mg·100 g-1)
TY
(kg)
HGT
(cm)
SPR
(cm)
PI 608019 6.37 367 132 0.667 1.053 54.5 46.5
PI 566897 5.33 447 185 0.700 0.690 45.9 47.5
Ames 5693 3.67 529 145 0.767 1.55 69.4 58.3
PI 511724 4.33 502 171 0.600 0.987 44.9 55.8
PI 210995 5.60 434 115 0.833 0.930 49.7 52.8
PI 477915 4.37 529 144 0.800 1.05 48.0 58.3
RUAM24 5.10 410 157 0.767 0.627 26.1 42.0
PI 604669 9.07 471 161 0.833 0.523 23.6 32.1
UG-AM-40 4.63 475 147 0.767 0.680 46.7 47.8
AC-45 5.67 480 173 0.900 1.68 52.6 55.7
Madiira 2 5.60 423 165 0.833 1.09 30.0 52.5
AC-NL 4.27 417 160 0.633 1.03 40.6 53.3
AH-TL 5.13 489 157 0.633 1.54 51.2 63.5
Madiira 1 5.97 396 166 0.800 1.12 54.1 53.6
Ex-Zan 4.63 499 164 1.07 1.30 47.9 60.3
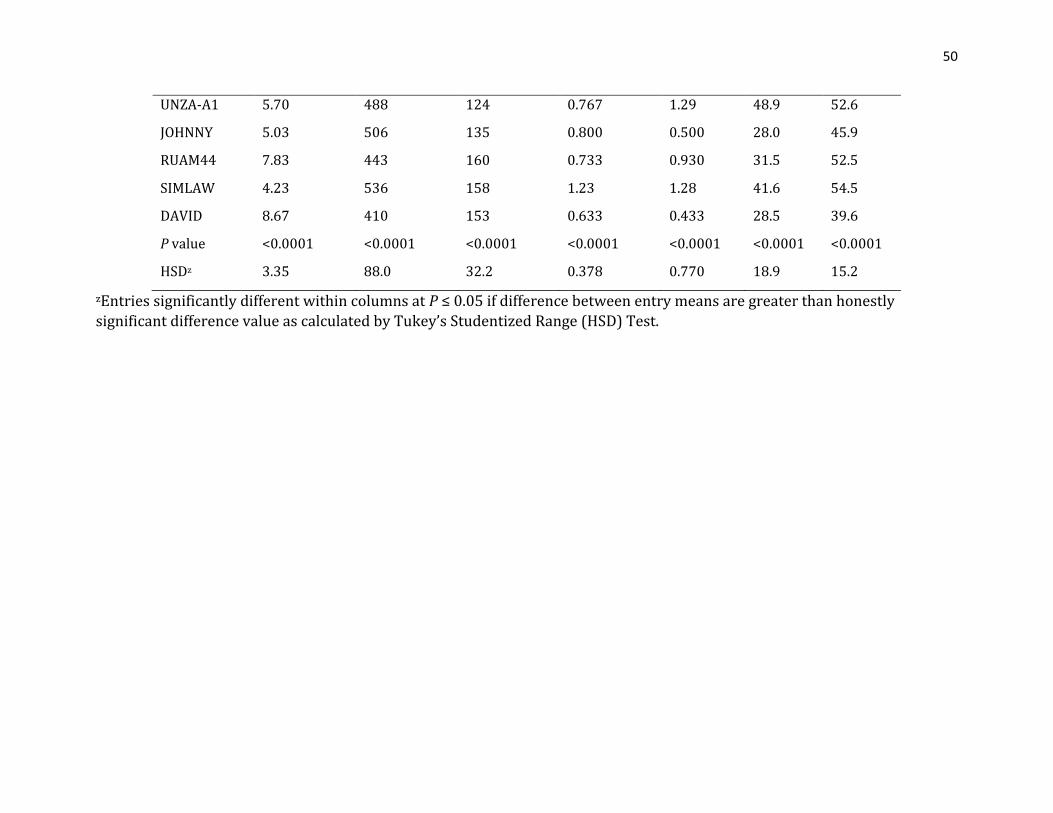
50
UNZA-A1 5.70 488 124 0.767 1.29 48.9 52.6
JOHNNY 5.03 506 135 0.800 0.500 28.0 45.9
RUAM44 7.83 443 160 0.733 0.930 31.5 52.5
SIMLAW 4.23 536 158 1.23 1.28 41.6 54.5
DAVID 8.67 410 153 0.633 0.433 28.5 39.6
P value <0.0001 <0.0001 <0.0001 <0.0001 <0.0001 <0.0001 <0.0001
HSDz 3.35 88.0 32.2 0.378 0.770 18.9 15.2
zEntries significantly different within columns at P ≤ 0.05 if difference between entry means are greater than honestly
significant difference value as calculated by Tukey’s Studentized Range (HSD) Test.

51
Table 2.3. Means of micronutrient content and horticultural performance of vegetable amaranth entries at Arusha, Tanzania in 2014. Fe,
Ca, Mg, and Zn reported as (mg·100 g-1); TY, total yield of five plants; MY, marketable yield of five plants; MP, marketable percentage; HGT,
plant height; SPR, canopy spread.
Entry Fe (mg·100 g-1)
Ca (mg·100 g-1)
Mg (mg·100 g-1)
Zn (mg·100 g-1)
TY (kg)
MY (kg)
MP (%)
HGT (cm)
SPR (cm)
Ames 26212 3.60 539 145 0.463 0.256 0.127 50 29.3 22.0
Ames 26211 5.20 552 145 0.463 0.380 0.183 48 31.6 30.0
RUAM24 7.17 437 145 0.457 0.763 0.515 68 29.7 36.1
Ames 5100 7.27 396 123 0.413 1.16 0.758 66 38.0 37.2
Ex-Zan 4.17 382 121 0.663 3.61 1.77 49 59.7 46.7
AH-TL 3.40 368 130 0.433 3.45 1.17 34 70.0 38.5
AC-NL 3.13 417 150 0.407 3.65 1.34 37 68.3 49.7
Madiira 1 3.10 366 145 0.479 2.69 1.14 44 83.2 31.4
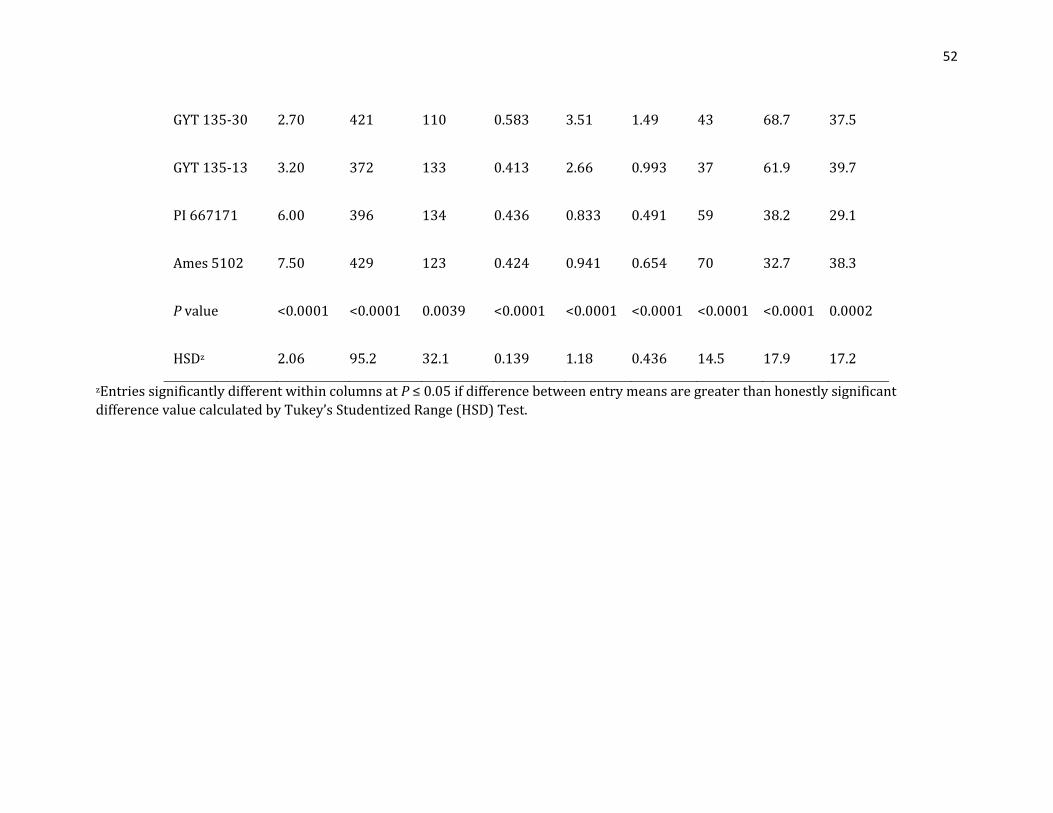
52
GYT 135-30 2.70 421 110 0.583 3.51 1.49 43 68.7 37.5
GYT 135-13 3.20 372 133 0.413 2.66 0.993 37 61.9 39.7
PI 667171 6.00 396 134 0.436 0.833 0.491 59 38.2 29.1
Ames 5102 7.50 429 123 0.424 0.941 0.654 70 32.7 38.3
P value <0.0001 <0.0001 0.0039 <0.0001 <0.0001 <0.0001 <0.0001 <0.0001 0.0002
HSDz 2.06 95.2 32.1 0.139 1.18 0.436 14.5 17.9 17.2
zEntries significantly different within columns at P ≤ 0.05 if difference between entry means are greater than honestly significant
difference value calculated by Tukey’s Studentized Range (HSD) Test.
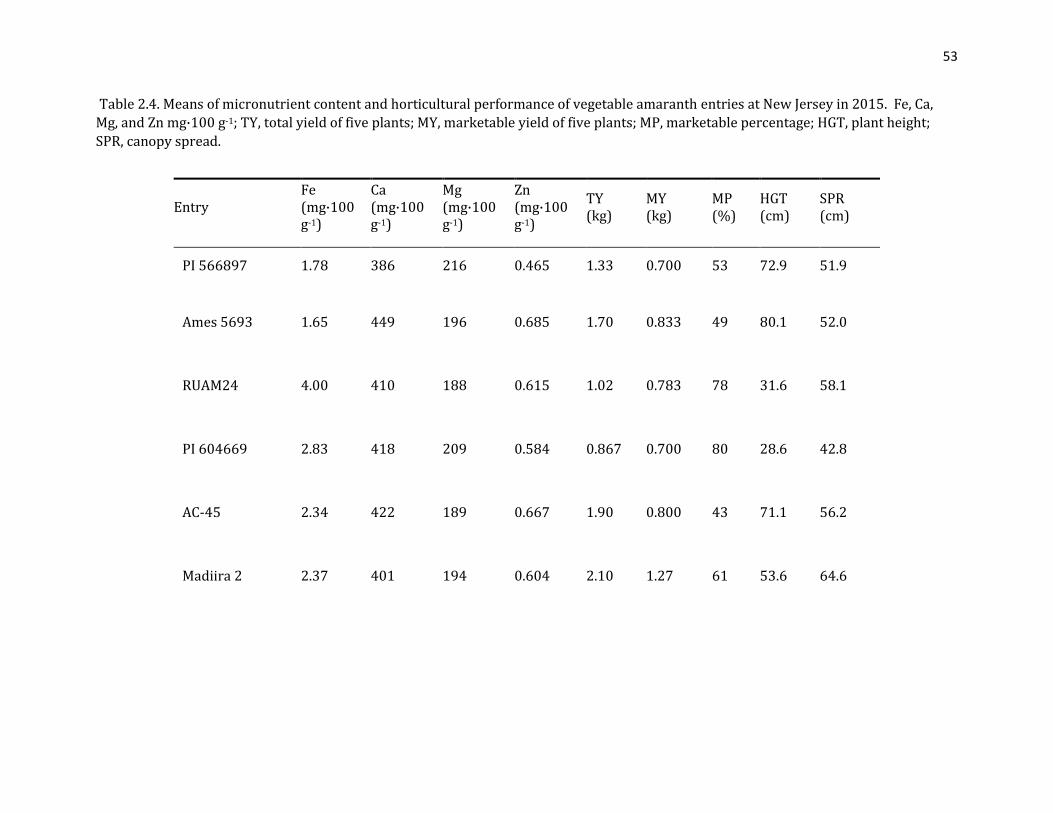
53
Table 2.4. Means of micronutrient content and horticultural performance of vegetable amaranth entries at New Jersey in 2015. Fe, Ca,
Mg, and Zn mg·100 g-1; TY, total yield of five plants; MY, marketable yield of five plants; MP, marketable percentage; HGT, plant height;
SPR, canopy spread.
Entry Fe (mg·100 g-1)
Ca (mg·100 g-1)
Mg (mg·100 g-1)
Zn (mg·100 g-1)
TY (kg)
MY (kg)
MP (%)
HGT (cm)
SPR (cm)
PI 566897 1.78 386 216 0.465 1.33 0.700 53 72.9 51.9
Ames 5693 1.65 449 196 0.685 1.70 0.833 49 80.1 52.0
RUAM24 4.00 410 188 0.615 1.02 0.783 78 31.6 58.1
PI 604669 2.83 418 209 0.584 0.867 0.700 80 28.6 42.8
AC-45 2.34 422 189 0.667 1.90 0.800 43 71.1 56.2
Madiira 2 2.37 401 194 0.604 2.10 1.27 61 53.6 64.6
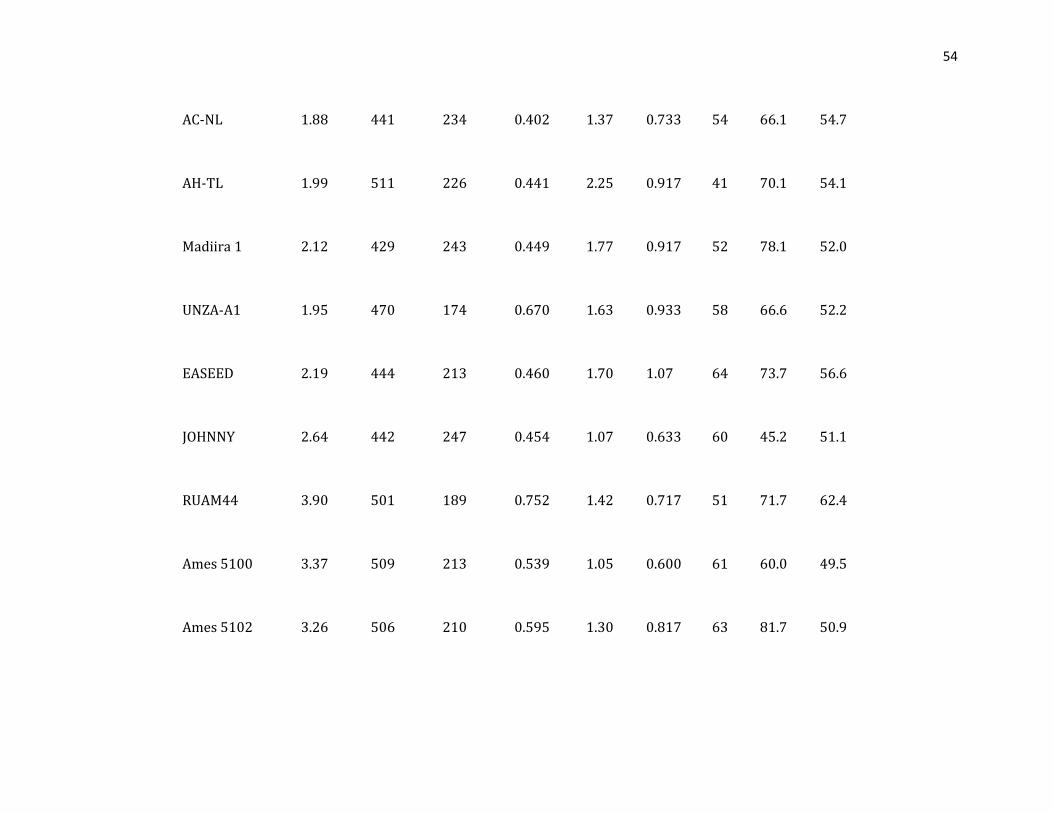
54
AC-NL 1.88 441 234 0.402 1.37 0.733 54 66.1 54.7
AH-TL 1.99 511 226 0.441 2.25 0.917 41 70.1 54.1
Madiira 1 2.12 429 243 0.449 1.77 0.917 52 78.1 52.0
UNZA-A1 1.95 470 174 0.670 1.63 0.933 58 66.6 52.2
EASEED 2.19 444 213 0.460 1.70 1.07 64 73.7 56.6
JOHNNY 2.64 442 247 0.454 1.07 0.633 60 45.2 51.1
RUAM44 3.90 501 189 0.752 1.42 0.717 51 71.7 62.4
Ames 5100 3.37 509 213 0.539 1.05 0.600 61 60.0 49.5
Ames 5102 3.26 506 210 0.595 1.30 0.817 63 81.7 50.9
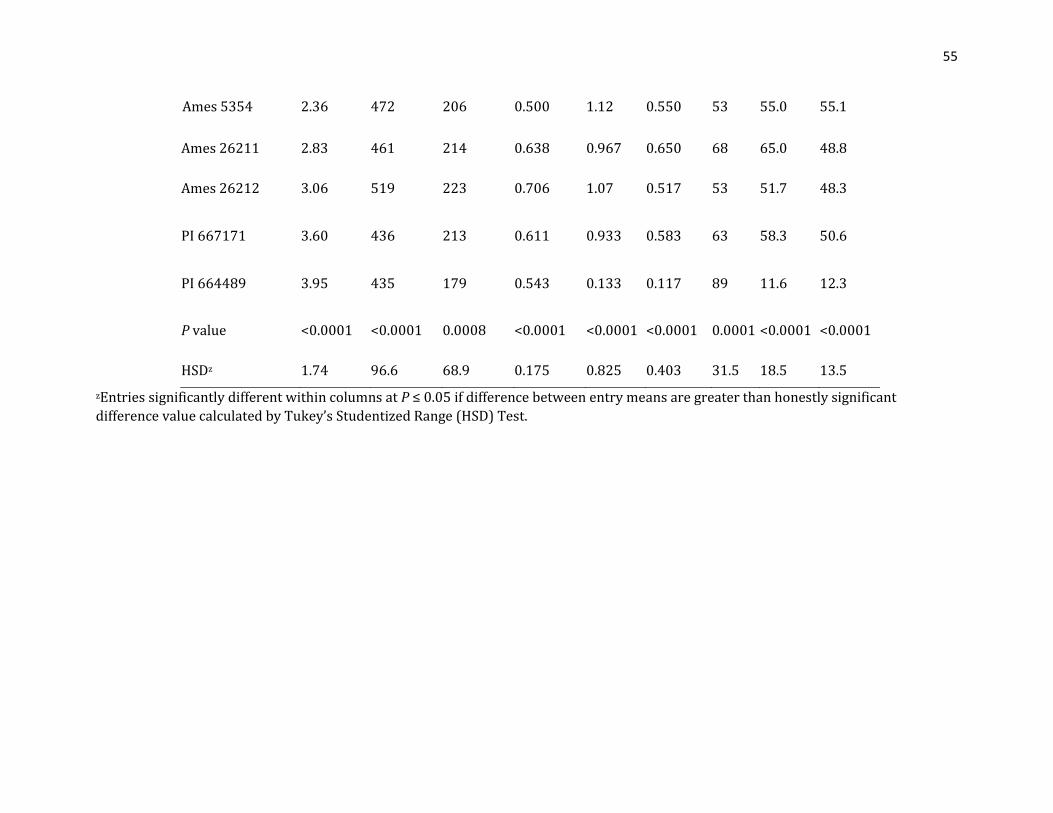
55
Ames 5354 2.36 472 206 0.500 1.12 0.550 53 55.0 55.1
Ames 26211 2.83 461 214 0.638 0.967 0.650 68 65.0 48.8
Ames 26212 3.06 519 223 0.706 1.07 0.517 53 51.7 48.3
PI 667171 3.60 436 213 0.611 0.933 0.583 63 58.3 50.6
PI 664489 3.95 435 179 0.543 0.133 0.117 89 11.6 12.3
P value <0.0001 <0.0001 0.0008 <0.0001 <0.0001 <0.0001 0.0001 <0.0001 <0.0001
HSDz 1.74 96.6 68.9 0.175 0.825 0.403 31.5 18.5 13.5
zEntries significantly different within columns at P ≤ 0.05 if difference between entry means are greater than honestly significant
difference value calculated by Tukey’s Studentized Range (HSD) Test.
56
2.5 References
Achigan-Dako, E.G., O.E.D. Sogbohossou, and P. Maundu. 2014. Current knowledge on
Amaranthus spp.: Research avenues for improved nutritional value and yield in leafy
amaranths in sub-Saharan Africa. Euphytica 197(3):303–317.
Beyer, P. 2010. Golden rice and “golden” crops for human nutrition. New Biotechnol.
27(5):478–481.
Cakmak, I., H. Ozkan, H.J. Braun, R.M. Welch, and V. Romheld. 2000. Zinc and iron
concentrations in seeds of wild, primitive, and modern wheats. Food Nutr. Bul. 21(4):401–
403.
Codex Alimentarius. 1997. Nutrition and health claims (CAC/GL 23-1997): Guidelines for
use of nutrition and health claims. Food and Agriculture Organization of the United Nations
and World Health Organization, Rome, Italy.
Crossa, J. 2012. From genotype × environment interaction to gene × environment
interaction. Current Genomics 13(3):225-244.
Feed the Future. 2014. Feed the future indicator handbook. Washington, D.C.
Feil, B., S.B. Moser, S. Jampatong, and P. Stamp. 2005. Mineral composition of the grains of
tropical maize varieties as affected by pre-anthesis drought and rate of nitrogen
fertilization. Crop Sci. 45(2)516-523.
Gregorio, G.B., D. Senadhira, H. Htut, and R.D. Graham. 2000. Breeding for trace mineral
density in rice. Food Nutr. Bul. 21(4):382–386.
Haas, J.D., J.L. Beard, L.E. Murray-Kolb, A.M. del Mundo, A. Felix, and G.B. Gregorio. 2005.
57
Iron-biofortified rice improves the iron stores of nonanemic Filipino women. J Nutr.
135(12):2823–2830.
Jain, S.K., H. Hauptil, and K.R. Vaidya. 1982. Outcrossing rate in grain amaranths. J. Hered.
73(1):71–72.
Koike, S., M. Cahn, M Cantwell, S. Fennimore, M. LeStrange, E. Natwick, R. Smith, and E.
Takele. 2011. Spinach Production in California. University of California. Div. Agr. Natural
Resources. 24 Mar. 2017. <http://anrcatalog.ucanr.edu/pdf/7212.pdf>
Luoh, J.W., C.B. Begg, R.C. Symonds, D. Ledesma, and R. Yang. 2014. Nutritional yield of
African indigenous vegetables in water-deficient and water-sufficient conditions. Food Nutr.
Sci. 5(9):812–822.
Masuda, H., Y. Ishimaru, M.S. Aung, T. Kobayashi, Y. Kakei, M. Takahashi, K. Higuchi, H.
Nakanishi, and N.K. Nishizawaa. 2012. Iron biofortification in rice by the introduction of
multiple genes involved in iron nutrition. Scientific Rpt. 2:543.
Mayer, J.E., W.H. Pfeiffer, and P. Beyer. 2008. Biofortified crops to alleviate micronutrient
malnutrition. Current Opinion Plant Biol. 11(2):166–170.
Muggeridge, M. 2000. Quality specifications for herbs and spices. In: K.V. Peter (ed).
Handbook of herbs and spices. CRC Press, Washington, DC.
National Resource Council, 2006. Lost crops of Africa. Vol. II. Natl. Acad. Press, Washington,
DC.
Schönfeldt, H.C. and B. Pretorius. 2011. The nutrient content of five traditional South African
dark green leafy vegetables: A preliminary study. J. Food Composition Analysis
24(8):1141–1146.
58
Shukla, S., A. Bhargava, A. Chatterjee, A.C. Pandey, and B.K. Mishra. 2010. Diversity in
phenotypic and nutritional traits in vegetable amaranth (Amaranthus tricolor), a
nutritionally underutilised [sic] crop. J. Sci. Food Agr. 90(1):139–44.
Shukla, S., A. Bhargava, A. Chaterjee, A. Srivastava, and S.P. Singh. 2006. Genotypic
variability in vegetable amaranth (Amaranthus tricolor L.) for foliage yield and its
contributing traits over successive cuttings and years. Euphytica 151(1):103–110.
U.S. Department of Agriculture. 2016. National nutrient database for standard reference
release 28: Amaranth leaves, raw. The Natl. Agr. Library, Washington, DC.
Velu, G., R.P. Singh, J. Huerta-Espino, R.J. Peña, B. Arun, A. Mahendru-Singh, M. Yaqub
Mujahid, V.S. Sohu, G.S. Mavi, J. Crossa, G. Alvarado, A.K. Joshi, W.H. Pfeiffer. 2012.
Performance of biofortified spring wheat genotypes in target environments for grain zinc
and iron concentrations. Field Crops Res. 137:261-267.
Weller, S.C., E.Van Wyk, and J.E. Simon. 2015. Sustainable production for more resilient food
production systems: Case study of African indigenous vegetables in eastern Africa. Acta
Hort. 1102:289-298.
World Health Organization. 2002. Quantifying selected health risks: Childhood and
maternal undernutrition. In: The world health report 2002: Reducing risks, promoting
healthy life. World Health Organization, Geneva, Switzerland.
World Health Organization. 2009. Calcium and magnesium in drinking-water: Public health
significance. World Health Organization, Geneva, Switzerland.

59
World Health Organization. 2017. Nutrition. Micronutrient deficiencies: Iron deficiency
anaemia. World Health Organization, Geneva, Switzerland. 20 Mar. 2017.
<http://www.who.int/nutrition/topics/ida/en/>
60
Chapter 3 Genotype x environment interaction for elemental micronutrient content of vegetable amaranth, Ethiopian mustard, edible nightshade and spiderplant
3.1 Introduction
Vegetable amaranth (Amaranthus sp.), Ethiopian mustard (Brassica carinata), edible
nightshade (Solanum scabrum), and spiderplant (Cleome gynandra), are leafy green
vegetables consumed in at least 50 countries combined across sub-Saharan Africa, South
Asia, Southeast Asia, and the Caribbean (Achigan-Dako, Sogbohossou, & Maundu, 2014;
National Resource Council, 2006). High rates of micronutrient deficiencies in these regions
have attracted attention to these culturally preferred horticulture crops to provide
micronutrients as a public health benefit that comes with self-sufficient economic growth of
smallholder farmers (National Resource Council, 2006; Weller, Van Wyk, & Simon, 2015).
Micronutrients for human consumption are typically categorized as either vitamins or
elemental minerals. Elemental micronutrients are not metabolic products of plants and
must be obtained from the environment, supporting the hypothesis that plants are limited
from accumulating meaningful concentrations of these minerals in severely deficient soils
(Ortiz-Monasterio et al., 2007). However, consistent observation of significant genotype
effect, from both selection and genetic modification in various staple and horticultural crops
supports that meaningful gains in elemental micronutrient content can be realized toward
being utilized for reduction of nutritional deficiencies in the environments (Byrnes, Dinssa,
Weller, & Simon, 2017; Kodkany et al., 2013; Masuda et al., 2012).
The concentration of Fe in solution has long been understood to decrease
exponentially as pH increases, becoming less readily available for uptake by plants as Fe2+ is
converted to the less water-soluble Fe3+; this phenomenon has long made Fe availability
61
considered to be the most problematic among essential mineral nutrients for plants (Oertli
& Jacobson, 1969). The capacity for plants to tolerate high pH soils with respect to Fe
sufficiency has been demonstrated to be controlled genetically with either of two different
mechanisms. In grasses, a strong chelator of Fe3+ is released and a specific uptake system
transports without reducing to Fe2+ (Römheld & Marschner, 1986). In non-grasses, entries
capable of overcoming Fe unavailability in high pH soils have been demonstrated to reduce
F3+ to Fe2+ within the roots prior to transport (Brown, 1977). The genes that have been
identified for being involved in these processes have consistently fit these models
(Kobayashi & Nishizawa, 2012).
The bulk of studies in the literature on identifying genetically improved elemental mineral
use in plants are primarily interested in tolerance to adverse environments and efficiency.
This may result in inapplicable findings relative to high accumulation if the mechanism of
tolerance is based on functioning with less rather than increased uptake. Iron-efficiency as
observed previously does not appear to raise this concern as those with genetic adaptation
found to be efficient for Fe usage have been shown to have much higher Fe in the leaves
than those which were Fe deficient under the same conditions (Brown, Chaney, & Ambler,
1971). Genotypic resistance to calcium stress expressed as blossom end rot in tomato
(Lycopersicon esculentum) however, has been demonstrated to be expressed as a function of
both having a lower requirement as well as greater uptake (Greenleaf & Adams, 1969).
Heavy metal toxicity is known to cause Fe deficiency symptoms in plants, though some Fe-
efficient varieties have been demonstrated to be capable of tolerating elevated quantities of
heavy metals in the soil (Brown & Jones, 1975). This could present an unintended problem,
for allowing full production of crops that can contain minerals which are deleterious to
62
human health from contaminated soils which would otherwise be unable to produce crops
successfully.
The accumulation of Ca in plants is associated with soil conditions; plants grown on
calcareous soils are expected to have high quantities of soluble Ca2+, while those grown in
acidic and low-calcium soil will accumulate very little Ca2+ (Läuchli, 1976). However,
genotype effect on Ca-efficiency has been reported in several plants including tomatoes,
snap beans, and broccoli (Caines & Shennan, 1999; Farnham, Grusak, & Wang, 2000;
Quintana, Harrison, Nienhuis, Palta, & Grusak, 1996).
The environmental availability of Mg in soil may be induced by low soil pH, though
this is limited if Mg is in abundance as in the case of certain soil parent material and
proximity to major bodies of saltwater (Marschner, 1991). Efficiency of Mg has been
observed in plants as an effect of genotype (Farnham et al., 2000).
Differential Zn efficiency has been observed in grasses as an effect of genotype
(Cakmak et al., 1996; Graham, Ascher, & Hynes, 1992). The mechanism of Zn efficiency has
been supported to be associated with the release of phytosiderophores i.e. Fe-chelating
compounds, from the roots allowing greater uptake of Zn (Cakmak et al., 1996). Across Zn-
efficient lines, however, an unspecified interaction has been observed weakening the
correlation of phytosiderophore release with Zn-efficiency; this has been speculated to be
due to transport mechanisms following uptake from soil (Erenoglu et al., 1996).
The occurrence of both Ca and Mg stress in plants is associated with soil acidity, yet
the efficient use of both of these minerals is not always correlated (Farnham et al., 2000).
Anion transport is facilitated by a contrast of low H+ concentration in the soil and a higher
concentration in the plasma membrane; conversely, cation transport is inhibited by a lower
63
soil pH, particularly Mg, which may partially demonstrate how efficiency for use of both
minerals would not necessarily be correlated (Marschner, 1991).
Vegetable amaranth has previously been characterized for micronutrient content in
a number of studies and is listed on the USDA National Nutrient Database for Standard
Reference, yet this data includes a wide range of variability between studies and often lacks
description of methodology used to quantify micronutrients (Achigan-Dako et al., 2014;
Luoh, Begg, Symonds, Ledesma, & Yang, 2014; Schönfeldt & Pretorius, 2011; Shukla et al.,
2006; Shukla, Bhargava, Chatterjee, Pandey, & Mishra, 2010).
A consistently significant effect by genotype on Fe, Ca, Mg, and Zn content was
observed in vegetable amaranth by Byrnes et al. (2017). Observing the effect of genotype by
environment interaction (GEI) is necessary to determine how to proceed with selection of
entries for nutrition delivery as a complement to horticultural performance. Genetic by
environment interaction, or phenotypic plasticity effect, is the phenomenon of differential
trait expression between genotypes in response to environmental differences between
trials (Kang, 2004). Observation of GEI is essential to variety development to reliably
predict performance stability in the expression of traits of interest. GEI analysis should be
conducted with genotypes of interest observed in target environments to observe
performance relative to where the genotypes are intended to be promoted for cultivation.
The two basic expressions of GEI are with rank change, also known as crossover, or
without rank change across environments. Sufficiently moderate GEI facilitates selection as
this indicates stability in performance, while substantial GEI limits accurate prediction of
genotype performance. GEI with rank order change may indicate genotypes should be
selected for promotion specific to environment (Crossa, 2012; Gregorio, Senadhira, Htut, &
Graham, 2000). The effect of GEI has been reported in several crops, including grain
64
amaranth (Bednarz, Bridges, and Brown 2000; Mekbib 2003; Riday and Brummer 2006;
Fan et al. 2007; Mulema et al. 2008; De Vita et al. 2010; Guillen-Portal, F.R., Baltensperger,
D.D., Nelson, L.A., D’Croz-Mason 1999) (Dia et al., 2016; Edwards, 2016; Tumwegamire et
al., 2016).
There are several methods which have been introduced to observe GEI and stability
through previous decades to the present. The Additive Main effects and Multiplicative
Interaction (AMMI) method, previously known as FANOVA, was introduced for situations
where both main effects and interaction are important (Gollob, 1968; Mandel, 1971; Zobel,
Wright, & Gauch, 1988). The application of this multivariate approach updated the various
univariate approaches and was found to have the effect of improved precision on yield
estimates equivalent to increasing replications by a factor of 2.59 (Crossa, 1990). Genotype
by genotype x environment interaction (GGE) analysis (Yan, Hunt, Sheng, & Szlavnics, 2000)
is a similar method to AMMI with considerations for optimal applications of each method
often discussed (Dia et al., 2016; Gauch, Piepho, & Annicchiarico, 2008).
An underlying issue of GEI models is that the observed genotype effect is affected by
the environments included and vice-versa (Marcos Malosetti, Ribaut, & van Eeuwijk, 2013).
Environments are generally expected to be the majority source of variance. To ensure
significance of variation by genotype, genotypes likely to be commercially irrelevant are
incentivized for inclusion. While this may be argued to be logical as an experimental
control method, this study prioritizes advanced lines and cultivars.
In this study, the AMMI model is used indicate performance interactions with
genotypes, environments, and the interactions thereof where pertinent (see discussion). A
mixed model was applied to partition variance by genotype, environment, and GEI as has
become commonly performed across statistical software platforms for the analysis of multi-
65
environment trial data for various traits and crops with multiple genotypes being compared
(Gilbert et al., 2015; Jat et al., 2018; M. Malosetti, Voltas, Romagosa, Ullrich, & Eeuwijk,
2004; Mathews et al., 2008; van der Voet, Perry, Amzal, & Paoletti, 2011). The GEI variance
was partitioned by genotype within the mixed model analysis where potential for selection
of a genotype with relative stability appeared feasible, as also performed in (Gilbert et al.,
2015).
The USDA National Nutrient Database for Standard Reference assigns a value to
vegetables and vegetable products a value for each micronutrient from a variable sample
size without differentiation by variety or genotype. This is the primary resource
researchers can use to verify whether a food can be considered high source by FAO
definitions (Feed the Future, 2016). A food which is recognized as meeting or exceeding
high source thresholds for one or more micronutrients may be used to quantitatively
evaluate health status improvement by observing consumption of the food by individuals
deficient in those micronutrients. The target quantities of micronutrients in this study are
assigned as defined in Codex Alimentarius Guidelines for Use of Nutrition and Health
Claims. “High source” thresholds are defined as being the content necessary to provide at
least 30% of the Nutrient Reference Value (NRV) per micronutrient if 100g is consumed: 4.2
mg/100g Fe, 90 mg/100g Mg, 300 mg/100g Ca, and 4.5 mg/100g Zn, by fresh weight basis
(Codex Alimentarius, 1997). “Source” thresholds are defined as half the value of respective
high source thresholds (Codex Alimentarius, 1997).
A GEI analysis of micronutrient content is needed for AIVs to understand whether a
crop, or a genotype within a crop, can be reliably used to improve the health status of
people with one or more micronutrient deficiencies.
66
3.2 Materials and Methods
3.2.1 Germplasm
The genotypes included for each crop are detailed in Table 3.1 below. The
genotypes include advanced lines and cultivated varieties developed by the World
Vegetable Center and other breeding groups such as RUAM24, which was previously found
to have high marketable proportion, competitive marketable yield, and high Fe content
(Byrnes et al., 2017).
3.2.2 Experimental design and field sites
All field experiments were arranged in a randomized complete block design (RCBD)
with three replications for amaranth and four replications each for Ethiopian mustard,
edible nightshade, and spiderplant due to having fewer entries. Plants were grown in double
rows spaced 30 cm between plants within rows with 14 plants per plot. Plots were 2.1 m
long and 1.2 m wide, spaced 1 m between plots and 2 m between plot rows. Plants were
mechanically transplanted using a water wheel in New Jersey (NJ) field trials and by hand in
both Kenya and Tanzania. The four border plants in each plot were excluded from data
collection and the interior plants were observed for data collection at time of harvest.
3.2.2.1 USA site
The experiments in NJ were conducted at Snyder Research and Extension Farm in
Pittstown, NJ (lat. 40.6°N, long. 75.0°W, 116 m elevation) in 2013 and 2015. The soil at this
site is characterized as a silt loam. Seedlings used for field trials in Pittstown, NJ were
grown for four weeks in 72-cell trays with growing mix (Fafard Grow Mix 2; Sun Gro
Horticulture, Agawam, MA) under greenhouse conditions at the Rutgers University
Research Greenhouses in New Brunswick, NJ until transplanted in raised beds with 0.032
mm black plastic mulch with drip irrigation applied as needed. Granular 5N–17.5P–50.2K
67
was applied 29 March 2013 at 746 kg·ha-1, 46N–0P–0K was applied 28 May 2013 at 224
kg·ha-1, and soluble 10N–13.1P–16.6K was applied at transplanting 6 June 2013 at 2.3 g·L-1
at approximately 0.12 L per plant. Granular 12N–17.5P–50.2K–10S–1Zn was applied 3 April
2015 at 313 kg·ha-1, 46N–0P–0K was applied 27 April 2015 at 224 kg·ha-1, and soluble
10N–22.7P–8.3K was applied at transplanting 17 June 2015 at 4.0 g·L-1 at approximately
0.12 L per plant.
3.2.2.2 Tanzania site
The experiments in Arusha, Tanzania were carried out on-station at WorldVeg,
eastern and southern Africa (lat. 36.8°S, long. 3.4°E, 1290 m elevation) in 2016 and 2017.
The site is characterized by well-drained clay loam soil with pH 6.4. Seedlings in Arusha,
Tanzania were grown in 72-cell trays with sterilized media composed of forest
soil/compost, manure, sand, and rice husks in a ratio of 3:2:1:1 by mass. Furrow irrigation
was applied as needed. 20N–4.4P–8.3K fertilizer was applied to beds in Arusha at 200
kg·ha-1 prior to transplanting on 7 August 2014. Urea (46N-0P-0K) was applied 3 weeks
after transplanting at 120 kg·ha-1. The first field trial at the Tanzanian site was conducted
between December 2015 and March 2016, and the second trial between May and
September 2017. Plants were lyophilized during the first trial and oven-dried at 40°C for
the second trial.
3.2.2.3 Kenya site
The experiments in the Turbo region outside of Eldoret, Kenya (lat. 0.37°N, long.
35.1°E, 1789 m elevation) were carried out during three distinct cultivation periods in
2017. The soil at this site was found to have an average pH of 5.7, CEC of 14.2 meq/100g,
and 4.34% OM. Drip irrigation was applied as needed. A “chimney solar dryer” was used to
dry plant materials for shipment to Rutgers University (Deltsidis et al., 2018).
68
The first season of cultivation at the Kenyan site at Turbo was conducted during the
hottest and driest period Kenya experiences annually. Seeds were sown November 17,
2016, transplanted January 12, 2017, and harvested February 15, 2017. Five grams of
granular 17:17:17 fertilizer was applied to each plant at time of transplanting.
The second field season at the Kenyan site was conducted during highest annual
precipitation period with more moderate temperatures. Seeds were sown April 20, 2017,
transplanted June 19, 2017, and harvested July 11, 2017. Five grams of granular 17:17:17
fertilizer was applied at time of transplanting.
The third field season at the Kenyan site was conducted following the cooler period,
when the average temperature increases to a moderate level with moderate precipitation
from 50-100mm of rain per month on average. Seeds were sown September 9, 2017,
transplanted to the field October 18, 2017, and harvested November 24, 2017.
3.2.3 Elemental analysis.
Elemental micronutrient analysis was conducted on foliar subsamples of the dried
yields from each line by inductively coupled plasma mass spectrophotometry at Penn State
Agricultural Analytical Services Laboratory, University Park, PA. The elemental analysis was
performed on the marketable yield of the first harvest in each trial. The marketable yield is
defined in this study as inclusive of leaves and stems with diameters comparable to the
petiole of leaves which would commonly be consumed.
In our mineral analysis studies, several original samples received from our African
partners appeared to be unusually high in iron. The concentration of Fe found in plants for
biologically relevant quantities is notably different than the amount of iron that would appear in
tissue analyses due to contamination e.g. by small amounts of soil or rust. We observed several
69
sets of tissues appeared to have been exposed to such sources of iron and as such were not
used in data analyses. Several trials were removed from the data set when unusually high levels
of iron came back in the analyses. Analysis was not included from the Tanzania 2016 trial for all
crops as it appears plant samples were contaminated prior to lyophilizing on-site. For amaranth,
the next Tanzania trial was also excluded as it did not feature the full germplasm; the second
and third Kenyan trials were also removed as it appeared several entries included in these trials
may have been contaminated with soil. For nightshade, each Kenyan trial contained many
entries which appeared to have been contaminated with soil, these have been excluded from
analysis. Ethiopian mustard appeared to have several entries contaminated with soil from the
second Kenyan trial. These removals were done in order not to bias the statistical analyses due
to factors beyond normal plant accumulation of minerals, including iron from the soil.
3.2.4 Statistical analysis
Each field trial was treated as a unique environment for each location, season, and
year. Significance of each of the model terms was done using an approximated F-test with
the Kenward Roger (Kenward & Roger, 1997) correction for the degrees of freedom. The
specific genotypes were compared by slicing the GEI variance by genotype effect and
LSMeans were estimated. The model was fitted using PROC MIXED in SAS 9.4 (SAS Institute
Inc., Cary, NC, USA). AMMI analysis was conducted using R Studio.
3.3 Results and Discussion
3.3.1 Iron Content
The mean Fe content of all crops inclusive of all genotypes and environments was
below the high source threshold (4.2 mg/100g) and above the source threshold (2.1
70
mg/100g) (Figure 3.1). Genotype effect on Fe content was only found to be significant in
amaranth (Table 3.2).
Two amaranth genotypes were found to have mean Fe content above the high
source threshold, though between them, Madiira2 has much greater variation than RUAM24
(Figure 3.2). Partitioning of GEI effect across genotypes indicates that RUAM24 is the only
genotype which was found not to have significance of variance across environments (Table
3.3).
Ethiopian mustard had a higher mean Fe content, with relatively more data points
above the high source and source threshold than edible nightshade and spiderplant.
However, genotype effect on Fe in Ethiopian was not observed to be significant and neither
was GEI (Table 3.2). None of the Ethiopian mustard genotypes were found to be
consistently above the high source threshold for Fe content.
Edible nightshade and spiderplant had more data points below the source threshold
than amaranth and Ethiopian mustard. Neither edible nightshade nor spiderplant were
observed to have a significant genotype, nor GEI effect (Table 3.2).
3.3.2 Calcium Content
The mean Ca content observed in each crop was found to be within the “source”
range (Figure 3.3). Genotype effect was found to be significant within amaranth, Ethiopian
mustard, and edible nightshade (Table 3.2).
Amaranth was observed to have a significant genotype effect on Ca content and was
found to have more data points above the high source threshold compared to the other
crops (Figure 3.3). Genotypes AC45, ACNL, AHTL, and UGAM40 had means above the high
71
source threshold (Figure 3.4), yet none of the amaranth genotypes were observed to have
significantly less variance by GEI effect (Table 3.3).
Ethiopian mustard was found to have a significant genotype effect on Ca content and
an insignificant GEI effect, though none of the genotypes were found to have mean Ca
content substantially greater than the other Ethiopian mustard entries (Figure 3.5). None
of the Ethiopian mustard genotype means were observed to be above the high source
threshold, or below the source threshold. While partitioning of the GEI effect across
Ethiopian mustard genotypes would indicate that some genotypes have greater stability
(Table 3.3), non-significance of effect was more likely for having included fewer trials
analyzed compared to the other crops.
Edible nightshade was found to have a lower mean Ca content compared to the
other crops (Figure 3.3). A significant genotype effect was observed (Table 3.2). The mean
and median of entry SS042 were the highest, observed to be above the source threshold
(Figure 3.6).
3.3.3 Magnesium Content
Amaranth was the only crop not found to have a significant genotype effect on Mg
content (Table 3.2); it was also the only crop with a mean above the high source threshold
(Figure 3.7). Ethiopian mustard, spiderplant and edible nightshade each had a significant
effect by genotype (Table 3.2). Ethiopian mustard was found to have a mean Mg content
below the source threshold; edible nightshade and spiderplant each had means above the
source threshold (Figure 3.7).
The findings of this study would support amaranth being a high source food for Mg
irrespective of genotype as a reliable delivery source of Mg. It is reasonable to speculate
72
that Mg content of amaranth may fall below the high source threshold as some data points
had; AC45, RUAM24, and UGAM40 however, did not fall below the high source threshold for
Mg (Figure 3.8). These varieties may be considered for having greater potential stability,
though all genotypes were found to have significant variation across environments (Table
3.3). When observing these results using the AMMI model, the three genotypes mentioned
to not have been observed to have Mg contents below the high source threshold have
separation from the other entries from having less of a negative interaction from the
Kenyan field trial which was the only environment with a mean Mg content below the high
source threshold across amaranth genotypes (Figure 3.9).
Despite a significant genotype effect observed in each Ethiopian mustard,
spiderplant, and edible nightshade, within each crop no genotype was found to have
substantially preferable stability or content (Figures 10, 11, 12). Results of the mixed model
analysis partitioning GEI by genotype did not indicate that any genotype within each of
these crops to had insignificant GEI effect (not shown).
Ethiopian mustard was found to be a relatively poor source of Mg. ‘Arumeru’ and
‘Chinasaki’ were found to have slightly higher means, though likely not enough to warrant
use as breeding lines for this purpose and if intending to supplement the diet for Mg, the
results of this study find that amaranth, regardless of genotype, would be preferred if
available.
3.3.4 Zinc
The zinc content of each crop across environments was found to be below the source
threshold (Figure 13). The results of this study support that the included crops grown in
the environments tested would not be suitable as a source of Zinc for the human diet.
73
3.4 Conclusions
The results of this study demonstrate a differential capacity of AIVs to deliver Fe, Ca,
and Mg. Each of the samples analyzed contained quantities of Zn below the “source”
threshold, which follows data on leafy green vegetables in the USDA standard reference
database as discussed in Chapter 1.
The observation of samples with Fe content above the “high source” threshold
complemented by Ca and Mg above “high source” thresholds would potentially have low
incidence given Fe becomes less available to plants as the pH increases, while Ca and Mg
becomes less available to plants as pH decreases (Läuchli, 1976; Marschner, 1991; Oertli &
Jacobson, 1969). However, if a plant is genetically adapted to uptake one of more of these
minerals in otherwise limiting conditions, it is reasonable to predict that quantities of these
micronutrients can be accumulated simultaneously at “high source” levels given the
observation that the effect of genotype can overcome environmental limitations (Brown,
1977; Caines & Shennan, 1999; Farnham et al., 2000; Kobayashi & Nishizawa, 2012;
Quintana et al., 1996). The consistent observation of high Fe content in RUAM24, including
observations when Fe was lower in comparison with other entries and when Ca and Mg
were also high indicates the potential for this entry to be characterized as “high source” for
Fe.
The objective description of a variety for application of a Plant Variety Patent (PVP)
would normally be observed for three location/years (environments) in the region and
season of best adaptability (U.S. Department of Agriculture, 2015a). In these studies, the
unique nature of RUAM24 being stable and high in iron is a notable character that could
show its distinction among comparative amaranth leafy green lines in micronutrient
content. With most PVP applications, little focus has been applied to micronutrient content,
74
though in some crops there is consideration for tolerance of limiting conditions as in the
case of soybean (Glycine max), which is graded for iron-chlorosis on calcareous soil (U.S.
Department of Agriculture, 2015b).
The observation of micronutrients in crops over multiple environments provides
needed guidance to characterize those as foods for reduction of micronutrient deficiencies
and general maintenance of health for people who chose foods with an expectation of
micronutrient content. The current study demonstrates that substantial differences in
elemental micronutrient content exist between crops and within crops with respect to
Codex Alimentarius thresholds for micronutrient content.
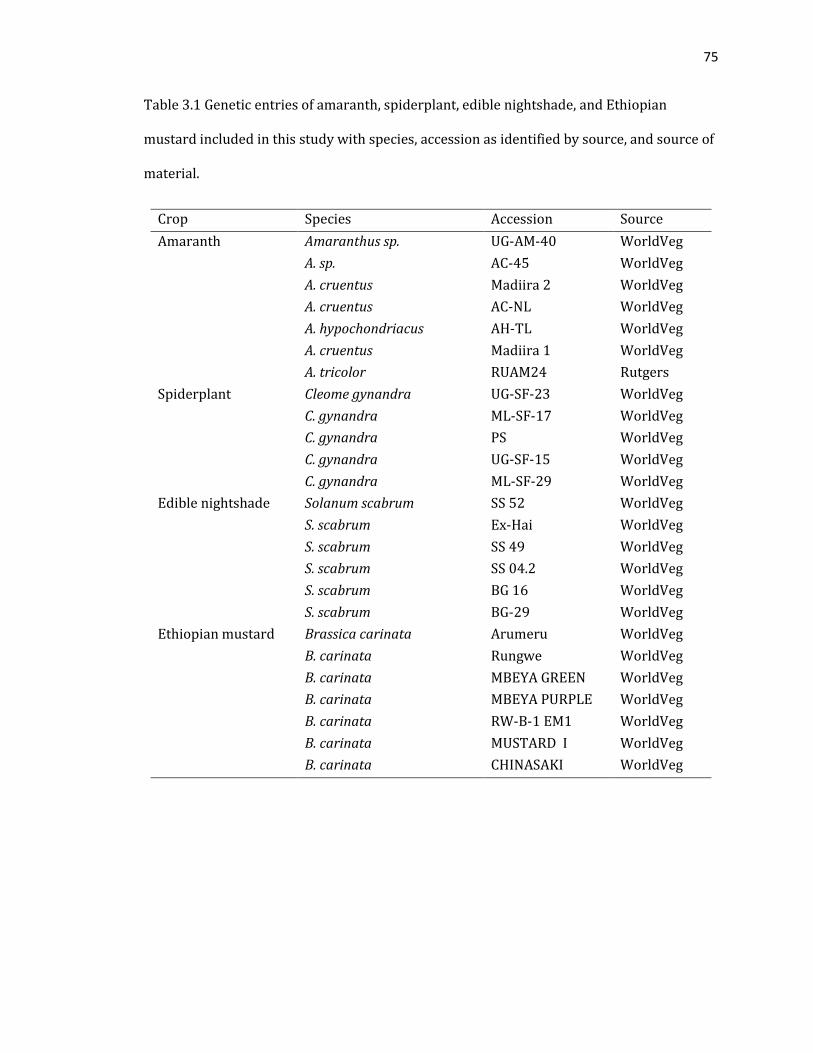
75
Table 3.1 Genetic entries of amaranth, spiderplant, edible nightshade, and Ethiopian
mustard included in this study with species, accession as identified by source, and source of
material.
Crop Species Accession Source
Amaranth Amaranthus sp. UG-AM-40 WorldVeg
A. sp. AC-45 WorldVeg
A. cruentus Madiira 2 WorldVeg
A. cruentus AC-NL WorldVeg
A. hypochondriacus AH-TL WorldVeg
A. cruentus Madiira 1 WorldVeg
A. tricolor RUAM24 Rutgers
Spiderplant Cleome gynandra UG-SF-23 WorldVeg
C. gynandra ML-SF-17 WorldVeg
C. gynandra PS WorldVeg
C. gynandra UG-SF-15 WorldVeg
C. gynandra ML-SF-29 WorldVeg
Edible nightshade Solanum scabrum SS 52 WorldVeg
S. scabrum Ex-Hai WorldVeg
S. scabrum SS 49 WorldVeg
S. scabrum SS 04.2 WorldVeg
S. scabrum BG 16 WorldVeg
S. scabrum BG-29 WorldVeg
Ethiopian mustard Brassica carinata Arumeru WorldVeg
B. carinata Rungwe WorldVeg
B. carinata MBEYA GREEN WorldVeg
B. carinata MBEYA PURPLE WorldVeg
B. carinata RW-B-1 EM1 WorldVeg
B. carinata MUSTARD I WorldVeg
B. carinata CHINASAKI WorldVeg
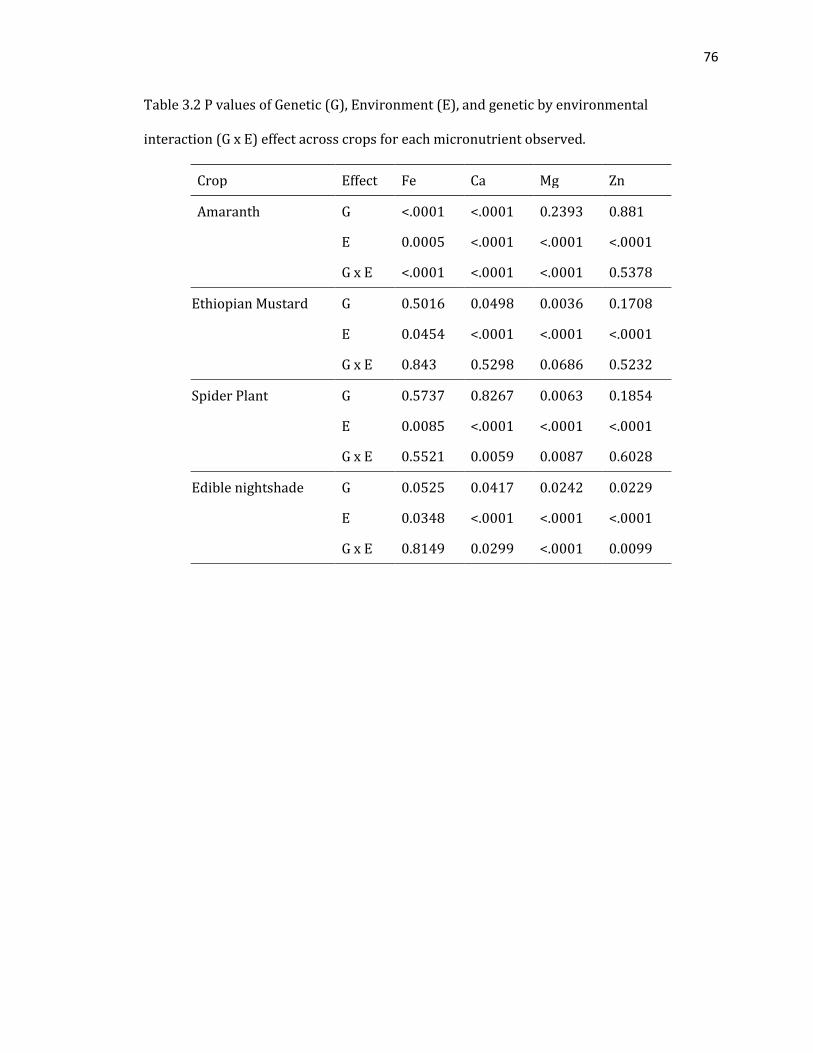
76
Table 3.2 P values of Genetic (G), Environment (E), and genetic by environmental
interaction (G x E) effect across crops for each micronutrient observed.
Crop Effect Fe Ca Mg Zn
Amaranth G <.0001 <.0001 0.2393 0.881
E 0.0005 <.0001 <.0001 <.0001
G x E <.0001 <.0001 <.0001 0.5378
Ethiopian Mustard G 0.5016 0.0498 0.0036 0.1708
E 0.0454 <.0001 <.0001 <.0001
G x E 0.843 0.5298 0.0686 0.5232
Spider Plant G 0.5737 0.8267 0.0063 0.1854
E 0.0085 <.0001 <.0001 <.0001
G x E 0.5521 0.0059 0.0087 0.6028
Edible nightshade G 0.0525 0.0417 0.0242 0.0229
E 0.0348 <.0001 <.0001 <.0001
G x E 0.8149 0.0299 <.0001 0.0099
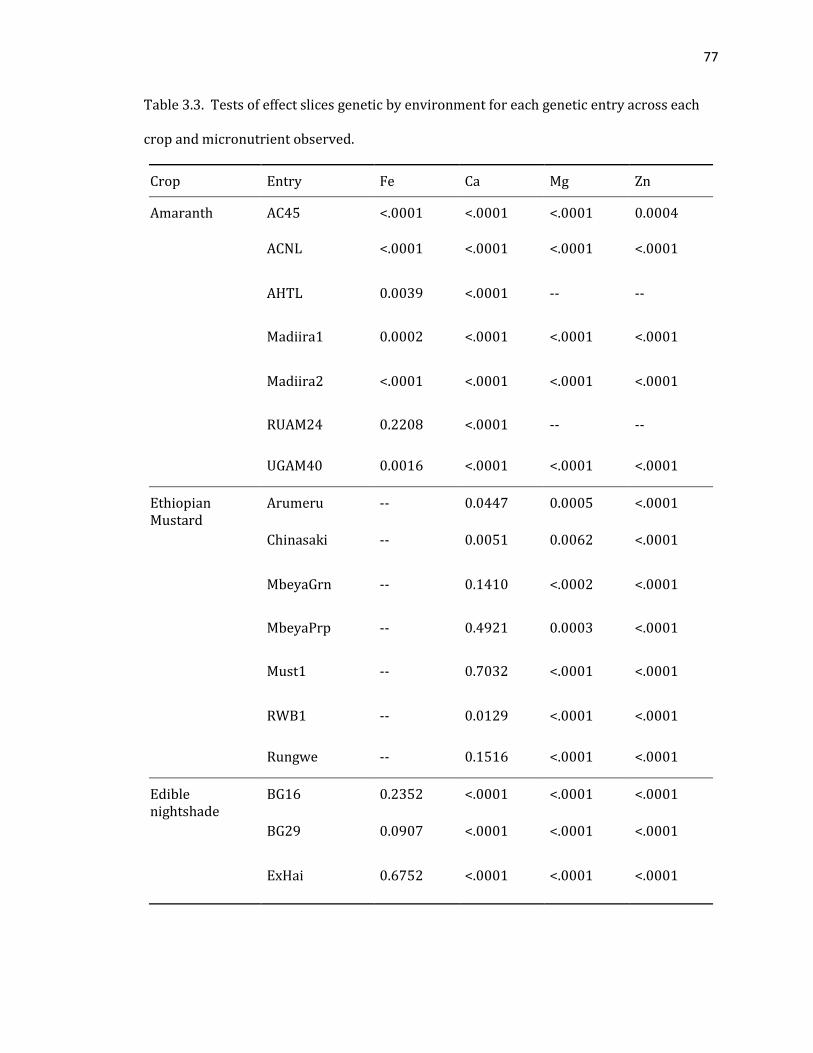
77
Table 3.3. Tests of effect slices genetic by environment for each genetic entry across each
crop and micronutrient observed.
Crop Entry Fe Ca Mg Zn
Amaranth AC45 <.0001 <.0001 <.0001 0.0004
ACNL <.0001 <.0001 <.0001 <.0001
AHTL 0.0039 <.0001 -- --
Madiira1 0.0002 <.0001 <.0001 <.0001
Madiira2 <.0001 <.0001 <.0001 <.0001
RUAM24 0.2208 <.0001 -- --
UGAM40 0.0016 <.0001 <.0001 <.0001
Ethiopian Mustard
Arumeru -- 0.0447 0.0005 <.0001
Chinasaki -- 0.0051 0.0062 <.0001
MbeyaGrn -- 0.1410 <.0002 <.0001
MbeyaPrp -- 0.4921 0.0003 <.0001
Must1 -- 0.7032 <.0001 <.0001
RWB1 -- 0.0129 <.0001 <.0001
Rungwe -- 0.1516 <.0001 <.0001
Edible nightshade
BG16 0.2352 <.0001 <.0001 <.0001
BG29 0.0907 <.0001 <.0001 <.0001
ExHai 0.6752 <.0001 <.0001 <.0001
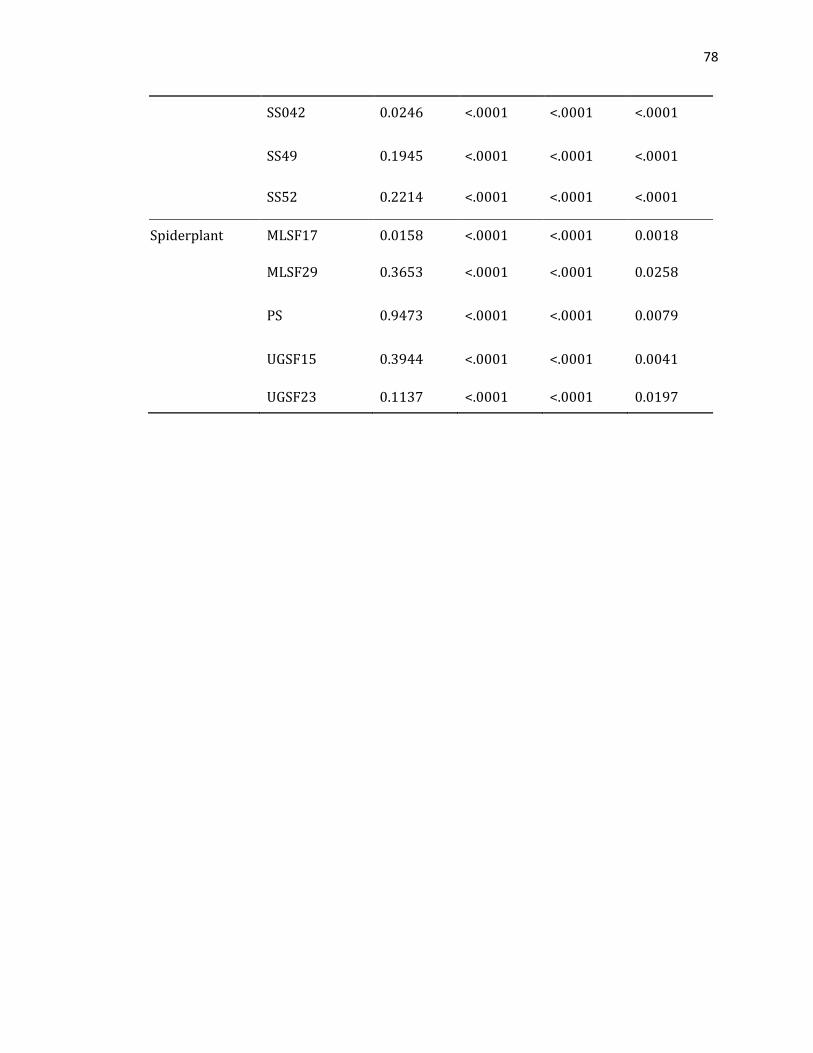
78
SS042 0.0246 <.0001 <.0001 <.0001
SS49 0.1945 <.0001 <.0001 <.0001
SS52 0.2214 <.0001 <.0001 <.0001
Spiderplant MLSF17 0.0158 <.0001 <.0001 0.0018
MLSF29 0.3653 <.0001 <.0001 0.0258
PS 0.9473 <.0001 <.0001 0.0079
UGSF15 0.3944 <.0001 <.0001 0.0041
UGSF23 0.1137 <.0001 <.0001 0.0197
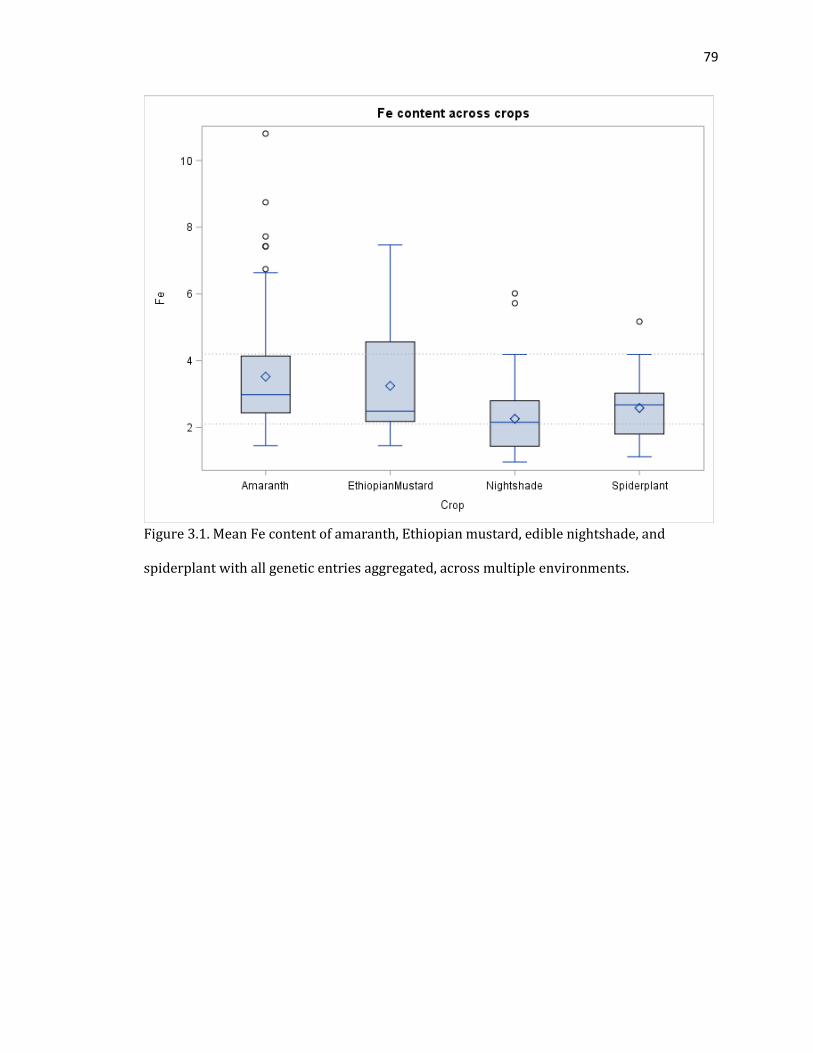
79
Figure 3.1. Mean Fe content of amaranth, Ethiopian mustard, edible nightshade, and
spiderplant with all genetic entries aggregated, across multiple environments.
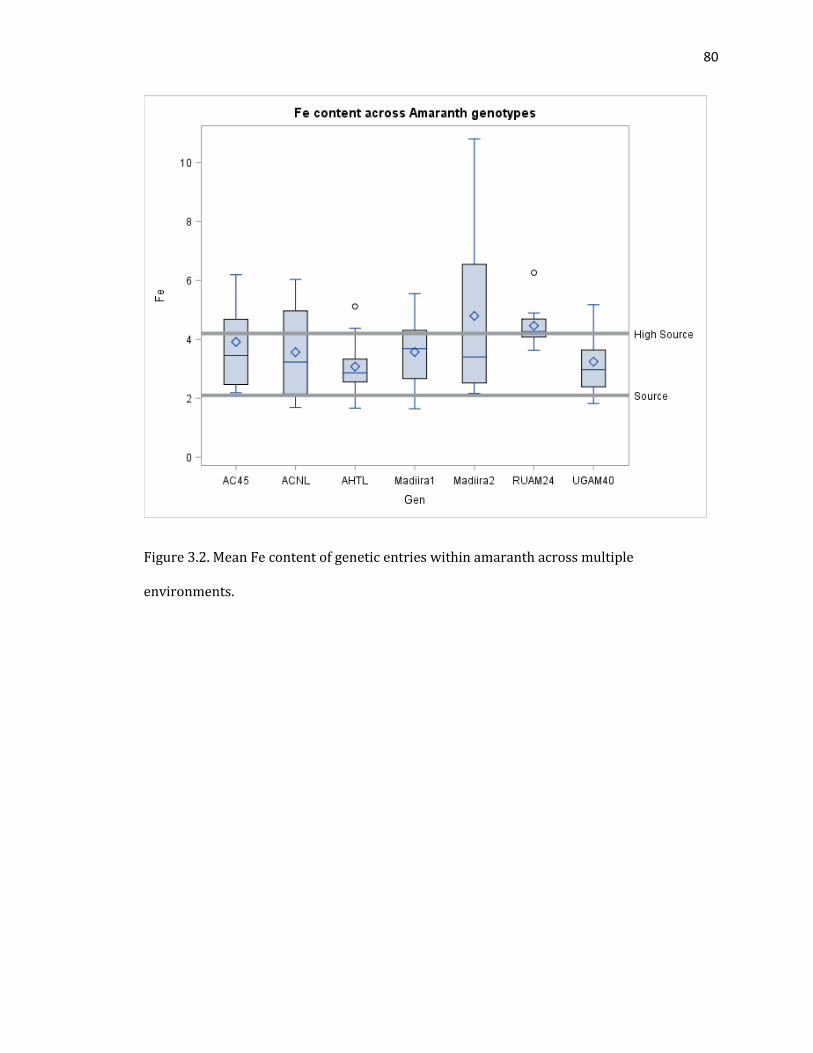
80
Figure 3.2. Mean Fe content of genetic entries within amaranth across multiple
environments.
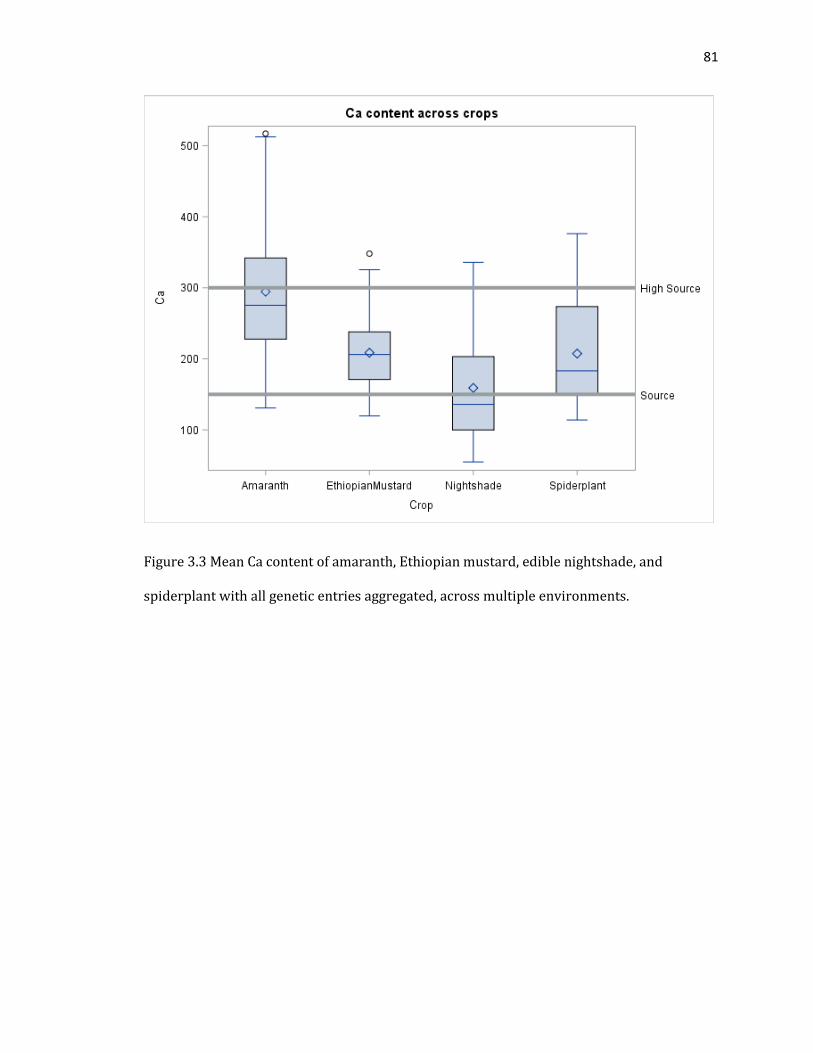
81
Figure 3.3 Mean Ca content of amaranth, Ethiopian mustard, edible nightshade, and
spiderplant with all genetic entries aggregated, across multiple environments.
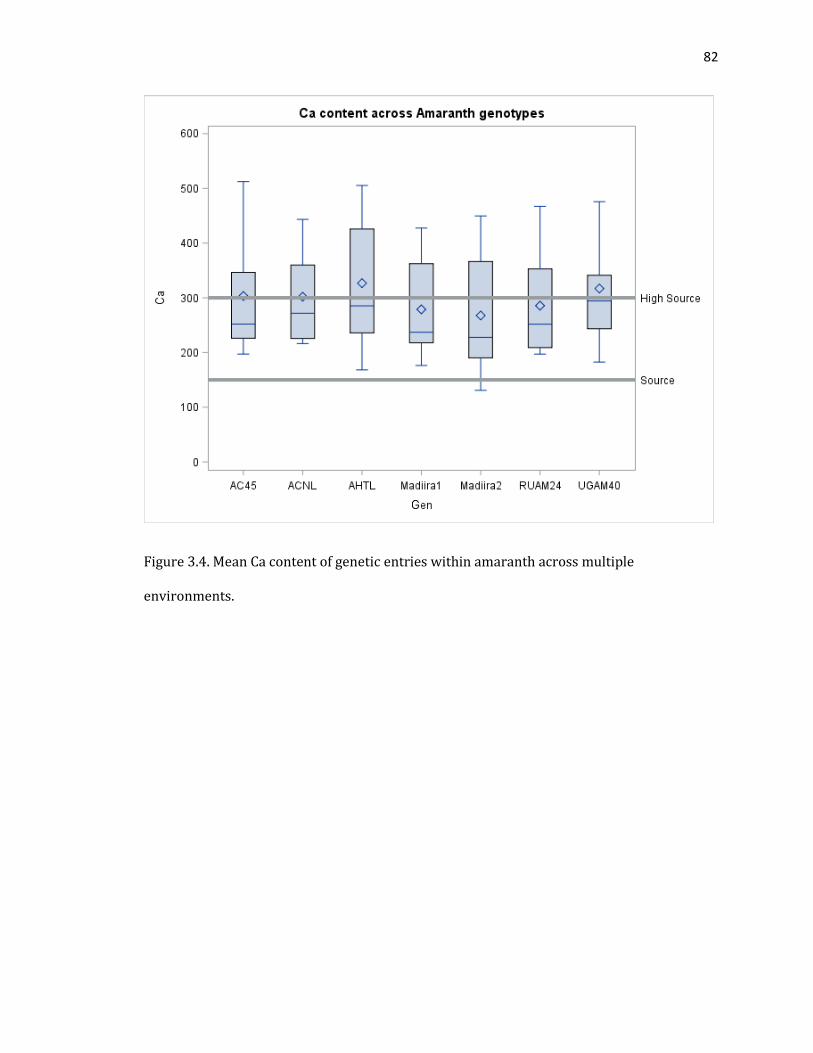
82
Figure 3.4. Mean Ca content of genetic entries within amaranth across multiple
environments.
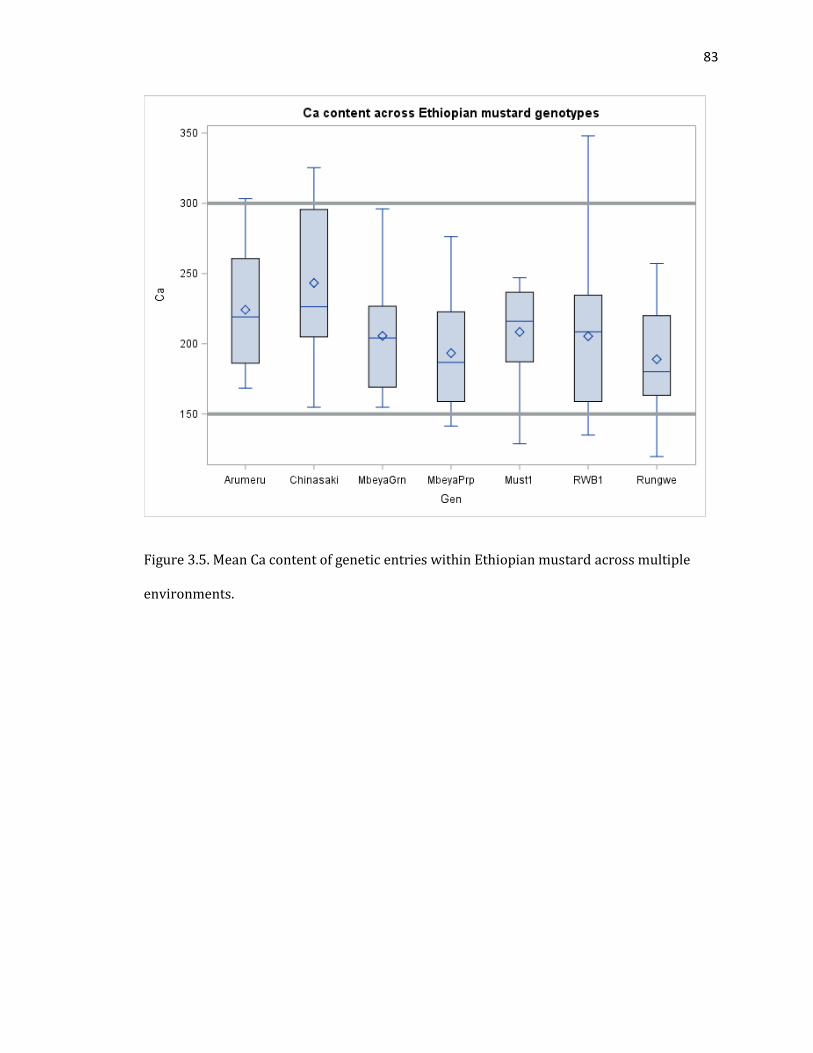
83
Figure 3.5. Mean Ca content of genetic entries within Ethiopian mustard across multiple
environments.
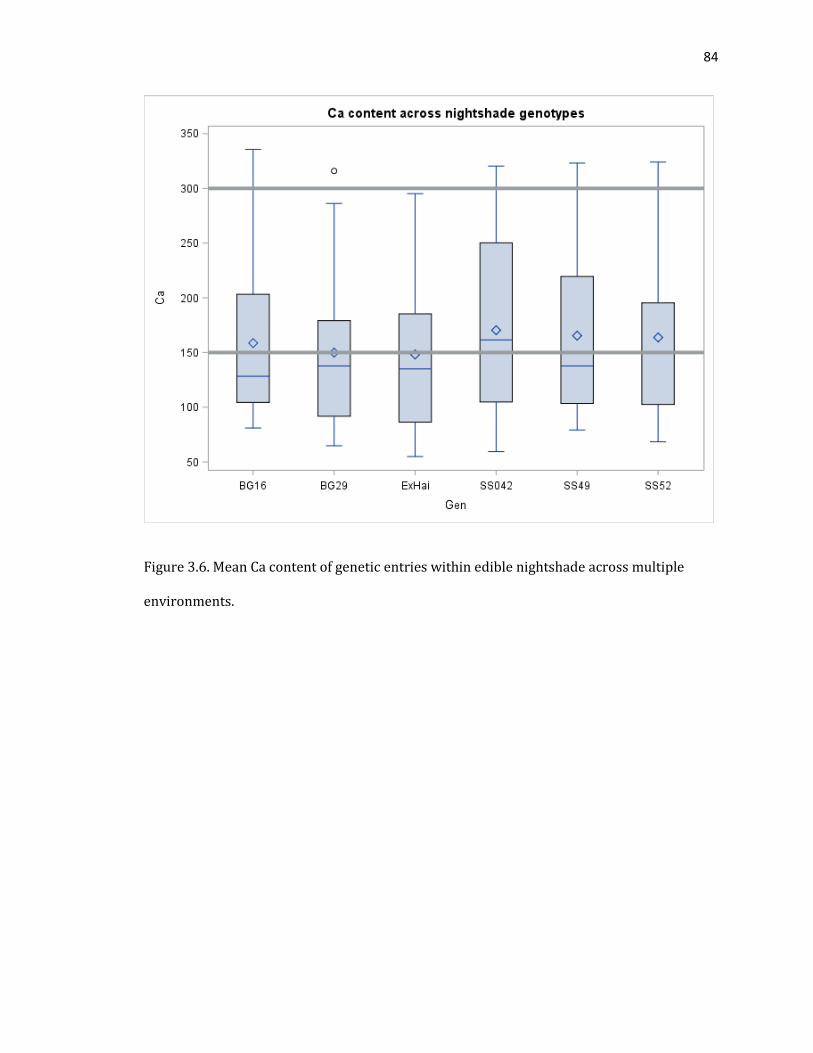
84
Figure 3.6. Mean Ca content of genetic entries within edible nightshade across multiple
environments.
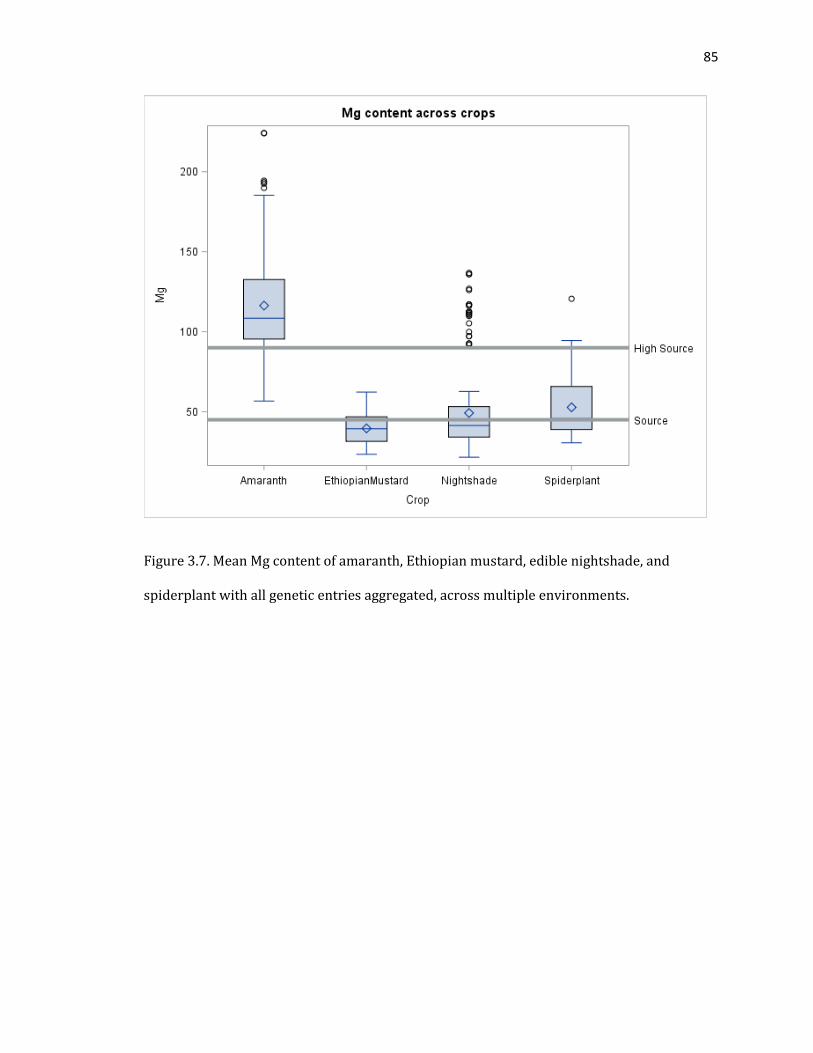
85
Figure 3.7. Mean Mg content of amaranth, Ethiopian mustard, edible nightshade, and
spiderplant with all genetic entries aggregated, across multiple environments.
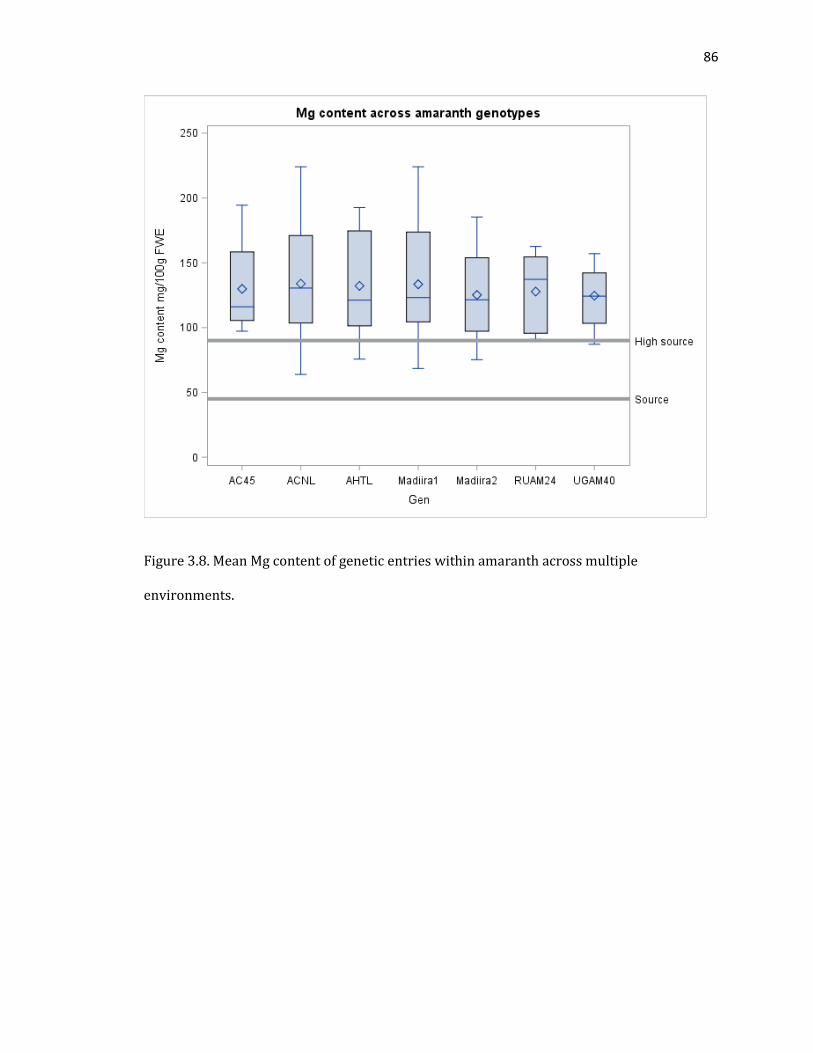
86
Figure 3.8. Mean Mg content of genetic entries within amaranth across multiple
environments.
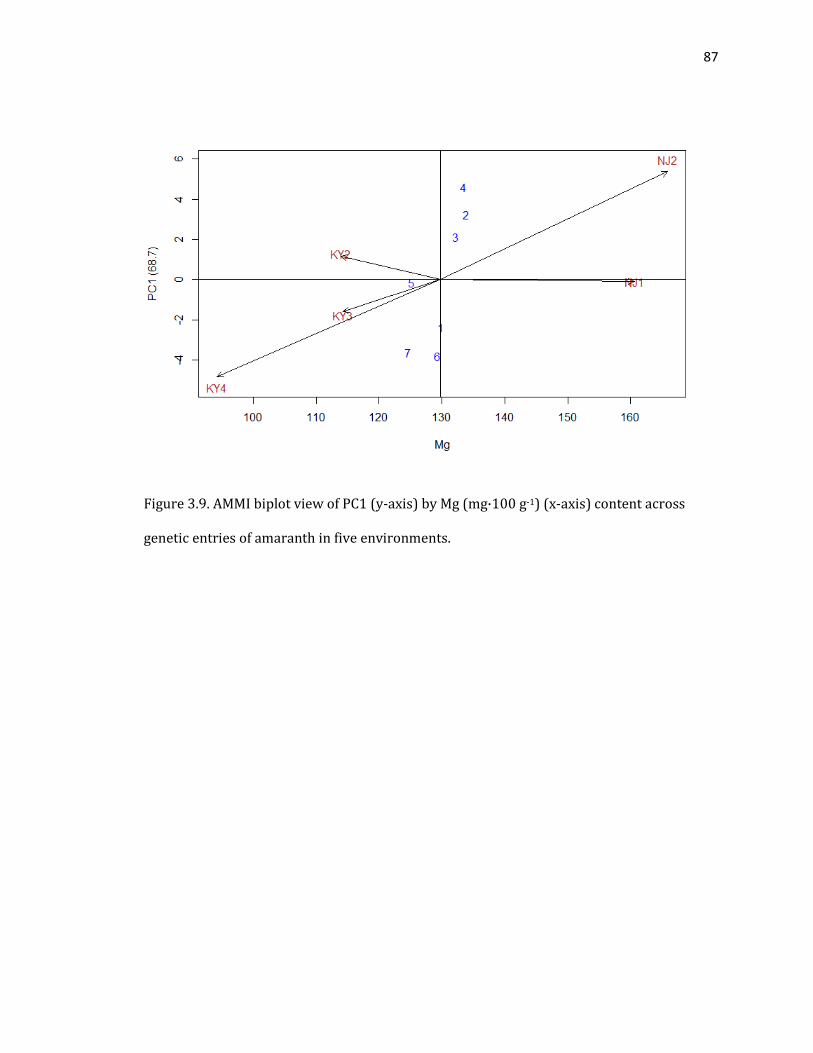
87
Figure 3.9. AMMI biplot view of PC1 (y-axis) by Mg (mg·100 g-1) (x-axis) content across
genetic entries of amaranth in five environments.
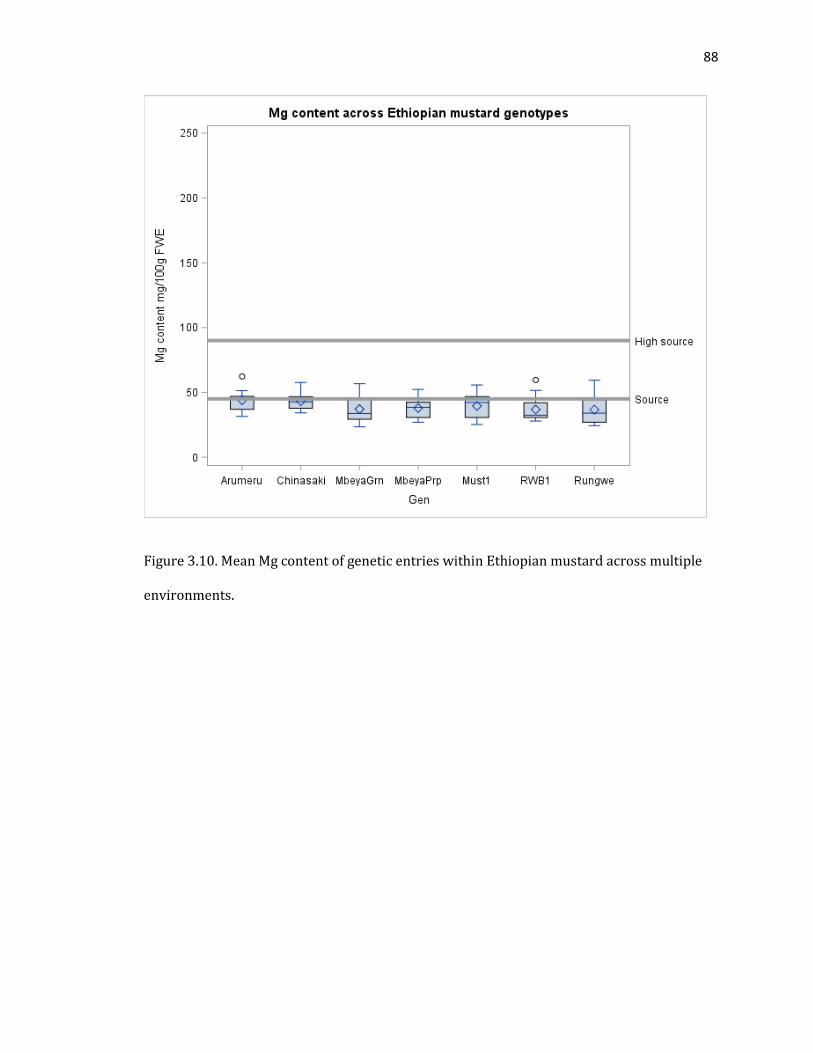
88
Figure 3.10. Mean Mg content of genetic entries within Ethiopian mustard across multiple
environments.
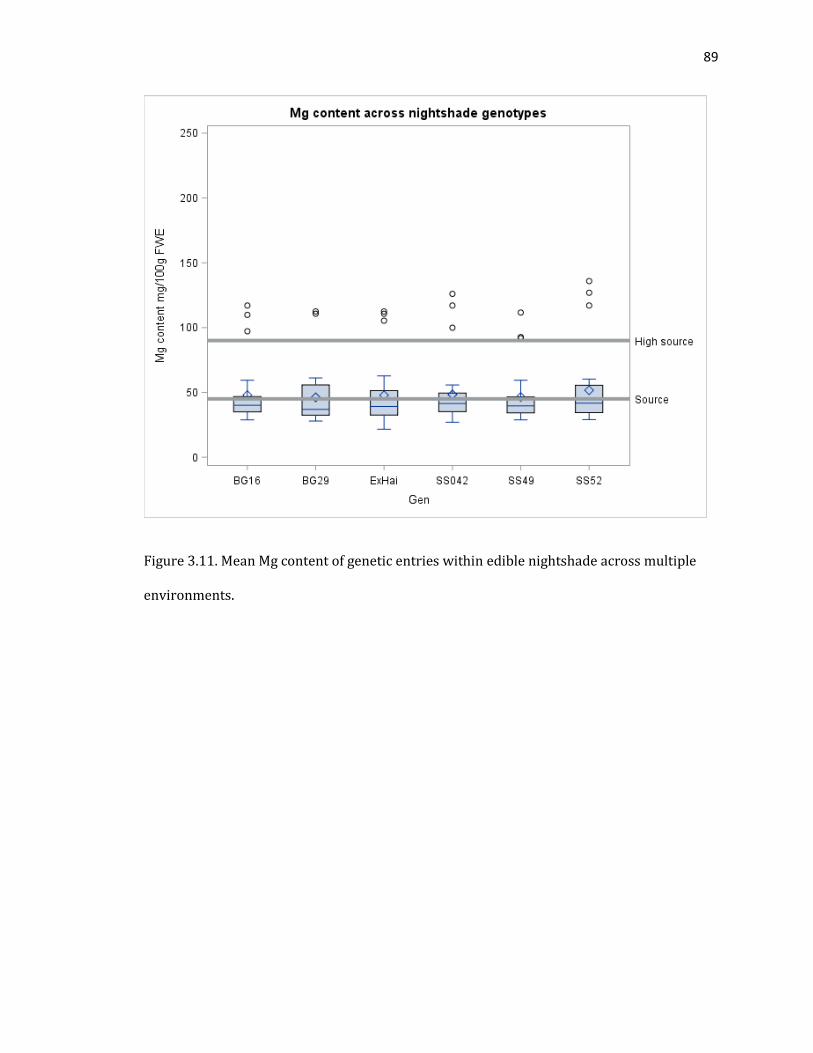
89
Figure 3.11. Mean Mg content of genetic entries within edible nightshade across multiple
environments.
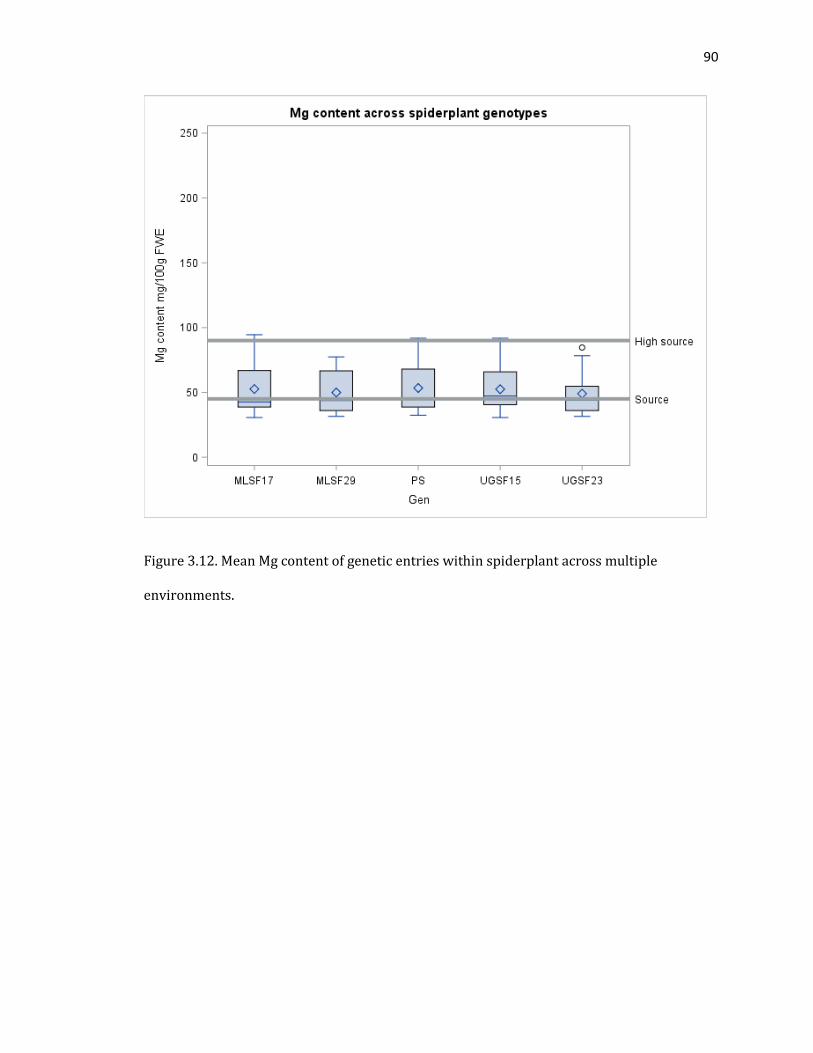
90
Figure 3.12. Mean Mg content of genetic entries within spiderplant across multiple
environments.
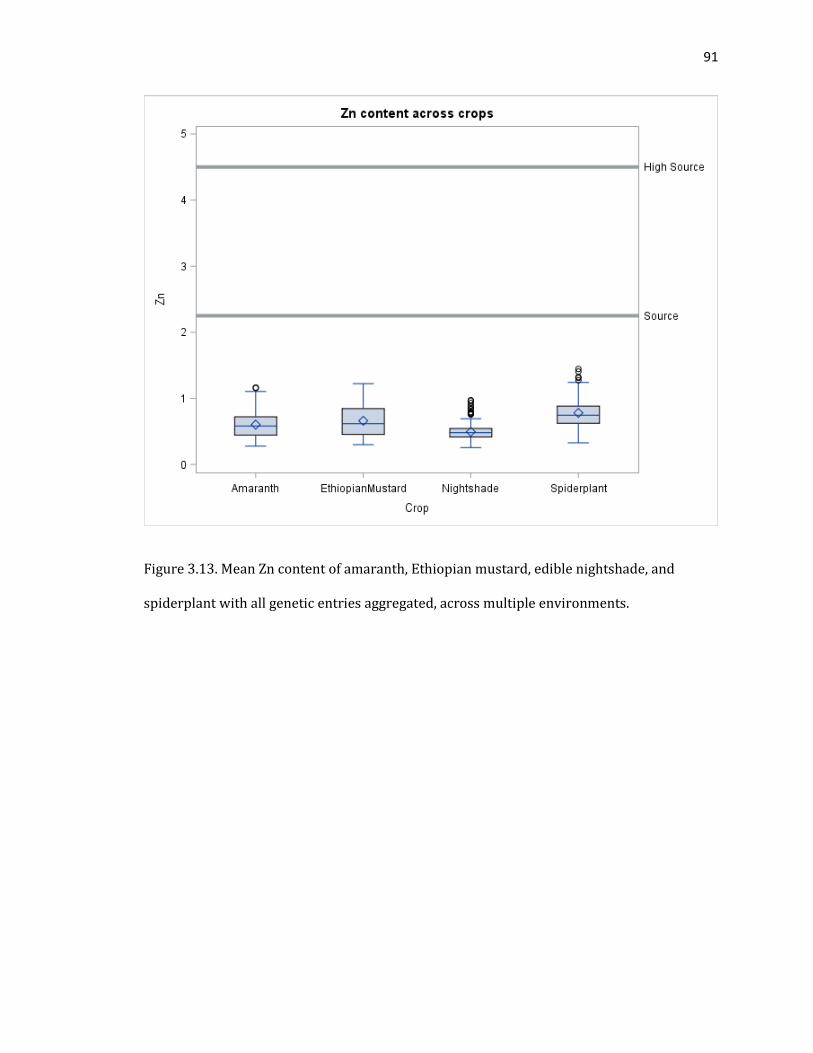
91
Figure 3.13. Mean Zn content of amaranth, Ethiopian mustard, edible nightshade, and
spiderplant with all genetic entries aggregated, across multiple environments.
92
3.5 References
Achigan-Dako, E. G., Sogbohossou, O. E. D., & Maundu, P. (2014). Current knowledge on
Amaranthus spp.: research avenues for improved nutritional value and yield in leafy
amaranths in sub-Saharan Africa. Euphytica, 197(3), 303–317.
http://doi.org/10.1007/s10681-014-1081-9
Bednarz, C. W., Bridges, D. C., & Brown, S. M. (2000). Analysis of Cotton Yield Stability Across
Population Densities. Agronomy Journal, 92(1), 128.
http://doi.org/10.2134/agronj2000.921128x
Brown, J. C. (1977). Genetically Controlled Chemical Factors Involved in Absorption and
Transport of Iron by Plants. In Kenneth N. Raymond (Ed.), Bioinorganic Chemistry—II (pp.
93–103). Washington, DC: American Chemical Society. http://doi.org/10.1021/ba-1977-
0162
Brown, J. C., Chaney, R. L., & Ambler, J. E. (1971). A New Tomato Mutant Inefficient in the
Transport of Iron. Physiologia Plantarum, 25(1), 48–53. http://doi.org/10.1111/j.1399-
3054.1971.tb01086.x
Brown, J. C., & Jones, W. E. (1975). Heavy‐metal toxicity in plants 1. A crisis in embryo.
Communications in Soil Science and Plant Analysis, 6(4), 421–438.
http://doi.org/10.1080/00103627509366579
Byrnes, D. R., Dinssa, F. F., Weller, S. C., & Simon, J. E. (2017). Elemental Micronutrient Content
and Horticultural Performance of Various Vegetable Amaranth Genotypes. Journal of the
American Society for Horticultural Science, 142(4), 265–271.
http://doi.org/10.21273/JASHS04064-17
93
Caines, A. M., & Shennan, C. (1999). Growth and nutrient composition of Ca2+ use effkient and
Ca2+ use inefficient genotypes of tomato. Plant Physiol. Biochem., 37(7/8), 559–567.
Cakmak, I., Sari, N., Marschner, H., Ekiz, H., Kalayci, M., Yilmaz, A., & Braun, H. J. (1996).
Phytosiderophore release in bread and durum wheat genotypes differing in zinc efficiency.
Plant and Soil, 180(2), 183–189. http://doi.org/10.1007/BF00015301
Codex Alimentarius. (1997). Guidelines for Use of Nutrition and Health Claims. Guidelines for
Use of Nutrition and Health Claims, CAC/GL 23-. http://www.fao.org/fao-who-
codexalimentarius/sh-
proxy/en/?lnk=1&url=https%3A%2F%2Fworkspace.fao.org%2Fsites%2Fcodex%2FStandard
s%2FCAC+GL+23-1997%2FCXG_023e.pdf
Crossa, J. (1990). Additive Main Effects and Multiplicative Interaction Analysis of Two
International Maize Cultivar Trials. Crop Science, 30(3), 493–500.
Crossa, J. (2012). From genotype × environment interaction to gene × environment interaction.
Current Genomics, 13(3), 225–44. http://doi.org/10.2174/138920212800543066
De Vita, P., Mastrangelo, A. M., Matteu, L., Mazzucotelli, E., Virzì, N., Palumbo, M., … Cattivelli,
L. (2010). Genetic improvement effects on yield stability in durum wheat genotypes grown
in Italy. Field Crops Research, 119(1), 68–77. http://doi.org/10.1016/J.FCR.2010.06.016
Deltsidis, A., Aalia, K. B., Reid, M., Thompson, J., Mitcham, E., Hansen, B., … Jarman, A. (2018).
Chimney Solar Dryer Manual Improved Solar Dryer for Fruits and Vegetables. Davis, Ca.
https://horticulture.ucdavis.edu/sites/g/files/dgvnsk1816/files/extension_material_files/C
himney Solar Dryer Manual.pdf
Dia, M., Wehner, T. C., Hassell, R., Price, D. S., Boyhan, G. E., Olson, S., … Tolla, G. E. (2016).
94
Genotype × Environment Interaction and Stability Analysis for Watermelon Fruit Yield in
the United States. Crop Science, 56(4), 1645. http://doi.org/10.2135/cropsci2015.10.0625
Edwards, J. W. (2016). Genotype × Environment Interaction for Plant Density Response in Maize
( L.). Crop Science, 56(4), 1493. http://doi.org/10.2135/cropsci2015.07.0408
Erenoglu, B., Cakmak, I., Marschner, H., Romheld, V., Eker, S., Daghan, H., … Ekiz, H. (1996).
Phytosiderophore release does not relate well with zinc efficiency in different bread wheat
genotypes. Journal of Plant Nutrition, 19(12), 1569–1580.
http://doi.org/10.1080/01904169609365222
Fan, X.-M., Kang, M. S., Chen, H., Zhang, Y., Tan, J., & Xu, C. (2007). Yield Stability of Maize
Hybrids Evaluated in Multi-Environment Trials in Yunnan, China. Agronomy Journal, 99(1),
220. http://doi.org/10.2134/agronj2006.0144
Farnham, M. W., Grusak, M. A., & Wang, M. (2000). Calcium and Magnesium Concentration of
Inbred and Hybrid Broccoli Heads. J. AMER. SOC. HORT. SCI, 125(3), 344–349.
http://journal.ashspublications.org/content/125/3/344.full.pdf
Feed the Future. (2016). Feed the Future Indicator Handbook Definition Sheets.
https://feedthefuture.gov/sites/default/files/resource/files/Feed_the_Future_Indicator_H
andbook_Sept2016.pdf
Gauch, H. G., Piepho, H.-P., & Annicchiarico, P. (2008). Statistical Analysis of Yield Trials by AMMI
and GGE: Further Considerations. Crop Science, 48(3), 866.
http://doi.org/10.2135/cropsci2007.09.0513
Gilbert, J. L., Guthart, M. J., Gezan, S. A., Pisaroglo de Carvalho, M., Schwieterman, M. L.,
Colquhoun, T. A., … Olmstead, J. W. (2015). Identifying Breeding Priorities for Blueberry
95
Flavor Using Biochemical, Sensory, and Genotype by Environment Analyses. PLOS ONE,
10(9), e0138494. http://doi.org/10.1371/journal.pone.0138494
Gollob, H. F. (1968). A statistical model which combines features of factor analytic and analysis
of variance techniques. Psychometrika, 33, 73–115.
Graham, R. D., Ascher, J. S., & Hynes, S. C. (1992). Selecting zinc-efficient cereal genotypes for
soils of low zinc status. Plant and Soil, 146(1–2), 241–250.
http://doi.org/10.1007/BF00012018
Greenleaf, W. H., & Adams, F. (1969). Genetic control of blossom-end rot disease in tomatoes
through calcium metabolism. J Amer Soc Hort Sci. http://agris.fao.org/agris-
search/search.do?recordID=US201301233125
Gregorio, G. B., Senadhira, D., Htut, H., & Graham, R. D. (2000). Breeding for Trace Mineral
Density in Rice. Food and Nutrition Bulletin, 21(4), 382–386.
http://doi.org/10.1177/156482650002100407
Guillen-Portal, F.R., Baltensperger, D.D., Nelson, L.A., D’Croz-Mason, N. (1999). Variability in
“Plainsman” Grain Amaranth. Perspectives on New Crops and New Uses. Alexandria, VA:
ASHS Press. https://hort.purdue.edu/newcrop/proceedings1999/v4-184.html
Gusmini, G., & Wehner, T. C. (2007). Heritability and Genetic Variance Estimates for Fruit Weight
in Watermelon. HortScience, 42(6), 1332–1336.
http://hortsci.ashspublications.org/content/42/6/1332.abstract?sid=af2b517a-0405-4ef1-
9ac3-af66bc15a838
Jat, R. K., Singh, P., Jat, M. L., Dia, M., Sidhu, H. S., Jat, S. L., … Ridaura, S. L. (2018). Heat stress
and yield stability of wheat genotypes under different sowing dates across agro-
96
ecosystems in India. Field Crops Research, 218, 33–50.
http://doi.org/10.1016/J.FCR.2017.12.020
Kang, M. S. (2004). Breeding: Genotype-by-environment interaction. In Encyclopedia of plant
and crop science (pp. 218–221). New York: Marcel-Dekker.
Kenward, M. G., & Roger, J. H. (1997). Small Sample Inference for Fixed Effects from Restricted
Maximum Likelihood. Biometrics, 53(3), 983. http://doi.org/10.2307/2533558
Kobayashi, T., & Nishizawa, N. K. (2012). Iron Uptake, Translocation, and Regulation in Higher
Plants. Annual Review of Plant Biology, 63(1), 131–152. http://doi.org/10.1146/annurev-
arplant-042811-105522
Kodkany, B. S., Bellad, R. M., Mahantshetti, N. S., Westcott, J. E., Krebs, N. F., Kemp, J. F., &
Hambidge, K. M. (2013). Biofortification of Pearl Millet with Iron and Zinc in a Randomized
Controlled Trial Increases Absorption of These Minerals above Physiologic Requirements in
Young Children. The Journal of Nutrition, 143(9), 1489–1493.
http://doi.org/10.3945/jn.113.176677
Läuchli, A. (1976). Genotypic Variation in Transport. In U. Lüttge & M. G. Pitman (Eds.),
Transport in Plants (2nd ed., pp. 372–393). Berlin: Springer. http://doi.org/10.1007/978-3-
642-66230-0_9
Luoh, J. W., Begg, C. B., Symonds, R. C., Ledesma, D., & Yang, R.-Y. (2014). Nutritional Yield of
African Indigenous Vegetables in Water-Deficient and Water-Sufficient Conditions. Food
and Nutrition Sciences, 05(09), 812–822. http://doi.org/10.4236/fns.2014.59091
Malosetti, M., Ribaut, J.-M., & van Eeuwijk, F. A. (2013). The statistical analysis of multi-
environment data: modeling genotype-by-environment interaction and its genetic basis.
97
Frontiers in Physiology, 4, 44. http://doi.org/10.3389/fphys.2013.00044
Malosetti, M., Voltas, J., Romagosa, I., Ullrich, S. E., & Eeuwijk, F. A. van. (2004). Mixed models
including environmental covariables for studying QTL by environment interaction.
Euphytica, 137(1), 139–145. http://doi.org/10.1023/B:EUPH.0000040511.46388.ef
Mandel, J. (1971). A New Analysis of Variance Model for Non-additive Data. Technometrics,
13(1), 1–18. http://doi.org/10.1080/00401706.1971.10488751
Marschner, H. (1991). Mechanisms of adaptation of plants to acid soils. Plant and Soil, 134(1), 1–
20. http://doi.org/10.1007/BF00010712
Masuda, H., Ishimaru, Y., Aung, M. S., Kobayashi, T., Kakei, Y., Takahashi, M., … Nishizawa, N. K.
(2012). Iron biofortification in rice by the introduction of multiple genes involved in iron
nutrition. Scientific Reports, 2, 543. http://doi.org/10.1038/srep00543
Mathews, K. L., Malosetti, M., Chapman, S., McIntyre, L., Reynolds, M., Shorter, R., & van
Eeuwijk, F. (2008). Multi-environment QTL mixed models for drought stress adaptation in
wheat. Theoretical and Applied Genetics, 117(7), 1077–1091.
http://doi.org/10.1007/s00122-008-0846-8
Mekbib, F. (2003). Yield stability in common bean (Phaseolus vulgaris L.) genotypes. Euphytica,
130(2), 147–153. http://doi.org/10.1023/A:1022878015943
Mulema, J. M. K., Adipala, E., Olanya, O. M., & Wagoire, W. (2008). Yield stability analysis of late
blight resistant potato selections. Experimental Agriculture, 44(02), 145–155.
http://doi.org/10.1017/S0014479708006133
National Resource Council. (2006). Lost Crops of Africa (Volume II). Washington, D.C.: National
98
Academies Press. http://doi.org/10.17226/11763
Oertli, J. J., & Jacobson, L. (1969). Some Quantitative Considerations in Iron Nutrition of Higher
Plants. Plant Physiol., 35(5), 683–688.
https://www.ncbi.nlm.nih.gov/pmc/articles/PMC406025/pdf/plntphys00474-0135.pdf
Ortiz-Monasterio, J. I., Palacios-Rojas, N., Meng, E., Pixley, K., Trethowan, R., & Peña, R. J. (2007).
Enhancing the mineral and vitamin content of wheat and maize through plant breeding.
Journal of Cereal Science, 46(3), 293–307. http://doi.org/10.1016/j.jcs.2007.06.005
Quintana, J. M., Harrison, H. C., Nienhuis, J., Palta, J. P., & Grusak, M. A. (1996). Variation in
Calcium Concentration among Sixty S1 Families and Four Cultivars of Snap Bean (Phaseolus
vulgaris L.). Journal of the American Society for Horticultural Science (Vol. 121). American
Society for Horticultural Science.
http://journal.ashspublications.org/content/121/5/789.short
Riday, H., & Brummer, E. C. (2006). Persistence and Yield Stability of Intersubspecific Alfalfa
Hybrids. Crop Science, 46(3), 1058. http://doi.org/10.2135/cropsci2005.0272
Römheld, V., & Marschner, H. (1986). Evidence for a specific uptake system for iron
phytosiderophores in roots of grasses. Plant Physiology, 80(1), 175–80.
http://doi.org/10.1104/PP.80.1.175
Schönfeldt, H. C., & Pretorius, B. (2011). The nutrient content of five traditional South African
dark green leafy vegetables—A preliminary study. Journal of Food Composition and
Analysis, 24(8), 1141–1146. http://doi.org/10.1016/j.jfca.2011.04.004
Shukla, S., Bhargava, A., Chatterjee, A., Pandey, A. C., & Mishra, B. K. (2010). Diversity in
phenotypic and nutritional traits in vegetable amaranth (Amaranthus tricolor), a
99
nutritionally underutilised crop. Journal of the Science of Food and Agriculture, 90(1), 139–
44. http://doi.org/10.1002/jsfa.3797
Shukla, S., Bhargava, A., Chatterjee, A., Srivastava, J., Singh, N., & Singh, S. P. (2006). Mineral
profile and variability in vegetable amaranth (Amaranthus tricolor). Plant Foods for Human
Nutrition (Dordrecht, Netherlands), 61(1), 23–8. http://doi.org/10.1007/s11130-006-0004-
x
Tumwegamire, S., Rubaihayo, P. R., Grüneberg, W. J., LaBonte, D. R., Mwanga, R. O. M., &
Kapinga, R. (2016). Genotype × Environment Interactions for East African Orange-Fleshed
Sweetpotato Clones Evaluated across Varying Ecogeographic Conditions in Uganda. Crop
Science, 56(4), 1628. http://doi.org/10.2135/cropsci2015.10.0612
U.S. Department of Agriculture. (2015a). Objective Description of Variety: Spinach (Spinacia
oleracea L.). https://www.ams.usda.gov/sites/default/files/media/83-Spinach ST-470-83
2015.pdf
U.S. Department of Agriculture. (2015b). ST 470-02 Soybean.
https://www.ams.usda.gov/sites/default/files/media/02-Soybean ST-470-02 2015.pdf
van der Voet, H., Perry, J. N., Amzal, B., & Paoletti, C. (2011). A statistical assessment of
differences and equivalences between genetically modified and reference plant varieties.
BMC Biotechnology, 11(1), 15. http://doi.org/10.1186/1472-6750-11-15
Weller, S. C., Van Wyk, E., & Simon, J. E. (2015). Sustainable production for more resilient food
production systems: case study of African indigenous vegetables in eastern Africa. In J. D.
H. Keatinge (Ed.), Acta Horticulturae XXIX IHC - Int. Symp. on Promoting the Future of
Indigenous Vegetables Worldwide. International Society of Horticultural Scientists.
100
Yan, W., Hunt, L. A., Sheng, Q., & Szlavnics, Z. (2000). Cultivar Evaluation and Mega-Environment
Investigation Based on the GGE Biplot. Crop Science, 40(3), 597.
http://doi.org/10.2135/cropsci2000.403597x
Zobel, R. W., Wright, M. J., & Gauch, H. G. (1988). Statistical Analysis of a Yield Trial. Agronomy
Journal, 80(3), 388–393.
101
Chapter 4 Selection for improved Fe content in vegetable amaranth
4.1 Introduction
Amaranth is a leafy green vegetable crop consumed as part of traditional meals
within communities in many of the countries which are most severely and consistently
afflicted by iron deficiency anemia, globally (National Resource Council, 1984; World Health
Organization, 2010). While leafy green vegetables can often be characterized as a high
source of Vitamin A, this class of crops is often found to contain quantities of elemental
micronutrients below respective “source” thresholds as discussed in Chapter 1.
Results presented in Chapter 3 demonstrate that stable, high source levels of Fe can
be observed within amaranth due to genotype. Entry RUAM24 shows promise as a
potential cultivar and breeding line following observations described in Chapters 2 and 3,
though it is unlikely to have the capacity for introgression through traditional breeding into
currently promoted by the World Vegetable Center (WorldVeg) as RUAM24 has been
identified as Amaranthus tricolor (2n=32) while ‘Madiira 1’ has been identified as
Amaranthus cruentus (2n=34) (Bonasora, Poggio, & Greizerstein, 2013; Pal, 1972).
The amaranth species characterized primarily as vegetable-type i.e. A. lividus, A.
tricolor have been described as having very low rates of outcrossing in the field (Pal, 1972).
In contrast, the outcrossing rates of amaranth species characterized primarily as grain-type
i.e, Cruentus, hyprochondriacus, caudatus have been described as ranging from 3.5 to 34%
(Hauptli & Jain, 1985; Jain, Hauptil, & Vaidya, 1982). Despite often being referred to as
“grain-type”, most of the cultivars promoted as leafy green vegetables by the World
Vegetable Center in East and Southern Africa are of these species.
102
Response to single plant selection has previously been found to be successful in
amaranth (Baltensperger, Weber, & Nelson, 1992) as well as selection within discrete
landrace entries (Hauptli & Jain, 1985). To introduce an A. crutentus, with improved Fe
content complementing a market-ready phenotype, a search for high-performance within
the latent segregation of Fe content was initiated.
4.2 Materials and Methods
4.2.1 Initial evaluation
Seeds of cv. Madiira1 from WorldVeg (Arusha, TZ) were sown January 16, 2017 in
128-cell trays with growing mix (Fafard Grow Mix 2; Sun Gro Horticulture, Agawam, MA)
under 14 h day high pressure sodium lights at the Rutgers University Agriculture
Experiment Station Greenhouses in New Brunswick, NJ. Thirty seedlings were transplanted
on Feb 17, 2017 to individual 1-gallon pots with the same growing mix that was used for
seed trays. Plants were under automated irrigation with individual lines running to each
pot. Samples were obtained on March 24, 2017 using a cutback harvesting method leaving
lateral shoots to grow for subsequent seed harvest. Samples were placed in separate paper
bags and dried in a convection oven at 40°C for three days, when samples were crisp and
easily broken apart by hand yet still green in color. Subsamples of the dried harvested
leaves were ground using a shearing-action mill and submitted to Penn State Agricultural
Analytical Services Laboratory, University Park, PA for elemental micronutrient analysis by
inductively coupled plasma mass spectrometry (ICP-MS).
The Fe content from results of greenhouse evaluation ranged from 5.2 mg Fe/100g
FWE to 9.2 mg Fe/100g FWE (Table 4.1). The two individual plants with the highest Fe
content, 36-20 and 36-30, with 9.2 and 8.5 mg Fe/100g FWE respectively, were moved to a
growth chamber on June 7, 2017 under 10 h light, 14 h dark to induce flowering. Seed was
103
collected August 17, 2018 from each plant and transferred to WorldVeg in Arusha,
Tanzania.
4.2.2 Field evaluation
Twenty progeny entries of each ‘36-20’, ‘36-30’, and of the original ‘Madirra1’ were
sown in 72-cell trays with sterilized media composed of forest soil/compost, manure, sand,
and rice husks in a ratio of 3:2:1:1 by mass. 20N–4.4P–8.3K fertilizer was applied to beds at
200 kg·ha-1 prior to transplanting on January 16, 2018 at the WorldVeg research site in
Arusha, Tanzania (lat. 36.8ºE, long. 3.4°S, 1290 m elevation). Plants were grown in plots
separated by parent. The site is characterized by well-drained clay loam soil with pH 6.4.
Furrow irrigation was applied as needed.
Samples were collected on February 20, 2018 by cutting at the axial stem 10 cm
from the soil line to allow grow-back, separating any thick stems included in the harvest
from the edible portion as described in Chapter 2. Samples were dried at the WorldVeg
Arusha site in a convection oven at 40°C and transferred to Rutgers University where
subsamples of the dried harvested leaves were ground using a shearing-action mill and
submitted to Penn State Agricultural Analytical Services Laboratory, University Park, PA for
elemental micronutrient analysis by ICP-MS.
4.2.3 Statistical analysis
Plots of comparative histograms and boxplots of Fe content for each population were
produced using Proc Univariate and descriptive statistical analysis was performed using
Proc Means, SAS (version 9.4; SAS Institute, Cary, NC).
104
4.3 Results and Discussion
The mean, median, and 95% two-sided confidence intervals for Fe content of each
population was within the source range for Fe content as defined by Codex Alimentarius
labeling guidelines (Codex Alimentarius, 1997) (Table 4.2).
Response to selection was limited to a reduction in variance in both selection
populations. The variance of Fe content within the original Madiira1 was slightly more than
11 and 20 multiples higher than the progeny of selections AM36-20 and AM36-30,
respectively (Table 4.2). This indicates that selection increased homogeneity of loci
associated with traits that result in the accumulation of Fe in leaf parts.
The mean and median Fe content was highest in Madiira1 (Table 4.2). Despite the
substantially higher variance observed in the Madiira1 population, most observations in
this group were higher than the mean Fe contents observed in the AM36-20 and AM36-30
populations (Figures 4.1 and 4.2).
Improvement of mean Fe content was not observed in the field trial of selection
populations compared to the originating parent line. This indicates that the greenhouse
conditions which were used for initial selection of top-performing individuals was not
representative of field conditions at the site in Arusha, Tanzania. The selection of ’36-20’
and ’36-30’ produced an increase of precision for Fe content in the progeny populations of
each of these entries, though not an increase in mean Fe content. Selection for Fe content
would potentially be more accurate for subsequent trials if the initial screening is
conducted in environmental conditions representative of end-use conditions or which
would otherwise be predictably discriminating. A high-pH environment would generally be
informative to identify plants which are genetically adapted to tolerate soils that would
105
limit Fe uptake non-genetically adapted plants (Kobayashi & Nishizawa, 2012; Oertli &
Jacobson, 1969).
4.4 Conclusions
Genetic adaptation for consistent high Fe content has been observed in several plant
systems (Brown, 1977; Brown, Chaney, & Ambler, 1971; Römheld & Marschner, 1986).
Classic hypotheses for mechanisms of adaptation have been supported by modern genetics
(Kobayashi & Nishizawa, 2012).
Selection for improved Fe content should be maintained across environments according to
existing hypotheses if the screening environment is discriminant. A distribution of Fe
content was observed in the initial greenhouse screening of this study (Table 4.1).
However, the progeny of the highest-performing entries in the initial screening were not
observed to have a higher Fe content in the field trial than the original ‘Madiira1’ group
(Table 4.2).
Both progeny groups from selection had substantially lower variances than the original
‘Madiira1’ group. This would suggest that the reduction in genetic diversity in the progeny
of ’36-20’ and ’36-30’ may have selected for adaptations specific to the initial screening
environment. This would generally not agree with current accepted hypotheses for
improved Fe uptake in non-grass plants, which does not involve any adaptations which
would limit uptake in otherwise non-limiting environments (Kobayashi & Nishizawa, 2012).
Narrowing genetic diversity within a population by selection to increase the precision of
performance with respect to Fe content would be a valuable improvement for consumers of
amaranth in regions with high rates of iron-deficiency. The reduction in variance in
selection populations in this study indicates this is feasible. Screening for diversity of Fe

106
content in an environment limited due to high pH may result in greater repeatability across
varying environments.
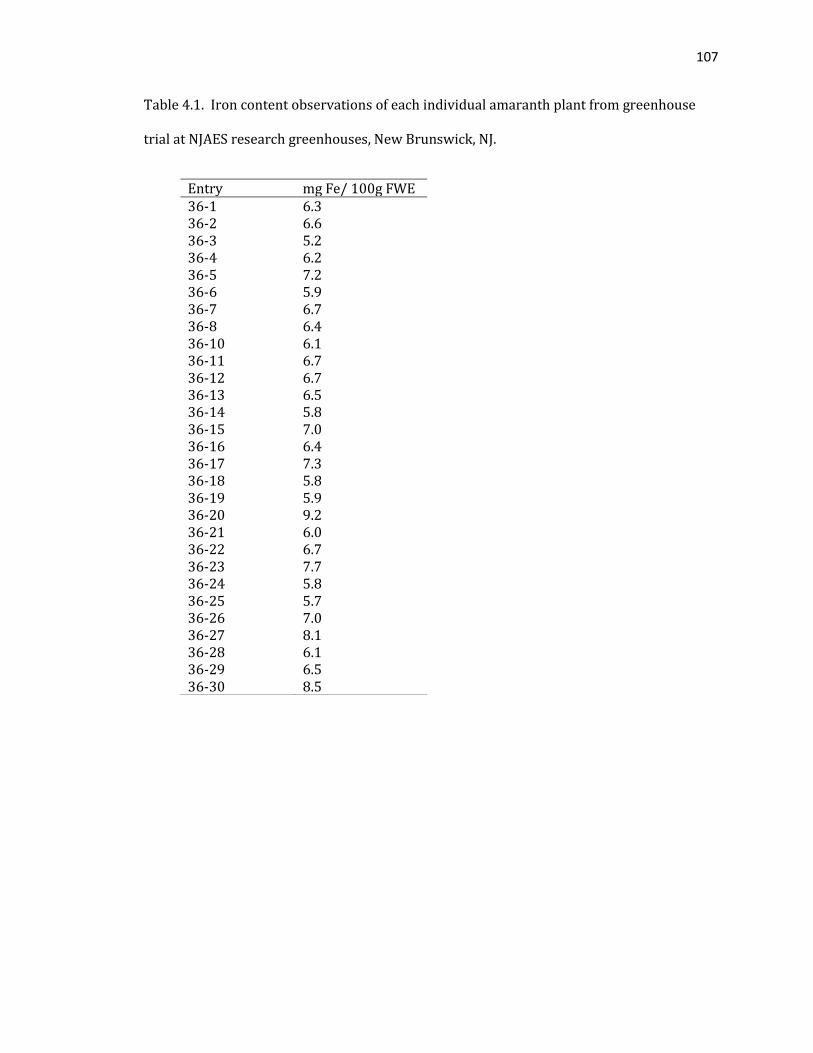
107
Table 4.1. Iron content observations of each individual amaranth plant from greenhouse
trial at NJAES research greenhouses, New Brunswick, NJ.
Entry mg Fe/ 100g FWE 36-1 6.3 36-2 6.6 36-3 5.2 36-4 6.2 36-5 7.2 36-6 5.9 36-7 6.7 36-8 6.4 36-10 6.1 36-11 6.7 36-12 6.7 36-13 6.5 36-14 5.8 36-15 7.0 36-16 6.4 36-17 7.3 36-18 5.8 36-19 5.9 36-20 9.2 36-21 6.0 36-22 6.7 36-23 7.7 36-24 5.8 36-25 5.7 36-26 7.0 36-27 8.1 36-28 6.1 36-29 6.5 36-30 8.5
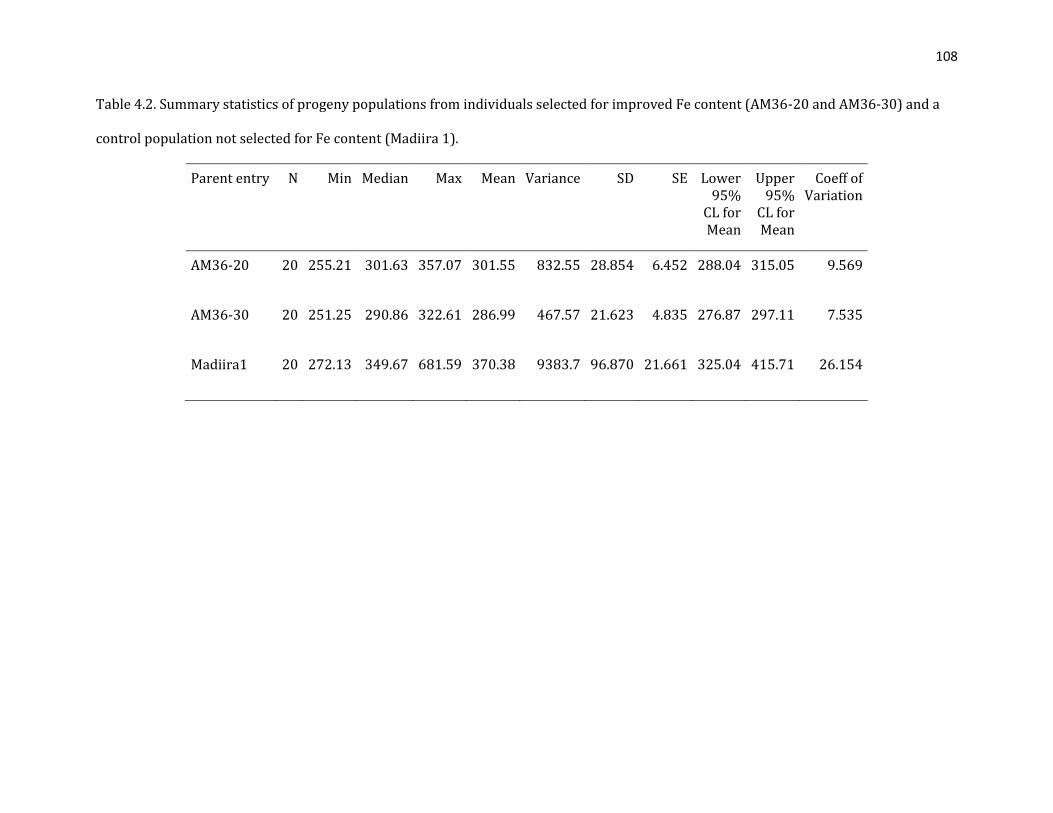
108
Table 4.2. Summary statistics of progeny populations from individuals selected for improved Fe content (AM36-20 and AM36-30) and a
control population not selected for Fe content (Madiira 1).
Parent entry N Min Median Max Mean Variance SD SE Lower 95%
CL for Mean
Upper 95%
CL for Mean
Coeff of Variation
AM36-20 20 255.21 301.63 357.07 301.55 832.55 28.854 6.452 288.04 315.05 9.569
AM36-30 20 251.25 290.86 322.61 286.99 467.57 21.623 4.835 276.87 297.11 7.535
Madiira1 20 272.13 349.67 681.59 370.38 9383.7 96.870 21.661 325.04 415.71 26.154
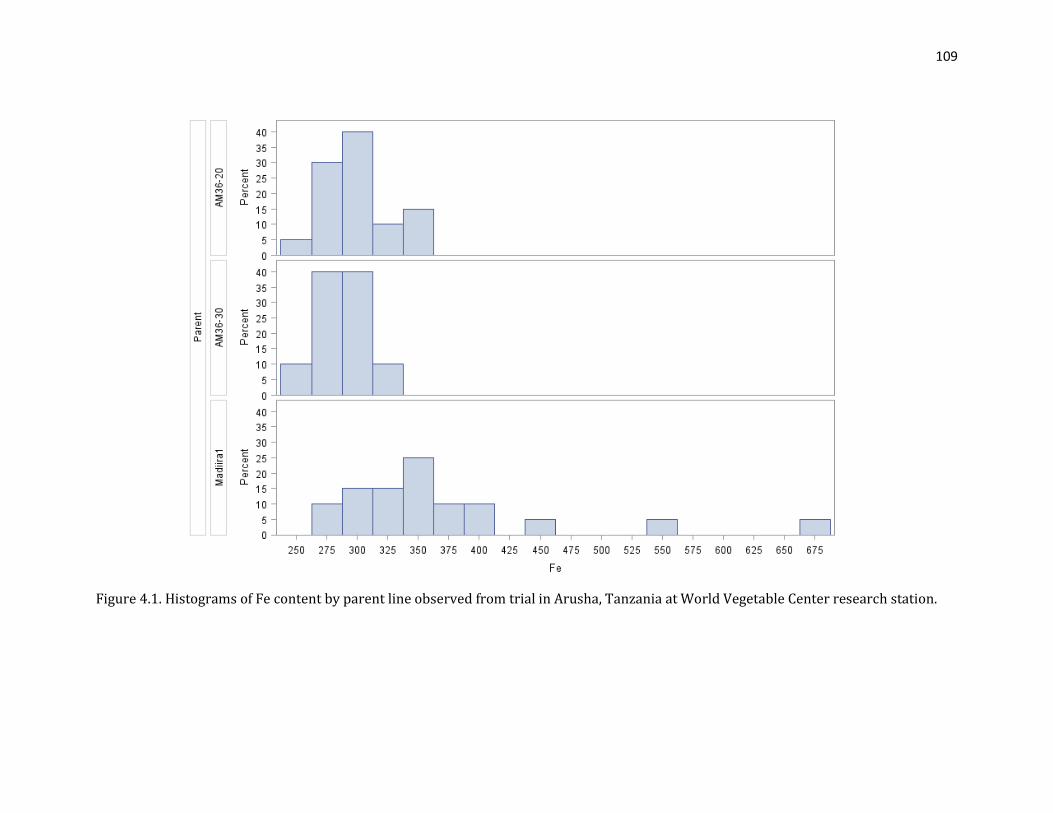
109
Figure 4.1. Histograms of Fe content by parent line observed from trial in Arusha, Tanzania at World Vegetable Center research station.
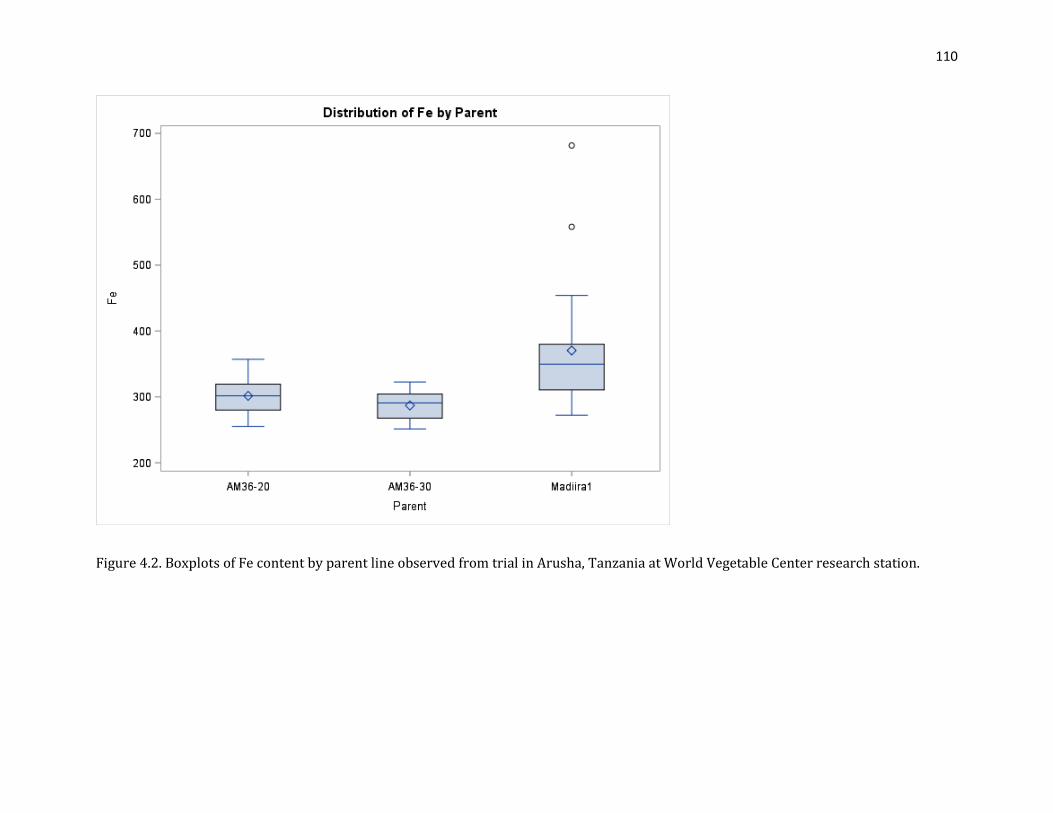
110
Figure 4.2. Boxplots of Fe content by parent line observed from trial in Arusha, Tanzania at World Vegetable Center research station.
111
4.5 References
Baltensperger, D. D., Weber, L. E., & Nelson, L. A. (1992). Registration of ‘Plainsman’ Grain
Amaranth. Crop Science, 32(6), 1510.
http://doi.org/10.2135/cropsci1992.0011183X003200060047x
Bonasora, M. G., Poggio, L., & Greizerstein, E. J. (2013). Cytogenetic studies in four cultivated
Amaranthus (Amaranthaceae) species. Comparative Cytogenetics, 7(1), 53–61.
http://doi.org/10.3897/CompCytogen.v7i1.4276
Brown, J. C. (1977). Genetically Controlled Chemical Factors Involved in Absorption and
Transport of Iron by Plants. In Kenneth N. Raymond (Ed.), Bioinorganic Chemistry—II
(pp. 93–103). Washington, DC: American Chemical Society.
http://doi.org/10.1021/ba-1977-0162
Brown, J. C., Chaney, R. L., & Ambler, J. E. (1971). A New Tomato Mutant Inefficient in the
Transport of Iron. Physiologia Plantarum, 25(1), 48–53.
http://doi.org/10.1111/j.1399-3054.1971.tb01086.x
Codex Alimentarius. (1997). Guidelines for Use of Nutrition and Health Claims. Guidelines
for Use of Nutrition and Health Claims, CAC/GL 23-. Retrieved from
http://www.fao.org/fao-who-codexalimentarius/sh-
proxy/en/?lnk=1&url=https%3A%2F%2Fworkspace.fao.org%2Fsites%2Fcodex%2FS
tandards%2FCAC+GL+23-1997%2FCXG_023e.pdf
Hauptli, H., & Jain, S. (1985). Genetic variation in outcrossing rate and correlated floral traits
in a population of grain amaranth (Amaranthus cruentus L.). Genetica, 66(1), 21–27.
http://doi.org/10.1007/BF00123602
Jain, S. K., Hauptil, H., & Vaidya, K. R. (1982). Outcrossing rate in grain amaranths. J. Hered.,
112
73(1), 71–72. Retrieved from http://jhered.oxfordjournals.org/content/73/1/71.short
Kobayashi, T., & Nishizawa, N. K. (2012). Iron Uptake, Translocation, and Regulation in
Higher Plants. Annual Review of Plant Biology, 63(1), 131–152.
http://doi.org/10.1146/annurev-arplant-042811-105522
National Resource Council. (1984). Amaranth: Modern Prospects for an Ancient Crop.
Washington D.C.: USAID, National Academy Press. Retrieved from
http://pdf.usaid.gov/pdf_docs/PNAAQ614.pdf
Oertli, J. J., & Jacobson, L. (1969). Some Quantitative Considerations in Iron Nutrition of
Higher Plants. Plant Physiol., 35(5), 683–688. Retrieved from
https://www.ncbi.nlm.nih.gov/pmc/articles/PMC406025/pdf/plntphys00474-
0135.pdf
Pal, M. (1972). Evolution and improvement of cultivated amaranths. III. Amaranthus
spinosus-dubius complex. Genetica, 43(1), 106–118.
http://doi.org/10.1007/BF00122504
Römheld, V., & Marschner, H. (1986). Evidence for a specific uptake system for iron
phytosiderophores in roots of grasses. Plant Physiology, 80(1), 175–80.
http://doi.org/10.1104/PP.80.1.175
World Health Organization. (2010). Indicators for assessing infant and young child feeding
practices.
113
Chapter 5 Selection for delayed flower time to increase vegetative
growth in spideprlant (Cleome gynandra)
5.1 Introduction
Spiderplant (Cleome gynandra) is an annual herb used primarily as a leafy vegetable
in several sub-Sahara African countries: Benin, Botswana, Cameroon, Democratic Republic
of Congo, Ghana, Kenya, Malawi, Nigeria, Namibia, South Africa, Swaziland, Tanzania,
Uganda, Zambia, Zimbabwe, as well as in India and Thailand (Dansi et al., 2012; Redhead,
1990). The modest development status of this vegetable is disproportionate to the
importance of the role it serves as a food source in these regions (Kwarteng et al., 2018;
Cecilia M. Onyango, Kunyanga, Ontita, Narla, & Kimenju, 2013).
Modern phylogenetic analysis has characterized Cleomaceae as an independent
family (Hall, Sytsma, & Iltis, 2002). Cleome gyndandra had previously been described as
belonging to subfamily Cleomoideae of Capparaceae (Chweya & Mnzava, 1997; Hall et al.,
2002; Sanchez-Acebo, 2005). There are over 200 species in the genus Cleome, with 50
considered to be native to Africa (Iltis, 1960, 1967). The Cleome genus is widely distributed
throughout the tropics and subtropics, with many growing as weeds in the America, Asia,
and Africa, though it is most prevalent in Africa (Iltis, 1960, 1967).
The selection of improved yield directly as a trait has been found to have low
heritability in spiderplant due to being quantitative with an environment effect on
contributing factors (Chweya & Mnzava, 1997). Late flowering has been identified as a trait
to prioritize toward increased vegetative yield, and has been observed to have relatively
high heritability (Chweya & Mnzava, 1997; Omondi & Ayeicho, 1992). This is a common
genetic improvement strategy for yield increase (Kim et al., 2007; Morales, Maynard, &
Janick, 2006; Wallace et al., 1993).
114
Many producers of spiderplant have been observed to cultivate local selections or
landraces of spiderplant and in Zambia, a private seed company sells and promotes a
variety of spiderplant (Chweya & Mnzava, 1997). Very few countries where spiderplant is
grown wild or cultivated maintain a collection of spiderplant germplasm (Kwarteng et al.,
2018). The National Gene Bank of Kenya has been described as holding 45 accessions
(Kemei, Wataaru, & Seme, 1997); the National Plant Genetic Resource Center in Arusha,
Tanzania, and South Africa reportedly holds 184 accessions (Jan van Rensburg et al., 2009);
and 108 accessions are held by the World Vegetable Center (WorldVeg, formerly AVRDC)
Genetic Resources Unit of Arusha, Tanzania (Ochieng, Tenkouano, & Yang, 2010).
The spiderplant germplasm held by the National Gene Bank of Kenya and in South
Africa are reportedly lacking documentation as well as morphological and agronomic
characterization (Wasonga, Ambuko, Chemining ’wa, Odeny, & Crampton, 2015). WorldVeg
is actively characterizing spiderplant accessions held by the Genetic Resources Unit for field
performance and producer evaluations (Dinssa et al., 2015). One of the most informative
studies available in the literature characterizing multiple accessions of spiderplant
observed 26 accessions for traits including days to flowering (Cecilia Moraa Onyango,
Onwonga, & Kimenju, 2016).
Spiderplant produces perfect flowers on a terminal infloresence which are both self-
and outcrossing-compatible and has been observed to be protogynous, which would
facilitate greater rates of outcrossing (Chweya & Mnzava, 1997; Solomon Raju & Sandhya
Rani, 2016). Spiderplant has been reported to be a majority-outcrossing crop when
pollinators are present (Solomon Raju & Sandhya Rani, 2016).
Cytogenetic studies have reported different chromosome numbers within the
species Cleome gynandra. most often reporting n=17, yet also reporting n=18 , n=16, and
115
n=10 (Koshy & Mathew, 1985; Rice et al., 2015). This may result in breeding barriers across
spiderplant entries.
Deflowering is often predicted to extend vegetative production, indirectly increasing
leaf yield in crops with production limited by bolting. Deflowering has had variable results
in the limited studies available in the literature (Chweya, 1995; Wangolo, Onyango,
Gachene, Mong’are, & Fujita, 2015). Development of genetic resources capable of
continuous vegetative production would preclude labor requirements for deflowering and
is widely accepted as a reliable method for yield improvement as discussed above.
Flowering time is a widely studied trait given the applications for optimal yield
performance and conditional adaptability of cultivars. Maize (Zea mays), an outcrossing
crop has been described as simple-additive with many genes responsible for small, additive
effect on flowering time (Buckler et al., 2009). Self-pollenating crops such as Arabidopsis
and rice (Oryza sativa), have been described as having relatively fewer genes with more
substantial interaction effects (Izawa, Takahashi, & Yano, 2003; Yano & Izawa, 2007).
This study was initiated to identify genetic resources of spiderplant with delayed
time to flowering. Methodology using greenhouse screening with seedling trays as a viable
approach for this purpose can be considered from the results of this study.
5.2 Materials and Methods
5.2.1 Plant materials
Entries for this study included one commercial line from Simlaw Seed (Nairobi,
Kenya), and five advanced lines from WorldVeg: UG-SF-23, ML-SF-17, PS, UG-SF-15, ML-SF-
29; entries were renamed SP1 through SP7, excluding ‘SP2’ which no entry was named in
this study. Five plants from each variety were grown with growing mix (Fafard Grow Mix 2;
Sun Gro Horticulture, Agawam, MA) in 3L plastic containers under 14 h day, high pressure
116
sodium lights at the Rutgers University New Jersey Agriculture Experiment Station (NJAES)
Greenhouses in New Brunswick, NJ from September 5th, 2016 and allowed to openly
pollenate to produce seed.
5.2.2 Greenhouse evaluation
Seed collected from one randomly selected individual of each variety was sown in
72-cell trays with growing mix (Fafard Grow Mix 2; Sun Gro Horticulture, Agawam, MA) and
germinated at the NJAES Research Greenhouses in New Brunswick, NJ. One seed was
planted in each cell, about 1000 seeds in total were planted. The total number of plants
emerged was 385. Plants were hand watered and remained in the seedling trays for daily
observations of emergence and days to flowering, recorded for each plant individually.
Seed was collected from isolated inflorescences of seven individuals selected for early
flowering, six for average flowering, and four for delayed flowering.
5.2.3 Field evaluation
A field trial was conducted in Arusha, Tanzania on-station at WorldVeg, eastern and
southern Africa (lat. 36.8ºE, long. 3.4°S, 1290 m elevation) to evaluate the time to flowering
of the progeny selected from the greenhouse trial. Seedlings were grown in 72-cell trays
with sterilized media composed of forest soil/compost, manure, sand, and rice husks in a
ratio of 3:2:1:1 by mass. Progeny were transplanted on April 21, 2017 and individually
evaluated for number of days until flowering from time of transplant. The site is
characterized by well-drained clay loam soil with pH 6.4. Furrow irrigation was applied as
needed.
5.2.4 Statistics
Data was analyzed from the greenhouse trial and field trial separately, using PROC
UNIVARIATE MIXED in SAS 9.4 (SAS Institute Inc., Cary, NC, USA) to create histograms to
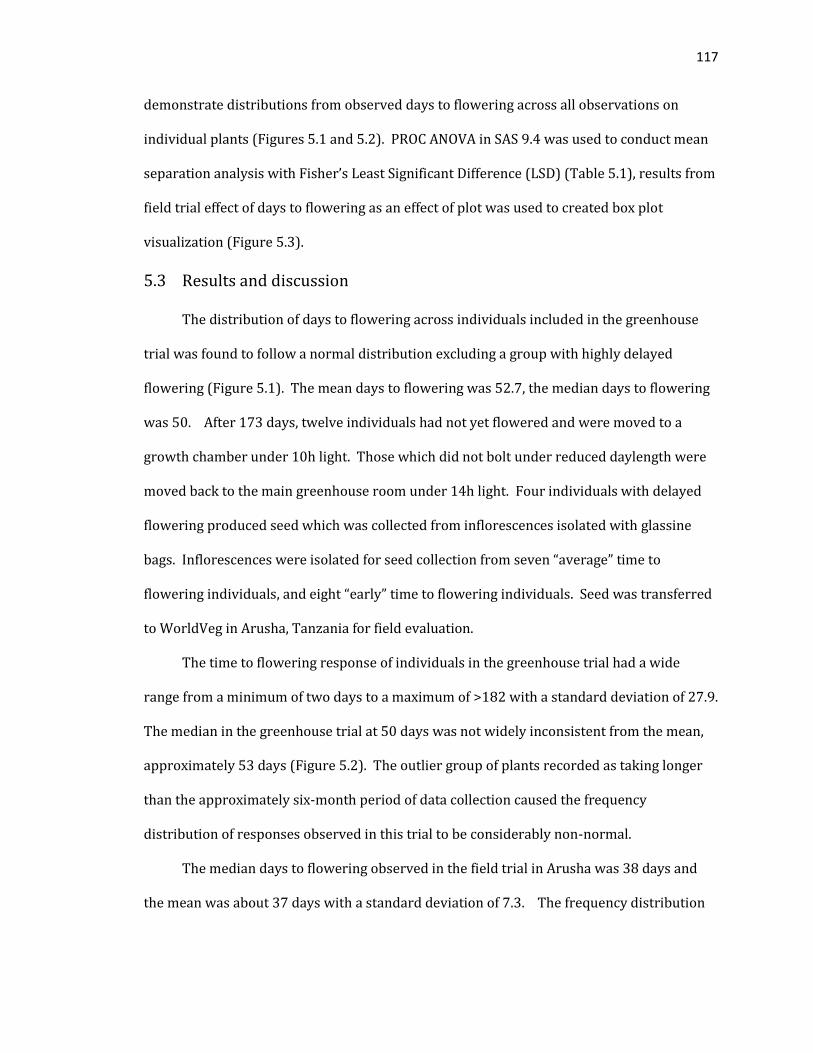
117
demonstrate distributions from observed days to flowering across all observations on
individual plants (Figures 5.1 and 5.2). PROC ANOVA in SAS 9.4 was used to conduct mean
separation analysis with Fisher’s Least Significant Difference (LSD) (Table 5.1), results from
field trial effect of days to flowering as an effect of plot was used to created box plot
visualization (Figure 5.3).
5.3 Results and discussion
The distribution of days to flowering across individuals included in the greenhouse
trial was found to follow a normal distribution excluding a group with highly delayed
flowering (Figure 5.1). The mean days to flowering was 52.7, the median days to flowering
was 50. After 173 days, twelve individuals had not yet flowered and were moved to a
growth chamber under 10h light. Those which did not bolt under reduced daylength were
moved back to the main greenhouse room under 14h light. Four individuals with delayed
flowering produced seed which was collected from inflorescences isolated with glassine
bags. Inflorescences were isolated for seed collection from seven “average” time to
flowering individuals, and eight “early” time to flowering individuals. Seed was transferred
to WorldVeg in Arusha, Tanzania for field evaluation.
The time to flowering response of individuals in the greenhouse trial had a wide
range from a minimum of two days to a maximum of >182 with a standard deviation of 27.9.
The median in the greenhouse trial at 50 days was not widely inconsistent from the mean,
approximately 53 days (Figure 5.2). The outlier group of plants recorded as taking longer
than the approximately six-month period of data collection caused the frequency
distribution of responses observed in this trial to be considerably non-normal.
The median days to flowering observed in the field trial in Arusha was 38 days and
the mean was about 37 days with a standard deviation of 7.3. The frequency distribution
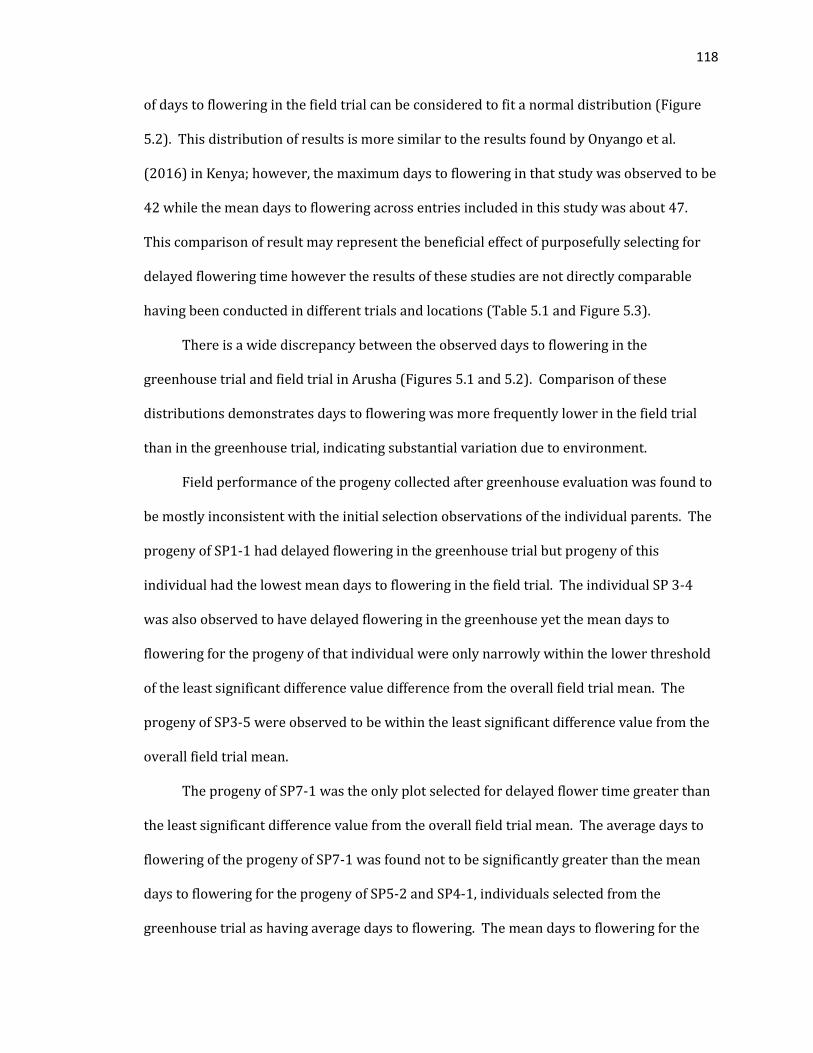
118
of days to flowering in the field trial can be considered to fit a normal distribution (Figure
5.2). This distribution of results is more similar to the results found by Onyango et al.
(2016) in Kenya; however, the maximum days to flowering in that study was observed to be
42 while the mean days to flowering across entries included in this study was about 47.
This comparison of result may represent the beneficial effect of purposefully selecting for
delayed flowering time however the results of these studies are not directly comparable
having been conducted in different trials and locations (Table 5.1 and Figure 5.3).
There is a wide discrepancy between the observed days to flowering in the
greenhouse trial and field trial in Arusha (Figures 5.1 and 5.2). Comparison of these
distributions demonstrates days to flowering was more frequently lower in the field trial
than in the greenhouse trial, indicating substantial variation due to environment.
Field performance of the progeny collected after greenhouse evaluation was found to
be mostly inconsistent with the initial selection observations of the individual parents. The
progeny of SP1-1 had delayed flowering in the greenhouse trial but progeny of this
individual had the lowest mean days to flowering in the field trial. The individual SP 3-4
was also observed to have delayed flowering in the greenhouse yet the mean days to
flowering for the progeny of that individual were only narrowly within the lower threshold
of the least significant difference value difference from the overall field trial mean. The
progeny of SP3-5 were observed to be within the least significant difference value from the
overall field trial mean.
The progeny of SP7-1 was the only plot selected for delayed flower time greater than
the least significant difference value from the overall field trial mean. The average days to
flowering of the progeny of SP7-1 was found not to be significantly greater than the mean
days to flowering for the progeny of SP5-2 and SP4-1, individuals selected from the
greenhouse trial as having average days to flowering. The mean days to flowering for the
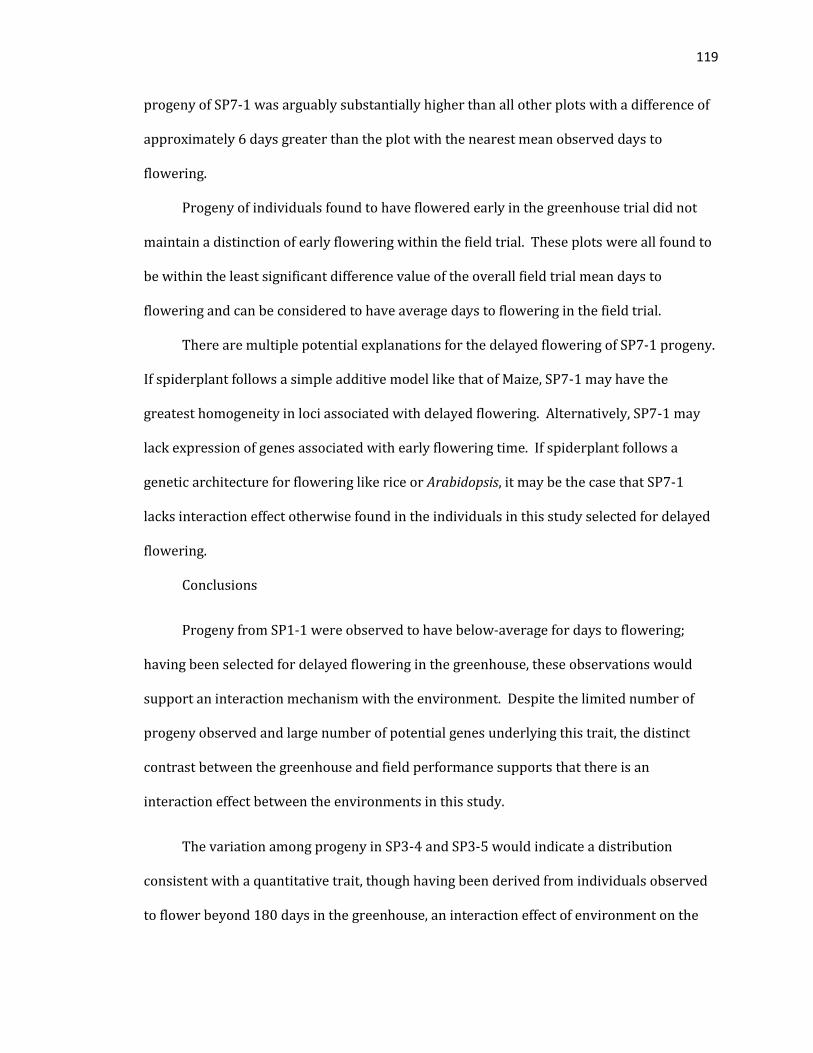
119
progeny of SP7-1 was arguably substantially higher than all other plots with a difference of
approximately 6 days greater than the plot with the nearest mean observed days to
flowering.
Progeny of individuals found to have flowered early in the greenhouse trial did not
maintain a distinction of early flowering within the field trial. These plots were all found to
be within the least significant difference value of the overall field trial mean days to
flowering and can be considered to have average days to flowering in the field trial.
There are multiple potential explanations for the delayed flowering of SP7-1 progeny.
If spiderplant follows a simple additive model like that of Maize, SP7-1 may have the
greatest homogeneity in loci associated with delayed flowering. Alternatively, SP7-1 may
lack expression of genes associated with early flowering time. If spiderplant follows a
genetic architecture for flowering like rice or Arabidopsis, it may be the case that SP7-1
lacks interaction effect otherwise found in the individuals in this study selected for delayed
flowering.
Conclusions
Progeny from SP1-1 were observed to have below-average for days to flowering;
having been selected for delayed flowering in the greenhouse, these observations would
support an interaction mechanism with the environment. Despite the limited number of
progeny observed and large number of potential genes underlying this trait, the distinct
contrast between the greenhouse and field performance supports that there is an
interaction effect between the environments in this study.
The variation among progeny in SP3-4 and SP3-5 would indicate a distribution
consistent with a quantitative trait, though having been derived from individuals observed
to flower beyond 180 days in the greenhouse, an interaction effect of environment on the
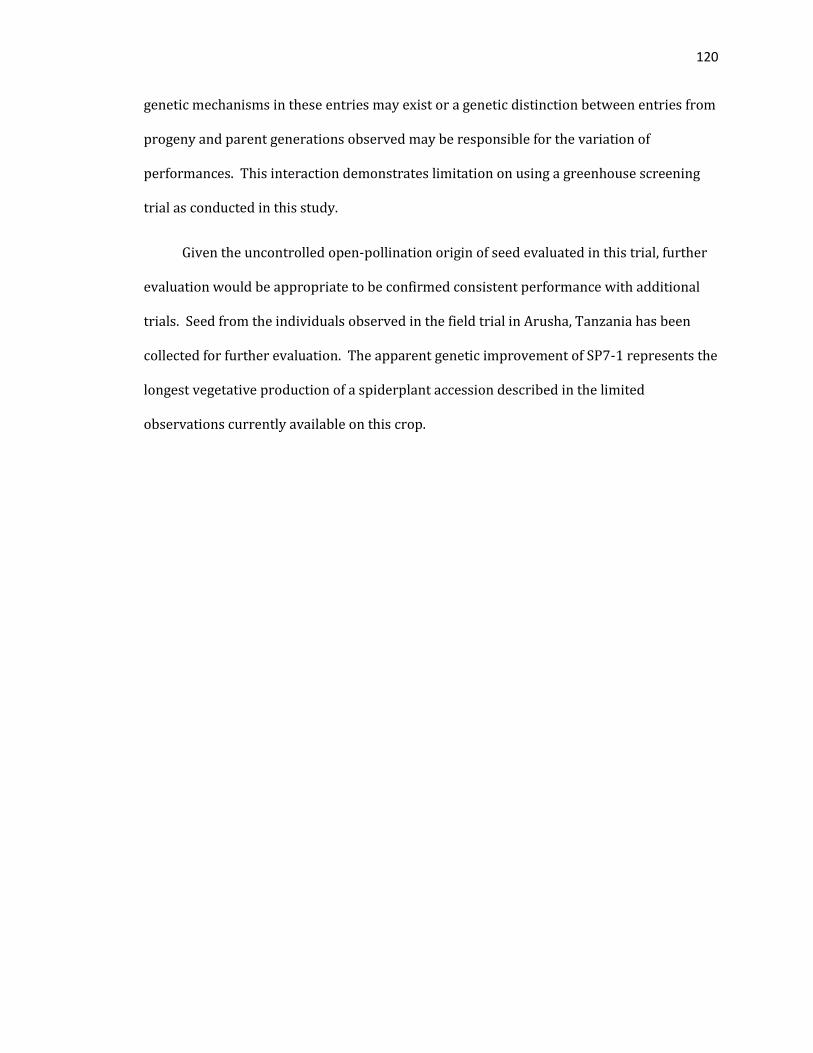
120
genetic mechanisms in these entries may exist or a genetic distinction between entries from
progeny and parent generations observed may be responsible for the variation of
performances. This interaction demonstrates limitation on using a greenhouse screening
trial as conducted in this study.
Given the uncontrolled open-pollination origin of seed evaluated in this trial, further
evaluation would be appropriate to be confirmed consistent performance with additional
trials. Seed from the individuals observed in the field trial in Arusha, Tanzania has been
collected for further evaluation. The apparent genetic improvement of SP7-1 represents the
longest vegetative production of a spiderplant accession described in the limited
observations currently available on this crop.
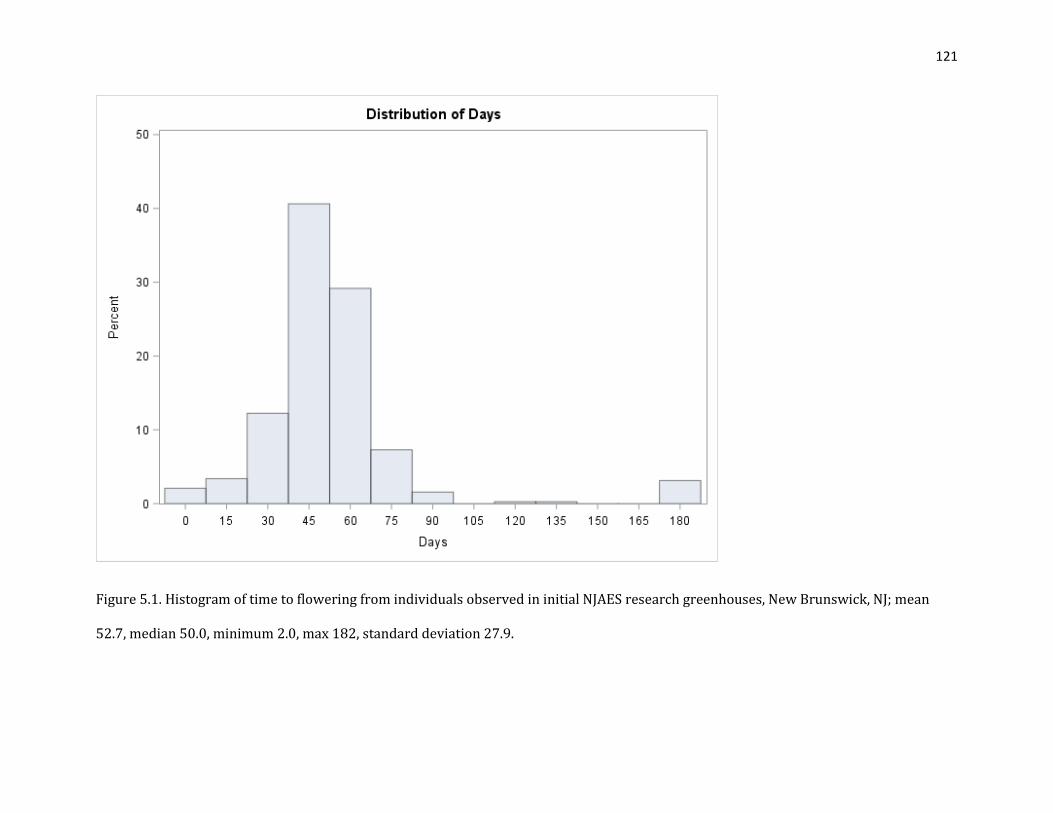
121
Figure 5.1. Histogram of time to flowering from individuals observed in initial NJAES research greenhouses, New Brunswick, NJ; mean
52.7, median 50.0, minimum 2.0, max 182, standard deviation 27.9.
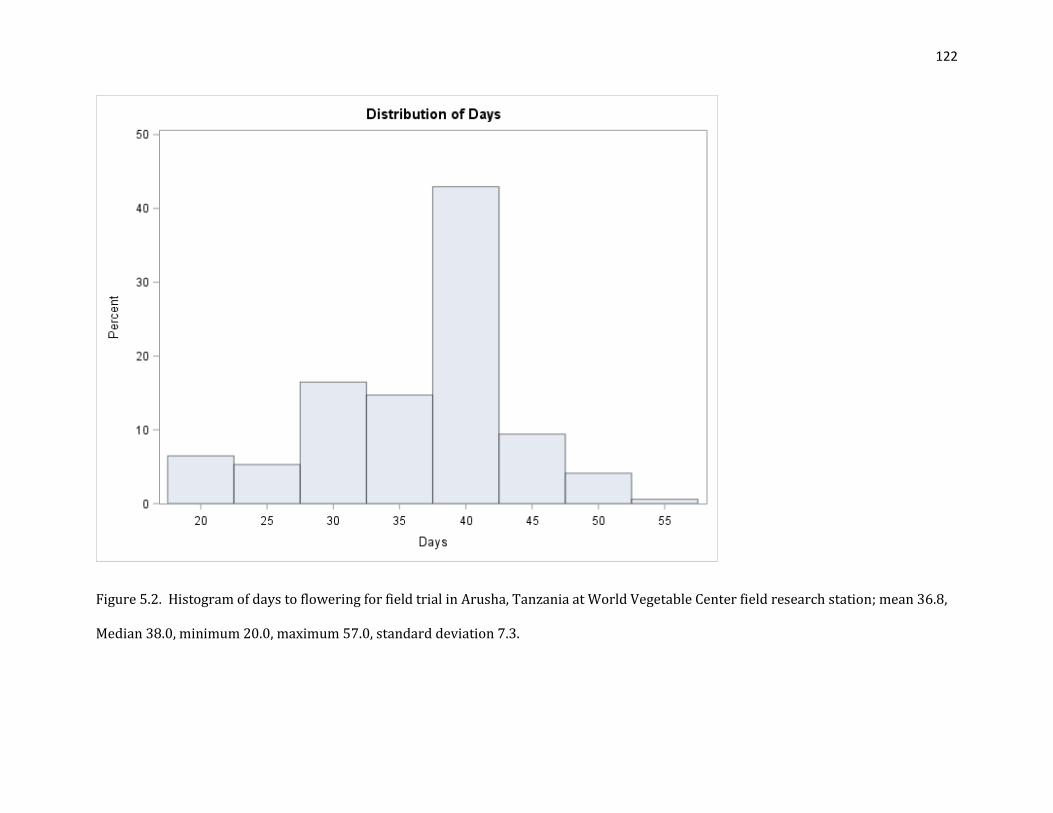
122
Figure 5.2. Histogram of days to flowering for field trial in Arusha, Tanzania at World Vegetable Center field research station; mean 36.8,
Median 38.0, minimum 20.0, maximum 57.0, standard deviation 7.3.
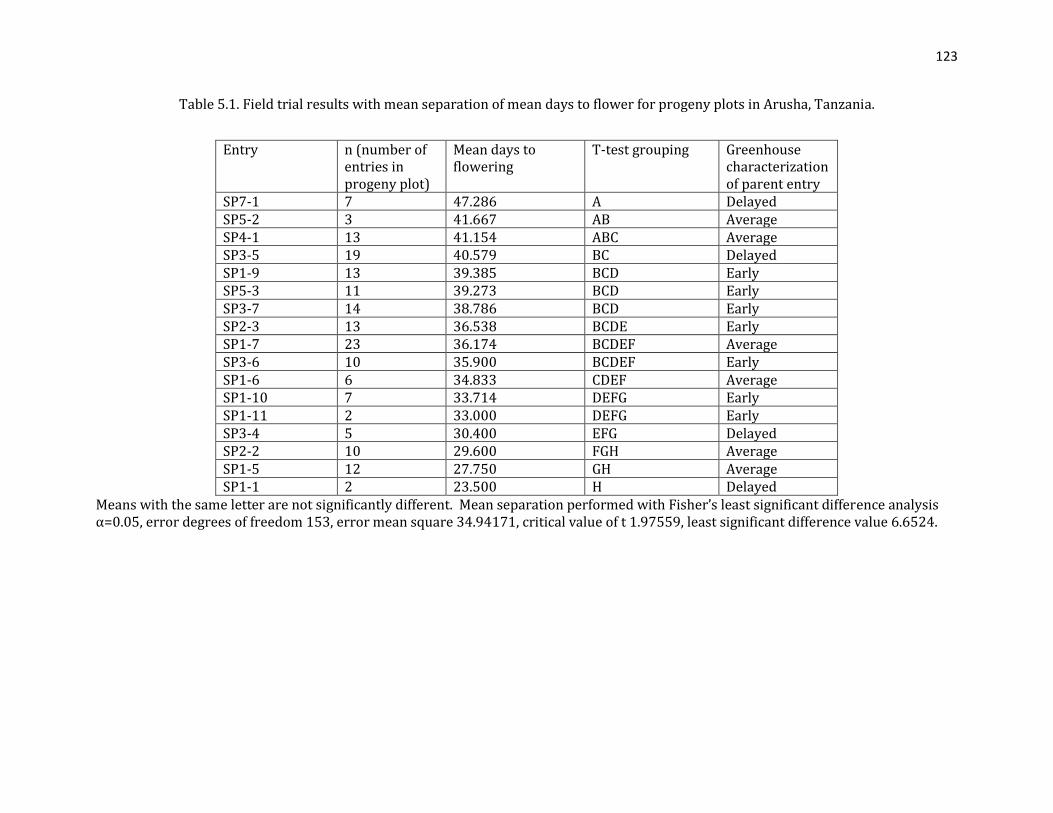
123
Table 5.1. Field trial results with mean separation of mean days to flower for progeny plots in Arusha, Tanzania.
Entry n (number of entries in progeny plot)
Mean days to flowering
T-test grouping Greenhouse characterization of parent entry
SP7-1 7 47.286 A Delayed SP5-2 3 41.667 AB Average SP4-1 13 41.154 ABC Average SP3-5 19 40.579 BC Delayed SP1-9 13 39.385 BCD Early SP5-3 11 39.273 BCD Early SP3-7 14 38.786 BCD Early SP2-3 13 36.538 BCDE Early SP1-7 23 36.174 BCDEF Average SP3-6 10 35.900 BCDEF Early SP1-6 6 34.833 CDEF Average SP1-10 7 33.714 DEFG Early SP1-11 2 33.000 DEFG Early SP3-4 5 30.400 EFG Delayed SP2-2 10 29.600 FGH Average SP1-5 12 27.750 GH Average SP1-1 2 23.500 H Delayed
Means with the same letter are not significantly different. Mean separation performed with Fisher’s least significant difference analysis α=0.05, error degrees of freedom 153, error mean square 34.94171, critical value of t 1.97559, least significant difference value 6.6524.
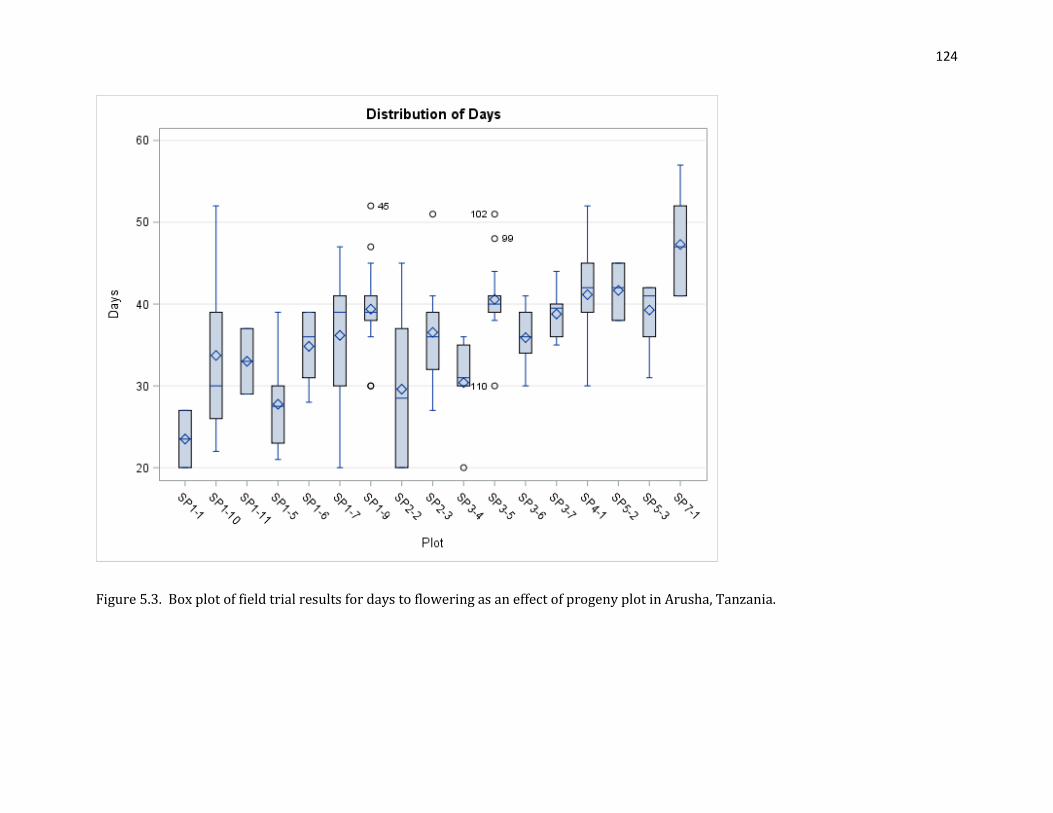
124
Figure 5.3. Box plot of field trial results for days to flowering as an effect of progeny plot in Arusha, Tanzania.
125
5.4 References
Buckler, E. S., Holland, J. B., Bradbury, P. J., Acharya, C. B., Brown, P. J., Browne, C., …
McMullen, M. D. (2009). The genetic architecture of maize flowering time. Science (New
York, N.Y.), 325(5941), 714–8. http://doi.org/10.1126/science.1174276
Chweya, J. A. (1995). Genetic enhancement of indigenous vegetables in Kenya. In Genetic
enhancement of indigenous vegetables in Kenya. Nairobi. Retrieved from
https://www.bioversityinternational.org/fileadmin/bioversity/publications/Web_ver
sion/500/ch12.htm
Chweya, J. A., & Mnzava, N. A. (1997). Cat’s whiskers Cleome gynandra L. Rome, Italy:
International Plant Genetic Resources Institute. Retrieved from
https://www.bioversityinternational.org/fileadmin/_migrated/uploads/tx_news/Cat_
s_whiskers_Cleome_gynandra_L._350.pdf
Dansi, A., Vodouhè, R., Azokpota, P., Yedomonhan, H., Assogba, P., Adjatin, A., … Akpagana, K.
(2012). Diversity of the Neglected and Underutilized Crop Species of Importance in
Benin. The Scientific World Journal, 2012, 1–19. http://doi.org/10.1100/2012/932947
Dinssa, F. F., Stoilova, T., Nenguwo, N., Aloyce, A., Tenkouano, A., Hanson, P., … Keatinge, J. D.
H. (2015). Traditional vegetables: improvement and development in sub-Saharan
Africa at AVRDC – The World Vegetable Center. Acta Horticulturae, (1102), 21–28.
http://doi.org/10.17660/ActaHortic.2015.1102.2
Hall, J. C., Sytsma, K. J., & Iltis, H. H. (2002). Phylogeny of Capparaceae and Brassicaceae
based on chloroplast sequence data. American Journal of Botany, 89(11), 1826–1842.
http://doi.org/10.3732/ajb.89.11.1826
Iltis, H. H. (1960). Old world Cleomes adventive in the New World. Brittonia, 12(4), 279.
126
http://doi.org/10.2307/2805120
Iltis, H. H. (1967). Cleome afrospina, a tropical African endemic with neotropical affinities.
In Studies in the Capparidaceae (Vol. 54, pp. 953–962). Wiley-Blackwell.
http://doi.org/10.1002/j.1537-2197.1967.tb10720.x
Izawa, T., Takahashi, Y., & Yano, M. (2003). Comparative biology comes into bloom: genomic
and genetic comparison of flowering pathways in rice and Arabidopsis. Current
Opinion in Plant Biology, 6(2), 113–20. Retrieved from
http://www.ncbi.nlm.nih.gov/pubmed/12667866
Jan van Rensburg, W., Van Averbeke, W., Slabbert, R., Faber, M., Van Jaarsveld, P., Van
Heerden, I., … Oelofse, A. (2009). African leafy vegetables in South Africa. Water SA,
33(3). http://doi.org/10.4314/wsa.v33i3.49110
Kemei, J. K., Wataaru, R. K., & Seme, E. N. (1997). The role of the National Genebank of Kenya
in the collecting, characterization and conservation of traditional vegetables. In L.
Guarino (Ed.), Proceedings of the IPGRI International Workshop on Genetic Resources of
Traditional Vegetables in Africa: Conservation and Use. Nairobi, Kenya: International
Plant Genetic Resources Institute. Retrieved from
https://www.bioversityinternational.org/fileadmin/bioversity/publications/Web_ver
sion/500/ch11.htm
Kim, S.-Y., Park, B.-S., Kwon, S.-J., Kim, J., Lim, M.-H., Park, Y.-D., … Lee, Y.-H. (2007). Delayed
flowering time in Arabidopsis and Brassica rapa by the overexpression of FLOWERING
LOCUS C (FLC) homologs isolated from Chinese cabbage (Brassica rapa L. ssp.
pekinensis). Plant Cell Reports, 26(3), 327–336. http://doi.org/10.1007/s00299-006-
0243-1
127
Koshy, J. K., & Mathew, P. M. (1985). Cytology of the Genus Cleome Linn. Cytologia, 50, 283–
287. Retrieved from
https://www.jstage.jst.go.jp/article/cytologia1929/50/2/50_2_283/_pdf
Kwarteng, A. O., Abogoom, J., Adu Amoah, R., Nyadanu, D., Ghunney, T., Nyam, K. C., … Whyte,
T. (2018). Current knowledge and breeding perspectives for the spider plant (Cleome
gynandra L.): a potential for enhanced breeding of the plant in Africa. Genetic Resources
and Crop Evolution, 65(5), 1529–1550. http://doi.org/10.1007/s10722-018-0626-5
Morales, M. R., Maynard, E., & Janick, J. (2006). “Adagio”: A Slow-Bolting Arugula.
HORTSCIENCE, 41(6), 1506–1507. Retrieved from
https://www.hort.purdue.edu/newcrop/adagio.pdf
Ochieng, C., Tenkouano, A., & Yang, R. (2010). The role of AVRDC - The world vegetable
centre in vegetable value chains. In African Journal of Horticultural Science (Vol. 3).
Horticultural Association of Kenya. Retrieved from
http://www.hakenya.net/ajhs/index.php/ajhs/article/view/1
Omondi, C. O., & Ayeicho, P. O. (1992). orrelation and multiple-regression analyses in the
population of two Kenyan landraces of spiderflower (Gynandropsis gynandra). Indian
J. Agric. Sci, 62(2), 160–162.
Onyango, C. M., Kunyanga, C. N., Ontita, E. G., Narla, R. D., & Kimenju, J. W. (2013). Current
status on production and utilization of spider plant (Cleome gynandra L.) an
underutilized leafy vegetable in Kenya. Genetic Resources and Crop Evolution, 60(7),
2183–2189. http://doi.org/10.1007/s10722-013-0036-7
Onyango, C. M., Onwonga, R. N., & Kimenju, J. W. (2016). Assessment of Spider Plant (Cleome
gynandra L.) Germplasm for Agronomic Traits in Vegetable and Seed Production: A
128
Green House Study. American Journal of Experimental Agriculture, 10(1), 1–10.
http://doi.org/10.9734/AJEA/2016/20209
Redhead, J. (1990). Utilization of tropical foods: fruits and leaves. FAO Food and Nutrition
Paper, 47(7). Retrieved from
https://www.cabdirect.org/cabdirect/abstract/19911436005
Rice, A., Glick, L., Abadi, S., Einhorn, M., Kopelman, N. M., Salman-Minkov, A., … Mayrose, I.
(2015). The Chromosome Counts Database (CCDB) - a community resource of plant
chromosome numbers. New Phytologist, 206(1), 19–26.
http://doi.org/10.1111/nph.13191
Sanchez-Acebo, L. (2005). A Phylogenetic Study of the New World Cleome (Brassicaceae,
Cleomoideae). Annals of the Missouri Botanical Garden, 92(2), 179–201.
Solomon Raju, A., & Sandhya Rani, D. (2016). Reproductive ecology of Cleome gynandra and
Cleome viscosa (Capparaceae). Phytologia Balcanica, 22(1), 15–28. Retrieved from
http://www.bio.bas.bg/~phytolbalcan/PDF/22_1/PhytolBalcan_22-
1_03_Raju_&_Rani.pdf
Wallace, D. H., Baudoin, J. P., Beaver, J., Coyne, D. P., Halseth, D. E., Masaya, P. N., … Zobel, R.
W. (1993). Improving efficiency of breeding for higher crop yield. Theoretical and
Applied Genetics, 86(1), 27–40. http://doi.org/10.1007/BF00223805
Wangolo, E. E., Onyango, C. M., Gachene, C. K. K., Mong’are, P. N., & Fujita, M. (2015). Effects
of Shoot Tip and Flower Removal on Growth and Yield of Spider Plant (Cleome
gynandra L.) in Kenya. AJEA, 8(6), 367–376.
http://doi.org/10.9734/AJEA/2015/17271
129
Wasonga, D. O., Ambuko, J. L., Chemining ’wa, G. N., Odeny, D. A., & Crampton, B. G. (2015).
Morphological Characterization and Selection of Spider Plant (Cleome Gynandra)
Accessions from Kenya and South Africa. Asian Journal of Agricultural Sciences, 7(4),
36–44. Retrieved from http://oar.icrisat.org/9261/1/AJAS_7_4_36-44_2015.pdf
Yano, M., & Izawa, T. (2007). Genetic and molecular dissection of flowering time in rice. In B.
Brar D.S., Mackill, D.J, Hardy (Ed.), Rice Genetics V: Proceedings of the Fifth International
Rice Genetics Symposium (pp. 177–189). Manilla, Phillipines: Singapore: World
Scientific Publishing and Los Baños (Philippines): International Rice Research
Institute. Retrieved from http://www.e-agriculture.biz/download/Agricultural
Genetics/Rice Genetics V.pdf

130
Chapter 6 Progeny testing in amaranth using simple sequence repeats
6.1 Introduction
Most species within the genus Amaranthus are monoecious, including all of those with
any commercial relevance (Brenner, D.M., Myers, R.L., Baltensperger, D.D., Slabbert, M.M.,
Kulakow, P.A., Sleugh, B.B., Lehmann, 2000). Flowers usually occur in both axial and
terminal inflorescences with differences in prevalence between these habits across species
(Hauptli & Jain, 1985). Infloresences are indeterminate, each plant often capable of
producing over 50,000 seeds (National Resource Council, 1984). Individual flowers are
very small, 2-4cm each, requiring at least 10x magnification to observe floral morphology
(Brenner, D.M., Myers, R.L., Baltensperger, D.D., Slabbert, M.M., Kulakow, P.A., Sleugh, B.B.,
Lehmann, 2000; Pal, 1972). Within the infloresence, flowers are organized with both male
and female within a glomerule with the exception of two species, A. spinosus and A. dubius,
which have pistillate and staminate flowers organized into separate glomerules (Pal, 1972).
The very small size of individual amaranth flowers adds complexity to breeding
procedures. It is difficult to distinguish between male and female flowers for emasculation
prior to the anthers dehiscing, though it has occasionally been described (Jordan, 1996;
Murray, 1938). Maintaining record of individual putative female flowers for pollination and
seed retrieval is exceptionally challenging. Many amaranth breeders hybridize by dusting
with pollen without emasculating and relying on visible traits to distinguish successfully
outcrossed progeny (McElroy, 1982; Murray, 1938). Confirmation of successful outcrossing
with molecular markers would facilitate amaranth breeding systems and allow researchers
and breeders to pursue hybridizations in the absence of visible traits for confirmation.
131
In this study, a method for employing Simple Sequence Repeats (SSR)s for progeny or
paternity testing is tested on Amaranthus tricolor to provide a basis to allow breeders
working with this crop to bypass criteria for selecting parent lines by the presence of visible
traits for identifying successfully outcrossed progeny. Molecular markers offer the means of
confirming parentage and genotyping seedlings which would otherwise be ambiguous or
indistinguishable phenotypically, facilitating reliable inheritance studies and cultivar
development among other applications. This approach been demonstrated in numerous
plant systems (Buteler, LaBonte, Jarret, & Macchiavelli, 2002; de la Rosa, James, & Tobutt,
2004; Dow, 1998) (Buteler et al., 2002). Using SSRs is proposed to avoid the additional step
of sequencing which would be needed if using single nucleotide polymorphisms (SNPs),
another molecular marker system actively being applied to amaranth by researchers (Sunil
et al., 2014).
The amaranth entries used to make putative hybridizations were selected for having
complementary stem pigmentation previously described as following an inheritance
pattern of a single gene with Mendelian dominance, red being dominant to green (Brenner,
D.M., Myers, R.L., Baltensperger, D.D., Slabbert, M.M., Kulakow, P.A., Sleugh, B.B., Lehmann,
2000). The pollen parent in this study (AM101) has red pigmentation in the stem and the
seed parent (RUAM24) has green pigmentation in the stem. Seedlings resulting from
hybridization attempts with red stem pigmentation were considered putative F1 and tested
using SSRs identified to be polymorphic across RUAM24 and Kerala Red.
With emasculation being a relatively unpopular method for breeders of this crop and
the limited ability of tracking individual pollination attempts, being able to confirm
hybridizations with a molecular technique is an apt approach for this crop.
132
6.2 Methods
6.2.1 Plant material
Parent lines Kerala Red (USDA NPGS, PI 566897) and RUAM24 (Byrnes, Dinssa,
Weller, & Simon, 2017) were selected for being phenotypically distinct in the trait of stem
color. Foliar samples from active growth of representative parent lines were collected from
four healthy individuals each and maintained separately after tissue collection for DNA
extraction in the laboratory.
Hybridization was conducted by dusting pollen from Am101 onto the inflorescence
of RUAM24 without emasculation or isolation of seed heads. Seeds were collected from
RUAM24 and grown in 72-cell trays containing growing mix (Fafard Grow Mix 2; Sun Gro
Horticulture, Agawam, MA) under greenhouse conditions at the Rutgers University
Research Greenhouses in New Brunswick, NJ. Foliar samples from ten putative F1
individuals identified by red stems were collected in liquid nitrogen and maintained
separately after tissue collection for DNA extraction in the laboratory.
6.2.2 SSR markers
For all SSR primers, the M13(-21) 18-bp sequence (5′-TGTAAAACGACGGCCAGT-3′)
was added to the 5′ end of the forward primer to facilitate fluorescent labeling of the
resultant PCR product (Schuelke, 2000). Additionally, all reverse primers were elongated at
the 5′ end by using the sequence (5′-GTTTCTT-3′), referred to as “PIG-tailing”, resulting in
adenylation of the 3′ end of the forward strand of the PCR product, which served to reduce
ambiguities associated with scoring “true” versus “plus A” alleles (Brownstein, Carpten, &
Smith, 1996). All primers were synthesized by Integrated DNA Technologies (Coralville, IA).
133
6.2.3 SSR analysis
Plant genomic DNA was isolated from all samples in this study with a Qiagen Quick-
Start DNeasy Plant Mini Kit (Hilden, Germany) by following the manufacturer’s instructions.
Concentration and quality of DNA extractions were observed with NanoDrop ND-1000
Spectrophotometer analyzed using NanoDrop 1000 3.7.1 software (ThermoFisher,
Waltham, MA, USA). PCR was conducted in 96-well plates, in a total reaction volume of 13
μL per sample, using approximately 5 ng genomic DNA, 1 x ImmoBuffer (Bioline, Tauton,
MA, USA), 2mM MgCl2, 0.25 mM each dNTP (Bioline), 0.5 U 1 X Immolase DNA polymerase
(Bioline), .5 pmol forward primer with M13(-21) addition, 1 pmol reverse primer with “PIG-
tailing” addition and 1 pmol forward M13(-21) primer with FAM, NED, PET, or VIC
fluorescent labels in each reaction.
Thermalcycling conditions were an initial denaturation of 94 °C for 5 min, followed by
30 cycles of 94 °C for 30 s, 55 °C for 45 s, 72 °C for 45 s, followed by 20 cycles of 94 °C for 30
s, 53 °C for 45 s, 72 °C for 45 s, followed by a final extension of 72 °C for 10 min. Each 96-
well plate contained 1 sample of GeneScan Installation Standard DS-33 (ThermoFisher) for
assessing consistency of results across PCR plates. PCR products were analyzed by using
capillary electrophoresis (ThermoFisher 3500xl Genetic Analyzer) and sized with a LIZ 600
size standard v2.0 (ThermoFisher) and Genemapper 4.1 software (ThermoFisher).
6.3 Results and discussion
6.3.1 Primer selection
Twelve primers identified by Lee et al. (2008) were used in this study (Table 1).
Eleven of the twelve primers screened amplified with GB-AMM-078 being the only one that
did not amplify (Table 1). Two primers found to be polymorphic between the parent lines,
GB-AMM-132 and GB-AMM-123, were used for screening putative F1 entries.
134
6.3.2 Progeny testing
Putative F1 individuals were screened with primers GB-AMM-132 and GB-AMM-123;
however, GB-AMM-123 did not amplify in the progeny testing. Amplification results from
primer GB-AMM-132 in this study support that five out of ten of the putative F1 entries
were the result of a hybridization between RUAM24 and Kerala Red (Table 2). The
remaining five out of the ten putative F1 individuals screened were found to have one allele
amplify consistently with the seed parent at Locus GB-AMM-132 and another allele which
was not consistent with either of the parent lines used in this study (Table 2).
6.4 Conclusions
The results of this study indicated that half of the putative F1 individuals were the
result of unintended hybridization events. Although this is a highly self-pollinated plant
with reports of limited outcrossing, the results of this study demonstrate that unintended
hybridizations can occur and be difficult if not impossible to visually distinguish from
intended hybridizations.
Results of this study are limited by having only one marker that was polymorphic
between the parent lines and amplified in the putative F1 samples. The SSR loci used in this
study from Lee et al (2008) were originally identified for variation across species and would
likely facilitate progeny detection of inter-specific crosses with greater confidence. An SSR
is incapable of distinguishing between an intended hybridization and an unintended
outcrossing if the allele of the unintended pollen parent is monomorphic to the intended
parent at that SSR locus. Multiple SSRs are typically used for progeny testing in plants (de la
Rosa et al., 2004; Lambeth, Lee, O’Malley, & Wheeler, 2001). In the current study, screening
with primer GB-AMM-132 was adequate to distinguish between the products of purposeful
hybridization and unintended outcrossing without visually observable differences.

135
This study demonstrates that confirming parentage with molecular markers in
amaranth can benefit a breeding agenda both featuring and absent of visible traits to
identify progeny of successful crosses. Confirmation with molecular markers should be
considered for incorporating into breeding programs for amaranth given the many
difficulties specific to this plant system.
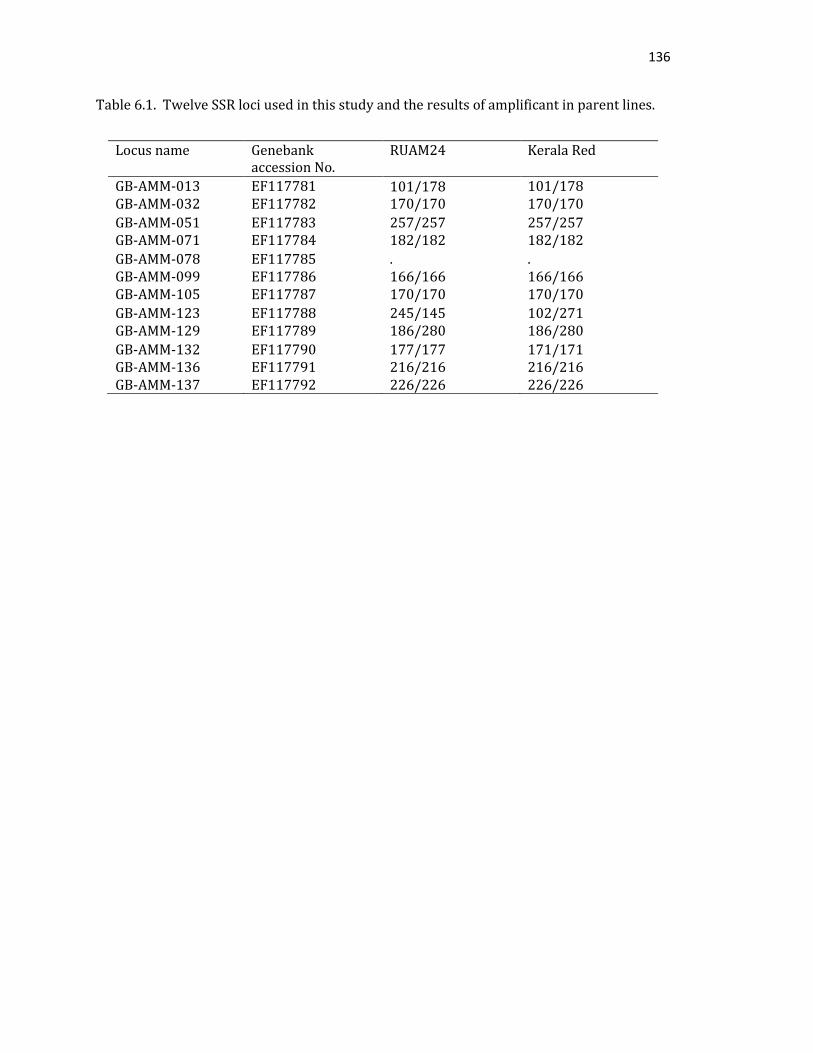
136
Table 6.1. Twelve SSR loci used in this study and the results of amplificant in parent lines.
Locus name Genebank accession No.
RUAM24 Kerala Red
GB-AMM-013 EF117781 101/178 101/178 GB-AMM-032 EF117782 170/170 170/170
GB-AMM-051 EF117783 257/257 257/257 GB-AMM-071 EF117784 182/182 182/182
GB-AMM-078 EF117785 . . GB-AMM-099 EF117786 166/166 166/166 GB-AMM-105 EF117787 170/170 170/170
GB-AMM-123 EF117788 245/145 102/271 GB-AMM-129 EF117789 186/280 186/280
GB-AMM-132 EF117790 177/177 171/171 GB-AMM-136 EF117791 216/216 216/216 GB-AMM-137 EF117792 226/226 226/226
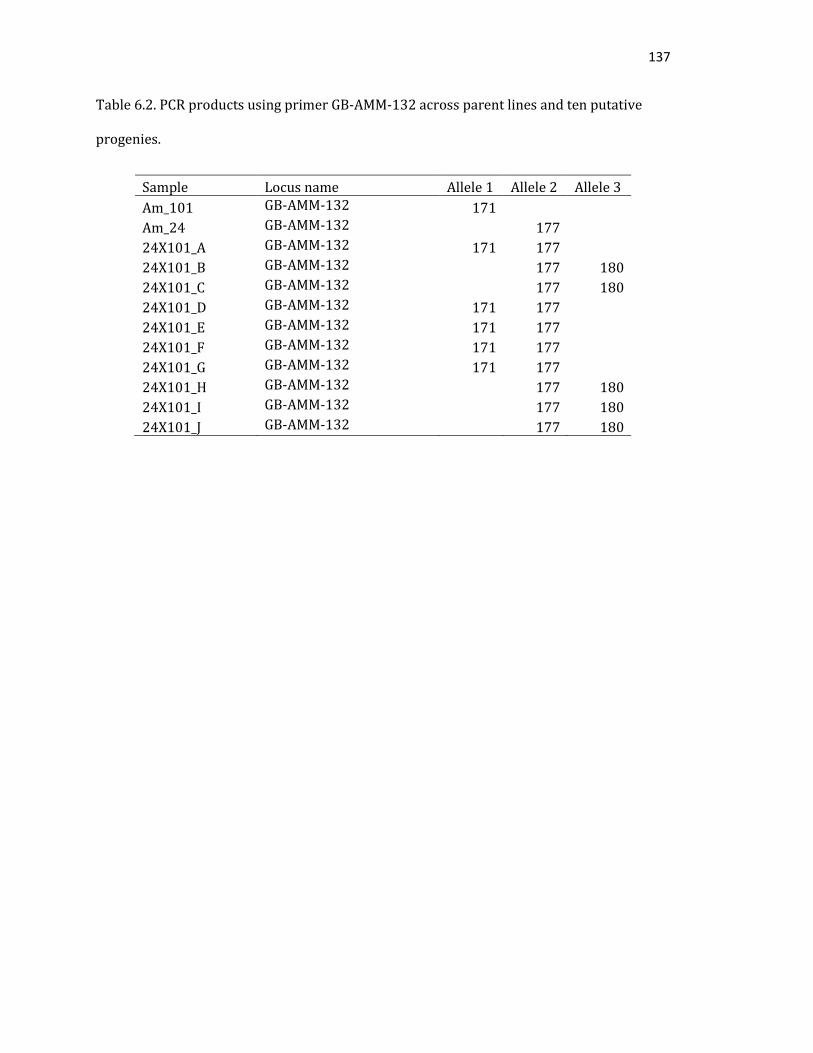
137
Table 6.2. PCR products using primer GB-AMM-132 across parent lines and ten putative
progenies.
Sample Locus name Allele 1 Allele 2 Allele 3
Am_101 GB-AMM-132 171
Am_24 GB-AMM-132 177 24X101_A GB-AMM-132 171 177
24X101_B GB-AMM-132 177 180
24X101_C GB-AMM-132 177 180
24X101_D GB-AMM-132 171 177 24X101_E GB-AMM-132 171 177
24X101_F GB-AMM-132 171 177
24X101_G GB-AMM-132 171 177
24X101_H GB-AMM-132 177 180
24X101_I GB-AMM-132 177 180
24X101_J GB-AMM-132 177 180
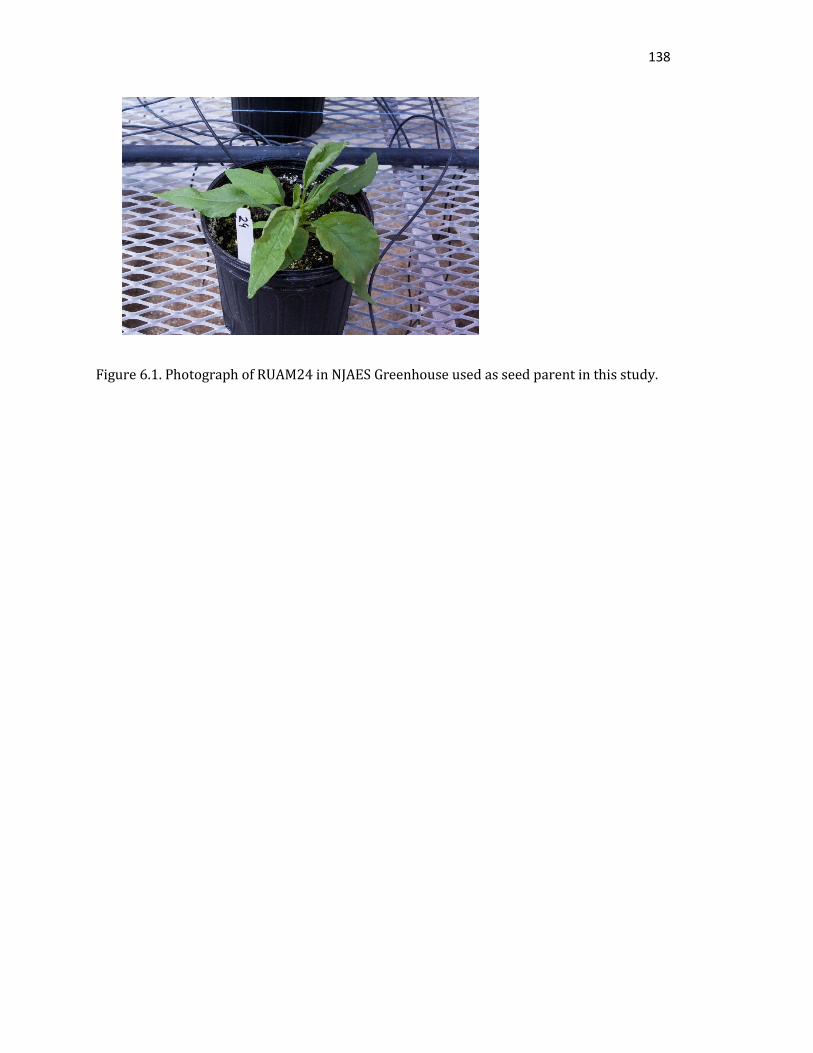
138
Figure 6.1. Photograph of RUAM24 in NJAES Greenhouse used as seed parent in this study.
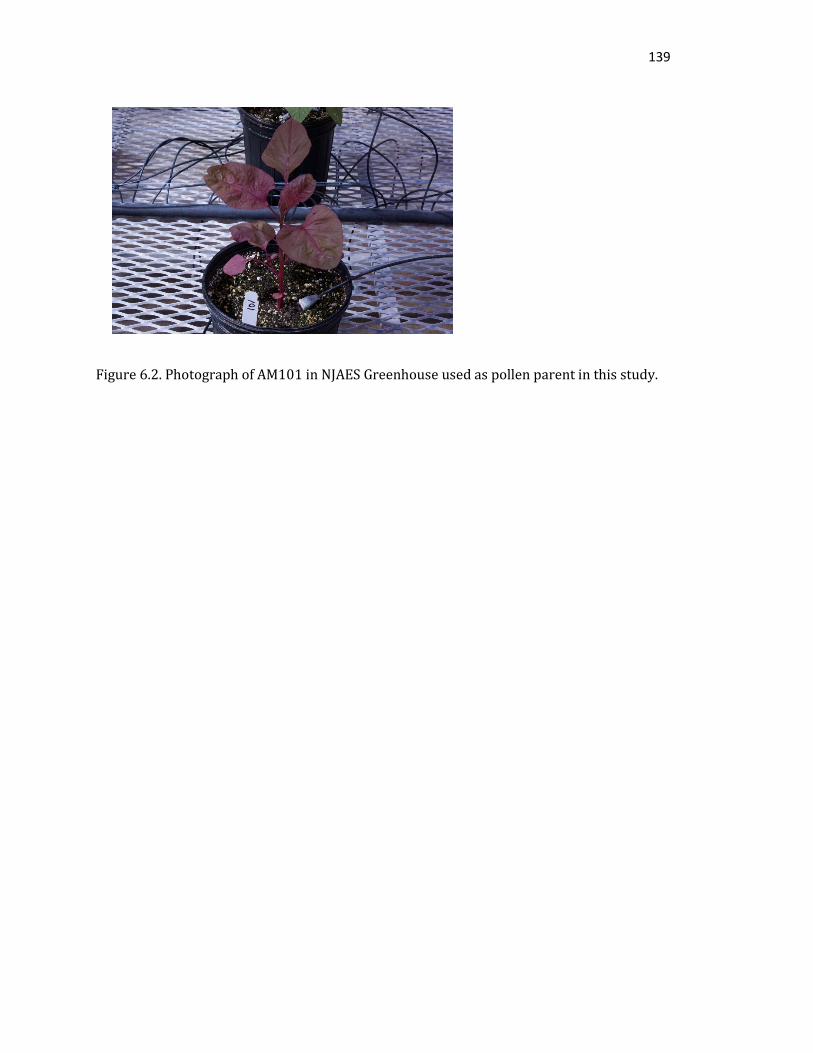
139
Figure 6.2. Photograph of AM101 in NJAES Greenhouse used as pollen parent in this study.
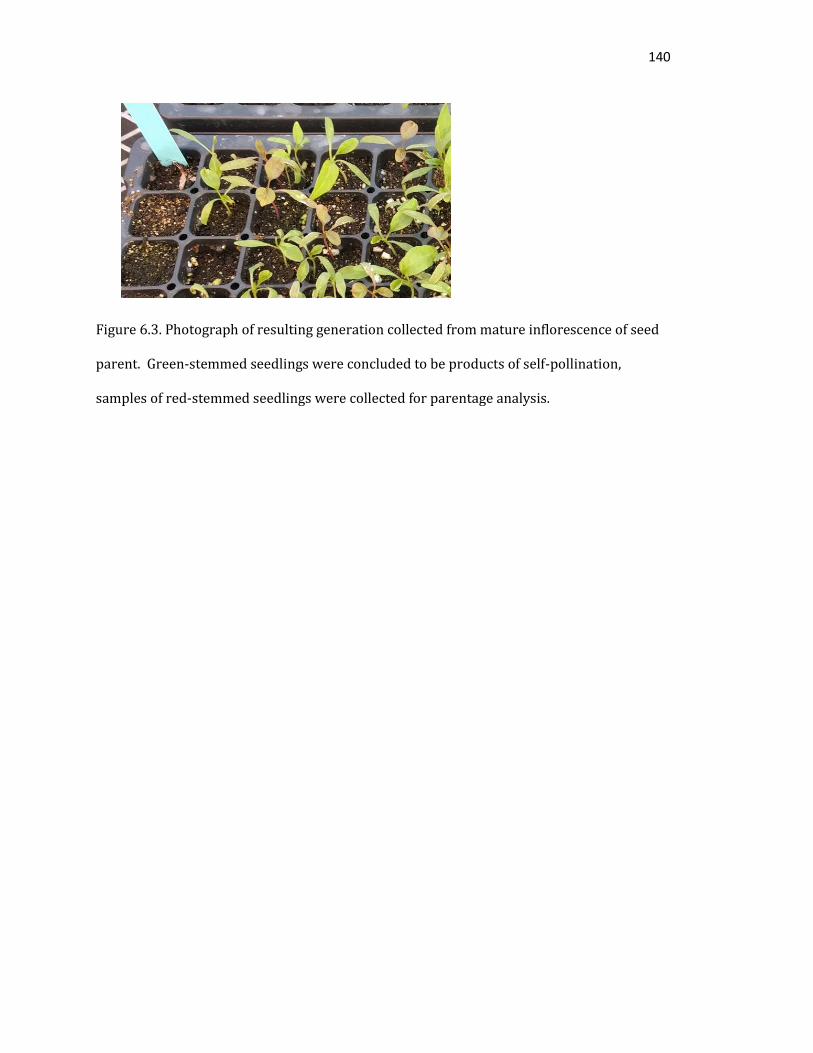
140
Figure 6.3. Photograph of resulting generation collected from mature inflorescence of seed
parent. Green-stemmed seedlings were concluded to be products of self-pollination,
samples of red-stemmed seedlings were collected for parentage analysis.
141
6.5 References
Brenner, D.M., Myers, R.L., Baltensperger, D.D., Slabbert, M.M., Kulakow, P.A., Sleugh, B.B.,
Lehmann, J. W. (2000). Genetic Resources and Breeding of Amaranthus. Plant Breeding
Reviews, 19.
Brownstein, M. J., Carpten, J. D., & Smith, J. R. (1996). Modulation of Non-Templated Nucleotide
Addition by Taq DNA Polymerase: Primer Modifications that Facilitate Genotyping.
BioTechniques, 20(6), 1004–1010. http://doi.org/10.2144/96206st01
Buteler, M. I., LaBonte, D. R., Jarret, R. L., & Macchiavelli, R. E. (2002). Microsatellite-based
Paternity Analysis in Polyploid Sweetpotato. J. Amer. Soc. Hort. Sci., 127(3), 392–396.
Retrieved from http://journal.ashspublications.org/content/127/3/392.short
Byrnes, D. R., Dinssa, F. F., Weller, S. C., & Simon, J. E. (2017). Elemental Micronutrient Content
and Horticultural Performance of Various Vegetable Amaranth Genotypes. Journal of the
American Society for Horticultural Science, 142(4), 265–271.
http://doi.org/10.21273/JASHS04064-17
de la Rosa, R., James, C. M., & Tobutt, K. R. (2004). Using Microsatellites for Paternity Testing in
Olive Progenies. HortScience, 39(2), 351–354. Retrieved from
http://hortsci.ashspublications.org/content/39/2/351.short
Dow, B. D. (1998). High levels of gene flow in bur oak revealed by paternity analysis using
microsatellites. Journal of Heredity, 89(1), 62–70. http://doi.org/10.1093/jhered/89.1.62
Hauptli, H., & Jain, S. (1985). Genetic variation in outcrossing rate and correlated floral traits in a
population of grain amaranth (Amaranthus cruentus L.). Genetica, 66(1), 21–27.
http://doi.org/10.1007/BF00123602
142
Jordan, N. (1996). Effects of the Triazine-Resistance Mutation on Fitness in Amaranthus hybridus
(Smooth Pigweed). Journal of Applied Ecology, 33(1), 141–150. Retrieved from
http://www.jstor.org.proxy.libraries.rutgers.edu/stable/2405023?seq=5&Search=yes&sear
chText=of&searchText=triazine-
resistance&searchText=amaranthus&searchText=fitness&searchText=mutation&searchTex
t=on&searchText=effects&searchText=in&searchText=hybridus&list=hide&searchUri=/acti
on/doBasicSearch?Query=effects+of+triazine-
resistance+mutation+on+fitness+in+amaranthus+hybridus&prq=applied+ecology&am
p;hp=25&acc=on&wc=on&fc=off&
Lambeth, C., Lee, B.-C., O’Malley, D., & Wheeler, N. (2001). Polymix breeding with parental
analysis of progeny: an alternative to full-sib breeding and testing. TAG Theoretical and
Applied Genetics, 103(6–7), 930–943. http://doi.org/10.1007/s001220100627
Lee, J.-R., Hong, G.-Y., Dixit, A., Chung, J.-W., Ma, K.-H., Lee, J.-H., … Park, Y.-J. (2008).
Characterization of microsatellite loci developed for Amaranthus hypochondriacus and
their cross-amplifications in wild species. Conservation Genetics, 9(1), 243–246.
http://doi.org/10.1007/s10592-007-9323-1
McElroy, J. B. (1982). Species relationships and breeding behavior in the cultivated vegetable
amaranths. Cornell. Cornell University. Retrieved from
http://www.worldcat.org/title/species-relationships-and-breeding-behavior-in-the-
cultivated-vegetable-amaranths/oclc/63574884
Murray, M. J. (1938). Interspecific and Intergeneric Crosses in the Family Amaranthaceae in
Relation to Sex Determination. Cornell, University. Retrieved from
143
http://catalog.hathitrust.org/Record/009117321
National Resource Council. (1984). Amaranth: Modern Prospects for an Ancient Crop.
Washington D.C.: USAID, National Academy Press. Retrieved from
http://pdf.usaid.gov/pdf_docs/PNAAQ614.pdf
Pal, M. (1972). Evolution and improvement of cultivated amaranths. III. Amaranthus spinosus-
dubius complex. Genetica, 43(1), 106–118. http://doi.org/10.1007/BF00122504
Schuelke, M. (2000). An economic method for the fluorescent labeling of PCR fragments. Nature
Biotechnology, 18(2), 233–234. http://doi.org/10.1038/72708
Sunil, M., Hariharan, A. K., Nayak, S., Gupta, S., Nambisan, S. R., Gupta, R. P., … Srinivasan, S.
(2014). The draft genome and transcriptome of Amaranthus hypochondriacus: a C4 dicot
producing high-lysine edible pseudo-cereal. DNA Research : An International Journal for
Rapid Publication of Reports on Genes and Genomes, 21(6), 585–602.
http://doi.org/10.1093/dnares/dsu021