Embed Size (px)
Citation preview
2008Global
Strategic Planning
www.avrdc.org
Post-Harvest Handling and Marketing of African Indigenous Vegetables
•Author
•Ojiewo C
•Guga Y.
•Tenkouano A.
•Yang RY
•Image here
2008Global
Strategic Planning
www.avrdc.org
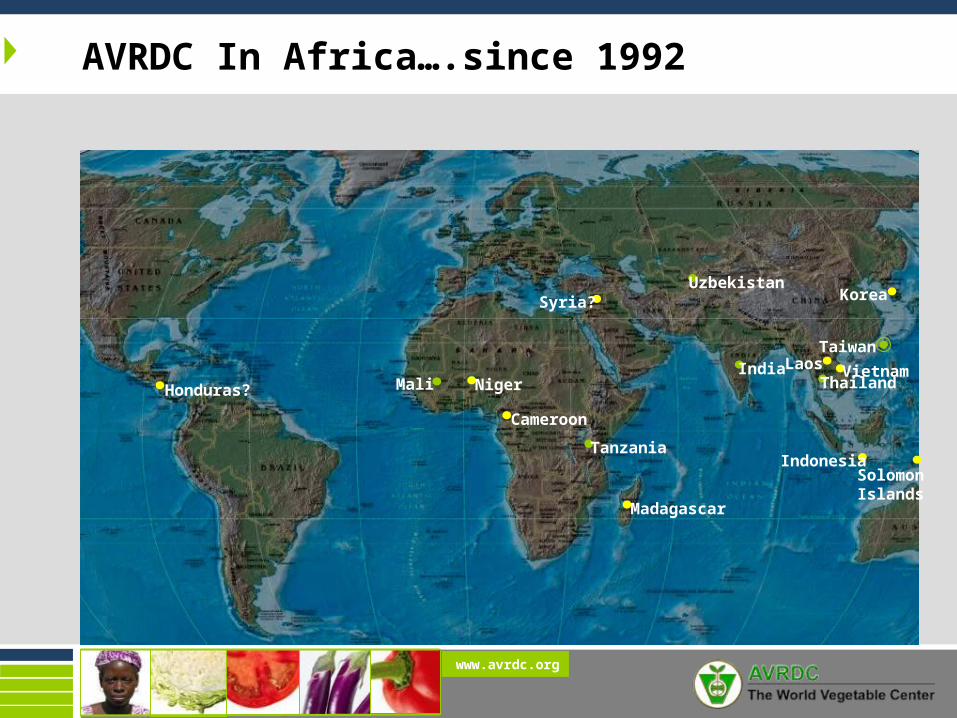
AVRDC In Africa….since 1992
UzbekistanKorea
TaiwanLaos
Thailand
IndonesiaSolomon
Islands
India
Syria?
Madagascar
Tanzania
Mali Niger
Cameroon
VietnamHonduras?
2008Global
Strategic Planning
www.avrdc.org
Vegetable R&D in Africa
Collaborative Network for Vegetable Research and Development in Eastern and Southern Africa (CONVERDS, SADC)
focus on human resource development and networking for delivery of promising products and techniques – about 6000 alumni from 30+ countries
assembly of diverse array of indigenous vegetables – about 2000 accessions
Light structure - basic field facilities and small research team
2008Global
Strategic Planning
www.avrdc.org
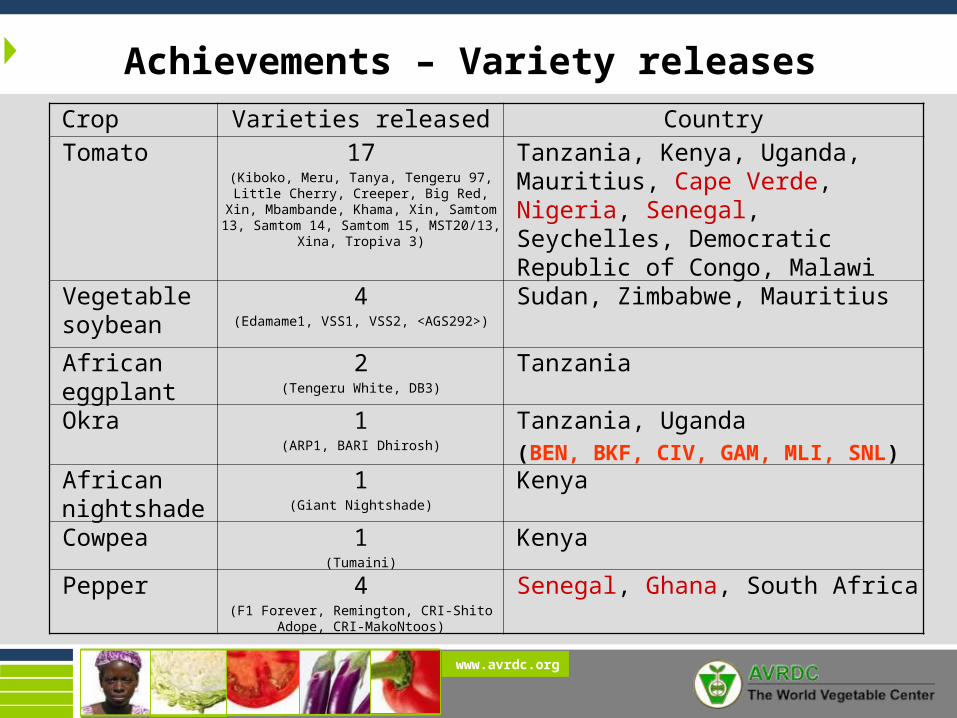
Achievements – Variety releasesCrop Varieties released CountryTomato 17
(Kiboko, Meru, Tanya, Tengeru 97, Little Cherry, Creeper, Big Red, Xin,
Mbambande, Khama, Xin, Samtom 13, Samtom 14, Samtom 15, MST20/13, Xina,
Tropiva 3)
Tanzania, Kenya, Uganda, Mauritius, Cape Verde, Nigeria, Senegal, Seychelles, Democratic Republic of Congo, Malawi
Vegetable soybean
4(Edamame1, VSS1, VSS2, <AGS292>)
Sudan, Zimbabwe, Mauritius
African eggplant
2(Tengeru White, DB3)
Tanzania
Okra 1(ARP1, BARI Dhirosh)
Tanzania, Uganda(BEN, BKF, CIV, GAM, MLI, SNL)
African nightshade
1(Giant Nightshade)
Kenya
Cowpea 1(Tumaini)
Kenya
Pepper 4(F1 Forever, Remington, CRI-Shito Adope,
CRI-MakoNtoos)
Senegal, Ghana, South Africa
2008Global
Strategic Planning
www.avrdc.org
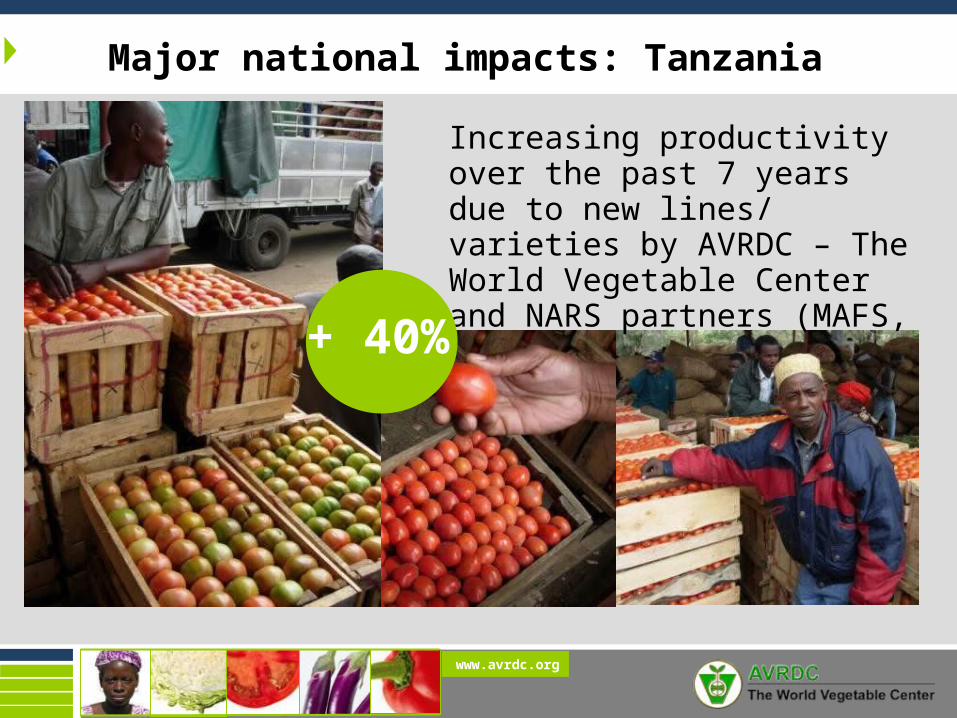
Increasing productivity over the past 7 years due to new lines/ varieties by AVRDC – The World Vegetable Center and NARS partners (MAFS, 2005)
+ 40%
Major national impacts: Tanzania

2008Global
Strategic Planning
www.avrdc.org
Develop and Promote a
Vegetable Business Route to Health and Wealth
Use our Science
and Networks
No or little access to improved varieties
and foundation seed thereof has been a major impediment to the development of a viable private vegetable seed industry in Sub-Sahara Africa
Going Further to Deliver - Working Hypothesis
2008Global
Strategic Planning
www.avrdc.org
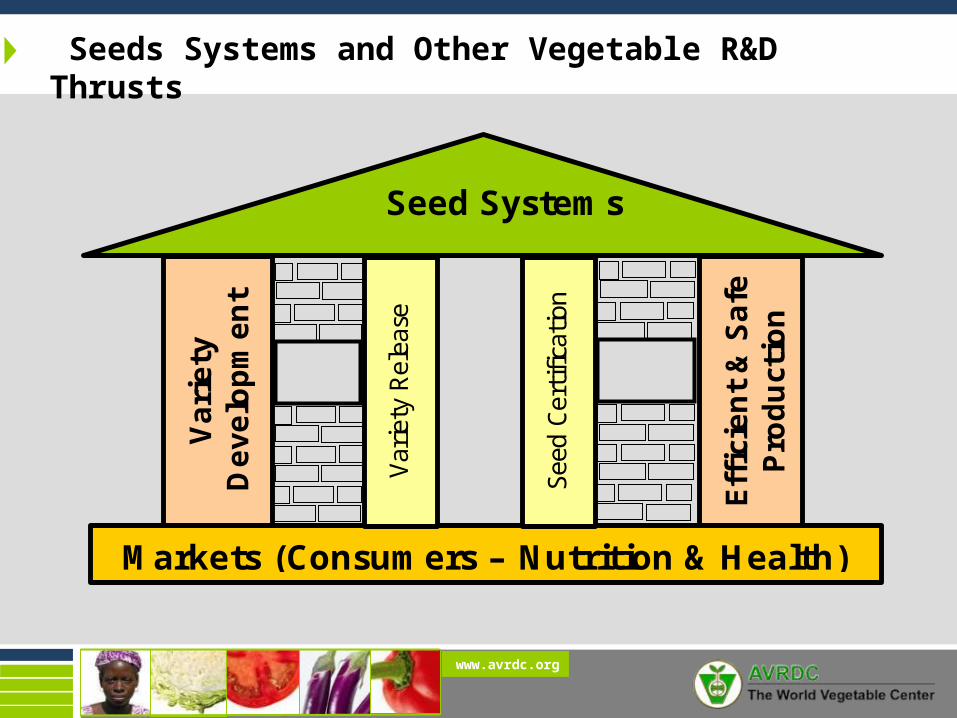
Seeds Systems and Other Vegetable R&D Thrusts
Seed Systems
Markets (Consumers – Nutrition & Health)
Vari
ety
D
eve
lopm
ent
Var
iety
Rel
ease
Seed
Cer
tifica
tion
Effi
cient
& S
afe
Pro
duct
ion
2008Global
Strategic Planning
www.avrdc.org
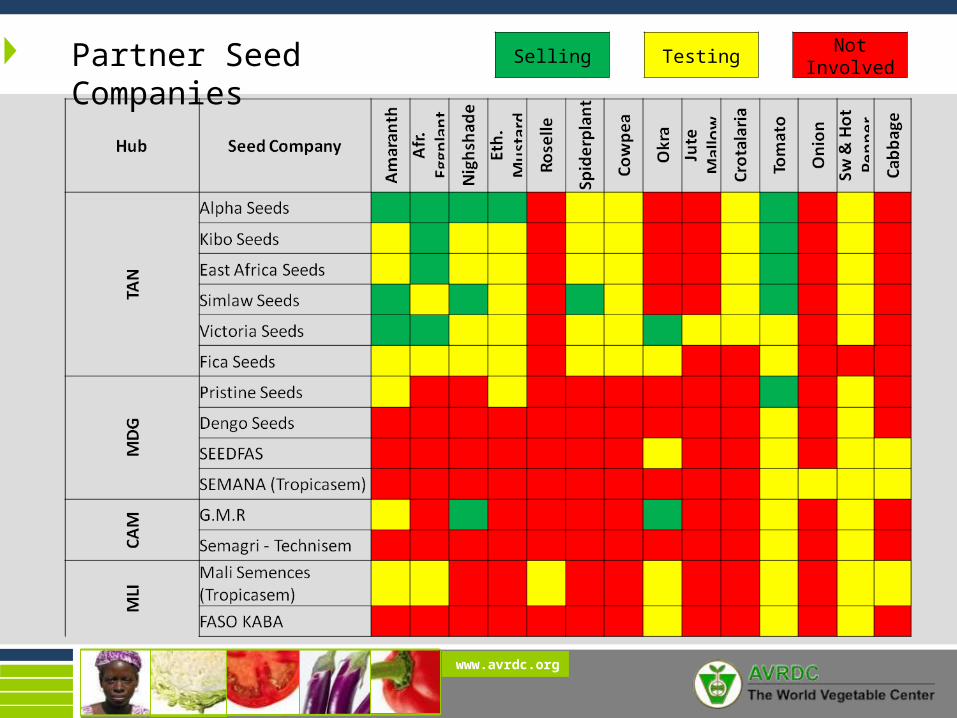
Selling Testing Not InvolvedPartner Seed Companies
2008Global
Strategic Planning
www.avrdc.org
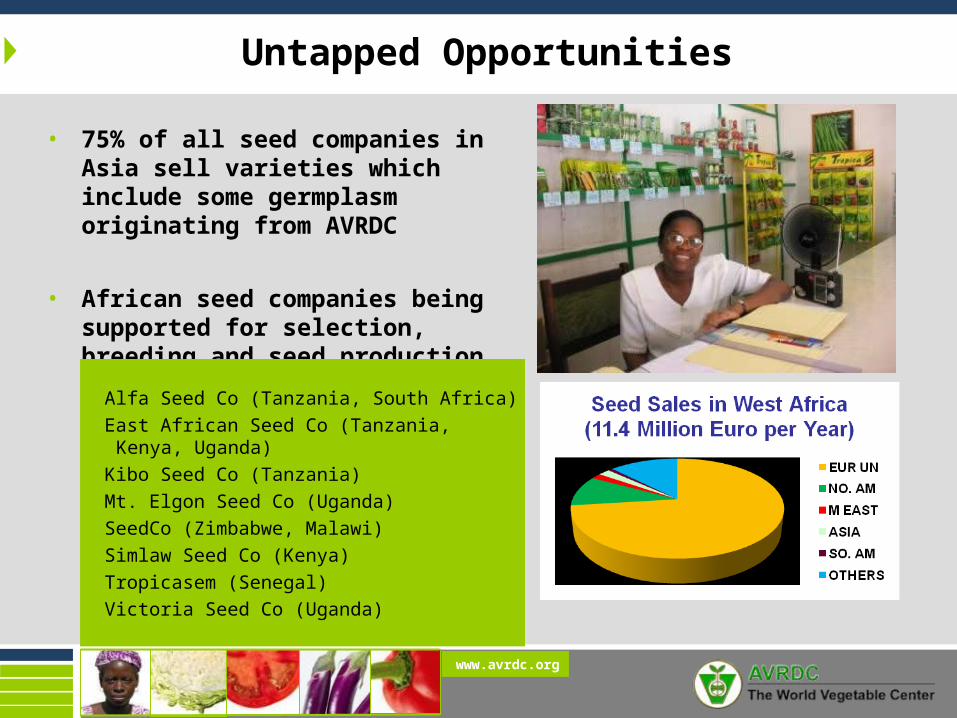
Untapped Opportunities
• 75% of all seed companies in Asia sell varieties which include some germplasm originating from AVRDC
• African seed companies being supported for selection, breeding and seed production
Alfa Seed Co (Tanzania, South Africa)East African Seed Co (Tanzania, Kenya, Uganda)
Kibo Seed Co (Tanzania)Mt. Elgon Seed Co (Uganda)SeedCo (Zimbabwe, Malawi)Simlaw Seed Co (Kenya)Tropicasem (Senegal)Victoria Seed Co (Uganda)
2008Global
Strategic Planning
www.avrdc.org
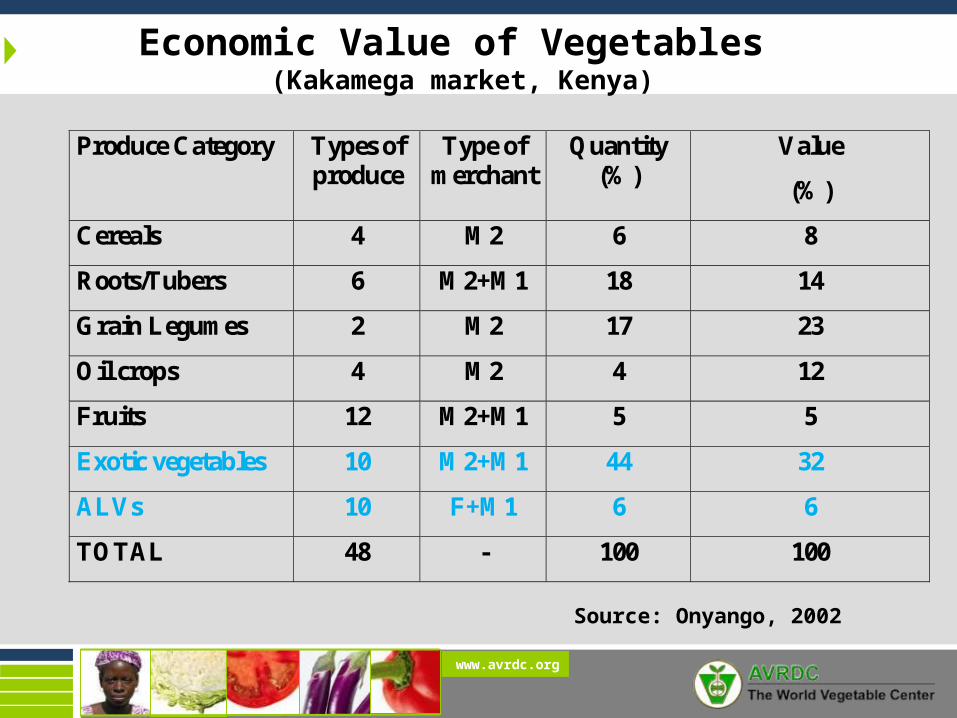
Economic Value of Vegetables (Kakamega market, Kenya)
Produce Category Types of produce
Type of merchant
Quantity (%)
Value
(%)
Cereals 4 M2 6 8
Roots/Tubers 6 M2+M1 18 14
Grain Legumes 2 M2 17 23
Oil crops 4 M2 4 12
Fruits 12 M2+M1 5 5
Exotic vegetables 10 M2+M1 44 32
ALVs 10 F+M1 6 6
TOTAL 48 - 100 100
Source: Onyango, 2002
2008Global
Strategic Planning
www.avrdc.org
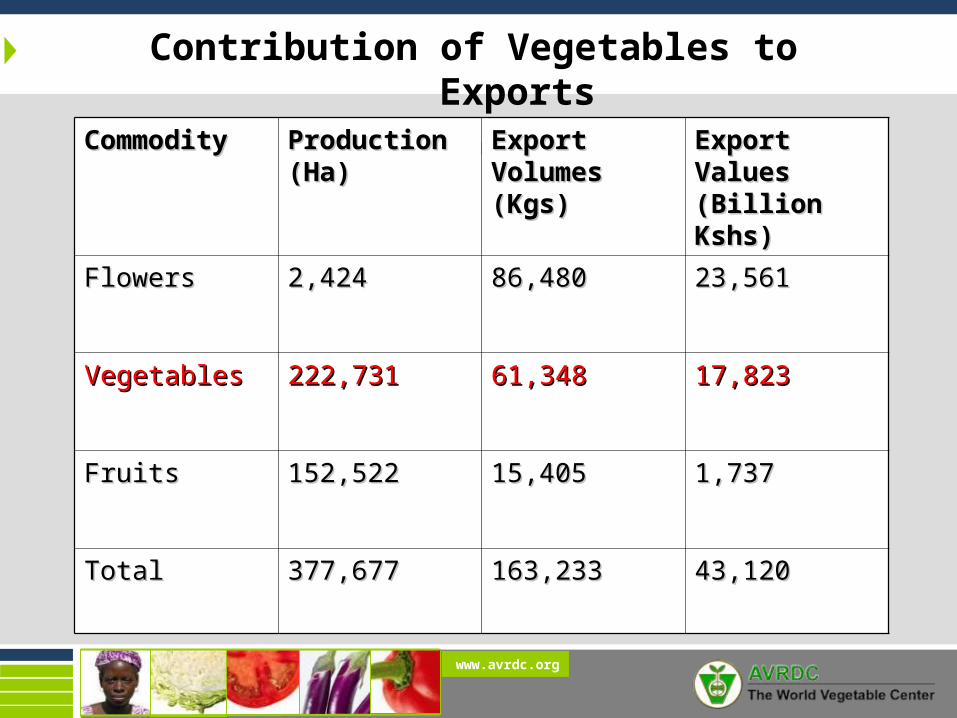
Contribution of Vegetables to Exports(Kenya,2006)
CommodityCommodity Production Production (Ha)(Ha)
Export Export Volumes Volumes (Kgs)(Kgs)
Export Values Export Values (Billion Kshs)(Billion Kshs)
FlowersFlowers 2,4242,424 86,48086,480 23,56123,561
VegetablesVegetables 222,731222,731 61,34861,348 17,82317,823
FruitsFruits 152,522152,522 15,40515,405 1,7371,737
TotalTotal 377,677377,677 163,233163,233 43,12043,120
2008Global
Strategic Planning
www.avrdc.org
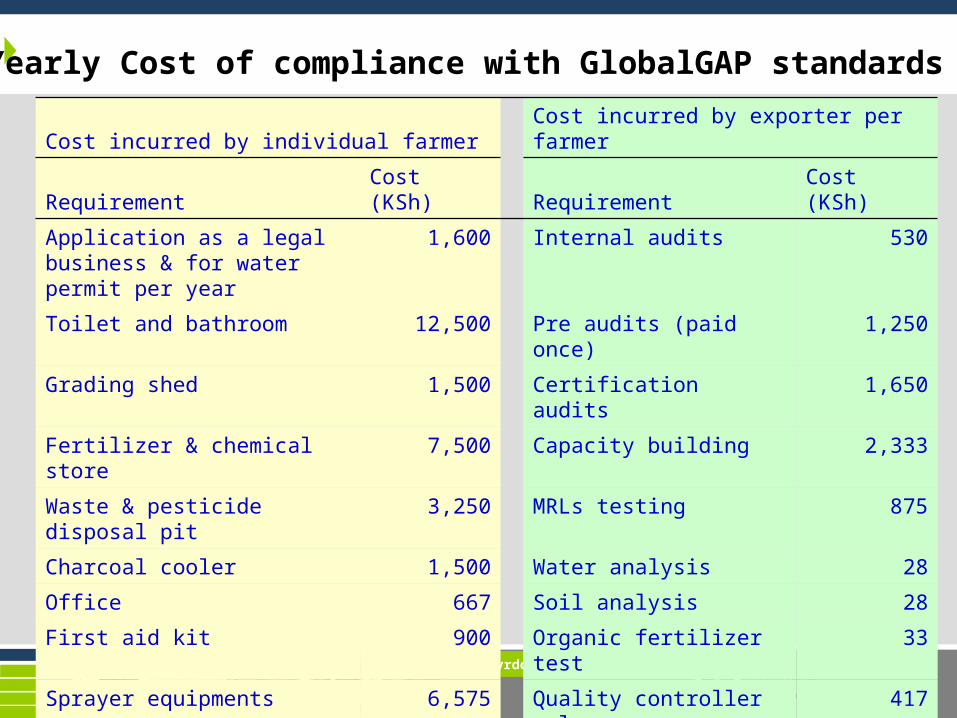
Yearly Cost of compliance with GlobalGAP standards
Cost incurred by individual farmer Cost incurred by exporter per farmer
Requirement Cost (KSh) Requirement Cost (KSh)
Application as a legal business & for water permit per year
1,600 Internal audits 530
Toilet and bathroom 12,500 Pre audits (paid once) 1,250
Grading shed 1,500 Certification audits 1,650
Fertilizer & chemical store 7,500 Capacity building 2,333
Waste & pesticide disposal pit 3,250 MRLs testing 875
Charcoal cooler 1,500 Water analysis 28
Office 667 Soil analysis 28
First aid kit 900 Organic fertilizer test 33
Sprayer equipments 6,575 Quality controller salary 417
Harvesting buckets 195 Technical assistant salary 1,250
Record keeping 420
Total 36,607
(508 US$)
Total 8,394
(115 US$)
2008Global
Strategic Planning
www.avrdc.org
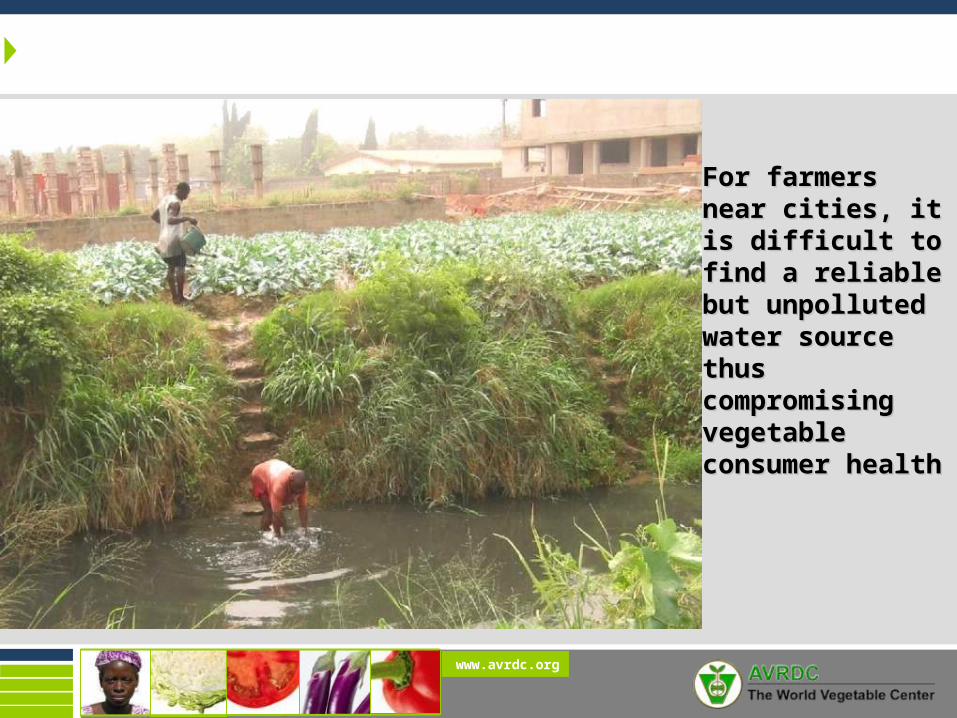
For farmers For farmers near cities, it is near cities, it is difficult to find difficult to find a reliable but a reliable but unpolluted unpolluted water source water source thus thus compromisingcompromisingvegetable vegetable consumer consumer healthhealth
2008Global
Strategic Planning
www.avrdc.org
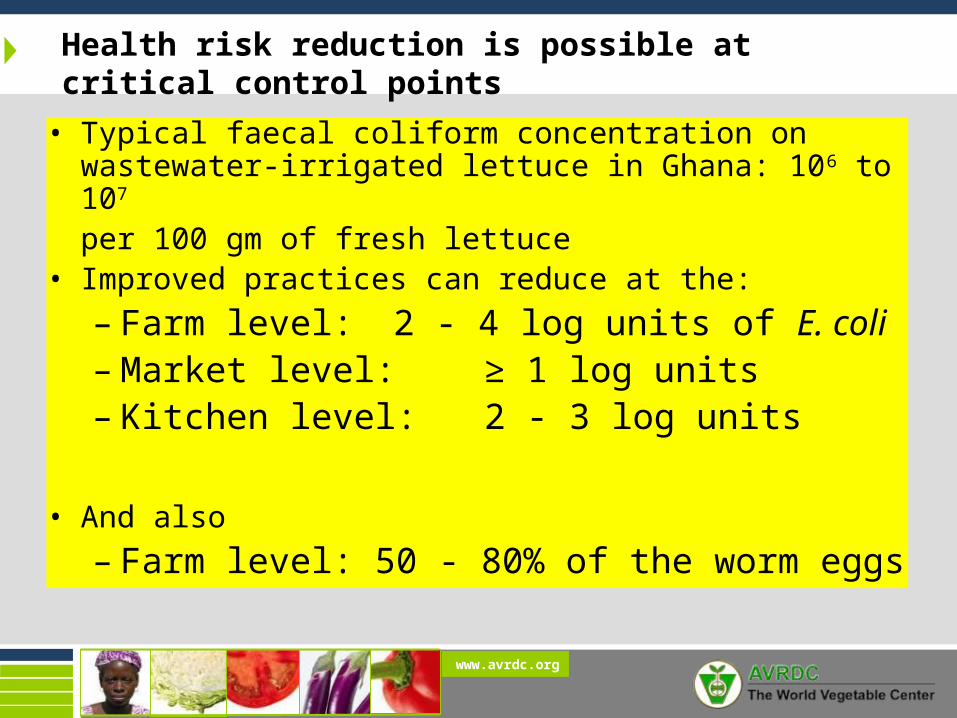
Health risk reduction is possible at critical control points
• Typical faecal coliform concentration on wastewater-irrigated lettuce in Ghana: 106 to 107
per 100 gm of fresh lettuce• Improved practices can reduce at the:
– Farm level: 2 - 4 log units of E. coli– Market level: ≥ 1 log units– Kitchen level: 2 - 3 log units
• And also
– Farm level: 50 - 80% of the worm eggs
2008Global
Strategic Planning
www.avrdc.org
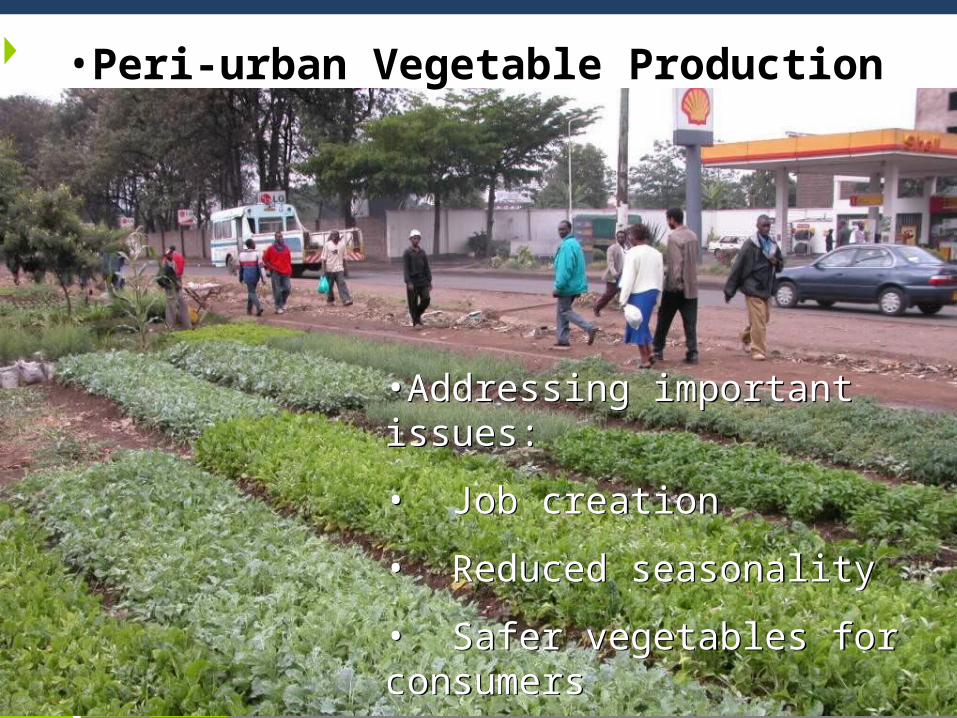
•Addressing important issues:
• Job creation
• Reduced seasonality
• Safer vegetables for consumers
• Improved marketing systems
•Addressing important issues:
• Job creation
• Reduced seasonality
• Safer vegetables for consumers
• Improved marketing systems
•Peri-urban Vegetable Production
2008Global
Strategic Planning
www.avrdc.org
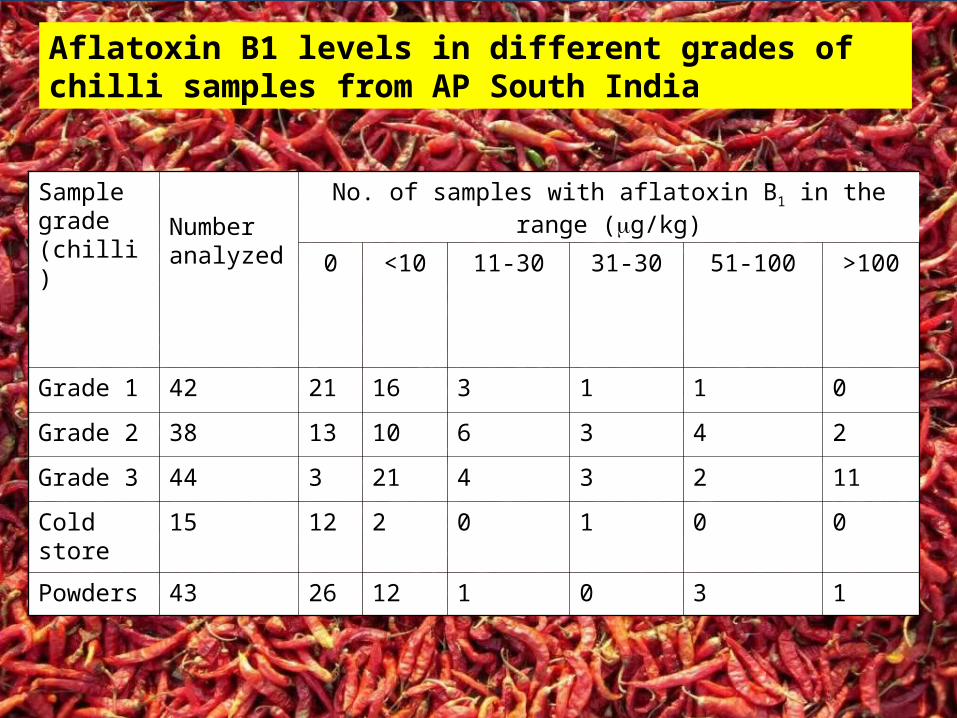
Aflatoxin B1 levels in different grades of chilli samples from AP South India
Sample grade (chilli)
Number analyzed
No. of samples with aflatoxin B1 in the range (g/kg)
0 <10 11-30 31-30 51-100 >100
Grade 1 42 21 16 3 1 1 0
Grade 2 38 13 10 6 3 4 2
Grade 3 44 3 21 4 3 2 11
Cold store
15 12 2 0 1 0 0
Powders 43 26 12 1 0 3 1
2008Global
Strategic Planning
www.avrdc.org
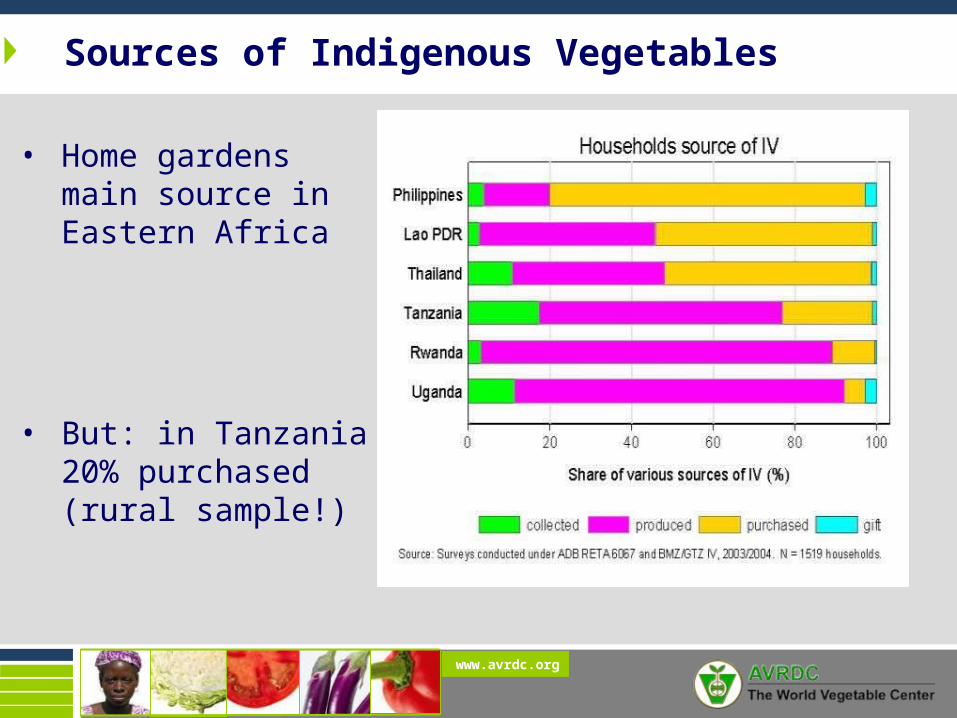
Sources of Indigenous Vegetables
• Home gardens main source in Eastern Africa
• But: in Tanzania 20% purchased (rural sample!)
2008Global
Strategic Planning
www.avrdc.org
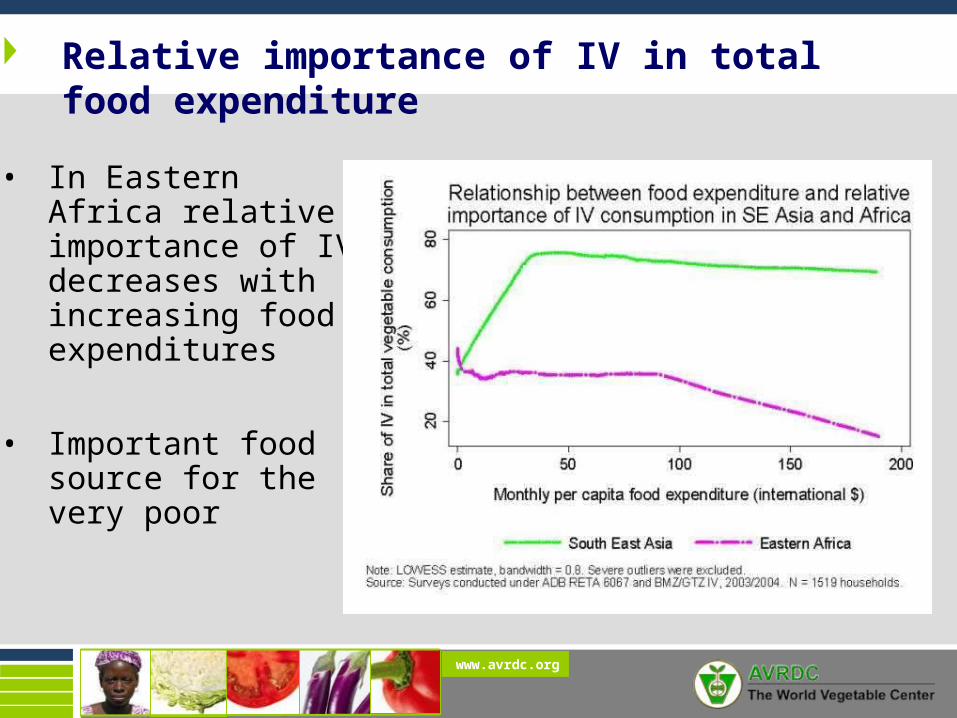
Relative importance of IV in total food expenditure
• In Eastern Africa relative importance of IV decreases with increasing food expenditures
• Important food source for the very poor
2008Global
Strategic Planning
www.avrdc.org
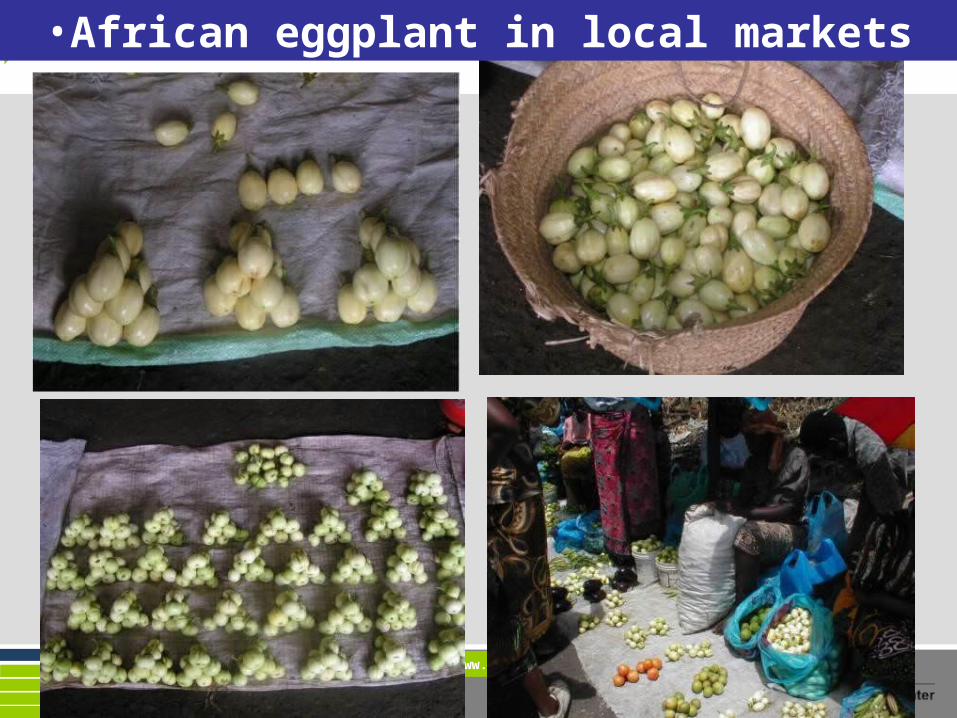
•African eggplant in local markets
2008Global
Strategic Planning
www.avrdc.org
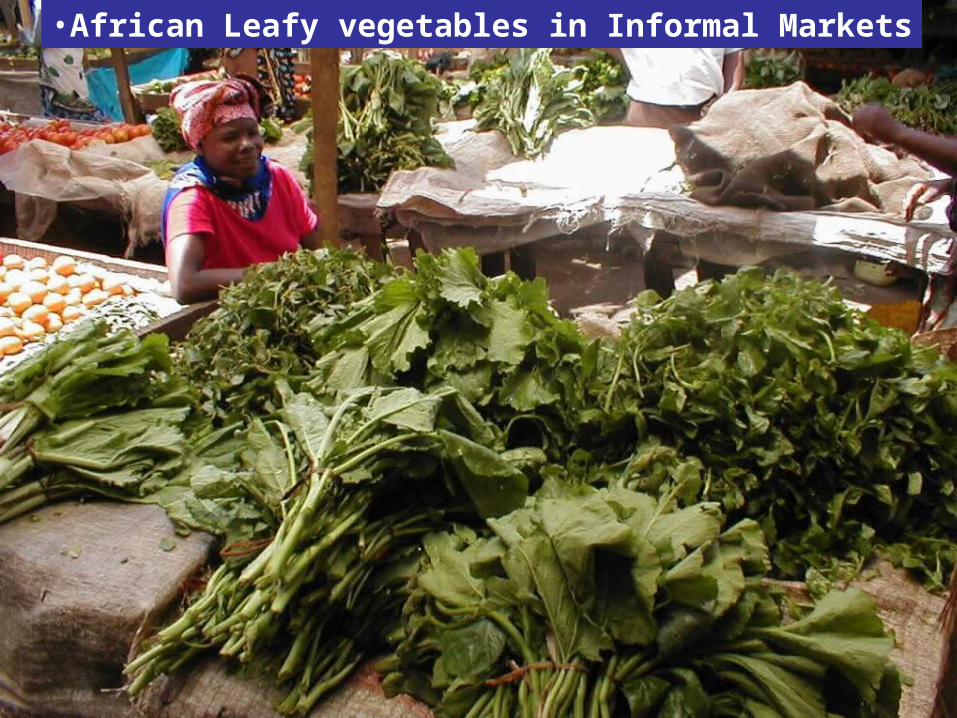
•African Leafy vegetables in Informal Markets
2008Global
Strategic Planning
www.avrdc.org
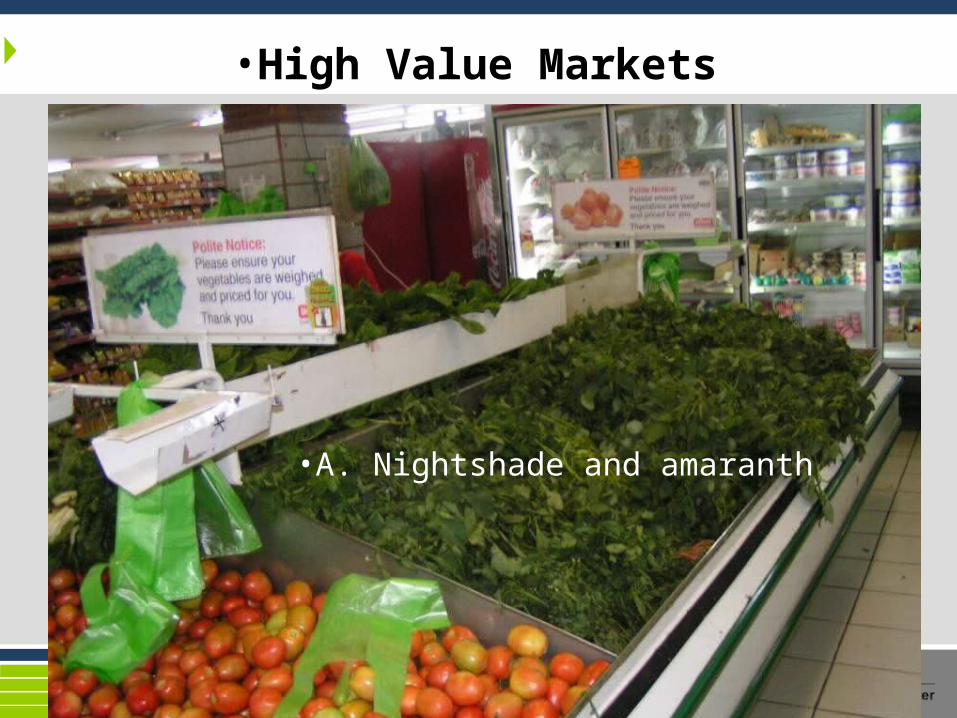
•High Value Markets
•A. Nightshade and amaranth
2008Global
Strategic Planning
www.avrdc.org
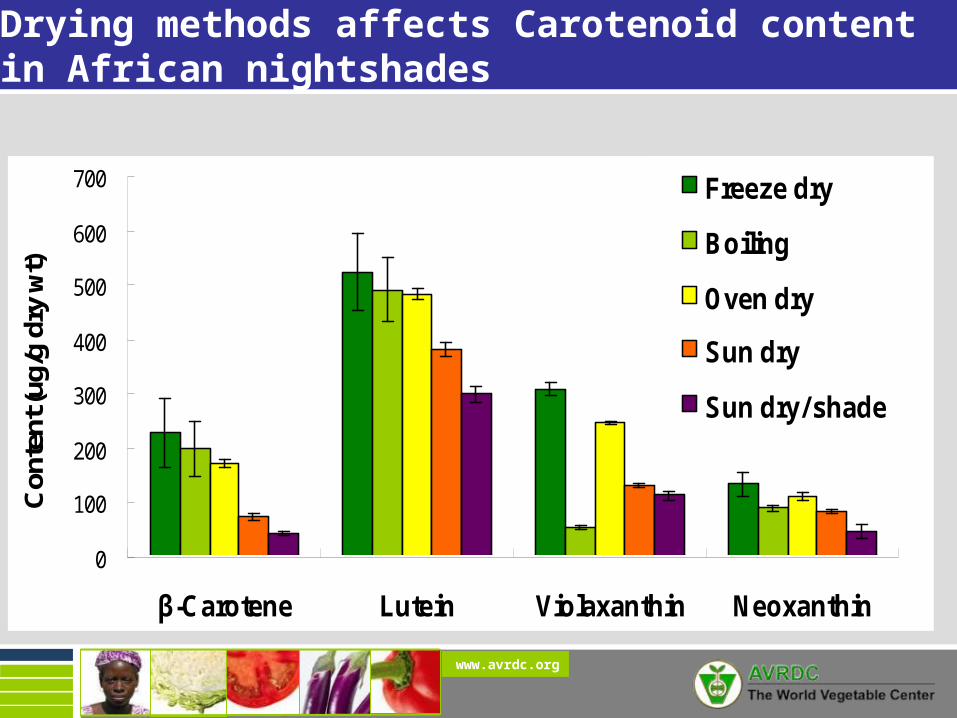
Drying methods affects Carotenoid content in African nightshades
0
100
200
300
400
500
600
700
β-Carotene Lutein Violaxanthin Neoxanthin
Con
tent
(ug/
g dr
y w
t)
Freeze dry
Boiling
Oven dry
Sun dry
Sun dry/ shade
dccdc
bb
aa
aa
a
a
a
a
e
c
b
b
b
2008Global
Strategic Planning
www.avrdc.org
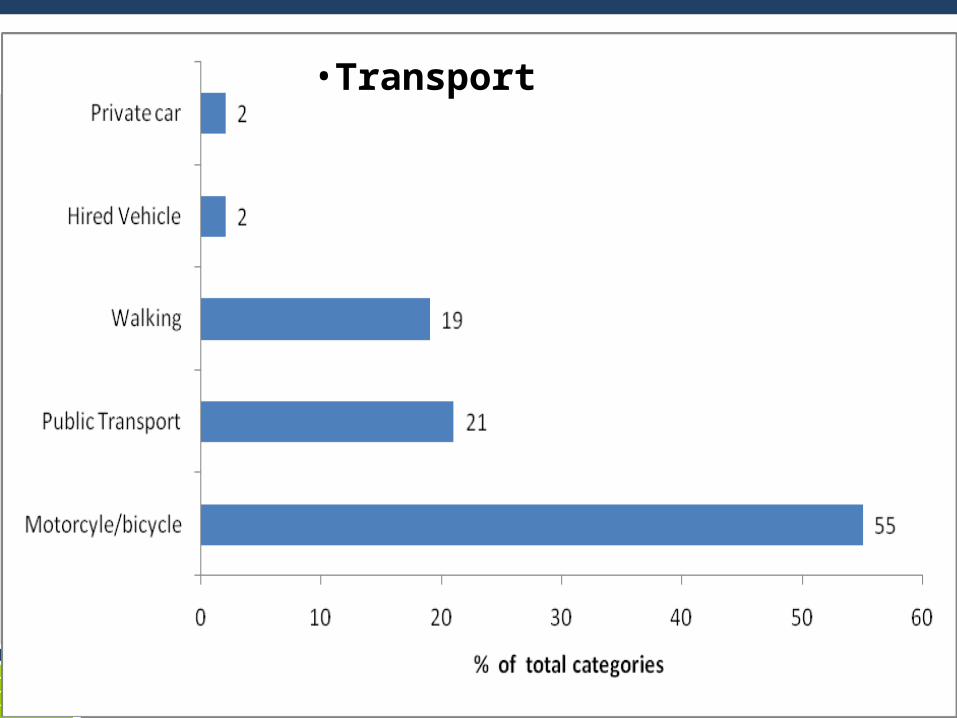
•Transport

2008Global
Strategic Planning
www.avrdc.org
A Lack of Post-harvest storage & processing:Up to 50% of vegetable crops are lost from field to shelf
2008Global
Strategic Planning
www.avrdc.org
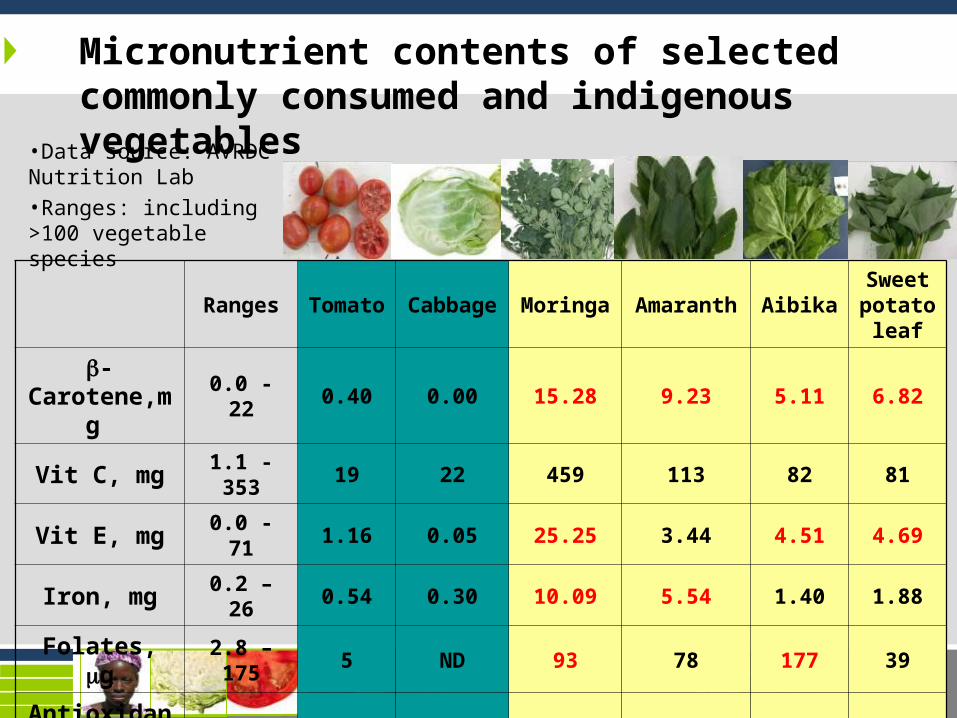
Micronutrient contents of selected commonly consumed and indigenous vegetables
Ranges Tomato Cabbage Moringa Amaranth AibikaSweet potato
leaf
-Carotene,mg 0.0 - 22 0.40 0.00 15.28 9.23 5.11 6.82
Vit C, mg 1.1 - 353 19 22 459 113 82 81
Vit E, mg 0.0 - 71 1.16 0.05 25.25 3.44 4.51 4.69
Iron, mg 0.2 – 26 0.54 0.30 10.09 5.54 1.40 1.88
Folates, g 2.8 – 175 5 ND 93 78 177 39
Antioxidant activity, TE
0.6 - 82,000 323 496 2858 394 560 870
•Data source: AVRDC Nutrition Lab
•Ranges: including >100 vegetable species
2008Global
Strategic Planning
www.avrdc.org
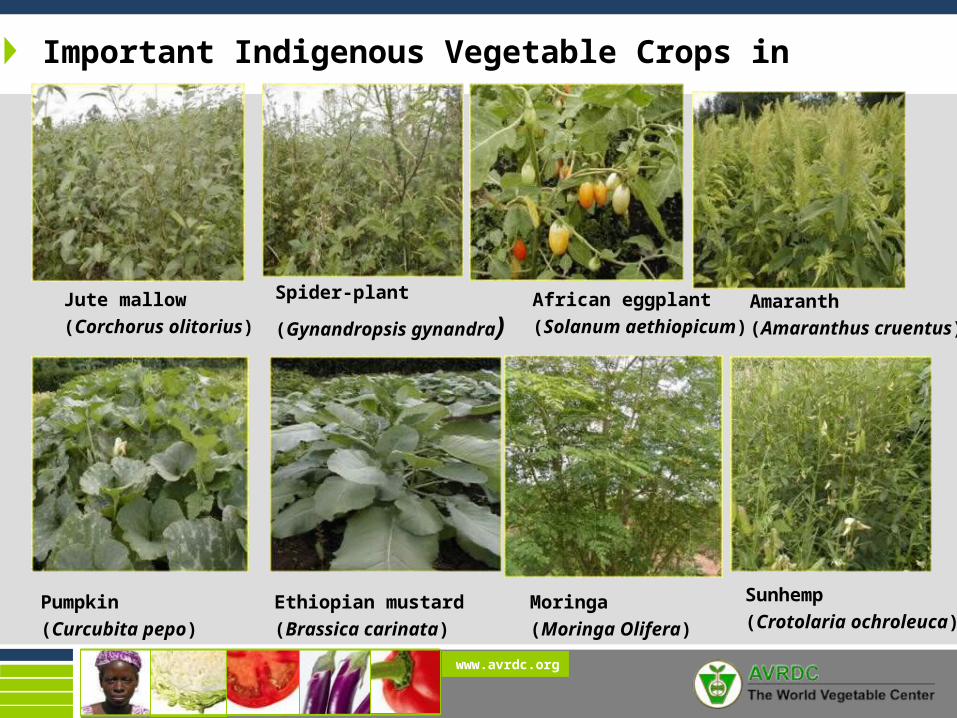
Important Indigenous Vegetable Crops in Africa
Ethiopian mustard(Brassica carinata)
Pumpkin(Curcubita pepo)
African eggplant(Solanum aethiopicum)
Amaranth(Amaranthus cruentus)
Moringa(Moringa Olifera)
Spider-plant
(Gynandropsis gynandra)Jute mallow(Corchorus olitorius)
Sunhemp(Crotolaria ochroleuca)
2008Global
Strategic Planning
www.avrdc.org
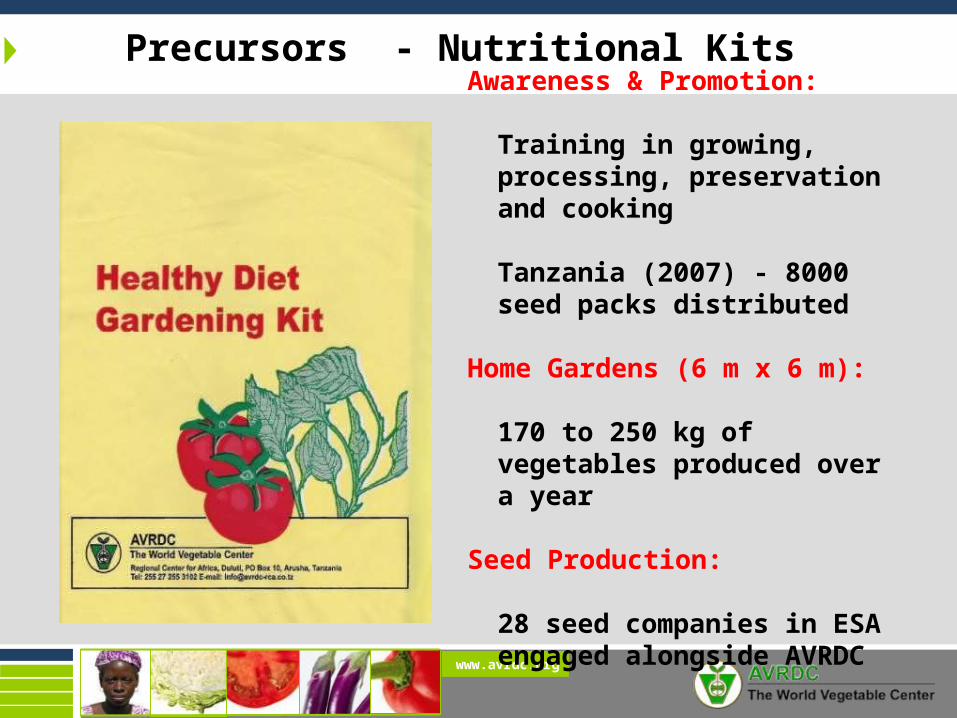
Precursors - Nutritional Kits
Awareness & Promotion:
Training in growing, processing, preservation and cooking
Tanzania (2007) - 8000 seed packs distributed
Home Gardens (6 m x 6 m):
170 to 250 kg of vegetables produced over a year
Seed Production:
28 seed companies in ESA engaged alongside AVRDC
2008Global
Strategic Planning
www.avrdc.org
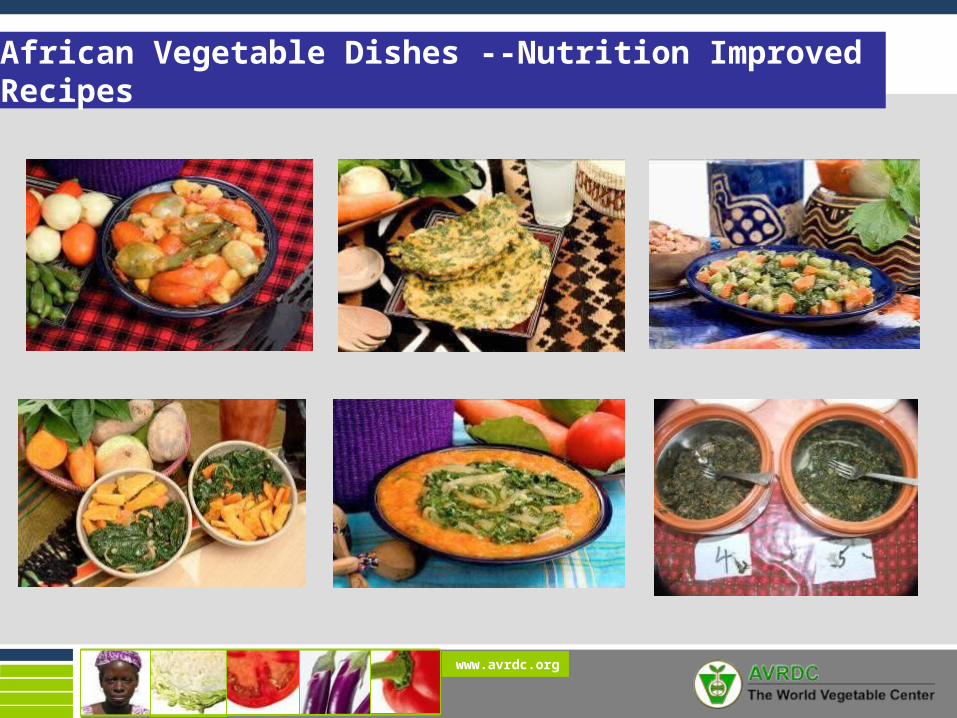
African Vegetable Dishes --Nutrition Improved Recipes
2008Global
Strategic Planning
www.avrdc.org
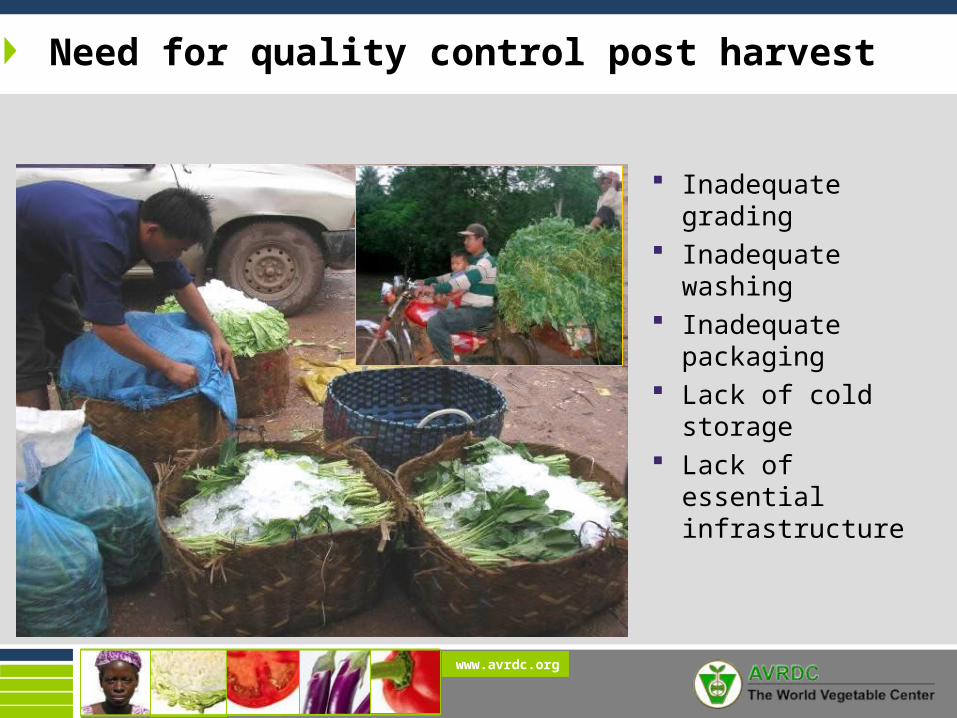
Need for quality control post harvest
Inadequate grading
Inadequate washing
Inadequate packaging
Lack of cold storage
Lack of essential infrastructure
2008Global
Strategic Planning
www.avrdc.org
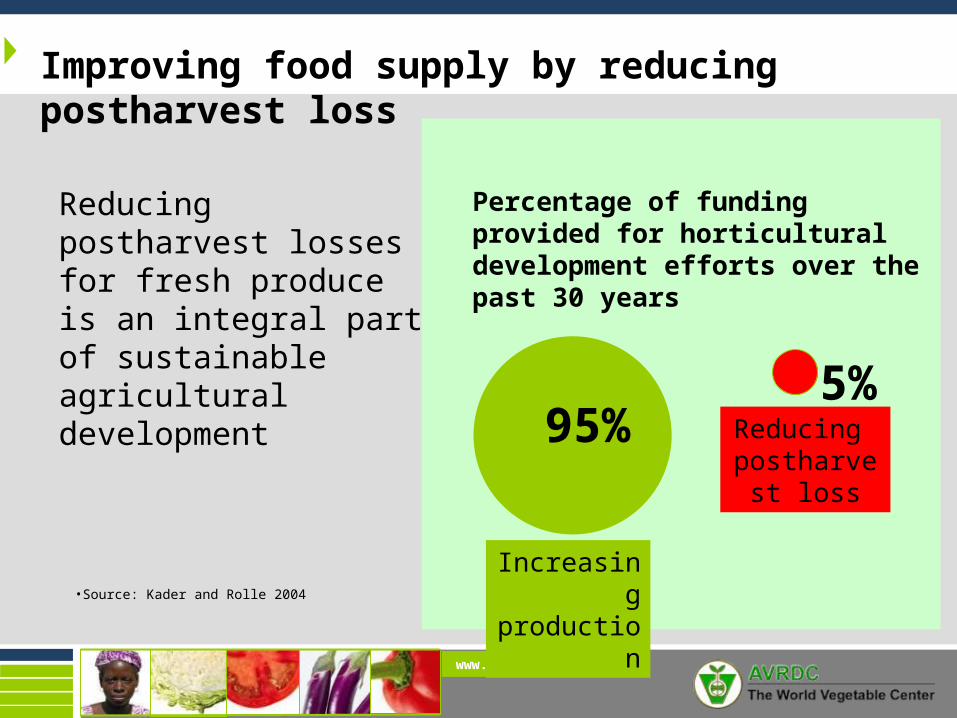
Improving food supply by reducing postharvest loss
Reducing postharvest losses for fresh produce is an integral part of sustainable agricultural development
95% 5%
Percentage of funding provided for horticultural development efforts over the past 30 years
Increasing production
Reducing postharvest
loss
•Source: Kader and Rolle 2004
2008Global
Strategic Planning
www.avrdc.org
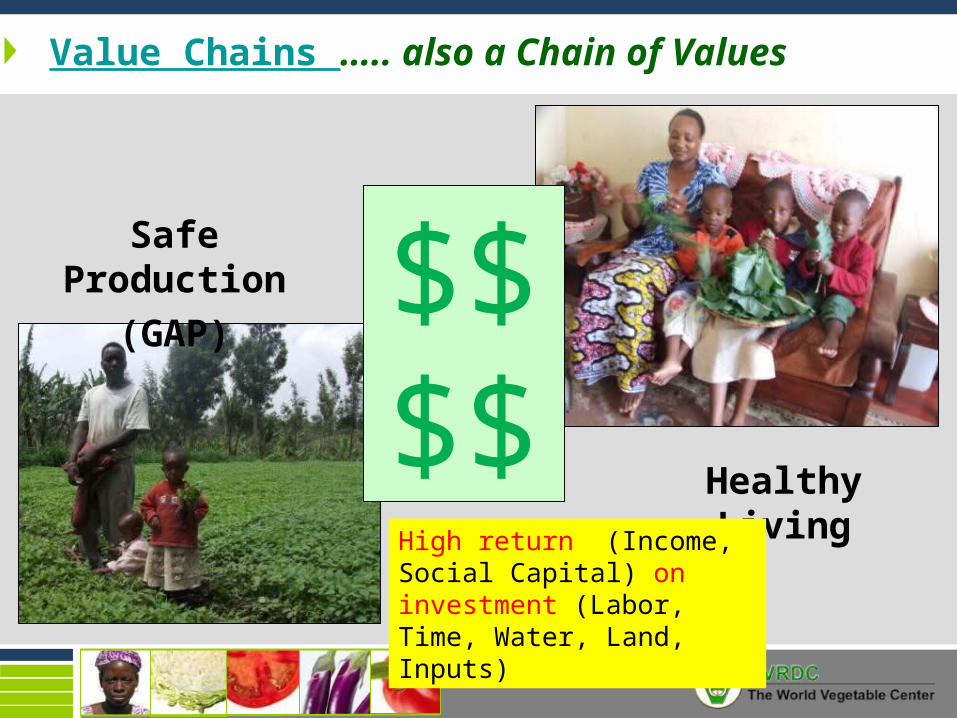
Value Chains ….. also a Chain of Values
$$$$
Safe Production
(GAP)
Healthy Living
High return (Income, Social Capital) on investment (Labor, Time, Water, Land, Inputs)

2008Global
Strategic Planning
www.avrdc.org