Embed Size (px)
Citation preview

1/38
Jochen JägerUnivers ity of Washington
Department of Computer S cience
Advisors :Larry Ruzzo
R imli S engupta
Improved gene selection in microarrays bycombining clustering and statistical techniques
2/38
Motivation
• T hink of a complicated question:
• Will it be sunny tomorrow?
• How can you answer it correctly if you DONOT know the answer?
• Ask around or better, make a poll
3/38
Majority vote
• S tudent: I heard it is supposed to be sunny
• T V: partly sunny
• Yourself: Cons idering the past few days and lookingouts ide I would guess it will rain
• Weather.com: partly cloudy with scattered showers
• Result: 2 (sunny) : 2 (not sunny)
• Better: Use weights
• Idea: remove redundant answers as well

4/38
Outline
• Motivating example example• Biological background• Problem statement• Current solution• Proposed attack• Results• Future work

5/38
Biological task
• F ind informative genes• (e.g. genes which can discriminate
between cancer and normal)• Use series of microarrays• Compare results from different tis sues
6/38
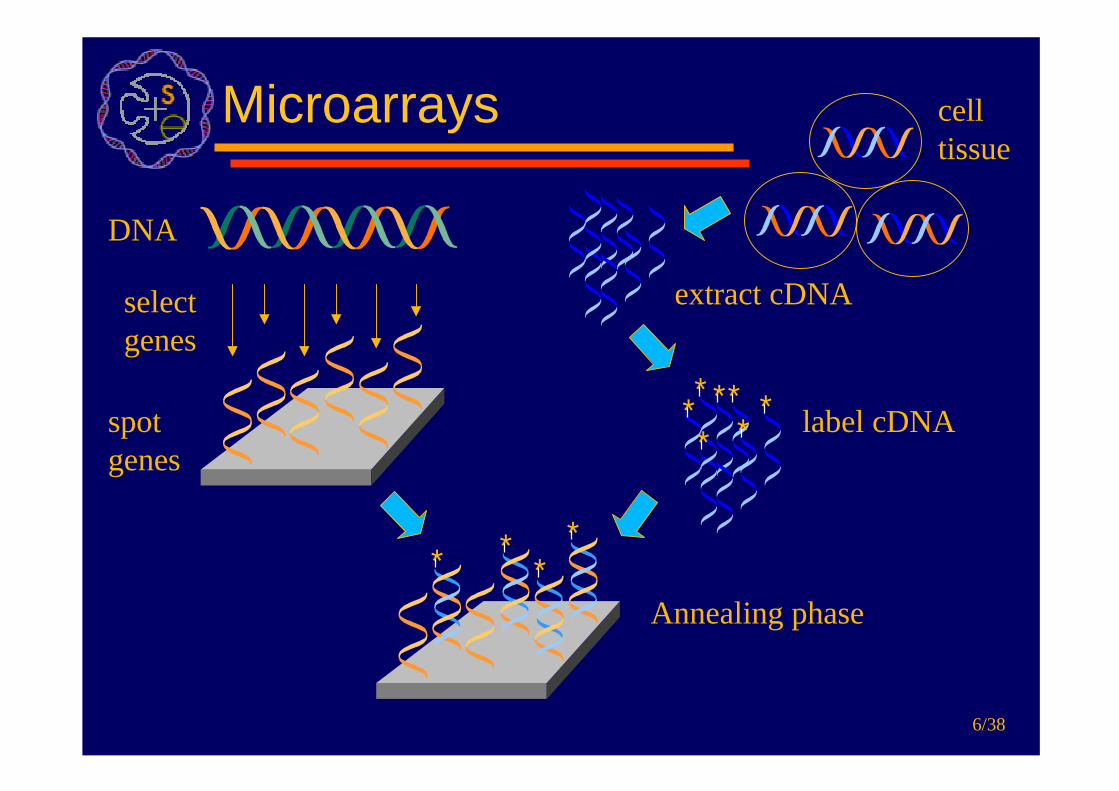
Microarrays
DNA
selectgenes
spotgenes
celltissue
extract cDNA
* * **** * label cDNA
* **
*
Annealing phase

7/38
Outline
• Motivating example example• Biological background• Problem statement• Current solution• Proposed attack• Results• Future work

8/38
F inding informative genes
• Microarrays from different tis sues
cancerous normal

9/38
Outline
• Motivating example example• Biological background• Problem statement• Current solution• Proposed attack• Results• Future work
10/38
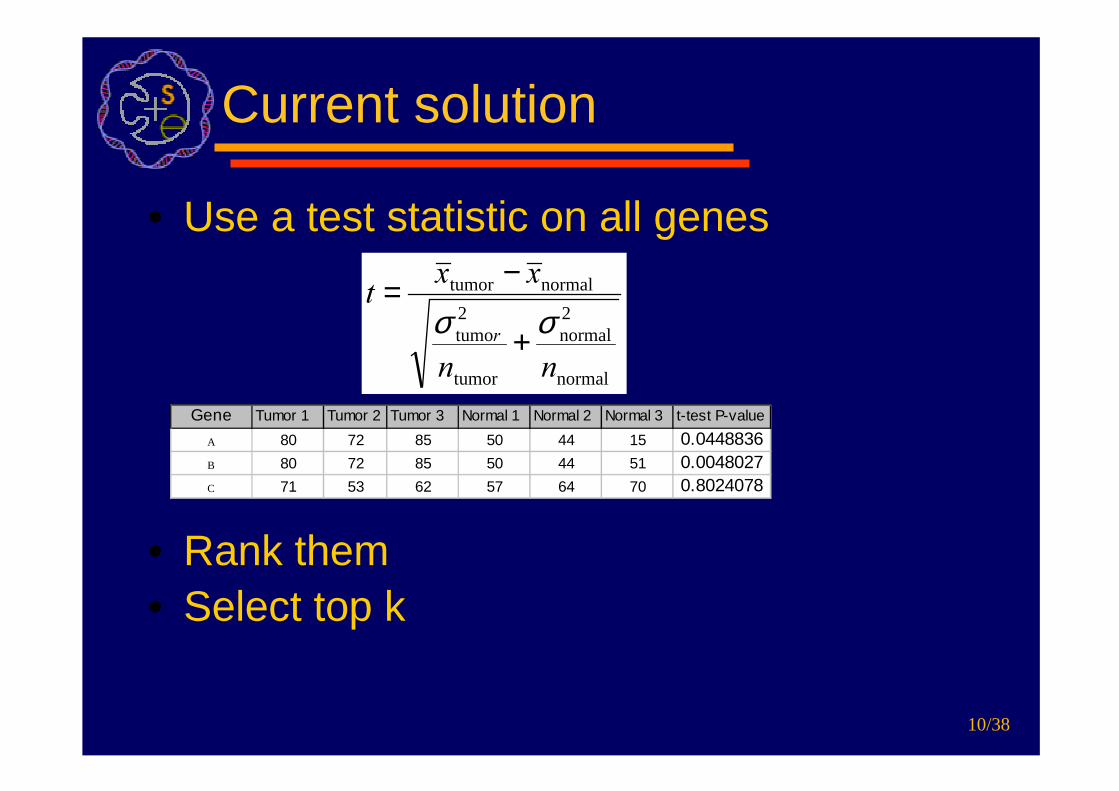
Current solution
• Use a test s tatis tic on all genes
• Rank them• S elect top k
Gene Tumor 1 Tumor 2 Tumor 3 Normal 1 Normal 2 Normal 3 t-test P-value
A 80 72 85 50 44 15 0.0448836B 80 72 85 50 44 51 0.0048027C 71 53 62 57 64 70 0.8024078
normal
2normal
tumor
2tumo
normaltumor
��
���
� σσ +
−=

11/38
Problem with current solution
• Each gene independently scored• T op k ranking genes might be very s imilar and
therefore no additional information gain• Reason: genes in s imilar pathways probably
all have very s imilar score• What happens if several pathways involved in
perturbation but one has main influence• Poss ible to describe this pathway with fewer
genes

12/38
Problem of redundancy
Accession Number Adenoma 1 Adenoma 2 Adenoma 3 Adenoma 4 Normal 1 Normal 2 Normal 3 Normal 4
t-test P-value
AF001548 54.55 43.93 55.69 28.47 1354.36 1565.42 1459.48 1612.85 0.00012
M12125 35.9 46.64 35.73 35.27 642.46 577.81 580.5 707.35 0.00028
X13839 46.16 47.72 26.79 17 652.66 653.14 546.12 720.43 0.0003
X15882 13.52 15.73 27.32 16.15 209.3 209.64 221.24 267.43 0.0004
AB002533 659.25 958.82 812.77 786.24 407.91 558.33 529.68 379.84 0.00557
M93651 40.1 54.77 39.93 40.37 8.74 21.07 14.45 32.94 0.01038
AF001548 M12125 X13839 X15882 AB002533 M93651
AF001548 1
M12125 0.99 1
X13839 0.991 0.996 1
X15882 0.992 0.995 0.988 1
AB002533 -0.87 -0.898 -0.891 -0.888 1
M93651 -0.8 -0.802 -0.789 -0.776 0.808 1
Top 3 genes highly correlated!
13/38
Outline
• Motivating example example• Biological background• Problem statement• Current solution• Proposed attack• Results• Future work
14/38
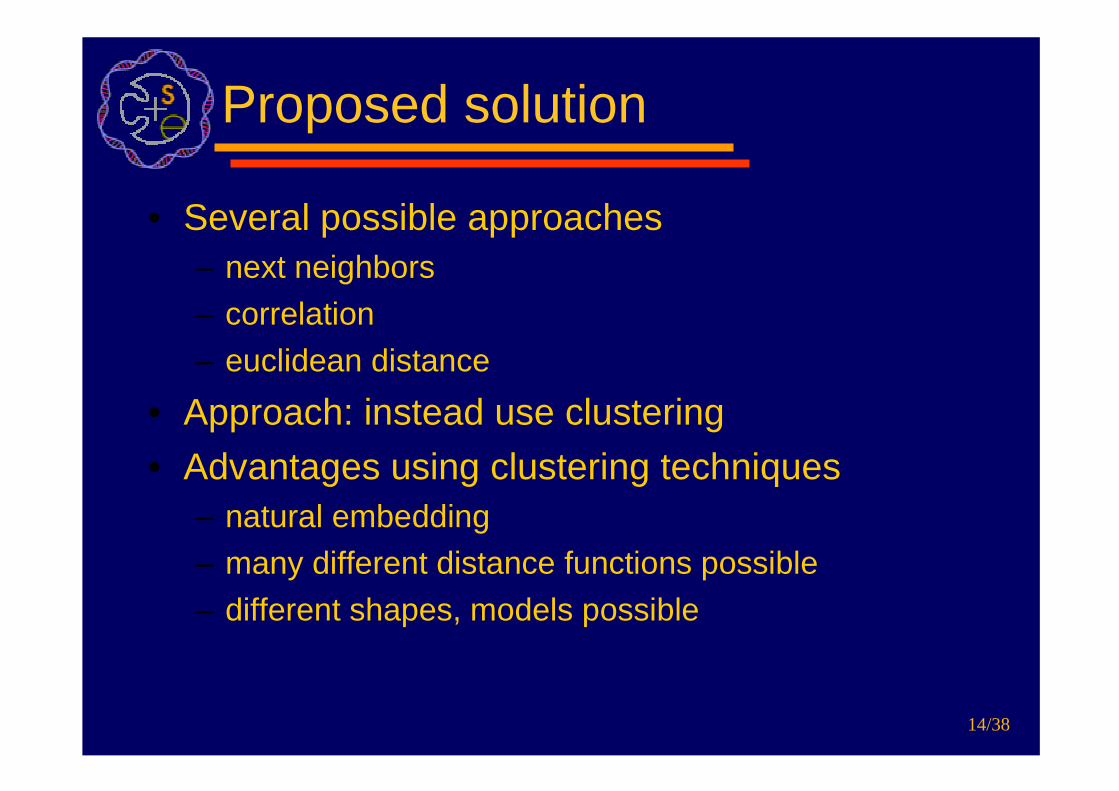
Proposed solution
• S everal poss ible approaches– next neighbors– correlation– euclidean dis tance
• Approach: instead use clustering• Advantages us ing clustering techniques
– natural embedding– many different dis tance functions poss ible– different shapes, models poss ible
15/38
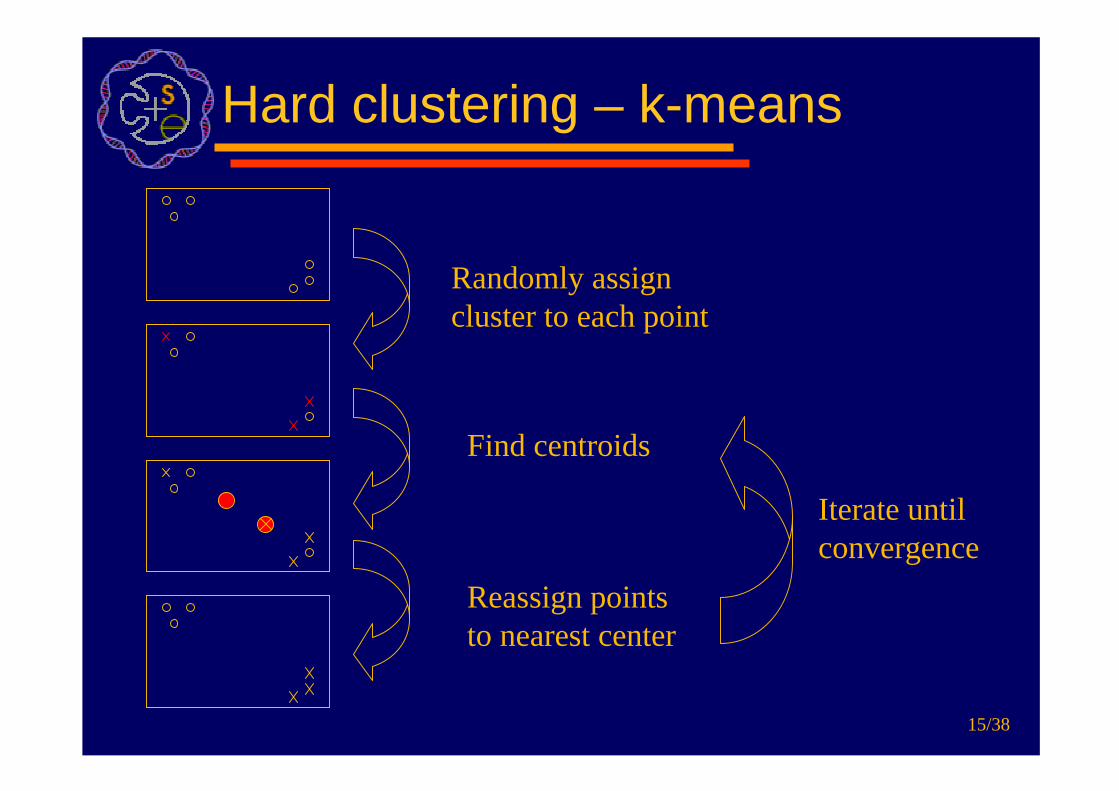
Hard clustering – k-means
Randomly assigncluster to each point
Reassign pointsto nearest center
Iterate untilconvergence
Find centroids

16/38
S oft - Fuzzy Clustering
instead of hard assignment,probability for each cluster
Very similar to k-means but fuzzy softness factorm (between 1 and infinity) determines how hardthe assignment has to be

17/38
Fuzzy examples
Nottermans carcinoma dataset:
18 colon adenocarcinoma and 18 normal tissues
data from 7457 genes and ESTs
cluster all 36 tissues

18/38
Fuzzy softness 1.3

19/38
Fuzzy softness 1.25

20/38
Fuzzy softness 1.2

21/38
Fuzzy softness 1.15

22/38
Fuzzy softness 1.05

23/38
S electing genes from clusters
• T wo way filter: exclude redundant genes,select informative genes
• Get as many pathways as poss ible• Cons ider cluster s ize and quality as well as
discriminative power

24/38
How many genes per cluster?
• Constraints :– minimum one gene per cluster
– maximum as many as poss ible
• T ake genes proportionally to cluster quality and s ize ofcluster
• T ake more genes from bad clusters
• S maller quality value indicates tighter cluster
• Quality for k-means: sum of intra cluster dis tance
• Quality for fuzzy c-means: avg cluster membershipprobability

25/38
Which genes to pick?
• Choices:– Genes closest to center– Genes farthest away– S ample according to probability function– Genes with best discriminative power

26/38
Comparison Evaluation
extract features
microarray data: n exampleswith m expression levels each
classify held-outsample
Repeat for each ofthe n examples:leave out one sample
test data train data
train learner
apply samefeatureextraction toleft out sample

27/38
S upport Vector machines
• F ind separating hyperplane with maximal dis tance to closesttraining example
• Advantages:– avoids overfitting– can handle higher order interactions and noise us ing kernel functions
and soft margin

28/38
Outline
• Motivating example example• Biological background• Problem statement• Current solution• Proposed attack• Results• Future work
29/38
Experimental setup
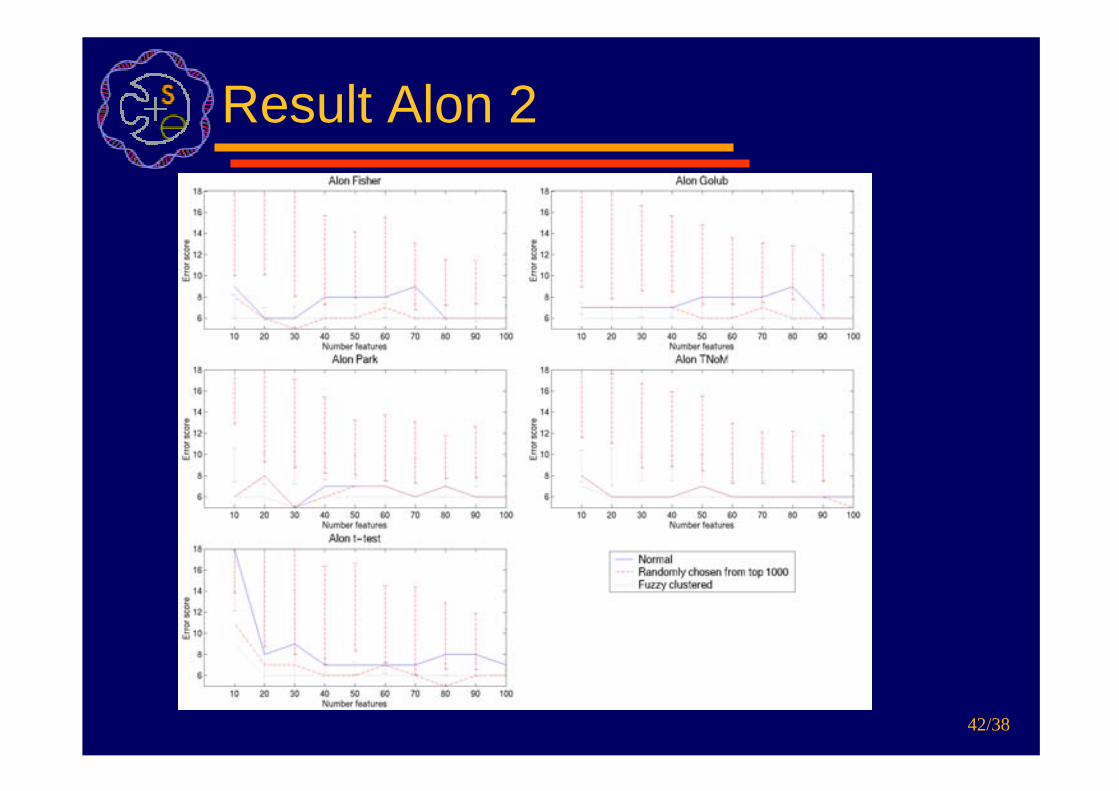
• Datasets :– Alons Colon (40 tumor and 22 normal colon
adenocarcinoma tis sue samples)– Golubs Leukemia (47 ALL, 25 AML)– Nottermans Carcinoma and Adenoma (18
adenocarcinoma, 4 adenomas and paired normaltis sue)
• Experimental setup:– calculate LOOCV us ing S VM on feature subsets– do this for feature s ize 10-100 (in s teps of 10) and
1-30 clusters

30/38
Results
31/38
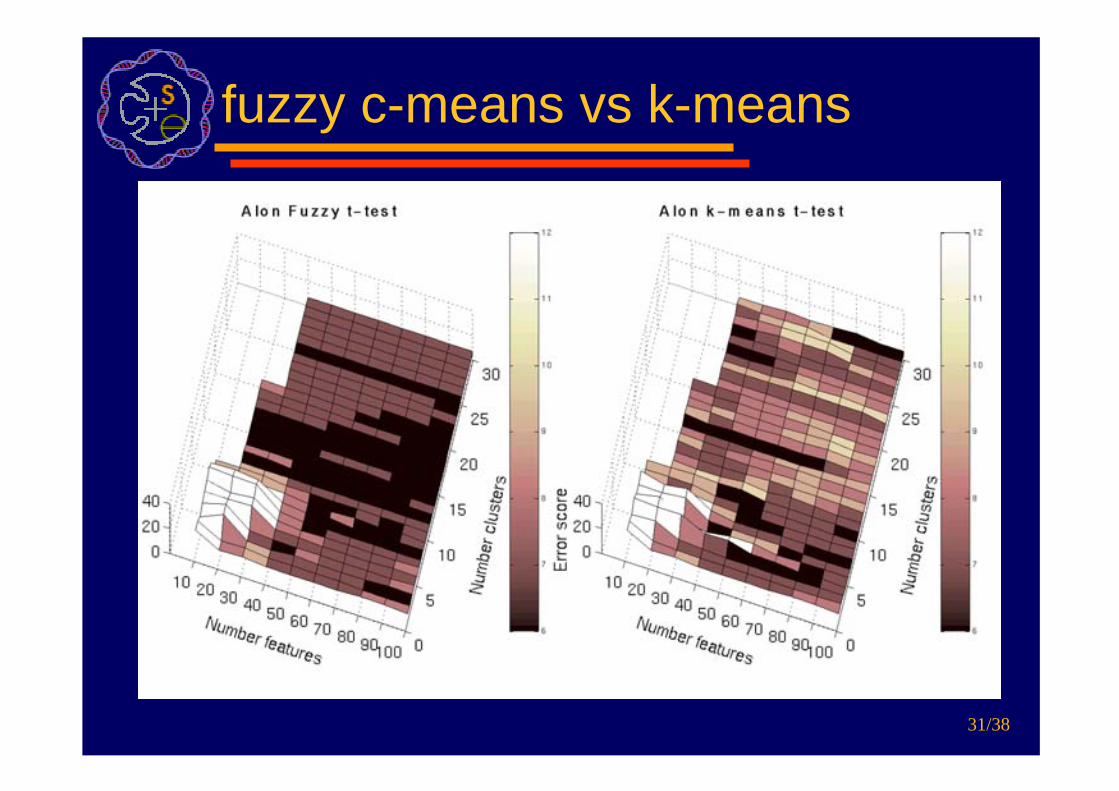
fuzzy c-means vs k-means

32/38
Different test-s tatis tics

33/38
Comparing best results

34/38
How about randomly choos ing?

35/38
Related work
• T usher, T ibshirani and Chu (2001): S ignificance analys is of microarraysapplied to the ionizing radiation response, PNAS 2001 98: 5116-5121
• Ben-Dor, A., L. Bruhn, N. F riedman, I. Nachman, M. S chummer, and Z .Yakhini (2000). T issue class ification with gene express ion profiles . InProceeding of the fourth annual international conference on computationalmolecular biology, pp. 54-64
• Park, P.J., Pagano, M., Bonetti, M.: A nonparametric scoring algorithm foridentifying informative genes from microarray data. Pac S ymp Biocomput:52-63, 2001.
• Golub T R, S lonim DK, T amayo P, Huard C, Gaasenbeek M, Mes irov JP,Coller H, Loh M, Downing JR, Caligiuri MA, Bloomfield CD, and Lander 18ES . Molecular class ification of cancer: class discovery and class predictionby gene express ion monitoring. S cience 286: 531-537, 1999.
• J. Weston, S . Mukherjee, O. Chapelle, M. Pontil, T . Poggio, and V. Vapnik.Feature selection for S VMs . In S ara A S olla, T odd K Leen, and Klaus-Robert Muller, editors , Advances in Neural Information Process ing S ystems13. MIT Press , 2001. 11
36/38
Outline
• Motivating example example• Biological background• Problem statement• Current solution• Proposed attack• Results• Future work
37/38
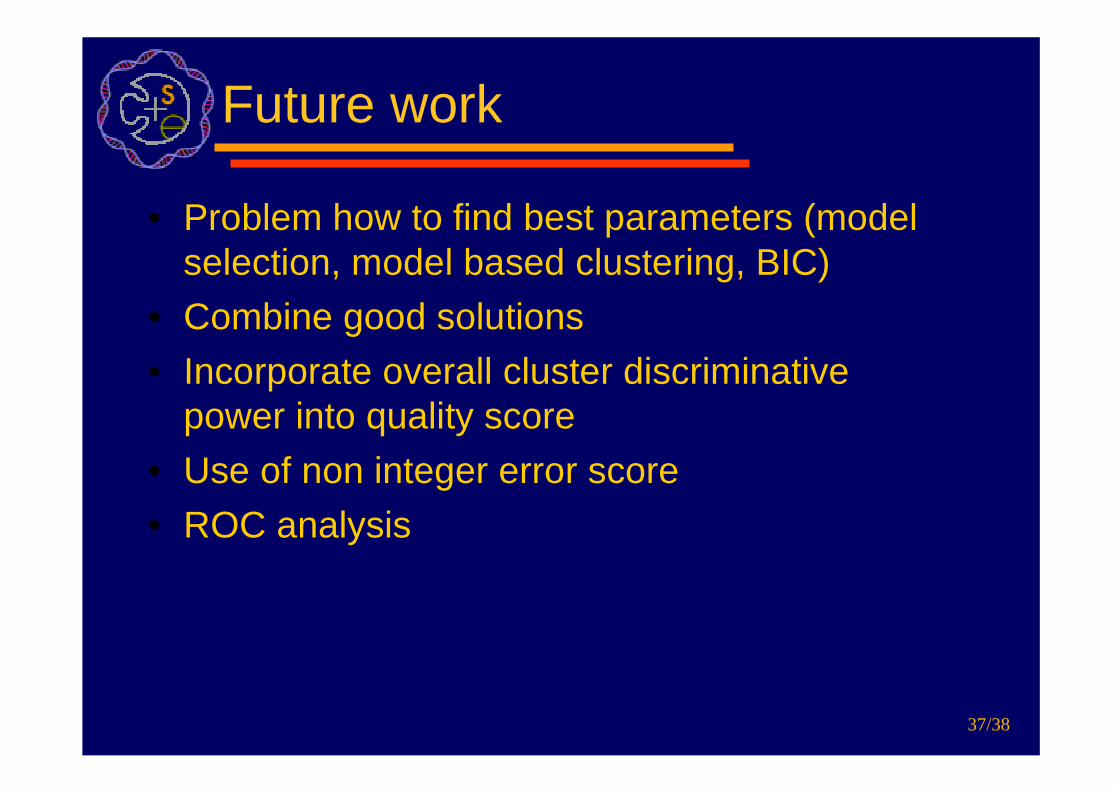
Future work
• Problem how to find best parameters (modelselection, model based clustering, BIC)
• Combine good solutions• Incorporate overall cluster discriminative
power into quality score• Use of non integer error score• ROC analys is

38/38
S ummary
• Used clustering as a pre-filter for featureselection in order to get rid of redundant data
• Defined a quality measurement for clusteringtechniques
• Incorporated cluster quality, s ize and s tatis ticalproperty into feature selection
• Improved LOOCV error for almost all features izes and different related tests

39/38
Result Notterman

40/38
Result Golub

41/38
Result Alon
42/38
Result Alon 2