Embed Size (px)
Citation preview

Donia, Noha, et al.
Vol. 41, No.3, March 2018 77
IMPROVE THE OPERATING PERFORMANCE OF SEA
WATER SYSTEM IN MED/TCD UNIT IN EGYPT
USINGSIX SIGMA METHOD
[5]
Donia, Noha, S.(1)
; Nagla, T. F.(2)
and Kaka, A. A.(2)
1) Institute of Environmental Studies and Research, Ain Shams University
2) Nuclear Power Plants Authority
ABSTRACT
The purpose of this paper is to establish a maintenance program for the
sea water System as a critical part from Desalination Unit type (MED/TCD),
to satisfy all requirements needed as the main supplier for most of the systems
in the desalination unit, improve the performance of desalination unit, and
increase the life time of its components.
The methodology/approach – by applying the scientific method (four step
method) plus the PDCA cycle, it means we apply the Six Sigma philosophy.
To improve the performance of the multi effects Desalination unit and
increase the operational lifetime, we will work on one of the critical system in
the MED/TCD unit (Sea Water System SWS) establishing maintenance
program using the Six Sigma philosophy, define, measure, analyze, improve,
and control (DMAIC) method for problem-solving methodology in
MED/TCD Unit, to increase the Reliability and Availability of the MED/TCD
Unit and increase the unit lifetime.
Keywords: Six Sigma, Multi Effect Desalination, Sea Water System,
Reliability Centered Maintenance, Plan-Do-Check-Act Cycle, Reliability,
Availability.
Abbreviations:-
SWS Sea Water System.
PDCA plan – Do – Check – Act Cycle.
MED Multi Effect Desalination.
MED/TCD Multi Effect Desalination/ Thermo-compression Desalination.
DMAIC Define – Measure – Analysis – Improve – Control Cycle.
RCM Reliability Centered Maintenance.
PMP Preventive Maintenance Program.

J. Environ. Sci.
Institute of Environmental Studies and Research – Ain Shams University
Vol. 41, No.3, March 2018 78
IMS Integrated Management System.
DPMO Defects Per Million Opportunity.
DOE Design Of Experiment .
DFSS Design For Six Sigma.
PHE Plate Heat Exchanger.
SIPOC Supplier, Inputs, Process, Outputs, and Customers .
CTQ Critical To Quality.
ANOVA Analysis Of Varience.
DPU Defects Per Unit.
RCMP Reliability Centered Maintenance Program.
INTRODUCTION
Using six sigma method means applying the four-step method, Observe,
Hypothesis, Data collection and Conclusion plus the PDCA cycle, Plan, Do,
Check, Act methods to enhance the Maintenance program that matches with
the Six Sigma methodology, so we will use the Reliability Centered
Maintenance (RCM) instead of the Preventive Maintenance Program (PMP).
The Integrated Management System (IMS) approach instead of the Quality
Management System and also the Leadership Principle shall apply. Six
Sigma is a project-based, customer-focused, and data-driven approach
[Coronado, R.B. and Antony, J. (2002) and Black, K. and Revere, L. (2006)]
that makes use of a structured and systematic methodology, which relies on
the define, measure, analyze, improve, control (DMAIC) roadmap for
continuous improvement, to enhance the capability of business processes
[Goldstein, M. (2001), Senapati, N.R. (2004)]. To be effectively
implemented, this problem-solving methodology requires full management
belief and commitment, a well-trained and experienced technical project
leadership to act as a change- agent, and a dedicated and competent

Donia, Noha, et al.
Vol. 41, No.3, March 2018 79
multifunctional project team [Coronado, R.B. and Antony, J. (2002), Robert
G. Launsby, Mark J. Kiemele Stephen R].The aim of this paper is establish a
maintenance program for the one of the critical system in the MED/TCD
desalination plants (Sea Water System) to achieves the six sigma strategy,
this maintenance program named Reliability Centered Maintenance (RCM).
The Importance of this system is to adjust and control the Sea Water
Parameters like the sea water pressure, temperature, flowrate, and impurities
for feeding the other systems like the chemical dosing system, brine rejection
system, distillate water system, and evaporation system. The project was
identified and selected to enhance the current Performance, the Availability,
and the Reliability of the desalination unit to increase the lifetime of the other
systems and components. This paper is divided into seven sections. In Section
2, an overview of six sigma is given. The status and behavior of the Sea
Water System before applying the six-sigma methodology will have provided
in Section 3. Establishing Integrated Quality Assurance Program for the
maintenance of the Sea Water Systems is presented and described throughout
Section 4, the Analyze phase of six sigma will have provided in section 5, the
Improvements and Control phase will have provided in section 6, as well as
the discussion of its results and practical implications. Finally, the
conclusions are summarized in Section 7.

J. Environ. Sci.
Institute of Environmental Studies and Research – Ain Shams University
Vol. 41, No.3, March 2018 80
METHODOLOGY
Six Sigma has been applied to many companies that have a productivity
with great success and has been subsequently transformed into the strategic
management system of these companies Six Sigma was developed at
Motorola/USA in 1987 by Bill Smith (Arnheiter and Maleyeff, 2005) and was
enhanced by GE after 1995 (Slater, 1999). It was intended to reduce
variability and waste in operational processes that were based primarily on
statistical process control and total quality control/TQM [Issa Bass Barbara
Lawton, Ph.D] Six Sigma is a methodology that can be defined both in
statistical and business terms. In statistical terms, Six Sigma refers to 3.4
defects per million opportunities (DPMO) in a given production process.
Sigma (σ) is used to represent the variation (standard deviation) of a process
mean. In business terms, Six Sigma is a strategy used to improve business
profitability by eliminating waste, reducing costs from poor quality
management and improving the effectiveness and efficiency of all operations
to meet or exceed customers’ requirements and expectations [Kai Yang,
(2005)]. There have evolved two key methods for carrying out Six Sigma.
The first method is the most well-defined and works best if you have a
problem with an unknown solution in existing products, processes or services.
This method is called DMAIC phases. Each of these processes (phases) can
be realized with different tools and techniques while some tools can be used
in more than one processes (phases). One possible use of technique in the Six
Sigma methodology for an improvement process is design of experiments
(DOE).The newest method, which is in the developing stages, is called

Donia, Noha, et al.
Vol. 41, No.3, March 2018 81
Design for Six Sigma or DFSS. The goal of DFSS is to develop a new
product, process or service that is defect-free in the eyes of the customer. The
main steps for developing the six sigma projects are the following:
Identification of Six Sigma projects;
Selection of Six Sigma projects;
Six Sigma project planning;
Six Sigma project execution and completion; and
Post Six Sigma project, where lessons learned are determined, recorded,
and archived.
Status and behavior of the sea water system before applying the six
sigma strategy:
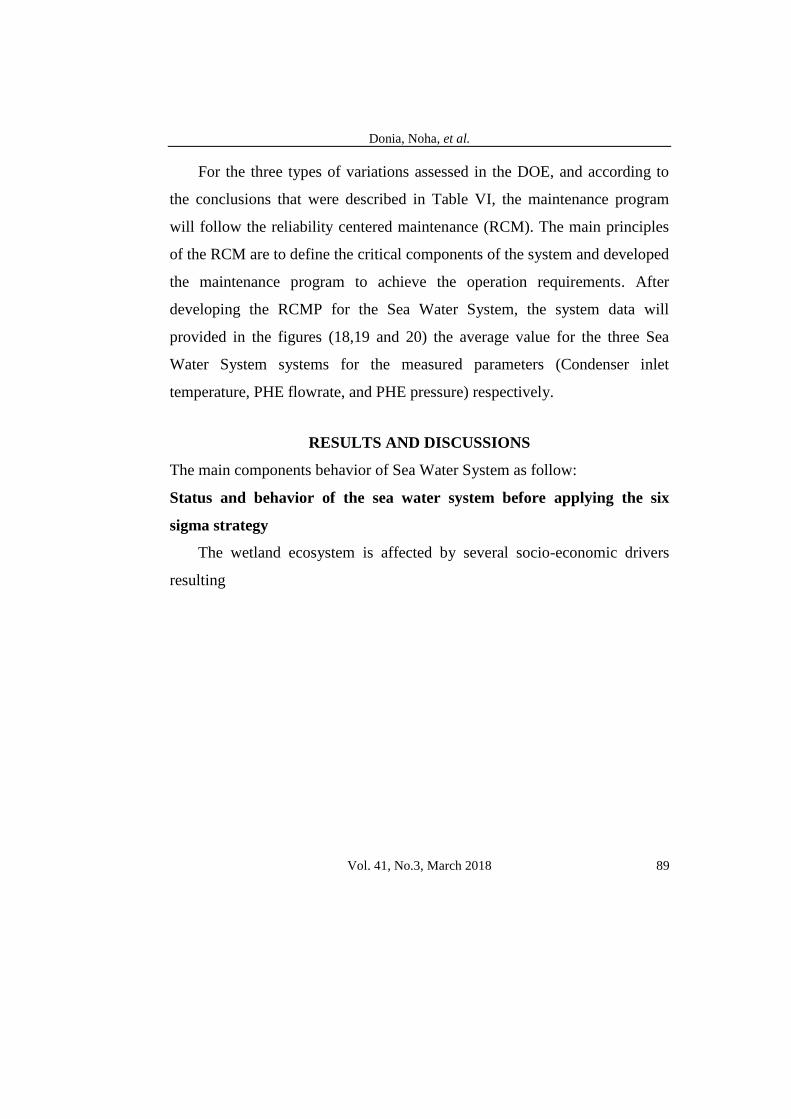
The behavior of the Sea Water System will be provided in fig (1), fig (2),
fig (3), fig (4), fig (5) and fig (6) for the Sea Water (The main Components of
MED/TCD Desalination Unit including the SWS. Pump flowrate,
temperature, PHE Inlet pressure, PHE Outlet pressure and Water
Conductivity) respectively. The Sea Water System composed of four parts as
follows:
Brine Plate Heat Exchangers (PHE) system. The temperature of brine
water that rejected from the evaporation system shall be cooled before
entering again to the system or rejected to the Sea. For cooling the brine
water, we use sea water.
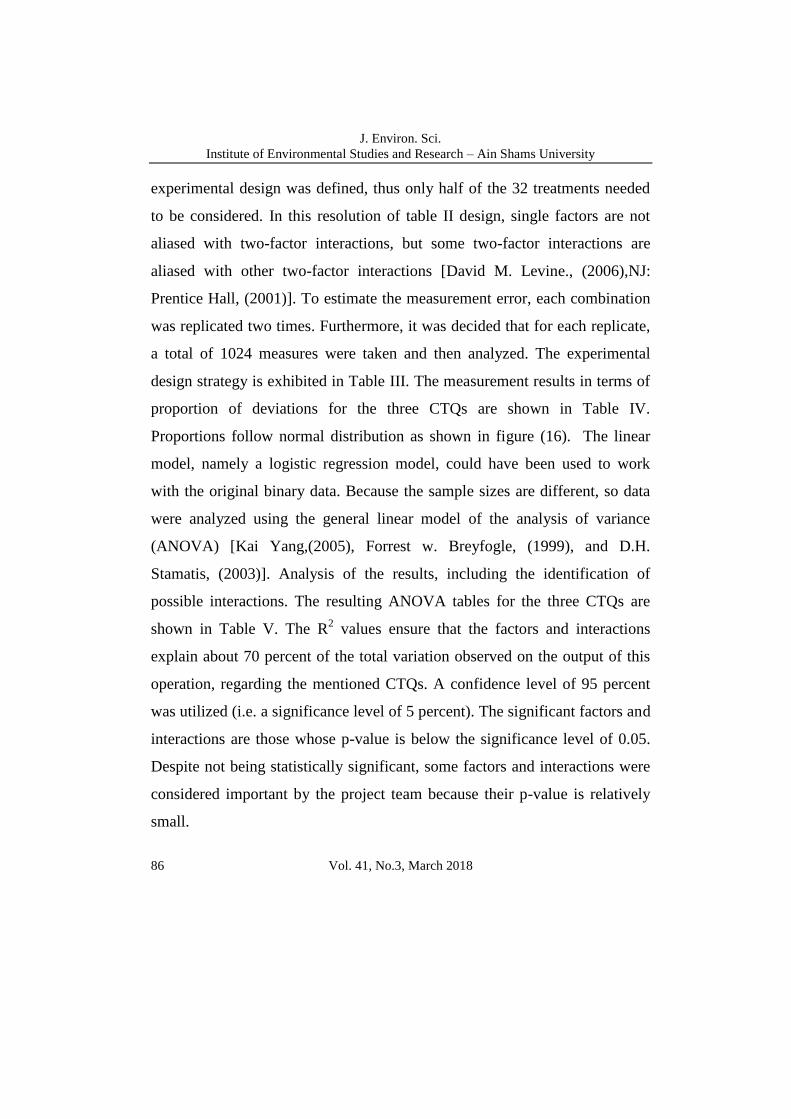
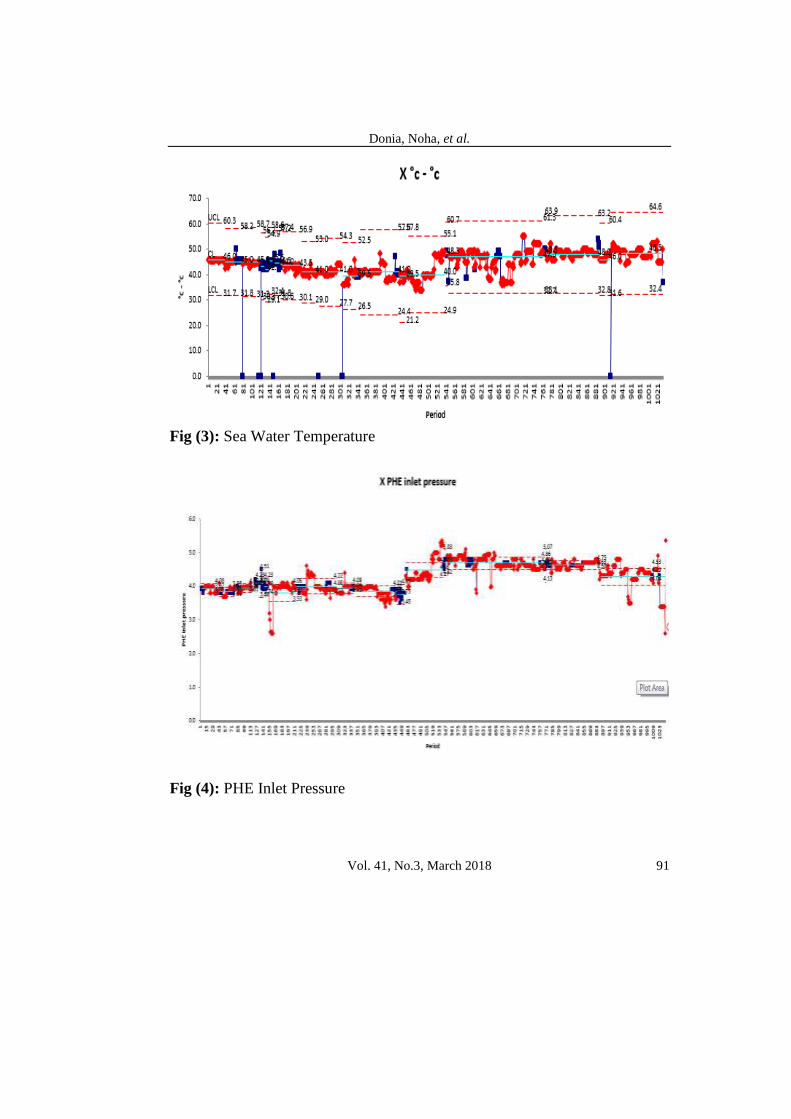
Distillate Plate Heat Exchangers (PHE) system. The temperature of
distillate water that produces from the evaporation system shall be cooled
before storage. For cooling the distillate water, we use the sea water. The
data of the PHE and sea water during the operation is provided in fig (4),

J. Environ. Sci.
Institute of Environmental Studies and Research – Ain Shams University
Vol. 41, No.3, March 2018 82
fig (5), and fig (6) for the PHE (inlet pressure, outlet pressure, and Sea
Water Conductivity) respectively; and
Condensation system for cooling the distillation water before entering the
PHE system, to raise the pressure it is pumped and stored as a final
product. the data of the condensation system during the operation is
provided at fig (7), and fig (11) for condenser (inlet temperature, and
Condenser vapor temperature) respectively.
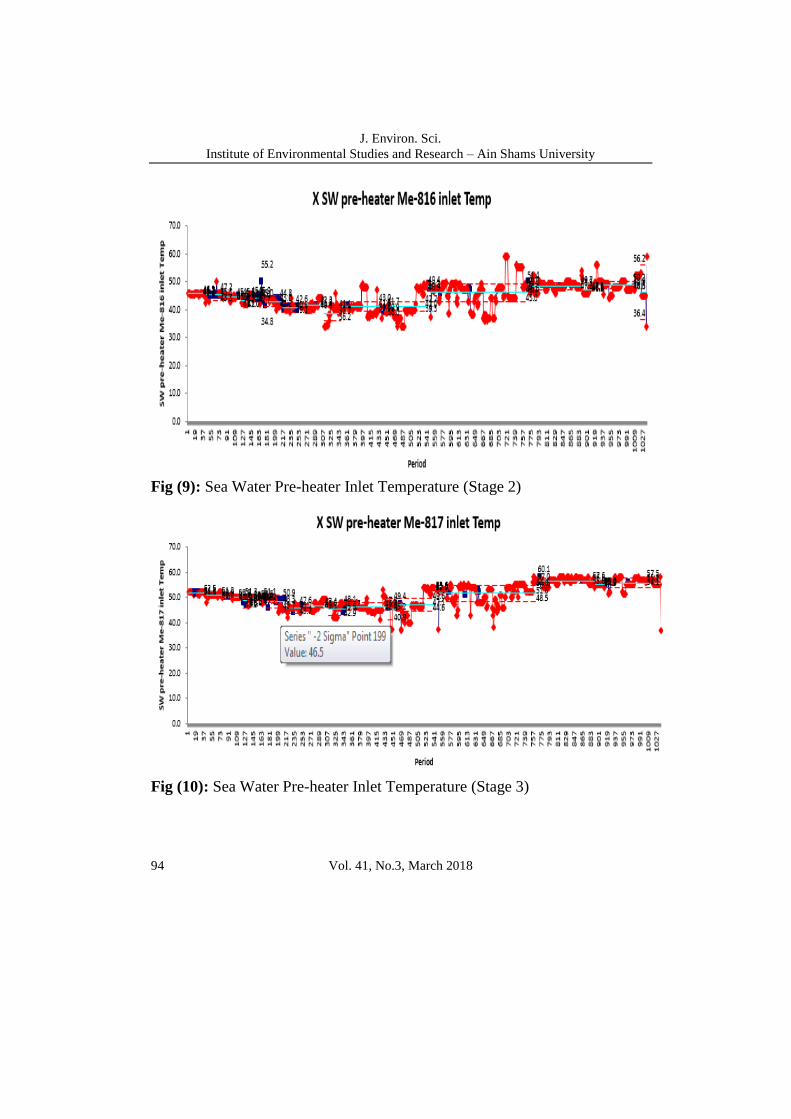
Pre-heater system. This system used to increase entering sea water
temperature, if needed especially in the winter season, before entering to
the evaporator system. The data of the pre-heater system will be provided
in figure (8), fig (9), and fig (10) for the Sea Water Pre-heater Inlet
Temperature for the three stages of preheating respectively. The Pareto
charts for these systems is provided in fig (12), fig (13), and fig (14) for
(Brine PHE, Distillate PHE, and condensation) systems respectively.
Integrated quality assurance program for SWS maintenance:
Project planning: The Planning phase is the first stage that takes place
before the DMAIC roadmap is initiated. It intends to reach understanding the
problem in chemical dosing systems, and ends with the project planning
tasks. For the chemical dosing Systems, it composed of the tow components
(Tank for storage the chemicals, and pump for pumping the Sea water with
mixing the chemical before entering to the evaporator systems. The Operating
data tell us the variations of each component of the system.

Donia, Noha, et al.
Vol. 41, No.3, March 2018 83
Definition phase: The initial efforts of this phase targeted a deep
understanding of the system operation and maintenance. Process mapping
tasks using a supplier, inputs, process, outputs, customers (SIPOC) diagram,
depicted in table 1, were carried out. then gathered and analyzed data from
the operation and maitainence process, by inspecting the components of each
system for the Chemical dosing system in the MED/TCD PLANT. At the
same time, an affinity diagram was constructed to group similar types of
defects into a same class/category of defect. The last activity of this DMAIC
phase was the setting of critical to quality (CTQ) characteristics and of their
operational definitions, which in this case is a clear, unambiguous, and
observable standard of acceptance. For each group of defects, a document
with a similar structure to the one exhibited in Figure 4 was developed to
characterize each CTQ and to establish its correspondent operational
definition.
Measurements phase: Operation results were recorded to assess the baseline
performance of the chemical dosing system in the operation. In these records,
all key controllable input variables remained constant, at the levels usually
used in the normal operation at full load (100% of load). The measures were
taken during 9 months every 2 hours. A total of 1024 measured data were
recorded, and 860 of them were far away from the average measured in
figures 8,9, and 10 for anti-foam system, figures 2,3 and 4 for anti-scale
system, and figures 5,6 and 7 for de-chlorination system; thus, the resulting
proportion of deviation from the average was around 83.9 percent, which is a
very high value. After categorization the variations from normal operations as

J. Environ. Sci.
Institute of Environmental Studies and Research – Ain Shams University
Vol. 41, No.3, March 2018 84
a percentage values, now we can calculate the Defect Per Million Opportunity
(DPMO) by the following equation:
DPMO= = = 108,508
Where, D: is the total number of measurements that deviated from the
normal values; P: the total number of measurements for the Sea Water
Systems; and O: the considered number of opportunities for deviation of the
measures.
The number of opportunities for measures variation comprises the six
categories of variations from sigma table the DPMO, the corresponding
Sigma level (Z) value is approximately 1.61 equivalent to 2.73 (σ) sigma
level.
Analysis phase: The first activity of this phase was the development of an
interrelationship digraph, illustrated in Figure (15), to study and understand
the chain of causes-and-effects that will ultimately create the different types
of defects in the Sea Water System operation.
Determination of the significant factors that contribute to the most
relevant types of deviations from normal operation of the Sea Water System.
A critical observation of the output variables using (DOE) should thus allow
the team to isolate the factors that influence the variability of the normal
operation of the dosing system. To carry out the DOE in the analyze phase,
the following sequence was adopted:
selection of the response variables;
choice of the controllable factors (input variables);
preparation of the DOE;

Donia, Noha, et al.
Vol. 41, No.3, March 2018 85
conduction of the DOE;
analysis of the results; and
identification of possible interactions.
Selection of the response variables. A DOE strategy was developed in
order to investigate which controllable input factors of the Sea Water System
have a significant effect on the CTQ characteristics of the Sea Water system
operation. Three specific CTQs were considered:
preheater malfunction (CTQ1);
temperature sensing (CTQ2); and
PHE pump pressure (CTQ3).
The variables inherent to these three CTQs are not continuous. Choice of
the controllable factors. Using the information from the interrelationship
diagram, the audit of the production process was held to identify which
factors could have an effect on the CTQs (output variables). the following
five controllable input factors:
Malfunction of measured temp;
Failure of the sensing level;
Operator of the desalination unit have a lack of training;
Not maintained equipment; and
Not calibrated devices.
To investigate their individual and combined influence on the CTQs, two
distinct levels were defined for each process, as shown in Table II.
Preparation of the DOE. To avoid running all the 32 possible combinations
among the levels of the five factors, corresponding to a 25-full factorial, a
two-level fractional factorial strategy was designed. In particular, a 25−1
J. Environ. Sci.
Institute of Environmental Studies and Research – Ain Shams University
Vol. 41, No.3, March 2018 86
experimental design was defined, thus only half of the 32 treatments needed
to be considered. In this resolution of table II design, single factors are not
aliased with two-factor interactions, but some two-factor interactions are
aliased with other two-factor interactions [David M. Levine., (2006),NJ:
Prentice Hall, (2001)]. To estimate the measurement error, each combination
was replicated two times. Furthermore, it was decided that for each replicate,
a total of 1024 measures were taken and then analyzed. The experimental
design strategy is exhibited in Table III. The measurement results in terms of
proportion of deviations for the three CTQs are shown in Table IV.
Proportions follow normal distribution as shown in figure (16). The linear
model, namely a logistic regression model, could have been used to work
with the original binary data. Because the sample sizes are different, so data
were analyzed using the general linear model of the analysis of variance
(ANOVA) [Kai Yang,(2005), Forrest w. Breyfogle, (1999), and D.H.
Stamatis, (2003)]. Analysis of the results, including the identification of
possible interactions. The resulting ANOVA tables for the three CTQs are
shown in Table V. The R2 values ensure that the factors and interactions
explain about 70 percent of the total variation observed on the output of this
operation, regarding the mentioned CTQs. A confidence level of 95 percent
was utilized (i.e. a significance level of 5 percent). The significant factors and
interactions are those whose p-value is below the significance level of 0.05.
Despite not being statistically significant, some factors and interactions were
considered important by the project team because their p-value is relatively
small.

Donia, Noha, et al.
Vol. 41, No.3, March 2018 87
Coefficient of determination R2: The coefficient of determination in a
DOE measures proportion in the total variation that is due to the model. It is
therefore the ratio of the sum of squares of the model to the total sum of
squares. The R2 values ensure that the factors and interactions explain about
57 percent of the total variation observed on the output of this operation,
regarding the mentioned CTQs. A confidence level of 95 percent was utilized
(i.e. a significance level of 5 percent). The significant factors and interactions
are those whose p-value is above the significance level of 0.05. Despite not
being statistically significant, some factors and interactions were considered
important. Experimental data from the DOE enabled us to compute a set of
important metrics. Table VI summarizes the values for the rate of variations
of the parameters due to operation, the average number of variations per
operation (defects per unit (DPU)), and the Sigma Level.
Determination of the root causes for the occurrence of the abnormalities
in the Sea Water system operation. In addition to equipment maintenance,
devices calibration, feeding channels, maintenance procedures, and sensing
levels, when Monitoring occurs during the unit operation, many of them had
structural abnormalities, such as failures. Structural abnormalities tend to
appear when the unit work for long time from the scheduled maintenance
after of the unit maintenance.
To investigate the influence of maintenance and calibration in the
performance, and quality of the Sea Water System unit operation, some
samples of measuring data containing structural abnormalities were taken for
analysis. The results of the data measured found that some abnormalities in
the Sea Water System output when the Critical components to quality not

J. Environ. Sci.
Institute of Environmental Studies and Research – Ain Shams University
Vol. 41, No.3, March 2018 88
maintained like (the PHE pump, PHE sensors, pipes cleaning from solid
waste). After some auditing we discovered that wrong procedures for the
maintenance of the Sea Water System was carried out.
Improve & control phase: After having determined the root causes for the
high variations rate of the parameters for the Sea Water System in the
Measure phase of the DMAIC approach, the development procedure of
improvement actions to be implemented for the Sea Water System. A set of
procedures established, including the operator's procedures, was undertaken.
Many ideas of improvement actions were collected, combined, analyzed, and
the most promising ones considered. The final version of the improvement
plan contained a set of actions that were grouped around the four areas
indicated in Figure (17). In this figure, the area of action 1 – Establishing
Reliability Centered Maintenance Program (RCMP). The main effect on the
operation of the Sea Water System is the lake of a maintenance program that
determine the critical components in the system and establish the
maintenance program for this systems to enhance the operation parameters.
From the analyzed data in the previous section we found that the critical
components in the system are the following:
BHE pumps,
main control valve,
BHE Sensors for measuring water and steam temperature, and
main pipes connected between the seawater and the chemical dosing
system.
Donia, Noha, et al.
Vol. 41, No.3, March 2018 89
For the three types of variations assessed in the DOE, and according to
the conclusions that were described in Table VI, the maintenance program
will follow the reliability centered maintenance (RCM). The main principles
of the RCM are to define the critical components of the system and developed
the maintenance program to achieve the operation requirements. After
developing the RCMP for the Sea Water System, the system data will
provided in the figures (18,19 and 20) the average value for the three Sea
Water System systems for the measured parameters (Condenser inlet
temperature, PHE flowrate, and PHE pressure) respectively.
RESULTS AND DISCUSSIONS
The main components behavior of Sea Water System as follow:
Status and behavior of the sea water system before applying the six
sigma strategy
The wetland ecosystem is affected by several socio-economic drivers
resulting

J. Environ. Sci.
Institute of Environmental Studies and Research – Ain Shams University
Vol. 41, No.3, March 2018 90
Fig.(1): MED/TCD Desalination Plant Components
Fig (2): Sea Water Flowrate
Donia, Noha, et al.
Vol. 41, No.3, March 2018 91
Fig (3): Sea Water Temperature
Fig (4): PHE Inlet Pressure

J. Environ. Sci.
Institute of Environmental Studies and Research – Ain Shams University
Vol. 41, No.3, March 2018 92
For PHE system, the following distribution for the inlet pressure, outlet
pressure, and Sea Water Conductivity.
Fig (5): PHE Outlet Pressure
Fig (6): Sea Water Conductivity

Donia, Noha, et al.
Vol. 41, No.3, March 2018 93
Fig (7): Condenser Inlet Temperature
The following distribution for the Pre-heater inlet temperature for the
three stages, pressure, and the tank level of the Anti-foam
Fig (8): Sea Water Pre-heater Inlet Temperature (Stage 1)
J. Environ. Sci.
Institute of Environmental Studies and Research – Ain Shams University
Vol. 41, No.3, March 2018 94
Fig (9): Sea Water Pre-heater Inlet Temperature (Stage 2)
Fig (10): Sea Water Pre-heater Inlet Temperature (Stage 3)

Donia, Noha, et al.
Vol. 41, No.3, March 2018 95
The following distribution for the temperature of vapor at the final stage
and transfers to condenser.
Fig (11): Cell 6 to condenser Vapor Temperature
As shown from the figures, the variations of the measurement are very
high and Sea Water systems not matches with the six-sigma approach.
Developing Integrated Quality Assurance Program for the maintenance
of the Sea Water Systems (Brine Plate Heat Exchangers (PHE) system,
Distillate Plate Heat Exchangers (PHE) system and Condensation
system):

J. Environ. Sci.
Institute of Environmental Studies and Research – Ain Shams University
Vol. 41, No.3, March 2018 96
Table (1): (SIPOC) diagram for the dosing system operation

Donia, Noha, et al.
Vol. 41, No.3, March 2018 97
Fig (12): Pareto chart for the Brine PHE system deviations

J. Environ. Sci.
Institute of Environmental Studies and Research – Ain Shams University
Vol. 41, No.3, March 2018 98
Fig.(13): Pareto chart for the Distillate PHE system deviations

Donia, Noha, et al.
Vol. 41, No.3, March 2018 99
Fig.(14): Pareto chart for the Condensation PHE system deviations

J. Environ. Sci.
Institute of Environmental Studies and Research – Ain Shams University
Vol. 41, No.3, March 2018 100
Analyze phase:
Table (2): Input controllable factors and their low and high levels
Controllable input factor Levels used High and
low levels
Malfunction of measuring
temp
10
20
- 1
+1
Failure of the sensing level 60%
80%
- 1
+1
Operator failure Interpret not in time
Interpret on time
- 1
+1
Maintenance failure Not on scheduled
On scheduled
- 1
+1
Calibration failure Not calibrated devices
Calibrated devices
- 1
+1
Table (3): Experimental design strategy of the screening DOE
Combination of the input factor levels
No. of
replicates
# of
measurements A B C D E F G H
2 1024 +1 +1 +1 +1 - 1 - 1 +1 - 1
2 1024 -1 +1 +1 - 1 - 1 - 1 +1 - 1
2 1024 +1 +1 +1 +1 +1 +1 +1 +1
2 1024 -1 - 1 - 1 - 1 +1 +1 - 1 +1
2 1024 +1 - 1 - 1 +1 - 1 - 1 - 1 - 1
2 1024 -1 - 1 - 1 - 1 - 1 - 1 - 1 - 1
2 1024 +1 +1 +1 +1 +1 +1 +1 +1
2 1024 -1 +1 +1 - 1 +1 +1 +1 +1
2 1024 +1 +1 +1 +1 - 1 - 1 +1 - 1
2 1024 -1 - 1 - 1 - 1 - 1 - 1 - 1 - 1
2 1024 +1 - 1 - 1 +1 +1 +1 - 1 +1
2 1024 -1 - 1 - 1 - 1 +1 +1 - 1 +1
2 1024 +1 +1 +1 +1 - 1 - 1 +1 - 1
2 1024 -1 +1 +1 - 1 - 1 - 1 +1 - 1
2 1024 +1 +1 +1 +1 +1 +1 +1 +1
2 1024 -1 - 1 - 1 - 1 +1 +1 - 1 +1

Donia, Noha, et al.
Vol. 41, No.3, March 2018 101
Fig.(15): Chain of causes- and- occurrences of Sea Water failures
Fig.(16): Proportions follow normal distribution
Establishing Reliability Centered Maintenance Program (RCMP)
Developing the Operation and Maintenance Procedures
Calibration of the measuring devices
On – the – Job Training

J. Environ. Sci.
Institute of Environmental Studies and Research – Ain Shams University
Vol. 41, No.3, March 2018 102
Table (4): The measurement results in terms of proportion of deviations for
the four CTQs
Combination of the input
factor levels
Proportions of
defectives for each
CTQ
Rep
lica
te
Ru
n o
rd
er
A B C D E F G H
Actu
al
sam
ple
siz
e
1
Preh
ea
ter
2
Tem
pera
ture
3
Press
ure
1 10 +1 +1 +1 +1 +1 -1 +1 -1 100 1 0.98 1
2 11 -1 +1 +1 -1 -1 -1 +1 -1 200 1 1 1
1 24 +1 +1 +1 +1 +1 +1 +1 +1 100 1 1 0.98
2 50 -1 -1 -1 -1 -1 +1 -1 +1 120 1 0.98 0.53
1 30 +1 -1 -1 +1 +1 -1 -1 -1 120 1 0.98 1
2 40 -1 -1 -1 -1 -1 -1 -1 -1 120 1 0.98 1
1 33 +1 +1 +1 +1 +1 +1 +1 +1 130 1 0.98 0.86
2 22 -1 +1 +1 -1 -1 +1 +1 +1 110 1 0.98 0.85
1 11 +1 +1 +1 +1 +1 -1 +1 -1 120 1 0.98 1
2 15 -1 -1 +1 -1 -1 -1 -1 -1 100 1 0.98 0.82
1 10 +1 -1 +1 +1 +1 +1 -1 +1 100 1 0.98 0.53
2 35 -1 -1 -1 -1 -1 +1 -1 +1 110 1 0.98 0.59
1 37 +1 +1 -1 +1 +1 -1 +1 -1 120 1 0.98 0.45
2 39 -1 +1 -1 -1 -1 -1 +1 -1 120 1 0.98 0.74
1 44 +1 +1 +1 +1 +1 +1 +1 +1 130 1 0.98 0.90
2 80 -1 -1 +1 -1 -1 +1 -1 +1 110 1 0.98 1
1 26 +1 +1 +1 +1 +1 -1 +1 -1 120 1 0.98 001

Donia, Noha, et al.
Vol. 41, No.3, March 2018 103
Table (4): The measurement results in terms of proportion of deviations for
the four CTQs
Combination of the input
factor levels
Proportions of defectives
for each CTQ
Rep
lica
te
Ru
n o
rd
er
A B C D E F G H
Actu
al
sam
ple
size
1
Preh
ea
ter
2
Tem
pera
ture
3
Press
ure
2 20 -1 +1 -1 -1 -1 -1 +1 -1 120 1 0.98 0.90
1 90 +1 +1 -1 +1 +1 +1 +1 -1 134 1 0.98 0.77
2 16 -1 +1 -1 -1 -1 +1 +1 +1 120 1 0.98 1
1 22 +1 +1 +1 +1 +1 -1 -1 +1 300 1 0.98 1
2 50 -1 +1 +1 -1 -1 -1 -1 -1 300 1 0.98 0.78
1 55 +1 -1 +1 +1 +1 +1 -1 -1 500 1 0.98 0.96
2 66 -1 -1 -1 -1 -1 +1 +1 +1 600 1 0.98 0.86
1 30 +1 -1 +1 +1 +1 -1 +1 +1 500 1 0.98 0.86
2 10 -1 +1 +1 -1 -1 -1 +1 -1 800 1 0.98 0.91
1 20 +1 +1 +1 +1 +1 +1 -1 -1 600 1 0.98 0.88
2 23 -1 +1 -1 -1 -1 +1 -1 +1 700 1 0.98 0.86
1 25 +1 -1 -1 +1 +1 -1 -1 +1 100 1 0.98 0.52
2 28 -1 -1 -1 -1 -1 -1 +1 -1 150 1 0.98 0.88
1 29 +1 -1 +1 +1 +1 +1 +1 -1 800 1 0.98 0.89
2 23 -1 +1 +1 -1 -1 +1 +1 +1 700 1 0.98 0.85

J. Environ. Sci.
Institute of Environmental Studies and Research – Ain Shams University
Vol. 41, No.3, March 2018 104
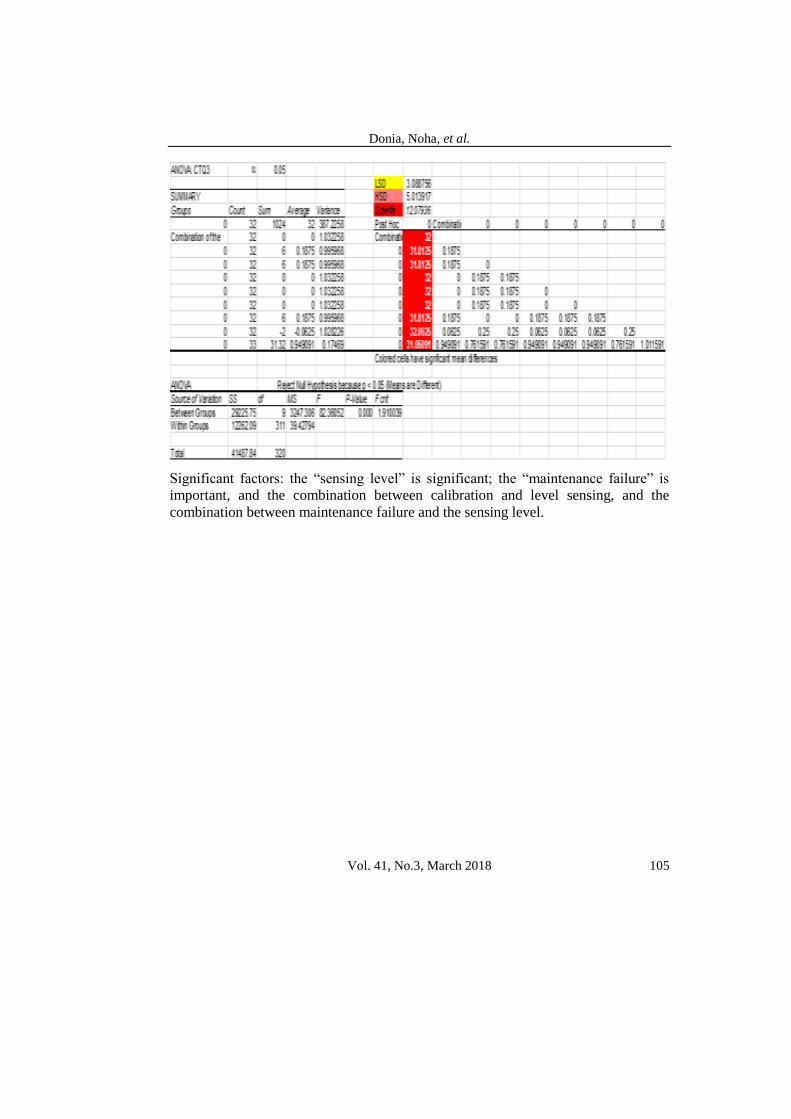
Table (5): ANOVA of the screening DOE and determination of the
significant factors
Significant factors: the “maintenance failure” is significant; the “device calibration”
is important.
Significant factors: the “maintenance failure” is significant; the “device
calibration” is important and the combination between calibration and maintenance.
Donia, Noha, et al.
Vol. 41, No.3, March 2018 105
Significant factors: the “sensing level” is significant; the “maintenance failure” is
important, and the combination between calibration and level sensing, and the
combination between maintenance failure and the sensing level.

J. Environ. Sci.
Institute of Environmental Studies and Research – Ain Shams University
Vol. 41, No.3, March 2018 106
ANOVA Regression

Donia, Noha, et al.
Vol. 41, No.3, March 2018 107
Table (6): metrics measured based on monitored data
Malf
un
ctio
n
of
mea
suri
ng
tem
p
Fail
ure
of
sen
sin
g l
evel
Des
ali
nati
on
un
it o
per
ati
on
Not
main
tain
ed
equ
ipm
ent
Not
cali
bra
ted
dev
ices
Fail
ure
of
feed
ing
chan
nel
s
All
oth
ers
55 59 18 530 405 33 102
Number of measures = 1024
Total Number of variations = 597
Number of opportunities per defects= 8
Rate of defectives = 59 %
Sigma level (Z ) = 2.73
Improve & control phase:-
Fig. (18): Condenser inlet temperature after adjustment

J. Environ. Sci.
Institute of Environmental Studies and Research – Ain Shams University
Vol. 41, No.3, March 2018 108
Fig. (19): Water Flowrate after adjustment
Fig. (20): PHE outlet pressure after adjustment
Donia, Noha, et al.
Vol. 41, No.3, March 2018 109
From the previous figures all the outputs of the critical components in the
system adjusted and under control.
Area of action 2 – calibration of the measuring devices.
The sensors that used for starting the actuation system shall have
calibration procedures to fulfill the requirements needed for the continuous
operation of the Sea Water System without any interruption.
Area of action 3 – On-the-Job Training.
An on-the-job training program was implemented on the Sea Water
System as a part of the MED/TCD plant in order to increase the knowledge
and the technical skills of the personnel. The on-the-job training program
covers several topics, including the following ones:
promotion and dissemination of the best practices to be adopted in the
operational procedures involved in maintenance activities and in applying
the quality assurance procedures;
standardization of the inspection criteria in all the control points of the
process, in order to ensure exactly the same criteria are adopted by
everyone; and
provision of knowledge, rehabilitation, education, and training of
personnel. And establishing guidelines to increase the ability of people to
distinguish items or parts need a maintenance in different types faults.
Six- sigma calculation:
1- Standard Deviation Calculation

J. Environ. Sci.
Institute of Environmental Studies and Research – Ain Shams University
Vol. 41, No.3, March 2018 110
2- Normal distribution and process capability
3- Arithmetic mean of grouped data
Where μ is the arithmetic mean, X is the midpoint, f is the frequency in
each interval, and N is the total number of the frequencies.
4- Range = highest value − lowest value
5- Variance
6- Poisson distribution, rolled throughput yield, and DPMO
Where P(x) is the probability for a unit to contain x defects, and μ is the
mean defect per unit. This equation can be rewritten if the DPU is known,
7- Estimating the Population Mean with Large Sample Sizes
Using the Central Limit Theorem, we have determined that the Z value
for sample means can be used for large samples.
By rearranging this formula, we can derive the value of μ,

Donia, Noha, et al.
Vol. 41, No.3, March 2018 111
Where,
is the upper confidence limit (UCL) and
is the lower confidence limit (LCL).
8- Statistical Process Control: The first step when creating a p-chart is to
calculate the proportion of nonconformity for each sample.
9- The p-chart
Where m represents the number of nonconforming items, b is the number
of items in the sample, and p is the proportion of nonconformity.
Where, is the mean proportion, k is the number of samples audited, and
is the kth proportion obtained. The control limits of a p-chart are:
and represents the center line.
10- Process Capability Analysis
Short-term potential capabilities Cp and Cr.

J. Environ. Sci.
Institute of Environmental Studies and Research – Ain Shams University
Vol. 41, No.3, March 2018 112
Where USL, LSL are upper specific limits and lower specific limits
respectively.
Capability ratios,
11- Analysis of Variance (ANOVA)
12- Regression Analysis
The regression equation: The independent variable is known with certainty
and only that variable can affect the response variable ˆy, the model that
will be built will generate an exact predictable output.
=f(x)
= β1 x+β0
Where,
β0 representing the y-intercept and,
β1 being the slope of the line.
CONCLUSION
The six-sigma method based on the DMAIC roadmap is a helpful method
to understand the problem through the define phase of the Sea Water System
and determine that most of the variations of the outputs of the system comes
from the lack of maintenance of the system and the calibration of devices not
maintained. Further data and measures were collected in the measure phase
by means of operation output measures, which led to the estimation of the

Donia, Noha, et al.
Vol. 41, No.3, March 2018 113
performance baseline of the operation process. In the analyze phase of
DMAIC approach, a set of studies, including DOE, were conducted to
identify the root causes of variation of the measures. Some of the relevant
causes had origin in calibration of the devices itself, but others had origin in
downstream operations where maintenance of equipment no obtained. The
improve phase involved the development and implementation of a set of
improvement actions that were grouped around four areas of action. Each
action shall apply in the philosophy of integration management system, not
each action applies alone. The results after applying the four actions show
that the behavior of the chemical dosing system enhanced and followed the
six-sigma principle. The effectiveness of the improvement actions was also
confirmed by the significant enhancement on the values of the operation
parameters.
REFERENCES
Black, K. & Revere, L. (2006): “Six Sigma arises from the ashes of TQM
with a twist”, InternationalJournal of Health Care Quality
Assurance, Vol. 19 No. 3, pp. 259-266.
El-Haik, B. S. & Al-Aomar, R. (2006): Simulation-Based Lean Six Sigma
and Design for Six Sigma, Wiley, Hoboken, NJ.
Goldstein, M. (2001): “Six Sigma program success factors”, Six Sigma
Forum Magazine, Vol. 1 No. 1, pp. 36-45.
Senapati, N. R. (2004): “Six Sigma: myths and realities”, International
Journal of Quality and Reliability Management, Vol. 21 No. 6,
pp. 683-690.
Coronado, R. B. & Antony, J. (2002): Critical Success Factors for the
Successful Implementation of Six Sigma Projects in
Organizations. The TQM Magazine, 14, 92-99.

J. Environ. Sci.
Institute of Environmental Studies and Research – Ain Shams University
Vol. 41, No.3, March 2018 114
Robert, G. Launsby, Mark J. Kiemele Stephen R. Schmidt: Understanding
Industrial Designed Experiments (1994).
Issa Bass Barbara Lawton, Ph.D., Lean Six Sigma Using SigmaXL &
Minitab, The McGraw-Hill Companies.
David, M. Levine. (2006): “Statistics for Six Sigma Green Belts with
Minitab® And JMP™”
NJ: Prentice Hall (2001): Engineers and Scientists UsingMicrosoft Excel and
Minitab.
Kai, Yang (2005): Design for SixSigma for Service.
Forrest, W. Breyfogle (1999): Implementing Six Sigma,Smarter Solutions
UsingStatistical Methods.
D. H. Stamatis (2003): Six Sigma And BeyondTheImplementationProcess.
تحلية متعددة تحسين الأداء التشغيلي لنظام مياه البحر في وحدة في مصر باستخدام أسلوب ستة سيجما تقطير بالضغط الحراري/ التأثير
[5] (2)قاقا أشرف عبد الباسط -(2)طارق فاروق نجلا -(1)نهى سمير دنيا
هيئة المحطات النووية لتوليد الكهرباء( 2 جامعة عين شمس، البيئية بحوثوال الدراساتمعهد ( 1
مستخلصالمن هاما الغرض من هذه الورقة البحثية هو وضع برنامج صيانة لنظام مياه البحر باعتباره جزءا
ات اللازمة لمعظم النظم في وحدة ، لتلبية جميع المتطلب(TCD /MED)متعددة التأثيرنوع وحدة تحلية تحلية المياه باعتبار هذا النظام هو المورد الرئيسي للمياه لباقي أجزاء المحطة، وكذلك تحسين أداء
.وحدة تحلية المياه، وزيادة عمر أجزاء المحطة -خطط)بالإضافة إلى دورة ( أسلوب أربع خطوات)من خلال تطبيق المنهج العلمي :النهج/المنهجية
ولتحسين أداء وحدة التحلية متعددة . ، فهذا يعني أننا نطبق فلسفة ستة سيجما(اتخذ قرار -تحقق -نفذنظام مياه ) MED/TCDالتأثيرات وزيادة عمر التشغيل، سنعمل على أحد الأنظمة الحرجة في وحدة
-حدد)هجية باستخدام من ، حيث يتم إنشاء برنامج صيانة باستخدام فلسفة ستة سيجما،(SWS)البحر

Donia, Noha, et al.
Vol. 41, No.3, March 2018 115
، لزيادة موثوقية MED/TCDلحل المشاكل في وحدة ((DMAIC)تحكم -حسن –حلل –قيس (MED/TCD)واتاحية وزيادة عمر الوحدة
، وانخفاض MED/TCDاكتشف موظفو التشغيل والصيانة أن الأداء المنخفض لوحدة التحلية :النتائجما أن عمر مكونات المبخر انخفض ولم يتطابق الاتاحية والموثوقية لا يتطابق مع أهداف التشغيل، ك
وبالتالي فإن نظام صيانة مرتكزة على . مع الجدول الزمني المخطط له من قبل تغيير مكونات المحطة .الموثوقية سوف يتم تطبيقه بدلا من الصيانة الوقائية
تة سيجما في برنامج توضح نتائج نظام مياه البحر التطبيق العملي الناجح لمشروع س :النتائج العملية(. MED/TCD)تقطير بالضغط الحراري / تحلية متعددة التأثيرالصيانة لوحدة تحلية المياه من النوع
ستتم مناقشة فوائد تطبيق طريقة ستة سيغما على نظام مياه البحر لوحدة تحلية المياه في هذه الورقة .البحثية
–نظام مياه البحر -تقطير بالضغط الحراري –يرتحلية متعددة التأث –ستة سيجما :الكلمات الدالة .الاتاحية –الموثوقية -( اتخذ قرار -تحقق -نفذ -خطط)دورة –صيانة مرتكزة على الموثوقية