Embed Size (px)
Citation preview

Image designed by Nicole Brate
MSgt Eric A. Plack, USAF, Jonathan D. Ritschel, Edward D. White, Lt Col Clay M. Koschnick, USAF, & Lt Col Scott T. Drylie, USAF
Science and technology (S&T) programs serve an important function in the defense acquisition process as the initial phase leading to discovery and development of warfighting technology. The results of these programs impact the larger major defense acquisition programs, which integrate the technologies in subsequent phases of the life cycle. Despite this important role, little prior research has examined the performance of S&T programs. In this study, the authors investigate the impact of technological maturation as a critical success factor in Air Force S&T programs. The results suggest that S&T programs with mature technologies are more likely to experience above average cost growth and larger contract values while less likely to experience schedule growth. Additionally, the authors find the partnership method between the government and contractor matters for both technologica l maturation and schedule growth. Lastly, the nature of the S&T program is important, with aerospace programs more likely to technologically mature than human systems programs.
DOI: https://doi.org/10.22594/dau.20-863.28.04 Keywords: Program Management, Defense Acquisition, Technology Readiness Level, Technological Maturity
ExploringPERFORMANCEIN AIR FORCE SCIENCEand Technology Programs

422 Defense ARJ, October 2021, Vol. 28 No. 4 : 420–451
Exploring Performance in Air Force Science and Technology Programs https://www.dau.edu
Program management focuses on cost, schedule, and performance as the three key measures of success (Meridith & Mantel, 2003; Pinto & Slevin, 1998). A large body of literature identifies critical factors that lead to program success in both private industry (Nasir & Sahibuddin, 2011; Pinto & Slevin, 1987; Zwikael & Globerson, 2006) and the public sector (Rendon, 2012; Rodriguez-Segura et al., 2016; Tishler et al., 1996). Prior analyses of program performance in defense programs, however, have focused almost exclusively on larger, more mature programs that have reached the Engineering and Manufacturing Development (EMD) phase of the life cycle or beyond. An abundance of studies exploring cost growth or schedule growth can be found for these major defense acquisition programs (MDAPs) (Bolten et al., 2008; Cancian, 2010; Smirnoff & Hicks, 2008). Missing from the literature is an exploration of smaller programs that feed basic science and technologies to subsequent acquisition programs or that develop new systems and technologies on a smaller scale. These are the science and technology (S&T) programs that are undertaken in defense research labs. This article seeks to bridge that gap through an exploratory analysis of program performance in Air Force S&T programs.To the best of our knowledge, this study is the first to systematically analyze Air Force S&T program performance. While the contributions are novel, they are not intended to be the final word on the subject. Rather, this article seeks to ignite the spark that spawns the intellectual curiosity and research of others in S&T programs. Thus, the purpose of this article is to identify initial insights regarding relationships that may impact cost, schedule, and performance in S&T programs. By lighting the fire, we are optimistic that the findings articulated here will be further explored so that future S&T program decisions can be fully informed.
Importance of Science and TechnologyThe vision to implement S&T as a centerpiece of our nation’s airpower
strategy has been around since 1945 (Duffner, 2000). General H. H. “Hap” Arnold, Commanding General of the Army Air Forces, enlisted the aid of top aeronautics scientist Dr. Theodore von Karman to lead the first of these efforts, recommending the creation of an agency devoted exclusively to aeronautical research and development (Gorn, 1988). Over time, that agency has evolved to what is known today as the Air Force Research Laboratory (AFRL) (Duffner, 2000).S&T’s enduring importance is demonstrated in the 2019 publication of the U.S. Air Force 2030 Science and Technology Strategy. The 2030 S&T strategy aligns with the National Defense Strategy to empower S&T programs to
423Defense ARJ, October 2021, Vol. 28 No. 4 : 420–451
October 2021
develop and deliver warfighting capabilities rapidly and effectively (United States Air Force, 2019). How does S&T fulfill this need? S&T functions as the initial phase of the acquisition process by which technologies are matured and, where appropriate, are transitioned for acquisition by the Air Force (Office of the Chief Scientist of the U.S. Air Force, 2010). Continual advancement in these cutting-edge technologies is crucial, as the Air Force faces ever-changing threats and adversarial advancements in technology.
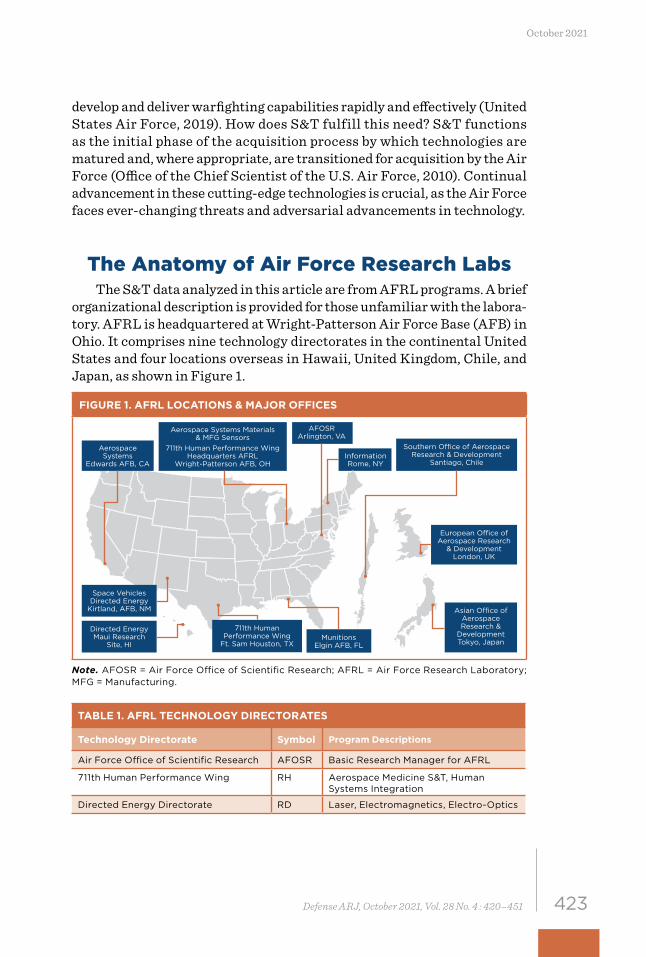
The Anatomy of Air Force Research LabsThe S&T data analyzed in this article are from AFRL programs. A brief
organizational description is provided for those unfamiliar with the labora-tory. AFRL is headquartered at Wright-Patterson Air Force Base (AFB) in Ohio. It comprises nine technology directorates in the continental United States and four locations overseas in Hawaii, United Kingdom, Chile, and Japan, as shown in Figure 1.
FIGURE 1. AFRL LOCATIONS & MAJOR OFFICES
InformationRome, NY
Aerospace Systems Materials & MFG Sensors
711th Human Performance WingHeadquarters AFRL
Wright-Patterson AFB, OH
AFOSRArlington, VA
Southern O�ce of Aerospace Research & Development
Santiago, Chile
AerospaceSystems
Edwards AFB, CA
European O�ce of Aerospace Research
& DevelopmentLondon, UK
Asian O�ce of Aerospace Research &
DevelopmentTokyo, Japan
Space Vehicles Directed Energy
Kirtland, AFB, NM
Directed EnergyMaui Research
Site, HIMunitions
Elgin AFB, FL
711th Human Performance Wing
Ft. Sam Houston, TX
Note. AFOSR = Air Force Office of Scientific Research; AFRL = Air Force Research Laboratory; MFG = Manufacturing.
TABLE 1. AFRL TECHNOLOGY DIRECTORATES
Technology Directorate Symbol Program Descriptions
Air Force Office of Scientific Research AFOSR Basic Research Manager for AFRL
711th Human Performance Wing RH Aerospace Medicine S&T, Human Systems Integration
Directed Energy Directorate RD Laser, Electromagnetics, Electro-Optics

424 Defense ARJ, October 2021, Vol. 28 No. 4 : 420–451
Exploring Performance in Air Force Science and Technology Programs https://www.dau.edu
TABLE 1. AFRL TECHNOLOGY DIRECTORATES
Technology Directorate Symbol Program Descriptions
Information Directorate RI Information Fusion, Exploitation, Networking
Aerospace Systems Directorate RQ Aerodynamics, Flight Control, Engines, Propulsion
Space Vehicle Directorate RV Space-Based Surveillance, Capability Protection
Munitions Directorate RW Air-Launched Munitions
Materials & Manufacturing Directorate RX Aircraft, Spacecraft, Missiles, Rockets
Sensors Directorate RY Sensors for Reconnaissance, Surveillance
Each technology directorate focuses on the development and innovation of leading-edge technologies and is separated by technological capabilities. A list of AFRL’s technology directorates, their office symbols, and program descriptions appears in Table 1. The analysis of individual technical directorates will be one of the ways this research segments the data.
Measures of Success: The Role of Technology Readiness Levels
The General Accounting Office (GAO) has identified technology mat-uration as a critical success factor in product development (GAO, 1999). The DoD’s approach to incorporate this critical success factor has been to emphasize Technology Readiness Levels (TRLs) as a measure for selecting mature technologies for inclusion in a program (Department of Defense [DoD], 2011). The TRL concept was developed by NASA (Sadin et al., 1989) and has subsequently been adopted by AFRL. A TRL is a tool to measure the technology maturity of a system or subsystem using a 9-level ordinal scale (DoD, 2011). Detailed TRL definitions and descriptions can be found in Appendix A.It is believed that “programs that enter the Engineering and Manufacturing Development (EMD) phase of the Defense Acquisition System and have immature technologies will incur cost growth and schedule slippage” (DoD, 2009). To reduce the risk associated with entering the EMD phase of the acquisition life cycle at Milestone B, DoD Instruction 5000.02 requires technologies to be demonstrated in a relevant environment and obtain a TRL of at least 6 (DoD, 2011). AFRL, through the S&T programs they over-see, plays a key role in the creation and maturation of these technologies to reach those thresholds.
(CONTINUED)
425Defense ARJ, October 2021, Vol. 28 No. 4 : 420–451
October 2021
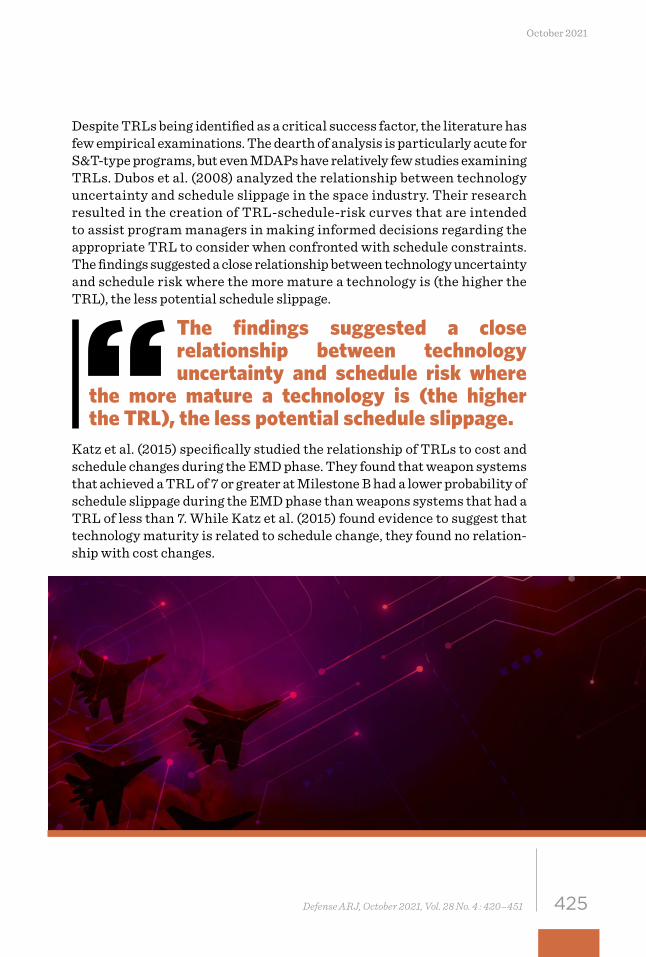
Despite TRLs being identified as a critical success factor, the literature has few empirical examinations. The dearth of analysis is particularly acute for S&T-type programs, but even MDAPs have relatively few studies examining TRLs. Dubos et al. (2008) analyzed the relationship between technology uncertainty and schedule slippage in the space industry. Their research resulted in the creation of TRL-schedule-risk curves that are intended to assist program managers in making informed decisions regarding the appropriate TRL to consider when confronted with schedule constraints. The findings suggested a close relationship between technology uncertainty and schedule risk where the more mature a technology is (the higher the TRL), the less potential schedule slippage.
Katz et al. (2015) specifically studied the relationship of TRLs to cost and schedule changes during the EMD phase. They found that weapon systems that achieved a TRL of 7 or greater at Milestone B had a lower probability of schedule slippage during the EMD phase than weapons systems that had a TRL of less than 7. While Katz et al. (2015) found evidence to suggest that technology maturity is related to schedule change, they found no relation-ship with cost changes.
The findings suggested a close relationship between technology uncertainty and schedule risk where
the more mature a technology is (the higher the TRL), the less potential schedule slippage.

426 Defense ARJ, October 2021, Vol. 28 No. 4 : 420–451
Exploring Performance in Air Force Science and Technology Programs https://www.dau.edu
Smoker and Smith (2007), however, found evidence that suggests costs vary exponentially across time as the system’s technology progresses through each TRL. Similarly, Linick (2017) found that as the TRL increased through-out the development phase, the percentage of the development cost grew at an increasing rate. As shown by the literature, the extant TRL studies are primarily focused on programs once they reach the EMD stage. To the best of our knowledge, no studies focus solely on S&T programs—a gap this article is designed to fill.
DataThe data for this research were obtained from the AFRL cost and
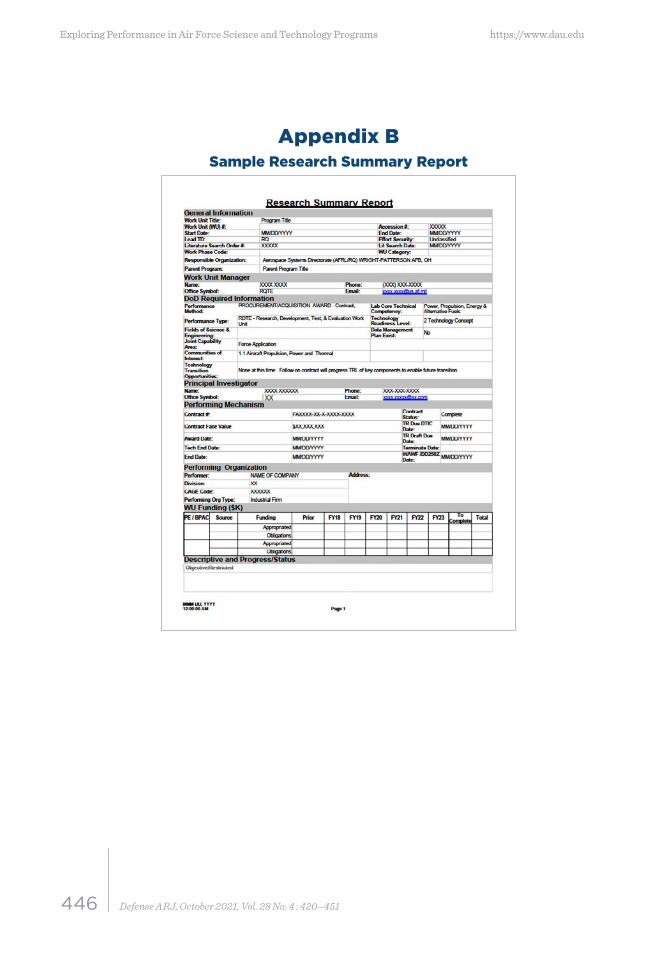
economics division. S&T programs typically fall below the dollar thresh-old for traditional standardized reporting such as Contract Performance Reports (CPRs). Instead, the S&T programs receive Funds and Man-Hour Expenditure Reports (FMERs). These FMERs provide the procuring activ-ity visibility into the contractor’s expenditures for labor, materials and parts, travel, subcontractors, and other charges. Like CPRs, these reports are required on a periodic basis from the contractor—usually monthly. Unlike CPRs, FMERs do not report standardized cost elements like the ones found in MIL-STD-881D. The initial AFRL dataset consisted of 165 S&T programs with contract start dates spanning from 2009 to 2017.Research Summary Reports were also collected for these programs. These reports are generated at the start of the program (Initial), during the pro-gram (Periodic), and at the end of the program (Final). Research Summary Reports include general information such as the program title, lead tech-nical directorate, and start/end dates. They also include DoD-required information such as performance type, joint capability area, Air Force tech-nical capabilities, and TRLs. An example of a Research Summary Report can be found in Appendix B.

427Defense ARJ, October 2021, Vol. 28 No. 4 : 420–451
October 2021
TABLE 2. DATASET EXCLUSIONS
Category Number Removed Remaining Programs
Programs Obtained from AFRL 165
Missing Elements 64 101
Inadequate TD Sample Size 10 91
Less Than 92.5% Complete 48 43
Final Dataset for Analysis 43
Of the 165 programs obtained from AFRL, 43 are included in the final dataset. Table 2 provides the exclusion criteria and associated number of programs remaining in the analysis.
As shown in Table 2, programs that had missing elements are excluded. These 64 programs had their costs reported on the FMER in unique ways, including cost burn rates, earned value management graphs, total costs in phases, or simply an overall total cost or labor hours spent. These reporting methods lack the specific elements needed in this analysis to compute per-centages of total cost, which are used to observe the program’s behavior. Of the 101 remaining programs, 10 programs fall under four different technical directorates (RD, RI, RX, and RY). Each technical directorate represents unique programs with different characteristics, which precluded aggrega-tion above the technical directorate level. Therefore, the small sample size in these directorates would likely skew the analysis results, especially when observing how these programs behave at the technical directorate level. For these reasons, the programs are excluded from the analysis. Finally, programs with a completion percentage of less than 92.5% are excluded from the dataset. A program’s completion percentage is computed using the total cost from the last available FMER to the program’s contract value at that time. Previous research determined that a program with a completion per-centage of 92.5% or greater accurately predicts the final cost of the program (Tracy & White, 2011). The final number of programs in the dataset is 43, which is sufficient to conduct a robust analysis. See Appendix C for details on the 43 individual programs.
S&T programs typically fall below the dollar threshold for traditional standardized reporting such as Contract Performance
Reports (CPRs). Instead, the S&T programs receive Funds and Man-Hour Expenditure Reports (FMERs).

428 Defense ARJ, October 2021, Vol. 28 No. 4 : 420–451
Exploring Performance in Air Force Science and Technology Programs https://www.dau.edu
Methods: Contingency Table AnalysisThe dataset consists largely of qualitative variables. Therefore, the
methodological approach employed is a two-way contingency table analy-sis. (See McClave et al. [2018, pp. 608–632] for more details on contingency tables.) This type of analysis is used to summarize the relationship between two categorical variables based on the data observed. The contingency table analysis uses a 2 x 2 table to test for independence. For each test, the same type of hypothesis test will be implemented, as shown in Equation 1:
Ho: The two classifications are independentHa: The two classifications are dependent (1)
The chi-square distribution is the test statistic used for considering infer-ences about the category probabilities. If there is a failure to reject the null, the two variables are independent and are not statistically related to one another. If the null is rejected, then the variables are dependent, and a statis-tical relationship exists between them. The two-way contingency analysis examines the categorical variables (Table 3) with subsequent discussion on the rationale behind variable selection and categorization.
TABLE 3. CATEGORICAL VARIABLES USED IN CONTINGENCY TABLE ANALYSIS
Categorical Variables
Technical Directorate Cost Growth > 0%
Performance Type Cost Growth > 33.7%
TRL Increase Cost Growth > 44.1%
Last Known TRL ≥ 6 Cost Growth > 56.5%
Final TRL ≥ 6 Cost Growth > 60.5%
TRL 1 - 3 Cost Growth > 68%
TRL 4 - 5 Contract Value > $1M
TRL 6 - 7 Contract Value > $3M
TRL 8 - 9
Schedule Growth > 0%
Schedule Growth > 33%
Schedule Growth > 63%
An underlying assumption of the chi-square contingency table test is that the sample size should be large enough so that the estimated expected cell count will be equal to five or more. If this assumption is violated, the Fisher’s Exact Test can be utilized. The Fisher’s Exact Test is based on hypergeometric probabilities, and no statistical assumptions are needed
429Defense ARJ, October 2021, Vol. 28 No. 4 : 420–451
October 2021
except for computational ability and time. (For more details regarding the use of Fisher’s Exact Test, see McDonald [2014, pp. 77–85] or Mehta and Patel [1983].)When highly significant results are found, one of the benefits of a contin-gency table is that odds ratios and their associated confidence intervals can be produced. An odds ratio is a measure of association for a two-way contingency table. The ratio is the odds of an event occurring in one group to the odds of the same event occurring in another group. In other words, the odds ratio is the ratio of the probability of a property being present compared to the probability of it being absent. If the odds ratio is 1, the two events are independent.
Categorical variables for the Technical Directorate (TD), Performance Type, and TRLs are obtained from the Research Summary Reports. The TD variable denotes which AFRL directorate is the lead on the program. Such a variable may capture organizational/managerial/technological differences. For this dataset, the TD variable is either RH (Airman/Human Systems) or RQ (Aerospace Systems). (This limitation is due to the sample size of the other TDs as previously discussed.) The performance type represents the partnership method between AFRL and the contractor. This variable con-sists of Research, Development, Test and Evaluation (RDT&E) and Small Business Innovative Research (SBIR) relationships. This type of variable may capture differences due to the size, skills, or knowledge of the company types (e.g., small vs. large companies). TRL data for the S&T programs are used in seven different categorical variables. TRL Increase indicates whether the TRL increases at any point during the program’s life cycle. Last Known TRL ≥ 6 denotes the last reported TRL of the program, while Final TRL ≥ 6 only analyzes programs that have a Final Research Summary Report. The decision to categorize based on TRL level 6 is due to the role this TRL level fulfills in the defense acquisition process. Specifically, a TRL of 6

430 Defense ARJ, October 2021, Vol. 28 No. 4 : 420–451
Exploring Performance in Air Force Science and Technology Programs https://www.dau.edu
is equivalent to demonstration in a relevant environment, which is needed for a program to enter Milestone B (DoD, 2011). Four variables were created by grouping TRLs (Figure 2) based on the maturity of the technology and the product’s requirements, as determined in the literature (GAO, 1999).
FIGURE 2. USING TRL’S TO MATCH TECHNOLOGY WITH REQUIREMENTS
PRODUCTREQUIREMENTS
High risk for product launch
Low risk for product launch
Risk forUnknowns
TR L1 2 3
4 5
6 7
8 9
Note. Adapted from GAO (1999).
TABLE 4. BREAK POINT SUMMARY
Category Break Point Reason Source
Schedule Growth 0%33%63%
Any growthMedianMean
DatasetDatasetDataset
Cost Growth 0%33.7%44.1%56.5%60.5%68%
Any growthDoD Development - MedianAir Force Development - MedianDoD Development - MeanAir Force Development - MeanMean
DatasetBolten et al. (2008)Bolten et al. (2008)Bolten et al. (2008)Bolten et al. (2008)Dataset
Contract Value $1M$3M
MedianMean
DatasetDataset
Additional variables of interest created from the Research Summary Report contract information include schedule growth, cost growth, and contract value. These attributes are commonly studied for acquisition programs at all phases of their life cycles.The variables for cost growth, schedule growth, and contract value have been converted from continuous variables to categorical variables for inclu-sion in the contingency table analysis. Binary (or dummy) variables with methodical break points were created to test the relationships at different locations. These breakpoints were derived either from the literature review or from descriptive statistics of the variable itself in the dataset with its

431Defense ARJ, October 2021, Vol. 28 No. 4 : 420–451
October 2021
mean and/or median. For example, the mean cost growth of the dataset was 68%, which led to the creation of a dummy variable (Cost Growth > 68%), separating programs that are above and below the sample mean. Likewise, Bolten et al. (2008) distinguished mean and median percentages of total DoD and Air Force acquisition program development cost percentages. These thresholds from Bolten et al. (2008) are also examined. A summary of the break points can be seen in Table 4.
Results and DiscussionThe contingency table results are organized into four sections: technical
directorate, performance type, TRL, and growth relationships. Using the chi-square distribution as the test statistic, relationships are identified when Pearson’s chi-squared test is significant at a p-value of less than 0.10. For highly significant results (p-value < 0.01), the odds ratio and its associ-ated confidence interval are analyzed. It is important to note the possibility of spurious relationships. Spurious relationships occur when the two vari-ables are associated, but not causally related, possibly due to an unknown mediating variable. With the sheer number of 2 x 2 tables generated in this analysis, spurious relationships are possible. Therefore, only highly statis-tically significant results (p-value < 0.01) will be studied in detail (i.e., full contingency table shown) while the other significant variables are observed solely as potential findings.
Technical Directorate The Technical Directorate (TD) categorical variable denotes which
AFRL directorate is the lead on the respective program: either RH (Airman/Human Systems) or RQ (Aerospace Systems). Analyzing the TD variable resulted in 19 contingency tables to be tested for significance. Two variables were significant at an alpha of 0.10 and two were significant at an alpha of 0.05. The full set of test results is provided in Table 5, where the more likely TD is annotated with a + and its name (e.g., +RQ).

432 Defense ARJ, October 2021, Vol. 28 No. 4 : 420–451
Exploring Performance in Air Force Science and Technology Programs https://www.dau.edu
TABLE 5. CONTINGENCY TABLE RESULTS FOR TECHNICAL DIRECTORATE
Variable TD
Performance Type
TRL Increase ** (+RQ)
Last Known TRL ≥ 6
Final TRL ≥ 6
TRL 1-3
TRL 4-5
TRL 6-7
TRL 8-9
Schedule Growth > 0%
Schedule Growth > 33% (Median) ** (+RQ)
Schedule Growth > 63% (Mean) * (+RQ)
Contract Value > $1.0M (Median)
Contract Value > $3.0M (Mean)
Cost Growth > 0% * (+RQ)
Cost Growth > 33.7% (DoD Dev - Median)
Cost Growth > 44.1% (AF Dev - Median)
Cost Growth > 56.5% (DoD Dev - Mean)
Cost Growth > 60.5% (AF Dev - Mean)
Cost Growth > 68% (Mean)
Total Significant Contingency Tables: 4
Note. * p-value <0.10 ** p-value <0.05 *** p-value <0.01
TRL Increase is the only TRL variable with a statistically significant rela-tionship to TD. This test suggests that it is more probable to have a program’s TRL increase with RQ (Aerospace Systems) programs compared to RH (Airman/Human Systems) programs. The RQ (Aerospace Systems) pro-grams are composed primarily of engine and propulsion (hardware) system technologies. The ability to transition RQ (Aerospace Systems) through TRL levels may be due to the relationship of hardware versus software
433Defense ARJ, October 2021, Vol. 28 No. 4 : 420–451
October 2021
(human systems interactions). It is likely easier to make advancements in hardware technologies as the testing, failures, and efficiencies may be more conclusive. Similarly, the contingency table results suggest that RQ (Aerospace Systems) programs are more probable to have cost growth as well as schedule growth that is greater than 33% (the dataset’s median) and 63% (the dataset’s mean). This could be related to the maturing technology (increasing the TRL) of RQ (Aerospace Systems) programs. If the technology is maturing, a program office may be more likely to increase funding and schedule to keep the mat-uration on track. If the technologies do not mature, it could be that the agile nature of S&T programs allows for an early decision to cancel programs. In summary, the TD results suggest that RQ (Aerospace Systems) programs are more likely to technologically mature, have cost growth, and have schedule growth (greater than the dataset mean and median) when compared to RH (Airman/Human Systems) programs.
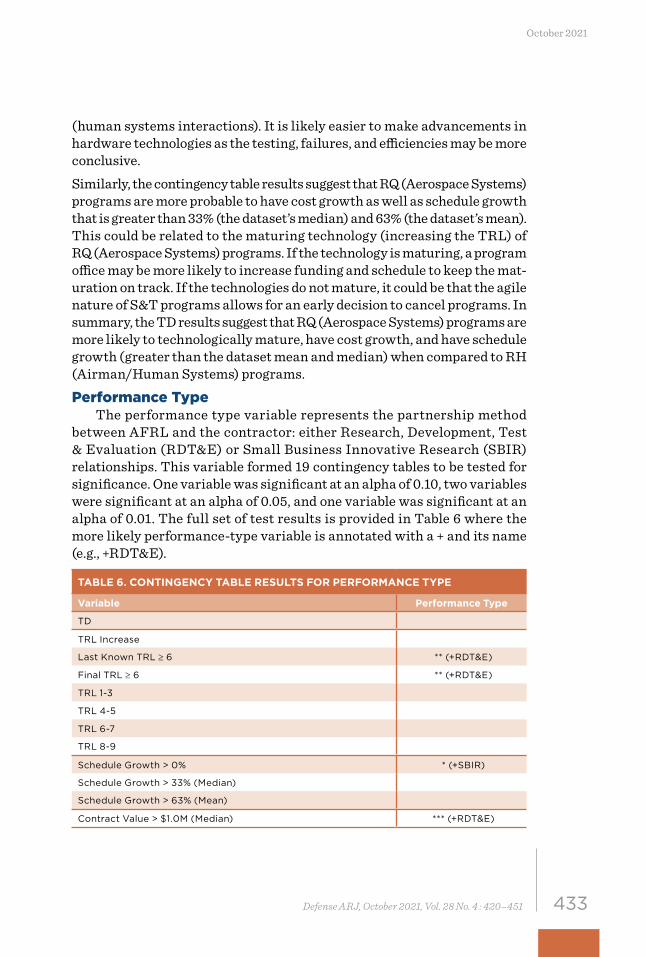
Performance TypeThe performance type variable represents the partnership method
between AFRL and the contractor: either Research, Development, Test & Evaluation (RDT&E) or Small Business Innovative Research (SBIR) relationships. This variable formed 19 contingency tables to be tested for significance. One variable was significant at an alpha of 0.10, two variables were significant at an alpha of 0.05, and one variable was significant at an alpha of 0.01. The full set of test results is provided in Table 6 where the more likely performance-type variable is annotated with a + and its name (e.g., +RDT&E).
TABLE 6. CONTINGENCY TABLE RESULTS FOR PERFORMANCE TYPE
Variable Performance Type
TD
TRL Increase
Last Known TRL ≥ 6 ** (+RDT&E)
Final TRL ≥ 6 ** (+RDT&E)
TRL 1-3
TRL 4-5
TRL 6-7
TRL 8-9
Schedule Growth > 0% * (+SBIR)
Schedule Growth > 33% (Median)
Schedule Growth > 63% (Mean)
Contract Value > $1.0M (Median) *** (+RDT&E)

434 Defense ARJ, October 2021, Vol. 28 No. 4 : 420–451
Exploring Performance in Air Force Science and Technology Programs https://www.dau.edu
TABLE 6. CONTINGENCY TABLE RESULTS FOR PERFORMANCE TYPE
Variable Performance Type
Cost Growth > 0%
Cost Growth > 33.7% (DoD Dev - Median)
Cost Growth > 44.1% (AF Dev - Median)
Cost Growth > 56.5% (DoD Dev - Mean)
Cost Growth > 60.5% (AF Dev - Mean)
Cost Growth > 68% (Mean)
Total Significant Contingency Tables: 5
Note. * p-value <0.10 ** p-value <0.05 *** p-value <0.01
Table 6 test results suggest that an S&T program with an RDT&E per-formance type is more likely to have or end with a TRL of at least 6 than an SBIR-type program. SBIR programs are developed by small domestic businesses, which potentially provide an agile way to stimulate high-tech innovation. But RDT&E programs are dominated by the larger, more expe-rienced defense contractors. These results suggest that the larger defense contractors may obtain contracts with more mature technologies due to their capacity and ability to develop these technologies when compared to SBIR businesses.
FIGURE 3. CONTINGENCY TABLE OF PERFORMANCE TYPE BY CONTRACT VALUE > $1M
RDT&E SBIR
0
1
1.00
0.75
0.50
0.25
0.00
Performance Type
Contingency Table
Tests
37.69231
Count Expected
Total
SBIR
RDT&E
0
1
Total
127.30769
1712.3077
711.6923
20 19
15
24
39Per
form
ance
Typ
e
Last Contract Value > $1M (Med)
Odds Ratio
N DF -LogLike RSquare (U)39 1 5.0265877 0.1860
Test ChiSquare Prob>ChiSq
Likelihood Ratio 10.053 0.0015*
Pearson 9.547 0.0020*
Odds Ratio Lower 95% Upper 95%
0.102941 0.022042 0.480764
Last
Co
ntra
ct V
alue
> $
1M (
Med
)
(CONTINUED)

435Defense ARJ, October 2021, Vol. 28 No. 4 : 420–451
October 2021
Further, as a potential indication of RDT&E and SBIR working different kinds of programs from the start, one can observe that contract values greater than $1 million (the dataset’s median) are more probable with RDT&E performance types, as seen in Figure 3. This result may be an arti-fact of the policy constraints on SBIR programs. A phase II SBIR contract cannot exceed $1.73 million without a waiver from the U.S. Small Business Administration. Due to this limitation, one might question the appropri-ateness of comparing RDT&E and SBIR programs by contract value. But in the dataset analyzed, the average SBIR contract was $977 thousand, with only one program nearing the waiver cap (Appendix C). At the same time, RDT&E programs have no lower dollar limit, and six of the 17 RDT&E programs are below the $1.73 million SBIR waiver threshold. Therefore, while comparisons of larger contract values are likely inappropriate, the $1 million threshold compared here may suggest that the differences are not conclusively a result of the policy limitation, but rather may be highlight-ing differences in the types of contractors involved in RDT&E and SBIR programs. SBIR programs may target uncertain and risky technologies that small businesses research so that AFRL can evaluate which programs have the potential to develop into mature technologies. The scale of these uncertain programs may contribute to lower contract values. In fact, the odds ratio indicates that given the program has an SBIR performance type, the odds of the contract value being less than $1 million are 9.7 times higher than when the program has an RDT&E performance type.
The Table 6 contingency test results also suggest that a program with an SBIR performance type is more likely to have schedule growth. While test results indicate that RDT&E programs are more likely to have higher TRL levels, the opposite could be said that SBIR programs are more likely to have lower TRL levels. Less is known about these immature technologies (where
SBIR programs may target uncertain and risky technologies that small businesses research so that AFRL can evaluate which
programs have the potential to develop into mature technologies.
(CONTINUED)
436 Defense ARJ, October 2021, Vol. 28 No. 4 : 420–451
Exploring Performance in Air Force Science and Technology Programs https://www.dau.edu
immature is defined as TRL 1–5), which could lead these small businesses to spend more time developing them, leading to schedule slippage. This result is consistent with the literature findings of Dubos et al. (2008). In summary, the results suggest that a program that has a performance type of RDT&E is more likely to have a TRL of 6. Furthermore, highly signifi-cant results point to evidence that a program that has a performance type of RDT&E is more likely to have a contract value greater than $1 million. Lastly, the results suggest that SBIR programs are more likely to experience schedule growth.
Technology Readiness LevelTRL data were used to create seven different binary variables as pre-
viously discussed. These seven TRL variables were tested for significance against the 11 performance variables to produce 77 contingency tables. Seven variables were significant at an alpha of 0.10, four variables were significant at an alpha of 0.05, and one variable was significant at an alpha of 0.01. Despite registering significant Pearson p-values, the contingency table results for the seven significant variables at an alpha of 0.10 were found to be invalid. For all seven tests, the expected counts of two of the four cells were less than five. This violates an assumption for a valid chi-squared contingency table test, which states the sample size should be large enough so that the estimated expected count will be equal to five or more. As a further check, Fisher’s Exact Test—which is a nonparametric test for small samples—found all seven tests to be nonsignificant. This result was largely due to the small number of programs with a TRL of 6–7 (5) and a Final TRL of ≥ 6 (4). The full set of test results is provided in Table 7, with special subscript designators on those test results deemed invalid.
As technologies mature, investments are made, which allow costs to grow over their initial estimates. As the technology
integrates into a demonstration effort (TRL 6–8), the program is often met with new and unexpected challenges, which tends to increase costs.

437Defense ARJ, October 2021, Vol. 28 No. 4 : 420–451
October 2021
TABLE 7. SIGNIFICANT CONTINGENCY TABLE FOR TECHNOLOGY READINESS LEVEL
Variable TRL Increase
Last Known TRL ≥ 6
Final TRL ≥ 6
TRL 1-3
TRL 4-5
TRL 6-7
TRL 8-9
Schedule Growth > 0% ** *1 *1
Schedule Growth > 33% (Median)
Schedule Growth > 63% (Mean)
Contract Value > $1.0M (Median) **
Contract Value > $3.0M (Mean) ** ***
Cost Growth > 0% *1
Cost Growth > 33.7% (DoD Dev - Median) *1
Cost Growth > 44.1% (AF Dev - Median) *1
Cost Growth > 56.5% (DoD Dev - Mean) *1
Cost Growth > 60.5% (AF Dev - Mean) *1
Cost Growth > 68% (Mean) **
Total Significant Contingency Tables: 0 2 1 1 0 8 0
Note. *1 p-value <0.10, 50% of Expected Counts <5, Non-significant Fisher's Exact Test * p-value <0.10 ** p-value <0.05 *** p-value <0.01
FIGURE 4. CONTINGENCY TABLE OF TRL 6–7 BY CONTRACT VALUE > $3M
0 1
0
1
1.00
0.75
0.50
0.25
0.00
TRL 6-7
Contingency Table
Tests
2926.4286
Count Expected
Total
1
0
0
1
Total
810.5714
13.57143
41.42857
30 12
37
5
42
TRL
6-7
Last Contract Value > $3M (Mean)
Odds Ratio
N DF -LogLike RSquare (U)42 1 3.3084592 0.1317
Test ChiSquare Prob>ChiSq
Likelihood Ratio 6.617 0.0101*
Pearson 7.356 0.0067*
Odds Ratio Lower 95% Upper 95%
14.5 1.415167 148.5691
Last
Co
ntra
ct V
alue
> $
3M (
Mea
n)
The contingency table results suggest that an S&T program is more likely to have cost growth greater than 68% (the dataset’s mean) with a TRL of 6 or 7 but less likely to have schedule growth with a TRL ≥ 6. Such a finding, perhaps unusual for a development program, is both intuitive and precedent

438 Defense ARJ, October 2021, Vol. 28 No. 4 : 420–451
Exploring Performance in Air Force Science and Technology Programs https://www.dau.edu
in an S&T context. With an early TRL (1–5), there is little knowledge of how the technology will mature. This poses a problem to program manag-ers and cost estimators. As technologies mature, investments are made, which allow costs to grow over their initial estimates. As the technology integrates into a demonstration effort (TRL 6–8), the program is often met with new and unexpected challenges, which tends to increase costs. These results support previous research conducted on Air Force programs, which concluded that estimated costs vary exponentially across time with the progression through the various TRLs (Smoker & Smith, 2007). However, for more mature technologies, a broader knowledge base is available for the technology’s development due to more completed research. With a higher TRL, and thus more knowledge of the technology available, the better the chance of meeting schedule requirements (Dubos et al., 2008). This litera-ture finding is also consistent with the results found here.
Table 7 results also suggest that an S&T program with a TRL of 6 or greater is more likely to have contract values greater than $3 million (the dataset’s mean). An S&T program with a TRL of 1 through 3 is less likely to have con-tract values greater than $1 million (the dataset’s median). The explanation is consistent with the aforementioned cost growth finding. As the program’s technology matures, additional investments are made, as shown in the con-tingency analysis results in Figure 4. In fact, the odds ratio indicates that given the program has a TRL of 6 or 7, the odds of the contract value being greater than $3 million are 14.5 times higher than a program with a TRL other than 6 or 7.In summary, the TRL results suggest that programs with mature technolo-gies are more likely to experience larger than average cost growth and larger contract values. Additionally, these programs are less likely to experience schedule growth. Further, the results suggest that programs with immature technologies are less likely to have larger contract values.

439Defense ARJ, October 2021, Vol. 28 No. 4 : 420–451
October 2021
Growth Relationships As previously shown, variables for TD, performance type, and TRL
were tested for their relationships with cost growth, schedule growth, and contract value. An analysis was also conducted among these latter variables to analyze their relationships to each other; a total of 63 relationships were tested for significance. Eight tests were significant at an alpha of 0.10, 11 tests were significant at an alpha of 0.05, and 22 tests were significant at an alpha of 0.01. The full set of test results appears in Table 8.
TABLE 8. SIGNIFICANT CONTINGENCY TABLES FOR GROWTH RELATIONSHIPS
Variable
Sche
dul
e G
row
th
> 0
%
Sche
dul
e G
row
th >
33
% (
Med
)
Sche
dul
e G
row
th >
6
3% (
Mea
n)
Co
ntra
ct V
alue
>
$0.9
M
Co
ntra
ct V
alue
>
$1.0
M (
Med
)
Co
ntra
ct V
alue
>
$3.0
M (
Mea
n)
Co
ntra
ct V
alue
>
$4
.0M
Co
ntra
ct V
alue
>
$5.0
M
Tota
l Sig
nifi
cant
C
ont
ing
ency
Tab
les
Contract Value > $0.9M ** ** 2
Contract Value > $1.0M (Median) 0
Contract Value > $3.0M (Mean) 0
Contract Value > $4.0M 0
Contract Value > $5.0M 0
Cost Growth > 0% ** *** *** *** *** ** ** * 8
Cost Growth > 33.7% (DoD Dev - Median) * * *** *** *** *** ** 7
Cost Growth > 44.1% (AF Dev - Median) * * *** *** *** *** ** 7
Cost Growth > 56.5% (DoD Dev - Mean) * ** *** *** *** ** 6
Cost Growth > 60.5% (AF Dev - Mean) * ** *** *** *** ** 6
Cost Growth > 68% (Mean) * *** *** *** *** 5
Total Significant Contingency Tables: 5 7 7 1 3 6 6 6 41
Note. * p-value <0.10 ** p-value <0.05 *** p-value <0.01
The contingency table results suggest that it is more probable for S&T pro-grams with larger contract values to experience cost growth. Observing cost growth relationships with the original two contract value variables (using the mean and median of the dataset) provided highly significant results. To explore the sensitivity of these relationships relative to the threshold used to

440 Defense ARJ, October 2021, Vol. 28 No. 4 : 420–451
Exploring Performance in Air Force Science and Technology Programs https://www.dau.edu
define the binary variables, additional contract value variables were created with lower and higher breakpoints. This additional analysis found contract values greater than $0.9 million to be the lowest threshold for which a sta-tistically significant relationship could be found with an amount of cost growth (i.e., cost growth > 0%). As the contract value threshold increased, additional cost growth variables displayed statistical significance until all were significant at a contract value of $3.0 million. The progression is illustrated by the cells with light green shading, as shown in Table 8. This suggests that cost growth and contract value have a positive correlation with each other.Table 8 results also suggest that it is more probable for S&T programs with contract values greater than $0.9 million to experience schedule growth above the median and mean (i.e., greater than 33% and 63%, respectively). This was the only contract value variable to result in significant p-values when tested with schedule growth variables (see light blue shaded cells in Table 8). These results imply that programs with contract values less than $0.9 million are less likely to experience schedule growth.
Finally, the results suggest that if S&T programs are experiencing schedule growth, then it is more likely that they’re also experiencing cost growth. This seems to contradict the findings that programs with mature technol-ogies are more likely to experience cost growth and less likely to experience schedule growth. But closer analysis of these results suggests that programs with large schedule growth percentages are even more likely to experience cost growth at all amounts. Thus, when this cost and schedule growth rela-tionship is found, it is not in the mature technology programs, but rather in those programs with immature technologies. In summary, the results suggest that S&T programs with larger contract values experience cost growth, while programs with smaller contract val-ues (< $0.9 million) are less likely to experience schedule growth. Finally, analyzing the relationship between cost and schedule growth suggests that programs with schedule growth are more likely to have cost growth as well. The analysis revealed that this schedule growth/cost growth relationship is found in those programs with immature technologies.
Analyzing the relationship between cost and schedule growth suggests that programs with schedule growth are more likely to
have cost growth as well. The analysis revealed that this schedule growth/cost growth relationship is found in those programs with immature technologies.

441Defense ARJ, October 2021, Vol. 28 No. 4 : 420–451
October 2021
ConclusionsS&T programs serve an important role in the defense acquisition pro-
cess. They constitute the initial phase of the acquisition process through discovery and development of warfighting technology. The results of these programs impact the larger MDAPs, which integrate the technologies in subsequent phases of the life cycle. Despite this important role, little prior research has examined the performance of S&T programs. Thus, the over-arching goal of this article was to discern new insights from an analysis of Air Force S&T program characteristics in relation to their program’s performance.
The literature review identified technological maturity as a critical success factor in product development (GAO, 1999). One measure that defense pro-grams use for technological maturity is TRL levels. TRLs, therefore, were an integral component under investigation in this analysis. The objective was to understand how TRLs affect S&T program performance. Several key findings emerged from this analysis. First, the results suggest that aerospace programs are more likely to tech-nologically mature when compared to human system programs. In other words, the AFRL aerospace programs are more likely to progress through the TRLs in their programs. To the extent that technological maturity is a measure of success, the aerospace programs outperform. However, this technical performance comes at a cost as the aerospace programs were also more likely to experience cost and schedule growth. Intuitively, these results are compatible; with proven success in technology maturation, increases in funding and schedule are likely to keep the maturation on track. Second, the partnership method between the government and contrac-tor may matter. The partnerships for S&T programs consist of SBIR and RDT&E relationships. The RDT&E programs are more likely to have—and

442 Defense ARJ, October 2021, Vol. 28 No. 4 : 420–451
Exploring Performance in Air Force Science and Technology Programs https://www.dau.edu
end—with a TRL of 6 or more in comparison to SBIR programs. The result is not entirely surprising because, by definition, the larger defense companies constitute the RDT&E category. These larger companies have the capacity and resources to mature technology that the smaller SBIR companies may not possess. Additionally, the purpose and limitations of SBIR programs must be acknowledged. SBIR programs are intended to increase private-sec-tor commercialization of innovation and stimulate technology innovation. Funding limits are associated with these programs and, depending on the objectives of the specific SBIR program, they may eventually transition to a funded R&D or procurement contract. These differences are important when comparing SBIR to RDT&E programs.
Third, TRLs and program performance are linked. The relationships with TRLs suggest that programs with mature technologies are more likely to experience above average cost growth and larger contract values while less likely to experience schedule growth. Additionally, the results suggest that programs with immature technologies are less likely to have larger contract values. As technologies mature, additional funds for investments are made, which increases costs over their initial contract values. From a practical standpoint, these additional investments may occur due to the need for an increased performance outcome and are not an indictment on the manage-ment effort. This is likely to happen when the program is met with new and unexpected challenges as the technology integrates into a demonstration effort (TRLs 6–8). Linick (2017) found that as the TRL increased throughout the development phase, the percentage of the development cost increased at an increasing rate. This literature finding is in agreement with these results. Conversely, as these technologies mature, a broader knowledge base is gained for its development, which increases the chance of meeting schedule requirements. Lastly, the analysis of “growth” variables (cost growth, schedule growth, and contract value) provides additional insights on S&T programs. Specifically, the analysis suggests that S&T programs with larger contract values
Further analysis of the relationship between cost and schedule growth suggests that if programs have larger
schedule growth, then they are more likely to have larger cost growth as well. The analysis revealed that this schedule growth/cost growth relationship is found in those programs with immature technologies.

443Defense ARJ, October 2021, Vol. 28 No. 4 : 420–451
October 2021
experience larger cost growth at the same time programs with smaller con-tract values (< $0.9 million) are less likely to experience schedule growth. Further analysis of the relationship between cost and schedule growth suggests that if programs have larger schedule growth, then they are more likely to have larger cost growth as well. The analysis revealed that this schedule growth/cost growth relationship is found in those programs with immature technologies.When interpreting the results of this article, it is important to remember that S&T programs are different than MDAPs. As a result, the risk tolerance manifested in cost and schedule performance standards between the two should not be conflated. The research nature of an S&T program inherently makes it more risky. The subtext is that technical failure, or growth in cost and schedule, is often a normal part of the research process and may not be viewed in the same manner as MDAP performance. Rather, the benefit of the current study is the new understanding that arises from depicting the relationship between S&T program characteristics and their performance. Prior examinations of S&T programs are scarce. Thus, the possibilities for future research are vast. The exploratory analysis conducted here focused solely on AFRL programs. S&T programs in the other military services warrant examination. Additionally, one of the more surprising aspects of the data obtained from S&T programs was the reported TRL at various stages of the program’s life cycle. In order for a program to advance past Milestone B into the EMD phase, a program must have a TRL of 6 or greater. Further research into those S&T programs whose technology matured (TRL increased) could identify common characteristics, which indicates a higher probability of technological maturation. Lastly, future research should investigate the reasons or root causes behind the correlations found in this article. The aim of that research would be to expound upon the interpreta-tion of the data. The contribution from that research is important to arming leadership with the necessary information upon which to base decisions. The exploratory analysis provided here was just the first step of the journey. Through future research and discoveries, we can gain the knowledge needed to increase the odds of successful S&T programs.

444 Defense ARJ, October 2021, Vol. 28 No. 4 : 420–451
Exploring Performance in Air Force Science and Technology Programs https://www.dau.edu
Appendix ATRL Definitions, Descriptions, and Supporting Information
TRL Definition Description Supporting Information
1 Basic principles observed and reported.
Lowest level of technology readiness. Scientific research begins to be translated into applied research and development (R&D). Examples might include paper studies of a technology’s basic properties.
Published research that identifies the principles that underlie this technology. References to who, where, when.
2 Technology concept and/or application formulated.
Invention begins. Once basic principles are observed, practical applications can be invented. Applications are speculative, and there may be no proof or detailed analysis to support the assumptions. Examples are limited to analytic studies.
Publications or other references that outline the application being considered and that provide analysis to support the concept.
3 Analytical and experimental critical function and/or characteristic proof of concept.
Active R&D is initiated. This includes analytical studies and laboratory studies to physically validate the analytical predictions of separate elements of the technology. Examples include components that are not yet integrated or representative.
Results of laboratory tests performed to measure parameters of interest and comparison to analytical predictions for critical subsystems. References to who, where, and when these tests and comparisons were performed.
4 Component and/or breadboard validation in a laboratory environment.
Basic technological components are integrated to establish that they will work together. This is relatively “low fidelity” compared with the eventual system. Examples include integration of “ad hoc” hardware in the laboratory.
System concepts that have been considered and results from testing laboratory scale breadboard(s). References to who did this work and when. Provide an estimate of how breadboard hardware and test results differ from the expected system goals.
5 Component and/or breadboard validation in a relevant environment.
Fidelity of breadboard technology increases significantly. The basic technological components are integrated with reasonably realistic supporting elements so they can be tested in a simulated environment. Examples include “high-fidelity” laboratory integration of components.
Results from testing laboratory breadboard system are integrated with other supporting elements in a simulated operational environment. How does the “relevant environment” differ from the expected operational environment? How do the test results compare with expectations? What problems, if any, were encountered? Was the breadboard system refined to more nearly match the expected system goals?

445Defense ARJ, October 2021, Vol. 28 No. 4 : 420–451
October 2021
TRL Definition Description Supporting Information
6 System/subsystem model or prototype demonstration in a relevant environment.
Representative model or prototype system, which is well beyond that of TRL 5, is tested in a relevant environment. Represents a major step up in a technology’s demonstrated readiness. Examples include testing a prototype in a high-fidelity laboratory environment or in a simulated operational environment.
Results from laboratory testing of a prototype system that is near the desired configuration in terms of performance, weight, and volume. How did the test environment differ from the operational environment? Who performed the tests? How did the test compare with expectations? What problems, if any, were encountered? What are/were the plans, options, or actions to resolve problems before moving to the next level?
7 System prototype demonstration in an operational environment.
Prototype near or at planned operational system. Represents a major step up from TRL 6 by requiring demonstration of an actual system prototype in an operational environment (e.g., in an aircraft, in a vehicle, or in space).
Results from testing a prototype system in an operational environment. Who performed the tests? How did the test compare with expectations? What problems, if any, were encountered? What are/were the plans, options, or actions to resolve problems before moving to the next level?
8 Actual system completed and qualified through test and demonstration.
Technology has been proven to work in its final form and under expected conditions. In almost all cases, this TRL represents the end of true system development. Examples include developmental test and evaluation (DT&E) of the system in its intended weapon system to determine if it meets design specifications.
Results of testing the system in its final configuration under the expected range of environmental conditions in which it will be expected to operate. Assessment of whether it will meet its operational requirements. What problems, if any, were encountered? What are/were the plans, options, or actions to resolve problems before finalizing the design?
9 Actual system proven through successful mission operations.
Actual application of the technology in its final form and under mission conditions, such as those encountered in operational test and evaluation (OT&E). Examples include using the system under operational mission conditions.
Note. Adapted from DoD (2011).
446 Defense ARJ, October 2021, Vol. 28 No. 4 : 420–451
Exploring Performance in Air Force Science and Technology Programs https://www.dau.edu
Appendix BSample Research Summary Report
447Defense ARJ, October 2021, Vol. 28 No. 4 : 420–451
October 2021
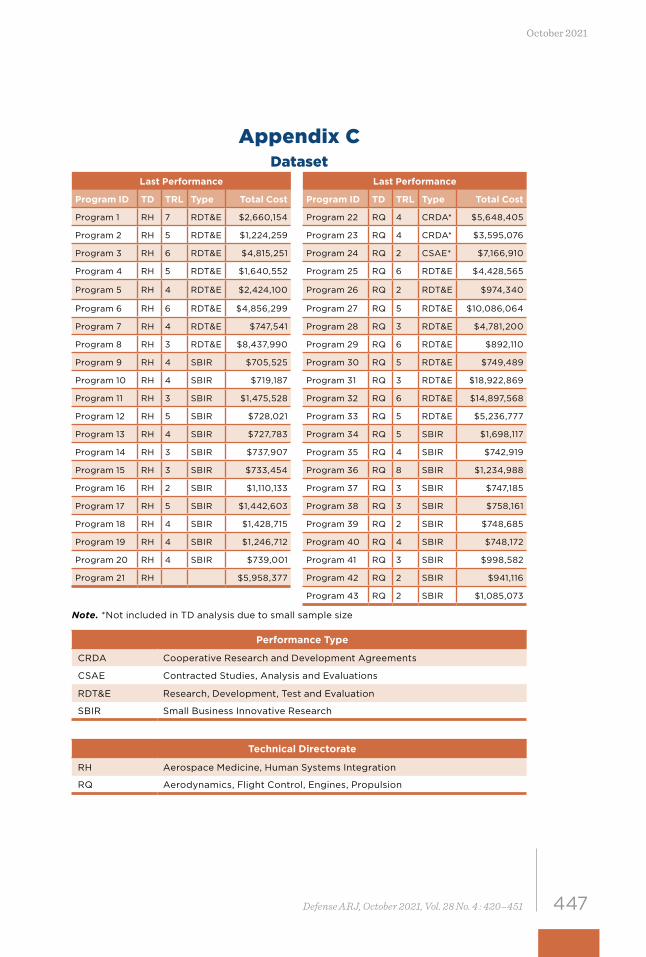
Appendix CDataset
Last Performance Last Performance
Program ID TD TRL Type Total Cost Program ID TD TRL Type Total Cost
Program 1 RH 7 RDT&E $2,660,154 Program 22 RQ 4 CRDA* $5,648,405
Program 2 RH 5 RDT&E $1,224,259 Program 23 RQ 4 CRDA* $3,595,076
Program 3 RH 6 RDT&E $4,815,251 Program 24 RQ 2 CSAE* $7,166,910
Program 4 RH 5 RDT&E $1,640,552 Program 25 RQ 6 RDT&E $4,428,565
Program 5 RH 4 RDT&E $2,424,100 Program 26 RQ 2 RDT&E $974,340
Program 6 RH 6 RDT&E $4,856,299 Program 27 RQ 5 RDT&E $10,086,064
Program 7 RH 4 RDT&E $747,541 Program 28 RQ 3 RDT&E $4,781,200
Program 8 RH 3 RDT&E $8,437,990 Program 29 RQ 6 RDT&E $892,110
Program 9 RH 4 SBIR $705,525 Program 30 RQ 5 RDT&E $749,489
Program 10 RH 4 SBIR $719,187 Program 31 RQ 3 RDT&E $18,922,869
Program 11 RH 3 SBIR $1,475,528 Program 32 RQ 6 RDT&E $14,897,568
Program 12 RH 5 SBIR $728,021 Program 33 RQ 5 RDT&E $5,236,777
Program 13 RH 4 SBIR $727,783 Program 34 RQ 5 SBIR $1,698,117
Program 14 RH 3 SBIR $737,907 Program 35 RQ 4 SBIR $742,919
Program 15 RH 3 SBIR $733,454 Program 36 RQ 8 SBIR $1,234,988
Program 16 RH 2 SBIR $1,110,133 Program 37 RQ 3 SBIR $747,185
Program 17 RH 5 SBIR $1,442,603 Program 38 RQ 3 SBIR $758,161
Program 18 RH 4 SBIR $1,428,715 Program 39 RQ 2 SBIR $748,685
Program 19 RH 4 SBIR $1,246,712 Program 40 RQ 4 SBIR $748,172
Program 20 RH 4 SBIR $739,001 Program 41 RQ 3 SBIR $998,582
Program 21 RH $5,958,377 Program 42 RQ 2 SBIR $941,116
Program 43 RQ 2 SBIR $1,085,073
Note. *Not included in TD analysis due to small sample size
Performance Type
CRDA Cooperative Research and Development Agreements
CSAE Contracted Studies, Analysis and Evaluations
RDT&E Research, Development, Test and Evaluation
SBIR Small Business Innovative Research
Technical Directorate
RH Aerospace Medicine, Human Systems Integration
RQ Aerodynamics, Flight Control, Engines, Propulsion
448 Defense ARJ, October 2021, Vol. 28 No. 4 : 420–451
Exploring Performance in Air Force Science and Technology Programs https://www.dau.edu
ReferencesBolten, J. G., Leonard, R. S., Arena, M. V., Yeinossi, O., & Sollinger, J. M. (2008).
Sources of weapon system cost growth: Analysis of 35 major defense acquisition programs (Report No. MG-670). RAND. https://doi.org/10.7249/MG670
Cancian, M. F. (2010). Cost growth: Perception and reality. Defense Acquisition Research Journal, 17(3), 389–404. https://www.dau.edu/library/arj/ARJ/arj55/Cancian_55.pdf
Department of Defense. (2009). Technology readiness assessment (TRA) deskbook. Office of the Director, Defense Research and Engineering. https://www.skatelescope.org/public/2011-11-18_WBS-SOW_Development_Reference_Documents/DoD_TRA_July_2009_Read_Version.pdf
Department of Defense. (2011). Technology readiness assessment (TRA) guidance. Office of the Assistant Secretary of Defense for Research and Engineering. https://apps.dtic.mil/dtic/tr/fulltext/u2/a554900.pdf
Dubos, G., Saleh, J., & Braun, R. (2008). Technology readiness level, schedule risk, and slippage in spacecraft design. Journal of Spacecraft and Rockets, 45(4), 836–842. https://doi.org/10.2514/1.34947
Duffner, R. (2000). Science and technology: The making of the Air Force Research Laboratory. Air University Press. https://www.airuniversity.af.edu/Portals/10/AUPress/Books/B_0077_DUFFNER_SCIENCE_TECHNOLOGY.pdf
General Accounting Office. (1999). Best practices: Better management of technology development can improve weapon systems outcomes (Report No. GAO/NSIAD-99-162). https://www.gao.gov/products/NSIAD-99-162
Gorn, Michael H. (1988). Harnessing the genie: Science and technological forecasting and the Air Force 1944–1986. Office of Air Force History. https://media.defense.gov/2010/May/26/2001330294/-1/-1/0/AFD-100526-038.pdf
Katz, D. R., Sarkani, S., Mazzuchi, T., & Conrow, E. H. (2015). The relationship of technology and design maturity to DoD weapon system cost change and schedule change during engineering and manufacturing development. Systems Engineering, 18(1), 1–15. https://doi.org/10.1111/sys.21281
Linick, J. (2017, June 6–9). Technology readiness level (TRL) vs. percent development cost [Paper presentation]. 2017 International Cost Estimating and Analysis Association Professional Development & Training Workshop, Portland, OR.
McClave, J. T., Benson, P. G., & Sincich, T. T. (2018). Statistics for business and economics (13th ed.). Pearson Publishing. https://www.pearson.com/us/higher-education/program/Mc-Clave-Statistics-for-Business-and-Economics-Plus-My-Lab-Statistics-with-Pearson-e-Text-24-Month-Access-Card-Package-13th-Edition/PGM1789505.html
McDonald, J. H. (2014). Handbook of biological statistics (3rd ed.). Sparky House Publishing. http://www.biostathandbook.com/
Mehta, C. R., & Patel, N. R. (1983). A network algorithm for performing Fisher’s Exact Test in r × c contingency tables. Journal of the American Statistical Association, 78(382), 427–434. https://doi.org/10.1080/01621459.1983.10477989
Meredith, J., & Mantel, S. (2003). Project management: A managerial approach. John Wiley. https://www.academia.edu/8973287/Project_Management_A_Managerial_Apprach_Jack_R_Meredith_and_Samuel_J_Mantel_Wiley_
Nasir, M. H. N., & Sahibuddin, S. (2011). Critical success factors for software projects: A comparative study. Scientific Research and Essays, 6(10), 2174–2186. https://doi.org/10.5897/SRE10.1171

449Defense ARJ, October 2021, Vol. 28 No. 4 : 420–451
October 2021
Office of the Chief Scientist of the U.S. Air Force. (2010). Technology horizons: A vision for Air Force science & technology during 2010–2030. https://www.airuniversity.af.edu/Portals/10/AUPress/Books/B_0126_TECHNOLOGYHORIZONS.pdf
Pinto, J. K., & Slevin, D. P. (1987). Critical factors in successful project implementation. IEEE Transactions on Engineering Management, 34(1), 22–27. https://doi.org/10.1109/TEM.1987.6498856
Pinto, J. K. & Slevin, D. P. (1998). Project success: Definitions and measurement techniques. Project Management Journal, 19(3), 67–73. https://www.pmi.org/learning/library/project-success-definitions-measurement-techniques-5460
Rendon, R. G. (2012). Defense procurement: An empirical analysis of critical success factors. In G. L. Albano, K. F. Snider, & K. V. Thai (Eds.), Charting a course in public procurement innovation and knowledge sharing (pp. 174–208). PrAcademics Press. https://publications.hse.ru/en/books/60442514
Rodriguez-Segura, E., Ortiz-Marcos, I., Romero, J. J., & Tafur-Segura, J. (2016). Critical success factors in large projects in the aerospace and defense sectors. Journal of Business Research, 69(11), 5419–5425. https://doi.org/10.1016/j.jbusres.2016.04.148
Sadin, S. R., Povinelli, F. P., & Rosen, R. (1989). The NASA technology push towards future space mission systems. Acta Astronautica, 20, 73–77. https://doi.org/10.1016/0094-5765(89)90054-4
Smirnoff, J. P., & Hicks, M. J. (2008). The impact of economic factors and acquisition reforms on the cost of defense weapon systems. Review of Financial Economics, 17(1), 3–13. https://doi.org/10.1016/j.rfe.2007.02.005
Smoker, R. E., & Smith, S. (2007). System cost growth associated with technology-readiness level. Journal of Parametrics, 26(1), 8–38. https://doi.org/10.1080/10157891.2007.10462276
Tishler, A., Dvir, D., Shenhar, A., & Lipovetsky, S. (1996). Identifying critical success factors in defense development projects: A multivariate analysis. Technological Forecasting and Social Change, 51(2), 151–171. https://doi.org/10.1016/0040-1625(95)00197-2
Tracy, S. P., & White, E. D. (2011). Estimating the final cost of a DoD acquisition contract. Journal of Public Procurement, 11(2), 190–205. https://doi.org/10.1108/JOPP-11-02-2011-B002
United States Air Force. (2019). Science and technology strategy: Strengthening USAF science and technology for 2030 and beyond. Office of the Secretary of the Air Force. https://www.af.mil/Portals/1/documents/2019%20SAF%20story%20attachments/Air%20Force%20Science%20and%20Technology%20Strategy.pdf
Zwikael, O., & Globerson, S. (2006). From critical success factors to critical success processes. International Journal of Production Research, 44(17), 3433–3449. https://doi.org/10.1080/00207540500536921
AcknowledgmentThis material is based upon work supported by the Acquisition Research
Program at the Naval Postgraduate School.

450 Defense ARJ, October 2021, Vol. 28 No. 4 : 420–451
Exploring Performance in Air Force Science and Technology Programs https://www.dau.edu
MSgt Eric A. Plack, USAFis an Operations and Support Cost Analyst at the Air Force Cost Analysis Agency (AFCA A). He received his BA in Mathematics and Statistics from Miami University and an MS in Cost Analysis from the Air Force Institute of Technology (AFIT). MSgt Plack is also a certified Professional Cost Estimator Analyst (PCEA).
(E-mail address: [email protected])
Author Biographies
Dr. Jonathan D. Ritschel is an Assistant Professor of Cost Analysis in the Department of Systems Engineering and Management at AFIT. He received his BBA in Accountancy from the University of Notre Dame, his MS in Cost Analysis from AFIT, and his PhD in Economics from George Mason University. Dr. Ritschel’s research interests include public choice, the effects of acquisition reforms on cost growth in DoD weapon systems, and economic institutional analysis.
(E-mail address: Jonathan.Ritschel@@afit.edu)
Dr. Edward D. White is a Professor of Statistics in the Department of Mathematics and Statistics at AFIT. He received his BS in Mathematics from the University of Tampa, MAS from The Ohio State University, and PhD in Statistics from Texas A&M University. His primary research interests include statistical modeling, simulation,
and data analytics.
(E-mail address: Edward.White@@afit.edu)

451Defense ARJ, October 2021, Vol. 28 No. 4 : 420–451
October 2021
Lt Col Clay M. Koschnick, USAF is a n A ssista nt Professor of Systems Eng ineering in the Depa r tment of Systems Eng ineering a nd Ma nagement at AFIT. Lt Col Koschnick holds a PhD in Industrial and Systems Engineering from the University of Florida, a BS in Operations Research from the United States Air Force Academy, and an MS in Operations Research from the Georgia Institute of Technolog y. His research interests include engineering economics, decision analysis, and econometrics.
(E-mail address: [email protected])
Lt Col Scott T. Drylie, USAF is an Assistant Professor of Cost Analysis in the Department of Systems Engineering and Management at AFIT. He received his BS in Economics from Montana State University, his MS in Cost Analysis from AFIT, and his PhD in Economics from George Mason University. His research interests include institutional economics, the economics of education, software costs, and
aircraft sustainment costs.
(E-mail address: [email protected])
The views expressed in this article are those of the author(s) alone and not of the Department of Defense. Reproduction or reposting of articles from Defense
Acquisition Research Journal should credit the author(s) and the journal.