Embed Size (px)
Citation preview

PDE Report No. 15-09, July 2015 Page i
Partnership for the Delaware Estuary
2015
Importance of Ribbed Mussels for Salt Marsh Climate Adaptation and Water Quality Management in Atlantic Estuaries Geospatial variation of ribbed mussel (Geukensia demissa) nutrient removal and vertical marsh building ecosystem services across the salt marsh landscape A technical report submitted to U.S. Environmental Protection Agency Atlantic Ecology Division and funded by the EPA Regional Applied Research Efforts (RARE) program.

PDE Report No. 15-09, July 2015 Page ii
Geospatial and seasonal variation in the capture, flux and fate of seston and associated
nitrogen by ribbed mussels (Geukensia demissa) in representative mid-Atlantic salt marshes.
Danielle Kreeger, Ph.D.
Joshua Moody
Partnership for the Delaware Estuary
110 South Poplar Street, Suite 202
Wilmington, DE 19801
Elizabeth Watson*
Marnita M. Chintala
U.S. EPA, Atlantic Ecology Division
27 Tarzwell Dr.
Naragansett, RI 02882
*(current) Department of Biodiversity, Earth and Environmental Science; Academy of Natural Sciences of
Drexel University; 1900 Ben Franklin Parkway, Philadelphia, PA 19103
Acknowledgments: Numerous staff and students at the Partnership for the Delaware Estuary and EPA ORD assisted with field and laboratory research, especially Angela Padeletti, Kurt Cheng, Jessie Buckner, LeeAnn Haaf, and Mary Casella. We are deeply grateful to Irene Purdy and Kathleen Drake at EPA Region II, and Suzanne Ayvazian at AED for their support of this work via Regional Applied Research Effort Grant Number 83523301. Suggested citation: Kreeger, D., J. Moody, E. Watson and M. Chintala . 2015. Geospatial and seasonal variation in the capture, flux and fate of seston and associated nitrogen by ribbed mussels (Geukensia demissa) in representative mid-Atlantic salt marshes. Partnership for the Delaware Estuary, Wilmington, DE. PDE Report No. 15-09. 135 p.

PDE Report No. 15-09, July 2015 Page iii
Contents
List of Figures .......................................................................................................................................................................... vii List of Tables ............................................................................................................................................................................... x
EXECUTIVE SUMMARY ......................................................................................................................................................... 1 INTRODUCTION ....................................................................................................................................................................... 4
Salt Marshes ............................................................................................................................................................................... 6
Importance of Salt Marshes ...................................................................................................................................................... 6 Status and Trends of the Delaware Estuary’s Salt Marshes ........................................................................................ 6 Mid-Atlantic Salt Marshes ......................................................................................................................................................... 7 Salt Marsh Ecosystem Services ............................................................................................................................................... 8 Impacts of Sea Level Rise on Mid-Atlantic Salt Marshes .............................................................................................. 9
Ribbed Mussels ....................................................................................................................................................................... 10
Ecology of the Ribbed Mussel (Geukensia demissa) ..................................................................................................... 10 The Ribbed Mussel and Salt Marsh Accretion ................................................................................................................ 11 The Ribbed Mussel and Nitrogen Cycling ......................................................................................................................... 12 Spatial Variation of Ribbed Mussels in Salt Marshes ................................................................................................... 13
Study Approach ...................................................................................................................................................................... 14
Task 1. Physiological Rate Functions of Ribbed Mussels ........................................................................................... 14 Task 2. Spatial Distribution of Ribbed Mussels Across the Marsh Platform ...................................................... 15 Task 3. Geospatial Variation in Physical and Biological Traits of Study Marshes............................................ 16 Task 4. Analysis of Correlations Between Ribbed Mussels and Marsh Processes ........................................... 16
METHODS ................................................................................................................................................................................. 17
Study Site Locations ............................................................................................................................................................. 17
Salt Marshes .................................................................................................................................................................................. 17 Habitats ........................................................................................................................................................................................... 17 Site Position .................................................................................................................................................................................. 17 Transect Placement ................................................................................................................................................................... 29 Study Plot Placement ................................................................................................................................................................ 30
Field Data Collection and Processing ............................................................................................................................ 31
Ribbed Mussel Lip Counts ....................................................................................................................................................... 31 Ribbed Mussel Density and Size Demographics Excavation..................................................................................... 31 Estimation of Ribbed Mussel Biomass in Field Plots ................................................................................................... 32 Aboveground Biomass .............................................................................................................................................................. 33 Belowground Biomass .............................................................................................................................................................. 33 Plant and Soil Nitrogen............................................................................................................................................................. 34 Porewater and Nutrient Analysis ........................................................................................................................................ 34

PDE Report No. 15-09, July 2015 Page iv
Horizontal Vegetation Obstruction ..................................................................................................................................... 34 Accretion Above Feldspar Marker Horizon ..................................................................................................................... 35 Real-Time Kinematic Elevation Surveys ........................................................................................................................... 35 Site-Wide Habitat Delineation ............................................................................................................................................... 35
Physiological Data Collection and Processing ........................................................................................................... 36
Water Collection for Seston Analysis and Bivalve Feeding ....................................................................................... 36 Collection of Seston for Particle Counting ........................................................................................................................ 37 Physiological Rate Experiments with Ribbed Mussels ............................................................................................... 37 Clearance and Filtration Rates .............................................................................................................................................. 38 Allometric Scaling of Physiological Rates ......................................................................................................................... 39 Mussel Defecation Collection and Analysis ...................................................................................................................... 39 Porewater and Nutrient Analysis ....................................................................................................................................... 40 Ribbed Mussel Body Metrics .................................................................................................................................................. 40 Assessment of Nitrogen Removal From Feeding Experiment ................................................................................. 40
Statistical Analysis ................................................................................................................................................................ 41
RESULTS: SEASONAL SESTON AND MUSSEL PHYSIOLOGY ................................................................................ 42
Seasonal Seston Analyses ................................................................................................................................................... 42
Total Suspended Solids (TSS) ................................................................................................................................................ 42 Total Suspended Solid Percent Organics .......................................................................................................................... 42 Total Suspended Solid Particulate Nitrogen ................................................................................................................... 42 Total Suspended Solid Carbon to Nitrogen Ratio .......................................................................................................... 44
Seasonal Mussel Physiology Experiments................................................................................................................... 44
Ribbed Mussel Shell Length ................................................................................................................................................... 44 Ribbed Mussel Dry Tissue Weight ....................................................................................................................................... 47 Ribbed Mussel Clearance Rates ............................................................................................................................................ 47 Clearance Rate by Marsh and Habitat ................................................................................................................................ 47 Clearance Rate by Season ........................................................................................................................................................ 47
Filtration Rates ....................................................................................................................................................................... 48
Filtration Rate by Marsh and Habitat ................................................................................................................................. 48 Filtration Rate by Season......................................................................................................................................................... 51 Filtration Rate Factor Interactions ...................................................................................................................................... 51 Defecation Rates ......................................................................................................................................................................... 52 Fecal Nitrogen .............................................................................................................................................................................. 54 Excretion Rates ............................................................................................................................................................................ 56 Ribbed Mussel Nitrogen Balance ......................................................................................................................................... 56
RESULTS: FIELD MONITORING AND SITE CHARACTERIZATION .................................................................... 59
Ribbed Mussel Metrics ........................................................................................................................................................ 59
PDE Report No. 15-09, July 2015 Page v
Ribbed Mussel Lip Counts by Marsh and Habitat ......................................................................................................... 59 Ribbed Mussel Shell Lengths by Marsh and Habitat .................................................................................................... 60 Ribbed Mussel Biomass by Marsh and Habitat .............................................................................................................. 60
Vegetation Metrics ................................................................................................................................................................ 62
Total Aboveground Biomass .................................................................................................................................................. 62 Live Belowground Biomass .................................................................................................................................................... 62 Total Belowground Biomass .................................................................................................................................................. 65 Aboveground to Belowground Biomass Ratio ............................................................................................................... 65 Aboveground Plant Nitrogen ................................................................................................................................................. 65 Aboveground Plant Carbon to Nitrogen Ratio ................................................................................................................ 67 Live Plant Root Nitrogen ......................................................................................................................................................... 67 Live Root Carbon to Nitrogen ratio ..................................................................................................................................... 69 Dead Root Nitrogen ................................................................................................................................................................... 69 Dead root N did not differ among marshes of NJ, but significant differences were measured between
all NJ marshes and RI. Dividing Creek dead root N was lowest in the high marsh and statistically similar in creeks and along the river, while no difference between habitats was observed in Dennis Creek and Maurice River. RI dead root N was lowest in the high marsh and highest along rivers (Fig 59). ................................................................................................................................................................... 69
Dead Root Carbon to Nitrogen Ratio .................................................................................................................................. 69 Dead root C:N did not differ among marshes. Dividing Creek dead root C:N was highest in the high
marsh and lowest along the river edge. In Dennis Creek, there was no difference in measurements between the high marsh and the river edge, but the observed creek values were significantly lower. Similar to Dividing Creek, RI high marshes had the greatest measured values, but statistical difference was detected between the creeks and river habitats. No inter-marsh differences were measured across habitats in the Maurice River (Fig 60). ............................................. 69
Soil Carbon to Nitrogen Ratio ................................................................................................................................................ 71 Accretion Above Feldspar Marker Horizons ................................................................................................................... 71
Elevation Metrics ................................................................................................................................................................... 74
Elevation by Habitat and Marsh ........................................................................................................................................... 74
RESULTS: EXPLORATORY RELATIONSHIPS ............................................................................................................. 74
Relationships between Ribbed Mussel Biomass and Marsh Processes .......................................................... 74
Mussel Biomass and Live Belowground Biomass ......................................................................................................... 75 Mussel Biomass and Dead Belowground Biomass ....................................................................................................... 75 Mussel Biomass and Total Belowground Biomass ....................................................................................................... 75 Mussel Biomass and Aboveground Biomass ................................................................................................................... 77 Mussel Biomass and Aboveground to Belowground Biomass Ratio ..................................................................... 77 Mussel Biomass and Soil Nitrogen ...................................................................................................................................... 77 Mussel Biomass and Soil Carbon to Nitrogen Ratio ..................................................................................................... 77 Mussel Biomass and Root Nitrogen .................................................................................................................................... 77 Mussel Biomass and Root Carbon to Nitrogen Ratio ................................................................................................... 78 Mussel Biomass and Plant Nitrogen ................................................................................................................................... 78 Mussel Biomass and Plant Carbon to Nitrogen Ratio .................................................................................................. 78

PDE Report No. 15-09, July 2015 Page vi
Mussel Biomass and Accretion Above Feldspar Marker Horizons ........................................................................ 78
Other Relationships .............................................................................................................................................................. 79
Accretion Rates and Elevation .............................................................................................................................................. 79 Ribbed Mussels and Elevation............................................................................................................................................... 79 Lateral Marsh Movement, TSS Particulate Nitrogen, Ribbed Mussels, and Elevation ................................... 79
RESULTS: GEOSPATIAL PATTERNS AND ECOSYSTEM SERVICE MAPS ........................................................ 80
Spatial Distribution of Habitat Within Marshes ........................................................................................................ 80 Geospatial Patterns of Mussel Density (g m-2) Among and Within Marshes ................................................ 81 Spatial Distribution of Ecosystem Services within and among Marshes ........................................................ 83
DISCUSSION ............................................................................................................................................................................. 85 LITERATURE CITED ............................................................................................................................................................. 91 APPENDIX A: BIOMASS AND NUTRIENT DEPTH PLOTS BY MARSH AND HABITAT ............................... 97 APPENDIX B: MUSSEL BIOMASS REGRESSION PLOTS ....................................................................................... 103 APPENDIX C: ESTIMATED FILTRATION OF TOTAL SUSPENDED SOLIDS (TSS) AND PARTICULATE
NITROGEN BY RIBBED MUSSELS IN DIFFERENT MARSHES AND HABITATS ............................... 115 APPENDIX D: MAPS OF HABITAT AREA, MUSSEL DEMOGRAPHICS AND ECOSYSTEM SERVICES . 122

PDE Report No. 15-09, July 2015 Page vii
List of Figures
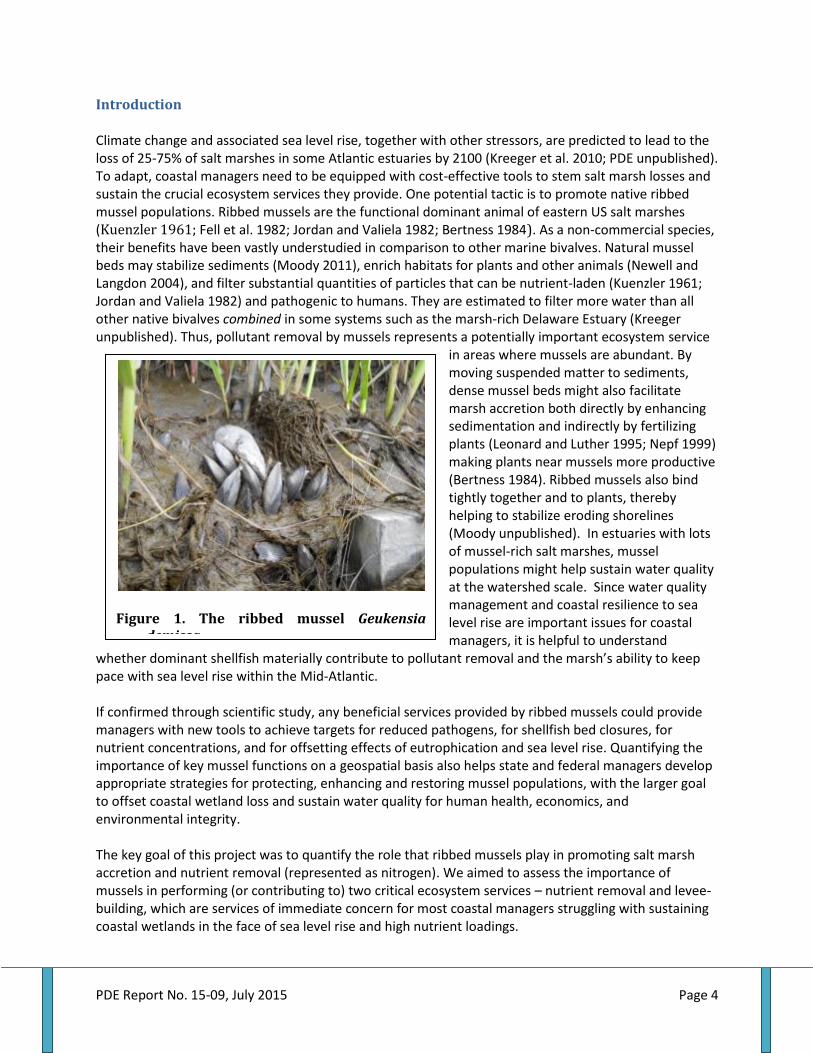
Figure 1. The ribbed mussel Geukensia demissa........................................................................................4 Figure 2. Projected future changes in sea level in the Delaware Estuary......................................7 Figure 3. Ribbed mussels along vegetated edges of low intertidal creek banks.......................15 Figure 4. Landscape view of study locations in New Jersey and Rhode Island..........................16 Figure 5. Dennis Creek site locations.............................................................................................................18 Figure 6. Dividing Creek site locations.......................................................................................................... 18 Figure 7. Maurice River site locations...........................................................................................................18 Figure 8. Rhode Island site locations.............................................................................................................19 Figure 9. Dennis Creek site 1 plot locations................................................................................................20 Figure 10. Dennis Creek site 2 plot locations.............................................................................................21 Figure 11. Dennis Creek site 3 plot locations.............................................................................................22 Figure 12. Dividing Creek site 1 plot locations..........................................................................................22 Figure 13. Dividing Creek site 2 plot locations..........................................................................................23 Figure 14. Dividing Creek site 3 plot locations..........................................................................................23 Figure 15. Maurice River site 1 plot locations............................................................................................24 Figure 16. Maurice River site 2 plot locations............................................................................................25 Figure 17. Maurice River site 3 plot locations.............................................................................................26 Figure 18. Rhode Island site 1 plot locations...............................................................................................27 Figure 19. Rhode Island site 2 plot locations...............................................................................................28 Figure 20. Rhode Island site 3 plot locations...............................................................................................29 Figure 21. Schematic of sampling plot layout along transects.............................................................30 Figure 22. Example of regression of ribbed mussel dry tissue weight by shell length .............32 Figure 23. A series of beakers containing river water used in experiments..................................38 Figure 24. Vacuum filtration manifold............................................................................................................39 Figure 25. Structure of nested linear mixed effect model used for analysis....................................41 Figure 26. Total suspended solids (TSS)(mg/L) by marsh and season..............................................42 Figure 27. TSS percent organics by marsh and season. .......................................................................... 43 Figure 28. TSS particulate nitrogen concentration by marsh and season.........................................44 Figure 29. TSS carbon to nitrogen ratio by marsh and season. ........................................................... 45 Figure 30. Ribbed mussel shell length by habitat within each marsh.............................................. 45 Figure 31. Ribbed mussel dry tissue weight by habitat within each marsh.................................... 46 Figure 32. Ribbed mussel clearance rate by habitat within each marsh........................................... 46 Figure 33. Ribbed mussel clearance rate seasonally by marsh........................................................... 49 Figure 34. Ribbed mussel filtration rate by marsh seasonally............................................................. 49 Figure 35. Ribbed mussel filtration rate by marsh and habitat............................................................. 50 Figure 36. Ribbed mussel clearance rate by habitat seasonally.......................................................... .50 Figure 37. Ribbed mussel filtration rate by habitat and season.......................................................... 51 Figure 38. Ribbed mussel filtration rate within each marsh by habitat and season.....................52 Figure 39. Ribbed mussel defecation rate by marsh and season...........................................................53 Figure 40. Ribbed mussel defecation rate by marsh and habitat...........................................................53 Figure 41. Ribbed mussel nitrogen defecation rate by marsh by season..........................................55 Figure 42. Ribbed mussel nitrogen defecation rate by marsh by habitat...........................................55 Figure 43. Ribbed mussel ammonia excretion rate by marsh by season............................................56 Figure 44. Ribbed mussel ammonia excretion rate by marsh and habitat........................................57 Figure 45. Ribbed mussel nitrogen ingestion rate by marsh by season.............................................. 58 Figure 46. Ribbed mussel ingestion rate by marsh and habitat.............................................................58 Figure 47. Ribbed mussel field lip counts by marsh and habitat............................................................59

PDE Report No. 15-09, July 2015 Page viii
Figure 48. Ribbed mussel shell length by marsh and habitat........................................................................61 Figure 49. Ribbed mussel biomass by marsh and habitat...............................................................................61 Figure 50. Total aboveground biomass by marsh and habitat......................................................................62 Figure 51. Live belowground biomass by marsh and habitat........................................................................63 Figure 52. Dead belowground biomass by marsh and habitat......................................................................64 Figure 53. Total belowground biomass by marsh and habitat......................................................................65 Figure 54. Aboveground and belowground biomass ratio by marsh and habitat................................66 Figure 55. Aboveground plant nitrogen by marsh and habitat.....................................................................66 Figure 56. Aboveground plant carbon to nitrogen ratio by marsh and habitat..................................... 68 Figure 57. Live root nitrogen by marsh and habitat..........................................................................................68 Figure 58. Live root carbon to nitrogen ratio by marsh and habitat..........................................................69 Figure 59. Dead root nitrogen by marsh and habitat.........................................................................................70 Figure 60. Dead root carbon to nitrogen ratio by marsh and habitat.........................................................70 Figure 61. Soil nitrogen by marsh and habitat......................................................................................................71 Figure 62. Soil carbon to nitrogen ratio by marsh and habitat......................................................................72 Figure 63. Accretion above feldspar marker horizons by marsh and habitat.........................................73 Figure 64. Elevation by marsh and habitat.............................................................................................................73 Figure 65. Accretion rate by elevation within and among marshes by habitat……………………….... 78 Figure A1. Belowground biomass at varying depth by marsh and habitat…………………………….....97 Figure A2. Soil nitrogen levels at varying depths by marsh and habitat...................................................98 Figure A3. Soil carbon to nitrogen ratios at varying depths by marsh and habitat..............................99 Figure A4. Root nitrogen levels at varying depths by marsh and habitat...............................................100 Figure A5. Root carbon to nitrogen ratios at varying depths by marsh and habitat..........................101 Figure A6. Porewater nutrient levels at varying depths by marsh and habitat....................................102 Figure B1. Relationship between ribbed mussel biomass and live belowground biomass......... .103 Figure B2. Relationship between ribbed mussel biomass and dead belowground biomass....... 104 Figure B3. Relationship between ribbed mussel biomass and total belowground biomass....... .105 Figure B4. Relationship between ribbed mussel biomass and aboveground biomass................... 106 Figure B5. Relationship between ribbed mussel biomass and AGB:BGB ratio.....................................107 Figure B6. Relationship between ribbed mussel biomass and soil nitrogen.........................................108 Figure B7. Relationship between ribbed mussel biomass and soil carbon to nitrogen ratios.... 109 Figure B8. Relationship between ribbed mussel biomass and root nitrogen...................................... 110 Figure B9. Relationship between ribbed mussel biomass and root carbon to nitrogen ratios.......111 Figure B10. Relationship between ribbed mussel biomass and plant nitrogen................................... 112 Figure B11. Relationship between ribbed mussel biomass and plant carbon to nitrogen ratio... 113 Figure B12. Relationship between ribbed mussel biomass and accretion rate................................... 114 Figure D1. Distribution of habitats, mussel, and ecosystem services for Dividing Creek site 1.... 123 Figure D2. Distribution of habitats, mussel, and ecosystem services for Dividing Creek site 2.... 123 Figure D3. Distribution of habitats, mussel, and ecosystem services for Dividing Creek site 3.... 123 Figure D4. Distribution of habitats, mussel, and ecosystem services for Dennis Creek site 1....... 123 Figure D5. Distribution of habitats, mussel, and ecosystem services for Dennis Creek site 2....... 123 Figure D6. Distribution of habitats, mussel, and ecosystem services for Dennis Creek site 3....... 123 Figure D7. Distribution of habitats, mussel, and ecosystem services for Maurice River site 1..... 123 Figure D8. Distribution of habitats, mussel, and ecosystem services for Maurice River site 2.......123 Figure D9. Distribution of habitats, mussel, and ecosystem services for Maurice River site3...... 123 Figure D10. Distribution of habitats, mussel, and ecosystem services for Rhode Island site 1.......123 Figure D11. Distribution of habitats, mussel, and ecosystem services for Rhode Island site 2..... 123

PDE Report No. 15-09, July 2015 Page ix
Figure D12. Distribution of habitats, mussel, and ecosystem services for Rhode Island site 3...... 123

PDE Report No. 15-09, July 2015 Page x
List of Tables
Table 1 . Metrics collected within quadrats forming each study plot............................................................... 31 Table 2. Mussel dry tissue weight regressed by shell length per habitat within marshes.....................33 Table 3. Total suspended solids, percent organics, seston nitrogen and C:N by marsh and season...43 Table 4. Ribbed mussel shell length and dry tissue weight by marsh, habitat and overall....................44 Table 5. Ribbed mussel clearance, TSS filtration and N filtration rate by marsh and season................48 Table 6. Ribbed mussel defecation rate and fecal nutrient by marsh and season......................................54 Table 7. Ingestion, excretion, defecation and net absorption rate of nitrogen by ribbed mussels......59 Table 8. Ribbed mussels, aboveground biomass, belowground biomass and AGB:BGB ratio.............63 Table 9. Plant and soil nitrogen by marsh and habitat............................................................................................67 Table 10. Accretion rate and elevation by marsh and habitat.............................................................................74 Table 11. Relationships between ribbed mussel biomass density and various marsh features...........76 Table 12. Ribbed mussel biomass, marsh erosion and elevation, and seston metrics by marsh....... 80 Table 13. Habitat area percentages by marsh.............................................................................................................81 Table 14. Ribbed mussel biomass distribution among habitat types within marshes............................ .83 Table 15. Area wide ercosystem services and habitat percentages by habitat............................................83 Table 16. Habitat areas, mussel biomass, and ecosystem services by habitat and region......................84

PDE Report No. 15-09, July 2015 Page 1
Executive Summary
Natural infrastructure is increasingly being valued for the ecosystem services that it provides to society. For example, shellfish reefs and coastal wetlands help to filter pollutants, sequester carbon, and buffer coastlines from storms, as well as supporting habitat for fish, shellfish and wildlife species needed for fisheries and ecotourism. The goal of this study was to quantify spatial and seasonal variation in key ecosystem services furnished by a functional dominant bivalve mollusk living within eastern USA salt marshes. Filtration rates of natural suspended material (seston) by the ribbed mussel, Geukensia demissa, were quantified seasonally and extrapolated to mussel population demographics in different habitat types and areas within three study marshes in New Jersey and one marsh system in Rhode Island. Nitrogen (N) removal rates were similarly estimated by assessing the N content of seston. Defecation and excretion rates of mussels, including the N contents of excreta, were measured to determine the fate of filtered matter and contribution of mussels to biodeposition and remineralization processes, respectively. Finally, a variety of wetland assessment tools and tactics were used to characterize the various field plots to explore whether and how salt marsh condition varies with mussel density. Ribbed mussels were estimated to filter between 41 and 237 metric tons of suspended matter per hectare per year in the four studied salt marsh systems, averaging 92.6 tons ha-1 y-1 overall. Since most filtered material gets transferred to the sediment surface as feces (and pseudofeces), representative populations of ribbed mussels in New Jersey and Rhode Island therefore mediated a sizeable transfer of material from the water column to the benthos (a.k.a. pelagic-benthic coupling). Averaged among all sites, 55.6 tons of feces were biodeposited per hectare per year. Much of this defecated matter is likely to be either resuspended by currents or reworked by benthic organisms and microbes; however, some portion is thought to get buried. As evidence for this burial, nutrient contents in belowground and aboveground vegetation were correlated with mussel density. If mussel feces were not broken down or resuspended and were displaced evenly across the marsh surface, they would contribute 5.6 mm y-1 to surface accretion rates. Since marsh accretion rates are a critical component of whether salt marshes keep pace with rising sea levels, currently about 4 mm per year, mussel-mediated biodeposition processes have the potential to contribute to vertical resilience, referred to as “elevation capital”. More study is therefore warranted to examine “levee-building services” associated with active particle feeding by dominant suspension-feeders. The Delaware Estuary has high nutrient loadings and is more turbid compared to other large American estuaries, and water quality is a top concern for coastal managers in this system. For example, in this study the seston of Delaware Bay marshes was significantly more abundant and enriched in N compared to Rhode Island marshes. Any natural infrastructure that is capable of removing or transforming total suspended solids and associated nutrients should therefore be considered in modeling and managing water quality. In the four representative marsh systems studied here, ribbed mussel populations were estimated to remove an average of 476 kg particulate N per ha-1 y-1 (=2,593 lbs N ac-1 y-1). Approximately one third of the filtered N was returned to the waters as dissolved ammonia (remineralized), meaning that it was recycled in a form that could once again be taken up by microorganisms such as phytoplankton, benthic diatoms, microhetertrophs, and bacteria. However, the bulk of filtered N passed through the mussels and was defecated, thereby representing sizeable pelagic-benthic coupling as noted above. Biodeposits of feces amounted to 305 kg N ha-1 y-1. As found by other researchers (e.g. the work by Bertness), such biodeposits can serve as fertilizers for vascular plants, especially the dominant smooth cordgrass, Spartina alterniflora. The N content of both roots and

PDE Report No. 15-09, July 2015 Page 2
shoots of plants was positively correlated, and the C:N ratio negatively correlated, with ribbed mussel population biomass when examined with pooled data from all plots. Mass balance estimates of TSS and N removal rates were generally consistent among the four salt marsh systems, which were selected as being representative of prevailing conditions across the mid-Atlantic (i.e., they were not “pristine reference sites”). Hence, coastal managers can assume that the pooled means reported above are likely to be applicable to similar salt marshes where ribbed mussels are present. However, it is important to understand that the amount of TSS and N filtered by ribbed mussels depends on several factors, most notably the mussel population biomass and the amount of TSS and particulate N available in the water column. For example, habitats within the marsh platform that contained more mussels (e.g., tidal creeks in Delaware Bay, river edge in RI), had far greater estimated ecosystem services than areas with fewer mussels. Although Rhode Island marshes had greater mussel densities than in marshes of Delaware Bay, the net ecosystem service flows were not significantly different because TSS and N concentrations were lower in Rhode Island seston. Seasonality (temperature) is also a critical determinant of ribbed mussel physiological processes. Water clearance rates are generally nil in winter, moderate in spring and fall, and highest during peak growing conditions in summer. Any models of the water quality benefits of ribbed mussels (and other bivalve shellfish such as oysters) must therefore capture their seasonal physiology. Fortunately, the peak of mussel services generally coincides with the timing of water quality impairments, such as related to harmful blooms of pathogens and phytoplankton. Despite such variability, ribbed mussels clearly contribute to salt marsh resilience by helping to trap particles comprising a portion of surface accretion processes and by fueling primary production of vascular plants via enrichment of sediments from their biodeposits. As found in other studies, ribbed mussels can also bind tightly together and to plant roots, thereby helping to stem erosion. On the other hand, more study is needed to examine the possible negative effects of mussel-mediated fertilization because of recent studies that suggest that belowground plant production might be negatively affected in areas with high nutrient concentrations, potentially undermining organic matter accumulation rates and hence elevation capital. Marshes build elevation by both capturing suspended particles (allochthonous material) and sequestering biomass that is produced in situ (authochthonous production), and the relative importance of these components likely varies widely in space (e.g., along a eutrophication gradient) and time (storm events). The importance of mussel-mediated ecosystem services could therefore depend on context and be subject to thresholds, an important topic for future research. Taken together, our results demonstrate that ribbed mussels directly and indirectly contribute to the health and resilience of salt marshes through diverse physical, chemical and biological linkages with the vascular plant community. Ribbed mussels also can contribute substantially to the maintenance and enhancement of water quality in areas where mussels are abundant. A better understanding of the ecological importance of ribbed mussels to salt marsh health and climate resilience provides more support for efforts to preserve, restore and adapt these vitally important marsh habitats. Numerous tactics exist to promote bivalve shellfish, however, these tactics have rarely been applied to non-commercial native species such as the ribbed mussel, Geukensia demissa. Given the substantial ecosystem services contributed by ribbed mussels, protection and restoration strategies aimed at optimizing mussel population biomass should therefore be given greater consideration by managers and restoration practitioners who are focused on protecting water quality and coastal wetlands. Ribbed mussels are increasingly being studied for their nutrient bioextraction services, such as in designed aquaculture farms. In addition to this promising area of interest, our results suggest that managers

PDE Report No. 15-09, July 2015 Page 3
should (urgently) consider ways to stem the ongoing loss of the ecosystem services being furnished by natural populations. In the Delaware Estuary, current rates of coastal wetland loss are about an acre per day, which represents a daily decline of 6 pounds less N being removed by ribbed mussels living therein. History has shown that it is much more cost-effective to avert losses of natural infrastructure than to later try to replace lost ecosystem services by either natural infrastructure restoration or in mechanical water treatment plants. A variety of new tactics are emerging for stemming losses of coastal wetlands, such as various living shoreline methods, thin layer sediment enhancement, and hydrological repairs, for example. In such cases, we recommend that restoration practitioners consider ways to maximize ribbed mussel populations in the projects. Investments in marsh- and mussel-mediated ecosystem services could be justified by future savings in water quality treatment or flood protection for coastal communities.
PDE Report No. 15-09, July 2015 Page 4
Figure 1. The ribbed mussel Geukensia demissa.
Introduction
Climate change and associated sea level rise, together with other stressors, are predicted to lead to the loss of 25-75% of salt marshes in some Atlantic estuaries by 2100 (Kreeger et al. 2010; PDE unpublished). To adapt, coastal managers need to be equipped with cost-effective tools to stem salt marsh losses and sustain the crucial ecosystem services they provide. One potential tactic is to promote native ribbed mussel populations. Ribbed mussels are the functional dominant animal of eastern US salt marshes (Kuenzler 1961; Fell et al. 1982; Jordan and Valiela 1982; Bertness 1984). As a non-commercial species, their benefits have been vastly understudied in comparison to other marine bivalves. Natural mussel beds may stabilize sediments (Moody 2011), enrich habitats for plants and other animals (Newell and Langdon 2004), and filter substantial quantities of particles that can be nutrient-laden (Kuenzler 1961; Jordan and Valiela 1982) and pathogenic to humans. They are estimated to filter more water than all other native bivalves combined in some systems such as the marsh-rich Delaware Estuary (Kreeger unpublished). Thus, pollutant removal by mussels represents a potentially important ecosystem service
in areas where mussels are abundant. By moving suspended matter to sediments, dense mussel beds might also facilitate marsh accretion both directly by enhancing sedimentation and indirectly by fertilizing plants (Leonard and Luther 1995; Nepf 1999) making plants near mussels more productive (Bertness 1984). Ribbed mussels also bind tightly together and to plants, thereby helping to stabilize eroding shorelines (Moody unpublished). In estuaries with lots of mussel-rich salt marshes, mussel populations might help sustain water quality at the watershed scale. Since water quality management and coastal resilience to sea level rise are important issues for coastal managers, it is helpful to understand
whether dominant shellfish materially contribute to pollutant removal and the marsh’s ability to keep pace with sea level rise within the Mid-Atlantic. If confirmed through scientific study, any beneficial services provided by ribbed mussels could provide managers with new tools to achieve targets for reduced pathogens, for shellfish bed closures, for nutrient concentrations, and for offsetting effects of eutrophication and sea level rise. Quantifying the importance of key mussel functions on a geospatial basis also helps state and federal managers develop appropriate strategies for protecting, enhancing and restoring mussel populations, with the larger goal to offset coastal wetland loss and sustain water quality for human health, economics, and environmental integrity. The key goal of this project was to quantify the role that ribbed mussels play in promoting salt marsh accretion and nutrient removal (represented as nitrogen). We aimed to assess the importance of mussels in performing (or contributing to) two critical ecosystem services – nutrient removal and levee-building, which are services of immediate concern for most coastal managers struggling with sustaining coastal wetlands in the face of sea level rise and high nutrient loadings.

PDE Report No. 15-09, July 2015 Page 5
A better understanding of the ecological importance of ribbed mussels to salt marsh health and climate resilience also helps direct efforts to preserve, restore and adapt these vitally important habitats. Numerous tactics exist to promote bivalve shellfish, however, these tactics have rarely been applied to non-commercial native species such as the ribbed mussel, Geukensia demissa. Shellfish restoration efforts have historically focused on commercial species (e.g., oysters, clams) living in open bays rather than noncommercial species living in fringing habitats such as salt marshes. Given the ecological dominance and potential role of ribbed mussels, these restoration and climate resilience tactics could be extended to ribbed mussels and brought to bear on the mounting challenge of sustaining crucial salt marsh habitat, which is unrivaled in its stacked natural capital value. The suspected ecosystem services that are contributed by ribbed mussels are diverse. One ecosystem service, levee-building, is likely to be the result of the combined physical and biological actions associated with the mussel-plant assemblage, rather than ribbed mussels per se. Ribbed mussels are reported to live in mutualism with vascular plants, primarily smooth cordgrass, Spartina alterniflora (Bertness 1984; Bertness and Grosholz 1985). Plants provide an attachment surface for mussels, and they likely also provide a source of nutrition indirectly via the microbial loop that is supported by detritus derived from plants (Kreeger and Newell 2000). In return, mussels filter large quantities of suspended matter rich in nutrients, which are then biodeposited in feces and pseudofeces. These biodeposits serve as fertilizer for the marsh plants (Jordan and Valiela 1982). Marsh plants are therefore taller and denser where mussels are most dense (Bertness 1984). The denser vegetation facilitates greater passive sedimentation (McCaffrey and Thomson 1980; Bricker-Urso et al. 1989; Friedrichs and Perry 2001), and the mussels themselves may contribute actively to sedimentation by capturing and depositing particles since they feed indiscriminately on inorganic as well as organic suspended matter. Since much of this suspended matter is likely to be nutrient rich, especially in salt marshes with higher nutrient loadings, these processes may result in greater nutrient sequestration in marshes with more mussels. Mussels also bind tightly together and to the root mats of plants with their byssal threads, which may also have direct protective benefits to offset erosion (Moody 2011). An additional ecosystem service that was explored is whether ribbed mussels materially contribute to nutrient and total suspended solids removal, which could represent important contributions for sustaining water quality, especially in impaired tributaries. By furthering the understanding of biological sinks of nutrients and pathogens by ribbed mussels, managers may be able to utilize these services to remediate water quality strategically through mussel protection and population enhancement in critical areas. In addition, a better understanding of the importance of ribbed mussels for sustaining watershed-wide water quality will help managers plan for potential degradation associated with the loss of mussels via the erosion and drowning of salt marshes. In this study, we quantified nutrient removal and levee building benefits along gradients of mussel density in various representative salt marshes in NJ and RI. Although we have a basic understanding of ribbed mussel ecology and nutrition at the individual level, there is remarkably little knowledge about the ecological role that mussel populations play in overall marsh health, nutrient balance, or accretion. As a caveat, it is plausible that in some cases high mussel densities might in fact be counterproductive for marshes or the benefits of mussels might scale non-linearly with nutrient loadings or mussel density. Our experimental design was framed to deduce possible positive, neutral or negative relationships between mussel density and key processes that underpin marsh health and accretion. Our study also explored how these ecosystem services vary across the marsh platform since mussel density is patchy. Since marshes are at risk of drowning, this geospatial analysis of ecosystem services could help prioritize areas for conservation

PDE Report No. 15-09, July 2015 Page 6
Salt Marshes
Importance of Salt Marshes
Natural lands that are situated along estuarine coasts generally provide more benefits to people than any other habitat serving as natural buffers at the nexus between land and sea. Seaward-derived stressors are lessened for the land, and landward-derived stressors are lessoned for the sea. These coastal habitats include beaches, emergent marshes, shellfish reefs, submerged beds of aquatic vegetation, and forested swamps. Of these, tidal wetlands are the most productive habitat in the system, performing many vital services, especially in the wetland-rich Delaware Estuary. Tidal wetlands are critical to: protect inland areas from tidal and storm damage; provide water storage; protect against flooding; provide important habitat for a wide variety of wildlife, including waterfowl; filter contaminants and help sustain water quality; capture and sequester carbon; provide spawning and nursery habitat for commercial fisheries; support active and passive recreation; and provide aesthetic value. Many of the benefits conveyed by coastal marshes were witnessed during and after Hurricane Sandy, which caused tremendous damage to both built and natural infrastructure in the upper mid-Atlantic region in late October, 2012. For example, developments that were situated landward of coastal marshes appeared to suffer less damage than developments that were directly exposed to open water. Thousands of tons of marine debris and pollutants collected in these marshes, sparing other vital habitats and developments from the associated impacts. Although these protective benefits have yet to be quantitatively substantiated with scientific analyses, it is generally accepted that coastal wetlands convey resilience to coastal communities and economies.
Status and Trends of the Delaware Estuary’s Salt Marshes
Unfortunately, coastal wetlands continue to be degraded and lost in the Delaware Estuary and vicinity at an alarming rate, approximately one acre per day between 1996-2006 (PDE 2012). These losses are expected to increase and accelerate with climate change and sea-level rise (Kreeger et al. 2010). As tidal ranges and the estuary’s water volume increase in response to rising seas and other systemic alterations, the extent of tidal inundation along coastal areas will also increase. This will result in successional shifts in habitat types as tidal wetlands encroach into non-tidal wetlands and forests. However, this natural migration, or transgression, is impeded in many areas by anthropogenic interference such as development and attempts to secure fixed coastlines . Erosion is increasing along seaward margins of unprotected tidal wetlands, being apparent at >90% of rapidly assessed shoreline points. Taken together, the seaward loss and restricted landward gain leads to substantial net loss of coastal wetland acreage.

PDE Report No. 15-09, July 2015 Page 7
Figure 2. Projected future changes in sea level at different carbon emission scenarios (envelopes). The brown rectangle represent 6-8mm/year sea level rise range. A1F, A2, and B1 represent sea level rise under the highest, average and lowest emission scenarios calculated by PNAS. AR4 represent s the IPCC projected rates of sea level rise. http://www.pnas.org/content/106/51/21527.full.pdf
A conservative analysis of projected future acreage changes (PDE 2010) indicated that approximately two-thirds of the current tidal wetland acres in the Delaware Estuary will be lost at the seaward edge by 2100, which will be partially offset by a landward gain of approximately one-third of the current acreage (about 140,000 acres in 2006). The net loss to open water was predicted to be more than 40,000 acres (PDE 2010). Since this report was released, new, higher, projections for sea level rise suggest that this earlier marsh change analysis underestimated the likely loss of coastal wetlands in this system. Emerging literature suggests that many types of salt marshes, especially those with micro-tidal inundation conditions such as Barnegat Bay, cannot keep pace with rates of sea level rise greater than 6-8 millimeters per year. This may represent a tipping point for marshes prior to mid-century (Fig. 2).
Mid-Atlantic Salt Marshes
Salt marsh ecosystems are a hallmark feature of our coastal environments (Mitsch and Gosselink 1993). At the interface between the terrestrial and aquatic environments they act as natural filtration systems, removing watershed sourced nitrogen pollution (Nelson and Zavaleta 2012); buffer zones against storm hazards (Costanza et al 2008; Temmerman et al. 2012); breeding and juvenile refuges for many commercial and recreational fish species (Weinstein et al. 1984; Weinstein and O’Neil 1986); and important, specialized habitat for a myriad of local and transitory species (Werme 1981; Kneib 1994). Salt marshes also export dissolved and organic particulate matter to deeper water, known as the out

PDE Report No. 15-09, July 2015 Page 8
welling hypothesis (Odum 1968), contributing to the sub-tidal food web (Valiela et al. 1979; Dame 1986). Mid-Atlantic salt marshes are typically characterized by the native smooth cordgrass S. alterniflora; valuable for maintaining shoreline habitat (Warren et al. 2002). Tall form S. alterniflora is found along the mid-intertidal zone and levee at the marsh edge and in intra-marsh creek systems. In the high marsh, the vegetative community transitions to species more tolerant of dry, saline conditions including short form S. alterniflora, Spartina patens, Salicornia virginica, and Disticlis spicata (Kuenzler 1961; Bertness 1984). Salt marshes serve as habitat for many important resident invertebrates, such as bivalves (Geukensia demissa), crustaceans (Uca tangeri), gastropods (Melampus bidentatus), various nematodes and annelids, as well as vertebrates such as fish (Fundulus heteroclitus), turtles (Malaclemys terrapin), mammals (Ondatra zibethicus) and a large variety of birds (Ammodramus caudacutus, Agelaius phoeniceus). The organic matter of salt marsh producers serves as the basis for salt marsh and subtidal food webs, and although emergent vascular plants are the most conspicuous producers in a salt marsh, benthic algal production can also be high (Peterson et al. 1986; Currin et al. 1995; Deegan and Garritt 1997). Within the salt marsh, decomposing vascular plant material in the form of detritus supports a rich heterotrophic decomposer community of bacteria, protists, and fungi which can also be important sources of nutrition for benthic predators and scavengers. Primary production coupled with consumption creates intra-marsh carbon storage and capture of tidally derived nutrients which contribute to enhanced coastal water quality.
Salt Marsh Ecosystem Services
Ecosystem services have been defined as “the benefits human populations derive, directly or indirectly, from ecosystem functions” (Costanza et al. 1997). These services include regulation of large scale processes including climate, water, and food production, as well as localized services such as erosion control, nutrient cycling and soil and peat formation, and whose value has been estimated to be within the range of $16-54 trillion per year for the biosphere (Costanza et al. 1997; Daily et al. 1997; de Groot et al. 2002). The Millennium Wetland Assessment has cited wetlands as providing an array of ecosystem services including storm protection nutrient cycling, water quality, and carbon storage. The New Jersey Department of Environmental Protection Agency has estimated the average value of ecosystem services, many of them from wetlands, located along the Delaware Bay to be between $1,000-$12,000 per acre (Liu et al. 2010), greater than other natural habitats in the State. At the interface of the land and the water, salt marsh ecosystems provide a buffer to maritime storms and flooding. In a meta-analysis of studies examining the role of salt marshes in protecting terrestrial environments from maritime sourced damage, Shepard et al. (2011) found that vegetation density, biomass production, and marsh size were all positively correlated to wave attenuation and shoreline stabilization In addition, coastal vegetative communities have also been shown to decrease the likelihood and magnitude of property loss and injury due to coastal hazards in vulnerable communities (Arkema et al. 2013). In order for ecosystems to provide these services, a minimal amount of natural capital, or infrastructure, must exist (Turner and Pearce 1997; Costanza and Daly 1992). Besides flood protection, nutrient cycling is another primary function of coastal wetlands. Salt marsh halophytes act as nutrient sinks for nitrogen (Sousa et al. 2008) and phosphorous (Lillebo et al. 2004) in which the uptake of these nutrients removes them from the ecosystem (Ibanez et al. 2009). Land

PDE Report No. 15-09, July 2015 Page 9
sourced nutrient pollution from agriculture and other anthropogenic activities are a major source of these nutrients in coastal waters (Nixon et al.1986) as are groundwater-borne nutrients (Valiela et al. 1990). The Delaware Bay has some of the highest nutrient loadings in the U.S., as the nutrients travel from the land to the water, salt marshes are able to intercept them before they reach coastal environments. The retention of these nutrients within the salt marsh leads to reduced coastal eutrophication (Sousa et al. 2010) and enhanced water quality. The enhanced productivity from nitrogen uptake allows wetland plants to fix and sequester atmospheric carbon in the soil (Armentano and Meges 1986). Salt marsh peat soils have the largest carbon content of all soils (Bridgham et al. 2006) due to the fact that wetland net primary production is higher than any other terrestrial ecosystem (Amthor and Huston 1998; Keddy 2000) and decomposition is slow due to common anaerobic conditions present during inundation (Stevenson and Cole 1999; White and Reddy 2000). As primary production increases and salt marsh biomass grows, this leads to increasing deposition of dead organic matter to the salt marsh platform. Over time, the burial of this organic matter leads to carbon storage below the marsh platform. Although wetland soils make up a relatively small percentage of terrestrial soils, they are estimated to contain approximately 20-25% of terrestrial soil carbon (Amthor and Huston 1998).
Although salt marsh plants can help to sequester nitrogen, excess nitrogen availability may have longer term consequence in terms of salt marsh stability and health. Deegan et al. (2012) performed a nine year study investigating the results of removing nitrogen limitation stress from salt marshes and how this affected resource allocation in terms of belowground biomass (BGB) and aboveground biomass (AGB) production. They found that nutrient levels elevated to those considered being eutrophic increased AGB at the expense of BGB and also increased microbial decomposition. These results are important because they imply that salt marshes that are subjected to high nutrient loadings might be less resilient and incapable of keeping pace with sea level rise. In addition, the nitrogen uptake of salt marshes will be allocated to AGB which is not completely sequestered in the marsh platform, but partially returns to the system in the form of detritus. The increased microbial decomposition will further reduce the organic peat layer, lowering the elevation of the marsh platform. The combination of returning nitrogen to the system, lowering the elevation of the marsh, and decreasing the amount of structurally sound BGB may result in accelerated marsh deterioration as sea level rises and other physiological stressors increase. As marshes erode, drown and decompose, the outwelled peat and sediments may release large amounts of formerly buried nutrients and carbon, further complicating management of these compounds because of the combined effects of this initial loss paired with lost future nutrient and carbon capture services.
Impacts of Sea Level Rise on Mid-Atlantic Salt Marshes
Currently, global sea level is rising at the rate of approximately 3 mm yr-1 (IPCC 2001) and is expected to accelerate (Church and White 2006), and relative sea level rise rates in the Delaware Estuary are slightly higher (PDE, 2012). In 1962, Albert Redfield published a paper in which, using sediment cores, he determined that that Barnstable Marsh had kept pace with sea level rise for four millennia (Redfield 1962). Since that time, it has become clear most marshes will not be able to keep pace with projected increases in sea level rise unless external sediment supplies are made more available (Friedrichs and Perry 2001). Marshes build elevation by either capturing sediment delivered by tides or through accumulation of primary production products in situ. Recently, it has been suggested that many marshes have already lost the ability to maintain themselves with sea level rise due to insufficient sediment for sustainable vertical accretion (DeLaune et al. 1983; Stevenson et al. 1985; Kearney et al 1988, 1994; Hartig et al. 2002; McKee et al. 2004; Turner et al. 2004).

PDE Report No. 15-09, July 2015 Page 10
In Delaware Bay, comparison of aerial photography with historic maps have shown extensive salt marsh loss since the 1840s (Philipp 2005), and rates of loss appear to be accelerating (PDE 2012). Along the New Jersey coast, accretion rates of 1.7 mm yr-1 have been measured (Erwin et al 2006) which fall below current rates of sea level rise. These measurements in conjunction with subsidence due to ground water extraction that can be as high as 2mm yr-1 (Sun et al. 1999) indicate that tidal marshes around Delaware Bay may be losing acreage (PDE 2012) due to the inability to keep pace with local relative sea level rise rates. Although marshes are able to migrate landward to some extent, seaward losses have outpaced landward gains and this trend is expected to accelerate (Kreeger et al. 2010). The Delaware Estuary has experienced wetland loss of 6,500 acres between 1996 and 2006. Currently, 37% of existing wetlands are categorized as severely stressed, 37% moderately stressed, and 27% minimally stressed, which is worrisome because degraded marsh condition can be a precursor of lost acreage. If erosion continues at its current rate, we may experience a 25-75% wetland loss by 2100 (PDE 2012). Another symptom of the rapid changes underway are shoreline erosion rates along Delaware Estuary salt marshes. Marsh edge retreat rates greater than 1 meter per year and as high as 8 meters per year have been measured recently in Delaware Bay (Moody 2011). More than 95% of random shoreline assessment points have recently been assessed as net eroding, whereas a stable marsh has balanced erosion and accretion. These high rates of edge erosion, coupled with increases in interior marsh drowning and intra-marsh creek widening, may have significant consequences for ribbed mussel abundance.
Ribbed Mussels
Ecology of the Ribbed Mussel (Geukensia demissa)
Ribbed mussels live throughout salt marshes, but they are most abundant along the marsh edge (Franz 1996, 1997, 2001;, Kreeger unpublished) and in creeks. Kuenzler (1961) and Bertness (1984) have summarized the life history and ecological role of ribbed mussels within the marsh ecosystem. Ribbed mussels live in synergism with the salt marsh cord grass, S. alterniflora. Ribbed mussels attach to the rhizome complex of S. alterniflora using secreted protein complexes called byssal threads. The ribbed mussels can grow and detach from these strands, allowing them to change their position among both the root systems of the cord grass and the local mussel population (Franz 2001). Ribbed mussels supply S. alterniflora with nutrients through the deposition of pseudofeces and (often nutrient rich) feces, enhancing ecological productivity (Bertness 1984). The enhanced productivity provides new attachment sites for ribbed mussels, which in turn, provides the cord grass with additional nutrients. The enriched plants grow taller and denser as a consequence of the mussel-mediated fertilization. Taken together, the mutualistic relationship leads to the development of natural levees along marsh edges due to the combined effects of active particle capture by the filter-feeding bivalves paired with passive particle settlement by the dense vegetation canopy, thus enhancing the vertical growth of the marsh (Bertness 1984). Bertness (1984) found that the removal of ribbed mussels from experimental field plots resulted in the landward movement of the marsh edge, while conversely; untouched plots containing high densities of ribbed mussels saw water-ward movement. Ribbed mussels are suspension feeders meaning that they actively pump water through gills for respiration and to capture suspended particulate material, including phytoplankton, in order to derive nutrition. Three types of cilia, frontal cilia, laterofrontal cirri, and lateral cilia, are beat to maximize water movement through the gills where particles are retained. Particles are then transported in free

PDE Report No. 15-09, July 2015 Page 11
suspension or mucous movement by the frontal cilia towards the labial palps where they are sorted to either be transported to the mouth or rejected as pseudofeces (Newell and Langdon 1996). Through these complex sorting processes, mussels can enrich their diet to suit their current physiological demands. Initial capture of particulate matter is indiscriminate, after which sorting occurs. Organic matter that is selected by the mussels passes into the gut and (mostly) inorganic material is passed to the marsh platform. The primary foods of ribbed mussels have been shown to be nano, micro, and bacterioplankton (Wright et al. 1982; Kemp et al. 1990; Langdon and Newell 1990), and heterotrophic flagellates, benthic microalgae and detritus also make a substantial contribution to their seasonal diet (Kreeger and Newell 1996, 2000). No single diet item can meet the mussel’s nutritional demands in the detritus-dominated marsh ecosystem, and so ribbed mussels have developed unique physiological adaptations to feed omnivorously and switch diets seasonally (Kreeger and Newell 2000). Importantly, ribbed mussels appear to be more nutritionally-limited by nitrogen than carbon or energy due to the naturally nitrogen-limited salt marsh environment (Kreeger and Newell, 2000), and so ribbed mussels have adapted ways to maximize the uptake and conservation of nitrogen, such as by filtering free bacteria which is an adaptation possessed by few other bivalves. The main predator of ribbed mussels along the marsh edge is the blue crab (Callinectes sapidus), although the mud crab (Panoperous herbstii) has also been known to feed on them (Lin 1989; Lin and Mendelssohn 1996). Avian predators include clapper rails (Rallus longirostris) and one study found ribbed mussels to be half the prey (percent by volume) in the stomachs of the California variety (Cohen et al. 2005). Predation appears to be lower when mussel density is high and mussels are tightly bound together in clumps.
The Ribbed Mussel and Salt Marsh Accretion
A 5 to 20 percent wetland loss has been estimated by 2080 along U.S. coasts due to sea-level rise (Nicholls et al. 1999, Nicholls and Lowe 2004) if important processes such as marsh accretion cannot keep pace with increasing sea levels. But, as noted above, losses of the expansive salt marshes in The Delaware Estuary are expected to be much greater, and are already averaging more than an acre per day (PDE 2012). By moving suspended matter to sediments, dense mussel beds could hypothetically facilitate marsh accretion both directly by enhancing sedimentation and indirectly by fertilizing plants (Leonard and Luther 1995; Nepf 1999) making plants near mussels more productive (Bertness 1984). Ribbed mussels also bind tightly together and to plants, thereby helping to stabilize eroding shorelines (Moody 2011).
It has been shown that plant canopies can provide the drag required to trap suspended sediments that are ultimately incorporated into the rhizome matrices of marsh plants increasing their resistance to erosion (McCaffery and Thomson 1980, Bricker-Urso et al. 1989, Friedrich and Perry 2001). As sea level rises, healthy, dense marsh vegetation may therefore augment vertical accretion by trapping more sediments than would sparse vegetation, helping the marsh grow vertically at a rate equal to, or above, the rising water (Leonard and Luther 1995, Nepf 1999). Interestingly, studies of the ribbed mussel’s role in salt marsh accretion have yet to be reported. As mentioned above, ribbed mussels are known to act synergistically with the salt marsh cord grass S. alterniflora, facilitating the development of natural levees along marsh edges and enhancing ecological

PDE Report No. 15-09, July 2015 Page 12
productivity through the deposition of pseudofeces and (often nutrient rich) feces (Bertness 1984). While the S. alterniflora root mass is commonly recognized as a stabilizing force and a wealth of data has been collected concerning G. demissa’s productivity (Bertness 1984), resource allocation (Franz 1997, 2001), and role in ecological energy cycling (Jordan and Valiela 1982; Kreeger et al. 1996; Kuenzler 1961), relatively little attention has been paid to the physical integrity formed by the synergistic ribbed mussel-Spartina assemblage, particularly when the mussels exist in dense aggregations.
The Ribbed Mussel and Nitrogen Cycling
Nitrogen (N) is essential for all organisms to construct amino and nucleic acids, and is considered the primary limiting nutrient for production in coastal ecosystems (Sprent 1987), especially salt marshes. The major N inputs to salt marshes are dissolved organic, inorganic, and particulate N delivered by tidal waters, as well atmospheric N fixation by bacterial communities; lesser contributions are provided by precipitation and ground water fluxes (Valiela and Teal 1979). In the salt marsh environment, energy rich ammonia is oxidized to nitrate which is subsequently removed from the ecosystem through either the anoxic process of microbial denitrification or by transport from tidal waters. N export has been measured to be equivalent to total input, indicating that the within-marsh cycle of N fixation (N2-NH3), nitrification (NH3-NO3), and denitrification (NO3-N2) are important for salt marsh communities to meet their internal N demands through recycling of limited nitrogenous compounds (Valiela and Teal 1979). In salt marsh ecosystems, changes in N imports and exports can have ecological effects. Increased N input enhances plant productivity (Valiela and Teal 1979). As global atmospheric CO2 levels are expected to increase (IPCC 2001), this sequestration may be important and limiting levels of available N has been shown to reduce this function (Reich et al. 2006). In some areas, the export of nitrogen from salt marshes can in turn increase primary production of algae in coastal waters which has been linked to decreased biological diversity (Valiela et al. 1990). To understand nutrient removal processes by ribbed mussels, it is helpful to understand how mussels feed on the complex mixture of natural particles in detritus-dominated salt marshes. For example, unlike other filter-feeding bivalves studies have indicated that bacteria, protozoans and detritus can provide significant contributions to ribbed mussel N uptake (Newell and Field 1983; Kreeger et al., 1988; Alber and Valiela 1994). These alternative diets may be critical for ribbed mussels to balance their N demands in the naturally nutrient poor salt marsh (Kreeger and Newell, 2000, 2001) Studies ranking secondary sources of N retention indicate that ribbed mussels incorporate five times more N when feeding on organic aggregates than on dissolved organic material (DOM) or particulate detritus (Alber and Valiela 1994). Organic aggregates are particles formed by the clustering of DOM from producers and bacteria, but their biochemical composition resembles bacteria rather than its marcophytic components. Similarly, Kreeger and Newell (1996) showed that while mussels are the only species capable of extracting carbon from cellulosic detritus, their uptake of both carbon and N is far greater when detritus is colonized by bacteria. These data suggest that ribbed mussels are capable of extracting N from the detritus-bacteria-protist-microphytobenthos complex to augment N derived from phytoplankton (Kreeger and Newell 2000, 2001) since phytoplankton are not abundant enough to be a dominant resource in interior areas of marshes, as confirmed via stable isotope tracer studies (Peterson et al. 1986). Of all Mid-Atlantic bivalves, only ribbed mussels appear to be capable of tapping into the detrital pathway, thus serving as an efficient link between producer and filter-feeding consumers (Kreeger et al. 1988, 1990; Alber and Valiela 1994. Kreeger and Newell 2001). The balance of N sources varies seasonally as ribbed mussels

PDE Report No. 15-09, July 2015 Page 13
switch between the most prevalent N-laden particles, but over the majority of the year, the most consistent sources of N for ribbed mussels are microheterotrophs and bacteria (Kreeger and Newell 2000). But the best source of food for ribbed mussels is based on ease of capture and digestion, so there is seasonal variation in considering the most important food source which, depending on the time of the year, may be a mix of particles including protists. Secondary and tertiary sources were phytoplankton and benthic microalgae respectively (Kreeger and Newell 2000). During the spring and summer, when N requirements are high microheterotrophs comprised 64% and 98% of the ribbed mussel demand respectively (Kreeger and Newell 2000), estimates that were based on measured abundances for different particles in salt marsh tidal creeks (Huang 2000). Phytoplankton consumption also occurred during this time period, potentially supplementing the carbon deficit in the microheterotrophs for use in seasonal growth. During the fall and spring, the ribbed mussel’s N demand was almost exactly met by these three sources whereas carbon demand was supersaturated, indicating that all three sources may be equally important during these times and that N can be more nutritionally limiting than carbon. Storage during the winter and gamete production during spring may provide reasons for the high N demands at these times (Kreeger and Newell 2000). These results show that ribbed mussels depend on a mix of food particles and that the N content is critical. In natural marshes which are not severely eutrophied, ribbed mussels are “N scavengers” throughout most of the year. In examining the importance of ribbed mussels for marsh-wide N retention, they have been reported to filter 1.8 times the particulate N exported from the marsh by tidal flushing (Jordan and Valiela 1982). Ribbed mussels, which outweigh all other metazoans in the marsh, are therefore considered functional dominant animals in salt marsh ecosystems (Kuenzler, 1961; Fell et al. 1982; Jordan and Valiela 1982; Bertness 1984), helping to govern mass biogeochemical relationships such as N retention and export. Hence, where mussels are dense, there presence can significantly alter the N budget of the salt marsh, shifting the equilibrium to net marsh N retention, thus enhancing productivity. Ribbed mussels only retain approximately 10% of their ingested N for growth (Fig. 2; Jordan and Valiela 1982). Fifty percent is deposited into the marsh in the forms of feces and pseudofeces. Spartina alterniflora stands are typically associated with clumps of ribbed mussels. These areas exhibit higher soil nitrogen levels than stands without marsh mussels, indicating that feces and pseudofeces contribute to nitrogen enrichment, this contributing to plant production (Bertness 1984). Since mussels are N scavengers (see above), they also usually do not release large amounts of dissolved ammonia in excreta; e.g., Jordan and Valiela (1982) found that only 27% of filtered N gets remineralized as ammonia. Hence, most N that is filtered by ribbed mussels gets deposited to the benthos and is not immediately returned to coastal waters, but rather it gets retained and incorporated, or buried, within the marsh (Jordan and Valiela 1982). The combination of N in feces, pseudofeces and ammonia represents a sizeable N transformation, thus contributing to in situ biogeochemical cycling wherever mussels are abundant.
Spatial Variation of Ribbed Mussels in Salt Marshes
Ribbed mussels populations are not evenly distributed across the marsh platform. After their planktonic life stage, the larva drop out of the water column, with the majority of settlement occurring along the edge of the marsh (Bertness and Grosholz 1985; Nielsen and Franz 1994; Franz 2001) in close proximity to previously established mussel populations (Nielsen and Franz 1994). Since it has been shown that space and sediment stability are the most limiting variables on populations and that predation, sediment suffocation and ice dislodgement have substantial effects on new recruits (Bertness and

PDE Report No. 15-09, July 2015 Page 14
Grosholz 1985), it may be that the refuge provided in the interstitial space of the shell assemblages along with the stability provided by the larger mussel and Spartina complexes provide the highest chance of survival. In previous population studies, larval recruits were found to comprise 55% of the population at the marsh edge, in contrast to only approximately 9% of the high marsh population (Franz 2001). High recruitment along the marsh edge was cited as a possible explanation for low high marsh abundance. Ribbed mussel populations along the marsh edge were characterized as being comprised of seven annual decreasing age classes. First year recruits were the largest of the age classes with second year individuals making up only 20% of the population. By year six, the number of individuals was negligible. In the high marsh, 15 annual age classes were present with second year individuals representing the largest age class of the population at approximately 30%. Populations of subsequent age classes decreased with year, but not as drastically as along the marsh edge. Individuals over 10 years of age represented approximately 15% of the population (Franz 2001). These data suggest that there is higher survivorship in the high marsh and the authors speculate that the high marsh can act as a refuge from predation and intra-specific competition for resources, thus the high numbers of second year age class in the high marsh may represent better year to year survival. The life history of mussels that settle along the marsh edge is markedly different in terms of growth and reproduction than that of mussels who recruit into the high marsh. Recruits to the marsh edge show a higher growth rate (Bertness and Grosholz 1985) and mature at a smaller size class (Franz 1996), but also display lower survivorship (Franz 2001) than those in the high marsh. Mussels populations in the high marsh include older but smaller size classes compared with populations along the marsh edge. Despite having greater age and survival in the high marsh (Franz 2001), the smaller size and density of high marsh mussel populations means that the biomass of the high marsh population (per unit area) is lower than in low marsh areas.
Study Approach
The overall goal of this study was to assess how much suspended matter and associated particulate nutrients are removed, utilized, and bio-deposited in different seasons by different-sized mussels living in different tidal zones of representative eastern USA salt marshes. The approach was to assess and integrate: key physiological rate functions of ribbed mussels feeding and digesting natural particle assemblages (Task 1), and ribbed mussel population demographics and densities across the salt marsh platform (Task 2). Because ribbed mussels process materials differently throughout the year, and potentially among different sub-habitats within a marsh, this approach was repeated seasonally and for different habitats (river edge, tidal creek, high marsh). To provide context for interpreting results, a variety of wetland assessment tools were also used to characterize the various marsh habitats (Task 3), providing an opportunity to also explore relationships among key features and mussel populations (Task 4). Finally, to assess whether our results are broadly applicable, we repeated these studies and assessments in four different marsh systems: three in New Jersey (NJ) and one in Rhode Island (RI). Below is a brief orientation to the logic framework for key study elements.
Task 1. Physiological Rate Functions of Ribbed Mussels
There is a growing body of literature on the physiological rate functions of ribbed mussels, such as particle clearance rates (Jordan and Valiela 1982), nutrient processing rates (Kuenzler 1961), bio-deposition rates (Smith and Frey 1985), and natural diet composition and utilization (Kreeger et al. 1988,
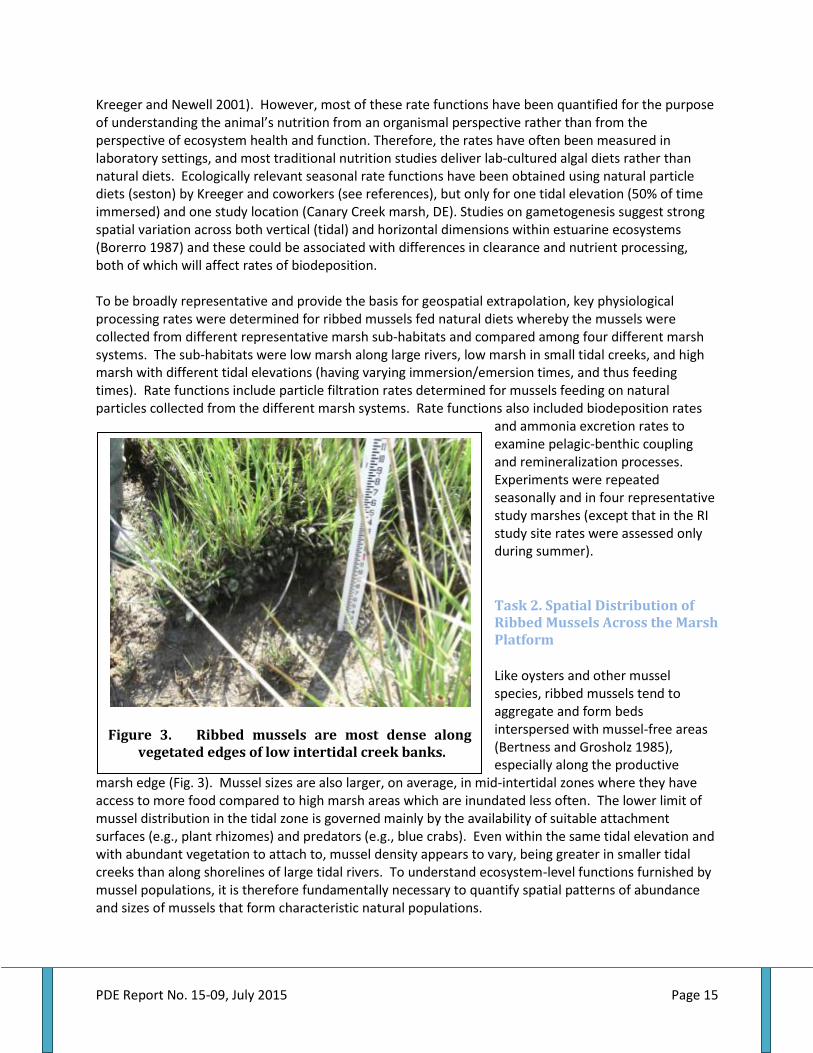
PDE Report No. 15-09, July 2015 Page 15
Figure 3. Ribbed mussels are most dense along vegetated edges of low intertidal creek banks.
Kreeger and Newell 2001). However, most of these rate functions have been quantified for the purpose of understanding the animal’s nutrition from an organismal perspective rather than from the perspective of ecosystem health and function. Therefore, the rates have often been measured in laboratory settings, and most traditional nutrition studies deliver lab-cultured algal diets rather than natural diets. Ecologically relevant seasonal rate functions have been obtained using natural particle diets (seston) by Kreeger and coworkers (see references), but only for one tidal elevation (50% of time immersed) and one study location (Canary Creek marsh, DE). Studies on gametogenesis suggest strong spatial variation across both vertical (tidal) and horizontal dimensions within estuarine ecosystems (Borerro 1987) and these could be associated with differences in clearance and nutrient processing, both of which will affect rates of biodeposition. To be broadly representative and provide the basis for geospatial extrapolation, key physiological processing rates were determined for ribbed mussels fed natural diets whereby the mussels were collected from different representative marsh sub-habitats and compared among four different marsh systems. The sub-habitats were low marsh along large rivers, low marsh in small tidal creeks, and high marsh with different tidal elevations (having varying immersion/emersion times, and thus feeding times). Rate functions include particle filtration rates determined for mussels feeding on natural particles collected from the different marsh systems. Rate functions also included biodeposition rates
and ammonia excretion rates to examine pelagic-benthic coupling and remineralization processes. Experiments were repeated seasonally and in four representative study marshes (except that in the RI study site rates were assessed only during summer).
Task 2. Spatial Distribution of Ribbed Mussels Across the Marsh Platform
Like oysters and other mussel species, ribbed mussels tend to aggregate and form beds interspersed with mussel-free areas (Bertness and Grosholz 1985), especially along the productive
marsh edge (Fig. 3). Mussel sizes are also larger, on average, in mid-intertidal zones where they have access to more food compared to high marsh areas which are inundated less often. The lower limit of mussel distribution in the tidal zone is governed mainly by the availability of suitable attachment surfaces (e.g., plant rhizomes) and predators (e.g., blue crabs). Even within the same tidal elevation and with abundant vegetation to attach to, mussel density appears to vary, being greater in smaller tidal creeks than along shorelines of large tidal rivers. To understand ecosystem-level functions furnished by mussel populations, it is therefore fundamentally necessary to quantify spatial patterns of abundance and sizes of mussels that form characteristic natural populations.
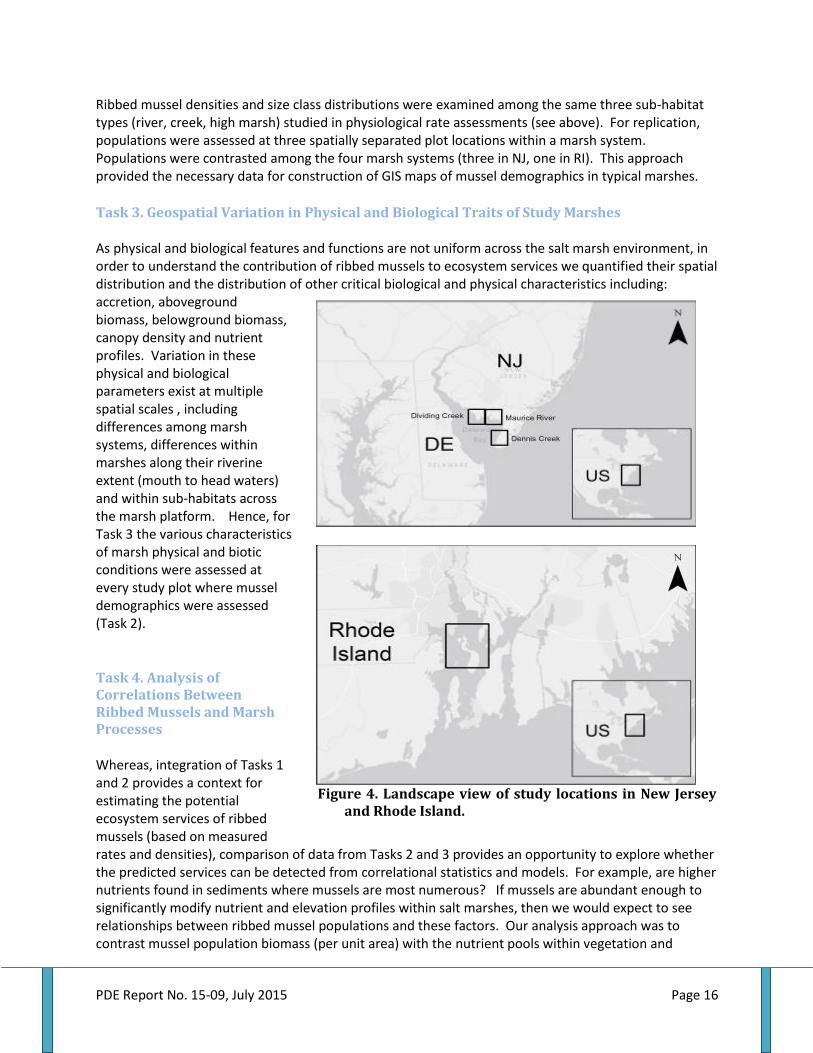
PDE Report No. 15-09, July 2015 Page 16
Ribbed mussel densities and size class distributions were examined among the same three sub-habitat types (river, creek, high marsh) studied in physiological rate assessments (see above). For replication, populations were assessed at three spatially separated plot locations within a marsh system. Populations were contrasted among the four marsh systems (three in NJ, one in RI). This approach provided the necessary data for construction of GIS maps of mussel demographics in typical marshes.
Task 3. Geospatial Variation in Physical and Biological Traits of Study Marshes
As physical and biological features and functions are not uniform across the salt marsh environment, in order to understand the contribution of ribbed mussels to ecosystem services we quantified their spatial distribution and the distribution of other critical biological and physical characteristics including: accretion, aboveground biomass, belowground biomass, canopy density and nutrient profiles. Variation in these physical and biological parameters exist at multiple spatial scales , including differences among marsh systems, differences within marshes along their riverine extent (mouth to head waters) and within sub-habitats across the marsh platform. Hence, for Task 3 the various characteristics of marsh physical and biotic conditions were assessed at every study plot where mussel demographics were assessed (Task 2).
Task 4. Analysis of Correlations Between Ribbed Mussels and Marsh Processes
Whereas, integration of Tasks 1 and 2 provides a context for estimating the potential ecosystem services of ribbed mussels (based on measured rates and densities), comparison of data from Tasks 2 and 3 provides an opportunity to explore whether the predicted services can be detected from correlational statistics and models. For example, are higher nutrients found in sediments where mussels are most numerous? If mussels are abundant enough to significantly modify nutrient and elevation profiles within salt marshes, then we would expect to see relationships between ribbed mussel populations and these factors. Our analysis approach was to contrast mussel population biomass (per unit area) with the nutrient pools within vegetation and
Figure 4. Landscape view of study locations in New Jersey
and Rhode Island.

PDE Report No. 15-09, July 2015 Page 17
sediments. We repeated this correlation test between mussel biomass density and other critical biological and physical characteristics including: elevation, accretion, aboveground biomass, belowground biomass, canopy density and nutrient profiles.
Methods
Study Site Locations
Salt Marshes
Data were collected in three representative study salt marshes in NJ and one in RI (Fig 4-8). New Jersey salt marshes were chosen in Dennis Creek, Dividing Creek and the Maurice River, which are tributary watersheds along the Delaware Bayshore. In Rhode Island, the study marsh was Cogshall Cove, located on Prudence Island in Narragansett Bay. These marshes were selected based on their representative nature, based on long-term wetland monitoring datasets and continued monitoring at fixed stations (e.g. including surface elevation tables). Hence, results from our study can be related to long term local trends for context, where appropriate. Habitats Mussel-mediated ecosystem services vary in relation to mussel population density, demographics, and physiological rate functions. Due to variation in feeding time and other factors, these parameters will vary across the salt marsh landscape. Three sub-habitats (hereafter referred to simply as habitats) were chosen to represent major types within which mussels reside: areas of low marsh along the main river/channel (Low Marsh River; LMR); areas of low marsh along smaller inter-marsh drainage creeks (Low Marsh Creek; LMC); and expanses of high marsh (High Marsh; HM). Low Marsh River habitat was delineated as being along the main river/channel of the marsh that does not drain at low tide, and characterized by, at least, a two meter band low marsh vegetation (S. alterniflora tall form) from the water's edge to the high marsh platform. High Marsh habitat was delineated by vegetation community composition, including: S. alterniflora short form; S. patens; Distichlis spicata; Juncus spp. and Salicornia spp. Low Marsh Creek habitat was characterized by a minimum of a four meter band of tall form S. alterniflora bisected by an inter-marsh drainage creek that drained fully at low tide. These habitat types are able to be mapped by digitization of high resolution aerial images. Site Position Within each of the four representative salt marsh systems, three replicate study sites were chosen spanning the tributary axis from nearest the mouth to upstream. The lower position was selected near the river/channel mouth, the upper position was selected at the furthest extent upriver mussels were present, and the middle position was located between the two (Fig 9-20) All study sites contained a mussel population and the three habitats of interest.. Therefore, there was a total of 12 study sites (4 marsh systems, 3 study sites in each).

PDE Report No. 15-09, July 2015 Page 18
Figure 5. Dennis Creek (NJ) site locations.
Figure 6. Dividing Creek (NJ) site locations.

PDE Report No. 15-09, July 2015 Page 19
Figure 8. Rhode Island site locations.

PDE Report No. 15-09, July 2015 Page 20
Figure 9. Dennis Creek (NJ) site 1 plot locations.

PDE Report No. 15-09, July 2015 Page 21
Figure 10. Dennis Creek (NJ) site 2 plot locations.

PDE Report No. 15-09, July 2015 Page 22
Figure 11. Dennis Creek (NJ) site 3 plot locations.
Figure 12. Dividing Creek (NJ) site 1 plot locations.

PDE Report No. 15-09, July 2015 Page 23
Figure 13. Dividing Creek (NJ) site 2 plot locations.
Figure 14. Dividing Creek (NJ) site 3 plot locations.
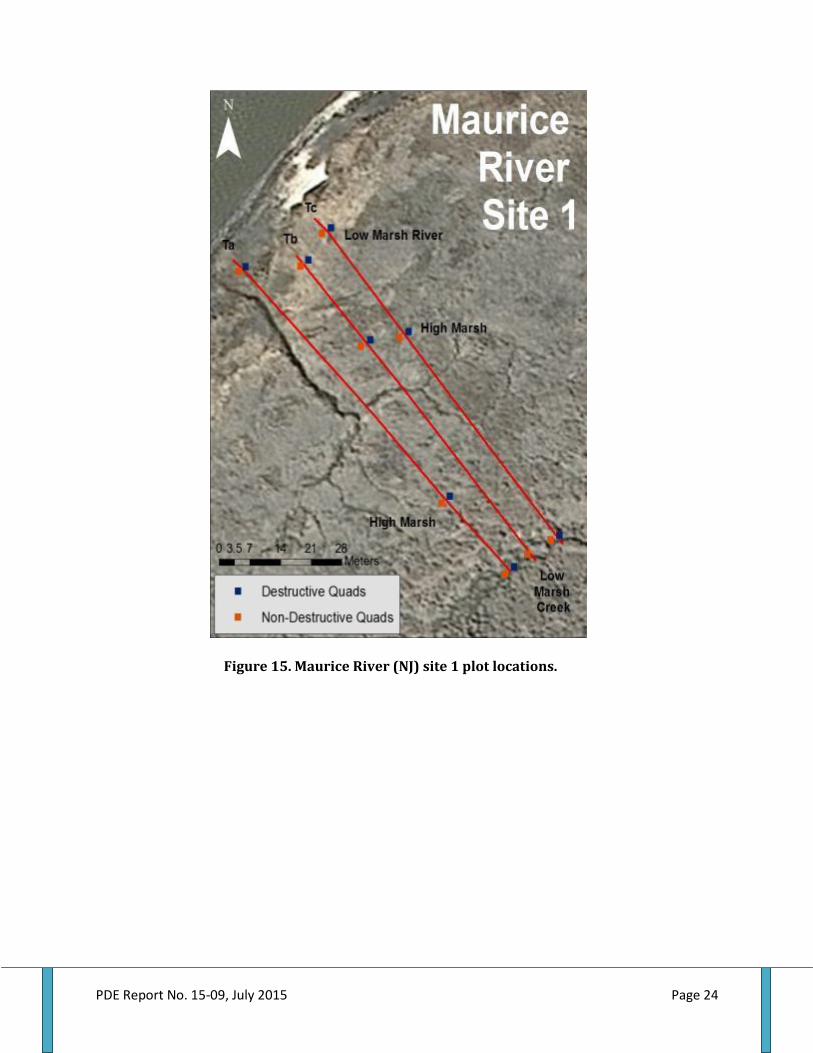
PDE Report No. 15-09, July 2015 Page 24
Figure 15. Maurice River (NJ) site 1 plot locations.

PDE Report No. 15-09, July 2015 Page 25
Figure 16. Maurice River (NJ) site 2 plot locations.

PDE Report No. 15-09, July 2015 Page 26
Figure 17. Maurice River (NJ) site 3 plot locations.

PDE Report No. 15-09, July 2015 Page 27
Figure 18. Rhode Island site 1 plot locations.
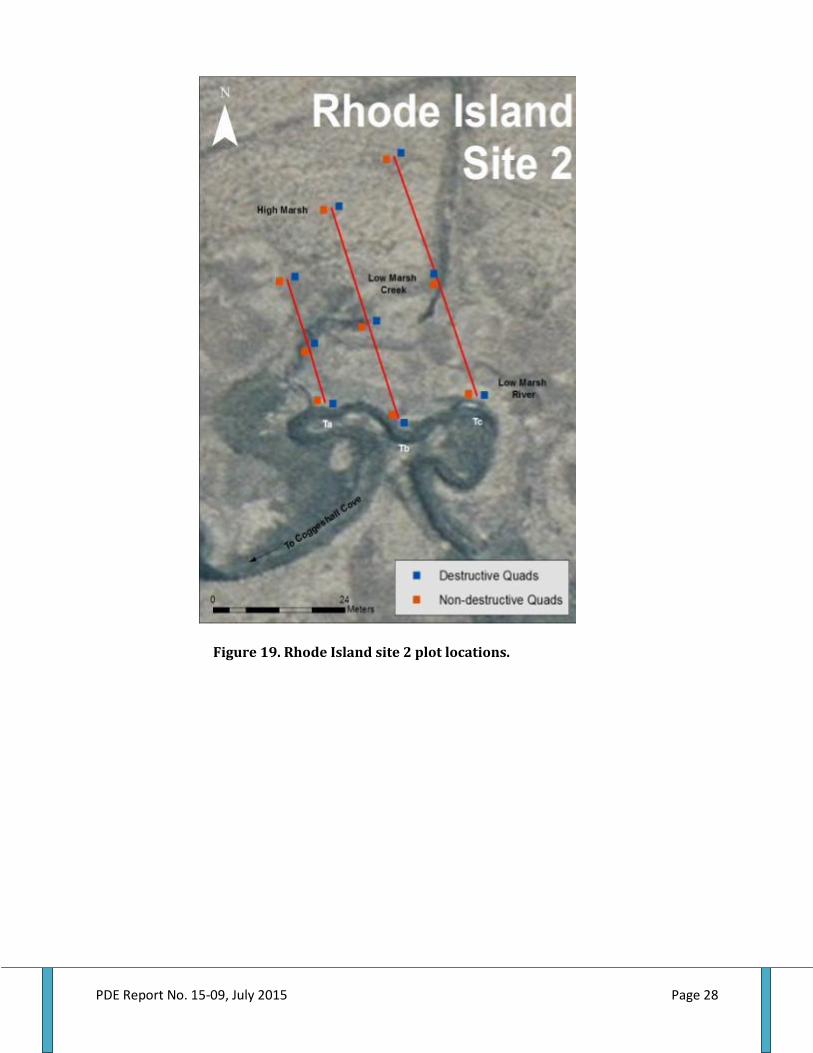
PDE Report No. 15-09, July 2015 Page 28
Figure 19. Rhode Island site 2 plot locations.

PDE Report No. 15-09, July 2015 Page 29
Transect Placement
Within each study site, three parallel transects were spaced 10m apart. The origin of each transect was fixed at the most seaward extent of the contiguous vegetated marsh edge. Transects were extended landward so that they spanned at least some of all three habitats of interest (Fig 21). In general, each transect started in LMR habitat, crossed through HM habitat, and ended in LMC habitat. The landward extent (length) of each transects was not consistent among, or necessarily within, study sites. The only criteria for transect length was that each transect spanned all three habitats of interest. In general, transects were less than 100 m long.
Figure 20. Rhode Island site 3 plot locations.

PDE Report No. 15-09, July 2015 Page 30
Figure 21. Schematic of destructive (blue) and non-destructive (orange) sampling plot layout along transects (T1-T3) intersecting three habitats: Low Marsh River (LMR); High Marsh (HM); and Low Marsh Creek (LMC). The red circles indicate belowground biomass core locations (0.5m outside plot). The green plus signs indicate porewater sampler locations. Metrics taken within each plot are denoted: lip counts (LC); mussel excavation (Ex); horizontal vegetaion obstruction (VB); accretion above feldspar marker horizons (Feld); and aboveground biomass (AGB).
Study Plot Placement
Study plot was centered on each transect within each of the three habitat types (n=3 plots/transect). Each plot consisted of a paired set of 1 m2 quadrats, one of which was designated for destructive sampling and one for non-destructive sampling. These quadrats were positioned directly to the right and left within each study plot, separated by a 1 m wide belt along the transect line (for access); hence, the data collection quadrats were 0.5m to the right and left of the transect belt (Fig 21). Looking landward into the marsh from the LMR habitat, the destructive and non-destructive paired data collection plots were located to the left and right of the transect, respectively (Fig 21). The position of the paired data collection plots allowed for movement along the transect without disturbing the study areas, while retaining a proximity that allowed for data to be representative of the study plot. Additionally, as some data collection techniques can be invasive to the marsh, by grouping destructive and non-destructive methods in separate plots, less marsh area needed to be disturbed and one plot always retained its structural integrity (could be useful for potential future data collection). Data collected in the paired destructive and non-destructive plots are listed in Table 1. In summary, there were 9 study plots per study site, each containing one destructive and one non-destructive sampling
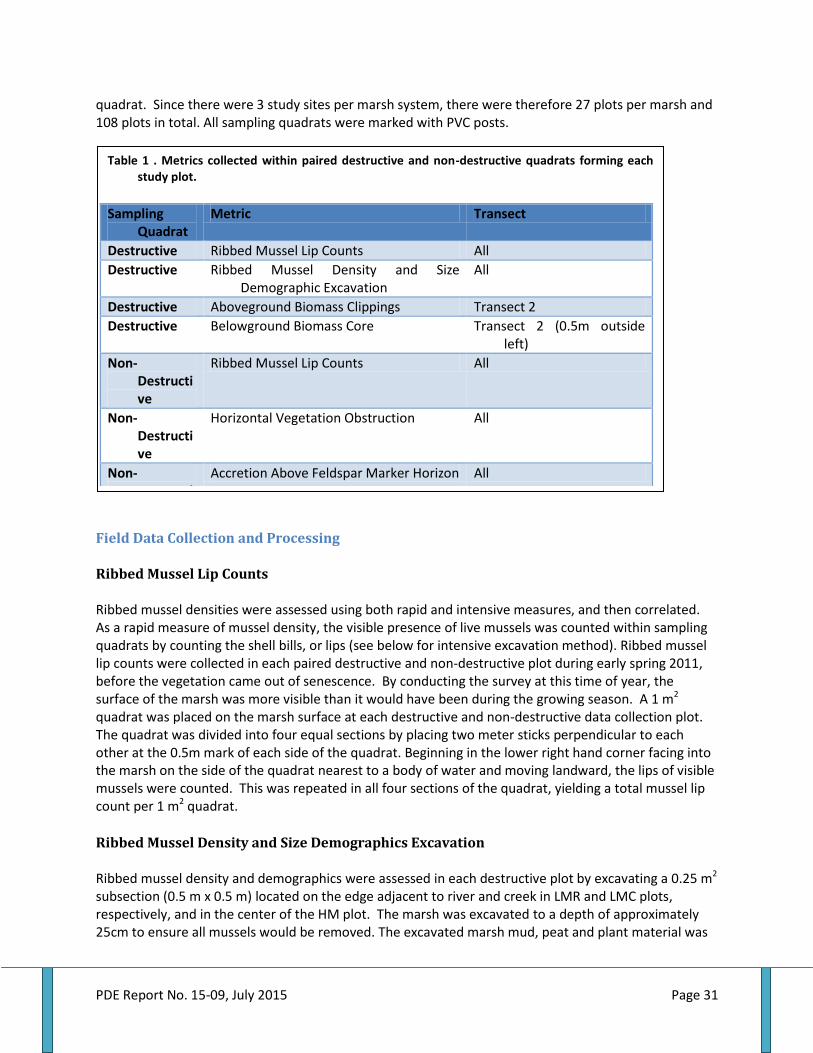
PDE Report No. 15-09, July 2015 Page 31
quadrat. Since there were 3 study sites per marsh system, there were therefore 27 plots per marsh and 108 plots in total. All sampling quadrats were marked with PVC posts.
Field Data Collection and Processing
Ribbed Mussel Lip Counts
Ribbed mussel densities were assessed using both rapid and intensive measures, and then correlated. As a rapid measure of mussel density, the visible presence of live mussels was counted within sampling quadrats by counting the shell bills, or lips (see below for intensive excavation method). Ribbed mussel lip counts were collected in each paired destructive and non-destructive plot during early spring 2011, before the vegetation came out of senescence. By conducting the survey at this time of year, the surface of the marsh was more visible than it would have been during the growing season. A 1 m2 quadrat was placed on the marsh surface at each destructive and non-destructive data collection plot. The quadrat was divided into four equal sections by placing two meter sticks perpendicular to each other at the 0.5m mark of each side of the quadrat. Beginning in the lower right hand corner facing into the marsh on the side of the quadrat nearest to a body of water and moving landward, the lips of visible mussels were counted. This was repeated in all four sections of the quadrat, yielding a total mussel lip count per 1 m2 quadrat.
Ribbed Mussel Density and Size Demographics Excavation
Ribbed mussel density and demographics were assessed in each destructive plot by excavating a 0.25 m2 subsection (0.5 m x 0.5 m) located on the edge adjacent to river and creek in LMR and LMC plots, respectively, and in the center of the HM plot. The marsh was excavated to a depth of approximately 25cm to ensure all mussels would be removed. The excavated marsh mud, peat and plant material was
Table 1 . Metrics collected within paired destructive and non-destructive quadrats forming each study plot.
Sampling Quadrat
Metric Transect
Destructive Ribbed Mussel Lip Counts All
Destructive Ribbed Mussel Density and Size Demographic Excavation
All
Destructive Aboveground Biomass Clippings Transect 2
Destructive Belowground Biomass Core Transect 2 (0.5m outside left)
Non-Destructive
Ribbed Mussel Lip Counts All
Non-Destructive
Horizontal Vegetation Obstruction All
Non-Destructive
Accretion Above Feldspar Marker Horizon All
Non-Destructive
Nutrient Porewater Concentrations Transect 2 (0.5m outside right)

PDE Report No. 15-09, July 2015 Page 32
added to buckets filled partially with water so that mud could be rinsed from plants and rhizomes, thereby making all attached mussels visible. Mussels were separated and transferred to a clean bucket. All mussels >10 mm in shell height were then counted. When the task of separating mussels in the field took more time than was available, the excavated plot sample was bagged in a 25 gallon heavy duty garbage bag, labeled according to site and returned to the Rutgers Haskin Shellfish Research Laboratory for analysis using a spray hose to clean away mud. A randomly selected subgroup of twenty five mussels from each sample (when available) were then measured using Absolute Digimatic Calipers to ±0.01 mm shell height.
Estimation of Ribbed Mussel Biomass in Field Plots
Ribbed mussel Dry Tissue Weight (DTW) to Shell Height (SH) allometric relationships were derived from measured and sacrificed mussels used in Physiology experiments. These allometric relationships were derived separately for each habitat of each marsh, as well as seasonally (n=21 or 24 mussels/marsh/habitat). A power regression curve of the form DTW=b*SHm (b= intercept; m=slope) was fitted for each group of mussels by marsh and habitat. (Fig 22, Table 2). These river and habitat specific
allometric relationships were then used to predict the DTW of each of the 25 ribbed mussels that had their shell heights measured within each of the excavated destructive plots. The average DTW of mussels per sampling quadrat was calculated by dividing the sum of the estimated DTWs of all mussels by the number measured. The average DTW per mussel was multiplied by the number of mussels excavated in the 0.25 m2 destructive plot and To estimate the mussel dry tissue weight in each non-destructive plot, a correction factor was applied to the lip count within that plot. This correction factor was derived from the paired destructive plot and
Shell Length (mm)
Figure 22. Example of fitted regression for estimating ribbed mussel dry tissue weight (g; y axis) by shell length (mm; x axis) in Dennis Creek high marsh habitat. n=21 mussels
Dry
Tis
sue
We
igh
t (g
)
Shell Length (mm)

PDE Report No. 15-09, July 2015 Page 33
consisted simply of the ratio of the actual mussel count (from the excavation x 4 to get count per 1 m2) to the lip count (within the full 1 m2 of the same destructive plot). The result was an estimated actual mussel density/m2 for each sampling quadrat. The DTW m-2 for each non-destructive plot was then multiplied by the average dry tissue weight/mussel for its paired destructive plot.
Aboveground Biomass
The aboveground biomass (AGB) of emergent vegetation (vascular plants only) was harvested from 1 m2 experimental plots between July and Sept 2013. All aboveground vegetation was clipped within only the destructive quadrat to <1 cm of the sediment surface. AGB clippings were collected in trash bags, tagged for sample locations, and then were taken back to the laboratory and frozen at -20° C until processed. In the lab, plant material was thawed, rinsed to remove adherent salt and sediment, sorted by species, sorted by live versus dead shoot material, and dried to a constant weight at 60° C in a convection oven.
Belowground Biomass
Belowground biomass (BGB) was harvested using 10 cm diameter by 35 cm length PVC cores, beveled to a sharpened edge, hammered into the marsh using a sledge and pounding head, and removed using a shovel. Cores were bagged, tagged and taken to the laboratory where they were kept refrigerated until analysis. Upon later laboratory analysis, each core was sectioned into five depth layers: 0-1 cm; 1-5 cm; 5-10 cm; 10-20 cm; and 20-30 cm. The BGB in each core section was measured as the dry weight of root and rhizome material retained by wet sieving (1mm sieve), dried to a constant weight at 600C in a convection oven. Belowground biomass was also separated into live and dead root and rhizome material. Live material was characterized using a combination of factors, including root hairs, turgidity and color, and through density separations (live root material contains air). Prior to wet sieving, 10 cc soil samples were removed for bulk soil characterization.
Table 2. Statistics for mussel dry tissue weight regressed over shell length by habitat within marshes.
Marsh Habitat Slope (m) Intercept (b) R2 p
Dividing Creek High Marsh 2.56 1.00E-05 0.82 <0.001
Dividing Creek Low Marsh Creek 2.80 4.00E-06 0.83 <0.001
Dividing Creek Low Marsh River 2.24 6.00E-05 0.83 <0.001
Dennis Creek High Marsh 2.29 3.00E-05 0.86 <0.001
Dennis Creek Low Marsh Creek 2.75 5.00E-06 0.93 <0.001
Dennis Creek Low Marsh River 2.37 3.00E-05 0.89 <0.001
Maurice River High Marsh 2.36 2.00E-05 0.87 <0.001
Maurice River Low Marsh Creek 2.65 8.00E-06 0.85 <0.001
Maurice River Low Marsh River 2.60 1.00E-05 0.94 <0.001
Rhode Island High Marsh 2.44 2.00E-05 0.83 <0.001
Rhode Island Low Marsh Creek 2.86 5.00E-06 0.98 <0.001
Rhode Island Low Marsh River 2.29 6.00E-05 0.87 <0.001

PDE Report No. 15-09, July 2015 Page 34
Plant and Soil Nitrogen
Aboveground biomass was characterized for carbon and nitrogen density and stable isotopes by randomly subsampling material from 1 m2 harvests, with the number of shoots chosen based on plant species. For S. alterniflora and Schoenoplectus robustus, five full shoots were chosen; for D. spicata, 10-15 shoots were chosen; and for S. patens, 30-40 shoots were chosen. To aid in determining whether mussel presence enhanced N availability, five green leaves of S. alterniflora were also analyzed from each plot, in order to hold constant variation in N density related to plant species differences and photosynthetically active vs. senesced material. Both AGB and root and rhizome material were ground using a Wiley Mini Mill. Twenty cc of soil material (inclusive of roots and rhizomes) was subsampled from soil cores from the depths of 0-1 cm, 1-5 cm, 5-10 cm, 10-20 cm, and from the 20cm- bottom depth, and dried to constant weight at 60° C for calculation of water content and dry bulk density. Soils were homogenized using a Spex Shatterbox mill. Soils and plant material were analyzed for total carbon (C) and N and for stable isotope ratios using a Vario Micro Cube elemental analyzer coupled to an Isoprime stable isotope ratio mass spectrometer (IRMS). Isotopic composition is expressed in per mill
notation relative to the reference standard such that δX
where R is the
ratio of the less to more common isotope. Post-run adjustments were performed, where necessary, to correct for drift and linearity, and for normalization to in house reference material. Every fifth sample was run in duplicate: median differences between duplicates were 0.02% for %N, 0.19% for %C, 0.11‰ for δ15N, and 0.05‰ for 13C.
Porewater and Nutrient Analysis
Passive diffusion porewater equilibrators were deployed for a one month period running from late September to October 2013. The design followed Hughes et al. 2012. Equilibrators were deployed at depths of 10 and 25 cm at each experimental plot. Pore-waters were filtered using a 0.4 µm filtering membrane, and analyzed for pH and salinity using an Accumet portable pH meter and YSI temperature, conductivity and salinity meter respectively, and frozen at -20° C for later analysis. Porewater samples were analyzed for nitrate plus nitrite, ammonium and phosphate using an Astoria Pacific A2 micro-segmented flow autoanalyzer (U.S. EPA methods 350.1, 353.2, and 365.2). Similarly, water samples from feeding experiments were analyzed for ammonium only (U.S. EPA method 350.1)
Horizontal Vegetation Obstruction
A vegetation obstruction board (1m x 13.5cm with ten 10cm alternating red and white stripes) was used as a rapid measure of plant canopy density, integrating horizontal and vertical robustness of the standing stock density of emergent plants. The method used followed the protocols of the Mid-Atlantic Coastal Wetland Assessment program’s Mid-Atlantic Tidal Rapid Assessment Method (MidTRAM). In brief, the board was held in the center of all non-destructive data collection plots perpendicular to the contiguous band of vegetation (all vegetation of a similar type , community composition) within which the plot is located. The number of red and white stripes visible (partially or completely) from 4m distance looking through the vegetation at 0.25m, 0.5m and 0.75m height from the marsh surface were counted, and the readings were integrated to obtain a numerical score for vegetation canopy density.
PDE Report No. 15-09, July 2015 Page 35
Accretion Above Feldspar Marker Horizon
Feldspar marker horizons were laid down in 50 x 50-cm plots situated within the middle of each non-destructive sampling quadrats. The layer was 5 mm thick and was placed to be uniform in thickness. Since each quadrat was marked with color coded PVC posts, it was possible to avoid any trampling of marker horizons during the study period. Over time, naturally accreting material was deposited on top of the feldspar (except in eroding areas). The depth of material that has accumulated on the marker was determined by collecting a 10cm x 10cm square core within the sample quadrat whenever readings were taken. The core was taken by cutting through the marsh surface using a stainless steel kitchen knife along the perimeter of the core to be taken. A rubber spatula was then inserted into cuts and the core was carefully removed. The knife was then used to gently clear away mud on each side of the core, revealing the marker horizon. The thickness of the newly deposited sediment, located above the feldspar marker was measured with calibrated calipers or a millimeter ruler, and the surface accretion depth was recorded to the nearest mm. Two measurements were taken on each of the 4 sides of the core (n=8 measurements/core), and these were averaged per core In a few cases, severe erosion or bioturbation obscured or prevented measurements, and in such cases no data were collected.
Real-Time Kinematic Elevation Surveys
Transects at all study sites were surveyed in summer 2011 and again in summer 2012 to assess elevation contours along transects, as well as within data collection plots. Elevation data were then contrasted between years to estimate any changes that may have resulted from accretion, erosion, compaction, etc. In addition to elevation data (latitudinal/logitudinal (NAD83) and vertical (NAVD88) positions), the dominant vegetation at each data point was also recorded , providing information for mapping tracking changes in dominant vegetation. Elevation data was collected using Trimble R6 Real-Time Kinematic GPS (RTK) and analyzed using the Geospatial Analyst Tool extension in ArcGIS 10.2. The RTK unit uses a global navigation satellite system (GNSS) to measure latitudinal/longitudinal and vertical (elevation) position with an accuracy of 8mm (+1ppm RMS) and 15mm (+ 1ppm RMS), respectively. The additional error attached to each measurement reflects the distance of the unit from the base station; for every 1km of distance an additional 1mm of potential error measurement is added. The average accuracy for these marshes, including error adjustments, was within 10mm horizontally and 17mm vertically. Point data were collected beginning at the main water channel in LMR Habitat. A point was collected at the delineated marsh edge, or edge of contiguous vegetation line, and subsequent points were taken moving into the marsh either every 5m, at every change in vegetative community, or at the encounter of a topographic feature/change of interest (e.g., marsh terracing, drainage creek, hardened structure, salt panne, denuded area, etc.). Point surveys continued through all three habitats. Additionally, point data were collected in each data collection plot (destructive and non-destructive) during both survey years.
Site-Wide Habitat Delineation
The area of each habitat type (LMR, HM, LMC) was assessed in the vicinity surrounding each study site. The percentage of the total area comprised of the three habitat types was then used to estimate marsh-wide mussel densities, DTW, and associated ecosystem services. The assessment area for the habitat mapping was bounded by a 300 m buffer, which was applied to the midpoint of the center transect (transect 2) and without crossing the main channel/river (large open waters >30 m wide were deleted from the assessment area). The area within this buffer region is referred to as habitat assessment area (HAA). The total HAA was calculated using the Calculate Geometry tool in ArcGIS 10.2. IKONOS 2014

PDE Report No. 15-09, July 2015 Page 36
digital imagery (0.82m black and white, 3.28m multispectral resolution) was used to digitize creek and river edges at 1:300 scale within the 300m buffer site. A 5m buffer was applied to the digitized main channel and creek edges from the edge moving into the marsh and was classified as Low Marsh River and Low Marsh Creek habitat, respectively. The 5m buffer was chosen based on average widths currently being reported for the tall form S. alterniflora that is typically used to delineate low marsh (Deegan et al. 2012; Partnership for the Delaware Estuary 2014). The area between digitized paired inter-marsh creek edges was considered open water and was excised from the total area of the site using the Erase tool. By subtraction, the remaining area not classified as LMR or LMC was classified as HM habitat.
Physiological Data Collection and Processing
Physiological experiments using live ribbed mussels and natural seston diets/water were conducted in fall 2012, spring 2013, and summer 2013, since the feeding status of bivalves varies seasonally in temperate latitudes. All experiments were conducted outdoors at times where ambient air temperatures were similar (within 3oC) to ambient water temperatures from where the mussels were collected. When mussels were collected for experiments, carboys of water were collected from the same locations, and these were used for the feeding studies to ensure that mussel physiology did not react to a change in diet quantity or quality. Ribbed Mussel Collection Fifteen ribbed mussels were collected from each habitat type (LMR, HM, and LMC) and each study marsh during each season, except that only a summer experiment was conducted for the RI study marsh. Mussels were always collected from only the middle position site per marsh (i.e., not nearest the mouth or most upriver). The seasonal experiments for the three NJ study marshes were conducted during November 2012, April 2013, and August 2013, whereas the single experiment at the RI marsh site was conducted in September 2012 (representing summer since climate conditions were still summerlike). For each experiment, mussels were collected on the falling tide and experiments were initiated approximately 6 hours later. Being intertidal and unable to feed during emersion, ribbed mussels are believed to have a “plug-flow” optimal foraging strategy whereby they feed when the tide is in and they digest when the tide is out and they are exposed to air. Hence, the timing of mussel collection and experimentation was designed to avoid disruption of these normal physiological patterns. Collected animals varied in size and were representative of the size distribution at the site from which they were collected. During transport to the nearby (outdoor) experiment site, mussels were placed in small containers wrapped in wet paper towels to keep them moist and at constant temperature. Mussels were gently rinsed of mud in a bucket of ambient water, their byssal threads were trimmed to the shell margin, and the outer shells of mussels were gently cleaned to remove epibiotic material and mud. Rinsed mussels were laid on a wet towel until use in experiments.
Water Collection for Seston Analysis and Bivalve Feeding
Water was collected in 20 liter carboys from each site where mussels were collected for use in physiology experiments. Before filling, the carboy was rinsed with ambient water. The carboy was filled by submerging it 5-10cm below the water surface in the main water channel, being careful not re-suspend soft material from the benthos or collect sediment plumes. Temperatures were monitored

PDE Report No. 15-09, July 2015 Page 37
throughout transport and experiments to ensure that it never deviated more than 3oC from ambient. Prior to seston analysis and feeding to mussels, all water was mixed in carboys and then passed through a 100 µm sieve to remove large debris and particle sizes too large for mussels to effectively filter.
Collection of Seston for Particle Counting
To assess the quantity and quality of microparticulate matter that mussels were fed on, replicate samples of seston were collected on pre-combusted glass fiber filters (Whatman GF/F, retention 0.7 µm) using vacuum filtration. All filtration glassware was pre-cleaned and rinsed with distilled water to ensure that it was as particle-free as possible. A few ml of 10% HCl were filtered and allowed to let stand for 2 min, and then rinsed with 10 ml particle-free distilled water. Seston was collected by passing a known volume of mixed water through the filter. To maximize the amount of seston on each filter without clogging the filter, which could introduce error, a test filter was first used per water type to determine the volume needed to clog the test filter; and subsequent filtrations were conducted using 90% of this “clogging volume”. Vacuum pressure was set to 20 psi to prevent filter breakdown. After the water had cleared each filter, the filter and its funnel was rinsed with 5 ml of 0.5 M ammonium formate to remove any inorganic salts. A total of 12 replicate seston filters were collected per habitat per marsh per season. Six of these filters were used for determination of total suspended solids (TSS), particulate organic matter (POM), and organic content using the loss-on-ignition method (dry 60oC for 2 days, weigh, ash at 450oC 1 day, reweigh). Weights of TSS and POM were divided by the filtered volumes to calculate concentrations. The other six filters per water type were later used for elemental analysis (see below). Between collection and later lab analysis, all seston filters were stored in individual plastic holders (Petrislides) and were frozen at -20oC. Filters were always handled by their edges with clean forceps.
Physiological Rate Experiments with Ribbed Mussels
Since the physiological status of bivalves can vary seasonally and with changes in diet, careful attention was paid to simulating natural conditions during the seasonal physiological experiments. Therefore, experiments were conducted using ambient water temperature, water quality, food quantity and quality, and timing to synchronize with natural immersion timing. Furthermore, since physiological metrics also vary with body size, a range of mussel sizes were tested to be representative of the local population from each study marsh. Seven (Dividing Creek, NJ and Maurice River, NJ) or eight (Dennis Creek, NJ and RI) ribbed mussels per season per marsh were fed on experimental diets for a fixed period of time during which their feeding rates were measured. At the end of this feeding period, the water was sampled for dissolved ammonia (excretion) and filtered (feces). Samples of food and feces were analyzed for organic content. The animals were sacrificed (shucked) and analyzed for various body size and condition index endpoints. These methods (summarized in more detail below) provided the data needed to calculate seston filtration rates, defecation rates, and excretion rates. All rate functions were then related to the actual body size (DTW) of individual mussels, enabling equations to be derived based on allometric scaling.

PDE Report No. 15-09, July 2015 Page 38
Figure 23. A series of beakers containing river water used in experiments, with mussels in tray in front of their associated beakers.
Clearance and Filtration Rates
Clearance (feeding) rates were measured in static aquaria by monitoring rates of particle disappearance for individual bivalves held in 1 L beakers (Fig. 23). Beakers were filled with 800 ml of ambient water from the marsh in which the mussels were collected that had been mixed and then sieved to 100um. Additional beakers (n=6/marsh) containing the same water but no ribbed mussels represent non-feeding controls for settling of particles. Beakers were mixed prior to sampling by plunging a graduated cylinder with wide base. Particle disappearance in each beaker was assessed by collecting water samples just prior to the experiment start (before bivalves are added), and then at various times after the bivalves are added. Typically, these water samples were taken every 30 minutes for 2 hours. In cases where bivalve feeding was delayed, which occurred during the fall experiments and one spring experiment (presumably due to lower water temperatures), the first sample used to assess feeding was taken only after mussels were observed to actually begin feeding (determined by the opening of valves, protrusion of siphons and the presence of feces). Water samples were 10 ml taken from the just beneath the water surface in the middle of each beaker, approximately 1 min following gentle mixing. This 1 min interval is sufficient to allow any resuspended feces to precipitate, whereas, smaller natural food particles remain in suspension. Each water sample was added to a 20 ml Coulter vial, and was fixed with 4 drops of Lugol's solution. Water samples were stored and later analyzed for concentration of all particles having diameters between 2-63 µm using a Coulter Multi-Sizer II. Therefore, for each animal (and control), particle concentrations were assessed at 0, 30, 60, 90 and 120 min (or more when initial feeding lagged). Regression curves were then fitted to the decline in particle concentration for the total feeding interval, and the equation was used to estimate an initial and final chamber concentration. If particle concentration in any beaker dropped below 50% of initial, then the later samples (any below 50%) were deleted from the regression to account for potential negative responses in feeding activity due to declining food quantity. Clearance rates for static chambers were calculated using the equation of Coughlan (1969): Clearance Rate (L/h) = [log Ci - log Cf] x [V / T] where Ci = particle concentration at the start of the incubation period, Cf = particle concentration at the end of the incubation period, V = chamber volume, and T = incubation time. Clearance rates refer to the volume of water that is swept clear of particles by bivalves per unit body weight and per unit time. Clearance rates for each mussel were then corrected for values measured in control beakers without
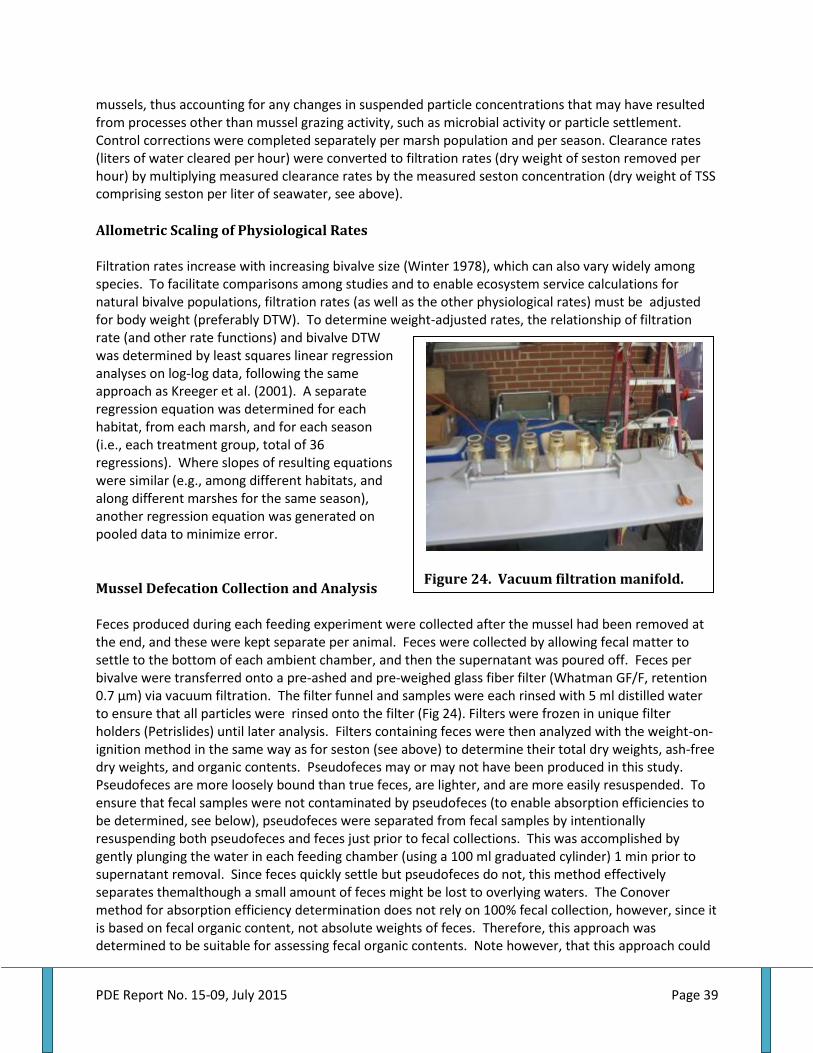
PDE Report No. 15-09, July 2015 Page 39
mussels, thus accounting for any changes in suspended particle concentrations that may have resulted from processes other than mussel grazing activity, such as microbial activity or particle settlement. Control corrections were completed separately per marsh population and per season. Clearance rates (liters of water cleared per hour) were converted to filtration rates (dry weight of seston removed per hour) by multiplying measured clearance rates by the measured seston concentration (dry weight of TSS comprising seston per liter of seawater, see above).
Allometric Scaling of Physiological Rates
Filtration rates increase with increasing bivalve size (Winter 1978), which can also vary widely among species. To facilitate comparisons among studies and to enable ecosystem service calculations for natural bivalve populations, filtration rates (as well as the other physiological rates) must be adjusted for body weight (preferably DTW). To determine weight-adjusted rates, the relationship of filtration rate (and other rate functions) and bivalve DTW was determined by least squares linear regression analyses on log-log data, following the same approach as Kreeger et al. (2001). A separate regression equation was determined for each habitat, from each marsh, and for each season (i.e., each treatment group, total of 36 regressions). Where slopes of resulting equations were similar (e.g., among different habitats, and along different marshes for the same season), another regression equation was generated on pooled data to minimize error.
Mussel Defecation Collection and Analysis
Feces produced during each feeding experiment were collected after the mussel had been removed at the end, and these were kept separate per animal. Feces were collected by allowing fecal matter to settle to the bottom of each ambient chamber, and then the supernatant was poured off. Feces per bivalve were transferred onto a pre-ashed and pre-weighed glass fiber filter (Whatman GF/F, retention 0.7 µm) via vacuum filtration. The filter funnel and samples were each rinsed with 5 ml distilled water to ensure that all particles were rinsed onto the filter (Fig 24). Filters were frozen in unique filter holders (Petrislides) until later analysis. Filters containing feces were then analyzed with the weight-on-ignition method in the same way as for seston (see above) to determine their total dry weights, ash-free dry weights, and organic contents. Pseudofeces may or may not have been produced in this study. Pseudofeces are more loosely bound than true feces, are lighter, and are more easily resuspended. To ensure that fecal samples were not contaminated by pseudofeces (to enable absorption efficiencies to be determined, see below), pseudofeces were separated from fecal samples by intentionally resuspending both pseudofeces and feces just prior to fecal collections. This was accomplished by gently plunging the water in each feeding chamber (using a 100 ml graduated cylinder) 1 min prior to supernatant removal. Since feces quickly settle but pseudofeces do not, this method effectively separates themalthough a small amount of feces might be lost to overlying waters. The Conover method for absorption efficiency determination does not rely on 100% fecal collection, however, since it is based on fecal organic content, not absolute weights of feces. Therefore, this approach was determined to be suitable for assessing fecal organic contents. Note however, that this approach could
Figure 24. Vacuum filtration manifold.

PDE Report No. 15-09, July 2015 Page 40
underestimate total biodeposition rates (a potential ecosystem service), since biodeposits can be comprised of feces and pseudofeces. Porewater and Nutrient Analysis Passive diffusion porewater equilibrators were deployed for a one month period running from late September to October 2013. Design followed Hughes et al. (2012), and equilibrators were deployed at
depths of 10 and 25 cm at each experimental plot. Porewaters were filtered using a 0.4 m filtering membrane, and analyzed for pH and salinity using an Accumet portable pH meter and YSI temperature, conductivity and salinity meter, and frozen at -20° C for later analysis. Porewater samples were analyzed for nitrate plus nitrite, ammonium and phosphate using an Astoria Pacific A2 micro-segmented flow autoanalyzer (U.S. EPA methods 350.1, 353.2, and 365.2). Similarly, water samples from feeding experiments were analyzed for ammonium only (U.S. EPA method 350.1).
Ribbed Mussel Body Metrics
At the conclusion of each feeding experiment, ribbed mussels had their shell length measured to ±0.01 mm. They were then weighed to ±0.01 g to get the total animal wet weight. Then they were sacrificed to allow for determination of each animal’s dry tissue weight and condition index. Shells were dried and then weighed. The tissues (and associated liquor) were frozen in Coulter vials at -20°C, and later were freeze-dried and then weighed to ±0.00001 g. The DTW of each animal was essential for constructing allometric relationships of physiological rate functions to body weight. Weight standardization also allowed for the best comparability of rate functions among species, environmental conditions, and studies. Freeze-dried tissues from individual bivalves have been stored and are available to be pulverized with a mortar and pestle at a later date for other potential future assays (e.g. proximate biochemical composition, stable isotope composition, elemental stoichiometry, etc).
Assessment of Nitrogen Removal From Feeding Experiment
For each glass fiber filter containing either seston food or mussel feces, sub-samples were analyzed for total N using a Flash EA112 elemental analyzer. Because analysis of large filter portions (e.g. ¼) resulted in incomplete combustion, adherence of combusted material to the column, and poor replication, filters were subsampled using a hole punch. Standard quality assurance methods were followed, including the running of check standards, and every fifth sample was run in duplicate. Duplicates run using the hole punch differed in estimates of whole filter N and C by a median of 12.8 µg of N and 126 µg of C. Duplicates run using the filter portion method differed by a median of 28.3 µg of N and 645 µg of C.

PDE Report No. 15-09, July 2015 Page 41
Statistical Analysis
All statistical analyses were conducted using R x64 3.03 open source statistical software and were conducted at a=0.05 level. Relationships among and within marshes by habitat were conducted using one-way Analysis of Variance and Tukey post-hoc test of Honestly Significant Differences. Analysis of effects of mussels on various metrics was conducted using simple linear regression. Analysis of Covariance (ANCOVA) tests were run for all significant regressions between ribbed mussel biomass and marsh process response variables. For all analyses, predictive relationships were evaluated using a nested linear mixed effects model with the structure shown in figure 25.
The lme4 mixed effects modeling package (Bates, 2010) was used for evaluation of the magnitude of the effect of fixed factors on all response variables in terms of levels of the random factors. Levels of River and Site were considered random effects in all models as all rivers and the sites they contain are independent, non-replicates, of all other rivers and the sites they contain. Levels of Habitat and Region were considered fixed effects in all models as habitat type and respective estuaries were actively selected. Habitat was replicated in the same manner across all rivers and sites. Since each site was located in a particular river, and each contained all fixed habitats levels, a nested design was used in evaluation of the magnitude of random effects. All other measured continuous and factorial independent variables of interest were considered fixed effects including: mussel biomass, depth, nutrient concentrations, below and aboveground biomass, and accretion. This model allows for the nesting of random effects River and Site, as denoted by River:Site coding, to reflect the sources of variance in the data. The position labeled “A” in the Fig 25 is used to estimate the effect that the levels of random factors have on the fixed effects. This model allows for the correlation of fixed effect with random effects River and Site, as denoted by A|River:Site coding. That is, the model allows for the possibility that the measurements of fixed effects at each Site may be strongly affected by the River they are located in and that distinct observational units within each Site correspond to distinct levels of River. A “1” in the position represents the most parsimonious model and indicated that the fixed factor effects do not change based on the levels of the random factors (i.e., there is no difference in slopes of fixed factor effects by random factor levels; no interaction). To test for the interactive effects of fixed and random factors a series of models were constructed ranging with all interaction between fixed factors in “A” position, reduced to additive fixed factor effects in the “A” position, reduced to singular fixed effects in the “A” position, and finally reduced to not fixed effects (1) in the “A” position. When evaluating the effects of the most simplistic form of each model, A=1, a maximum likelihood estimator was used and denoted in the coding as REML=F. When testing the effects of variance within a fixed factor over the levels of a random factor, a restricted maximum likelihood estimator was used , and was denoted in the coding as REML=T. These models were subsequently compared to find the best fit model (lowest AIC score), for which post-hoc tests were used to determine significant effect by factors on the response.
Response~ FF1*FFn *Habitat(FF)+Position(Fixed Factor) + (A|River(RF):Site(RF))
Figure 25. Structure of nested linear mixed effect model used for analysis. FF = Fixed Factor.

PDE Report No. 15-09, July 2015 Page 42
Figure 26. Total suspended solids (TSS)(mg/L) by marsh and season. DC: Dividing Creek; DN: Dennis Creek; MR: Maurice River; RI: Rhode Island Cogshall Cove. Letters represent results of Tukey HSD post-hoc significance tests. Capital letters indicate significant differences by marsh and lower case letters indicate significant differences within marshes by habitat. Error bars represent standard errors of the means.
Results: Seasonal Seston and Mussel Physiology
Seasonal Seston Analyses
Total Suspended Solids (TSS)
Total Suspended Solids (TSS) varied among and within marshes seasonally (Fig 26). There was no consistent pattern across factor levels. Fall TSS samples were collected 11 days post super-storm Sandy, and are likely high due to residual TSS than its NJ counterparts during the summer.
Total Suspended Solid Percent Organics
TSS percent organics did not significantly vary by season, but did vary within season by marsh (Fig 27, Table 3). In the fall and spring, Dividing Creek had significantly higher percent TSS organic concentrations than Dennis Creek and the Maurice River, of which the latter two only slightly differed in fall and were similar in spring. In the summer in the NJ, the Maurice River had significantly higher TSS percent organics than Dividing and Dennis Creeks, which did not differ. RI had the significantly highest TSS percent organics of all marshes. Total Suspended Solid Particulate Nitrogen TSS particulate N concentrations varied by season and by marsh within season (Fig 28). Dennis Creek had the highest TSS particulate N concentrations in the fall and summer, with lower concentrations measured in the spring. Maurice River had relatively consistent TSS particulate N concentrations throughout the year, with a slight increase observed in the spring. Overall, the NJ reported higher concentrations in the summer than were measured in RI.

PDE Report No. 15-09, July 2015 Page 43
Table 3. Total suspended solid (TSS) quantity, percent organics, seston nitrogen and C:N by marsh and season. X = no sample.
Figure 27. TSS percent organics by marsh and season. DC: Dividing Creek; DN: Dennis Creek; MR: Maurice River; RI: Rhode Island Cogshall Cove. Letters represent results of Tukey HSD post-hoc significance tests. Capital letters indicate significant differences by marsh and lower case letters indicate significant differences within marshes by habitat. Error bars represent standard errors of the means.

PDE Report No. 15-09, July 2015 Page 44
Total Suspended Solid Carbon to Nitrogen Ratio Total suspended solid C:N showed some seasonal variation between fall/spring and summer (Fig 29). Summer ratios were significantly lower when pooled by marsh. Within seasons variation among marshes was measured in the fall and summer, with consistent observations reported during the spring. In the fall, Dennis Creek had higher C:N than in Dividing Creek and Maurice River which did not significantly differ. During the summer, no significant differences were measured between the NJ marshes and RI sites, although significant variation between all NJ marshes was observed.
Seasonal Mussel Physiology Experiments
Ribbed Mussel Shell Length
Ribbed mussel shell length varied among and within marshes by habitat (Fig 30). Generally mussel shell length was smaller in high marsh habitats than in rivers and
creeks, but this difference was not always significant. The variation in shell length among rivers was not significantly different among rivers of the NJ and the RI sites. Averaged across all habitats, the shell length of ribbed mussels was 61.22 mm, 56.99 mm, 53.20 mm and 62.46 mm in DC, DN, MR and RI, respectively. Averaged across all study marshes, the SL was 46.17 mm, 62.43 mm and 64.58 mm in high marsh, creeks and along rivers, respectively. Across all habitats and marshes, the average size was 59.43 mm (Table 4).
Figure 28. TSS particulate nitrogen concentration by marsh and season. DC: Dividing Creek; DN: Dennis Creek; MR: Maurice River; RI: Rhode Island Cogshall Cove. Letters represent results of Tukey HSD post-hoc significance tests. Capital letters indicate significant differences by marsh and lower case letters indicate significant differences within marshes by habitat. Error bars represent standard errors of the means.
Table 4. Ribbed mussel average shell length and dry tissue weight (DTW) by marsh, habitat and overall.

PDE Report No. 15-09, July 2015 Page 45
Figure 29. TSS carbon to nitrogen ratio by marsh and season. DC: Dividing Creek; DN: Dennis Creek; MR: Maurice River; RI: Rhode Island Cogshall Cove. Letters represent results of Tukey HSD post-hoc significance tests. Capital letters indicate significant differences by marsh and lower case letters indicate significant differences within marshes by habitat. Error bars represent standard errors of the means.
Figure 30. Ribbed mussel shell length by habitat within each marsh. DC: Dividing Creek; DN: Dennis Creek; MR: Maurice River; RI: Rhode Island Cogshall Cove. Letters represent results of Tukey HSD post-hoc significance tests. Capital letters indicate significant differences by marsh and lower case letters indicate significant differences within marshes by habitat. Error bars represent standard errors of the means.

PDE Report No. 15-09, July 2015 Page 46
Figure 31. Ribbed mussel dry tissue weight by habitat within each marsh. DC: Dividing Creek; DN: Dennis Creek; MR: Maurice River; RI: Rhode Island Cogshall Cove. Letters represent results of Tukey HSD post-hoc significance tests. Capital letters indicate significant differences by marsh and lower case letters indicate significant differences within marshes by habitat. Error bars represent standard errors of the means
Figure 32. Ribbed mussel clearance rate by habitat within each marsh. DC: Dividing Creek; DN: Dennis Creek; MR: Maurice River; RI: Rhode Island Cogshall Cove. Letters represent results of Tukey HSD post-hoc significance tests. Capital letters indicate significant differences by marsh and lower case letters indicate significant differences within marshes by habitat. Error bars represent standard errors of the means.

PDE Report No. 15-09, July 2015 Page 47
Ribbed Mussel Dry Tissue Weight Ribbed mussel DTW also varied by marsh and habitat (Fig 31). High marsh mussels were significantly lighter than mussels in creeks and rivers in all marshes except the Maurice River. Mussel populations at the Maurice Rivers study sites were highly patchy and historically high erosion rates have resulted in loss of large amounts of the edge populations. This decline in long-term resident mussel populations may explain not only the similarity in weight of mussels across habitats, but also the small size class range observed across all habitats. Mussel weight in Dennis Creek was not significantly different than the weight in Maurice River and may be indicative of similar mussel population dynamics which resulted in the loss of older, typically larger, mussels. Dividing Creek and RI mussels were larger in creeks and rivers than in the high marsh, which reflects the more typical pattern expected based on previous studies. Averaged across all habitats, the DTW of ribbed mussels was 0.50 g, 0.42 g, 0.31 g and 0.87 g in DC, DN, MR and RI, respectively. Averaged across all study marshes, the DTW was 0.22 g, 0.58 g and 0.97 g in high marsh, creeks and along rivers, respectively. Across all habitats and marshes, the average weight was 0.59 g (Table 4).
Ribbed Mussel Clearance Rates
In general, bivalves clear water at generally constant rates across a wide spectrum of food (seston) concentrations and qualities, with the exception that they reduce feeding activity at very low or very high concentrations that become inefficient for optimal foraging. The magnitude of the clearance rate varies by species, body size, temperature (season). Instead of regulating clearance rates, bivalves optimize energy balance by more careful adjustments of particle selection and digestion processes, following particle capture. Hence, not surprisingly, weight-specific clearance rates generally were consistent within each season (temperature) among marshes and habitats. Some subtle variability was found, as mentioned below. Averaged across all assessed populations (marsh, habitat, season), the weight-specific clearance rate of ribbed mussels was 0.04, 0.33 and 0.61 L h-1g DTW-1 in fall (8.2oC), spring (16.2oC), and summer (23.9oC), respectively. These clearance rates were somewhat lower than those typically report for G. demissa feeding on natural diets, which are usually greater than 1 L h-1 g DTW-1 during the growing season (e.g., Kreeger and Newell 2001). Further data analysis is planned to verify that the absolute values reported here are correct; however, the relative differences among habitats, marshes and seasons are considered correct and representative.
Clearance Rate by Marsh and Habitat
Significant differences were measured in ribbed mussel clearance rates among marshes, but within marshes, clearance rates did not differ significantly by habitat (Fig 32). Although mussels in the Maurice River and RI had slightly higher clearance rates overall, and Dennis Creek the lowest, this was significant only during spring and compared only among NJ study sites.
Clearance Rate by Season
As noted above, the clearance rate of ribbed mussels varied most among seasons (Fig 33, Table 5). Like other bivalves, key physiological rate functions are temperature dependent. Highest clearance rates occurred during summer, but were not significantly different among marshes as noted above.

PDE Report No. 15-09, July 2015 Page 48
Filtration Rates
Filtration Rate by Marsh and Habitat
Although clearance rates were generally similar among marshes (per season), annual filtration rates significantly differed among marshes within each season (Fig. 34, Table 5). These differences were only significant in spring and fall, and they resulted largely because of variability among marshes in seston concentrations (see above) at those times rather than mussel physiology (filtration = clearance x food availability). Within marshes, filtration rates across habitats were generally consistent (Fig. 35), except that filtration rates of mussels along rivers in RI were significantly lower than those measured in the high marsh and in creeks. Averaged across all assessed populations (marsh, habitat, season), the weight-specific filtration rate of ribbed mussels was 31.09 mg h-1 g DTW-1.
Table 5. Averaged ribbed mussel weight specific clearance rate, filtration rate and particulate nitrogen filtration rate by marsh and season. X = no sample.

PDE Report No. 15-09, July 2015 Page 49
Figure 34. Ribbed mussel filtration rate by marsh seasonally. Temperature at the time of each experiment was as follows: Fall 8°C; Spring 15°C; Summer 22°C. DC: Dividing Creek; DN: Dennis Creek; MR: Maurice River; RI: Rhode Island Cogshall Cove. Letters represent results of Tukey HSD post-hoc significance tests. Capital letters indicate significant differences by marsh and lower case letters indicate significant differences within marshes by habitat. Error bars represent standard errors of the means.
Figure 33. Ribbed mussel clearance rate seasonally by marsh. Temperature at the time of each experiment was as follows: Fall 8°C; Spring 15°C; Summer 22°C. DC: Dividing Creek; DN: Dennis Creek; MR: Maurice River; RI: Rhode Island Cogshall Cove. Letters represent results of Tukey HSD post-hoc significance tests. Capital letters indicate significant differences by marsh and lower case letters indicate significant differences within marshes by habitat. Error bars represent standard errors of the means.

PDE Report No. 15-09, July 2015 Page 50
Figure 35. Ribbed mussel filtration rate by marsh and habitat. Temperature at the time of each experiment was as follows: Fall 8°C; Spring 15°C; Summer 22°C. DC: Dividing Creek; DN: Dennis Creek; MR: Maurice River; RI: Rhode Island Cogshall Cove. Letters represent results of Tukey HSD post-hoc significance tests. Capital letters indicate significant differences by marsh and lower case letters indicate significant differences within marshes by habitat. Error bars represent standard errors of the means.
Figure 36. Ribbed mussel clearance rate by habitat seasonally. Temperature at the time of each experiment was as follows: Fall 8°C; Spring 15°C; Summer 22°C. DC: Dividing Creek; DN: Dennis Creek; MR: Maurice River; RI: Rhode Island Cogshall Cove. Letters represent results of Tukey HSD post-hoc significance tests. Capital letters indicate significant differences by marsh and lower case letters indicate significant differences within marshes by habitat. Error bars represent standard errors of the means.

PDE Report No. 15-09, July 2015 Page 51
Filtration Rate by Season Due mostly to seasonal (temperature-related) variation in seasonal clearance rates, the filtration rates of ribbed mussels mainly varied among seasons (Figs 36 and 37). Lowest seasonal filtration rates were measured in the fall, and consistently high rates were recorded across all marshes in summer. Subtle variability in filtration rates among different mussel treatment groups could also have been influenced by changes in food quality and seasonal nutritional demands, although as mentioned above mussels generally adjust for these factors through post-ingestive physiological processes. Averaged across all assessed populations (marsh and habitat), the weight-specific filtration rate of ribbed mussels was 5.86, 28.69 and 48.71 mgh-1 g DTW-1 in fall (8.2oC), spring (16.2oC), and summer (23.9oC), respectively. Filtration rates in the Maurice River differed significantly across seasons. As in Dennis and Dividing Creeks, Maurice River fall filtration rates were low with no variability across habitats. Spring filtration rates were the highest measured of all marshes and are reflective of the high clearance rates measured in Maurice in the spring (Fig 38).
Filtration Rate Factor Interactions
Filtration rates in Dividing Creek were greatest in summer; however, filtration rates in Maurice marshes were greatest in spring (Table 5). Indeed, the greatest variability among marshes occurred during spring when mussels from Dennis Creek had filtration rates that were as low as during fall but Maurice mussels filtered at highest seasonal rates. A subtler interaction was detected between habitat and season whereby creek mussels in Dividing Creek filtered faster in spring than other habitats, but not in other seasons, or overall averaged among all marshes (Fig 38). The finding that high marsh mussels generally did not filter seston at significantly faster rates than creek or river mussels (during any site or season) is interesting because it suggests that ribbed mussels do not attempt to compensate for shorter feeding times by acquiring food more quickly. The only case where high marsh mussels filtered faster was in RI during the one summer experiment when mussels from both the high marsh and creeks filtered faster than mussels from the river (Fig 38).
Figure 37. Ribbed mussel filtration rate by habitat and season. Letters represent results of Tukey HSD post-hoc significance tests. Capital letters indicate significant differences by marsh and lower case letters indicate significant differences within marshes by habitat. Error bars represent standard errors of the means.

PDE Report No. 15-09, July 2015 Page 52
Defecation Rates Similar to clearance and filtration rates, rates of fecal matter production by ribbed mussels varied among and within season, but overall, Dividing Creek showed the lowest defecation rates by season among marshes in the NJ, and RI was lowest among all marshes (Fig 39, Table 6). Within marshes, Dividing and Dennis Creeks saw consistent rates in low marsh areas, with higher rates in the high marsh, unlike Maurice River and RI that had no inter-marsh variability (Fig 40). Averaged seasonally among all habitats and marshes, defecation rates were 45.37 mg h-1 g DTW-1. Averaged among habitats and marshes per season, defecation rates were 41.51 36.21 and 62.23 mg hr-1 gDTW-1 during spring, summer and fall, respectively.
Figure 38. Ribbed mussel filtration rate within each marsh by habitat and season. Letters represent results of Tukey HSD post-hoc significance tests. Capital letters indicate significant differences by marsh and lower case letters indicate significant differences within marshes by habitat. Error bars represent standard errors of the means.
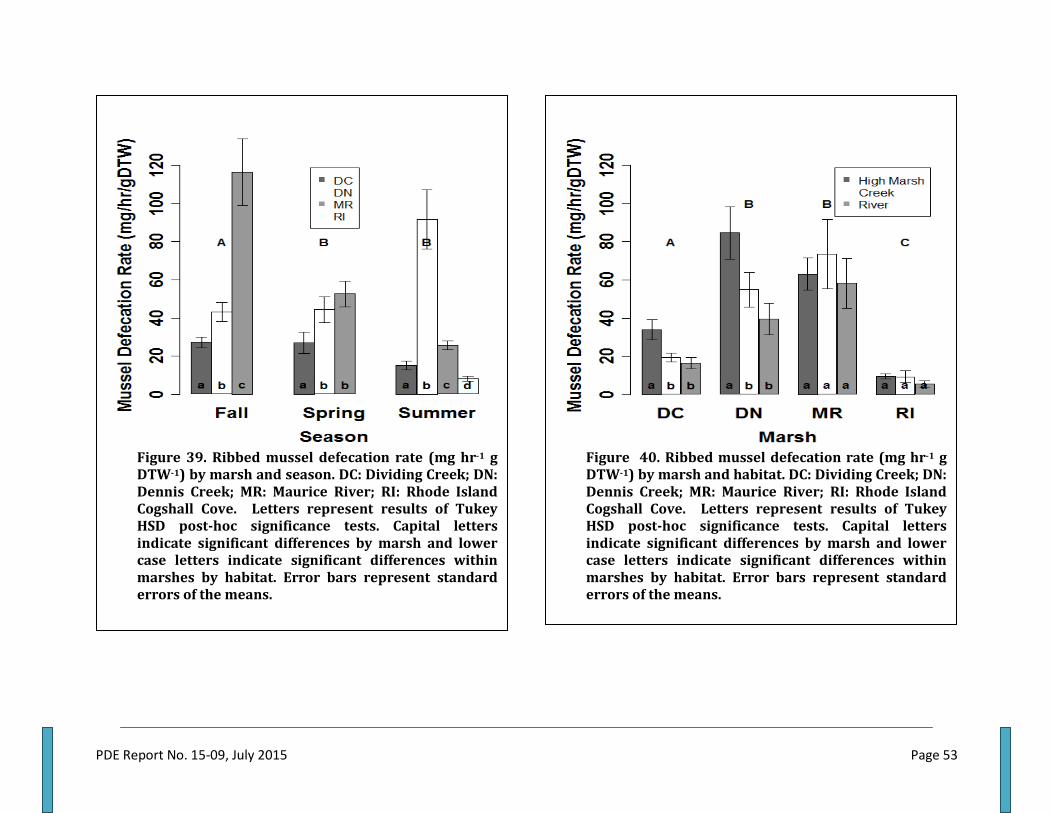
PDE Report No. 15-09, July 2015 Page 53
Figure 40. Ribbed mussel defecation rate (mg hr-1 g DTW-1) by marsh and habitat. DC: Dividing Creek; DN: Dennis Creek; MR: Maurice River; RI: Rhode Island Cogshall Cove. Letters represent results of Tukey HSD post-hoc significance tests. Capital letters indicate significant differences by marsh and lower case letters indicate significant differences within marshes by habitat. Error bars represent standard errors of the means.
Figure 39. Ribbed mussel defecation rate (mg hr-1 g DTW-1) by marsh and season. DC: Dividing Creek; DN: Dennis Creek; MR: Maurice River; RI: Rhode Island Cogshall Cove. Letters represent results of Tukey HSD post-hoc significance tests. Capital letters indicate significant differences by marsh and lower case letters indicate significant differences within marshes by habitat. Error bars represent standard errors of the means.

PDE Report No. 15-09, July 2015 Page 54
Fecal Nitrogen Ribbed mussel fecal N content differed significantly by region; NJ ribbed mussels produced a higher concentration of fecal N than their counterparts in RI (Table 6). Very little variability was measured among habitats within marshes; only in Dividing Creek was any significant habitat difference detected. Among marshes of NJ, no significant differences were measured among marshes regarding the production of ribbed mussel fecal N (Table 6). Ribbed mussel fecal N varied within and among seasons (Fig 41 and Fig 42) with no clear pattern regarding production differences. Maurice River had the highest production in the fall and spring with reduced production in summer. Dividing and Dennis Creeks ribbed mussels fecal N production was between 200-300 µg/animal across all seasons, and although statistically different in the fall and summer, were similar in terms of annual rates. RI ribbed mussel fecal N production was low, but not statistically different from Maurice River in the summer (Fig 41).
Table 6. Ribbed mussel defecation and fecal nutrient statistics averaged by marsh and season.

PDE Report No. 15-09, July 2015 Page 55
Figure 41. Ribbed mussel nitrogen defecation rate (µgN h-1 g DTW-1) by marsh by season. DC: Dividing Creek; DN: Dennis Creek; MR: Maurice River; RI: Rhode Island Cogshall Cove. Letters represent results of Tukey HSD post-hoc significance tests. Capital letters indicate significant differences by marsh and lower case letters indicate significant differences within marshes by habitat. Error bars represent standard errors of the means.
Figure 42. Ribbed mussel nitrogen defecation rate (µgN h-1 g DTW-1) by marsh by habitat. DC: Dividing Creek; DN: Dennis Creek; MR: Maurice River; RI: Rhode Island Cogshall Cove. Letters represent results of Tukey HSD post-hoc significance tests. Capital letters indicate significant differences by marsh and lower case letters indicate significant differences within marshes by habitat. Error bars represent standard errors of the means.

PDE Report No. 15-09, July 2015 Page 56
Averaged seasonally among all habitats and marshes, fecal N was produced at the rate of 304.14 µg N h-
1 g DTW-1. Averaged among habitats and marshes per season, fecal N production was 320.25, 264.21 and 350.17 µg N h-1gDTW-1 during spring, summer and fall, respectively. Excretion Rates Similar to clearance and filtration rates, rates of ammonia excretion by ribbed mussels varied by season, with lower excretion rates measured in the fall than in the spring and summer. Within seasons, a similar pattern among NJ marshes was present, although not always statistically significant. Dennis Creek had the highest measured excretion rates across all seasons followed by the Maurice River, with Dividing Creek the lowest. During the summer, RI had the lowest ammonia excretion rate mean, but it was not statistically lower than Dividing Creek (Fig 43 and Fig 44). Within marshes, the two marshes with the highest ammonia excretion rates, Dennis Creek and Maurice River, had no significant differences among habitats, but the two marshes with lower rates, Dividing Creek and RI did. Within these two marshes, ammonia excretion was highest in the high marsh and lower along the edge habitats. In RI, the river habitat was significantly lower than the creek, which was not the case in Dividing Creek (Fig 44). Averaged seasonally among all habitats and marshes, ammonia was excreted at the rate of 130.95 µg NH4-N h-1 g DTW-1. Averaged among habitats and marshes per season, ammonia excretion rates were 131.86, 163.78 and 76.12 µg NH4h
-1gDTW-1 during spring, summer and fall, respectively. Ribbed Mussel Nitrogen Balance Nitrogen budgets per ribbed mussel were constructed by contrasting the estimated ingestion rate of particulate N with the losses of dissolved N (ammonia excretion) and particulate N (defecation). Ingested N (I) was determined by multiplying the seston filtration rate of an individual mussel by the appropriate seston N content (the diet delivered to the mussel) (see above for metrics), and this assumed that no N was rejected in pseudofeces. Excreted (E) ammonia-associated N (NH4-N) losses per mussel were as described above. Defecated N (F) was determined by multiplying the defecation rate
Figure 43. Ribbed mussel ammonia excretion rate (ugNH4/hr/gDTW) by marsh by season. DC: Dividing Creek; DN: Dennis Creek; MR: Maurice River; RI: Rhode Island Cogshall Cove. Letters represent results of Tukey HSD post-hoc significance tests. Capital letters indicate significant differences by marsh and lower case letters indicate significant differences within marshes by habitat. Error bars represent standard errors of the means.

PDE Report No. 15-09, July 2015 Page 57
(per mussel) by the measured fecal N content (per mussel). Nitrogen that was retained by the mussel for production (P; i.e., for growth and reproduction) was indirectly estimated as follows: P = I – (E + F) All metrics were expressed as physiological processing rates for N (units = µg N per hour per g DTW). Since no N is lost via respiration, the N used for production is equivalent to the net absorption rate (NAR) for dietary N. Hence, the percentage of filtered N that was retained for production represents the N utilization efficiency. Ribbed mussel ingestion rates followed similar patterns as clearance and filtration rates with the lowest values measured in the fall, higher but more variable rates in the spring, and the generally highest rates in the summer. As with clearance and filtration rates, Maurice River ingestion rates were similar in the spring and summer and RI was the lowest of all ingestion rates in the summer (Fig 45). Within NJ marshes there no variation among habitats in mussel ingestion rates, but some difference was detected in RI marshes with the creek habitat having significantly lower ingestion rates than the high marsh (Fig 46). Averaged seasonally among all habitats and marshes, ribbed mussels ingested N at the rate of 232.72 µg N h-1 g DTW-1. Averaged among habitats and marshes per season, ingestion rates were 206.29, 366.03 and 46.27 µg NH4 h
-1 g DTW-1 during spring, summer and fall, respectively. NAR of ribbed mussels was generally negative (Table 7), indicating that mussels were not retaining N during our physiology experiments. This was unexpected, but not unprecedented, because ribbed mussels have the capacity to “time optimize” N balance, whereby they sequester N at some times of the year (i.e. “protein sparing”), whereas at other times they can simply catabolize organic forms of N as an energy source. Further data analysis is planned to double check these values and further interpret these results. If confirmed, these results might indicate that ribbed mussels are not N-limited nutritionally in these marshes where system-level N loadings are high. Three exceptions where the NAR value was positive were in Dividing Creek, Dennis Creek, and Maurice River during the summer (Table 7). Averaged seasonally among all habitats and marshes, net rates of NAR were -202.37 µg h-1 g DTW-1. Averaged among habitats and marshes per season, defecation rates were -245.81, -61.96 and -380.02 µg h-1 g DTW-1 during spring, summer and fall, respectively.
Figure 44. Ribbed mussel ammonia excretion rate (ugNH4/hr/gDTW) by marsh and habitat. DC: Dividing Creek; DN: Dennis Creek; MR: Maurice River; RI: Rhode Island Cogshall Cove. Letters represent results of Tukey HSD post-hoc significance tests. Capital letters indicate significant differences by marsh and lower case letters indicate significant differences within marshes by habitat. Error bars represent standard errors of the means.

PDE Report No. 15-09, July 2015 Page 58
Figure 45. Ribbed mussel nitrogen ingestion rate (ugN/hr/gDTW) by marsh by season. DC: Dividing Creek; DN: Dennis Creek; MR: Maurice River; RI: Rhode Island Cogshall Cove. Letters represent results of Tukey HSD post-hoc significance tests. Capital letters indicate significant differences by marsh and lower case letters indicate significant differences within marshes by habitat. Error bars represent standard errors of the means.
Figure 46. Ribbed mussel ingestion rate (ugN/hr/gDTW) by marsh and habitat. DC: Dividing Creek; DN: Dennis Creek; MR: Maurice River; RI: Rhode Island Cogshall Cove. Letters represent results of Tukey HSD post-hoc significance tests. Capital letters indicate significant differences by marsh and lower case letters indicate significant differences within marshes by habitat. Error bars represent standard errors of the means.

PDE Report No. 15-09, July 2015 Page 59
Results: Field Monitoring and Site Characterization
Ribbed Mussel Metrics
Ribbed Mussel Lip Counts by Marsh and Habitat Ribbed mussel lip counts varied by marsh and habitat (Fig 47). Among marshes, RI had the highest mussel counts and the Maurice River had the lowest. Within study marshes, creeks had high mussel densities in all marshes but the Maurice River. Dennis and Dividing Creeks ribbed mussel creek populations were significantly higher than their respective high marsh and river populations. Dividing Creek high marsh and river populations were not significantly different. Dennis Creek ribbed mussels were virtually non-existent along the river, but had abundant mussels in the high marsh. The Maurice River had similar populations in the creeks and along the river and lower population densities in the high marsh. RI had large
Table 7. Ingestion, excretion, defecation and net absorption rate of nitrogen by ribbed mussels.
Figure 47. Ribbed mussel field lip counts by marsh and habitat. DC: Dividing Creek; DN: Dennis Creek; MR: Maurice River; RI: Rhode Island Cogshall Cove. Letters represent results of Tukey HSD post-hoc significance tests. Capital letters indicate significant differences by marsh and lower case letters indicate significant differences within marshes by habitat. Error bars represent standard errors of the means.

PDE Report No. 15-09, July 2015 Page 60
populations along the river and in the creeks, with lower densities measured in the high marsh. High variability of mussel populations, as evidenced by the standard error bars, was evident in all marshes and habitats within marshes. Among marshes, lip counts of mussels were 41.46, 47.85, 25.29, 69.19 mussels m-2 for Dividing Creek, Dennis Creek, Maurice River and RI, respectively. In NJ, the average lip counts by habitat were 22.07, 232.04 and 4.11 mussels m-2 for the high marsh, creek and river, respectively. Compared with RI counts of 20.78, 87.72 and 99.06 mussels m-2 for the high marsh creek and river, the NJ has extremely lower mussel populations along the river edges, but dense creek populations. High marsh populations were similar between regions. Ribbed Mussel Shell Lengths by Marsh and Habitat Ribbed mussels shell lengths differed among and with within marshes by habitat. Shell lengths of mussels in Dividing and Dennis Creeks were largest in creeks with similar shell heights measured along the rivers and in the high marsh. In the Maurice River the smallest mussels were in the high marsh and the largest were along the river. RI mussels were largest in the creeks and along the river, with the smallest mussels in the high marsh (Fig 48). Among regions, RI mussels were slightly larger on average (62.46mm) than NJ mussels (57.58mm). High marsh and creek populations were very similar in size between NJ and RI (46.63mm and 45.18mm for the high marsh and 62.20mm and 63.06mm for the creek, respectively). Larger differences in size were found for river edge populations: NJ mussels averaged 52.88 mm and RI mussels averaged 69.26 mm. Ribbed Mussel Biomass by Marsh and Habitat Within NJ, ribbed mussel biomass per square meter did not differ among marshes overall. However, the distribution of mussel biomass within marshes (among habitat types) did vary significantly (Fig 49). Ribbed mussel biomass in Dividing and Dennis Creeks was highly concentrated in the creeks, whereas, significantly lower and similar biomass concentrations measured along the river and in the high marsh. The Maurice River had consistently low mussel biomass across all habitats, with the largest variation observed along the river. Overall, ribbed mussel biomass was higher in RI than in NJ, with the highest concentration of mussels concentrated in the creeks and the lowest concentration in the high marsh. All habitats in RI were significantly different in mussel biomass. Average ribbed mussel biomass was greatest in RI (188.22 g DTW m-2) than in any marsh in NJ (DC=47.41 g DTW m-2, DN=58.48 g DTW m-2 and MR=27.28 g DTW m-2), with the greatest differences in the low marsh creek and river habitats. NJ mussel biomass was 102.99 and 21.63 g DTW m-2 for the creek and river, respectively, while biomass in RI was measured at 183.87 and 371.20 g DTW m-2 for the creek and river habitats. High marsh mussels biomass values were similar between NJ and RI at 8.56 and 9.59 g DTW m-2, respectively. As will be discussed below, the high variability in mussel biomass along river edges appeared to be related to varying rates of shoreline erosion among the studied marsh systems. In general, rates of shoreline erosion are much greater in NJ (typically >1 m year-1), which might explain why river edge habitats in NJ had substantially lower mussel biomass (21.6 g DTW m-2) than in RI marshes (371.2 g DTW m-2).

PDE Report No. 15-09, July 2015 Page 61
Figure 48. Ribbed mussel shell height by marsh and habitat. DC: Dividing Creek; DN: Dennis Creek; MR: Maurice River; RI: Rhode Island Cogshall Cove. Letters represent results of Tukey HSD post-hoc significance tests. Capital letters indicate significant differences by marsh and lower case letters indicate significant differences within marshes by habitat. Error bars represent standard errors of the means.
Figure 49. Ribbed mussel biomass by marsh and habitat. DC: Dividing Creek; DN: Dennis Creek; MR: Maurice River; RI: Rhode Island Cogshall Cove. Letters represent results of Tukey HSD post-hoc significance tests. Capital letters indicate significant differences by marsh and lower case letters indicate significant differences within marshes by habitat. Error bars represent standard errors of the means.

PDE Report No. 15-09, July 2015 Page 62
Vegetation Metrics
Total Aboveground Biomass Total aboveground biomass did not differ overall among marshes and exhibited large variation within marshes. For example, differences by habitat were measured in Dennis Creek with the high marsh having significantly lower biomass than the creek or river habitats. Generally, with most marshes (Dividing Creek, Maurice River and RI), the mean high marsh aboveground biomass was lower than the creek and river, but due to the large variation within the latter habitats, the differences were not found to be statistically significant. Aboveground biomass in the Maurice River had similar means and variation, and was statistically similar across all habitats (Fig 50). Pooled data for habitats of different marshes, mean aboveground biomass was 535.29, 743.28 and 855.61 g m-2 for the high marsh, creek and river habitats, respectively. Along the river, Dennis Creek had the highest aboveground biomass (1241 g m-2) and RI has the lowest (660.95 g m-2) (Table 8). Live Belowground Biomass In NJ, live belowground biomass showed variation among, but not within marshes. Although means appeared to differ among habitats within marshes, the large degree of variation observed obscured these differences and no relationships were statistically significant. Generally, marshes had the highest belowground biomass in the high marsh, with lower average amounts collected in the creeks and rivers. These results are consistent with results from other studies where peat accumulation is more robust at higher elevations. The Maurice River had the significantly lowest pooled live belowground biomass among marshes (Fig 51), which is also consistent with data from the Mid-Atlantic Coastal Wetland Assessment.
Figure 50. Total aboveground biomass by marsh and habitat. DC: Dividing Creek; DN: Dennis Creek; MR: Maurice River; RI: Rhode Island Cogshall Cove Letters represent results of Tukey HSD post-hoc significance tests. Capital letters indicate significant differences by marsh and lower case letters indicate significant differences within marshes by habitat. Error bars represent standard errors of the means.

PDE Report No. 15-09, July 2015 Page 63
Table 8. Ribbed mussels, total aboveground, total belowground and aboveground belowground ratios of biomass (AGB:BGB).
Figure 51. Live belowground biomass by marsh and habitat. DC: Dividing Creek; DN: Dennis Creek; MR: Maurice River; RI: Rhode Island Cogshall Cove. Letters represent results of Tukey HSD post-hoc significance tests. Capital letters indicate significant differences by marsh and lower case letters indicate significant differences within marshes by habitat. Error bars represent standard errors of the means.

PDE Report No. 15-09, July 2015 Page 64
Averaged within marshes, RI had higher live belowground biomass than the NJ marshes at 42.19 compared to 31.29, 35.71 and 25.47 g core -1 for Dividing Creek, Dennis Creek and Maurice River, respectively. Pooled among marshes, live belowground biomass for the high marsh, creek and river were 45.06, 25.30 and 29.59 g core-1 respectively, with RI having larger values than all NJ sites in the high marsh and along the river (62.40 and 36.80 g core-1) and was only slightly less than Dividing Creek along the inter-marsh creeks (27.37 and 28.73 g core-1, respectively). Appendix A includes a series of graphs that depict variation in key belowground metrics with depth below the sediment surface, resulting from analysis of different depth sections of cores. By Depth, live belowground biomass did not differ among habitats in Dividing Creek or Maurice River . Dennis Creek had higher values than the creek and river, which did not significantly differ in the high marsh at 5 cm and 20 cm, but did not vary in creek or river significantly at 1, 10 or 30 cm depths. RI had higher live belowground biomass in the high marsh than the creek and river at shallower depths 1-10 cm, but was not significantly greater below 20 cm (Figure A1) Dead Belowground Biomass Dead belowground biomass was not significantly different among marshes of the NJ, but was significantly lower in the NJ among all marshes (14.23 g core-
1) than in RI 33.20 g core -1). High variation was measured by habitats within marshes and no clear pattern across habitats within marshes was observed. Pooled, the highest mean within marshes was in the high marsh at 27.86 compared to 13.53 and 15.54 g core -1 for the creek and river habitats (Fig 52). Similar to live belowground biomass, Dividing Creek and Maurice River dead belowground biomass did not differ significantly by depth, and were consistent by depth with the exception of the high marsh in the Maurice River from 3 to 7g. Dennis Creek and RI dead belowground biomass was significantly higher below 5cm in the high marsh than in the creek and river (Figure A1)
Figure 52. Dead belowground biomass by marsh and habitat. DC: Dividing Creek; DN: Dennis Creek; MR: Maurice River; RI: Rhode Island Cogshall Cove. Letters represent results of Tukey HSD post-hoc significance tests. Capital letters indicate significant differences by marsh and lower case letters indicate significant differences within marshes by habitat. Error bars represent standard errors of the means.

PDE Report No. 15-09, July 2015 Page 65
Total Belowground Biomass Total belowground biomass differed significantly among marshes, with mean values of 75.39, 48.46, 46.71 and 37.50 g core-1 for RI, Dividing Creek, Dennis Creek and Maurice River respectively. RI was significantly higher than all NJ marshes, which did not significantly differ from each other. Significant differences were present within marshes by habitat. Generally , all marsh total belowground biomass means were largest in the high marsh (73.46 g core-1), but due to large degree of measured variation in Dividing Creek and in Maurice River river sites, the difference was only significant in Dennis Creek and Rhode Island. The total belowground biomass in creek and river habitats was similar across all marshes, averaging 37.89 and 44.71 g core-1, respectively (Fig 53). Aboveground to Belowground Biomass Ratio Aboveground to belowground biomass ratios did not differ among marshes, but did vary within marshes in a consistent manner. Dividing Creek, Dennis Creek and RI all had the lowest ratios in the high marsh and similar ratios in the creeks and along the river. The Maurice River did not differ significantly by habitat due to the large variance within habitats, but generally, the high marsh mean was lower than the creeks and river, with the river showing the highest mean and variance (Fig 54 and Table 8). This means that high marsh habitats contained greater biomass belowground relative to aboveground, compared with river and creek habitats. On average, NJ had higher average ratios than RI (46.52 and 21.72, respectively), although only the Maurice River was extensively greater on average than Dividing Creek, Dennis Creek and RI (71.51, 34.32, 32.11 and 21.72, respectively). Averaged among rivers the high marsh, creek and river ratios were 13.78, 42.99 and 65.78, respectively. Aboveground Plant Nitrogen Aboveground plant nitrogen did not differ among marshes, but did differ within marshes. On average, Rhode Island was slightly higher than NJ (2.19 x 10⁻³ and 1.90 x 10⁻³ mol g-1). Within the marshes significant differences were detected within Dividing Creek or Maurice River across habitats, but Dennis Creek and RI both had significantly higher aboveground plant N in the rivers than in the high marsh with no observable difference between either of the former and the creek habitat (Fig 55). Pooled among marshes aboveground plant N was 1.74 x 10⁻³, 2.05 x 10⁻³ and 2.15 x 10⁻³ mol g-1 in the high marsh creek and river, respectively
Figure 53. Total belowground biomass by marsh and habitat. DC: Dividing Creek; DN: Dennis Creek; MR: Maurice River; RI: Rhode Island Cogshall Cove. Letters represent results of Tukey HSD post-hoc significance tests. Capital letters indicate significant differences by marsh and lower case letters indicate significant differences within marshes by habitat. Error bars represent standard errors of the means.

PDE Report No. 15-09, July 2015 Page 66
Figure 54. Aboveground (AGB) and belowground (BGB) biomass ratio by marsh and habitat. DC: Dividing Creek; DN: Dennis Creek; MR: Maurice River; RI: Rhode Island Cogshall Cove. Letters represent results of Tukey HSD post-hoc significance tests. Capital letters indicate significant differences by marsh and lower case letters indicate significant differences within marshes by habitat. Error bars represent standard errors of the means.
Figure 55. Aboveground plant nitrogen by marsh and habitat. DC: Dividing Creek; DN: Dennis Creek; MR: Maurice River; RI: Rhode Island Cogshall Cove. Letters represent results of Tukey HSD post-hoc significance tests. Capital letters indicate significant differences by marsh and lower case letters indicate significant differences within marshes by habitat. Error bars represent standard errors of the means.

PDE Report No. 15-09, July 2015 Page 67
Aboveground Plant Carbon to Nitrogen Ratio No significant differences in aboveground plant C:N were measured among marshes. Dividing Creek, Maurice River and RI had no significant differences with marshes among habitats. Dennis Creek river sites had significantly lower aboveground plant C:N than in the high marsh, but it was not significantly different than in the creek (Fig 56 and Table 9). Averaged across marshes aboveground plant C:N were 26.06, 25.95, 26.04, and 23.65 for Dividing Creek, Dennis Creek, Maurice River and RI, respectively. Averaged among marshes by habitat, aboveground plant C:N were 28.09, 24.68 and 23.28 for the high marsh creek and river habitats. Live Plant Root Nitrogen Live plant root N did not differ among marshes of NJ, but the marshes of NJ significantly differed from RI measuring 1.28 x 10⁻³ and 1.51 x 10⁻¹ mol g-1, respectively. Within marshes, Dennis Creek (1.47 x 10⁻³ mol g-1) and Maurice River (1.05 x 10⁻³ mol g-1) showed no variation among habitats within each marsh, and Dividing Creek and RI live root N was lowest in the high marsh (9.80 x 10⁻⁴ and 1.07 x 10⁻³ mol g-1) and largest along the river (1.64 x 10⁻³ and 2.30 x 10⁻³ mol g-1) (Fig 57 and Table 9).
Table 9. Plant and soil nitrogen by marsh and habitat. AGPN:BGPN is ratio of aboveground plant nitrogen to belowground plant nitrogen.

PDE Report No. 15-09, July 2015 Page 68
Figure 56. Aboveground plant carbon to nitrogen ratio by marsh and habitat. DC: Dividing Creek; DN: Dennis Creek; MR: Maurice River; RI: Rhode Island Cogshall Cove. Letters represent results of Tukey HSD post-hoc significance tests. Capital letters indicate significant differences by marsh and lower case letters indicate significant differences within marshes by habitat. Error bars represent standard errors of the means.
Figure 57. Live root nitrogen by marsh and habitat. DC: Dividing Creek; DN: Dennis Creek; MR: Maurice River; RI: Rhode Island Cogshall Cove. Letters represent results of Tukey HSD post-hoc significance tests. Capital letters indicate significant differences by marsh and lower case letters indicate significant differences within marshes by habitat. Error bars represent standard errors of the means.

PDE Report No. 15-09, July 2015 Page 69
By depth, live root N had high variability by depth and habitat for all marshes with no significant differences among them. Pooled among depth and habitat, live plant root N was 1.31 x 10⁻³, 1.39 x 10⁻³, 1.21 x 10⁻³ and 1.58 x 10⁻³ mol g-1 for Dividing Creek, Dennis Creek, Maurice River and RI, respectively. Pooled by depth and marsh, mean by habitat were 1.26 x 10⁻³, 1.38 x 10⁻³ and 1.48 x 10⁻³ mol g-1 for the high marsh, creek and river, respectively (Figure A4). Live Root Carbon to Nitrogen ratio Live root C:N did not differ among marshes. Dividing Creek had the highest C:N in the high marsh (52.45) and significantly lower ratio along creek (37.15) and the river edge (28.99). Dennis Creek and the Maurice River showed no significant differences among habitats within marshes, and RI had the lowest ratio along the river edge (49.81) (Fig 58 and Table 9). By depth, live root N had high variability by depth and habitat for all marshes with no significant differences among them. Pooled among habitats, Live Root C:N ratios were 39.53, 37.77, 38.94 and 31.71 for Dividing Creek, Dennis Creek, Maurice River and RI, respectively. Averaged among marshes by habitat, live root C:N ratios were 40.64, 35.57 and 34.95 for the high marsh creeks and rivers (Figure A5, Table 9)
Dead Root Nitrogen Dead root N did not differ among marshes of NJ, but significant differences were measured between all NJ marshes and RI. Dividing Creek dead root N was lowest in the high marsh and statistically similar in creeks and along the river, while no difference between habitats was observed in Dennis Creek and Maurice River. RI dead root N was lowest in the high marsh and highest along rivers (Fig 59). Dead Root Carbon to Nitrogen Ratio Dead root C:N did not differ among marshes. Dividing Creek dead root C:N was highest in the high marsh and lowest along the river edge. In Dennis Creek, there was no difference in measurements between the high marsh and the river edge, but the observed creek values were significantly lower. Similar to Dividing Creek, RI high marshes had the greatest measured values, but statistical difference was detected between the creeks and river habitats. No inter-marsh differences were measured across habitats in the Maurice River (Fig 60).
Figure 58. Live root carbon to nitrogen ratio by marsh and habitat. DC: Dividing Creek; DN: Dennis Creek; MR: Maurice River; RI: Rhode Island Cogshall Cove. Letters represent results of Tukey HSD post-hoc significance tests. Capital letters indicate significant differences by marsh and lower case letters indicate significant differences within marshes by habitat. Error bars represent standard errors of the means.
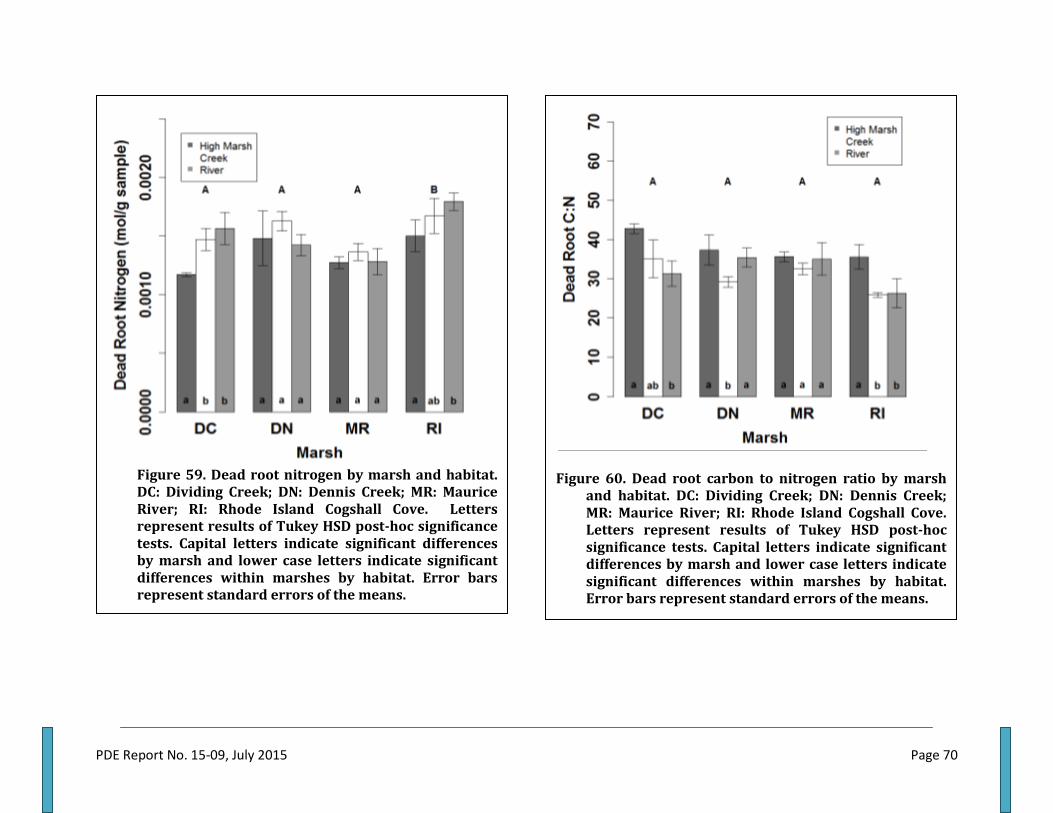
PDE Report No. 15-09, July 2015 Page 70
Figure 59. Dead root nitrogen by marsh and habitat. DC: Dividing Creek; DN: Dennis Creek; MR: Maurice River; RI: Rhode Island Cogshall Cove. Letters represent results of Tukey HSD post-hoc significance tests. Capital letters indicate significant differences by marsh and lower case letters indicate significant differences within marshes by habitat. Error bars represent standard errors of the means.
Figure 60. Dead root carbon to nitrogen ratio by marsh and habitat. DC: Dividing Creek; DN: Dennis Creek; MR: Maurice River; RI: Rhode Island Cogshall Cove. Letters represent results of Tukey HSD post-hoc significance tests. Capital letters indicate significant differences by marsh and lower case letters indicate significant differences within marshes by habitat. Error bars represent standard errors of the means.

PDE Report No. 15-09, July 2015 Page 71
Sediment Metrics Soil Nitrogen Among marshes, soil N was significantly lower in Dividing Creek due to the uniformity of the soil N measurements across habitats, 7.80 x 10⁻⁴, 7.01 x 10⁻⁴ and 6.49 x 10⁻⁴ mol g-1 for the high marsh creek and river respectively. Dennis Creek, Maurice River and RI had significantly higher measurements in the high marsh (1.69 x 10⁻³ mol g-1), creek (1.84 x 10⁻³ mol g-1) and river (1.67 x 10⁻³ mol g-1) respectively than in their other habitats (Fig 61 and Table 9). By depth, no habitats within marshes had significant differences by depth. Dividing Creek had no significant difference in soil N by habitat with a mean of 7.12 x 10⁻⁴ mol g sample-1. Dennis Creek had no significant differences in soil N by depth among the creek and river habitats (7.26 x 10⁻⁴ and 7.33 x 10⁻⁴ mol g-1), but had significantly higher measurements in the high marsh (1.53 x 10⁻³ mol g-1). These measurements did not differ by depth. Maurice River had significantly higher measurements in creek than the high marsh and river (1.42 x 10⁻³, 6.88 x 10⁻⁴ and 7.32 x 10⁻⁴ mol g-1, respectively). RI had the highest measurements along the river than in the high marsh and creek (1.60 x 10⁻³, 7.71 x 10⁻⁴ and 5.73 x 10⁻⁴ mol g-1, respectively) (Figure A2). Soil Carbon to Nitrogen Ratio Soil C:N ratios did not differ among marshes, but significant variation was measured within marshes. Pooled among marshes, soil C:N ratios were 13.87, 12.68, 13.01, 14.15 for Dividing Creek, Dennis Creek, Maurice River and RI, respectively. In Dividing Creek, Maurice River and RI, soil C:N was significant higher in the high marsh (15.50, 15.27 and 17.98) than in the creeks (13.57, 11.47 and 12.88) and along the river (12.57, 12.55, and 11.58). No differences among habitats were measured in Dennis Creek (Fig 62 and Table 9). By depth, Dividing and Dennis Creeks had no significant differences by depth or habitat, and averaged 13.86 and 12.68, respectively. Maurice River and RI averaged 13.01 and 14.15, respectively, and had higher C:N ratios in the high marsh (15.27 and 17.98) than in the creeks and rivers (11.47 and 12.55 for Maurice River and 12.89 and 11.58 for RI) (Figure A3). Accretion Above Feldspar Marker Horizons Accretion above feldspar maker horizons was highly variable within marshes. Pooled data among marshes showed no significant differences, with averages measuring 10.27, 13.18, 11.30 and 6.50 mm for Dividing Creek, Dennis Creek, Maurice River and RI, respectively. Even though mean accretion in NJ (11.59 mm) marshes was greater than the Rhode Island average (6.50 mm),the high degree of variation
Figure 61. Soil nitrogen by marsh and habitat. DC: Dividing Creek; DN: Dennis Creek; MR: Maurice River; RI: Rhode Island Cogshall Cove. Letters represent results of Tukey HSD post-hoc significance tests. Capital letters indicate significant differences by marsh and lower case letters indicate significant differences within marshes by habitat. Error bars represent standard errors of the means.

PDE Report No. 15-09, July 2015 Page 72
within data resulted in no significant difference between these systems (Fig 61). Measurements were highly variable within each marsh, however, and the pooled data do not take into account the different accretion patterns specific to each marsh. Results of a two-way ANOVA indicated that Habitat and River were interactive (p<0.02), and thus the habitat variability was river specific. Dividing Creek accretion rates were highest in the creeks (17.54 mm), and the lowest measurements were taken along the rivers (3.45 mm). Dennis Creek rates were highest in the high marsh (23.55 mm). Maurice River had similar high rates in the high marsh (17.40 mm) and along creeks (16.50 mm), and virtually no accretion measured along the river. RI had similar accretion rates among habitats, 5.73, 6.22, and 7.55 mm for the high marsh, creek and rivers, respectively (Fig 63, Table 10).
Figure 62. Soil carbon to nitrogen ratio by marsh and habitat. DC: Dividing Creek; DN: Dennis Creek; MR: Maurice River; RI: Rhode Island Cogshall Cove. Letters represent results of Tukey HSD post-hoc significance tests. Capital letters indicate significant differences by marsh and lower case letters indicate significant differences within marshes by habitat. Error bars represent standard errors of the means.

PDE Report No. 15-09, July 2015 Page 73
Figure 63. Accretion above feldspar marker horizons by marsh and habitat. DC: Dividing Creek; DN: Dennis Creek; MR: Maurice River; RI: Rhode Island Cogshall Cove. Letters represent results of Tukey HSD post-hoc significance tests. Capital letters indicate significant differences by marsh and lower case letters indicate significant differences within marshes by habitat. Error bars represent standard errors of the means.
.
Figure 64. Elevation by marsh and habitat. DC: Dividing Creek; DN: Dennis Creek; MR: Maurice River; RI: Rhode Island Cogshall Cove. Letters represent results of Tukey HSD post-hoc significance tests. Capital letters indicate significant differences by marsh and lower case letters indicate significant differences within marshes by habitat. Error bars represent standard errors of the means.

PDE Report No. 15-09, July 2015 Page 74
Elevation Metrics
Elevation by Habitat and Marsh Elevation within marshes was significantly different among habitats with low variability within habitats. There were clear delineations of all habitats among marshes. Elevations were greatest in the high marsh at 0.84, 0.87, 0.78 and 0.66m NAVD88 for the Dividing Creek, Dennis Creek, Maurice River and RI, respectively. Among regions, NJ marshes sat at a higher elevation (0.64m NAVD88) than the RI marshes (0.45m NAVD88). In NJ, the creeks were positioned higher than the rivers in all marshes, but the Maurice River creeks and river habitats were positioned at a higher elevation than their counterparts in Dividing and Dennis Creeks. RI creeks and rivers followed a reverse pattern in which the river habitat was on average higher (0.45m NAVD88) than the creek habitat (0.24m NAVD88) (Fig 64, Table 10).
Results: Exploratory Relationships
Relationships between Ribbed Mussel Biomass and Marsh Processes Appendix B contains a series of graphs depicting outputs from various regression statistics relating ribbed mussel biomass density (g DTW m-2) to other metrics assessed in the field. The actual numerical statistics are available in Table 11. Figure numbers for graphs are of the form: B#"Letter", indicating the reference graph is located in Appendix B, Figure # and is sub-graph "Letter" (e.g.: B2A is Appendix B, figure 2, graph A).
Table 10. Accretion rate and elevation measurements by marsh and habitat.

PDE Report No. 15-09, July 2015 Page 75
In many cases, relationships appeared to be obscured by differences between NJ and RI, mainly with regard to the river habitat type. As discussed above, river edges in NJ appeared to be much more highly eroded and scoured, and having far fewer mussels than in RI where mussel biomass densities were greatest along the river edge. To examine the data in the context of this interaction, we performed each test with all data pooled, with just NJ data, and with just RI data. Regressions were also performed by habitat type. Hence, in this section "data set" refers to the data groupings used in regression analysis: all data (data pooled from all marsh study sites; n=36); NJ (all data pooled from all NJ study marshes; n=27); and RI (all data pooled from RI sites; n=9). Mussel Biomass and Live Belowground Biomass Belowground biomass is mainly associated with the dominant vascular plants, and can be comprised of live and dead material. Belowground biomass consists of the organic matter that forms the peat layer, and peat formation can be an important component of whether marshes keep pace with sea level rise. An overall negative relationship was identified between ribbed mussel biomass and live belowground (vegetation) biomass, although only the slope for the regression using NJ data was significant (Fig B1A; Table 11). In the high marsh, relationships between the metrics in the NJ appear insignificant (Fig B1C), and this relationship appeared to be most evident in the small creeks (Fig B1D). Mussel Biomass and Dead Belowground Biomass Similarly, there was a negative relationship between mussel biomass density and dead belowground (vegetative) biomass among all data. However, only the RI-specific equation was statistically significant (Fig B2A; Table 11). This relationship was most evident in the river and creek habitats (Figs B2B and B2D). In NJ marshes, no clear relationships were found. Mussel Biomass and Total Belowground Biomass There was a significant negative relationship between total belowground (vegetation) biomass and ribbed mussel biomass density in the NJ data set (Fig B3A; Table 11). Although the pooled dataset and RI-specific datasets trended negative, their slopes were not identified as being significantly different from zero. In NJ, the relationship was most evident in the creek habitat (Fig B3D), with Dividing and Dennis Creeks and Maurice River total belowground biomass

PDE Report No. 15-09, July 2015 Page 76
Table 11. Regression statistics for relationships between ribbed mussel biomass density (g dry tissue per square meter) and various marsh features and processed, as depicted and defined in Appendix B. Relationships were evaluated at the global and regional levels. The global level pooled all data by marsh and habitat, and the regional level partitioned data by estuary (NJ= New Jersey marshes and RI = Rhode Island marshes). Both approaches were conducted on data pooled among habitat types. Further exploration of habitat-specific relationships are depicted in graphs B-D in all figures in Appendix B. Boldface asterisked values indicate significant relationships were identified at the p<0.05 level for the linear mixed effects model.

PDE Report No. 15-09, July 2015 Page 77
decreasing with increasing mussel biomass. The RI data appeared to show a similar relationship in the river habitat (Fig B3B). Mussel Biomass and Aboveground Biomass There was a significant positive relationship between aboveground vegetation biomass and mussel biomass density in the RI data set (Fig B4A; Table 11). This relationship was most evident in the river and creek habitats (Figs B4B and B4D). In NJ, although no significant relations were documented, there appeared to be a positive relationship between the two metrics in the creek habitat with a null to slightly negative relationship in the high marsh. In general, aboveground biomass did not appear to be as associated with mussel density as the various metrics of belowground biomass. Mussel Biomass and Aboveground to Belowground Biomass Ratio The ratio of aboveground biomass (AGB) to belowground biomass (BGB) has proven to be an important index of salt marsh condition in our MACWA studies. Higher ratios suggest that plants are living lower in their optimal growth range and may be more vulnerable to drowning, especially when this ratio is high in areas with higher true elevation (e.g., in the high marsh). Studies of the effects of nutrient loadings on wetland vegetation also have noted that plants can become tall and “leggy”, with reduced root structures, when they are not scavenging for nutrients belowground as normally would occur in naturally nutrient-poor marshes. A significant positive relationship was found between mussel biomass density and the ratio of AGB:BGB in all tests. The largest slope was in the NJ data set (Fig B5A; Table 11). This trend was most evident for NJ data in the creek habitat (Fig B5D), and for RI data in river and creek habitats (Figs B5B and B5D). The relationship was not clear in high marsh areas where the range of AGB:BGB was generally consistent among marshes, with the exception of one site in the Maurice River (Fig B5C). Mussel Biomass and Soil Nitrogen If ribbed mussels facilitate the transfer of pelagic nutrients in seston to benthic nutrients in marsh sediments, one might predict that metrics such as soil N would be greater in areas with more mussels. This would assume that plant roots and other biota do not quickly take up the nutrients. Here, we found no significant relationships between mussel biomass density and soil N, analyzed across all data sets and tests. No clear patterns emerged within or among study marshes and estuary systems (Figs B6B-D; Table 11). Mussel Biomass and Soil Carbon to Nitrogen Ratio Similar to soil N, the ratio of C to N (C:N ratio) in the soil could be an indicator of biological enrichment of sediment nutrients if biota do not rapidly absorb the nutrients. Similar to soil N, no significant relationships were detected between mussel biomass and soil C:N across data sets. Within habitats, no clear patterns emerge within or among marshes (Figs B7B-D; Table 11). Mussel Biomass and Root Nitrogen The finding that soil N and soil C:N ratio did not vary with mussel biomass suggests that either mussels were not affecting nutrient availability in the sediments or that the nutrients were simply removed (by biota) efficiently as they were delivered to the sediments. To explore the latter, the N content and C:N ratio was examined within plant roots (belowground) and leaves/stems (aboveground). There was a significant positive relationship between mussel biomass and root N in all data sets (Fig B8A; Table 11). This trend was evident for marshes in both NJ and RI in the high marsh and creek habitats (Figs B8C and B8D), and also for the river habitats in just RI (Figs B8B).

PDE Report No. 15-09, July 2015 Page 78
Mussel Biomass and Root Carbon to Nitrogen Ratio Since the root N was positively associated with mussel biomass, analysis of the C:N ratio of the roots helps to discern whether this was enrichment relative to non-nitrogenous elements. There was a significant negative relationship between mussel biomass and root C:N in all data sets (Fig B9A; Table 11), suggesting that the plant roots were in fact enriched in N in the vicinity of denser mussels. This trend was most evident for NJ data in the creek habitat (Fig B9D), however most marshes and habitats showed a negative trend between these two metrics. The RI relationship was most evident in river and high marsh habitats (Figs B9B and B9C). The relationship was not clear in the creek for the RI data set where the data seems to suggest a slight positive relationship (Fig B9D). Mussel Biomass and Plant Nitrogen Similar to plant roots, a significant positive relationship was detected between ribbed mussel biomass density and the N content of live shoots and stems comprising aboveground vegetation biomass. This relationship was significant when all data were pooled together (Fig B10A; Table 11), but the relationship was not significant when the data were partitioned by estuary (NJ, RI). Datasets specific to river, high marsh and creek habitats did not appear to depict a relationship between plant N and ribbed mussel biomass (Figs B10B-D), however. Mussel Biomass and Plant Carbon to Nitrogen Ratio A significant negative relationship was detected between ribbed mussel biomass and the C:N ratio of plant stems and blades, assessed when all data were pooled together (Fig B11A; Table X). This suggests, as with roots, that plants were enriched in N in areas with high mussel density. However, similar to plant N the relationship was not significant when data were partitioned by estuary (NJ, RI). Similarly, subsets of data by habitat (river, high marsh, creek) did not depict any clear relationships between plant C:N and ribbed mussel biomass (Figs B11B-D). Mussel Biomass and Accretion Above Feldspar Marker Horizons This test examined whether marsh surface accretion rates were correlated with mussel biomass density, possibly suggesting a link between mussels and elevation gain. However, no significant relationships were detected between mussel biomass and accretion rates no matter whether the data were pooled or analyzed by habitat, study marsh, or estuary (Figs B12B-D; Table 11). The patchiness of mussel populations and well mixed nature of shallow water marshes likely contributed to high variability in where any mussel biodeposits collected.
Figure 65. Accretion rate by elevation within and among marshes by habitat. Colors represent marshes (black= Dividing Creek; red=Dennis Creek; green=Maurice River; blue=Rhode Island.(Shapes represent habitats (circles = high marsh, triangles=creek and cross = river). Accretion data are means of 6 plots per habitat per marsh. Error bars represent standard error of means for accretion data.

PDE Report No. 15-09, July 2015 Page 79
Other Relationships
Accretion Rates and Elevation Accretion rates are affected by both the accumulation of organic matter resulted from autochthonous primary production as well as imported sediments carried by the tides. Rates of sedimentation are therefore affected by hydroperiod, currents, and TSS concentrations. Since elevation helps to govern hydroperiod, we explored whether accretion rates showed any relationships with the elevation of the plots where the feldspar marker horizons were deployed. Overall, accretion rates appeared to increase with elevation (Fig 64); however, estuary-specific regressions were not significant; i.e., within NJ marshes (p=0.12) or RI marshes (p=0.85). All river habitats had low accretion rates even though they spanned a range of elevations, which appeared to be one of the reasons for the inconclusive statistical results. As noted above, high erosion rates along the river edge habitats of NJ marshes led to scouring of feldspar from those study plots. More study is therefore needed to examine whether and how plants and ribbed mussels might contribute to accretion rates via either passive (sedimentation) or active (filtration) processes, respectively. Ribbed Mussels and Elevation In NJ, ribbed mussel populations were generally least dense along the river edge habitat, as well as in the high marsh, and densities were far greater in small tidal creek systems (21.63, 8.55 and 102.99 g DTW m-2, respectively). The creeks were typically positioned at mid-range elevations between river and high marsh (0.68, 0.42 and 0.79 m NAVD88, respectively), except in the Maurice River where high marsh and creek elevations generally overlapped. As noted above, the low densities of mussels along river edges of NJ appeared to be anomalous, associated with the high erosion rates of the river edges. In RI, mussels inhabited low to moderate elevations along rivers (0.37 m NAVD88) and in creeks (0.20 m NAVD88) at low to high densities. Creek elevations were generally lower than river elevations and biomass was also generally lower on average in creeks (183.87 g DTW m-2) than along rivers (371.20 g DTW m-2). High elevations in RI had low mussel densities (9.59 g DTW m-2 on average), but had some overlap river elevations. Therefore, mussel densities in RI marshes appeared to be more typical of healthy marshes where mussel biomass density generally decreases with increasing elevation (Fig 65 and Table 11). This trend was also evident in NJ, except for river edges. Lateral Marsh Movement, TSS Particulate Nitrogen, Ribbed Mussels, and Elevation To investigate whether the high erosion rates in some NJ river edge habitats might have been associated with lower than normal mussel biomass, lateral marsh movements (erosion rates) were assessed for all study plots by comparing changes in the position of the transect origin points (most waterward edge of contiguous vegetation). As shown in Table 12, erosion rates varied widely. In RI, erosion was nil, and in fact marsh edges appeared to slightly accrete seaward (+0.05 m). However, as reported in recent MACWA studies, in NJ there was erosion at all study marshes. The rates varied widely, from a low rate of -0.14 m in Dividing Creek, to a high of -1.18 m in Maurice River(Table 12). Interestingly, the two marshes with the highest erosion rates (Maurice and Dennis) also had the highest TSS particulate N concentrations (0.90 and 0.77 mg L-1, respectively).

PDE Report No. 15-09, July 2015 Page 80
Sites with the highest erosion rates also tended to have the lowest biomass densities of ribbed mussels, although there was considerable variability. Dennis Creek had a very low mean mussel density (1.07g DTW m-2). But in Maurice where erosion was highest, mussel densities were extremely variable and overall mussels densities were moderately high (44.41 g DTW m-2, but the standard error was large ± 29.29). Dividing Creek had lower lateral marsh movement rate (-0.43m yr-1 ) and also lower particulate N concentrations (0.52 my/L), and had a moderate amount of mussel biomass (19.41 gDTW m-2). RI was the only marsh that saw net growth, positive lateral marsh movement at 0.05 m yr -1, and also had the lowest TSS particulate N concentration (0.10 mg L-1) and the highest concentration of mussel biomass (371.20 g m -2) (Table 12). Taken together, these results suggest that erosion rates along river edges might be contributing to depressed mussel densities there, but more study is warranted to investigate this more directly. Mussel densities along river edges are notoriously patchy, with dense clumps often overhanging the water just prior to a collapse, and so densities can go from very high to very low overnight. Based on our results, it is plausible that high erosion rates likely interact with other features (elevation, predation intensity, etc) to govern mussel densities on the river edge, especially in more dynamic marshes such as in NJ. Results: Geospatial Patterns and Ecosystem Service Maps Tables of ecosystem service calculations are furnished in Appendix C. The spatial distribution of ribbed mussel population biomass, habitat types, and estimated ecosystem services (TSS and N removal) are depicted in a series of maps per site within each marsh in Appendix D. These appendices should be consulted for additional information in support of the findings in this section.
Spatial Distribution of Habitat Within Marshes
The high marsh habitat type comprised the greatest area within all study marshes, and the river edge habitat type had the lowest total area. High marsh comprised the greatest percentage of total area in Dividing Creek (79%), where tidal creek area was lowest (16%). Maurice River had the lowest high marsh area (68%) and the highest creek area (29%). River habitat, on average, never exceeded 10% of the total marsh area, and was lowest in Maurice River (3%). Similar to Maurice River, RI marshes had a relatively lower high marsh area overall (68%) and large inter-marsh creek area (24%) (Table 13). In Dividing Creek, the high marsh encompassed 73%, 81% and 83% of the
Table 12. Ribbed mussel biomass (g DTW m-2
), lateral marsh movement (m yr-1
), elevation (m NAVD88) and TSS particulate nitrogen concentration (mg/L) means and standard errors by marsh. Negative lateral marsh movement values indicate erosion, while positive values indicate growth or accetion. All values are for data collect in the river habitat of each marsh (n=9/river).

PDE Report No. 15-09, July 2015 Page 81
total area of sites 1, 2 and 3, respectively. The decrease in high marsh habitat among sites matched an increase in creek habitat among the three sites (22% site 1, 14% site 2 and 13% site 3), indicating a trade off between these two habitat types (Figs D1-D3). This makes sense because sites with more drainage creeks were closer to the mouth to Delaware Bay. This trend of decreasing high marsh and increasing creek habitat as one moved down the tributary toward the mouth was also seen in Dennis Creek where high marsh areas were 69%, 77%, 76%, and creeks were 28% 12% and 14% for sites 1, 2 and 3 respectively (Figs D4-6). Maurice River high marsh areas were very consistent at 68%, 69% and 68% for sites 1, 2, and 3, and creek habitat areas were 29% at all sites (Figs D7-9). River habitat was consistent in Dividing Creek and Maurice River at 5% for site 1, 4% and 3% respectively for site 2, and 2% and 3% respectively for site 3 (Figs D1-3 and D7-9), while higher variation was observed in Dennis Creek at 3%, 11% and 10% for sites 1,2 and 3 (Figs D4-6). RI high marsh areas were 68%, 78%, and 62% with similar related creek area patterns 28%, 18%, and 25% for sites 1, 2 and 3, respectively.
Geospatial Patterns of Mussel Density (g m-2) Among and Within Marshes
As a precursor to mapping mussel-mediated ecosystem services, maps were constructed of mussel biomass density (g m-2) across the marsh platform. As noted earlier, mussel biomass densities were lowest in the high marsh where mussels have less feeding time and are therefore smaller and less numerous. Mussel biomass densities were therefore contrasted among habitat types and extrapolated to the total areas of those habitats per study plot to yield a percentage of total (per ha) mussel population biomass residing in each of the three habitat type. In Dividing Creek, the mussel biomass
Table 13. Habitat area and total percentage of area by marsh. Averages are taken across habitats within marshes.

PDE Report No. 15-09, July 2015 Page 82
percentage (4%) in the high marsh was lowest among the NJ marshes, but not quite as low as in RI (2%). Maurice River had the greatest high marsh percentage of mussel biomass (14%), probably because it was lower in elevation and probably has more feeding time for mussels across the high marsh. In general, mussel biomass densities in NJ marshes were concentrated in the small creeks, especially in marshes with high erosion of river habitats which appeared to limit mussels along the rivers (see above). For example, in the Maurice River, mussel biomass density was 115 g m-2 in creeks but only 1.1 g m-2 along the river edge. Hence, the mussel biomass density percentage was 93% for creeks in the Maurice River. RI had the highest mussel biomass density in the creek habitat (217 g m-2), but because of the high density of mussel biomass along the river edge (371 g m-2), the percentage of creek mussel biomass overall in RI was lower than in Dennis Creek at 32%. The Rhode Island river mussel biomass was the largest of any marsh (372 g m-2), and even taking into account the variance in the data (±66 g m-2, Table 12), no river site in the NJ had a similar population (Table 14). In Dividing Creek, the high marsh mussel biomass density was 0.02, 3.5 and 16.6 g m-2 at sites 1, 2 and 3, respectively. Creek measurements were 71.1, 86.6 and 191 g m-2 and river mussel biomass was 4.6, 0.7 and 53.0 g m-2 for sites 1,2 and 3, respectively (Figs D1-3). Creek habitats within Dennis Creek contained more than 85% of the total mussel biomass at all sites at 183, 79.9 and 232 g m-2 for sites 1,2 and 3. River habitat in Dennis Creek had the lowest biomass of all habitats and was less than 3% of the total biomass for all sites with 1.0, 2.2 and 0.01 g m-2 for sites 1,2 and 3 (Figs D4-6). The river habitat in Maurice River had low mussel biomass density at sites 2 and 3 (1.2 and 0.1 g m-2), but high at site 1 (132 g m-2) due to a single high measurement at this site (Figs D7-9). RI had very high creek and river population and very low high marsh populations at all sites. Because of the high mussel biomass in
Table 14. Ribbed mussel biomass (g m-2
) and total percentage of biomass of marsh. Averages are taken across habitats within marshes.

PDE Report No. 15-09, July 2015 Page 83
creeks and rivers, their overall percent of site biomass appears lower than at other NJ sites, the biomass itself is greater (Figs D10-12). In summary, when examined across the whole marsh platform, most mussel biomass was located in small tidal creeks at Dividing Creek (87%) and Dennis Creek (93%). In RI and Maurice River, the river edge had the most mussel population biomass (66% and 49%, respectively). Hence, mussel biomass was concentrated in sub habitat types that were more frequently inundated and biomass in the much more expansive high marsh was comparatively lower.
Spatial Distribution of Ecosystem Services within and among Marshes
TSS and nutrient removal services were estimated by extrapolating physiological processing data (per tissue DTW) to the total estimated mussel population biomass (g DTW m-2, mapped by habitat type). The actual service rates are summarized by habitat and study marsh in Table 15, and here we discuss the spatial distribution of services across the marsh as percentages of the total area of each study site (i.e., across ha of marsh platform). In NJ, the river habitat had the lowest estimated removal of both TSS and particulate N, comprising 2%, <1% and 12% of total per hectare services in Dividing Creek, Dennis Creek and Maurice River, respectively (Table 13). In contrast, mussels living in tidal creek habitats were estimated to furnish the greatest service contribution, 80%, 89% and 53% in Dividing Creek, Dennis Creek and Maurice River, respectively. RI creeks also provided the greatest removal percentage at 50%, even though mussel
Table 15. Average area wide TSS and particulate nitrogen removal services (kg ha-1
y-1
) and the habitat percentage of total marsh service within marshes by habitat.

PDE Report No. 15-09, July 2015 Page 84
biomass was higher along the river. This was because tidal creeks comprised greater overall areas than river edges in RI marshes (Table 13). Dividing Creek's largest estimated TSS and particulate N removal services were located in creeks, with 99% estimated in the creeks at site 1. In upper areas of study marshes where there was a higher proportion of high marsh compared to creeks and river edges, ecosystem service contributions were more marked, such as at sites 2 and 3 (19% and 34%). River habitats were the lowest contributors of ecosystem services, providing only <1% at sites 1 and 2 and 4% at site 3(Figs D1-3). Dennis Creek had over 80% of these services provided by the creek habitat at all sites, with site 1 providing >99% and site 3 having 88%. Less than 1% of TSS and particulate N removal services were provided along the river at all sites (Figs D4-6). Maurice River site 1 had the largest percentage of ecosystem services provided in the creeks (52%) followed by the high marsh and river (34% and 14%). Site 2 also had the largest proportion provided in creeks (73%), but had a higher percentage along the river than site 1 (20%) and the lowest proportion in the high marsh (7%). Maurice River site 3 had greater mussel biomass in the high marsh than the other Maurice River sites and as a result saw a portion of TSS and particulate nutrient removal in the high marsh at this site (Figs D7-9). RI high marsh services were similar across sites (13%, 11% and 10% for sites 1, 2 and 3), and had the remaining ~90% divvied up between the river and creek habitats Sites 1 and 2 saw a higher proportion of the services being provided by creeks (64% and 49%), and site 3 had the largest proportion being provided along the river (54%) (Figs D10-12). Due mainly to high variability in mussel population biomass along river edges, estimated ecosystem services for this habitat type were the most variable. TSS and particulate nutrient removal services were estimated at 33,442 and 270 kg ha-1 y-1, respectively, in the low marsh in RI, compared with only 8,289 and 35 kg ha-1 y-1 along river edges in NJ, even though Rhode Island has a significantly lower river habitat area in which to provide these services. NJ had larger measured values in terms of creek-associated ecosystem services (NJ: 115,828 and 923 kg ha-1 y-1; RI: 62,291 and 502 kg ha-1 y-1).
Table 16. Summed habitat areas, mussel biomass, and TSS and particulate nitrogen removal by habitat and region.

PDE Report No. 15-09, July 2015 Page 85
Discussion
Natural infrastructure is increasingly being valued for the ecosystem services that it provides to society. For example, shellfish reefs and coastal wetlands help to filter pollutants, sequester carbon, and buffer coastlines from storms, as well as supporting habitat for fish, shellfish and wildlife species needed for fisheries and ecotourism. As a consequence, there is renewed interest in protecting and enhancing coastal habitats as means to address pollution, sustain economies, adapt to climate change, and fortify coastal community resilience. Inevitably however, this heightened restoration interest requires quantitative assessment of the expected return on investments in natural infrastructure. Too often, ecosystem services are crudely estimated from too few studies to allow robust extrapolation, modeling and monetization. This paucity of empirical data on key ecosystem service flows from coastal habitats thus represents an impediment to investments in coastal restoration at a meaningful scale. Ribbed mussels, G. demissa, are a foundational species that is ubiquitous within eastern USA salt marshes, often outweighing all other fauna combined and reportedly filtering the entire volume of each tide in some locations (Kuenzler 1961a, 1961b; Jordan and Valiela 1982; . In the Delaware Estuary, current populations of ribbed mussels have been estimated to filter six times the amount of water compared to oysters at the watershed scale (Kreeger 2008). Ribbed mussels are possibly unique among bivalves in also possessing the ability to filter and digest free bacteria, potentially helping to exert top-down control of harmful pathogens (Kreeger and Newell 1996, 2000). They live in mutualism with dominant salt marsh flora, binding tightly to roots of smooth cordgrass, S. alterniflora, thereby enhancing resilience to erosion, a feature that has led them to be used in living shoreline projects (PDE 2011). Ribbed mussels are also tolerant of a broader range of environmental stressors compared to other bivalve shellfish, and they are not prone to the disease mortality suffered by eastern oysters. For all of these reasons, ribbed mussels warrant special attention in ecosystem service assessments of habitats where they can live in abundance. The goal of this project was to quantify the role that ribbed mussels play in promoting salt marsh accretion and nutrient removal . These ecosystem services are of immediate concern for most coastal managers struggling with sustaining coastal wetlands in the face of sea level rise and high nutrient loadings. Our approach was to assess mussel densities in different sub-habitats (river edge, tidal creek, high marsh) of representative salt marshes in NJ (Dennis Creek, Dividing Creek, Maurice River in Delaware Bay) and RI (Prudence Island in Narragansett Bay), and to relate this spatial variation to seasonal measurements of key physiological rate functions associated with water quality improvement and benthic-pelagic coupling. Measurements of suspended matter and particulate nutrient filtration were used to assess the bulk (gross) removal of pollutants of concern (e.g., N). It is important to understand that some of this captured material can be used by the mussels for growth and reproduction, some gets returned as dissolved N via ammonia excretion, and some gets deposited on the sediments in feces and pseudofeces. We therefore assessed rates of fecal production and ammonia excretion to examine these fluxes by which waste products are returned to the system, representing the net transfer of filtered material to either the sediment (particles in biodeposits) or back to the water (dissolved ammonia that is remineralized). Rigorous assessments of key features of salt marshes were also conducted at fixed study plots in each sub-habitat of each studied marsh to also explore whether mussel population density is associated with more robust plant communities, nutrient profiles, elevation, and accretion. To ensure that our results

PDE Report No. 15-09, July 2015 Page 86
were broadly representative, replicate study plots were examined in salt marshes along the axis of each tributary, extending from near the mouth to the uppermost limits of ribbed mussel distributions. By quantifying and comparing mussel-mediated ecosystem services among seasons, sites, and sub-habitats, and in different marshes from NJ and RI, we therefore examined the intrinsic variability associated with the services from the Mid-Atlantic to Northeast regions. The pooled averages provided here therefore reflect broad seasonal and spatial variation, however it should be noted that this study only spanned one year, which included anomalies such as Hurricane Sandy. In general, the results confirmed earlier studies regarding the robust water filtering potential of ribbed mussels and the spatial distribution of mussels across the marsh platform. Mussel density tends to greatest at an intertidal elevation where they have an optimal balance of sufficient food (feeding time) and attachment surfaces (presence of Spartina). Other factors, such as prevalence and access by predators such as blue crabs, also surely affect mussel densities, but were not examined here. In general, ribbed mussels were most dense within small tidal creeks and along river banks at the edge of the tall-form S. alterniflora. This pattern was exemplified best in RI salt marshes. However, in all three NJ marshes, river edges had much lower and variable mussel densities compared with small creeks and compared with RI river banks. To put this in perspective, the “biomass density” of mussels within the river habitats of NJ averaged 21.6 g DTWm-2, compared to 371.2 g DTW m-2 along RI river habitats. Based on monitoring results of the Mid-Atlantic Coastal Wetland Assessment (MACWA) and other studies, the lower mussel densities on river banks in NJ likely resulted because of high shoreline erosion rates. Along Delaware Estuary marshes, edge retreat rates greater than 1 meter per year and up to 8 meters per year have been measured recently (e.g., Moody et al. 2011, MACWA datasets). More than 95% of random shoreline assessment points (MACWA RAM) have recently been assessed as net eroding, whereas a stable marsh has balanced erosion and accretion. These high rates of edge erosion, coupled with increases in interior marsh drowning and intra-marsh creek widening, surely have significant consequences for ribbed mussel abundance. A threshold likely exists whereby erosion rates greater than 0.5 meter per year do not allow sufficient time for mussels to recruit into the river edges and grow to sizes and densities that would in turn provide resilience to erosion. Since ecosystem services scale with mussel biomass, this means that mussel-mediated ecosystem services have likely already been compromised in rapidly eroding marshes of Delaware Bay. As noted above, mussel densities were greatest in small tidal creeks. Sizes of mussels were also larger in the creeks than in the high marsh where feeding time is more limited. Hence, ribbed mussel population density was highly variable across the marsh platform, lower in the more expansive high marsh and greater in creeks and (some) river banks. Averaged among all study sites, the typical ribbed mussel was 6 cm in shell height and contained 0.6 tissue DTW. Water filtration services per ribbed mussel, represented by particle filtration, varied widely among seasons but not as much among habitats and marshes. The amount of suspended particles filtered represents the interplay between the mussel’s physiological activity and the amount of total suspended solids (TSS) available to feed on. Delaware Bay is widely known as a naturally turbid estuary having much higher TSS than other large American estuaries. In this study, TSS ranged from 38-170 mg L-1 in NJ marshes, compared with 13 mg L-1 in RI. Hence, when clearing particles at similar rates, more particles were removed by mussels in NJ than in RI. This does not necessarily convey greater nutritional benefits to NJ mussels, however, because another difference was that Delaware Bay particles were much lower in food value. The organic content of suspended particles (seston) was always <17% in NJ marshes, compared to 26% in the study marshes of RI. These results are consistent with other recent studies of the quantity and quality of suspended particles in Delaware Bay, e.g., seston characterizations for oyster

PDE Report No. 15-09, July 2015 Page 87
nutrition (Kreeger 2013). Compared to other large American estuaries, the seston of Delaware Bay is more abundant but also much more recalcitrant with lower value for filter-feeding organisms. Taken together, particle clearance rates per mussel were generally similar among habitats and marshes, and actual TSS removal was variable (due to varying TSS levels) but not markedly different among habitats and marshes. Although clearance and filtration rates per mussel were comparable among habitat types, the net population-level services were not, for two reasons. First, high marsh habitats had smaller and fewer ribbed mussels than creeks or river banks. Second, there typically was much greater acreage of high marsh habitats (68-70%) than creeks (16-29%) or river edges (3-8%). When the per mussel physiology rates were compared to demographic and spatial data for the entire marsh platform, tidal creeks were found to contain the greatest density of water filtration services because they contained highest mussel biomass m-2 and had a moderate expanse of square meters. When all data were integrated, mussels living in tidal creeks were responsible for between 50-89% of the total TSS removed by mussels per hectare per year (50% in RI, 53% in Maurice River, 80% in Dividing Creek, 89% in Dennis Creek). The major source of variation in TSS removal rates was season, which simply reflects the typical seasonal changes in mussel metabolic rate with temperature. Averaged across all marshes and habitats, clearance rates of ribbed mussels were 0.04, 0.33 and 0.61 L h-1 per tissue DTW-1 in fall (8oC), spring (15oC) and summer (22oC), respectively. These clearance rates are somewhat lower than those measured previously for ribbed mussels feeding on natural seston (e.g., Kreeger et al 1988, Kreeger and Newell 2001), and more data analysis is needed to check our calculations; however, the seasonal pattern was consistent. So whereas some ecosystem services furnished by bivalves (e.g., erosion control) might be consistent throughout the year, it is important to recognize that bivalve mollusks deliver water filtration services at seasonally variable rates, peaking in summer. Fortunately for managers interested in using/managing shellfish to help meet water quality targets, it is also during the spring and summer when the services are most needed (e.g., to graze down harmful bloom and particulate nutrients). Seasonal and spatial variation in water filtration services were integrated to estimate the annual amount of TSS removed by mussels per hectare of salt marsh. Ribbed mussels in Dividing Creek, Dennis Creek, Maurice River and RI were estimated to filter 44.6, 236.8, 41.1 and 47.8 mt of (dry) TSS ha-1 y-1. Although Dennis Creek had a higher mean removal rate per hectare, this was not significantly different from other sites because of high variability among the replicate study plots. Averaged for all study marshes, ribbed mussels were estimated to remove 92.6 metric tons of TSS ha-1 y-1. Since approximately 60% of filtered matter gets biodeposited in feces (the rest is either retained, respired or excreted), we estimate that 55.6 tons of filtered material are typically defecated per hectare per year. These fecal particles might get resuspended, utilized by microorganisms and macrofauna, or get buried. If displaced uniformly across the marsh platform and not resuspended (exported as particles) or metabolized (exported as dissolved or gaseous compounds), the potential mussel feces contribution to marsh surface accretion is estimated to be 5.6 mm per year (assuming a specific gravity of 1 for feces). Of course, much of the biodeposits will be lost or processed, however, this is not an inconsequential value considering that sea level rise rates are currently about 4 mm per year in Delaware Bay and the ability of salt marshes to keep pace is a major concern. Nutrient removal services were examined by assessing the amount of particulate N that was filtered by ribbed mussels, the amount of N defecated, and the amount excreted as ammonia-N. Similar to TSS removal, the net nitrogen removal services performed by ribbed mussels depends on both their

PDE Report No. 15-09, July 2015 Page 88
physiological status and the amount of N in the diet. Although the C:N ratios of NJ and RI seston were comparable (6-10 generally), Delaware Bay has greater overall TSS, as mentioned above. The Delaware Estuary is also known to have some of the highest N loadings of any large estuary in the USA, as well. It was therefore not surprising that salt marsh seston N concentrations in Delaware Bay (0.30-1.45 µg L-1, depending on season and study marsh) were from 3 to 14 times greater than in RI (0.11 µg L-1 in summer). This means that the amount of N removed by NJ mussels was greater than RI mussels because they filtered seston at similar rates during the summer when all sites were examined. Ribbed mussels in Dividing Creek, Dennis Creek, Maurice River and RI were estimated to filter 275, 894, 350 and 385 kg N ha-1 y-1. Averaged for all study marshes, ribbed mussels were estimated to remove 476 kg N ha-1 y-1 (=2,593 lbs N ac-1 y-1). On average, 36% of N that was filtered was returned to the water in the form of dissolved N (ammonium-N). Interestingly, in this study mussels appeared to be passing all filtered N through without using any for growth and reproduction, based on N budget calculations. Further data analysis will be conducted to examine this result, but it is plausible that the generally N-rich food conditions (evidenced by the low C:N ratios) meant that mussels did not need to conserve protein (i.e. protein sparing) as they typically do during reproductive development. From an ecosystem service viewpoint, this is a moot finding since remineralization and biodeposition rates are of greater interest, reflecting the potential return of nutrients to the water or potential burial and net removal, respectively. Here, we estimated that 64% of the filtered N was defecated. This amounts to 305 kg N ha-1 y-1 being defecated by mussels in the study marshes, on average. Since we did not examine the added biodeposition that can occur via pseudofeces production, this estimate of pelagic-benthic coupling should be regarded as conservative (i.e., it would be greater if pseudofeces were also produced/quantified). By all accounts, our salt marsh study sites appeared to be representative of typical NJ and RI marsh systems. Several of the sites are also long-term monitoring locations for MACWA, and physical and biological metrics assessed in this study yielded values that were comparable to MACWA datasets as well as published results from other studies elsewhere. For example, aboveground biomass of vascular plants was robust, varying from 535 g m-2 in the high marsh to 743 g m-2 in tidal creeks to 855 g m-2 along the river edges where grasses were tallest. One interesting finding was that the ratio of above ground to belowground biomass was higher in NJ marshes compared to RI, especially in the Maurice River. A discussed in recent MACWA reports and the PDE 2012 State of the Estuary report, the high nutrient loadings to the Delaware Estuary could be affecting the growth morphology of the plants. While more research is needed to investigate cause-effect relationships here, other studies (e.g., Deegan et al. 2012) raise important questions about the possible negative effects of high nutrients on the ability of salt marsh systems to sequester belowground biomass, which might affect their ability to keep pace with sea level rise. More analysis of our C:N ratios (plants, soils) will be performed to investigate this further. Accretion rates and nominal elevations were also different between NJ and RI marshes. Our study marshes in NJ had significantly higher rates of accretion. Since the standing stocks were comparable (aboveground biomass) but TSS concentrations were higher in Delaware Bay, this suggests that the higher accretion rates likely stem from allochthonous inputs rather than differences in autotochonous production in situ. This confirms the widespread belief that the Delaware Estuary is such a wetland-rich system historically because it is naturally turbid and sediment-rich. In recent years, studies of regional sediment budgets have suggested that the current budget is partly sustained by high rates of marsh erosion. Hence, high erosion rates of marsh edges might be contributing to higher accretion of interior areas, as discussed in recent MACWA reports where more than 95% of studied marshes have been

PDE Report No. 15-09, July 2015 Page 89
found to be net eroding (whereas erosion and edge accretion are balanced in a healthy system). The higher accretion rates on top of the marsh platform might explain why we found higher overall elevations in NJ (mean of 0.64 m NAVD88 in high marsh) compared to RI (mean of 0.45 m NAVD88 in high marsh); however, this might also be a consequence of tidal range since Delaware Bay marshes tend to be more macrotidal versus microtidal. Regardless, the current erosional disequilibrium state may be especially problematic for the maintenance of mussel-mediated ecosystem services, which are concentrated along river edges and tidal creeks. Salt marsh ecosystems are extremely complex, variable, and well mixed spatially; therefore, it was not surprising that we found few strong relationships between ribbed mussel densities and key biotic or abiotic features, such as plant robustness or elevation. For example, we had hypothesized that if mussel biodeposits materially contributed to surface accretion rates, then we would detect either higher accretion rates or elevations in the vicinity of denser mussel assemblages. However, we were unable to detect a significant link between these metrics. Out of the hundreds of exploratory statistics performed there were some interesting results, as discussed below. However, to further clarify linkages between mussel densities and major marsh features, we suggest that future studies skip the correlation approach and instead perform field manipulations or mesocosm studies to unequivocally test such hypotheses. Here, we did not have the resources to test these questions robustly. Of particular interest, the ratio of aboveground to belowground biomass was significantly correlated with ribbed mussel biomass density (p<0.01 in all marshes), primarily due to an inverse correlation between mussel density and live belowground biomass. The N content of plant roots and aboveground plant biomass were also positively correlated with mussel biomass density. Taken together, these results confirm findings suggesting that ribbed mussels affect plant growth morphology and contribute to their nutrient uptake, presumably via their N-containing feces, which serve as fertilizer (Bertness 1984). It is not surprising that actual soil N did not reflect this because nutrients are typically scavenged rapidly in salt marshes where biota are adapted for low nutrients. If confirmed by future studies, it is plausible that the pelagic-benthic coupling mediated by ribbed mussels can be both beneficial and deleterious for salt marshes. The benefit is that ecosystem services furnished by mussels may be helpful to water quality managers by removing TSS and particulate nutrients, thereby improving water quality. Levee-building services are also a positive due to the estimated large contribution from mussels. On the other hand, if peat accumulation in marshes is compromised by high nutrients in the sediments (partly facilitated by mussels), then dense mussel populations might facilitate lower belowground organic matter accumulation and hence increase sea level rise vulnerability (e.g., as per Morris and Bradley 1999, Darby and Turner 2008). Here, we did detect lower belowground biomass in areas with more abundant mussel biomass. Future studies should work to deduce the net result of these processes on the elevation capital of the marsh platform; i.e. the positive term from “biodeposition accretion” versus the negative term from altered plant growth and “organic matter accumulation”. Elevation capital is a relatively new term used by Drs. D. Cahoon, J. Morris and D. Reed, among others (e.g. Morris et al. 2002, Cahoon et al. 2011), that refers to the elevation of a vegetated marsh relative to the optimal growth range of the dominant plants within the tidal zone at a particular site (McKee and Patrick 1988). If the vegetation elevation is high relative to the mean tidal elevation, then the marsh is said to have greater elevation capital than a comparable marsh in which the vegetation elevation is low in the tidal prism. Elevation capital provides a helpful way to assess vulnerability of the platform to drowning by capturing both physical (elevation) and biological (plant growth range) components of resilience. Hence, when exposed to similar predicted rates of sea level rise, marshes with higher elevation capital can be expected to endure longer than

PDE Report No. 15-09, July 2015 Page 90
comparable marshes with low elevation capital. Most studies of elevation capital are conducted on the high marsh platform and do not examine geospatial variation with tidal zonation, hydroperiod, or the robustness of filter-feeding animal populations. More study is therefore needed to detangle the complex effects of ribbed mussels on elevation capital, especially because mussel densities and passive sedimentation also vary with hydroperiod/elevation due to feeding time and plant canopy robustness respectively. It should be noted that mussels provide a diversity of benefits to marshes, many of which were not examined here, such as erosion control (Moody 2011). On balance, the many benefits of mussels, such as levee-building, erosion control, fish habitat enhancement, and contribution to plant vigor might outweigh the possible negative on belowground organic matter accumulation. Future studies should also consider whether mussel-mediated ecosystem services scale non-linearly with mussel density. In studying of erosion control by mussels, for example, Moody (2011) noted that low densities of mussels imparted some benefits but higher mussel densities did not add resilience, indicating that thresholds can exist whereby various ecosystem services furnished by ribbed mussels might scale non-linearly with density. Since N removal services provided by ribbed mussels are believed to result from its unique adaptations for a nutrient-poor habitat, it remains to be seen whether these services are similar under highly eutrophic conditions where phytoplantkon might supersaturate the mussel’s nutritional demands. Since the seston of detritus-dominated salt marshes typically has too little phytoplankton to sustain ribbed mussels, they have evolved to be obligate omnivores, capable of utilizing detritus, bacteria, microheterotrophs and organic floc as well as phytoplankton (Kreeger and Newell 2000). In salt marshes that have not been disturbed by high nutrient loadings, ribbed mussels are N-limited and they must utilize a mix of these natural particle types to sustain themselves (Kreeger and Newell 1996, 2001). But as algal blooms in coastal waters become fueled by higher nutrient loadings, leading to eutrophication, higher seston N concentrations can occur within marshes (Newton and Thornber 2013). The increase in available N might therefore relieve N limitation of the mussels and the associated community. When mussels are no longer N limited, they produce more fecal-N and ammonia-N, as seen in Mytilus trossulus.(Kreeger and Langdon 1994, Kreeger and Newell 1996). Here, we found that 100% of filtered N was in fact passed through the animals and lost in feces and excreta, suggesting that the mussels studied here were in fact not N-limited. It is therefore plausible that these higher fluxes of N to the sediments could help to shift plant production from belowground to aboveground, with consequences for marsh platform vertical growth and stability (Deegan et al. 2012). In summary, ribbed mussel populations in NJ and RI marshes were found to make sizeable, predictable contributions to water quality improvement based on their collective filtration and net removal (via feces) of suspended particles, including N-bearing particles. The approach taken in this study was physiologically-based, whereby careful seasonal assessments of key rate functions were quantified and then extrapolated to reflect the spatial demographics of natural mussel populations. The actual amount of TSS (and particulate nutrients) removed by natural mussel populations living in situ will depend on many other factors that were not studied here. For example, some of the water that is filtered might be (re)filtered by the same or adjacent mussels. Conversely, the hydrodynamics of salt marshes are complex, and some of the TSS flushing the marsh might not be accessible to mussel filtration. Nevertheless, our measurements were taken with mussels exposed to natural conditions and fed natural seston, and the physiological rates reported here are somewhat lower than what we and others have measured previously. We also did not assess the potential biodeposition of pseudofeces. For these reasons, our estimates of bulk seston processing are likely to be conservative. More study will be needed to deduce actual cause-effect relationships between mussels and “levee-building” services, as

PDE Report No. 15-09, July 2015 Page 91
well as the other purported ecosystem services associated with light improvement, erosion control, fish habitat enhancement, etc. Based on what we learned here, we recommend that: The conservation and restoration of natural ribbed mussel populations should be included in watershed-scale efforts to sustain and remediate water quality. Of special note, high edge erosion rates along Delaware Bay salt marshes appear to be compromising mussel-mediated ecosystem services. Currently, rates of salt marsh loss average about an acre per day in the Delaware Estuary, representing a service decline of 6 pounds less N being removed every day just by the mussels alone. Therefore: Tactics should be considered (e.g., living shorelines that include ribbed mussels) that can be used to stem the loss of natural populations of these important fauna.
Literature Cited
Alber, M. and I. Valiela. 1994. Incorporation of organic aggregates by marine mussels. Marine Biology 121: 259-265.
Amthor, J. S. and M. A. Huston (eds.). 1998. Terrestrial Ecosystem Responses to Global Change. A Research Strategy, Oak Ridge National Laboratory, ORNL/TM-1998/27, Oak Ridge, TN.
Arkema K.K., G. Guannel, G. Verutes, S.A. Wood, A. Guerry, M. Ruckelshaus, P.Kereiva, M. Lacayo, and J.M. Silver. 2013. Coastal habitats shield people and property from sea level rise and storms. Nature Climate Change: Letters: advance online publication: www.nature.com/natureclimatechange.
Armentano, T.V. and E.S. Menges. 1986. Patterns of change in the carbon balance of organic soil wetlands of the temperate zone. Journal of Ecology 74: 755-774.
Bates, D. M. 2010. lme4: Mixed-effects modeling with R. URL http://lme4. r-forge. r-project. org/book. Bayne, B. L. 1976. The biology of mussel larvae. In: B. L. Bayne [ed.], Marine mussels. Cambridge, p. 81-120. Bertness, M. D. 1984. Ribbed Mussels and Spartina alterniflora production in a New England salt marsh.
Ecology 65(6):1794-1807. Bertness, M. D. and E. Grosholz. 1985. Population dynamics of the ribbed mussel, Geukensia demissa: The
costs and benefits of an aggregated distribution. Oceologia 67: 192-204. Borrero, F. J. 1987. Tidal height and gametogenesis: reproductive variation among populations of Geukensia
demissa. The Biological Bulletin 173: 160-168. Bricker-Urso, S., S. W. Nixon, J. K Cochran, D. J Hirschberg, and C. Hunt. 1989. Accretion rates and sediment
accumulation in Rhode Island salt marshes. Estuaries 12(4): 300-317. Bridgham,S.D., J.P. Megonigal, J.K. Keller, N.B. Bliss and C. Trettin. 2006. The carbon balance of North
American wetlands. Wetlands 26: 889–916 Bustian, J.J., I.A. Mendelssohn and M.W. Hester. 2012. Vegetation’s importance in regulating surface
elevation in a coastal salt marsh facing elevated rates of sea level rise. Global Change Biology 18: 3377-3382.
Cahoon, D. R., White, D. A., & Lynch, J. C. 2011. Sediment infilling and wetland formation dynamics in an active crevasse splay of the Mississippi River delta. Geomorphology, 131(3), 57-68.
Church, J. A., and N. J. White. 2006. A 20th century acceleration in global sea-level rise. Geophysical research letters 33: L01602.

PDE Report No. 15-09, July 2015 Page 92
Cohen, M. C. L., H. Behling, and R. J. Lara. 2005. Amazonian mangrove dynamics during the last millennium: the relative sea-level and the Little Ice Age. Review of Palaeobotany and Palynology 136: 93-108.
Costanza, R. and H.E. Daly. 1992. Natural Capital and Sustainable Development. Conservation Biology 6: 37-46.
Costanza, R., R. d’Arge, R. de Groot, S. Farber, M. Grasso, B. Hannon, K. Limberg, S. Naeem, R. V. O’Neill, J. Paruelo, R. G. Raskin, P. Sutton and M. van den Belt. 1997. The value of the world’s ecosystem services and natural capital. Nature 387: 253-260.
Costanza, R., O. Perez-Maqueo, M. L. Martinez, P. Sutton, S. J. Anderson and Kenneth Mulder. 2008. The value of coastal wetlands for hurricane protection. AMBIO: A Journal of the Human Environment 37(4): 241-248.
Currin, C.A., S.Y. Newell and H.W. Paerl. 1995. The role of standing dead Spartina alterniflora and benthic microalgae in salt marsh food webs: Considerations based on multiple stable isotope analysis. Marine Ecology Progress Series 212: 99-116.
Daily G.C., S. Alexander , P.R. Ehrlich , L. Goulder, J. Lubchenco, P.A. Matson, H.A Mooney, S. Postel, S.H. Schneider, D. Tilman and G.M. Woodwell. 1997. Ecosystem services: benefits supplied to human societies by natural ecosystems. Issues in Ecology 2:1–16.
Dame, R.F. 1986. Book Review: The oyster: the life and lore of the celebrated bivalve, by R.A. Hedeen. Estuaries 9: 382-383.
Deegan, L.A., D.S. Johnson, R.S. Warren, B.J. Peterson, J.W. Fleeger, S. Fagherazzi, and W.M. Wollheim. 2012. Coastal eutrophication as a driver for salt marsh loss. Nature 490: 388-392.
Deegan L.A. and R. H. Garritt. 1997. Evidence for spatial variability in estuarine food webs. Marine Ecology Progress Series 147: 31-47.
De Groot R.S., M.A. Wilson , and R.J.M. Boumans . 2002. A typology for the classification, description and valuation of ecosystem functions, goods and services. Ecol Econ 41:393–408.
DeLaune, R. D., C. J. Smith, and W.H. Patrick. 1983. Relationship of marsh elevation, redox potential, and sulfide to Spartina alterniflora productivity. Soil Science Society of America Journal 47: 930-935.
Erwin, R. M., G.M. Sanders, D.J. Prosser and D.R. Cahoon. 2006. High tides and rising seas: potential effects on estuarine waterbirds. Studies in Avian Biology 32: 214.
Fell, P.E., N.C. Olmstead, E. Carlson, W, Jocob, D. Hitchcock, and G. Silber. 1982. Distribution and abundance of macroinvertebrates on certain Connecticut tidal marshes, with emphasis on dominant molluscs. Estuaries 5: 234-239.
Franz, D. R. 1996. Size and age at first reproduction of the ribbed mussel, Geukensia demissa, in relation to shore level in a New York salt marsh. Journal of Experimental Marine Biology and Ecology 205: 1-13.
Franz, D. R. 1997. Resource allocation in the intertidal salt marsh mussel Geukensia demissa in relation to shore level. Estuaries 20:134-148.
Franz, D. R. 2001. Recruitment, survivorship, and age structure of a New York ribbed mussel population (Geukensia demissa) in relation to shore level – a nine-year study. Estuaries 24:319-327.
Friedrichs, C. T., and J. E. Perry. 2001. Tidal salt marsh morphodynamics: a synthesis. Journal of Coastal Research 7-37.
Hartig, E.K, V. Gornitz, A. Kolker, F. Muschacke and D. Fallon. 2002. Anthropogenic and climate-change impacts on salt marshes of Jamaica Bay, New York City. Wetlands 22: pp. 71–89
Huang, S.C. 2000. A comparison of temporal and spatial variation in nutritional resources and the nutritional demands of the marsh musse, Geukensia demissa. Dissertation, University of Maryland, College Park, MD, USA.
Hughes, T. J. 2012. The finite element method: linear static and dynamic finite element analysis. Courier Corporation.
Ibanez, C., P.J. Sharpe, J. W. Day, J.N. Day, and N. Prat. 2009. Vertical accretion and relative sea level rise in the Ebro Delta Wetlands (Catalonia, Spain). Wetlands 30: 979-988.

PDE Report No. 15-09, July 2015 Page 93
IPCC: Intergovernmental Panel on Climate Change. 2001. Climate Change 2001: The Scientific Basis. Cambridge Univ. Press, New York, 2001.
Jordan, T. E. and I. Valiela. 1982. The nitrogen budget of the ribbed mussel, Geukensia demissa, and its significance in nitrogen flow in a New England salt marsh. Limnology and Oceanography 27: 75-90.
Kearney, M. S., J. C. Stevenson, and L. G. Ward. 1994. Spatial and temporal changes in marsh vertical accretion rates at Monie Bay: Implications for sea-level rise. Journal of Coastal Research 1010-1020.
Kearney, M.S.; R.E. Graceand, J.C. Stevenson. 1988. Marsh loss in Nanticoke Estuary, Chesapeake Bay. Geographical Review 78: 205-220.
Keddy, P.A. 2000. Wetland Ecology: Principles and Conservation. Cambridge University Press, Cambridge, UK. Kemp, P.F., S.Y. Newell and C. Krambeck. 1990. Effects of filter-feeding by the ribbed mussel Geukensia
demissa on the water-column microbiota of Spartina alterniflora saltmarsh. Marine Ecology Pregress Series 59: 1149-131.
Kneib, R.T. 1994. Spatial pattern, spatial scale and feeding in fishes. In D.J. Stouder and R.J. Feller, (eds). Theory and application in fish feeding ecology. University of South Carolina Press, Columbia, South Carolina, USA, pp. 171-185
Kreeger, D.A. 2013. Analysis of particulate nutrients and seston weights from 2009 to 2011 at Delaware Bay oyster stations. Academy of Natural Sciences of Drexel University. Final Report to Rutgers University as part of the U.S. Army Corps of Engineers Delaware River and Bay Monitoring Study. August 28, 2013. 40 p.
Kreeger, D. A., J. Adkins, P. Cole, R. Najjar, D. Velinsky, P. Conolly, and J. Kraeuter. 2010. Climate change and The Delaware Estuary: Three case studies in vulnerability assessment and adaptation planning. delawareestuary.org/science_projects_climate_ready_products.asp
Kreeger, D.A. 2008. From local to regional: contrasting the water processing and restoration potential of native bivalves throughout the Delaware Estuary and Watershed. Proceedings for the Second Delaware Estuary Science & Environmental Summit. Partnership for the Delaware Estuary. Report No. 08-02. 113 p
Kreeger, D. A. and R. I. E. Newell. 2001. Seasonal utilization of different seston carbon sources by the ribbed mussel, Geukensia demissa (Dillwyn) in a mid-Atlantic salt marsh. Journal of Experimental Marine Biology and Ecology 260: 71-91.
Kreeger, D.A. and R. I. E. Newell. 2000. Trophic complexity between producers and invertebrate consumers in salt marshes. In Concepts and Controversies in Tidal Marsh Ecology, M. P. Weinstein and D. A. Kreeger (eds). Dordrecht: Kluwer Academic Publishers, pp. 187- 213
Kreeger, D. A., & Newell, R. I. E. 1996. Ingestion and assimilation of carbon from cellulolytic bacteria and heterotrophic flagellates by the mussels Geukensia demissa and Mytilus edulis(Bivalvia, Mollusca). Aquatic Microbial Ecology, 11(3), 205-214.
Kreeger, D. A., and C. J. Langdon. 1994. Digestion and assimilation of protein by Mytilus trossulus (Bivalvia: Mollusca) fed mixed carbohydrate/protein microcapsules. Marine Biology 118(3): 479-488.
Kreeger, D. A., Newell, R. I., & Langdon, C. J. (1990). Effect of tidal exposure on utilization of dietary lignocellulose by the ribbed mussel Geukensia demissa (Dillwyn)(Mollusca: Bivalvia). Journal of experimental marine biology and ecology, 144(2), 85-100.
Kreeger, D. A., C. J. Langdon, and R. I. E. Newell. 1988. Utilization of refractory cellulosic carbon derived from Spartina alterniflora by the ribbed mussel Geukensia demissa. Marine Ecology - Progress Series 42: 171-179.
Kuenzler, E. J. 1961a. Structure and energy flow of a mussel population in a Georgia salt marsh. Limnology and Oceanography 6: 191-204.
Langdon, C.J. and R.I.E. Newell. 1990. Utilization of detritus and bacteria as food sources by two bivalve suspension-feeders, the oyster Cassostria virginica and the mussel Geukensia demissa. Marine Ecology-Progress Series 58: 299-310.

PDE Report No. 15-09, July 2015 Page 94
Leonard, L.A. and M.E. Luther. 1995. Flow hydrodynamics in tidal marsh canopies. Limnology and Oceanography 40(8): 1474-1484.
Lillebo, A.I., J.M Neto, M.R. Flindt, J.C. Marques, and M.A. Pardal. 2004. Phosphorous dynamics in a temperate intertidal estuary. Estuarine, Coastal, and Shelf Science 61(1): 101-109.
Lin, Q., and I. A. Mendelssohn. 1996. A comparative investigation of the effects of south Louisiana crude oil on the vegetation of fresh, brackish and salt marshes. Marine Pollution Bulletin 32.2: 202-209.
Lin, J. 1989. Influence of location in a salt marsh on survivorship of ribbed mussels. Marine ecology progress series. 56: 105-110.
Liu, S., R. Costanza, A. Troy, J. D'Aagostino and W. Mates. 2010. Valuing New Jersey’s Ecosystem Services and Natural Capital: A Spatially Explicit Benefit Transfer Approach. Environmental n
Management 45(6): 1271-1285. McCaffrey, R. J., and J. Thomson. 1980. A record of the accumulation of sediment and trace metals in a
Connecticut salt marsh. Advances in Geophysics 22: 165-236. McKee, K. L., I. A. Mendelssohn, and M. D. Materne. 2004. Acute salt marsh dieback in the Mississippi River
deltaic plain: a drought‐induced phenomenon? Global Ecology and Biogeography 13: 65-73. Mckee, K. L., & Patrick, W. H. 1988. The relationship of smooth cordgrass (Spartina alterniflora) to tidal
datums: a review. Estuaries, 11(3), 143-151. Morris, J. T.,P.V. Sundarehwar, C.T. Nietch, B. Kjerfve, and D.R. Cahoon. 2002. Responses of coastal wetlands
to rising sea level. Ecology 83.10: 2869-2877. Mitsch, W.J. and J.G. Gosselink. 1993. In C. J. Barrow (ed.), Wetlands (2nd Edition). Reinhold, New York. Moody, Joshua A. 2011. The Relationship between the ribbed mussel (Guekensia demissa) and salt marsh
shoreline erosion (Master’s Thesis). Rutgers, the State University of New Jersey, New Brunswick, New Jersey.
Nelson JL, Zavaleta ES (2012) Salt Marsh as a Coastal Filter for the Oceans: Changes in Function with Experimental Increases in Nitrogen Loading and Sea-Level Rise. PLoS ONE 7(8): e38558. doi:10.1371/journal.pone.0038558
Nepf, H. M. 1999. Drag, turbulence, and diffusion in flow through emergent vegetation. Water resources research 35.2: 479-489.
Neubauer, S. C. 2008. Contributions of mineral and organic components to tidal freshwater marsh accretion. Estuarine, Coastal and Shelf Science 78.1: 78-88.
Newell,R.I.E., C.J Langdon. 1986. Mechanisms and physiology of larval and adult feeding. In V.S Kennedy, R.I.E Newell, A. Eble (Eds.), The Eastern Oyster, Crassostrea virginica. Maryland Sea Grant Publication, College Park, MD (1996), pp. 185–230
Newell, R. C., and J.G. Field. 1983. The contribution of bacteria and detritus to carbon and nitrogen flow in a benthic community. Marine Biology Letters 4(1): 23-36.
Newton, C., & Thornber, C. 2013. Ecological impacts of macroalgal blooms on salt marsh communities. Estuaries and coasts, 36(2), 365-376.
Newton, C., and C. Thornber. 2012. Abundance and species composition surveys of macroalgal blooms in Rhode Island salt marshes. Northeastern Naturalist 19(3): 501-516.
Nicholls, R. J. and J.A. Lowe. 2004. Benefits of mitigation of climate change for coastal areas. Global Environmental Change A: Human and Policy Dimensions 14(3): 229-244.
Nicholls, R. J., F.M.J. Hoozemans, and M. Marchand. 1999. Increasing flood risk and wetland losses due to global sea-level rise: regional and global analyses. Global Environmental Change 9: 69-87.
Nielson, K. J. and D. R. Franz. 1994. The influence of adult conspecifics of the ribbed mussel Geukensia demissa (Dillwyn). Journal of Experimental Marine Biology and Ecology 188: 89-98.

PDE Report No. 15-09, July 2015 Page 95
Nixon, S.W., C.D. Hunt and B.L. Nowicki. 1986. The Retention of Nutrients (C, N, P), Heavy Metals (Mn, Cd,Pb,Cu, and Petroleum Hydrocarbons in Narragansett Bay. Elsevier Oceanography Series, Volume 43: Pages 99-122
Odum, E.P. 1968. A research challenge: evaluating the productivity of coastal and estuarine water. Proceedings of the second Sea Grant conference, University of Rhode Island, Kingston, Rhode Island, USA.
Partnership for the Delaware Estuary. 2014. Site Specific Intensive Monitoring of Coastal Wetlands in Dividing Creek New Jersey Watershed, 2012-2013 . PDE Report No. 14-04. 29pp.
Partnership for the Delaware Estuary. 2012. TREB: Technical Report for the Delaware Estuary and Basin. Report Number 12-01. 255 pages.
www.delawareestuary.org/science_programs_state_of_the_estuary.asp Partnership for the Delaware Estuary. 2011. Practitioner's Guide: Shellfish-Based Living Shorelines for Salt
Marsh Erosion Control and Environmental Enhancement in the Mid-Atlantic. REport Number 11-04. 48 pages.http://delawareestuary.s3.amazonaws.com/pdf/Living%20Shorelines/Final_DELSI%20Practitioners%20Guide_2012.pdf
Partnership for the Delaware Estuary. 2010. State of the Estuary 2010 Climate Report. http://delawareestuary.org/pdf/Climate/Climate%20Change%20and%20the%20Delaware%20Estuary_PDE-10-01.pdf
Peterson, B.J., R.W. Howarth and R.H. Garritt. 1986. Sulfur and carbon isotopes as tracer of salt marsh organic matter flow. Ecology 67: 865-874.
Philipp, K.R., 2005. History of Delaware and New Jersey salt marsh restoration sites. Ecol. Eng. 25: 214–230. Redfield, A. C., and R. Meyer. 1962. The age of salt marsh peat and its relation to recent changes in sea level
at Barnstable, Massachusetts. Proceedings of the National Academy of Sciences of the United States of America 48.10: 1728.
Reich, P. B., et al. 2006. Nitrogen limitation constrains sustainability of ecosystem response to CO2. Nature 440.7086: 922-925.
Shepard, C.C., C.M. Crain, M.W. Beck. 2011. The Protective Role of Coastal Marshes: A Systematic Review and Meta-analysis. PLoS ONE 6(11): e27374. doi:10.1371/journal.pone.0027374
Smith, J. M., & Frey, R. W. 1985. Biodeposition by the ribbed mussel Geukensia demissa in a salt marsh, Sapelo Island, Georgia. Journal of Sedimentary Research, 55(6).
Sousa, A.I., A.I. Lillebo, I. Cacador, and M.A. Paradel. 2008. Contribution of Spartina maritime to the reduction of eutrophication in estuarine systems. Environmental Pollution 156: 628-635.
Sousa, A.I., A.I. Lillebo, M.A. Paradal, and I. Cacador. "Productivity and nutrient cycling in salt marshes: contribution to ecosystem health." Estuarine, Coastal and Shelf Science 87.4 (2010): 640-646.
Sprent, J. I. 1987. The ecology of the nitrogen cycle. Cambridge University Press. Stevenson, F. J., and M. A. Cole. 1999. The carbon cycle. In Stevenson and Cole (eds.) Cycles of Soil, pp. 1-45. Stevenson, J. C. M. S., M. S. Kearney, and E. C. Pendleton. 1985. Sedimentation and erosion in a Chesapeake
Bay brackish marsh system. Marine Geology 67: 213-235. Sun G.L., O. Diaz, B. Salomon, and R. Von Bothmer. 1999. Genetic diversity in Elymus caninus as revealed by
isozyme, RAPD, and microsatellite markers. Genome 42: 420–431. Temmerman, S., M. B. De Vries and T. J. Bouma. 2012. Coastal marsh die-off and reduced attenuation of
coastal floods: A model analysis. Global and Planetary Change 92-93: 267-274. Turner, R. E., E.M Swenson, C.S. Milan, J.M Lee and T.A Oswald. 2004. Below‐ground biomass in healthy and
impaired salt marshes. Ecological Research 19.1: 29-35. Turner R.K. and D. Pearce. 1993. In E.D. Barbier (ed.) Economics and Ecology: New Frontiers and Sustainable
Development, Chapman and Hall, London, pp. 177-194 Valiela, I. and J. M. Teal. 1979. The nitrogen budget of a salt marsh ecosystem. Nature 280: 652-656.

PDE Report No. 15-09, July 2015 Page 96
Valiela, I., J. Costa, K. Foreman, J.M. Teal, B. Howes and D. Aubrey. 1990. Transport of groundwater-borne nutrients from watersheds and their effects on coastal waters. Biogeochemisrty 10: 177-197.
Valiela, I., J. McClelland, J. Hauxwell, P. J. Behr, D. Hersh and K. Foreman. 1997. Macroalgal blooms in shallow estuaries: controls and ecophysiological and ecosystem consequences. Limnology and Oceanography 42: 1105-1118.
Warren, R. S., Fell, P. E., Rozsa, R., Brawley, A. H., Orsted, A. C., Olson, E. T., Swamy, V. and Niering, W. A. (2002), Salt Marsh Restoration in Connecticut: 20 Years of Science and Management. Restoration Ecology, 10: 497–513.
Werme CE. 1981. Resource partitioning in a salt marsh fish community. PhD thesis, Boston University. Weinstein, M.P. and S.P. O’Neil. 1986. Exchange of marked juvenile spots between adjacent tidal creeks in
the York River Estuary, Virginia. Transactions American Fisheries Society 115: 93-97. Weinstein, M.P., L. Scott, S.P. O’Neil, R.C.I. Sigfried, and S.T. Szedlmayer. 1984. Population dynamics of spot,
Leiostomus xanthurus, in polyhaline tidal creeks of the York River Estuary, Virginia. Estuaries 7: 444-450. White J.R. and K.R. Reddy. 2000. Nitrification and denitrification rates of everglades wetland soils along a
phosphorous impacted gradient. Journal of Environmental Quality 32(6): 2436-2443. Winter, J. E. 1978. A review on the knowledge of suspension-feeding in lamellibranchiate bivalves, with
special reference to artificial aquaculture systems. Aquaculture, 13(1), 1-33. Wright, R.T., R.B. Coffin, C.P. Ersing and D. Pearson, 1982. Field and laboratory measurements of bivalve
filtration of natural marine bacterioplankton. Limnology and Oceanography 27 :91-98.
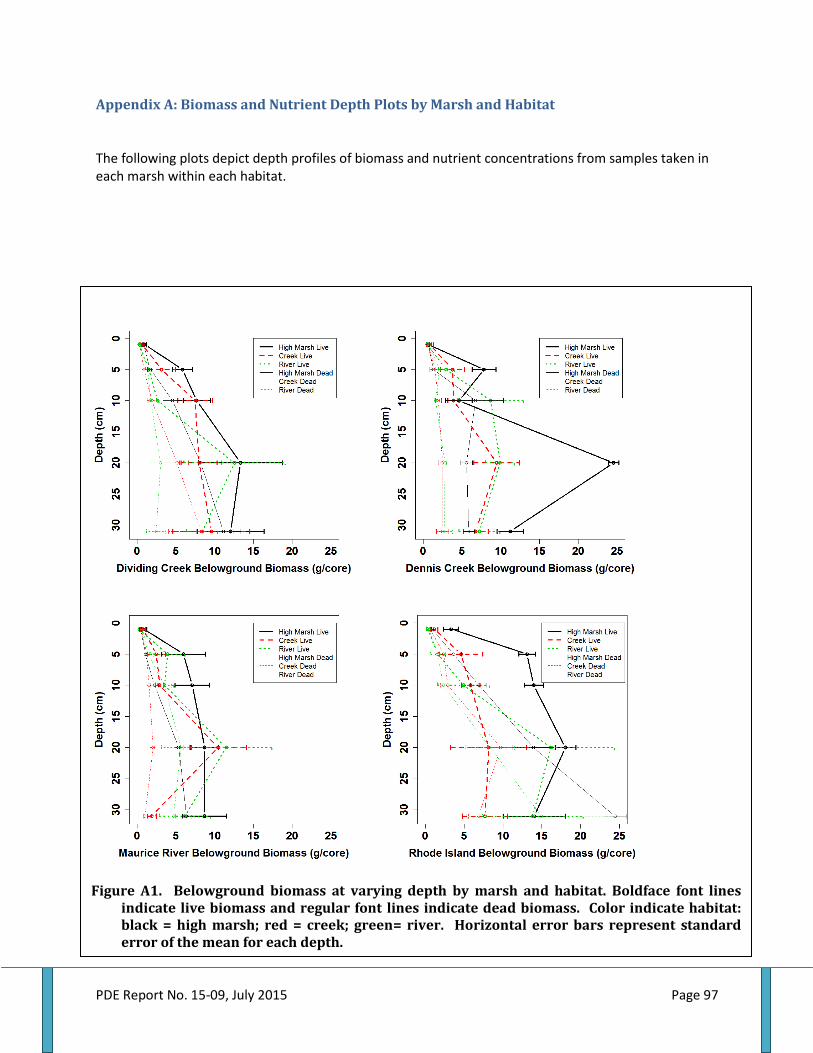
PDE Report No. 15-09, July 2015 Page 97
Appendix A: Biomass and Nutrient Depth Plots by Marsh and Habitat
The following plots depict depth profiles of biomass and nutrient concentrations from samples taken in each marsh within each habitat.
Figure A1. Belowground biomass at varying depth by marsh and habitat. Boldface font lines indicate live biomass and regular font lines indicate dead biomass. Color indicate habitat: black = high marsh; red = creek; green= river. Horizontal error bars represent standard error of the mean for each depth.
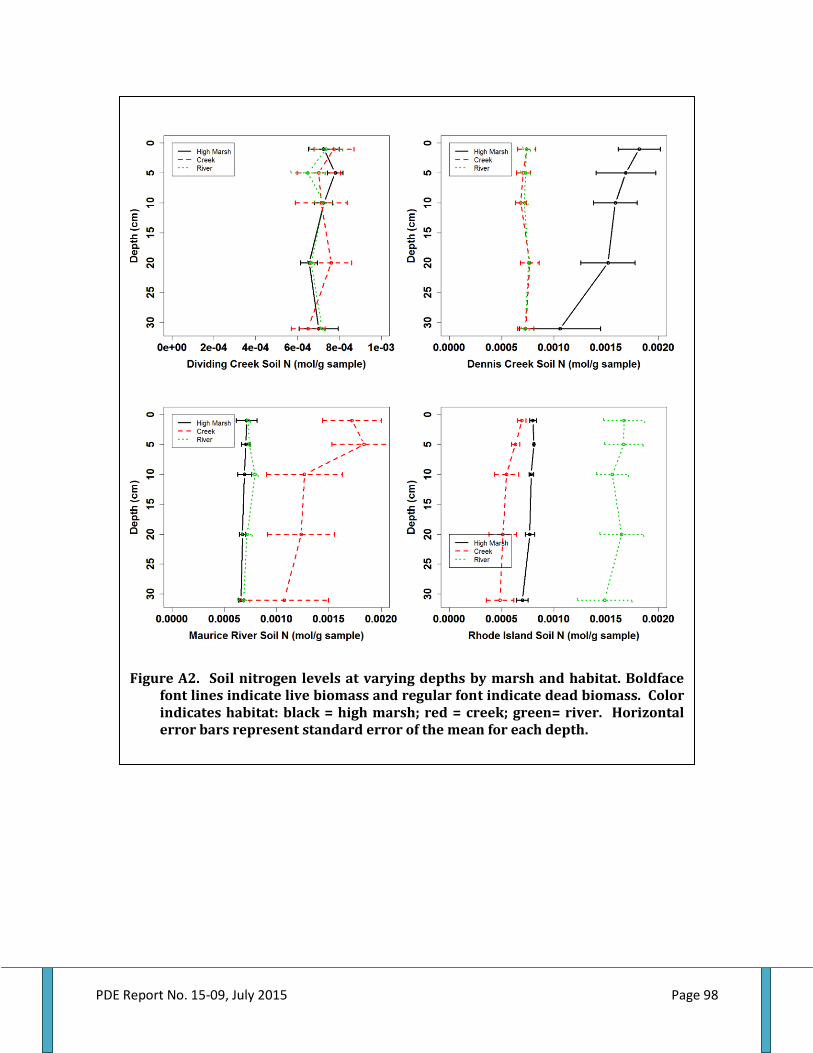
PDE Report No. 15-09, July 2015 Page 98
Figure A2. Soil nitrogen levels at varying depths by marsh and habitat. Boldface font lines indicate live biomass and regular font indicate dead biomass. Color indicates habitat: black = high marsh; red = creek; green= river. Horizontal error bars represent standard error of the mean for each depth.

PDE Report No. 15-09, July 2015 Page 99
Figure A3. Soil carbon to nitrogen ratios at varying depths by marsh and habitat. Boldface font lines indicate live biomass and regular font indicate dead biomass. Color indicates habitat: black = high marsh; red = creek; green= river. Horizontal error bars represent standard error of the mean for each depth.
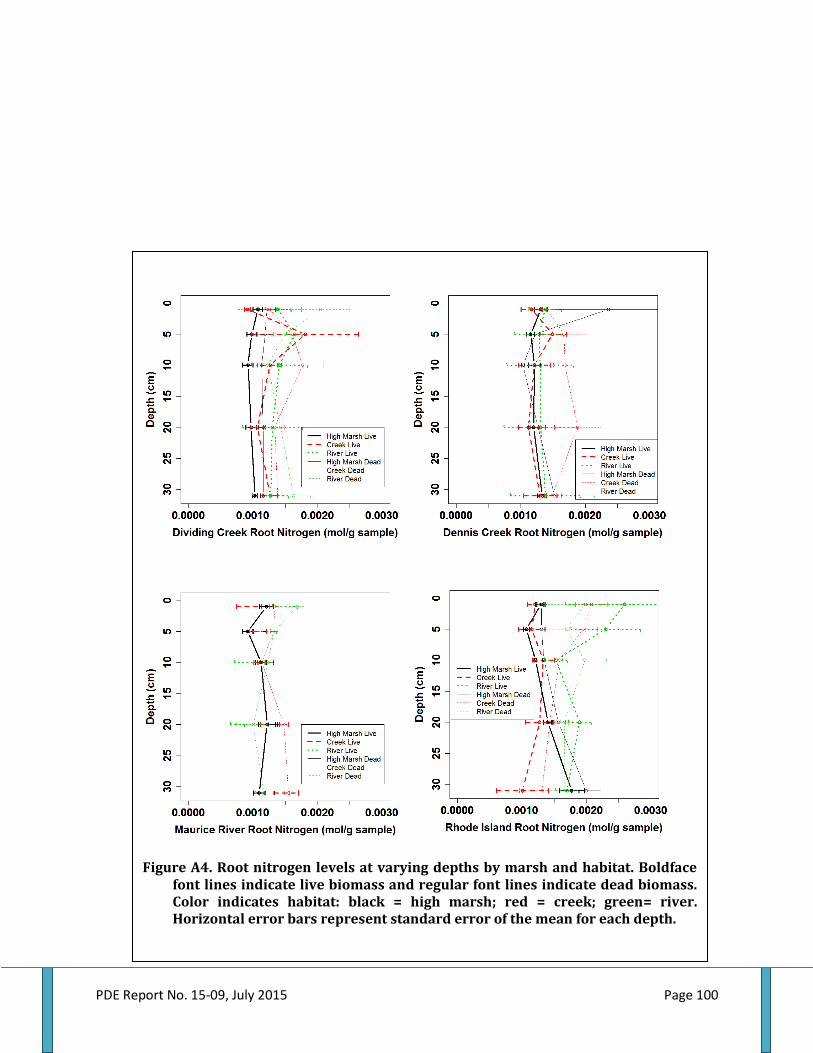
PDE Report No. 15-09, July 2015 Page 100
Figure A4. Root nitrogen levels at varying depths by marsh and habitat. Boldface font lines indicate live biomass and regular font lines indicate dead biomass. Color indicates habitat: black = high marsh; red = creek; green= river. Horizontal error bars represent standard error of the mean for each depth.

PDE Report No. 15-09, July 2015 Page 101
Figure A5. Root carbon to nitrogen ratios at varying depths by marsh and habitat. Boldface font lines indicate live biomass and regular font lines indicate dead biomass. Color indicates habitat: black = high marsh; red = creek; green= river. Horizontal error bars represent standard error of the mean for each depth.

PDE Report No. 15-09, July 2015 Page 102
Figure A6. Porewater nutrient levels at varying depths by marsh and habitat. Boldface font lines indicate live biomass and regular font lines indicate dead biomass. Color indicates habitat: black = high marsh; red = creek; green= river. Horizontal error bars represent standard error of the mean for each depth.

PDE Report No. 15-09, July 2015 Page 103
Appendix B: Mussel Biomass Regression Plots
The following plots depict relationships between ribbed mussel biomass and paired metrics between estuaries (Delaware Bay and Naragansett Bay), and among marshes (i.e. Dividing Creek, Dennis Creek, Maurice River ansd Rhode Island) by habitat.
Figure B1. Relationship between ribbed mussel biomass and live belowground biomass. Graph A depicts the relationship between variables using all data from all marshes (All Data), pooled NJ and pooled Rhode Island Data (RI). All r2 values are next to their respective regression lines in the legend. Additional graph partition data by habitat (B=river habitat; C=high marsh habitat; D= creek habitat), and data points within these graphs are grouped by marsh site.

PDE Report No. 15-09, July 2015 Page 104
Figure B2. Relationship between ribbed mussel biomass and dead belowground biomass. Graph A depicts the relationship between variables using all data from all marshes (All Data), pooled NJ and pooled Rhode Island Data (RI). All r2 values are next to their respective regression lines in the legend. Additional graph partition data by habitat (B=river habitat; C=high marsh habitat; D= creek habitat), and data points within these graphs are grouped by marsh.

PDE Report No. 15-09, July 2015 Page 105
Figure B3. Relationship between ribbed mussel biomass and total belowground biomass. Graph A depicts the relationship between variables using all data from all marshes (All Data), pooled NJ and pooled Rhode Island Data (RI). All r2 values are next to their respective regression lines in the legend. Additional graph partition data by habitat (B=river habitat; C=high marsh habitat; D= creek habitat), and data points within these graphs are grouped by marsh.

PDE Report No. 15-09, July 2015 Page 106
Figure B4. Relationship between ribbed mussel biomass and aboveground biomass. Graph A depicts the relationship between variables using all data from all marshes (All Data), pooled NJ and pooled Rhode Island Data (RI). All r2 values are next to their respective regression lines in the legend. Additional graph partition data by habitat (B=river habitat; C=high marsh habitat; D= creek habitat), and data points within these graphs are grouped by marsh.

PDE Report No. 15-09, July 2015 Page 107
Figure B5. Relationship between ribbed mussel biomass and aboveground to belowground biomass ratio. Graph A depicts the relationship between variables using all data from all marshes (All Data), pooled NJ (DE Bay) and pooled Rhode Island Data (RI). All r2 values are next to their respective regression lines in the legend. Additional graph partition data by habitat (B=river habitat; C=high marsh habitat; D= creek habitat), and data points within these graphs are grouped by marsh.

PDE Report No. 15-09, July 2015 Page 108
Figure B6. Relationship between ribbed mussel biomass and soil nitrogen. Graph A depicts the relationship between variables using all data from all marshes (All Data), pooled NJ Data (DE Bay) and pooled Rhode Island Data (RI). All r2 values are next to their respective regression lines in the legend. Additional graph partition data by habitat (B=river habitat; C=high marsh habitat; D= creek habitat), and data points within these graphs are grouped by marsh.

PDE Report No. 15-09, July 2015 Page 109
Figure B7. Relationship between ribbed mussel biomass and soil carbon to nitrogen ratios. Graph A depicts the relationship between variables using all data from all marshes (All Data), pooled NJ Data (DE Bay) and pooled Rhode Island Data (RI). All r2 values are next to their respective regression lines in the legend. Additional graph partition data by habitat (B=river habitat; C=high marsh habitat; D= creek habitat), and data points within these graphs are grouped by marsh.

PDE Report No. 15-09, July 2015 Page 110
Figure B8. Relationship between ribbed mussel biomass and root nitrogen. Graph A depicts the relationship between variables using all data from all marshes (All Data), pooled NJ Data (DE Bay) and pooled Rhode Island Data (RI). All r2 values are next to their respective regression lines in the legend. Additional graph partition data by habitat (B=river habitat; C=high marsh habitat; D= creek habitat), and data points within these graphs are grouped by marsh.

PDE Report No. 15-09, July 2015 Page 111
Figure B9. Relationship between ribbed mussel biomass and root carbon to nitrogen ratios. Graph A depicts the relationship between variables using all data from all marshes (All Data), pooled Delaware Bay Data (DE Bay) and pooled Rhode Island Data (RI). All r2 values are next to their respective regression lines in the legend. Additional graph partition data by habitat (B=river habitat; C=high marsh habitat; D= creek habitat), and data points within these graphs are grouped by marsh.

PDE Report No. 15-09, July 2015 Page 112
Figure B10. Relationship between ribbed mussel biomass and plant nitrogen. Graph A depicts the relationship between variables using all data from all marshes (All Data), pooled NJ Data (DE Bay) and pooled Rhode Island Data (RI). All r2 values are next to their respective regression lines in the legend. Additional graph partition data by habitat (B=river habitat; C=high marsh habitat; D= creek habitat), and data points within these graphs are grouped by marsh.

PDE Report No. 15-09, July 2015 Page 113
Figure B11. Relationship between ribbed mussel biomass and plant carbon to nitrogen ratio. Graph A depicts the relationship between variables using all data from all marshes (All Data), pooled NJ Data (DE Bay) and pooled Rhode Island Data (RI). All r2 values are next to their respective regression lines in the legend. Additional graph partition data by habitat (B=river habitat; C=high marsh habitat; D= creek habitat), and data points within these graphs are grouped by marsh.
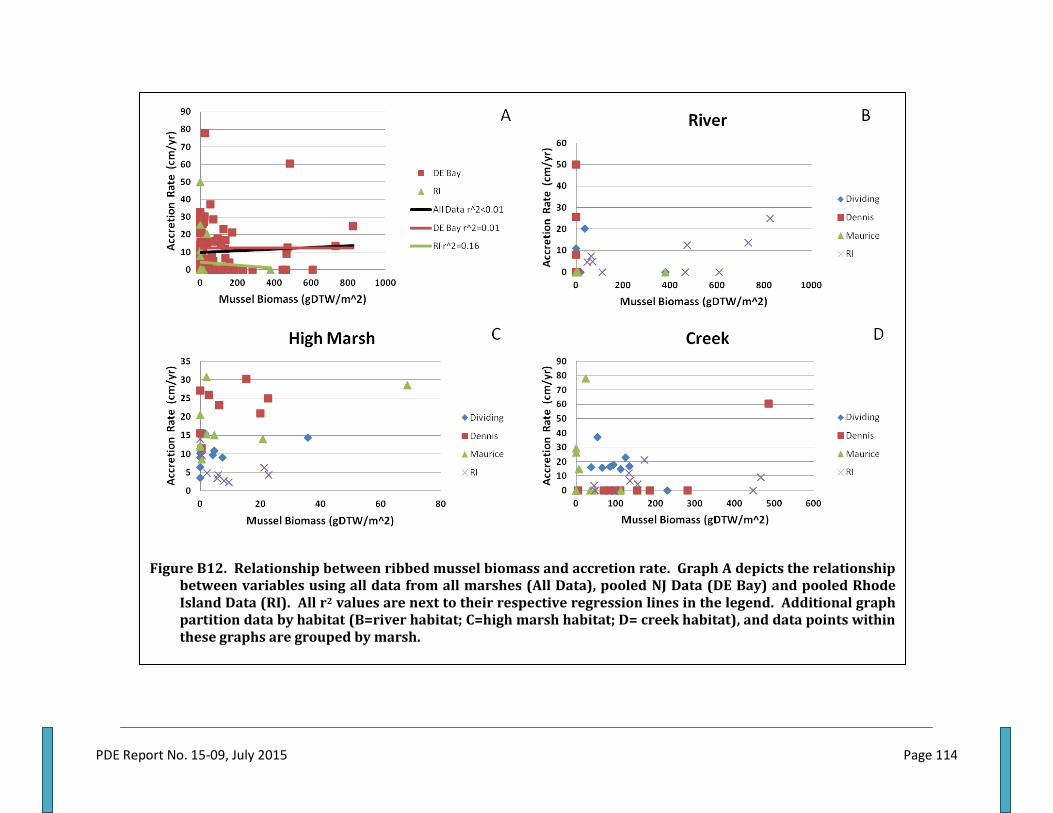
PDE Report No. 15-09, July 2015 Page 114
Figure B12. Relationship between ribbed mussel biomass and accretion rate. Graph A depicts the relationship between variables using all data from all marshes (All Data), pooled NJ Data (DE Bay) and pooled Rhode Island Data (RI). All r2 values are next to their respective regression lines in the legend. Additional graph partition data by habitat (B=river habitat; C=high marsh habitat; D= creek habitat), and data points within these graphs are grouped by marsh.

PDE Report No. 15-09, July 2015 Page 115
Appendix C: Estimated Filtration of Total Suspended Solids (TSS) and Particulate Nitrogen by Ribbed Mussels in Different Marshes and Habitats
The following tables depict TSS and particulate nutrient removal services of ribbed mussels in each habitat or each marsh. Ribbed mussel biomass (m-2) is multiplied by the daily clearance rate, TSS and particulate N concentrations (mg L-1) and scaled to estimate the total particulate and particulate nutrient ecosystem services of each habitat of each marsh. The Area Wide TSS and Nutrient Removal Services by Habitat is boldfaced at the bottom of each table.
Table C1. Calculations of ribbed mussel area wide TSS and particulate nitrogen removal for all habitats at Dividing Creek site 1.

PDE Report No. 15-09, July 2015 Page 116
Table C2. Calculations of ribbed mussel area wide TSS and particulate nitrogen removal for all habitats at Dividing Creek site 2.
Table C3. Calculations of ribbed mussel area wide TSS and particulate nitrogen removal for all habitats at Dividing Creek site 3.

PDE Report No. 15-09, July 2015 Page 117
Table C4. Calculations of ribbed mussel area wide TSS and particulate nitrogen removal for all habitats at Dennis Creek site 1.
Table C5. Calculations of ribbed mussel area wide TSS and particulate nitrogen removal for all habitats at Dennis Creek site 2.

PDE Report No. 15-09, July 2015 Page 118
Table C6. Calculations of ribbed mussel area wide TSS and particulate nitrogen removal for all habitats at Dennis Creek site 3.
Table C7. Calculations of ribbed mussel area wide TSS and particulate nitrogen removal for all habitats at Maurice River site 1.

PDE Report No. 15-09, July 2015 Page 119
Table C8. Calculations of ribbed mussel area wide TSS and particulate nitrogen removal for all habitats at Maurice River site 2.
Table C9. Calculations of ribbed mussel area wide TSS and particulate nitrogen removal for all habitats at Maurice River site 3.

PDE Report No. 15-09, July 2015 Page 120
Table C10. Calculations of ribbed mussel area wide TSS and particulate nitrogen removal for all habitats at Rhode Island site 1.
Table C11. Calculations of ribbed mussel area wide TSS and particulate nitrogen removal for all habitats at Rhode Island site 2.

PDE Report No. 15-09, July 2015 Page 121
Table C12. Calculations of ribbed mussel area wide TSS and particulate nitrogen removal for all habitats at Rhode Island site 3.

PDE Report No. 15-09, July 2015 Page 122
Appendix D: Maps of Habitat Area, Mussel Demographics and Ecosystem Services
These figures depict the percentage of total area, ribbed mussel biomass distribution and total particulate and particulate nutrient removal services by habitat for each site in each marsh. Total habitat area refers to the percentage of each habitat type in an expanded area with a radius of 300m surrounding the transects, not crossing the main water channel. Ribbed mussel biomass is the estimation of biomass of each habitat type calculated by multiplying the biomass per m2 of each habitat by the area and taking the percentage. These metrics are used to calculate the area wide TSS and particulate nutrient removal services of each site (see Appendix C for calculations) as depicted in the maps.

PDE Report No. 15-09, July 2015 Page 123
Figure D1. Habitat area, ribbed mussel biomass distribution ecosystem services for Dividing Creek site 1. Habitat percentage of area is depicted in green; mussel density (gDTW m-2) is depicted in blue; particulate nitrogen (Kg ha-1 yr-1) removal services is depicted in red; and total TSS removal services (Kg ha-1 yr-1) is depicted in pink.

PDE Report No. 15-09, July 2015 Page 124
Figure D2. Habitat area, ribbed mussel biomass distribution ecosystem services for Dividing Creek site 2. Habitat percentage of area is depicted in green; mussel density (gDTW m-2) is depicted in blue; particulate nitrogen (Kg ha-1 yr-1) removal services is depicted in red; and total TSS removal services (Kg ha-1 yr-1) is depicted in pink.

PDE Report No. 15-09, July 2015 Page 125
Figure D3. Habitat area, ribbed mussel biomass distribution ecosystem services for Dividing Creek site 3. Habitat percentage of area is depicted in green; mussel density (gDTW m-2) is depicted in blue; particulate nitrogen (Kg ha-1 yr-1) removal services is depicted in red; and total TSS removal services (Kg ha-1 yr-1) is depicted in pink.

PDE Report No. 15-09, July 2015 Page 126
Figure D4. Habitat area, ribbed mussel biomass distribution ecosystem services for Dennis Creek site 1. Habitat percentage of area is depicted in green; mussel density (gDTW m-2) is depicted in blue; particulate nitrogen (Kg ha-1 yr-1) removal services is depicted in red; and total TSS removal services (Kg ha-1 yr-1) is depicted in pink.

PDE Report No. 15-09, July 2015 Page 127
Figure D5. Habitat area, ribbed mussel biomass distribution ecosystem services for Dennis Creek site 2. Habitat percentage of area is depicted in green; mussel density (gDTW m-2) is depicted in blue; particulate nitrogen (Kg ha-1 yr-1) removal services is depicted in red; and total TSS removal services (Kg ha-1 yr-1) is depicted in pink.

PDE Report No. 15-09, July 2015 Page 128
Figure D6. Habitat area, ribbed mussel biomass distribution ecosystem services for Dennis Creek site 3. Habitat percentage of area is depicted in green; mussel density (gDTW m-2) is depicted in blue; particulate nitrogen (Kg ha-1 yr-1) removal services is depicted in red; and total TSS removal services (Kg ha-1 yr-1) is depicted in pink.

PDE Report No. 15-09, July 2015 Page 129
Figure D7. Habitat area, ribbed mussel biomass distribution ecosystem services for Maurice River site 1. Habitat percentage of area is depicted in green; mussel density (gDTW m-2) is depicted in blue; particulate nitrogen (Kg ha-1 yr-1) removal services is depicted and total TSS removal services (Kg ha-1 yr-1) are depicted in pink.

PDE Report No. 15-09, July 2015 Page 130
Figure D8. Habitat area, ribbed mussel biomass distribution ecosystem services for Maurice River site 2. Habitat percentage of area is depicted in green; mussel density (gDTW m-2) is depicted in blue; particulate nitrogen (Kg ha-1 yr-1) removal services and total TSS removal services (Kg ha-1 yr-1) are depicted in pink.

PDE Report No. 15-09, July 2015 Page 131
Figure D9. Habitat area, ribbed mussel biomass distribution ecosystem services for Maurice River site3. Habitat percentage of area is depicted in green; mussel density (gDTW m-2) is depicted in blue; particulate nitrogen (Kg ha-1 yr-1) removal services is depicted in red; and total TSS removal services (Kg ha-1 yr-1) is depicted in pink.

PDE Report No. 15-09, July 2015 Page 132
Figure D10. Habitat area, ribbed mussel biomass distribution ecosystem services for Rhode Island site 1. Habitat percentage of area is depicted in green; mussel density (gDTW m-2) is depicted in blue; particulate nitrogen (Kg ha-1 yr-1) removal services is depicted in red; and total TSS removal services (Kg ha-1 yr-1) is depicted in pink.

PDE Report No. 15-09, July 2015 Page 133
Figure D11. Habitat area, ribbed mussel biomass distribution ecosystem services for Rhode Island site 2. Habitat percentage of area is depicted in green; mussel density (gDTW m-2) is depicted in blue; particulate nitrogen (Kg ha-1 yr-1) removal services is depicted in red; and total TSS removal services (Kg ha-1 yr-1) is depicted in pink.

PDE Report No. 15-09, July 2015 Page 134
Figure D12. Habitat area, ribbed mussel biomass distribution ecosystem services for Rhode Island site 3. Habitat percentage of area is depicted in green; mussel density (gDTW m-2) is depicted in blue; particulate nitrogen (Kg ha-1 yr-1) removal services is depicted in red; and total TSS removal services (Kg ha-1 yr-1) is depicted in pink.