Embed Size (px)
Citation preview

Implosion dynamics measurements at the National Ignition FacilityD. G. Hicks, N. B. Meezan, E. L. Dewald, A. J. Mackinnon, R. E. Olson et al. Citation: Phys. Plasmas 19, 122702 (2012); doi: 10.1063/1.4769268 View online: http://dx.doi.org/10.1063/1.4769268 View Table of Contents: http://pop.aip.org/resource/1/PHPAEN/v19/i12 Published by the American Institute of Physics. Related ArticlesStatistical spatio-temporal properties of the Laser MegaJoule speckle Phys. Plasmas 19, 102704 (2012) Formation of jet-like spikes from the ablative Rayleigh-Taylor instability Phys. Plasmas 19, 100701 (2012) Designs for highly nonlinear ablative Rayleigh-Taylor experiments on the National Ignition Facility Phys. Plasmas 19, 082708 (2012) Direct drive implosion experiments on SGIII prototype laser facility: Assessing energy coupling efficiency andimplosion symmetry Phys. Plasmas 19, 072708 (2012) Study of Rayleigh–Taylor growth in directly driven cryogenic-deuterium targets Phys. Plasmas 19, 072707 (2012) Additional information on Phys. PlasmasJournal Homepage: http://pop.aip.org/ Journal Information: http://pop.aip.org/about/about_the_journal Top downloads: http://pop.aip.org/features/most_downloaded Information for Authors: http://pop.aip.org/authors
Downloaded 07 Dec 2012 to 198.125.178.250. Redistribution subject to AIP license or copyright; see http://pop.aip.org/about/rights_and_permissions

Implosion dynamics measurements at the National Ignition Facility
D. G. Hicks,1,a) N. B. Meezan,1 E. L. Dewald,1 A. J. Mackinnon,1 R. E. Olson,2
D. A. Callahan,1 T. D€oppner,1 L. R. Benedetti,1 D. K. Bradley,1 P. M. Celliers,1 D. S. Clark,1
P. Di Nicola,1 S. N. Dixit,1 E. G. Dzenitis,1 J. E. Eggert,1 D. R. Farley,1 J. A. Frenje,3
S. M. Glenn,1 S. H. Glenzer,1 A. V. Hamza,1 R. F. Heeter,1 J. P. Holder,1 N. Izumi,1
D. H. Kalantar,1 S. F. Khan,1 J. L. Kline,4 J. J. Kroll,1 G. A. Kyrala,4 T. Ma,1 A. G. MacPhee,1
J. M. McNaney,1 J. D. Moody,1 M. J. Moran,1 B. R. Nathan,1 A. Nikroo,5 Y. P. Opachich,1
R. D. Petrasso,3 R. R. Prasad,1 J. E. Ralph,1 H. F. Robey,1 H. G. Rinderknecht,3
J. R. Rygg,1 J. D. Salmonson,1 M. B. Schneider,1 N. Simanovskaia,1 B. K. Spears,1
R. Tommasini,1 K. Widmann,1 A. B. Zylstra,3 G. W. Collins,1 O. L. Landen,1 J. D. Kilkenny,1
W. W. Hsing,1 B. J. MacGowan,1 L. J. Atherton,1 and M. J. Edwards1
1Lawrence Livermore National Laboratory, Livermore, California 94550, USA2Sandia National Laboratory, Albuquerque, New Mexico 87185, USA3Massachusetts Institute of Technology, Cambridge, Massachusetts 02139, USA4Los Alamos National Laboratory, Los Alamos, New Mexico 87545, USA5General Atomics, San Diego, California 92121, USA
(Received 13 October 2012; accepted 13 November 2012; published online 7 December 2012)
Measurements have been made of the in-flight dynamics of imploding capsules indirectly driven
by laser energies of 1–1.7 MJ at the National Ignition Facility [Miller et al., Nucl. Fusion 44, 228
(2004)]. These experiments were part of the National Ignition Campaign [Landen et al., Phys.
Plasmas 18, 051002 (2011)] to iteratively optimize the inputs required to achieve thermonuclear
ignition in the laboratory. Using gated or streaked hard x-ray radiography, a suite of ablator
performance parameters, including the time-resolved radius, velocity, mass, and thickness, have
been determined throughout the acceleration history of surrogate gas-filled implosions. These
measurements have been used to establish a dynamically consistent model of the ablative drive
history and shell compressibility throughout the implosion trajectory. First results showed that the
peak velocity of the original 1.3-MJ Ge-doped polymer (CH) point design using Au hohlraums
reached only 75% of the required ignition velocity. Several capsule, hohlraum, and laser pulse
changes were then implemented to improve this and other aspects of implosion performance and a
dedicated effort was undertaken to test the sensitivity of the ablative drive to the rise time and
length of the main laser pulse. Changing to Si rather than Ge-doped inner ablator layers and
increasing the pulse length together raised peak velocity to 93% 6 5% of the ignition goal using a
1.5 MJ, 420 TW pulse. Further lengthening the pulse so that the laser remained on until the capsule
reached 30% (rather than 60%–70%) of its initial radius, reduced the shell thickness and improved
the final fuel qR on companion shots with a cryogenic hydrogen fuel layer. Improved drive efficiency
was observed using U rather than Au hohlraums, which was expected, and by slowing the rise time
of laser pulse, which was not. The effect of changing the Si-dopant concentration and distribution, as
well as the effect of using a larger initial shell thickness were also examined, both of which indicated
that instabilities seeded at the ablation front are a significant source of hydrodynamic mix into the
central hot spot. Additionally, a direct test of the surrogacy of cryogenic fuel layered versus gas-filled
targets was performed. Together all these measurements have established the fundamental ablative-
rocket relationship describing the dependence of implosion velocity on fractional ablator mass
remaining. This curve shows a lower-than-expected ablator mass at a given velocity, making the
capsule more susceptible to feedthrough of instabilities from the ablation front into the fuel and hot
spot. This combination of low velocity and low ablator mass indicates that reaching ignition on the
NIF will require >20 lm (�10%) thicker targets and laser powers at or beyond facility limits. VC
2012 American Institute of Physics. [http://dx.doi.org/10.1063/1.4769268]
I. INTRODUCTION
A. Ignition requirements and optimization
In the indirect-drive approach to inertial confinement
fusion (ICF),1–3 laser energy, converted to thermal x rays
inside a high-Z cavity (hohlraum), ablatively drives the im-
plosion of a spherical capsule containing a deuterium-tritium
(DT) fuel layer. The resulting kinetic energy imparted to the
fuel is converted at stagnation to a central hot spot inertially
confined by colder, denser fuel.
The essential physics requirements for ignition can be
intuitively grasped by considering the energy balance of thea)[email protected].
1070-664X/2012/19(12)/122702/26/$30.00 VC 2012 American Institute of Physics19, 122702-1
PHYSICS OF PLASMAS 19, 122702 (2012)
Downloaded 07 Dec 2012 to 198.125.178.250. Redistribution subject to AIP license or copyright; see http://pop.aip.org/about/rights_and_permissions

hot spot. When approaching the ignition threshold, the heat
gained due to compression should exceed the heat lost
through conduction and radiation. Delivering compressive
work to the hot spot fast enough to overcome losses requires
a high fuel velocity. Minimizing conduction and radiation
loss demands that the hot spot be spherically symmetric and
nearly free of cooler or higher-Z material driven into the
core region by hydrodynamic instabilities. Inertially sustain-
ing this net heating long enough to ignite a significant fuel
fraction requires that the incoming fuel layer have a low
enough adiabat that a high areal density is generated around
the hot spot upon final convergence.
These requirements on the velocity and adiabat of the
incoming fuel layer and the shape and mix fraction of the
final hot spot can be combined into a single figure-of-merit
such as the energy margin4 or ignition threshold factor
(ITF)5 given by the ratio of available kinetic energy to the
minimum required for ignition. Since the kinetic energy
scales as V2f , where Vf is the fuel velocity, and the minimum
required for ignition6,7 scales as �V�6f , energy margin (or
ITF) scales as V8f . This illustrates the critical importance of
high velocities in the ICF hot spot ignition scheme. A value
of 370 lm/ns is calculated to be at the ignition threshold.
Ignition requirements typically compete with each other.
A fundamental trade-off is that between velocity and mix.
Rocket-like3,8 ablative acceleration of an ICF capsule
achieves higher capsule velocities by removing ablator mass;
however, too little remaining mass raises the risk of feed-
through of ablation front instabilities into the fuel and hot
spot.9,10 This competition between velocity and mix ulti-
mately sets the total laser energy required to achieve ignition
since larger masses are more stable but require more energy
to reach ignition velocity. Similarly, the velocity and adiabat
requirements place competing demands on the laser pulse
shape: High velocities are achieved with a high peak power
delivered early in the pulse when the shell surface area is
largest; low fuel adiabats are preserved by a slow increase in
laser power to minimize shock entropy and can be compro-
mised by pre-heat driven by high laser powers. The resulting
optimized pulse shape has a long low power foot to minimize
the adiabat and rises quickly to a high peak power to maxi-
mize the velocity.11
The National Ignition Facility (NIF)12 laser was
designed to operate at up to 1.8 MJ. On this energy scale,
known uncertainties in high energy density physics models
prevent an a priori determination of the experimental input
parameters from radiation-hydrodynamic simulations alone.
Additionally, uncertainties exist in the velocity, adiabat,
shape, and mix requirements themselves: exactly satisfying
all these requirements was previously thought to give a 50%
chance the capsule will ignite.13
The National Ignition Campaign (NIC) was thus
designed as a multi-dimensional experimental optimization
of several different laser and target parameters, iteratively
adjusting them to achieve ignition.13–15 Starting from an ini-
tial “point design,” 14 laser and 3 target parameters were to
be adjusted based on data returned from 4 different types of
experimental platform:15 Surrogate (gas-filled) capsules
(“symcaps”) are used for measurements of the shape of the
core (i.e., the central hot spot) to infer drive symmetry;16
shock timing measurements in liquid deuterium are used to
infer the fuel adiabat;17,18 convergent ablator measurements
are used to infer ablator velocity and mass;19 Yield and qR
measurements20,21 on cryogenic layered targets are then used
to assess integrated performance22,23 and mix.24,25 These
data have been used to progressively iterate the laser and tar-
get parameters to push implosion performance towards
simultaneously meeting the requirements on velocity, adia-
bat, symmetry, and mix.
B. Background
This paper focuses on results from convergent ablator
measurements on NIF ignition-scale implosions. The conver-
gent ablator, or “ConA,” experiments were designed to
address uncertainties in the ability to predict the ablation
pressure and mass ablation rate of the converging capsule.
These lead to uncertainties in the final velocity and remain-
ing ablator mass that determine the velocity-mix trade-off.
For ignition-scale NIF implosions, the mass of plasma
ablated from the capsule (�3 mg) is 20–40 times larger than
has been generated at previous laser facilities such as
OMEGA26 or NOVA
27 at comparable radiation temperatures
(�300 eV). X rays produced at the hohlraum wall and in the
coronal plasma must be transported through this blow-off to
reach the capsule ablation front. Radiation transport through
the plasma, which may not be in thermal equilibrium, is
strongly affected by opacities28–30 and equations-of-state
(EOS)31,32 and represents a major computational challenge.
For example, in going from tens to hundreds of eV across an
ablation front, carbon transitions from a Li-like to H-like
ionization state, strongly affecting both opacity and EOS.
Uncertainties in previous mass ablation rate measurements
on smaller hohlraums at lower radiation temperatures33,34
are magnified significantly when extrapolated to NIF-scale
plasmas due to the larger optical depths involved.
Early hohlraum energetics measurements on the NIF,35–38
though apparently successful in demonstrating sufficient
laser-to-x-ray conversion efficiencies and tunable symmetry
in surrogate capsules, persistently showed that the time at
which peak x-ray emission from the imploded core occurred
(referred to as the x-ray bang time (XRBT)) was 200–300 ps
later than predicted by radiation-hydrodynamic simulations.
This hinted that coupling of energy to the capsule was over-
estimated in the simulations. Implementation of the shock
timing measurements indicated that those early energetics
experiments were compromised by a severely suppressed
laser picket, soon found to be caused by the presence of a
few microns of target chamber condensate on the hohlraum
laser entrance holes (LEH).17 Fixing this problem resulted in
an even larger bang time discrepancy, although at the time, it
was not immediately clear that a late bang time guaranteed a
low peak velocity. Subsequent improvements in shock tim-
ing, raising the laser picket further, and delaying the main
pulse,18 increased this discrepancy even more. It was during
these earliest shock timing measurements, after diagnosing
the LEH condensate problem, which the ConA measure-
ments described here were begun.
122702-2 Hicks et al. Phys. Plasmas 19, 122702 (2012)
Downloaded 07 Dec 2012 to 198.125.178.250. Redistribution subject to AIP license or copyright; see http://pop.aip.org/about/rights_and_permissions

The convergent ablator tuning strategy, as originally
conceived, required measurements of the peak velocity and
minimum mass of the ablator only.13,15,39 Deviations from
the design goal would then be reduced by changing the peak
laser power and initial ablator thickness in an iterative
approach demanding relatively few shots. Implicit in this
strategy was that velocities of the point design would be
within several percent of the ignition requirement and that
the tuning landscape would be nearly linear and thus mono-
tonic. As described below, first data showed that peak veloc-
ities of the 1.3 MJ Ge-doped polymer (CH) point design
were �25% below ignition requirements. Such a significant
deviation from expectation meant that it would be difficult to
achieve the required velocities within the energy and power
constraints of the current NIF laser. Substantive changes in
capsule designs, hohlraum designs, and laser pulse shapes,
some of which had been anticipated before and others which
were conceived during the experiments, would be necessary.
With ongoing experiments, it also became apparent that
the measurement of shell velocity and mass needed to
expand from being simply an “end state” measurement of
conditions at peak velocity (after the laser turned off) to
being a detailed mapping of the drive history via the
observed implosion dynamics. The shock timing campaign,
which uses continuous velocity interferometry to interrogate
the drive pressure history during the foot of the pulse, is
silent beyond the rise of the main pulse due to optical blank-
ing of the leading shock wave.17,18 There was thus a blind
spot in the knowledge of the history of the drive on the cap-
sule throughout the main laser pulse. By tracking the shell
trajectory, mass, and thickness during this period, it has now
been possible to fill in this gap and constrain the drive pres-
sure history throughout the entire implosion.
C. Outline
Section II describes the setup of the implosion experi-
ment, emphasizing the particular details of the ConA radio-
graphic platform. Section III gives an overview and some
new details about how analysis of the radiograph is per-
formed and what experimental observables are extracted.
Section IV provides a brief description of the simulations to
which these measurements are compared. Section V goes
through the suite of observables obtained on each group of
shots, highlighting the main points. In Sec. VI, all these
results and their implications are discussed, with conclusions
given in Sec. VII. Readers interested in a summary assess-
ment of these experiments, without extensive experimental
details, can skip directly to Secs. VI and VII.
The convergent ablator experiments were performed
within the broader context of the NIC, and thus incorporated
influences and design changes motivated by other experimental
platforms. The sequence of shots described in this paper reflects
this evolution. Though it is not the purpose of this paper to
explain the data from other platforms, brief mention will be
given of the results or conjectures that motivated design
changes to the ConA experiments described here.
The nature of an on-going experimental campaign is
that new data often sheds a different light on past experi-
ments. This paper presents plausible current interpretations
of the results obtained thus far. There remain open questions
whose resolution will await further experiments.
II. EXPERIMENTAL SETUP
The experimental setup for the various shots evolved
over the course of the different campaigns. In this section, an
overall summary is given of each experimental component:
the laser, backlighter, hohlraum, capsule, and diagnostics,
listing the different configurations. The motivation for each
change will be described briefly, pointing out those design
changes that were anticipated in the original tuning plan13
and those that were not.
A. Laser conditions
The NIF12 laser was designed to deliver up to 1.8 MJ at
a wavelength of 0.35 lm. Its 192 beams are grouped into 48
quads with 16 quads comprising the inner cone of beams
(oriented at 23:5� and 30� to the hohlraum axis) and 32
quads comprising the outer cone of beams (oriented at 44:5�
and 50�). To enable cross-beam transfer for symmetry tun-
ing,40 inner and outer cone wavelengths were separated by
several Angstroms. Wavelength separation was enabled
between the 23:5� and 30� beams, once this capability was
implemented.41 Over the course of the experiments, the
exact wavelength separations were adjusted according to the
results from core emission symmetry measurements. All
beams used continuous phase plates, smoothing by spectral
dispersion, and polarization smoothing.42 In these shots,
laser energies into the hohlraum varied between 1 to 1.7 MJ,
delivered on 184 beams. The remaining 8 beams (2 quads)
were used to drive a backlighter foil.
A major focus of many of these shots was to investigate
changes in the implosion dynamics observed with the rise
time and duration of the main pulse. Nominal rise times to a
peak power of 420 TW were 2 ns. Shots were taken with
both 1 ns and 3 ns rise times, with many of the later shots
using the 3 ns rise. Note that when changing the peak power,
the slope of the rise remained the same, thus changing the
duration of the rise. Nevertheless, the different slopes were
still referred to as 1, 2, and 3 ns rises. The duration of the
laser pulse was lengthened for many shots after it was dis-
covered that the capsule acceleration appeared to decrease
more rapidly than expected after the laser turned off. Several
shots at the end of the experimental series used this longer
“low coast” drive. While tuning the 4th rise duration was
part of the original tuning plan, lengthening the main pulse
was not.
B. Backlighter beams
Two outer quads were used to drive the backlighter foil
with 35–60 kJ of energy in a pulse with a 1 to 2.4 ns flattop
with a peak power of up to 2.2 TW/beam or 16–18 TW com-
bined power. Initial shots looked late in time only, using
shorter, lower energy pulses while later shots used the lon-
ger, higher energy pulses to view more of the target trajec-
tory. The backlighter pulse was designed with a low-power
122702-3 Hicks et al. Phys. Plasmas 19, 122702 (2012)
Downloaded 07 Dec 2012 to 198.125.178.250. Redistribution subject to AIP license or copyright; see http://pop.aip.org/about/rights_and_permissions

pre-pulse, arriving �4 ns before the main pulse, to preform a
plasma and increase x-ray conversion efficiency.43
Beams were pointed towards the 5lm thick Zn backlighter
foil positioned at 6 or 12 mm away from capsule center, a dis-
tance set by the need to avoid beam interference with the light
shields surrounding the target. Using the standard outer cone
phase plates generates a spot that is approximately 1.2 mm
wide (oriented in the hohlraum equatorial plane) and 1 mm
high when projected onto the foil. For shots designed to look
late in the implosion when the capsule radius was �500 lm, all
8 beams were overlapped at a single spot giving a peak laser in-
tensity of �2� 1015 W=cm2. For shots looking earlier in time,
the quads were pointed 1.2–1.4 mm apart, illuminating a
2.4 mm wide field of view with half the intensity.
C. Hohlraum design
The hohlraum length, diameter, and LEH diameter, as
well as the hohlraum material were changed over the course
of these shots. Though the original tuning plan had required
only the hohlraum length be adjusted,13 results from both
symmetry and velocity measurements indicated the need to
improve the hohlraum design. In all experiments, the hohl-
raum was filled with pure 4He at a density 0:96 mg=cm3, set
by the earlier hohlraum energetics campaign.35
Initial experiments were performed using the point
design hohlraum5 which had a 5.44 mm inner diameter,
10.01 mm inner length, and a 3.101 mm diameter LEH at
cryogenic shot temperatures (�24 K). After extensive meas-
urements of core symmetry16 showed that drive at the hohl-
raum waist was being depleted by optical scatter from the
inner cone beams (resulting in a tendency toward oblate
implosions), a shorter, wider hohlraum was implemented
having a 5.75 mm inner diameter, 9.425 mm inner length
(see Fig. 1(a)). This increased drive at the capsule waist from
the outer cone beams, reducing demands on cross-beam
energy transfer to the inner cone beams. To investigate pos-
sible laser clipping at the laser entrance hole, a larger diame-
ter LEH (3.373 mm) was tested.44 Though no evidence of
clipping was found, there was found to be a nearly 10% loss
in peak velocity (described below). This resulted in a return
to the original 3.101 mm diameter LEH on subsequent shots.
In this last design configuration, tests were performed
using both gold and uranium hohlraums. Gold hohlraum wall
thicknesses were 30 lm. Uranium hohlraums had an 8.8 lm
thick layer of depleted uranium inside an 18 lm thick gold
wall. At peak hohlraum temperatures approaching 300 eV,
uranium has a higher opacity and lower specific heat than
gold and thus provides an increased x-ray conversion effi-
ciency,44 leading to higher capsule velocities for a given
laser energy. The inside of the uranium layer was lined with
a 0.6 lm gold layer, which protects the uranium from oxida-
tion and also replicates conditions in Au hohlraums during
the foot of the pulse. The various hohlraum design changes
are listed according to shot number in Table III.
D. Capsule design
Capsules with CH-based ablators were used throughout
this study. This glow-discharge polymer is composed of
42.3% carbon, 57.2% hydrogen, and 0.5% oxygen by atomic
fraction. After the first few shots, the ablator mid-Z dopant
material was changed from germanium, set by the original
point design,5 to silicon in order to increase ablative drive
pressure and thus peak capsule velocity. Most shots were
performed with the resulting graded Si-doped design con-
taining the stair-stepped 1%, 2%, 1% graded layered distri-
bution45 (see Fig. 1(b)). Towards the end of the experiments,
a few shots used double the Si dopant concentration in each
graded layer, and also a uniform Si dopant distribution. In
addition, a single shot was performed with an ablator 20 lm
thicker than the standard 209 lm thick design. The different
types of target, the dopant concentrations, and layer densities
are listed in Table I. Exact thicknesses and radii on a given
shot, as well as the fill gas, are given in Table III. The origi-
nal tuning plan anticipated that the ablator thickness and
dopant concentration would need to be experimentally opti-
mized;13 having to adjust the dopant material and its distri-
bution were not expected.
All but one of the shots utilized capsules filled with
D-3He gas, or symcaps. These gas-filled targets act as surro-
gates for targets containing solid DT or tritium-hydrogen-
deuterium (THD)46 fuel layers. Most gas-filled capsules
contained 6:3 mg=cm3 of 30:70 atomic deuterium to 3He
fraction set to 24 K at shot time. One shot was taken with a
50:50 D-3He atomic fraction. This fill provides neutron yield
at bang time and proton spectral47 information at shock flash
time (the arrival time at capsule center of a strong shock, just
prior to final stagnation). Note that the gas fill pressure for
symcaps (�3000 Torr) is around 60 times larger than the
FIG. 1. (a) Target design showing the position of the zinc backlighter foil
and the viewing slots through the hohlraum. Hohlraum dimensions are given
for one type of design (see Table III). (b) Schematic of ablator showing
dimensions for a graded Si-doped capsule (see Table I).
122702-4 Hicks et al. Phys. Plasmas 19, 122702 (2012)
Downloaded 07 Dec 2012 to 198.125.178.250. Redistribution subject to AIP license or copyright; see http://pop.aip.org/about/rights_and_permissions

typical vapor pressure inside a layered DT target (50 Torr),
leading to a lower convergence ratio (initial capsule radius
divided by the minimum capsule radius) in symcaps com-
pared to layered targets.
Gas-filled targets provide a practical platform for studying
implosion dynamics without growing a cryogenic fuel layer.
They also generate a neutron yield that is around a thousand
times less than that from DT ignition targets, which along with
the softer DD neutron spectrum, allows the CCD-based primary
radiography diagnostics to be operated without concern for neu-
tron damage. Most importantly, the primary goals of these shots
are to characterize the implosion during the acceleration and
peak velocity phase (i.e., at radii �200 lm) where it is largely
the total mass of the capsule that dominates the implosion dy-
namics. To be surrogates for the layered targets, gas-filled cap-
sules thus have ablators containing an equivalent fuel mass
payload of 14 lm of pure CH, located inside the shell. This
mass is equivalent to that for�69 lm of DT fuel. Note that sur-
rogacy is not valid during the shock timing phase of the implo-
sion since shock dynamics are different in capsules, which
contain a fuel layer versus those which do not. In particular,
shocks timed to coalesce deep in the fuel layer will be signifi-
cantly mistimed if the ablator is thicker and has no fuel layer.
Similarly, the different gas densities and release profiles inside
the capsule result in different deceleration behavior at the end
of the implosion. Thus, while the global dynamics of the
surrogate implosion are expected to be similar, finer details will
not be.
To test the validity of the surrogacy assumption, a single
THD layered target was radiographed (Sec. V D). The fuel
layer was composed of 74% T, 24% H, and 2% D by atomic
fraction and held at 17.6 K.23 Neutron yields were low
enough to allow use of a standard CCD-based gated imager.
On this shot, the fuel layer is transparent to the backlighter x
rays; the experiment thus only measures the dynamics of the
CH ablator. Of course such THD targets are themselves low-
yield surrogates for DT ignition targets as has been described
previously.46 Radiographing DT targets is in principle possi-
ble in the future using radiation hardened imagers.
E. Radiographic imaging
Radiography was performed in the equatorial plane of
the hohlraum using 8.95 keV He-a x rays from the laser-
heated zinc backlighter foil. To provide equatorial line-of-
sight through the capsule, two horizontal slots were cut
around the hohlraum equator on opposite sides: the upstream
slot (closest to the backlighter) provided access for the x rays
while the downstream slot apodized the x ray illumination
allowing only the equatorial plane of the capsule to be
viewed (see Fig 1(a)). The original ConA targets, designed to
look late during the implosion, had 1.2 mm wide slots
(around the equator), allowing a view of capsule radii below
�500 lm. The more versatile ConA-wide design (“ConAw”)
had 2.4 mm wide slots and thus allowed viewing of capsules
out to their starting radii of �1 mm when backlighter beams
were pointed accordingly. No obvious core asymmetry was
caused by these slots.
Each hohlraum viewing slot was filled with a diamond
sliver to prevent closure during the experiment. Each dia-
mond sliver was 168 lm deep (i.e., in the hohlraum radial
direction), resulting in 30% x-ray attenuation. The two
slivers on a single target have different heights of 102 or
146 lm (in the hohlraum axial direction). The smaller sliver
height was set by the maximum tolerable vertical blurring of
the equatorial image slice. The larger sliver height was set
by the beam divergence required to illuminate the vertical
extent of the gated x-ray detector (GXD). Targets also had a
50 lm diameter tungsten wire on the downstream window,
positioned to block some of the core self-emission, provide a
background reference level for the analysis, and also act as a
fiducial for checking the magnification within the x-ray
images.
Early shots aligned the radiography axis with the diag-
nostic instrument manipulator (DIM)48 in the 90–315 direc-
tion (i.e., in the equatorial plane, along the 315� azimuth).
To better coordinate with the evolving needs of facility diag-
nostic transactions, later shots utilized the 90–78 diagnostic
axis and DIM. Given that the target positioner axis is fixed
(at 90–239 for the gas-filled targets, and 90–15 for the lay-
ered target), the change in viewing axis required targets with
windows clocked at different positions. The primary result
of this change was that the backlighter had to move from
6 mm away from capsule center to 12 mm for gas-filled tar-
gets since the backlighter foil was now closer to the 90–239
positioner axis where the target shield is wider (potentially
interfering with the incoming backlighter beams). The THD-
ConA target, since it was held on the 90–15 axis, could
TABLE I. Summary of capsule types used in these experiments, showing nominal dimensions, densities, and dopant concentrations at cryogenic shot tempera-
tures (�24 K). Individual layer properties for the graded doped designs are listed in order from smallest radius to largest. In the case of the THD target, the
mass given is for the ablator only. The actual (measured) outer radius and total thickness on a given shot vary slightly from these nominal values and are listed
in Table III.
Capsule
Type
Total CH
Thickness
(lm)
Outer
Radius
(lm)
CH Layer
Thicknesses
(lm)
CH layer
Densities
(g/cm3)
CH layer dopant
Atomic fraction
(%)
Total
Mass
(mg)
Graded Ge-doped 203 1114 18 5 34 13 133 1.07 1.11 1.15 1.11 1.07 0.0 0.5 1.0 0.5 0.0 2.85
Graded Si-doped 209 1137 21 6 34 10 138 1.05 1.07 1.10 1.07 1.05 0.0 1.0 2.0 1.0 0.0 2.97
Graded Si-doped, THD 195 1130 6 6 34 10 139 1.05 1.07 1.10 1.07 1.05 0.0 1.0 2.0 1.0 0.0 2.77
Graded Si-doped, 2x 209 1137 21 6 34 10 138 1.05 1.08 1.12 1.08 1.05 0.0 2.0 4.0 2.0 0.0 2.98
Graded Si-doped, 2x thick 229 1157 20 6 35 10 158 1.05 1.08 1.12 1.08 1.05 0.0 2.0 4.0 2.0 0.0 3.33
Uniform Si-doped, 2% 205 1128 205 1.08 2.0 2.94
122702-5 Hicks et al. Phys. Plasmas 19, 122702 (2012)
Downloaded 07 Dec 2012 to 198.125.178.250. Redistribution subject to AIP license or copyright; see http://pop.aip.org/about/rights_and_permissions

maintain the 6 mm backlighter standoff. These configuration
changes, given shot-by-shot in Table II, did not cause any
obvious systematic differences to data quality.
Most data were recorded on a microchannel plate-based
GXD,49,50 which gave a time resolution of �105 ps for each
image. Imaging was achieved using slits located at �13:3 cm
from target center and oriented 90� to the hohlraum slots,
giving a magnification of 9� to the image plane. With ConAtargets, 3 adjacent imaging slits were used, spaced horizon-
tally 1.2 mm apart. Slits were �25 lm wide, giving a spatial
resolution �10% worse than this. The GXD recorded a time
sequence of discrete images on 4 separate strips spaced
300–350 ps apart, with 3 images per strip each spaced
�70 ps apart (for a total of 12 images per shot). With ConAwtargets, the wider field of view (and the same magnification)
required using only 1 imaging slit, giving a total of 4 images
per shot. For some of the ConAw targets used to look early
during the implosion when the shell was expected to be
�25 lm, a 10 lm slit was used to improve spatial resolution.
Imaging slits were machined in 200 lm thick Ta substrates
to minimize the hard x-ray background.
The actual magnification for each shot was measured insitu using either the relative position of the wire in the 3 ad-
jacent images on the ConA targets, or using the spacing of
pinhole images of core emission obtained on an image plate
positioned around the primary radiography imaging axis.
This accounted for DIM insertion depth errors and gave re-
sidual uncertainties in magnification of �1%. Measured
magnifications, DIM offsets, and slit width for each shot are
shown in Table II. The actual slit widths are used in the
deconvolution of the data described below.
Later data were recorded on the DIM-based imaging
streak camera (DISC),51,52 giving a continuous record with
�70 ps time resolution (as set by the camera slit width and
internal blurring). An ultraviolet temporal fiducial system52
was used to check and calibrate sweep speeds on some shots.
The smaller detector area resulted in lower counts per unit
time than was obtained on the GXD but the continuous re-
cord in time allowed some of this loss to be regained at the
expense of some time averaging. Data were taken primarily
using a �17 lm slit, although a 10 lm slit was used on one
shot. Though providing a continuous record and more
TABLE II. Radiographic imaging setup for each shot: (a) The primary difference between the two target platforms used was in the length of the hohlraum slots
cut around the equator for radiographic viewing. ConA (and THDConA) targets had 1.2 mm long slots, while ConAw targets had 2.4 mm long slots. (b) Exper-
imental data recorded were either gated (GXD) or streaked (DISC); the numbers refer to the specific camera used. (c) Experiments were begun on DIM(90-
315) and, to reduce facility transactions, switched to DIM(90-78). (d) Total magnification of the target at the image plane was measured on each shot using par-
allax of image features. The DISC internal magnification of 1.24 is included. (e) The imaging slit width in the snout was adjusted according to expected resolu-
tion requirements. (f) The field of view was 1.2 mm for measurements at late time only, and 2.4 mm for other measurements as fixed by the target platform and
the backlighter pointing separation. (g) The distance of the slit to the target determined from the magnification.(h) Backlighter quads were set to be outer cone
quads most opposite the DIM being used. (i) The distance of the backlighter foil from capsule center was set by the need for the beams to clear light shields. (j)
Separation of the backlighter quad pointing positions was set by the required field of view. (k) Backlighter energies were higher for shots requiring viewing
over a longer time window. (l) Backlighter peak powers were generally set near facility limits at the time of the shot.
Apparatus Imaging Backlighter
Shot #
(a)
Target
Platform
(b)
Diagnostic
(c)
DIM
Azimuth (�)
(d)
Mag
(e)
Slit Width
(lm)
(f)
FoV
(mm)
(g)
Slit Dist
(cm)
(h)
Quads
(i)
Distance
(mm)
(j)
Sep
(mm)
(k)
Energy
(kJ)
(l)
Pwr
(TW)
N101218 ConA GXD1 315 8.83 25 1.2 13.6 46 T/46B 6 0.0 37 16
N101220 ConA GXD1 315 8.61 25 1.2 13.9 46T/46B 6 0.0 36 16
N110625 ConA GXD1 315 8.71 25 1.2 13.8 46T/46B 6 0.0 36 16
N110627 ConA GXD1 315 8.73 23 1.2 13.7 46T/46B 6 0.0 36 16
N110630 ConA GXD1 315 8.76 26 1.2 13.7 46T/46B 6 0.0 37 16
N111007 ConAw GXD3 315 8.81 30 2.4 13.6 46T/46B 6 1.2 54 18
N111009 ConA GXD3 315 8.74 26 1.2 13.7 46T/46B 6 0.0 39 17
N111011 ConA GXD3 315 8.79 28 1.2 13.6 46T/46B 6 0.0 39 17
N111218 ConAw GXD3 315 8.69 9 2.4 13.8 46T/46B 6 1.2 58 18
N111219 ConAw GXD3 315 8.78 30 2.4 13.7 46T/46B 6 1.2 57 17
N111220.1 ConAw GXD3 315 9.06 27 2.4 13.3 46T/46B 6 1.2 57 17
N111220.2 ConAw GXD3 315 8.69 11 2.4 13.8 46T/46B 6 1.4 57 18
N120119 ConAw GXD3 315 8.78 10 2.4 13.7 46T/46B 6 1.2 58 18
N120121 ConAw GXD3 315 8.76 10 2.4 13.7 46T/46B 6 1.2 56 17
N120122 ConAw GXD3 315 8.74 28 1.2 13.7 46T/46B 6 0.0 57 18
N120123 ConA GXD3 315 9.04 26 1.2 13.3 46T/46B 6 0.0 58 18
N120306 ConAw GXD3 78 9.22 30 1.2 13.0 26B/31T 12 0.0 54 16
N120324 ConAw DISC3 78 14.72 31 1.2 10.1 26B/31T 12 0.0 39 15
N120329 THDConA GXD3 78 14.84 29 1.2 8.1 26B/31T 6 0.0 39 16
N120408 ConAw DISC3 78 15.11 17 1.2 9.9 26B/31T 12 0.0 47 16
N120409 ConAw DISC3 78 15.08 17 1.2 9.9 26B/31T 12 0.0 48 16
N120418 ConAw DISC3 78 15.14 20 1.2 9.8 26B/31T 12 0.0 49 16
N120421 ConAw DISC3 78 15.19 10 1.2 9.8 26B/31T 12 0.0 49 16
122702-6 Hicks et al. Phys. Plasmas 19, 122702 (2012)
Downloaded 07 Dec 2012 to 198.125.178.250. Redistribution subject to AIP license or copyright; see http://pop.aip.org/about/rights_and_permissions

aesthetically appealing images, and also better spatial and
temporal resolution late in time, implementation of the streak
camera did not change any of the conclusions obtained using
the GXD. Note that, although the data appears continuous,
any practical application has to bin the data over finite time
intervals in order to achieve adequate signal-to-noise levels.
F. Other diagnostics
A range of secondary diagnostics were used to gather in-
formation on the x-ray, optical, and nuclear performance of
each implosion. Though the emphasis of this paper is on the
results from the x-ray radiography measurements, data from
these secondary diagnostics will be selectively mentioned
where relevant to the main themes of this paper.
An indirect measure of the kinetic energy coupled to the
capsule is given by the XRBT. This was measured using
gated x-ray imagers49 located on the polar DIM and also,
once commissioned, the south pole bang time (SPBT) time-
of-flight diamond detector.53,54 The shape of the core x-ray
emission was measured using both gated imagers (for time-
resolved data) but primarily using image plates (to give
time-integrated shape). The image plate data were collected
using a pinhole array in the equatorial and polar DIMs. Polar
data were decomposed into Fourier components while equa-
torial data were decomposed into Legendre components.55 A
suite of neutron time-of-flight detectors56 were used to mea-
sure the integrated neutron yield and Doppler-inferred aver-
age ion temperature of the core at nuclear bang time. In
addition, compact proton spectrometers were used to mea-
sure the time-integrated downshifted spectrum of protons
generated when a large shock reaches capsule center, a few
hundred picoseconds prior to maximum compression.47
X-ray emission from the hohlraum was measured by the
Dante broadband soft x-ray spectrometer57,58 while the static
x-ray imager (SXI)59,60 was used to characterize the time-
integrated behavior of the hohlraum wall and LEH. Hot elec-
tron levels were estimated using hard x-ray bremsstrahlung
measurements (the filter-fluorescer experiment diagnostic, or
FFLEX).61 In addition, a full aperture backscatter system
TABLE III. Essential capsule, hohlraum, and laser parameters for each shot, along with some key neutron and x-ray core emission results. (a) Ablator thick-
ness at shot temperature; (b) Outer radius of ablator at shot temperature; (c) Dopant type; All are graded doped except Si 2%, which is uniform doped. Si2x
corresponds to 2� Si concentration in the doped layers; (d) Gas fill in atomic %; all used 30%Dþ 70%3He apart from a single 50%Dþ 50%3He shot and a
layered THD shot. (e), (f), (g), (h): Hohlraum material and inner dimensions; Laser wavelength separation between (i) 30� beams and outer beams, and (j) 23�
beams and 30� beams; (k), (l): Laser energy and peak power incident at the LEH (thus does not include backlighter beams); (m) Rise time of the main (4th)
pulse, as specified for a 420 TW drive (lower peak powers have shorter rise times, such that the slope is preserved); (n), (o) Primary neutron yield and
Doppler-inferred ion temperature. For D-3He fills, this refers to the D-D yield; for the THD fill this corresponds to the DT yield; (p) X-ray bang time refers to
the time of peak x-ray emission as measured by DIM-based framing cameras or by the south-pole bang time diagnostic (or both); (q), (r), (s): Legendre modes
of the integrated x-ray core emission (at stagnation), as measured by DIM-based framing cameras.
Capsule Hohlraum Laser @ LEH Neutron X-ray core
Shot #
(a)
Abl
Thk
lm
(b)
Outer
Radius
lm
(c)
Dopant
(d)
Fill
at%
(e)
Mat’l
(f)
LEH
Diam
mm
(g)
Inner
Length
mm
(h)
Inner
Diam
mm
(i)
Dk2
A
(j)
Dk32
A
(k)
Energy
MJ
(l)
Peak
Pwr
TW
(m)
4th
rise
ns
(n)
Primary
Yield
1011
(o)
Tion
keV
(p)
Bang
Time
ns
(q)
m0
lm
(r)
P0
lm
(s)
P2
lm
N101218 201.3 1127.9 Ge 30/70D3He Au 3.101 10.010 5.44 6.0 0.0 1.045 302 2 1.5 2.95 16.70 50 52 4
N101220 200.7 1123.7 Ge 30/70D3He Au 3.101 10.010 5.44 6.0 0.0 1.094 326 2 6.5 2.70 21.64 59 52 �13
N110625 203.4 1112.8 Ge 30/70D3He Au 3.101 10.010 5.44 8.0 0.0 1.332 430 2 2.2 2.26 22.40 43 62 5
N110627 209.8 1144.5 Si 30/70D3He Au 3.101 10.010 5.44 8.0 0.0 1.335 434 2 7.2 2.87 22.44 52 50 1
N110630 209.2 1139.8 Si 30/70D3He Au 3.101 10.010 5.44 8.0 0.0 1.416 433 2 3.9 2.50 22.43 57 60 �2
N111007 205.5 1130.7 Si 30/70D3He Au 3.101 9.425 5.75 7.5 1.0 1.291 428 2 2.9 2.41 22.42 40 56 13
N111009 206.4 1135.9 Si 30/70D3He Au 3.101 9.425 5.75 7.5 1.0 1.516 422 2 7.4 2.92 22.39 52 49 10
N111011 206.3 1138.2 Si 30/70D3He Au 3.101 9.425 5.75 7.5 1.0 1.270 419 2 4.7 2.52 22.51 52 60 8
N111218 206.3 1130.7 Si 30/70D3He Au 3.373 9.325 5.75 6.6 1.5 1.195 426 2 7.2 2.21 22.51
N111219 209.3 1143.5 Si 30/70D3He Au 3.373 9.325 5.75 6.6 1.5 1.403 422 2 4.4 2.40 22.38 56
N111220.1 208.4 1134.9 Si 30/70D3He Au 3.373 9.325 5.75 6.6 1.5 1.417 428 3 2.7 2.42 22.47 53 61 5
N111220.2 206.6 1132.7 Si 30/70D3He Au 3.373 9.325 5.75 6.6 1.5 1.406 430 1 3.8 2.51 22.20 62 67 4
N120119 208.5 1136.7 Si 30/70D3He Au 3.373 9.325 5.75 6.6 1.5 1.398 427 3 3.2 2.41 22.91 56 8
N120121 209.0 1139.9 Si 30/70D3He Au 3.373 9.325 5.75 6.6 1.5 1.377 420 1 3.8 2.34 22.53 64 �3
N120122 205.9 1125.3 Si 30/70D3He Au 3.373 9.325 5.75 6.6 1.5 1.388 426 3 3.6 2.39 22.89 55 �2
N120123 207.7 1129.2 Si 30/70D3He Au 3.373 9.325 5.75 6.6 1.5 1.383 423 1 4.1 2.44 22.57 63 3
N120306 208.2 1139.3 Si 30/70D3He U 3.101 9.425 5.75 7.3 1.2 1.530 340 3 5.0 2.50 23.00 38 51 15
N120324 208.7 1142.1 Si 30/70D3He U 3.101 9.425 5.75 7.3 1.2 1.498 334 3 5.0 2.45 22.90 38 37 6
N120329 192.6 1126.2 Si 74/24/2THD Au 3.101 9.425 5.75 7.3 1.2 1.633 367 3 140.0 2.73 22.88 23 27 4
N120408 206.8 1143.7 Si2x 30/70D3He U 3.101 9.425 5.75 7.3 1.2 1.533 341 3 2.7 2.29 22.90 41 37 4
N120409 207.2 1146.3 Si2x 30/70D3He U 3.101 9.425 5.75 7.3 1.2 1.652 393 2 3.1 2.61 22.74 51 37 6
N120418 231.3 1168.8 Si2x 30/70D3He U 3.101 9.425 5.75 7.3 1.2 1.701 389 3 5.9 2.63 23.92 48 33 4
N120421 202.7 1128.1 Si2% 30/70D3He Au 3.101 9.425 5.75 7.3 1.2 1.632 367 3 0.9 1.50 22.58 60 38 4
122702-7 Hicks et al. Phys. Plasmas 19, 122702 (2012)
Downloaded 07 Dec 2012 to 198.125.178.250. Redistribution subject to AIP license or copyright; see http://pop.aip.org/about/rights_and_permissions

(FABS) and the near backscatter imager (NBI) instrument
separately measured the stimulated Brillouin and stimulated
Raman scattered light from which the total backscattered
power was determined.62
III. RADIOGRAPHIC OBSERVABLES AND ANALYSIS
A robust technique was developed previously19 to
extract information about the shell density distribution from
time-resolved x-ray radiographs of the capsule. Observables
from this technique and how they relate to ignition metrics,
as well as the essential elements of the analysis, and recent
improvements, are described.
A. Measurement observables and ignitionrequirements
The objective of this measurement is to extract radial
moments of the density profile for the unablated (remaining)
portion of the ablator. The radiographic analysis is able to
extract low-order density moments accurately even though
information about high-order features may be limited by
instrument resolution.
For a given radial density profile, qðrÞ, the remaining
ablator center-of-mass (hRmi), velocity (hUmi), areal density
(hqRi), mass (M), and shell thickness (2r) are defined as
follows:
hRmi ¼
ðrqðrÞr2 drð
qðrÞr2 dr; (1)
hUmi ¼dhRmi
dt; (2)
hqRi ¼ð
qðrÞ dr; (3)
M ¼ 4pð
r2qðrÞ dr; (4)
2r ¼ 2
ðqðrÞðr � hRmiÞ2 dr
ðqðrÞ dr
: (5)
The radiographic absorption measurement measures
only ablator quantities and does not directly record informa-
tion about the gas fill or, in the case of the layered target, the
cryogenic THD fuel. Inner and outer integration limits on the
above formulae are thus set by the inside edge of the ablator
and the ablation front, respectively. In practice, these limits
are important only in defining these quantities in the simula-
tions since the use of fitting functions with compact support
(i.e., zero outside a bounded region) obviate the need for ex-
plicitly defining integral limits.
In the definition of ignition metrics, it is the peak fuel
velocity that is of central importance since this directly
determines hot spot compressive heating. Due to geometric
convergence the maximum fuel velocity, defined5 as
�(2�fuel kinetic energy/fuel mass), is generally higher than
the maximum ablator center-of-mass velocity, since the fuel
is at smaller radius. Surrogacy differences between symcaps
and layered shots only slightly modify this relationship. Sim-
ulations of both types of capsule44 show that the peak fuel
velocity in a layered shot is 8%–12% higher than the center-
of-mass velocity of a symcap ablator, with larger differences
correlating with larger ablator mass remaining (where the
ablator and fuel center-of-masses are separated by a larger
distance). This correction, plus an additional þ2% correction
due to the use of backlighter beams in ConA experiments,
need to be used when comparing a measured velocity to the
370 lm/ns ignition requirement. Alternatively, the ignition
requirement translates to an observed shell velocity of
�330 lm=ns.
The ablator mass measured in a ConA experiment
includes the surrogate CH payload (f) that is ’6% of the
initial ConA ablator mass. The equivalent remaining mass
fraction on a layered target would then be ðfM � fÞ=ð1� fÞ,where fM the mass fraction measured in a ConA shot. Thus,
if the minimum remaining mass fraction requirement5 is
9.5%, measured ConA mass fractions should not drop below
15%.
B. Analysis
The radiographic analysis technique is based on the fact
that critical information in the shell radiograph exists at three
distinct length scales. Aggregate quantities of the unablated
shell density profile occur at scales of tens of microns while
ablated blow-off and backlighter variations exist at scales of
hundreds of microns. Features such as material interfaces
and shock fronts occur at scale lengths of a few microns that
are not visible at current instrument resolutions. An appropri-
ately designed regularization technique can thus separate the
unablated density profile from the other variations. It is the
intermediate scale length of tens of microns that sets the
global dynamics of the implosion and is the focus of this
study.
Since the original technique was reported,19 modifications
have been developed to allow the shell thickness and density
to be estimated accurately. Originally, it was found that infer-
ring the average shell radius, mass, or qR accurately was quite
insensitive to whether or not the correct instrument resolution
was used in the analysis. In contrast, when determining the
shell thickness and density the instrument blurring must be
accurately represented. The updated analysis uses a maximum
entropy deconvolution procedure63,64 to remove spatial blur-
ring due to the finite imaging slit, temporal blurring due to the
camera temporal resolution, and the effect of the two-
dimensional camera point spread function which, though
mostly narrow, also has a long tail which must be accounted
for to accurately determine capsule mass. In a streaked radio-
graph, this is simply a single two-dimensional deconvolution
prior to the analysis. In a sequence of gated images, the tem-
poral blurring must be self-consistently determined from the
shell velocity, thus requiring at least two passes at the analysis
and a spatial resolution width that changes with time. Though
deconvolution can in principle be avoided by using a forward
122702-8 Hicks et al. Phys. Plasmas 19, 122702 (2012)
Downloaded 07 Dec 2012 to 198.125.178.250. Redistribution subject to AIP license or copyright; see http://pop.aip.org/about/rights_and_permissions

iterative scheme, in practice, the presence of an unknown
background level requires that deconvolution of the spatial
blurring portion be performed first in order to accurately deter-
mine the background behind the central fiducial wire.
Background subtraction is an important step in the anal-
ysis, especially while the laser is on, due to the presence of a
hard x-ray signal. Background values are sampled at the out-
side edge of each radiograph and also under the central fidu-
cial wire—a polynomial fit being performed to interpolate
the background levels within the backlit portion of the radio-
graph. Background subtraction is performed after deconvolu-
tion in order that the shadow from the central fiducial wire
on the hohlraum provides a good representation of the back-
ground in the center of the radiograph. The subtraction is
performed at each time step since background levels vary
with time, especially near the end of the laser pulse.
The original iterative forward regularization approach
has been complemented by a direct Abel inversion tech-
nique, which is more intuitive and gives nearly identical
results. In this approach, the Abel inverse transform is per-
formed on the logarithm of the data before the unknown
backlighter profile, I0ðyÞ, is determined. The logarithm con-
verts I0ðyÞ in Beer’s Law from an unknown multiplicative
function to an unknown additive function akin to a back-
ground level. The inverse Abel transform, which involves a
derivative, is a high pass filter that amplifies the localized
shell density feature and suppresses the slowly varying back-
lighter and blow-off profiles. This process of Abel inverting
the logarithm of the data reduces the problem of separating
qðrÞ (in radius-space) and I0ðyÞ (in image space) to one of
finding a coherent density spike on a low-level background
in radius-space, much like identifying a single spectral line.
More details of this approach are given in Appendix.
An ambiguity exists in how the ablator opacity (at the
backlighter energy) is determined for an ablator comprised
of graded dopants. Originally, two methods were described
to address this,19 an exact method and a mean opacity
method. In the exact method, the assumed qðrÞ is used to
convert the known initial Lagrangian opacity profile j�ðmÞto an Eulerian opacity profile j�ðrÞ at each time step. This
technique is rigorous in that it assigns the appropriate j� to
each mass element in qðrÞ (effectively assuming no mixing),
though it results in an unblurred qðrÞj�ðrÞ fit function with
sharp discontinuities at the layer interfaces. Fitting this dis-
continuous function to both synthetic and real data has been
found to introduce minor oscillations of the density and
thickness. For this reason, the data have largely been ana-
lyzed using the mean opacity technique. Here, the average
opacity, j� ðMÞ, of the unablated shell is given by
j� ðMÞ ¼
ða
0
j�ðmÞdmða
0
dm
¼
ða
0
j�ðrÞqðrÞr2drða
0
qðrÞr2dr
: (6)
Both the forward and inverse analysis methods have
been tested on synthetic radiographs to establish the accu-
racy with which each of the observables described above are
determined. Fig. 2 shows the synthetic radiograph while
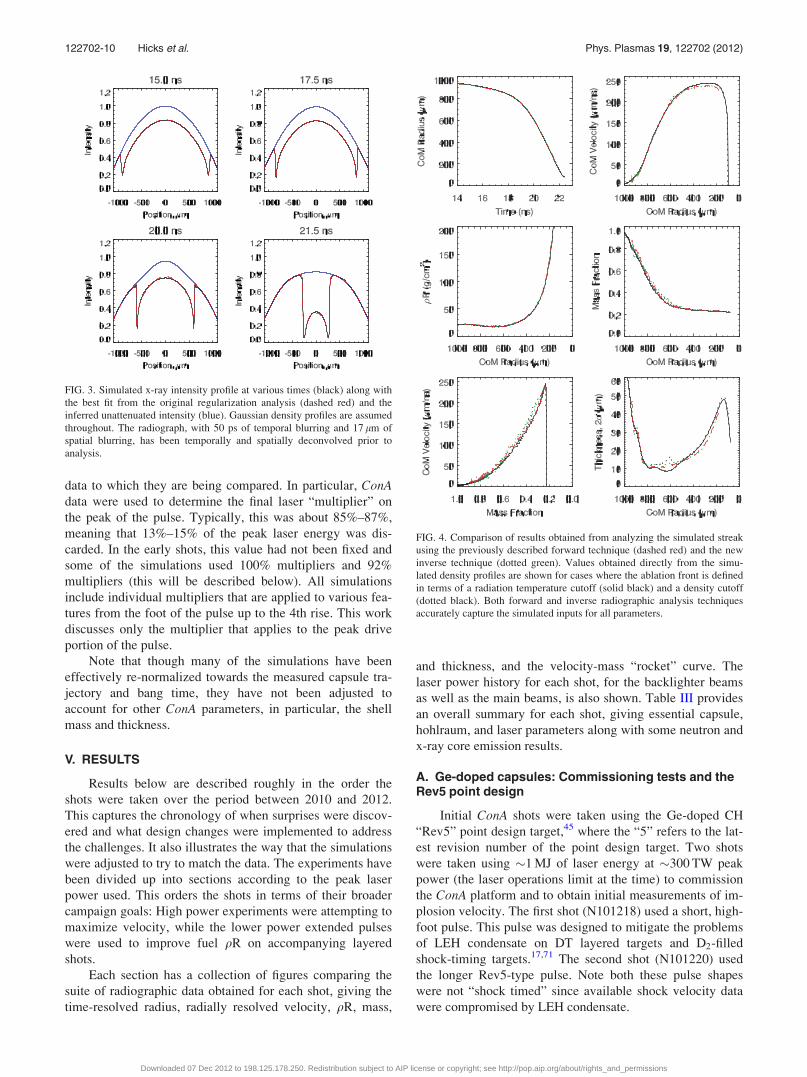
Fig. 3 shows the fitted profiles at four time steps. Final
results are compared in Fig. 4. As can be seen, both the for-
ward iterative and inverse methods give nearly identical
results and are in good agreement with values obtained
directly from the simulations. Note that late in time, system-
atic biases in the analyses lead to velocities that are slightly
higher than simulations at a given mass remaining and shell
thicknesses that are slightly smaller than simulations. As will
be shown, both these effects are the opposite of what is
observed in the experiments.
IV. SEMI-EMPIRICAL SIMULATIONS
Experimental results are compared to two-dimensional
HYDRA65 simulations of the hohlraum and capsule. These
use the “high-flux” hohlraum model66 with flux-limited elec-
tron thermal conduction using a non-local thermodynamic
equilibrium (nLTE) atomic physics model with direct config-
uration accounting (DCA). The hohlraum wall opacity and
emissivity is calculated from local thermodynamic equilib-
rium (LTE) tables for temperatures below 300 eV and an
nLTE DCA model at higher temperatures. Selected tabular
opacities (OPAL29 and VISTA67) and equations-of-state68
are used for the ablator and DT fuel. The input laser power is
modified to account for backscattered energy and crossbeam
energy transfer in the hohlraum plasma.38,40
As described in Sec. I A, baseline simulations were
found to overestimate measured shock velocities and under-
estimate the x-ray bang time, implying that capsule ablation
pressures are systematically overestimated. This is despite
the apparent agreement38,69 between the simulated and meas-
ured x-ray drive. To address this discrepancy, a semi-
empirical model was developed,70 which fits the shock ve-
locity data,17,18 as well as some of the ConA data described
in this paper, by an ad-hoc reduction in the laser power. Of
course matching the capsule dynamics this way had the
undesired effect of degrading the previous agreement
between the simulated x-ray drive and the measured Dante
power.70
This fitting approach means that the simulations shown
in this paper are not meant to be predictive, or even post-
dictive, as they already incorporate certain aspects of the
FIG. 2. Simulated radiograph used to perform the test analysis. Radiograph
has 50 ps of temporal blurring and 17 lm of spatial blurring.
122702-9 Hicks et al. Phys. Plasmas 19, 122702 (2012)
Downloaded 07 Dec 2012 to 198.125.178.250. Redistribution subject to AIP license or copyright; see http://pop.aip.org/about/rights_and_permissions
data to which they are being compared. In particular, ConAdata were used to determine the final laser “multiplier” on
the peak of the pulse. Typically, this was about 85%–87%,
meaning that 13%–15% of the peak laser energy was dis-
carded. In the early shots, this value had not been fixed and
some of the simulations used 100% multipliers and 92%
multipliers (this will be described below). All simulations
include individual multipliers that are applied to various fea-
tures from the foot of the pulse up to the 4th rise. This work
discusses only the multiplier that applies to the peak drive
portion of the pulse.
Note that though many of the simulations have been
effectively re-normalized towards the measured capsule tra-
jectory and bang time, they have not been adjusted to
account for other ConA parameters, in particular, the shell
mass and thickness.
V. RESULTS
Results below are described roughly in the order the
shots were taken over the period between 2010 and 2012.
This captures the chronology of when surprises were discov-
ered and what design changes were implemented to address
the challenges. It also illustrates the way that the simulations
were adjusted to try to match the data. The experiments have
been divided up into sections according to the peak laser
power used. This orders the shots in terms of their broader
campaign goals: High power experiments were attempting to
maximize velocity, while the lower power extended pulses
were used to improve fuel qR on accompanying layered
shots.
Each section has a collection of figures comparing the
suite of radiographic data obtained for each shot, giving the
time-resolved radius, radially resolved velocity, qR, mass,
and thickness, and the velocity-mass “rocket” curve. The
laser power history for each shot, for the backlighter beams
as well as the main beams, is also shown. Table III provides
an overall summary for each shot, giving essential capsule,
hohlraum, and laser parameters along with some neutron and
x-ray core emission results.
A. Ge-doped capsules: Commissioning tests and theRev5 point design
Initial ConA shots were taken using the Ge-doped CH
“Rev5” point design target,45 where the “5” refers to the lat-
est revision number of the point design target. Two shots
were taken using �1 MJ of laser energy at �300 TW peak
power (the laser operations limit at the time) to commission
the ConA platform and to obtain initial measurements of im-
plosion velocity. The first shot (N101218) used a short, high-
foot pulse. This pulse was designed to mitigate the problems
of LEH condensate on DT layered targets and D2-filled
shock-timing targets.17,71 The second shot (N101220) used
the longer Rev5-type pulse. Note both these pulse shapes
were not “shock timed” since available shock velocity data
were compromised by LEH condensate.
FIG. 3. Simulated x-ray intensity profile at various times (black) along with
the best fit from the original regularization analysis (dashed red) and the
inferred unattenuated intensity (blue). Gaussian density profiles are assumed
throughout. The radiograph, with 50 ps of temporal blurring and 17 lm of
spatial blurring, has been temporally and spatially deconvolved prior to
analysis.
FIG. 4. Comparison of results obtained from analyzing the simulated streak
using the previously described forward technique (dashed red) and the new
inverse technique (dotted green). Values obtained directly from the simu-
lated density profiles are shown for cases where the ablation front is defined
in terms of a radiation temperature cutoff (solid black) and a density cutoff
(dotted black). Both forward and inverse radiographic analysis techniques
accurately capture the simulated inputs for all parameters.
122702-10 Hicks et al. Phys. Plasmas 19, 122702 (2012)
Downloaded 07 Dec 2012 to 198.125.178.250. Redistribution subject to AIP license or copyright; see http://pop.aip.org/about/rights_and_permissions

Subsequent shock timing data, taken using targets with
thermally insulating windows to solve the condensate prob-
lem,17 resulted in significant modifications to the foot of the
pulse and the timing of the 4th rise. Radiographic images
from a ConA shot (N110625) incorporating these changes
and using a 1.3 MJ, 430 TW pulse are shown in Fig. 5 with
sample profile lineouts and fits given in Fig. 6. This shot was
the first peak velocity measurement of the shock-timed,
Rev5 ignition design and thus represents the first complete
assessment of the performance of the point design.
The inferred ConA parameters from this shot are shown
in Fig. 7 and compared to those from the first two shots. As
can be seen in Fig. 7(a), the shock timing modifications
implemented on shot N110625 (green) included a pulse with
a higher power picket, a longer trough, and a delayed 4th
rise compared to the point design. Each of these adjustments
push the peak capsule velocity lower. Changing from a pulse
that was shock timed in simulations (black and red) to one
that was shock timed experimentally thus offset any increase
in peak velocity that might have been gained by raising the
laser power and energy from 300 to 430 TW and 1.0 to
1.3 MJ, respectively. As a result, all three shots had a peak
velocity near 250 lm/ns (Fig. 7(c)). Most importantly, the
shock-timed Rev5 ignition point design only reached 75% of
the velocity goal of 330 lm/ns, considerably lower than
expected.
Accompanying data in Fig. 7 illustrate how this
observed velocity deficit manifests itself in the suite of radio-
graphic data. The remaining mass is above the Rev5 design
limit of 15% (Fig. 7(e)), consistent with an overall reduced
drive on the capsule. Put together, this lower velocity and
higher mass can be seen on the velocity-mass rocket curve to
fall well short of the goal, diverging from the rocket curve
too early (Fig. 7(f)).
The semi-empirical simulations shown in these plots all
implement laser multipliers on the foot of the pulse to reduce
the laser energy, so that the simulated shock velocity
matches accompanying shock timing data (see Sec. IV).
However, the multiplier on the peak of the pulse is kept at
100% in these simulations. As can be seen, this results in the
simulated implosions converging faster, earlier, and with
less remaining mass than observed. Importantly, it can also
be seen that the simulated point design now only reaches
300 lm/ns—10% below the ignition velocity. This reduction
is due to the changes in pulse shape (multipliers) required to
match the shock timing data.
Measured shell thicknesses are larger than simulated
values for both the longer foot, Rev5-type pulses, whether
shock-timed or not. At least some of this discrepancy is due
to the lower peak drive on the capsule in the experiment,
which reduces the density of the ablator. Better agreement
exists between simulation and experiment for the high foot
pulse. Generally, it is desirable to have a higher density
(thinner) ablator to maximize the pressure and confinement
of the fuel at stagnation.
B. Si-doped capsules: >400 TW peak laser power and1.2–1.5 MJ laser energy
Different campaigns were conducted to investigate how
various laser and target changes could improve ablator per-
formance. The effects of changing the ablator dopant from
Ge to Si as well as altering the length and rise time of the
main pulse were investigated. Several shots were taken to
measure the shell dynamics throughout the acceleration
phase, attempting to identify the origin of the observed per-
formance degradations. Shots used peak laser powers of
420–430 TW, the facility limit at the time.
1. Tests of Ge vs Si dopant
With the Ge-doped point design showing velocities 25%
below the ignition goal and thus needing unanticipated
design modifications, one modest change involved altering
the dopant material. Replacing Ge dopant with Si was
hypothesized to increase velocity since the lower Z dopant
allows more x-ray drive to reach the ablation front. Design
FIG. 5. Measured radiograph from the Rev5 Ge-doped CH shot, N110625.
(a) Raw data on four strips. Each strip, separated by �350 ps, records 3
images separated by �70 ps. The center of each image is obscured by the
shadow of the tungsten fiducial wire. (b) Stitching the images together
sequentially in time produces a “streak,” with time going from left to right.
Note the slightly brighter spot in the streak, converging from the bottom left,
is likely a thin spot in the ablator.
FIG. 6. Radiographic lineouts from Shot N110625 (black) showing the best
forward fit to the data (dashed red) and the inferred unattenuated backlighter
intensity (blue).
122702-11 Hicks et al. Phys. Plasmas 19, 122702 (2012)
Downloaded 07 Dec 2012 to 198.125.178.250. Redistribution subject to AIP license or copyright; see http://pop.aip.org/about/rights_and_permissions

calculations indicated that it was possible to set the Si dopant
concentration at a level that generated increased ablation
pressure without adversely pre-heating the fuel.
The dopant layers in these targets, located towards the
inside of the shell, begin to be ablated when there is �30%
ablator mass remaining. This occurs near the end of the laser
pulse when the capsule is inside a radius of �700 lm and
still at only 60%–70% of peak velocity. The benefits of
changing the dopant material should thus be gained entirely
at the end of, and after, the laser pulse. The simulations
shown in Fig. 8(c) illustrate how replacing Ge with Si was
expected to bring the simulated shell velocity back up to
ignition requirements, recovering the losses incurred from
the shock timing adjustments.
A direct experimental comparison of Ge- and Si-doped
targets was performed by driving both with similar laser
pulses. As can be seen in Fig. 8, the Si-doped shots
(N110627 and N110630) had peak velocities of
�280-290 lm=ns, a >10% improvement over the Ge-doped
shot (N110625) (the two Si-doped shots had 200 ps different
pulse lengths but did not exhibit significant velocity differen-
ces). This velocity increase was consistent with the �200 ps
earlier bang times observed with the Si-doped targets, indi-
cating a higher average ablation pressure using Si dopant.
Consistent with the increased velocities, the remaining abla-
tor mass was lower in the Si-doped than the Ge-doped tar-
gets, dropping below the ignition minimum of 15%.
Due to manufacturing differences, the Si-doped targets
had slightly lower densities (even of the pure CH), larger
inner radii, and larger thicknesses (see Table I). These were
calculated to have caused about half of the observed increase
in velocity, primarily from the larger inner radii. Accounting
for these target differences indicates that the velocity
improvement due to dopant effects alone was þ5%–7%
when comparing 2% Si-doped ablators and 1% Ge-doped
ablators, slightly larger than expected from simulations.
A noticeable feature of both the Ge-doped and Si-doped
capsule implosions is that the velocity peaks at a radius
>300 lm whereas simulations indicate that peak velocity
should occur at �250 lm. A fuel layer beginning to deceler-
ate at a larger radius has a larger enclosed volume upon
which work must be done and thus results in a lower final
stagnation pressure. Examining the density profiles in these
data indicate that the velocity of the inside edge of the abla-
tor (which would be most closely related to the fuel velocity)
is still accelerating inside 300 lm, and it is rather the outside
edge of the ablator that is responsible for the average decel-
eration of the center-of-mass. This rules out the possibility
that an anomalously early shock wave returning from the
capsule center is causing the early deceleration.
Premature deceleration of the ablation front at the end
of the implosion is likely due to Rayleigh-Taylor instability
growth in the unpolished capsules used in all these initial
shots. Subsequent shots with polished capsules showed
deceleration beginning at smaller radii, indicating that more
instability growth was present in these preliminary experi-
ments. It is possible that performing the Si vs Ge test in
unpolished capsules may have exaggerated the differences
between the two materials since mix of the dopant layers
into the outer pure CH regions could have caused ablation of
doped regions earlier in the pulse. Nevertheless, given the
apparent improvement observed in Si vs Ge-doped targets,
all subsequent shots in this study used Si-doped CH.
2. Extended pulse length to reduce coasting
Ignition designs originally set the main laser pulse to
turn off once the capsule radius reached about half the initial
radius (�500 lm). Because capsule trajectories were slower
FIG. 7. Data from 3 ConA shots. (a) Laser power at LEH (solid lines) and
backlighter power (dotted-dashed lines) versus time. Data extracted from ra-
diograph: (b) Ablator center-of-mass radius versus time, also showing the
laser pulse (dotted) for reference, (c) Ablator center-of-mass velocity versus
radius, (d) Ablator qR versus radius, (e) Ablator mass remaining fraction
versus radius, (f) “Rocket curve” of velocity versus mass, and (g) Shell
thickness versus radius. Data are given by solid points with error bars. Simu-
lations are shown with solid lines. For these shots, the simulations used laser
multipliers to roughly account for shock timing data but use a 100% multi-
plier on the peak of the pulse. Ignition requirements of 330 lm/ns in shell
velocity and 14.5% total remaining mass are marked on the velocity and
mass axes with dashed-dotted lines. Note that a timing error resulted in only
partial data being acquired on N101220. Color legend is given in (a).
122702-12 Hicks et al. Phys. Plasmas 19, 122702 (2012)
Downloaded 07 Dec 2012 to 198.125.178.250. Redistribution subject to AIP license or copyright; see http://pop.aip.org/about/rights_and_permissions

and later than expected, the capsule radius was at only
600-700 lm when the laser turned off. Lengthening the laser
pulse, and thus reducing the length of this “coasting” regime,
was hypothesized to be a relatively simple way to increase
the capsule velocity. The primary penalty for this strategy is
the increase in optics damage from the increased laser
energy.
To test this hypothesis, two shots were performed, one
driven by a standard length pulse (N111011), the other
driven by a pulse that was 600 ps longer (N111009). Both
pulses had the same peak power. The foot of these pulses
was set by shock timing of Si-doped capsules, giving a
slightly different pulse shape to that in Sec. V B 1 where the
pulse was set by shock timing of Ge-doped capsules. The
hohlraum in these shots was changed to a shorter wider
design, having an inner diameter and length of 5.75 mm and
9.425 mm rather than the original 5.44 mm and 10.01 mm.
This design change,44 motivated by a separate symmetry
campaign, attempted to reduce the demands on cross-beam
energy transfer by allowing more heating of the hohlraum
waist by the outer cone beams. The LEH diameter was kept
the same as in previous shots.
Increasing the pulse length by 600 ps raised the meas-
ured peak velocity from 275 lm/ns to 305 lm/ns, a �10%
improvement that reached �93% of the ignition requirement.
Separation of the two trajectories, apparent in the data record
(Fig. 9(b)), begins after the end of the longer pulse,
FIG. 8. Data showing the comparison of Si-doped and Ge-doped implosions.
Laser pulses for N110625 (Ge) (green) and N110627 (Si) (red, black) were
nearly identical and overlap each other. Si-doped capsules have a higher
peak velocity and lower remaining mass than Ge-doped capsules indicating
a higher ablation pressure is achieved using the lower-Z dopant. Simulations
used laser multipliers to fit shock timing data in the foot of the pulse but use
a 100% multiplier on the peak of the pulse. The apparent early deceleration
of the Si-doped capsules is due to deceleration at the ablation front, rather
than the inner edge of the capsule, and is likely due to hydrodynamic growth
in these unpolished capsules.
FIG. 9. Data showing the �10% improvement in shell velocity achieved by
increasing the peak power duration by 600 ps. The increased acceleration
using the extended pulse is apparent in radius and velocity records, along
with the reduced ablator mass and thickness. Simulations used laser multi-
pliers to fit shock timing data in the foot of the pulse and an 87% multiplier
on the peak of the pulse to attempt to bring the simulations into better agree-
ment with these data.
122702-13 Hicks et al. Phys. Plasmas 19, 122702 (2012)
Downloaded 07 Dec 2012 to 198.125.178.250. Redistribution subject to AIP license or copyright; see http://pop.aip.org/about/rights_and_permissions

demonstrating the several hundred picosecond time delay
between laser and capsule drives. The longer pulse resulted
in radial trajectories converging earlier, a 120 ps earlier x-
ray bang time, and a �60% higher DD neutron yield of
7:4� 1011, the highest ConA yield achieved as of this writ-
ing (see Table III). As can be seen in Fig. 9, the mass
remaining was reduced correspondingly, as was the thick-
ness of the shell, all indicative of the higher ablative drive
late in time achieved using the longer pulse.
Although changing to a Si dopant and extending the
laser pulse significantly increased the drive at the end of the
implosion over the Ge-doped case, capsule velocities were
still below those expected from nominal simulations, with
the measured velocity corresponding to a peak power deficit
of �13%-15%. The origin of this large discrepancy was, and
remains, unknown though it is likely in part due to an overes-
timate of the hohlraum x-ray conversion efficiency.
3. Detailed history of behavior from before to afterpeak drive
ConA measurements were originally designed to exam-
ine the end state of the acceleration phase, after the laser
pulse turned off and just prior to bang time. Given that shock
timing measurements operate only up to the rise of the main
laser pulse, this meant that there was no diagnostic of the
capsule response throughout peak laser power.
In the NIF designs, little attention was given to this part
of the implosion. Once shocks were timed, the capsule would
be driven by a flat-top peak laser power to maximize the cap-
sule acceleration regardless of higher order capsule dynam-
ics, such as might be caused by additional shocks or an
unsteady ablation pressure. Given the growing experimental
anomalies, in particular, the unexpectedly low neutron
yields,70 and fuel areal densities22 in companion DT implo-
sions, diagnosing the capsule response over its complete his-
tory became an important goal.
A related goal was to examine the sensitivity of implo-
sion dynamics to the main pulse rise time. Shorter rise times
were expected to give faster implosions but could potentially
compromise fuel adiabats since the 4th shock is stronger and
more difficult to time; in contrast, slower rise times were
expected to produce lower peak velocities but should achieve
lower fuel adiabats with less stringent demands on 4th shock
timing.13 A set of ConA experiments were performed to
examine how the rise duration affected the shell velocity and
thickness throughout the acceleration phase. These tests used
the standard 2 ns rise time, as well as slower (3 ns) and faster
(1 ns) rises.
Eight shots were used to characterize the implosion dy-
namics before, during, and after the main pulse. Because the
backlighter pulse length was limited to �2:4 ns, only select
time windows could be studied for each pulse type. Target
design changes from previous shots were minimal and
included widening the slots in the hohlraum and offsetting
the pointing of backlighter quads (see Sec. II E) to provide a
wider field of view. This new type of target is referred to as a
ConAw target in Table II. One change, inherited from the
symmetry campaign, was the use of a larger LEH diameter
of 3.373 mm (rather than 3.101 mm) designed to reduce
hypothesized clipping at the LEH.
The first group of shots (Fig. 11) examined the implo-
sion history of the standard, 2 ns rise pulse. Three shots
(N111220.2, N111218, and N111219) were used to map out
the capsule behavior starting after the 2nd shock, the regime
of shock timing measurements, and continuing to the end of
the laser pulse, the realm of previous ConA measurements.
Camera timings for each shot were set to provide complete
and overlapping coverage of a �7 ns region. Note that the
earliest time window measurement (N111220.2) examining
the period around 2nd and 3rd shocks, used a main pulse
with a 1 ns rise which did not affect the measurement (this
was done to provide an initial estimate of the bang time and
stagnation performance for this shorter rise time). A fourth
shot examined the implosion dynamics towards the end of
the 3 ns rise time pulse.
Slight changes were made to the foot of the pulse, raising
and delaying the 2nd pulse, and bringing forward the 3rd pulse,
in order to reduce the large gap between these pulses (see, e.g.,
Fig. 9(a)) arising from results of the shock timing measure-
ments. Allowing the ablator to release significantly between
successive shocks could raise the ablator adiabat, lowering its
density, potentially causing the thicker shell observed late in
time (see, e.g., Fig. 9(g)). This would also make the fuel-ablator
interface more unstable to hydrodynamic instability growth.
For facility reasons, these pulse shape changes had to be made
by dead reckoning. Later measurements on the shock timing
platform showed that the gap had been closed too much and
would have caused the 2nd and 3rd shocks to coalesce in a fuel
layer. In the subsequent four shots, the pulses were separated to
produce the desired shock timing.
A time sequence of radiographs is shown in Fig. 10.
Analysis of the first four shots (one from the slower rise
pulse) is shown in Fig. 11 and compared to simulations,
which have been degraded by 15% (an 85% laser multiplier)
in the peak. The usual multipliers have been used throughout
the foot of the pulse to account for shock timing. The data
show reasonable agreement in radius and velocity (by
design), as well as mass and qR. The observed shell thick-
ness was in agreement with simulations through 2nd and 3rd
shock compression but begins to deviate after break-out of
the 4th shock (at a radius of �900 lm) where a larger-than-
expected thickness was observed. The largest discrepancy
FIG. 10. Radiographs from 3 different shots ordered sequentially in time.
These images span radii from �940-380 lm and a time window of �7 ns.
122702-14 Hicks et al. Phys. Plasmas 19, 122702 (2012)
Downloaded 07 Dec 2012 to 198.125.178.250. Redistribution subject to AIP license or copyright; see http://pop.aip.org/about/rights_and_permissions

with simulated thickness, however, still occurs at the end of
the implosion where it had been observed previously.
To illustrate the discrepancy in shell thickness, the
measured and simulated opacity-density, j�ðrÞqðrÞ, profiles
are compared in Fig. 12. The first figure shows the profile
around the time of the 2nd shock and has two peaks. The
inner peak arises from the higher opacity of the inner doped
layers; the outer peak comes from the higher density shocked
pure CH being driven inwards. This profile is in relatively
good agreement with the simulations, which have been
adjusted to match the shock timing data. Late in time, there
is only a single peak, corresponding to the high density
doped region since the outer layer of pure CH has been
removed by ablation. This j�ðrÞqðrÞ profile is considerably
thicker than the simulated profile.
These initial results indicated that there was little differ-
ence in shell thickness between the 1 ns and 2 ns pulse rise
times and also that there was little difference in maximum
velocity between the two rise times. Though the shorter
(2 ns) rise accelerated the capsule at a larger radius than did
longer (3 ns) rise, as expected, the final velocity achieved
was, unexpectedly, almost identical.
To further examine this behavior, 4 shots were per-
formed directly comparing capsule behavior of the fast (1 ns)
rise and the slow (3 ns) rise soon after 4th shock break-out
and around peak velocity. As mentioned above, these fast
and slow pulse shapes had a gap between 2nd and 3rd pulses
that was a few hundred picoseconds larger than on the first 4
shots. To perform a clear comparison, the total energy and
peak power of the slow and fast rise pulses were kept nearly
identical.
As shown in Fig. 13, the fast rise pulse resulted in a
peak velocity that was slightly lower than the slow rise pulse.
This is the opposite of what was expected both from simula-
tions and from simple geometric reasoning: since the faster
rise generates a higher hohlraum temperature when the cap-
sule is at a larger radius, the greater surface area should
result in more work being done on the capsule. That the op-
posite occurs indicates that the slower rise pulse is more effi-
cient at converting laser energy to capsule kinetic energy.
Observed laser backscatter losses do not account for this dif-
ference, suggesting that there is an unseen loss mechanism
that is worse in the fast rise than in the slow.
Peak velocities were �20 lm=ns below those expected
from earlier measurements using a smaller LEH diameter,
consistent with greater LEH losses from the larger LEH. The
lack of evidence for beam clipping and this reduction in
peak velocity meant that all subsequent shots would revert to
the small LEH design.
Up to the 4th rise, shell thicknesses were close to those
simulated, becoming considerably larger late in time. Some
of these differences appear to be due to higher order devia-
tions in the drive history that are not captured in the simula-
tions by the flat multiplier on the peak of the laser pulse.
FIG. 11. A study of implosion dynamics before, during, and after the main
laser pulse. Measurements on each shot covered a �2:4 ns window set by
the backlighter pulse length. To cover the period from the 2nd shock to the
end of the main pulse, camera timings were shifted from shot to shot, build-
ing a composite history of a characteristic 2 ns rise implosion using shots
N111220.2, N111218, and N111219. Note that though N111220.2 used a
1 ns rise pulse and N111218 used a shorter duration pulse, radiographic
measurements were performed before these features occurred, and thus were
still characteristic of the "standard" 2 ns rise pulse. Shot N111220.1 was the
first shot to use a 3 ns rise pulse. Simulations use shock timing multipliers as
well as an 85% multiplier in the peak.
FIG. 12. Comparison of measured (red) and simulated (black) density-
opacity, j�ðrÞqðrÞ, profiles around the time of the 2nd shock (left) and
approaching peak velocity (right). At the early time, the inner peak corre-
sponds to the doped region of the shell while the outer peak corresponds to
the incoming shock wave in pure CH. Late in time, the observed shell is
thicker than simulations.
122702-15 Hicks et al. Phys. Plasmas 19, 122702 (2012)
Downloaded 07 Dec 2012 to 198.125.178.250. Redistribution subject to AIP license or copyright; see http://pop.aip.org/about/rights_and_permissions

Though the simulated trajectory, by design, approximates
the measured trajectory, a closer look indicates that there are
subtle differences. In particular, the measured acceleration is
larger early in the main pulse and smaller late in the pulse.
Properly capturing these higher order dynamics is an on-
going effort but initial indications are that exactly matching
the radial trajectory results in a much closer match to the
shell thickness.
C. 330-390 TW peak power, “low coast” pulses
In evaluating which pulse shape changes might improve
DT capsule performance, raising peak power in order to
increase capsule velocity appeared to be a clear way to boost
the anomalously70 low neutron yields. A similar benefit was
expected from using the higher laser-to-x-ray conversion ef-
ficiency of uranium hohlraums: when compared to gold
hohlraums driven by identical pulses at �420 TW peak
power, indirect evidence had shown that uranium hohlraums
raise peak capsule velocity by �4%.44 However, the first
attempt to drive a DT capsule in a uranium hohlraum at 420
TW peak power resulted in a significant yield and ion tem-
perature decrease, indicative of ablator-fuel mix into the hot
spot. This was the first obvious indication of the presence of
a mix cliff in the experimental data, where a steep drop in
neutron yield indicated the penetration of higher-Z material
into the hot spot. This suggested that implosions with thicker
ablators would likely be necessary in order to benefit from
higher hohlraum drive. Until these targets could be built and
shock tuned, other experimental changes were explored.
Effort was then focused on longer pulse lengths. Length-
ening the pulse by 600 ps had already been shown (see Sec.
V B 2) to increase peak velocity by �10%, generating the
highest velocity and neutron yield observed in ConA experi-
ments to date. Longer pulses were conjectured to raise fuel
qR’s on DT layered implosions (which were at 67% of igni-
tion requirements22) by maintaining capsule acceleration late
into the implosion and thus keeping the dense fuel from
releasing before stagnation. This fuel qR improvement was
observed in a THD implosion (see Sec. V D).
Several shots were performed to investigate implosion
performance using pulses with a reduced “coasting” phase—
the period when the laser is off but the capsule has yet to
reach maximum convergence. Traditional designs required
the laser to be on until the capsule reached �50% of its ini-
tial radius. As mentioned in Sec. V B 2, the unexpectedly
slow capsules meant that coasting would actually begin at
60%–70% of the initial radius. To significantly reduce coast-
ing, the laser pulse length was extended until the capsule had
reached �30% of its initial radius. Additionally, the need to
avoid deleterious mix on DT implosions (which, by this
time, had been inferred on several layered shots) meant that
the ConA experiments described hereafter would all use peak
laser powers in the range of 330–390 TW.
In addition to testing the effect of a longer pulse, shots
were conducted to explore the effect of using different dop-
ant concentrations and distributions, as well as the first test
of a thicker ablator.
1. An initial test of the “low-coast” pulses
A single shot was used to assess the effect of the new
“low-coast” pulse compared to the traditional “coasting”
pulses described earlier. Because of the need to reduce peak
laser power (to avoid the dramatic drop in performance seen
in DT implosions) and the switch to uranium hohlraums, a
clean comparison between the two pulse shapes could not be
made. Instead, simulations were used to set the peak power
to a level (�330 TW) that would achieve a similar peak ve-
locity to that observed on the earlier coasting, �420 TW shot
(N120122). This new pulse shape had a lower power but
used �100 kJ more laser energy (see Fig. 14(a)). Both pulse
shapes had a similar foot and used the slower (“3 ns”) slope-
FIG. 13. A detailed comparison of shell behavior around the time of 4th
shock break-out and near peak velocity for the fast (1 ns) and slow (3 ns) rise
pulses. Pulses for both 1 ns shots (red and black) and 3 ns shots (blue and
green) were nearly identical. Slight differences in simulated results within
each pair are mainly due to target variations. Unexpectedly, the fast rise
pulse resulted in a velocity that was slower than the slow rise pulse (both
rise times have the same peak power and laser energy). This suggests that
the slow rise is more efficient at converting laser energy to capsule kinetic
energy. Simulations here have an 87% multiplier on the peak.
122702-16 Hicks et al. Phys. Plasmas 19, 122702 (2012)
Downloaded 07 Dec 2012 to 198.125.178.250. Redistribution subject to AIP license or copyright; see http://pop.aip.org/about/rights_and_permissions

of-rise on the main pulse. Note that the slope-of-rise is speci-
fied in terms of the rise time for a pulse which peaks at 420
TW; thus the 330 TW pulse actually had a shorter rise time.
The resulting implosion data are shown in Fig. 14. Tra-
jectories, peak capsule velocities, and remaining masses
were nearly identical (�265 lm=ns). Although this similarity
between the shots was by design, it did indicate that the
semi-empirical simulation model can predict implosions
with fairly large changes in pulse shape and hohlraum
design. The only observable that was significantly different
between the two shots was the thickness of the shell, with
the low-coast pulse resulting in a thinner shell.
On earlier shots, the persistent observation of a thicker-
than-expected shell suggested several possible mechanisms:
(a) The drive pressure was lower than expected late in time,
(b) the ablator was stiffer than given by the current equation-
of-state model31 from 1-10 g=cm3, or (c) hydrodynamic
instabilities were causing break-up of the shell. The ability
of the longer pulse to compress the shell more late in time
hints that not all the shell thickening was due to hydrody-
namic instability since increasing the late-time drive would
tend to break the shell apart even more.
Extending the laser pulse at lower power did result in an
improvement in fuel qR’s of DT implosions. The resulting
higher neutron downscattered ratio was also observed in the
first ConA measurement on a layered target, as will be
described in Sec. V D.
2. Change of dopant concentration and distributionand the effect on inferred hydrodynamic mix
The degradation of neutron yield and temperature observed
on several layered shots was taken as an indication that ablator
material was penetrating into the hot spot. This could be caused
by hydrodynamic instabilities seeded at (i) the fuel-ablator
interface, (ii) any of the four internal interfaces between doped
regions of the graded-doped CH ablator, or (iii) the ablation
front. As shown below, experiments varying the dopant concen-
tration or distribution, which would mitigate the first two sour-
ces of instability at the expense of the third, appeared to
degrade neutron performance even further. This suggested that
the ablation front instability was dominant.
Instabilities seeded at the fuel-ablator interface should
be reduced by using a higher dopant concentration. This
decreases the level of pre-heat reaching the inner ablator
region, raising the CH density (and thus the Atwood Num-
ber) at the fuel-ablator boundary, and making for a more sta-
ble interface. However, during ablation of the doped region,
a higher dopant concentration leads to higher opacities and
thus a steeper, less stable ablation front. Higher dopant con-
centrations thus trade-off a more stable ablator-fuel interface
for a less stable ablation front.
Similarly, a uniformly doped ablator eliminates the
unstable internal interfaces of the graded doped design at the
expense of increasing growth at the ablation front. Distribut-
ing the dopant throughout the ablator creates a steeper abla-
tion front throughout the implosion.
Three shots were performed to directly compare the
ablation performance using the standard, “1�,” graded
doped design, which has a 1-2-1% dopant concentration pro-
file (N120324), a 2� graded doped design having a 2-4-2%
dopant profile (N120408), and a uniform dopant profile hav-
ing 2% Si throughout (N120421). Table I gives the details of
each CH layer density and thickness.
The two graded doped targets were shot with uranium
hohlraums and nearly identical laser pulses with a peak
power of 330-340 TW. The uniform doped target had a gold
hohlraum and different laser pulse: the foot was adjusted to
compensate for the ablation of doped material early in the
pulse, and the peak of the pulse was raised to �370 TW to
compensate for the lower x-ray conversion efficiency of gold
versus uranium. No shock timing had been performed on the
uniformly doped target, and thus the foot changes were made
FIG. 14. Comparison of the performance of an implosion using a longer,
lower power (�340 TW) laser pulse with a uranium hohlraum to a previous
shot using the shorter, higher power (�420 TW) pulse in a gold hohlraum.
Both shots have a similar foot and slope-of-rise. The value of the lower peak
power was designed to produce the same peak velocity capsule, taking into
account the longer pulse and different hohlraum material. Radius, velocity,
and mass appear close to simulations using an 87% multiplier on the peak
power. The lengthened pulse reduced shell thickness late in time.
122702-17 Hicks et al. Phys. Plasmas 19, 122702 (2012)
Downloaded 07 Dec 2012 to 198.125.178.250. Redistribution subject to AIP license or copyright; see http://pop.aip.org/about/rights_and_permissions

by calculation alone. All three shots used a 3 ns slope-of-rise
on the main pulse.72
The radiography data were recorded on a streaked rather
than gated camera (Fig. 15). Data points for radius, mass,
qR, and thickness were recorded every 80–90 ps, with each
time step being the average of the analysis of two sequential
lineouts. Velocity points were obtained by taking linear
derivatives of �4 sequential radius points in order to reduce
errors in the derivatives arising from warping and noise in
the camera.
Radiography results are shown in Fig. 16. The peak ve-
locity of the graded doped capsules were both �260 lm=ns,
comparable to data obtained on a similar shot using the gated
camera (N120306), with the uniformly doped shot having a
few percent lower velocity. Masses were also comparable
among the three shots, as expected. This was an important
test of analysis systematics since there was a 20%–40% dif-
ference in optical depth for the 2� versus 1� dopant concen-
trations. The shell thickness was slightly larger for the
1� versus the 2� graded dopant, consistent with reduced
pre-heat in the more heavily doped capsule allowing for
greater compression of the ablator.
It is not clear why the ablator mass continues to decrease
when the capsule is inside �300 lm. This behavior was also
seen in Sec. V C 1 using the gated camera but was not
observed in earlier data or in synthetic data tests. This feature
could be significant since the additional decrease causes the
mass to drop below the ignition requirement and could
explain why significant mix is being observed in the DT
implosions. At present, no clear physical mechanism or ex-
perimental systematic explains this behavior.
Though the 1� doped ablator was thicker than the 2�doped shell, the yield and ion temperature of the 2� graded
doped capsule (2:7� 1011 and 2.29 keV) were noticeably
smaller than that for the 1� graded doped capsule
(5:0� 1011 and 2.45 keV), suggesting that the 2� doped tar-
get was more unstable. Increasing the dopant concentration,
which improves stability of the inside surface of the ablator
at the expense of reduced stability at the ablation front, thus
resulted in degraded performance. This indicated that, in the
performance of the core, instabilities originating at the abla-
tion front dominated those originating at the fuel-ablator
interface. This conclusion was supported by DT layered
experiments.
Strikingly, the 2% uniformly doped capsule generated
the lowest neutron yield (0:9� 1011) and ion temperature
(1.50 keV) of any ConA capsule to date. This indicated the
presence of significantly more instability growth than in the
graded doped targets. The presence of dopant in the outer
parts of the ablator indicated that much of this additional
growth occurred when the mass remaining was >30%. The
fact that this capsule did not have a fuel layer or any internal
layers meant that all the instability growth originated at the
ablation front. This further confirms the inference that the
FIG. 15. Streaked radiograph from shot N120408 showing spatial and tem-
poral scales. The central wire provides a background reference. X-ray emis-
sion from the stagnating core is visible at �22:9 ns. At later times, the
radiating, outgoing blast wave is apparent.
FIG. 16. Comparison of shell dynamics to different dopant concentrations
and distributions. Data were recorded on a streak camera. By design, the ve-
locity and mass of these shots were similar. The shell thickness of data using
the 2� graded dopant (N120408) was slightly smaller than that for the stand-
ard graded dopant concentration (N120324), indicating a higher shell density
was achieved with more dopant.
122702-18 Hicks et al. Phys. Plasmas 19, 122702 (2012)
Downloaded 07 Dec 2012 to 198.125.178.250. Redistribution subject to AIP license or copyright; see http://pop.aip.org/about/rights_and_permissions

ablation front instability is a primary concern in these
implosions.
These shots demonstrate that ablation front instabilities
in the more heavily doped capsules significantly affect stag-
nation performance of ConA capsules. These instabilities
produce features at length scales below the resolution of this
diagnostic and produce only subtle differences observable in
the radiographic data. Nevertheless, the inference from neu-
tron diagnostics is that more dopant degrades implosion per-
formance largely through the destabilizing effect on the
ablation front.
3. Improved performance with a thicker shell
One method for reducing the penetration of hydrody-
namic mix into the central hot spot from the ablation front is
to use a thicker ablator. This requires higher laser powers to
achieve comparable velocities to that for a thinner, less mas-
sive shell. Though this increases the mass ablation rate, the
net result is a larger final mass.39 This is expected to be more
stable to ablation front feedthrough.39
A single shot was performed using a 2� graded doped
ablator that was �20 lm thicker than the �209 lm thick
standard design used in all previous shots. The capsule was
driven in a uranium hohlraum using a pulse with a peak
power that was increased to �390 TW in order to achieve a
similar velocity to that on the 2� doped standard thickness
comparison shot (N120408) described in Sec. V C 3. The
trough of this pulse was lengthened by �1 ns in order to
account for the longer transit time of the first shock through
the thicker ablator. Delays were also made to the second,
third, and fourth rises. These pulse adjustments were made
via calculation alone as shock timing measurements had yet
to be performed on the thicker ablator.
A comparison of the data from the thicker ablator shot
(N120418) with that from a similar standard ablator shot
(N120408) is shown in Fig. 17. Both shots had similar peak
velocities, again by design. The similar mass remaining frac-tion for the two shots meant that the absolute mass remaining
for the thicker shell was �10% larger (since its initial mass
was �10% larger). Measured remaining shell thicknesses
were comparable to within experimental errors, though still
larger than given by simulations. Overall, the differences
between the thicker and standard ablators largely followed
expectations.
Higher neutron yields and ion temperatures were
observed using the thicker shell, consistent with the capsule
being more robust to mix penetration from the ablation front.
As in Sec. V C 2, these differences in core performance were
not obviously reflected in the radiographic data alone.
D. Cryogenic surrogacy
All the ConA shots described thus far were gas-filled
capsules designed with an additional inner 14 lm of pure CH
to match the mass of a 69 lm solid DT fuel layer (see Sec.
II D). Since the global dynamics of the implosion (radial tra-
jectory, velocity, remaining mass) is primarily sensitive to
the initial mass and outer radius of the shell, these capsules
represent surrogates for a layered target at least up to peak
velocity.
To test the validity of this surrogacy, a single THDConAshot was performed. The solid fuel layer was 74% T, 24% H,
and 2% D by atomic fraction rather than equimolar DT in
order to reduce the neutron yield.46 Details of the fielding of
DT and THD layered shots have been described in detail
elsewhere.23 The only difference with this target was the
presence of horizontal slits in the hohlraum to provide radi-
ography access.
Complicating the surrogacy test was the use of a gold
hohlraum on the THDConA target. Only uranium hohlraum
ConA targets had been shot in the campaign using the low-
coast pulse shape. To generate an equivalent capsule drive
history in the gold hohlraum, the THDConA (N120329) was
shot with a pulse that had �8% higher peak power than the
FIG. 17. Comparison of the dynamics of a thicker shell implosion
(N120418) with the standard-thickness shell (N120408). Both capsules use
the 2� graded doped design. The thicker shell is driven with a longer and
higher power pulse designed to give a similar peak velocity. The similar
fractional mass remaining between the shots means that the thicker shell has
a �10% larger absolute final mass (since its initial mass is �10% larger).
122702-19 Hicks et al. Phys. Plasmas 19, 122702 (2012)
Downloaded 07 Dec 2012 to 198.125.178.250. Redistribution subject to AIP license or copyright; see http://pop.aip.org/about/rights_and_permissions
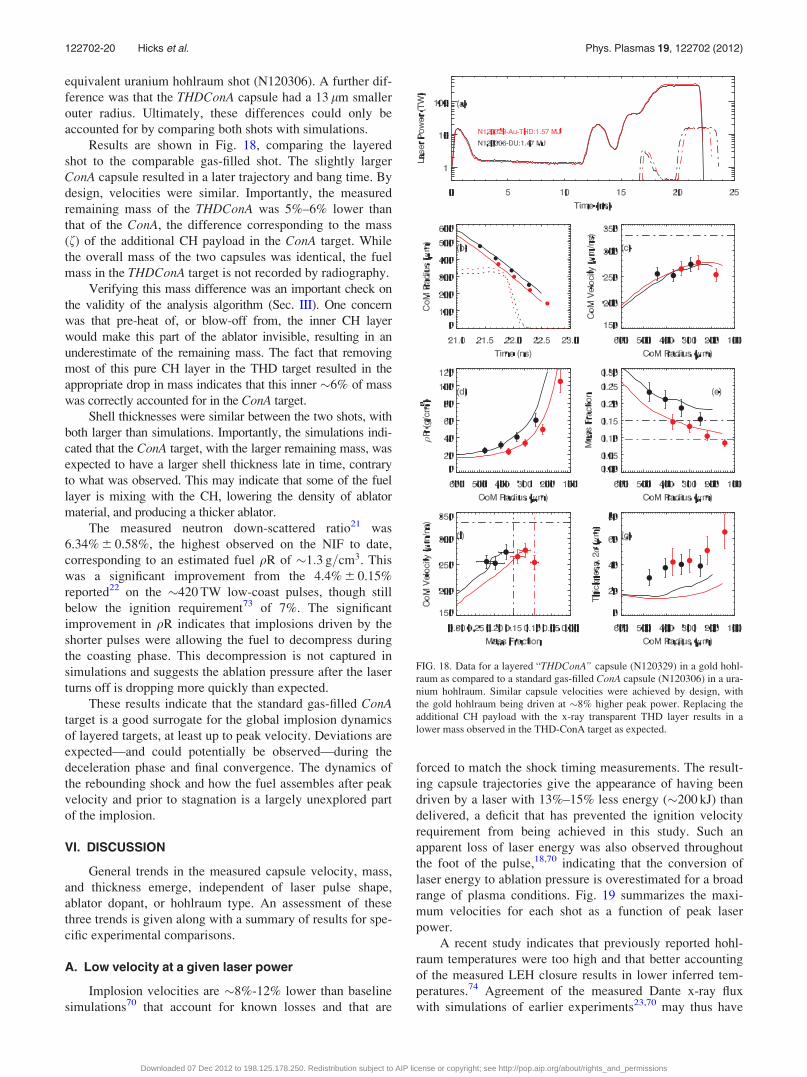
equivalent uranium hohlraum shot (N120306). A further dif-
ference was that the THDConA capsule had a 13 lm smaller
outer radius. Ultimately, these differences could only be
accounted for by comparing both shots with simulations.
Results are shown in Fig. 18, comparing the layered
shot to the comparable gas-filled shot. The slightly larger
ConA capsule resulted in a later trajectory and bang time. By
design, velocities were similar. Importantly, the measured
remaining mass of the THDConA was 5%–6% lower than
that of the ConA, the difference corresponding to the mass
(f) of the additional CH payload in the ConA target. While
the overall mass of the two capsules was identical, the fuel
mass in the THDConA target is not recorded by radiography.
Verifying this mass difference was an important check on
the validity of the analysis algorithm (Sec. III). One concern
was that pre-heat of, or blow-off from, the inner CH layer
would make this part of the ablator invisible, resulting in an
underestimate of the remaining mass. The fact that removing
most of this pure CH layer in the THD target resulted in the
appropriate drop in mass indicates that this inner �6% of mass
was correctly accounted for in the ConA target.
Shell thicknesses were similar between the two shots, with
both larger than simulations. Importantly, the simulations indi-
cated that the ConA target, with the larger remaining mass, was
expected to have a larger shell thickness late in time, contrary
to what was observed. This may indicate that some of the fuel
layer is mixing with the CH, lowering the density of ablator
material, and producing a thicker ablator.
The measured neutron down-scattered ratio21 was
6.34% 6 0.58%, the highest observed on the NIF to date,
corresponding to an estimated fuel qR of �1:3 g=cm3. This
was a significant improvement from the 4.4% 6 0.15%
reported22 on the �420 TW low-coast pulses, though still
below the ignition requirement73 of 7%. The significant
improvement in qR indicates that implosions driven by the
shorter pulses were allowing the fuel to decompress during
the coasting phase. This decompression is not captured in
simulations and suggests the ablation pressure after the laser
turns off is dropping more quickly than expected.
These results indicate that the standard gas-filled ConAtarget is a good surrogate for the global implosion dynamics
of layered targets, at least up to peak velocity. Deviations are
expected—and could potentially be observed—during the
deceleration phase and final convergence. The dynamics of
the rebounding shock and how the fuel assembles after peak
velocity and prior to stagnation is a largely unexplored part
of the implosion.
VI. DISCUSSION
General trends in the measured capsule velocity, mass,
and thickness emerge, independent of laser pulse shape,
ablator dopant, or hohlraum type. An assessment of these
three trends is given along with a summary of results for spe-
cific experimental comparisons.
A. Low velocity at a given laser power
Implosion velocities are �8%-12% lower than baseline
simulations70 that account for known losses and that are
forced to match the shock timing measurements. The result-
ing capsule trajectories give the appearance of having been
driven by a laser with 13%–15% less energy (�200 kJ) than
delivered, a deficit that has prevented the ignition velocity
requirement from being achieved in this study. Such an
apparent loss of laser energy was also observed throughout
the foot of the pulse,18,70 indicating that the conversion of
laser energy to ablation pressure is overestimated for a broad
range of plasma conditions. Fig. 19 summarizes the maxi-
mum velocities for each shot as a function of peak laser
power.
A recent study indicates that previously reported hohl-
raum temperatures were too high and that better accounting
of the measured LEH closure results in lower inferred tem-
peratures.74 Agreement of the measured Dante x-ray flux
with simulations of earlier experiments23,70 may thus have
FIG. 18. Data for a layered “THDConA” capsule (N120329) in a gold hohl-
raum as compared to a standard gas-filled ConA capsule (N120306) in a ura-
nium hohlraum. Similar capsule velocities were achieved by design, with
the gold hohlraum being driven at �8% higher peak power. Replacing the
additional CH payload with the x-ray transparent THD layer results in a
lower mass observed in the THD-ConA target as expected.
122702-20 Hicks et al. Phys. Plasmas 19, 122702 (2012)
Downloaded 07 Dec 2012 to 198.125.178.250. Redistribution subject to AIP license or copyright; see http://pop.aip.org/about/rights_and_permissions

been the result of offsetting errors: Simulations had overesti-
mated hohlraum temperatures but underestimated the LEH
diameter, resulting in a total emitted power being close to
experiment. How much of the velocity discrepancy is due to
the over-estimate of x-ray flux produced by the hohlraum
and how much is due to inaccuracies in the radiation trans-
port and ablative response of the capsule remains unclear.
Scaling from current results indicates that the ignition
velocity requirement should be achievable for the current
capsule thickness if uranium hohlraums are used. The single
Au hohlraum shot that reached 93% 6 5% of the required ve-
locity using 420 TW and 1.5 MJ indicates that with the �4%
increase in velocity expected by switching to a uranium
hohlraum and the 2% increase gained by not having back-
lighter beams, peak velocities should be within 99% of the
requirement for nominal thickness capsules driven at 420
TW.44 As discussed next, however, the need to move
towards thicker shells will make it more challenging to reach
velocity requirements within current NIF facility limits.
B. Low mass at a given velocity
Shell masses are already at, or below, the minimum
requirement even though ignition velocities have yet to be
reached. This suggests that ablation front growth into the
fuel and hotspot could already be of concern at drive condi-
tions well below those required to achieve ignition.
The mass remaining for a given achieved velocity is
referred to here as the ablation efficiency: more efficient ablators
reach a given velocity with less mass ablated. A comparison of
the simulated versus measured velocity and mass for the various
shots is shown in Fig. 20 and indicates a less-than-expected
ablation efficiency. Thus, capsules reaching only 85%–90% of
the ignition velocity requirement have already reached the mini-
mum mass requirement. Increasing the drive to raise velocities,
therefore, risks generating further hydrodynamic mix.75
This velocity-mass curve is of fundamental importance
as its path (though not its maximum) is relatively insensitive
to the different laser and hohlraum conditions. This path is
primarily a function of the intrinsic properties of the ablator,
its EOS (which determines the sound speed) and opacity
(which determines the ablation front thickness), rather than
the flux incident on it, although the hardness of the drive
spectrum plays a role. Since the rocket equation3,8 relates the
velocity and mass via the exhaust velocity (vex) by
dV=ðdlnMÞ ¼ vex, a low ablation efficiency indicates a low
exhaust velocity over at least part of the drive history. Simu-
lations of Ge-doped capsules, which were used to set the
ignition requirements,5 have a slightly higher rocket effi-
ciency than those for Si-doped capsules. This means that the
Si-doped simulations reach ignition velocity with less mass
than the requirements, with experimental data exhibiting
even lower mass.
The twin problems of a low laser-to-ablator coupling
and a low ablation efficiency have thus resulted in the severe
problem of an implosion with low velocity and low mass.
The practical implications of this are that thicker capsules
and higher laser powers are required to achieve ignition.
Scaling to capsules that are 20 lm thicker than current
designs indicate that laser powers at, or slightly beyond, the
500 TW facility limit are required to achieve the required ve-
locity and mass remaining. Capsules that are 40 lm thicker
would require laser powers well beyond current capabilities.
These results indicate the importance of undertaking a study
of other ablator materials, particularly those with potentially
improved rocket efficiency such as beryllium.
C. Larger thickness at a given radius
The measured ablator thickness is larger than simula-
tions, particularly around the time of peak velocity. This
result is consistent across all shots, except for a single high-
FIG. 19. Comparison of maximum measured velocity (relative to the igni-
tion requirement) as a function of peak laser power for different shots. Low
peak power shots primarily used the more efficient uranium hohlraums with
the low-coast pulse, while the higher peak power shots used gold hohlraums,
some with a larger LEH diameter. Shots using Ge-doped ablators, the larger
LEH, or a 2% uniformly doped ablator resulted in lower velocities for a
given peak laser power.
FIG. 20. The path of the rocket curve relating velocity to fractional mass
remaining is expected to be weakly dependent on pulse shape and dopant,
allowing data from many different experiments to be co-plotted. Here, only
data taken at radii larger than 300 lm are shown to focus on the acceleration
phase of the implosion. Experimental data generally have lower masses than
simulations at a fixed velocity, suggesting a lower-than-expected ablation ef-
ficiency throughout the implosion. The simulated curve for Ge-doped capsu-
les, on which the ignition requirements were set, lies at the upper limit of the
envelope of curves for Si-doped capsules, indicating that the lower-Z ablator
is slightly less ablatively efficient. Note that the dotted-dashed lines repre-
sent the Rev5 ignition requirements as established for Ge-doped capsules.5
122702-21 Hicks et al. Phys. Plasmas 19, 122702 (2012)
Downloaded 07 Dec 2012 to 198.125.178.250. Redistribution subject to AIP license or copyright; see http://pop.aip.org/about/rights_and_permissions

foot (high adiabat) implosion performed at the beginning of
the experimental series (see Sec. V A). Though extending the
pulse reduced the thickness, the proportional difference to
simulations was still comparable. The discrepancy begins at
the 4th rise, where shock timing measurements end, and con-
tinues throughout the main pulse and afterwards.
On-going work indicates that some of this discrepancy
may be the result of finer details in the x-ray drive history
that are not captured by simply reducing the peak laser
power by a constant (13%–15%) as shown above. Exactly
matching the measured capsule radius versus time, instead of
just approximating it as shown in this paper, results in an
ablator thickness much closer to measured values. This pro-
vides a self-consistent check of the dynamics of the implo-
sion, relating the ablation pressure to the ablator
compressibility. Importantly, these results suggest that the
thick shell late in time is caused by a sudden drop in drive as
the ablation front enters the Si dopant.
Unlike for the measurement of low velocity and low
mass, the implications of a thicker shell are less obvious. A
low density ablator is indicative of a higher shell adiabat,
providing less free energy to do work and leading to lower
hotspot pressures. It could also result in a more hydrody-
namically unstable ablator-fuel interface, although initial
attempts to mitigate this using heavier dopant fractions do
not appear to have produced a noticeable improvement in
neutron yield or fuel qR (see Sec. V C 2).
D. Summary of specific experimental comparisons
Many of the shots were set up to compare different ex-
perimental configurations in an effort to guide prospective
design changes. Here, the results and their implications are
summarized
(1) Si-doped CH results in a higher ablation pressure than
Ge-doped CH when dopant concentrations are set to pro-
duce comparable pre-heat levels (Sec. V B 1). For the
same laser power and capsule sizes, 2% Si-doped abla-
tors give 5%–7% higher velocities than 1% Ge-doped
ablators. This difference appears to be slightly larger
than expected from simulations.
(2) Extending the pulse is an effective strategy for increas-
ing velocity. This is in part because the lower-than-
expected velocities for a given laser power mean that the
laser turns off when the capsule is only at 60%–70% of
its initial radius, rather than �50%. (Sec. V B 2). Also,
evidence from the capsule trajectory and thickness sug-
gests that the drive decreases faster than expected when
the laser turns off.
(3) Slower rise times on the main laser pulse appear to be
more efficient at coupling laser energy to capsule kinetic
energy. Although the slower (3 ns) rise was expected to
have a lower velocity than the nominal (2 ns) rise, simply
for geometric reasons, velocities were in fact similar.
The faster (1 ns) had the lowest peak velocity, opposite
to predictions, indicating a faster rises have a larger
energy deficit than slower rises (Sec. V B 3).
(4) Increasing the Si dopant concentration in the graded
doped design makes no measurable difference to velocity
or mass but may slightly reduce thickness (Sec. V C 2).
Neutron yields for the more heavily doped design were
lower, indicating that the ablation front instability is
worse with more dopant (as expected, given the steeper
ablation front).
(5) A uniform dopant reduces velocity and increases shell
thickness, resulting in a significant drop in neutron yield
and temperature and suggesting76 significant ablator-gas
mix in the core (Sec. V C 2). Again, this points to an
unstable ablation front, at least in the more heavily
doped capsules.
(6) Surrogacy between layered capsules and gas-filled cap-
sules appears to be adequate for the acceleration phase.
The absence of the 6% CH surrogate mass payload was
detected in the THD capsule (Sec. V D), providing a use-
ful check of the systematics of the mass measurement.
(7) The highest measured neutron down-scattered fraction
measured to date was obtained with the extended, low-
coast laser pulse, suggesting that unexpected decompres-
sion of the fuel was occurring with a shorter main pulse.
This may be related to the larger shell thickness late in
time, which is also indicative of a late-time drop in the
drive pressure.
As mentioned above, most of these different design con-
figurations were tested on companion layered DT shots in
order to examine integrated performance. Simulations were
adjusted to match the observed radius versus time of com-
panion ConA shots. This semi-empirical approach effectively
ignores the simulated laser-hohlraum-capsule interaction and
sets the late time boundary condition for the implosion to be
the experimental capsule trajectory. While this approach
does result in improved agreement with many observables,
simulated neutron yields and stagnation pressures are still
too high.70
It is worth mentioning that, while the measurements
described here capture the evolution of several fundamental
parameters required for ignition, they are only a probe of the
temporal and spatial behavior of the capsule at scales greater
than �100 ps and �10 lm. Ignition is also extremely sensi-
tive to smaller-scale features of the implosion: Strong shock
waves, either during acceleration or deceleration, can have a
large effect on the 1-D implosion behavior while 3-D per-
formance is heavily influenced by fine-scale features in
hydrodynamic instability growth. This high-frequency infor-
mation is not directly accessible late in the implosion using
the current experimental platform due to temporal and spatial
resolution limits. Modifications are underway to improve the
resolution of detectors and imaging systems to better access
these finer scale details but it is likely that the problem of
unresolved, yet important, features will always exist.
VII. CONCLUSIONS
The original Ge-doped CH capsule and Au hohlraum
point design has been found to reach only 75% of the igni-
tion velocity requirement when driven by a 1.3-MJ shock-
timed pulse. Switching to Si-doped CH and extending the
pulse to 1.5 MJ has brought the velocity up to 93% of this
requirement, with a 4% additional improvement expected by
122702-22 Hicks et al. Phys. Plasmas 19, 122702 (2012)
Downloaded 07 Dec 2012 to 198.125.178.250. Redistribution subject to AIP license or copyright; see http://pop.aip.org/about/rights_and_permissions

switching to uranium hohlraums. These velocities were 8%–
12% lower than baseline designs adjusted to fit shock timing
data and accounting for known losses.
Even at �90% of ignition velocity, measured ablator
masses are at, or below, the minimum set by stability
requirements. This suggests a lower-than-expected ablation
efficiency for CH and indicates that raising the drive pressure
any further, as is necessary to increase velocity, would push
the capsule well into the hydrodynamically unstable regime.
Both these results indicate that a thicker ablator, and laser
powers potentially up to, or beyond, the 500 TW facility
limit, are required in order to achieve ignition.
The inability of current simulations to model experi-
ments at the level of accuracy necessary for ignition raises
the question of whether the ignition requirements themselves
are correct since these are set by aspects of the same simula-
tions. In particular, preliminary evidence suggests that the
remaining mass requirement needs to be set higher, with mix
already occurring before this limit has been reached.
Whether the velocity requirement is sufficient remains to be
seen.
Many of the changes made throughout this study were
not in the original tuning plan, a wider search necessitated
by the lower-than-expected velocities and neutron yields in
all implosions. This suggests that the original multi-
dimensional iterative method may need to be revisited. Such
an approach13 was based on the assumption that a global
optimization could be achieved by locally improving per-
formance at each tuning step. While this type of greedy algo-
rithm77 was expected to converge when the initial guess was
close to the goal (such that tuning steps are small, sensitiv-
ities are linear, and cross-coupling between changing inputs
is negligible), a more sophisticated search algorithm, and
many more shots, may be necessary to navigate the rugged
landscape in which current experiments likely find
themselves.
A parallel approach is to upgrade existing high energy
density physics models to improve the "first guess" at the ex-
perimental inputs required for ignition. Though integrated
implosion experiments have now demonstrated that uncer-
tainties in existing models were considerably underestimated
they do not convincingly identify which model is at fault, or
which physics may be missing. For example, low velocities
at a given laser power may be caused by several effects: a
less efficient laser-to-x-ray conversion at the hohlraum wall,
incorrect gold expansion velocities at the LEH, inaccurate
radiation transport through an ablating plasma of many opti-
cal depths, or a poorly modeled opacity or EOS for carbon
transitioning from Li-like to H-like ionization as it passes
through the ablation front. A new generation of highly accu-
rate measurements will be required to isolate and quantify
each one of these elements at the level required to success-
fully navigate the path to ignition at the scale of �2 MJ.
ACKNOWLEDGMENTS
This work was performed under the auspices of the U.S.
Department of Energy by Lawrence Livermore National
Laboratory under Contract DE-AC52-07NA27344.
APPENDIX: AN INVERSE METHOD FOR INFERRINGjmðrÞqðr ÞWHEN THE BACKLIGHTER PROFILE ISUNKNOWN
An inverse Abel approach is described, which provides
a robust method for extracting the opacity-density profile
(j�ðrÞqðrÞ) of a shell radiographed with a smooth, but
unknown, backlighter profile.
For absorption contrast radiography, the observed x-ray
intensity, I(y), along a measured dimension, y, where y¼ 0
corresponds to the center of the object with spherical sym-
metry, is given by
IðyÞ=I0ðyÞ ¼ exp½�sðyÞ�; (A1)
where I0ðyÞ is the unknown initial x-ray intensity and sðyÞ is
the optical depth along the line of sight.
Taking the logarithm and re-arranging Eq. (A1) gives
sðyÞ ¼ �lnIðyÞ þ lnI0ðyÞ: (A2)
Typically, both IðyÞ and I0ðyÞ are measured or known,
thus giving sðyÞ and allowing j�ðrÞqðrÞ to be determined ex-
plicitly from the inverse Abel transform, A�1½sðyÞ�
j�ðrÞqðrÞ ¼ A�1½sðyÞ�; (A3)
¼ � 1
p
ð1r
dsðyÞdy
dyffiffiffiffiffiffiffiffiffiffiffiffiffiffiy2 � r2
p : (A4)
If I0ðyÞ is not known a priori, the inverse Abel transform
can still be performed on Eq. (A2), giving
j�ðrÞqðrÞ ¼ �A�1½lnIðyÞ� þ A�1½lnI0ðyÞ�: (A5)
The combination of the logarithm and the inverse Abel trans-
form turns the unknown I0ðyÞ into an additive background,
A�1½lnI0ðyÞ�, upon which the shell profile sits. Separating the
shell profile from the background profile is much like sepa-
rating a spectral line from its low-level background. Fitting a
Gaussian to a quadratic background has been found to work
accurately when analyzing each limb independently.
Determining I0ðyÞ in the inverse space as described here is
more robust than determining it in the image space described
before,19 despite the presence of increased noise cause by the
inversion. This is because the inverse Abel transform (which
involves a derivative) magnifies the difference between the
high frequency shell feature and the low frequency backlighter
profile, in effect acting like a high pass filter to smooth out the
backlighter profile relative to the shell profile. The inverse
approach was found to be particularly useful when analyzing
radiographs of more heavily doped capsules.
1J. Lindl, Phys. Plasmas 2, 3933 (1995).2J. D. Lindl, P. Amendt, R. L. Berger, S. G. Glendinning, S. H. Glenzer, S.
W. Haan, R. L. Kauffman, O. L. Landen, and L. J. Suter, Phys. Plasmas
11, 339 (2004).3S. Atzeni and J. MeyerterVehn, The Physics of Inertial Fusion (Oxford
University Press, Oxford, U.K., 2007).4D. S. Clark, S. W. Haan, and J. D. Salmonson, Phys. Plasmas 15, 056305
(2008).
122702-23 Hicks et al. Phys. Plasmas 19, 122702 (2012)
Downloaded 07 Dec 2012 to 198.125.178.250. Redistribution subject to AIP license or copyright; see http://pop.aip.org/about/rights_and_permissions

5S. W. Haan, J. D. Lindl, D. A. Callahan, D. S. Clark, J. D. Salmonson, B.
A. Hammel, L. J. Atherton, R. C. Cook, M. J. Edwards, S. Glenzer, A. V.
Hamza, S. P. Hatchett, M. C. Herrmann, D. E. Hinkel, D. D. Ho, H.
Huang, O. S. Jones, J. Kline, G. Kyrala, O. L. Landen, B. J. MacGowan,
M. M. Marinak, D. D. Meyerhofer, J. L. Milovich, K. A. Moreno, E. I.
Moses, D. H. Munro, A. Nikroo, R. E. Olson, K. Peterson, S. M. Pollaine,
J. E. Ralph, H. F. Robey, B. K. Spears, P. T. Springer, L. J. Suter, C. A.
Thomas, R. P. Town, R. Vesey, S. V. Weber, H. L. Wilkens, and D. C.
Wilson, Phys. Plasmas 18, 051001 (2011).6M. Herrmann, M. Tabak, and J. Lindl, Nucl. Fusion 41, 99 (2001).7A. Kemp, J. Meyer-ter Vehn, and S. Atzeni, Phys. Rev. Lett. 86, 3336
(2001).8Y. Saillard, Nucl. Fusion 46, 1017 (2006).9B. Hammel, S. Haan, D. Clark, M. Edwards, S. Langer, M. Marinak, M.
Patel, J. Salmonson, and H. Scott, High Energy Density Phys. 6, 171
(2010).10D. S. Clark, S. W. Haan, A. W. Cook, M. J. Edwards, B. A. Hammel, J. M.
Koning, and M. M. Marinak, Phys. Plasmas 18, 082701 (2011).11D. S. Clark, S. W. Haan, B. A. Hammel, J. D. Salmonson, D. A. Callahan,
and R. P. J. Town, Phys. Plasmas 17, 052703 (2010).12G. H. Miller, E. I. Moses, and C. R. Wuest, Nucl. Fusion 44, S228 (2004).13O. L. Landen, J. Edwards, S. W. Haan, H. F. Robey, J. Milovich, B. K.
Spears, S. V. Weber, D. S. Clark, J. D. Lindl, B. J. MacGowan, E. I.
Moses, J. Atherton, P. A. Amendt, T. R. Boehly, D. K. Bradley, D. G.
Braun, D. A. Callahan, P. M. Celliers, G. W. Collins, E. L. Dewald, L.
Divol, J. A. Frenje, S. H. Glenzer, A. Hamza, B. A. Hammel, D. G. Hicks,
N. Hoffman, N. Izumi, O. S. Jones, J. D. Kilkenny, R. K. Kirkwood, J.
L. Kline, G. A. Kyrala, M. M. Marinak, N. Meezan, D. D. Meyerhofer,
P. Michel, D. H. Munro, R. E. Olson, A. Nikroo, S. P. Regan, L. J.
Suter, C. A. Thomas, and D. C. Wilson, Phys. Plasmas 18, 051002
(2011).14B. A. Hammel, Plasma Phys. Controlled Fusion 48, B497 (2006).15O. L. Landen, T. R. Boehly, D. K. Bradley, D. G. Braun, D. A. Callahan,
P. M. Celliers, G. W. Collins, E. L. Dewald, L. Divol, S. H. Glenzer, A.
Hamza, D. G. Hicks, N. Hoffman, N. Izumi, O. S. Jones, R. K. Kirkwood,
G. A. Kyrala, P. Michel, J. Milovich, D. H. Munro, A. Nikroo, R. E.
Olson, H. F. Robey, B. K. Spears, C. A. Thomas, S. V. Weber, D. C. Wil-
son, M. M. Marinak, L. J. Suter, B. A. Hammel, D. D. Meyerhofer, J.
Atherton, J. Edwards, S. W. Haan, J. D. Lindl, B. J. MacGowan, and E. I.
Moses, Phys. Plasmas 17, 056301 (2010).16G. A. Kyrala, J. L. Kline, S. Dixit, S. Glenzer, D. Kalantar, D. Bradley, N.
Izumi, N. Meezan, O. Landen, D. Callahan, S. V. Weber, J. P. Holder, S.
Glenn, M. J. Edwards, J. Koch, L. J. Suter, S. W. Haan, R. P. J. Town, P.
Michel, O. Jones, S. Langer, J. D. Moody, E. L. Dewald, T. Ma, J. Ralph,
A. Hamza, E. Dzenitis, and J. Kilkenny, Phys. Plasmas 18, 056307 (2011).17H. F. Robey, T. R. Boehly, P. M. Celliers, J. H. Eggert, D. Hicks, R. F.
Smith, R. Collins, M. W. Bowers, K. G. Krauter, P. S. Datte, D. H. Munro,
J. L. Milovich, O. S. Jones, P. A. Michel, C. A. Thomas, R. E. Olson, S.
Pollaine, R. P. J. Town, S. Haan, D. Callahan, D. Clark, J. Edwards, J. L.
Kline, S. Dixit, M. B. Schneider, E. L. Dewald, K. Widmann, J. D. Moody,
T. Doppner, H. B. Radousky, A. Throop, D. Kalantar, P. DiNicola, A. Nik-
roo, J. J. Kroll, A. V. Hamza, J. B. Horner, S. D. Bhandarkar, E. Dzenitis,
E. Alger, E. Giraldez, C. Castro, K. Moreno, C. Haynam, K. N. LaFortune,
C. Widmayer, M. Shaw, K. Jancaitis, T. Parham, D. M. Holunga, C. F.
Walters, B. Haid, E. R. Mapoles, J. Sater, C. R. Gibson, T. Malsbury, J.
Fair, D. Trummer, K. R. Coffee, B. Burr, L. V. Berzins, C. Choate, S. J.
Brereton, S. Azevedo, H. Chandrasekaran, D. C. Eder, N. D. Masters, A.
C. Fisher, P. A. Sterne, B. K. Young, O. L. Landen, B. M. V. Wonterghem,
B. J. MacGowan, J. Atherton, J. D. Lindl, D. D. Meyerhofer, and E.
Moses, Phys. Plasmas 19, 042706 (2012).18H. F. Robey, P. M. Celliers, J. L. Kline, A. J. Mackinnon, T. R. Boehly, O.
L. Landen, J. H. Eggert, D. Hicks, S. Le Pape, D. R. Farley, M. W.
Bowers, K. G. Krauter, D. H. Munro, O. S. Jones, J. L. Milovich, D. Clark,
B. K. Spears, R. P. J. Town, S. W. Haan, S. Dixit, M. B. Schneider, E. L.
Dewald, K. Widmann, J. D. Moody, T. D. D€oppner, H. B. Radousky, A.
Nikroo, J. J. Kroll, A. V. Hamza, J. B. Horner, S. D. Bhandarkar, E. Dzeni-
tis, E. Alger, E. Giraldez, C. Castro, K. Moreno, C. Haynam, K. N. LaFor-
tune, C. Widmayer, M. Shaw, K. Jancaitis, T. Parham, D. M. Holunga, C.
F. Walters, B. Haid, T. Malsbury, D. Trummer, K. R. Coffee, B. Burr, L.
V. Berzins, C. Choate, S. J. Brereton, S. Azevedo, H. Chandrasekaran, S.
Glenzer, J. A. Caggiano, J. P. Knauer, J. A. Frenje, D. T. Casey, M. Gatu
Johnson, F. H. S�eguin, B. K. Young, M. J. Edwards, B. M. Van Wonter-
ghem, J. Kilkenny, B. J. MacGowan, J. Atherton, J. D. Lindl, D. D.
Meyerhofer, and E. Moses, Phys. Rev. Lett. 108, 215004 (2012).
19D. G. Hicks, B. K. Spears, D. G. Braun, R. E. Olson, C. M. Sorce, P. M.
Celliers, G. W. Collins, and O. L. Landen, Phys. Plasmas 17, 102703
(2010).20J. A. Frenje, D. T. Casey, C. K. Li, F. H. Seguin, R. D. Petrasso, V. Y. Gle-
bov, P. B. Radha, T. C. Sangster, D. D. Meyerhofer, S. P. Hatchett, S. W.
Haan, C. J. Cerjan, O. L. Landen, K. A. Fletcher, and R. J. Leeper, Phys.
Plasmas 17, 056311 (2010).21M. G. Johnson, J. A. Frenje, D. T. Casey, C. K. Li, F. H. S�eguin, R. Pet-
rasso, R. Ashabranner, R. M. Bionta, D. L. Bleuel, E. J. Bond, J. A. Cag-
giano, A. Carpenter, C. J. Cerjan, T. J. Clancy, T. Doeppner, M. J. Eckart,
M. J. Edwards, S. Friedrich, S. H. Glenzer, S. W. Haan, E. P. Hartouni, R.
Hatarik, S. P. Hatchett, O. S. Jones, G. Kyrala, S. L. Pape, R. A. Lerche,
O. L. Landen, T. Ma, A. J. MacKinnon, M. A. McKernan, M. J. Moran, E.
Moses, D. H. Munro, J. McNaney, H. S. Park, J. Ralph, B. Remington, J.
R. Rygg, S. M. Sepke, V. Smalyuk, B. Spears, P. T. Springer, C. B. Yea-
mans, M. Farrell, D. Jasion, J. D. Kilkenny, A. Nikroo, R. Paguio, J. P.
Knauer, V. Y. Glebov, T. C. Sangster, R. Betti, C. Stoeckl, J. Magoon, M.
J. Shoup III, G. P. Grim, J. Kline, G. L. Morgan, T. J. Murphy, R. J.
Leeper, C. L. Ruiz, G. W. Cooper, and A. J. Nelson, Rev. Sci. Instrum. 83,
10D308 (2012).22A. J. Mackinnon, J. L. Kline, S. N. Dixit, S. H. Glenzer, M. J. Edwards, D.
A. Callahan, N. B. Meezan, S. W. Haan, J. D. Kilkenny, T. D€oppner, D. R.
Farley, J. D. Moody, J. E. Ralph, B. J. MacGowan, O. L. Landen, H. F.
Robey, T. R. Boehly, P. M. Celliers, J. H. Eggert, K. Krauter, G. Frieders,
G. F. Ross, D. G. Hicks, R. E. Olson, S. V. Weber, B. K. Spears, J. D. Sal-
monsen, P. Michel, L. Divol, B. Hammel, C. A. Thomas, D. S. Clark, O.
S. Jones, P. T. Springer, C. J. Cerjan, G. W. Collins, V. Y. Glebov, J. P.
Knauer, C. Sangster, C. Stoeckl, P. McKenty, J. M. McNaney, R. J.
Leeper, C. L. Ruiz, G. W. Cooper, A. G. Nelson, G. G. A. Chandler, K. D.
Hahn, M. J. Moran, M. B. Schneider, N. E. Palmer, R. M. Bionta, E. P.
Hartouni, S. LePape, P. K. Patel, N. Izumi, R. Tommasini, E. J. Bond, J.
A. Caggiano, R. Hatarik, G. P. Grim, F. E. Merrill, D. N. Fittinghoff, N.
Guler, O. Drury, D. C. Wilson, H. W. Herrmann, W. Stoeffl, D. T. Casey,
M. G. Johnson, J. A. Frenje, R. D. Petrasso, A. Zylestra, H. Rinderknecht,
D. H. Kalantar, J. M. Dzenitis, P. Di Nicola, D. C. Eder, W. H. Courdin,
G. Gururangan, S. C. Burkhart, S. Friedrich, D. L. Blueuel, l. A. Bernstein,
M. J. Eckart, D. H. Munro, S. P. Hatchett, A. G. Macphee, D. H. Edgell,
D. K. Bradley, P. M. Bell, S. M. Glenn, N. Simanovskaia, M. A. Barrios,
R. Benedetti, G. A. Kyrala, R. P. J. Town, E. L. Dewald, J. L. Milovich,
K. Widmann, A. S. Moore, G. LaCaille, S. P. Regan, L. J. Suter, B. Felker,
R. C. Ashabranner, M. C. Jackson, R. Prasad, M. J. Richardson, T. R.
Kohut, P. S. Datte, G. W. Krauter, J. J. Klingman, R. F. Burr, T. A. Land,
M. R. Hermann, D. A. Latray, R. L. Saunders, S. Weaver, S. J. Cohen, L.
Berzins, S. G. Brass, E. S. Palma, R. R. Lowe-Webb, G. N. McHalle, P. A.
Arnold, L. J. Lagin, C. D. Marshall, G. K. Brunton, D. G. Mathisen, R. D.
Wood, J. R. Cox, R. B. Ehrlich, K. M. Knittel, M. W. Bowers, R. A.
Zacharias, B. K. Young, J. P. Holder, J. R. Kimbrough, T. Ma, K. N. La
Fortune, C. C. Widmayer, M. J. Shaw, G. V. Erbert, K. S. Jancaitis, J. M.
DiNicola, C. Orth, G. Heestand, R. Kirkwood, C. Haynam, P. J. Wegner,
P. K. Whitman, A. Hamza, E. G. Dzenitis, R. J. Wallace, S. D. Bhandar-
kar, T. G. Parham, R. Dylla-Spears, E. R. Mapoles, B. J. Kozioziemski, J.
D. Sater, C. F. Walters, B. J. Haid, J. Fair, A. Nikroo, E. Giraldez, K. Mor-
eno, B. Vanwonterghem, R. L. Kauffman, S. Batha, D. W. Larson, R. J.
Fortner, D. H. Schneider, J. D. Lindl, R. W. Patterson, L. J. Atherton, and
E. I. Moses, Phys. Rev. Lett. 108, 215005 (2012).23S. H. Glenzer, D. A. Callahan, A. J. MacKinnon, J. L. Kline, G. Grim, E.
T. Alger, R. L. Berger, L. A. Bernstein, R. Betti, D. L. Bleuel, T. R.
Boehly, D. K. Bradley, S. C. Burkhart, R. Burr, J. A. Caggiano, C. Castro,
D. T. Casey, C. Choate, D. S. Clark, P. Celliers, C. J. Cerjan, G. W. Col-
lins, E. L. Dewald, P. DiNicola, J. M. DiNicola, L. Divol, S. Dixit, T.
Doppner, R. Dylla-Spears, E. Dzenitis, M. Eckart, G. Erbert, D. Farley, J.
Fair, D. Fittinghoff, M. Frank, L. J. A. Frenje, S. Friedrich, D. T. Casey,
M. G. Johnson, C. Gibson, E. Giraldez, V. Glebov, S. Glenn, N. Guler, S.
W. Haan, B. J. Haid, B. A. Hammel, A. V. Hamza, C. A. Haynam, G. M.
Heestand, M. Hermann, H. W. Hermann, D. G. Hicks, D. E. Hinkel, J. P.
Holder, D. M. Holunda, J. B. Horner, W. W. Hsing, H. Huang, N. Izumi,
M. Jackson, O. S. Jones, D. H. Kalantar, R. Kauffman, J. D. Kilkenny, R.
K. Kirkwood, J. Klingmann, T. Kohut, J. P. Knauer, J. A. Koch, B. Kozio-
ziemki, G. A. Kyrala, A. L. Kritcher, J. Kroll, K. L. Fortune, L. Lagin, O.
L. Landen, D. W. Larson, D. LaTray, R. J. Leeper, S. L. Pape, J. D. Lindl,
R. Lowe-Webb, T. Ma, J. McNaney, A. G. MacPhee, T. N. Malsbury, E.
Mapoles, C. D. Marshall, N. B. Meezan, F. Merrill, P. Michel, J. D.
Moody, A. S. Moore, M. Moran, K. A. Moreno, D. H. Munro, B. R.
Nathan, A. Nikroo, R. E. Olson, C. D. Orth, A. E. Pak, P. K. Patel, T.
122702-24 Hicks et al. Phys. Plasmas 19, 122702 (2012)
Downloaded 07 Dec 2012 to 198.125.178.250. Redistribution subject to AIP license or copyright; see http://pop.aip.org/about/rights_and_permissions

Parham, R. Petrasso, J. E. Ralph, H. Rinderknecht, S. P. Regan, H. F.
Robey, J. S. Ross, M. D. Rosen, R. Sacks, J. D. Salmonson, R. Saunders,
J. Sater, C. Sangster, M. B. Schneider, F. H. Seguin, M. J. Shaw, B. K.
Spears, P. T. Springer, W. Stoeffl, L. J. Suter, C. A. Thomas, R. Tomma-
sini, R. P. J. Town, C. Walters, S. Weaver, S. V. Weber, P. J. Wegner, P.
K. Whitman, K. Widmann, C. C. Widmayer, C. H. Wilde, D. C. Wilson,
B. V. Wonterghem, B. J. MacGowan, L. J. Atherton, M. J. Edwards, and
E. I. Moses, Phys. Plasmas 19, 056318 (2012).24B. A. Hammel, H. A. Scott, S. P. Regan, C. Cerjan, D. S. Clark, M. J.
Edwards, R. Epstein, S. H. Glenzer, S. W. Haan, N. Izumi, J. A. Koch, G.
A. Kyrala, O. L. Landen, S. H. Langer, K. Peterson, V. A. Smalyuk, L. J.
Suter, and D. C. Wilson, Phys. Plasmas 18, 056310 (2011).25S. P. Regan, R. Epstein, B. A. Hammel, L. J. Suter, J. Ralph, H. Scott, M.
A. Barrios, D. K. Bradley, D. A. Callahan, C. Cerjan, G. W. Collins, S. N.
Dixit, T. Doeppner, M. J. Edwards, D. R. Farley, S. Glenn, S. H. Glenzer,
I. E. Golovkin, S. W. Haan, A. Hamza, D. G. Hicks, N. Izumi, J. D. Kil-
kenny, J. L. Kline, G. A. Kyrala, O. L. Landen, T. Ma, J. J. MacFarlane,
R. C. Mancini, R. L. McCrory, N. B. Meezan, D. D. Meyerhofer, A. Nik-
roo, K. J. Peterson, T. C. Sangster, P. Springer, and R. P. J. Town, Phys.
Plasmas 19, 056307 (2012).26T. R. Boehly, D. L. Brown, R. S. Craxton, R. L. Keck, J. P. Knauer, J. H.
Kelly, T. J. Kessler, S. A. Kumpan, S. J. Loucks, S. A. Letzring, F. J. Mar-
shall, R. L. McCrory, S. F. B. Morse, W. Seka, J. M. Soures, and C. P.
Verdon, Opt. Commun. 133, 495 (1997).27J. T. Hunt and D. R. Spect, Opt. Eng. 28, 461 (1989).28A. Bar-Shalom, J. Oreg, W. H. Goldstein, D. Shvarts, and A. Zigler, Phys.
Rev. A 40, 3183 (1989).29C. A. Iglesias and F. J. Rogers, Astrophys. J. 464, 943 (1996).30C. A. Iglesias, M. H. Chen, V. Sonnad, and B. G. Wilson, J. Quantum
Spect. Rad. Trans. 81, 227 (2003).31M. A. Barrios, T. R. Boehly, D. G. Hicks, D. E. Fratanduono, J. H. Eggert,
G. W. Collins, and D. D. Meyerhofer, J. Appl. Phys. 111, 093515 (2012).32S. Hamel, L. X. Benedict, P. M. Celliers, M. A. Barrios, T. R. Boehly, G.
W. Collins, T. D€oppner, J. H. Eggert, D. R. Farley, D. G. Hicks, J. L.
Kline, A. Lazicki, S. LePape, A. J. Mackinnon, J. D. Moody, H. F. Robey,
E. Schwegler, and P. A. Sterne, Phys. Rev. B 86, 094113 (2012).33R. E. Olson, R. J. Leeper, A. Nobile, J. A. Oertel, G. A. Chandler, K.
Cochrane, S. C. Dropinski, S. Evans, S. W. Haan, J. L. Kaae, J. P. Knauer,
K. Lash, L. P. Mix, A. Nikroo, G. A. Rochau, G. Rivera, C. Russell, D.
Schroen, R. J. Sebring, D. L. Tanner, R. E. Turner, and R. J. Wallace,
Phys. Plasmas 11, 2778 (2004).34R. E. Olson, G. A. Rochau, O. L. Landen, and R. J. Leeper, Phys. Plasmas
18, 032706 (2011).35N. B. Meezan, L. J. Atherton, D. A. Callahan, E. L. Dewald, S. Dixit, E.
G. Dzenitis, M. J. Edwards, C. A. Haynam, D. E. Hinkel, O. S. Jones, O.
Landen, R. A. London, P. A. Michel, J. D. Moody, J. L. Milovich, M. B.
Schneider, C. A. Thomas, R. P. J. Town, A. L. Warrick, S. V. Weber, K.
Widmann, S. H. Glenzer, L. J. Suter, B. J. MacGowan, J. L. Kline, G. A.
Kyrala, and A. Nikroo, Phys. Plasmas 17, 056304 (2010).36N. B. Meezan, L. J. Atherton, E. J. Bond, D. A. Callahan, E. L. Dewald, S.
Dixit, E. G. Dzenitis, M. J. Edwards, C. A. Haynam, D. E. Hinkel, O. S.
Jones, O. Landen, R. A. London, P. A. Michel, J. D. Moody, J. L. Milo-
vich, M. B. Schneider, C. A. Thomas, R. P. J. Town, A. L. Warrick, S. V.
Weber, K. Widmann, S. H. Glenzer, L. J. Suter, B. J. MacGowan, J. L.
Kline, G. A. Kyrala, and A. Nikroo, Phys. Plasmas 17, 109901 (2010).37S. H. Glenzer, B. J. MacGowan, P. Michel, N. B. Meezan, L. J. Suter, S.
N. Dixit, J. L. Kline, G. A. Kyrala, D. K. Bradley, D. A. Callahan, E. L.
Dewald, L. Divol, E. Dzenitis, M. J. Edwards, A. V. Hamza, C. A. Hay-
nam, D. E. Hinkel, D. H. Kalantar, J. D. Kilkenny, O. L. Landen, J. D.
Lindl, S. LePape, J. D. Moody, A. Nikroo, T. Parham, M. B. Schneider, R.
P. J. Town, P. Wegner, K. Widmann, P. Whitman, B. K. F. Young, B. Van
Wonterghem, L. J. Atherton, and E. I. Moses, Science 327, 1228 (2010).38R. P. J. Town, M. D. Rosen, P. A. Michel, L. Divol, J. D. Moody, G. A.
Kyrala, M. B. Schneider, J. L. Kline, C. A. Thomas, J. L. Milovich, D. A.
Callahan, N. B. Meezan, D. E. Hinkel, E. A. Williams, R. L. Berger, M. J.
Edwards, L. J. Suter, S. W. Haan, J. D. Lindl, E. L. Dewald, S. Dixit, S. H.
Glenzer, O. L. Landen, E. I. Moses, H. A. Scott, J. A. Harte, and G. B.
Zimmerman, Phys. Plasmas 18, 056302 (2011).39B. Spears, D. Hicks, C. Velsko, M. Stoyer, H. Robey, D. Munro, S. Haan, O.
Landen, A. Nikroo, and H. Huang, J. Phys.: Conf. Ser. 112, 022003 (2008).40P. Michel, S. H. Glenzer, L. Divol, D. K. Bradley, D. Callahan, S. Dixit, S.
Glenn, D. Hinkel, R. K. Kirkwood, J. L. Kline, W. L. Kruer, G. A. Kyrala,
S. L. Pape, N. B. Meezan, R. Town, K. Widmann, E. A. Williams, B. J.
MacGowan, J. Lindl, and L. J. Suter, Phys. Plasmas 17, 056305 (2010).
41P. Michel, L. Divol, R. P. J. Town, M. D. Rosen, D. A. Callahan, N. B.
Meezan, M. B. Schneider, G. A. Kyrala, J. D. Moody, E. L. Dewald, K.
Widmann, E. Bond, J. L. Kline, C. A. Thomas, S. Dixit, E. A. Williams,
D. E. Hinkel, R. L. Berger, O. L. Landen, M. J. Edwards, B. J. MacGowan,
J. D. Lindl, C. Haynam, L. J. Suter, S. H. Glenzer, and E. Moses, Phys.
Rev. E 83, 046409 (2011).42C. A. Haynam, P. J. Wegner, J. M. Auerbach, M. W. Bowers, S. N. Dixit,
G. V. Erbert, G. M. Heestand, M. A. Henesian, M. R. Hermann, K. S. Jan-
caitis, K. R. Manes, C. D. Marshall, N. C. Mehta, J. Menapace, E. Moses,
J. R. Murray, M. C. Nostrand, C. D. Orth, R. Patterson, R. A. Sacks, M. J.
Shaw, M. Spaeth, S. B. Sutton, W. H. Williams, C. C. Widmayer, R. K.
White, S. T. Yang, and B. M. V. Wonterghem, Appl. Opt. 46, 3276
(2007).43F. Girard, J. P. Jadaud, M. Naudy, B. Villette, D. Babonneau, M. Primout,
M. C. Miller, R. L. Kauffman, L. J. Suter, J. Grun, and J. Davis, Phys.
Plasmas 12, 092705 (2005).44D. A. Callahan, N. B. Meezan, S. H. Glenzer, A. J. MacKinnon, L. R. Bene-
detti, D. K. Bradley, J. R. Celeste, P. M. Celliers, S. N. Dixit, T. Doppner,
E. G. Dzentitis, S. Glenn, S. W. Haan, C. A. Haynam, D. G. Hicks, D. E.
Hinkel, O. S. Jones, O. L. Landen, R. A. London, A. G. MacPhee, P. A.
Michel, J. D. Moody, J. E. Ralph, H. F. Robey, M. D. Rosen, M. B. Schnei-
der, D. J. Strozzi, L. J. Suter, R. P. J. Town, K. Widmann, E. A. Williams,
M. J. Edwards, B. J. MacGowan, J. D. Lindl, L. J. Atherton, G. A. Kyrala, J.
L. Kline, R. E. Olson, D. Edgell, S. P. Regan, A. Nikroo, H. Wilkins, J. D.
Kilkenny, and A. S. Moore, Phys. Plasmas 19, 056305 (2012).45S. W. Haan, M. C. Herrmann, T. R. Dittrich, A. J. Fetterman, M. M. Mari-
nak, D. H. Munro, S. M. Pollaine, J. D. Salmonson, G. L. Strobel, and L. J.
Suter, Phys. Plasmas 12, 056316 (2005).46M. J. Edwards, J. D. Lindl, B. K. Spears, S. V. Weber, L. J. Atherton, D.
L. Bleuel, D. K. Bradley, D. A. Callahan, C. J. Cerjan, D. Clark, G. W.
Collins, J. E. Fair, R. J. Fortner, S. H. Glenzer, S. W. Haan, B. A. Ham-
mel, A. V. Hamza, S. P. Hatchett, N. Izumi, B. Jacoby, O. S. Jones, J. A.
Koch, B. J. Kozioziemski, O. L. Landen, R. Lerche, B. J. MacGowan, A.
J. MacKinnon, E. R. Mapoles, M. M. Marinak, M. Moran, E. I. Moses,
D. H. Munro, D. H. Schneider, S. M. Sepke, D. A. Shaughnessy, P. T.
Springer, R. Tommasini, L. Bernstein, W. Stoeffl, R. Betti, T. R. Boehly,
T. C. Sangster, V. Y. Glebov, P. W. McKenty, S. P. Regan, D. H. Edgell,
J. P. Knauer, C. Stoeckl, D. R. Harding, S. Batha, G. Grim, H. W. Herr-
mann, G. Kyrala, M. Wilke, D. C. Wilson, J. Frenje, R. Petrasso, K. Mor-
eno, H. Huang, K. C. Chen, E. Giraldez, J. D. Kilkenny, M. Mauldin, N.
Hein, M. Hoppe, A. Nikroo, and R. J. Leeper, Phys. Plasmas 18, 051003
(2011).47A. B. Zylstra, J. A. Frenje, F. H. Seguin, M. J. Rosenberg, H. G. Rinder-
knecht, M. G. Johnson, D. T. Casey, N. Sinenian, M. J.-E. Manuel, C. J.
Waugh, H. W. Sio, C. K. Li, R. D. Petrasso, S. Friedrich, K. Knittel, R.
Bionta, M. McKernan, D. Callahan, G. W. Collins, E. Dewald, T. Dopp-
ner, M. J. Edwards, S. Glenzer, D. G. Hicks, O. L. Landen, R. London, A.
Mackinnon, N. Meezan, R. R. Prasad, J. Ralph, M. Richardson, J. R.
Rygg, S. Sepke, S. Weber, R. Zacharias, E. Moses, J. Kilkenny, A. Nikroo,
T. C. Sangster, V. Glebov, C. Stoeckl, R. Olson, R. J. Leeper, J. Kline, G.
Kyrala, and D. Wilson, Rev. Sci. Instrum. 83, 10D901 (2012).48W. J. Hibbard, M. D. Landon, M. D. Vergino, F. D. Lee, and J. A. Chael,
Rev. Sci. Instrum. 72, 530 (2001).49J. A. Oertel, R. Aragonez, T. Archuleta, C. Barnes, L. Casper, V. Father-
ley, T. Heinrichs, R. King, D. Landers, F. Lopez, P. Sanchez, G. Sandoval,
L. Schrank, P. Walsh, P. Bell, M. Brown, R. Costa, J. Holder, S. Monte-
longo, and N. Pederson, Rev. Sci. Instrum. 77, 10E308 (2006).50J. R. Kimbrough, P. M. Bell, D. K. Bradley, J. P. Holder, D. K. Kalantar,
A. G. MacPhee, and S. Telford, Rev. Sci. Instrum. 81, 10E530 (2010).51Kentech Instruments Ltd., Isis Building, Howbery Park, Wallingford,
Oxfordshire, OX10 8BA, U.K.52Y. P. Opachich, N. Palmer, D. Homoelle, B. Hatch, P. Bell, D. Bradley, D.
Kalantar, D. Browning, J. Zuegel, and O. Landen, Rev. Sci. Instrum. 83,
10E123 (2012).53A. G. MacPhee, D. H. Edgell, E. J. Bond, D. K. Bradley, C. G. Brown, S.
R. Burns, J. R. Celeste, C. J. Cerjan, M. J. Eckart, V. Y. Glebov, S. H.
Glenzer, D. S. Hey, O. S. Jones, J. D. Kilkenny, J. R. Kimbrough, O. L.
Landen, A. J. Mackinnon, N. B. Meezan, J. M. Parker, and R. M. Swee-
ney, J. Instrum. 6, P02009 (2011).54D. H. Edgell, D. K. Bradley, E. J. Bond, S. Burns, D. A. Callahan, J. Cel-
este, M. J. Eckart, V. Y. Glebov, D. S. Hey, G. Lacaille, J. D. Kilkenny, J.
Kimbrough, A. J. Mackinnon, J. Magoon, J. Parker, T. C. Sangster, M. J.
Shoup III, C. Stoeckl, T. Thomas, and A. MacPhee, Rev. Sci. Instrum. 83,
10E119 (2012).
122702-25 Hicks et al. Phys. Plasmas 19, 122702 (2012)
Downloaded 07 Dec 2012 to 198.125.178.250. Redistribution subject to AIP license or copyright; see http://pop.aip.org/about/rights_and_permissions

55S. M. Glenn, L. R. Benedetti, D. K. Bradley, B. A. Hammel, N. Izumi, S.
F. Khan, G. A. Kyrala, T. Ma, J. L. Milovich, A. E. Pak, V. A. Smalyuk,
R. Tommasini, and R. P. Town, Rev. Sci. Instrum. 83, 10E519 (2012).56V. Y. Glebov, T. C. Sangster, C. Stoeckl, J. P. Knauer, W. Theobald, K. L.
Marshall, M. J. Shoup III, T. Buczek, M. Cruz, T. Duffy, M. Romanofsky,
M. Fox, A. Pruyne, M. J. Moran, R. A. Lerche, J. McNaney, J. D. Kil-
kenny, M. J. Eckart, D. Schneider, D. Munro, W. Stoeffl, R. Zacharias, J.
J. Haslam, T. Clancy, M. Yeoman, D. Warwas, C. J. Horsfield, J.-L. Bour-
gade, O. Landoas, L. Disdier, G. A. Chandler, and R. J. Leeper, Rev. Sci.
Instrum. 81, 10D325 (2010).57E. L. Dewald, K. M. Campbell, R. E. Turner, J. P. Holder, O. L. Landen,
S. H. Glenzer, R. L. Kauffman, L. J. Suter, M. Landon, M. Rhodes, and D.
Lee, Rev. Sci. Instrum. 75, 3759 (2004).58J. L. Kline, K. Widmann, A. Warrick, R. E. Olson, C. A. Thomas, A. S.
Moore, L. J. Suter, O. Landen, D. Callahan, S. Azevedo, J. Liebman, S. H.
Glenzer, A. Conder, S. N. Dixit, P. Torres III, V. Tran, E. L. Dewald, J.
Kamperschroer, L. J. Atherton, J. R. Beeler, L. Berzins, J. Celeste, C. Hay-
nam, W. Hsing, D. Larson, B. J. MacGowan, D. Hinkel, D. Kalantar, R.
Kauffman, J. Kilkenny, N. Meezan, M. D. Rosen, M. Schneider, E. A.
Williams, S. Vernon, R. J. Wallace, B. V. Wonterghem, and B. K. Young,
Rev. Sci. Instrum. 81, 10E321 (2010).59M. B. Schneider, O. S. Jones, N. B. Meezan, J. L. Milovich, R. P. Town,
S. S. Alvarez, R. G. Beeler, D. K. Bradley, J. R. Celeste, S. N. Dixit, M. J.
Edwards, M. J. Haugh, D. H. Kalantar, J. L. Kline, G. A. Kyrala, O. L.
Landen, B. J. MacGowan, P. Michel, J. D. Moody, S. K. Oberhelman, K.
W. Piston, M. J. Pivovaroff, L. J. Suter, A. T. Teruya, C. A. Thomas, S. P.
Vernon, A. L. Warrick, K. Widmann, R. D. Wood, and B. K. Young, Rev.
Sci. Instrum. 81, 10E538 (2010).60M. B. Schneider, N. B. Meezan, S. S. Alvarez, J. Alameda, S. Baker, P. M.
Bell, D. K. Bradley, D. A. Callahan, J. R. Celeste, E. L. Dewald, S. N.
Dixit, T. D€oppner, D. C. Eder, M. J. Edwards, M. Fernandez-Perea, E.
Gullikson, M. J. Haugh, S. Hau-Riege, W. Hsing, N. Izumi, O. S. Jones,
D. H. Kalantar, J. D. Kilkenny, J. L. Kline, G. A. Kyrala, O. L. Landen, R.
A. London, B. J. MacGowan, A. J. MacKinnon, T. J. Mccarville, J. L.
Milovich, P. Mirkarimi, J. D. Moody, A. S. Moore, M. D. Myers, E. A.
Palma, N. Palmer, M. J. Pivovaroff, J. E. Ralph, J. Robinson, R. Soufli, L.
J. Suter, A. T. Teruya, C. A. Thomas, R. P. Town, S. P. Vernon, K. Wid-
mann, and B. K. Young, Rev. Sci. Instrum. 83, 10E525 (2012).61E. L. Dewald, C. Thomas, S. Hunter, L. Divol, N. Meezan, S. H. Glenzer, L.
J. Suter, E. Bond, J. L. Kline, J. Celeste, D. Bradley, P. Bell, R. L. Kauffman,
J. Kilkenny, and O. L. Landen, Rev. Sci. Instrum. 81, 10D938 (2010).62J. D. Moody, P. Datte, K. Krauter, E. Bond, P. A. Michel, S. H. Glenzer,
L. Divol, C. Niemann, L. Suter, N. Meezan, B. J. MacGowan, R. Hibbard,
R. London, J. Kilkenny, R. Wallace, J. L. Kline, K. Knittel, G. Frieders, B.
Golick, G. Ross, K. Widmann, J. Jackson, S. Vernon, and T. Clancy, Rev.
Sci. Instrum. 81, 10D921 (2010).63J. M. Hollis, J. E. Dorband, and F. Yusef-Zadeh, Astrophys. J. 386, 293 (1992).64Y. Alhassid, N. Agmon, and R. Levine, Chem. Phys. Lett. 53, 22 (1978).65M. M. Marinak, G. D. Kerbel, N. A. Gentile, O. Jones, D. Munro, S. Pol-
laine, T. R. Dittrich, and S. W. Haan, Phys. Plasmas 8, 2275 (2001).66M. Rosen, H. Scott, D. Hinkel, E. Williams, D. Callahan, R. Town, L.
Divol, P. Michel, W. Kruer, L. Suter, R. London, J. Harte, and G. Zimmer-
man, High Energy Density Phys. 7, 180 (2011).67VISTA is a relativistic LTE opacity code developed by M. H. Chen based
on STA theory (Ref. 28) using Dirac-Hartree-Slater methods with Breit
and QED corrections for the atomic data.68R. M. More, K. H. Warren, D. A. Young, and G. B. Zimmerman, Phys.
Fluids 31, 3059 (1988).69S. H. Glenzer, B. J. MacGowan, N. B. Meezan, P. A. Adams, J. B. Alfonso, E.
T. Alger, Z. Alherz, L. F. Alvarez, S. S. Alvarez, P. V. Amick, K. S. Ander-
sson, S. D. Andrews, G. J. Antonini, P. A. Arnold, D. P. Atkinson, L. Auyang,
S. G. Azevedo, B. N. M. Balaoing, J. A. Baltz, F. Barbosa, G. W. Bardsley, D.
A. Barker, A. I. Barnes, A. Baron, R. G. Beeler, B. V. Beeman, L. R. Belk, J.
C. Bell, P. M. Bell, R. L. Berger, M. A. Bergonia, L. J. Bernardez, L. V. Ber-
zins, R. C. Bettenhausen, L. Bezerides, S. D. Bhandarkar, C. L. Bishop, E. J.
Bond, D. R. Bopp, J. A. Borgman, J. R. Bower, G. A. Bowers, M. W. Bowers,
D. T. Boyle, D. K. Bradley, J. L. Bragg, J. Braucht, D. L. Brinkerhoff, D. F.
Browning, G. K. Brunton, S. C. Burkhart, S. R. Burns, K. E. Burns, B. Burr, L.
M. Burrows, R. K. Butlin, N. J. Cahayag, D. A. Callahan, P. S. Cardinale, R.
W. Carey, J. W. Carlson, A. D. Casey, C. Castro, J. R. Celeste, A. Y. Chaki-
cherla, F. W. Chambers, C. Chan, H. Chandrasekaran, C. Chang, R. F. Chap-
man, K. Charron, Y. Chen, M. J. Christensen, A. J. Churby, T. J. Clancy, B. D.
Cline, L. C. Clowdus, D. G. Cocherell, F. E. Coffield, S. J. Cohen, R. L. Costa,
J. R. Cox, G. M. Curnow, M. J. Dailey, P. M. Danforth, R. Darbee, P. S. Datte,
J. A. Davis, G. A. Deis, R. D. Demaret, E. L. Dewald, P. Di Nicola, J. M. Di
Nicola, L. Divol, S. Dixit, D. B. Dobson, T. Doppner, J. D. Driscoll, J. Dugore-
pec, J. J. Duncan, P. C. Dupuy, E. G. Dzenitis, M. J. Eckart, S. L. Edson, G. J.
Edwards, M. J. Edwards, O. D. Edwards, P. W. Edwards, J. C. Ellefson, C. H.
Ellerbee, G. V. Erbert, C. M. Estes, W. J. Fabyan, R. N. Fallejo, M. Fedorov,
B. Felker, J. T. Fink, M. D. Finney, L. F. Finnie, M. J. Fischer, J. M. Fisher, B.
T. Fishler, J. W. Florio, A. Forsman, C. B. Foxworthy, R. M. Franks, T. Fraz-
ier, G. Frieder, T. Fung, G. N. Gawinski, C. R. Gibson, E. Giraldez, S. M.
Glenn, B. P. Golick, H. Gonzales, S. A. Gonzales, M. J. Gonzalez, K. L. Grif-
fin, J. Grippen, S. M. Gross, P. H. Gschweng, G. Gururangan, K. Gu, S. W.
Haan, S. R. Hahn, B. J. Haid, J. E. Hamblen, B. A. Hammel, A. V. Hamza, D.
L. Hardy, D. R. Hart, R. G. Hartley, C. A. Haynam, G. M. Heestand, M. R.
Hermann, G. L. Hermes, D. S. Hey, R. L. Hibbard, D. G. Hicks, D. E. Hinkel,
D. L. Hipple, J. D. Hitchcock, D. L. Hodtwalker, J. P. Holder, J. D. Hollis, G.
M. Holtmeier, S. R. Huber, A. W. Huey, D. N. Hulsey, S. L. Hunter, T. R.
Huppler, M. S. Hutton, N. Izumi, J. L. Jackson, M. A. Jackson, K. S. Jancaitis,
D. R. Jedlovec, B. Johnson, M. C. Johnson, T. Johnson, M. P. Johnston, O. S.
Jones, D. H. Kalantar, J. H. Kamperschroer, R. L. Kauffman, G. A. Keating, L.
M. Kegelmeyer, S. L. Kenitzer, J. R. Kimbrough, K. King, R. K. Kirkwood, J.
L. Klingmann, K. M. Knittel, T. R. Kohut, K. G. Koka, S. W. Kramer, J. E.
Krammen, K. G. Krauter, G. W. Krauter, E. K. Krieger, J. J. Kroll, K. N. La
Fortune, and L. J. a. Lagin, Phys. Rev. Lett. 106, 085004 (2011).70O. S. Jones, C. J. Cerjan, M. M. Marinak, J. L. Milovich, H. F. Robey, P.
T. Springer, L. R. Benedetti, D. L. Bleuel, E. J. Bond, D. K. Bradley, D.
A. Callahan, J. A. Caggiano, P. M. Celliers, D. S. Clark, S. M. Dixit, T.
Doppner, R. J. Dylla-Spears, E. G. Dzentitis, D. R. Farley, S. M. Glenn, S.
H. Glenzer, S. W. Haan, B. J. Haid, C. A. Haynam, D. G. Hicks, B. J.
Kozioziemski, K. N. LaFortune, O. L. Landen, E. R. Mapoles, A. J. MacK-
innon, J. M. McNaney, N. B. Meezan, P. A. Michel, J. D. Moody, M. J.
Moran, D. H. Munro, M. V. Patel, T. G. Parham, J. D. Sater, S. M. Sepke,
B. K. Spears, R. P. J. Town, S. V. Weber, K. Widmann, C. C. Widmayer,
E. A. Williams, L. J. Atherton, M. J. Edwards, J. D. Lindl, B. J. MacGo-
wan, L. J. Suter, R. E. Olson, H. W. Herrmann, J. L. Kline, G. A. Kyrala,
D. C. Wilson, J. Frenje, T. R. Boehly, V. Glebov, J. P. Knauer, A. Nikroo,
H. Wilkens, and J. D. Kilkenny, Phys. Plasmas 19, 056315 (2012).71LEH condensate was not a problem on the early ConA targets since they
used gas-filled capsules, rather than liquid or solid fuel, and thus could be
warmed above the condensation temperature. N101218 was warmed to 32
K fifteen minutes prior the shot and cooled again to 24 K at shot time.
N101220 was kept at 32 K for the shot. On all subsequent ConA experi-
ments, thermally-insulating ‘storm’ windows (Ref. 17) were used to pre-
vent the formation of the condensate at 24 K.72In this series of shots, an additional 2 � Si graded doped target was shot
with a 2 ns slope-of-rise on the main pulse. This was part of an effort to
see if the steeper rise would mitigate mix on the DT implosions. The peak
power of this shot (N120409) was �370 TW, higher than the �330 TW for
the 3 ns shot (N120408) reported here. This led to a slightly higher peak
velocity but otherwise similar radiographic data. Further information about
this shot (N120409) is given in Tables II and III.73B. K. Spears, S. Glenzer, M. J. Edwards, S. Brandon, D. Clark, R. Town,
C. Cerjan, R. Dylla-Spears, E. Mapoles, D. Munro, J. Salmonson, S.
Sepke, S. Weber, S. Hatchett, S. Haan, P. Springer, E. Moses, J. Kline, G.
Kyrala, and D. Wilson, Phys. Plasmas 19, 056316 (2012).74N. B. Meezan, D. G. Hicks, D. A. Callahan, R. E. Olson, M. S. Schneider, C.
A. Thomas, H. F. Robey, P. M. Celliers, J. K. Kline, S. N. Dixit, P. A. Michel,
O. S. Jones, D. S. Clark, J. E. Ralph, T. Doeppner, A. J. MacKinnon, S. W.
Haan, O. L. Landen, S. H. Glenzer, L. J. Suter, M. J. Edwards, B. J. Macgo-
wan, J. D. Lindl, and L. J. Atherton, in 7th International Conference on Iner-
tial Fusion Sciences and Applications, Bordeaux, France 2011.75The lower-than-expected mass may be caused in part by hydrodynamic insta-
bility already present in the ablator. Due to the exponential relation between
optical depth and transmission, a given shell mass with high-mode density
fluctuations results in less transmission than does a shell of identical mass
without these perturbations. However, the fact that similarly low masses were
observed (a) Early in the implosion, when mix is expected to be less, and (b)
In capsules that have severe mix (see Secs. V B 1 and V C 2)) suggest that
mix is not the dominant cause of this low apparent mass.76T. Ma, N. Izumi, R. Tommasini, D. K. Bradley, P. Bell, C. J. Cerjan, S.
Dixit, T. D€oppner, O. Jones, J. L. Kline, G. Kyrala, O. L. Landen, S. LeP-
ape, A. J. Mackinnon, H.-S. Park, P. K. Patel, R. R. Prasad, J. Ralph, S. P.
Regan, V. A. Smalyuk, P. T. Springer, L. Suter, R. P. J. Town, S. V.
Weber, and S. H. Glenzer, Rev. Sci. Instrum. 83, 10E115 (2012).77T. H. Cormen, C. E. Leiserson, R. L. Rivest, and C. Stein, Introduction to
Algorithms, 2nd ed. (MIT, Cambridge, MA, USA, 2001), Chap. 16.
122702-26 Hicks et al. Phys. Plasmas 19, 122702 (2012)
Downloaded 07 Dec 2012 to 198.125.178.250. Redistribution subject to AIP license or copyright; see http://pop.aip.org/about/rights_and_permissions