Embed Size (px)
Citation preview
www.elsevier.com/locate/jappgeo
Journal of Applied Geophysics 54 (2003) 111–125
Implications of magnetic backgrounds for unexploded
ordnance detection
Dwain K. Butler*
Alion Science and Technology Corporation, U.S. Army Engineer Research and Development Center, 3909 Halls Ferry Road,
Vicksburg, MS 39180-6199, USA
Received 8 February 2002; accepted 26 August 2003
Abstract
Detection of buried unexploded ordnance (UXO) requires application of geophysical methods that exploit contrasts in
magnetic susceptibility and/or electrical conductivity of the UXO relative to surrounding soil and rock (the geologic
background). At many sites, the contrasts are very large, and the detection capability is relatively independent of the geologic
background. Some sites, however, are predictably problematic, such as volcanic terrains (e.g., Maui and Kaho’olawe, HI, USA).
Other sites that would not intuitively be predicted to pose detection problems are found to have localized high susceptibility
zones with wavelengths and magnitudes that can significantly complicate UXO detection. Details of a site in Indiana (USA) are
presented that illustrate order of magnitude variation of magnetic susceptibility over distances of 2–3 m. Magnetic
susceptibility at the site correlates to topography and soil type. Magnetic power spectral density plots from magnetic surveys at
selected areas at the Indiana site are compared to each other and to data from Maui, HI, and demonstrate the key issues in UXO
detection with magnetometry. Magnetic susceptibility data from Kaho’olawe are used to illustrate the effects on electromagnetic
induction surveys for UXO detection and discrimination. The phenomenological observations suggest approaches for magnetic
and electromagnetic induction survey data processing to enhance anomaly detectability and model-based inversion.
D 2003 Elsevier B.V. All rights reserved.
Keywords: Magnetic susceptibility; Unexploded ordnance; Detection and discrimination
1. Background military sites. Key features of the UXO problem in
Unexploded ordnance (UXO) cleanup or remedi-
ation is currently the highest priority military envi-
ronmental quality requirement in the United States
(U.S.) at active training and testing ranges, at military
sites scheduled for closure, and at formerly used
0926-9851/$ - see front matter D 2003 Elsevier B.V. All rights reserved.
doi:10.1016/j.jappgeo.2003.08.022
* Tel.: +1-601-634-2127.
E-mail address: [email protected]
(D.K. Butler).
the U.S. are: (a) millions of hectares of land poten-
tially contaminated with UXO; (b) hundreds of sites
and locations; (c) extremely diverse geologic and
environmental conditions; (d) UXO at the surface
and buried to depths as great as 10 m; (e) UXO sizes
from 20-mm projectiles to 2000-lb bombs (see Fig.
1). UXO cleanup requirements of comparable or
larger scope exist throughout the world as a legacy
of past military conflicts. The UXO cleanup problem
as discussed in this paper is totally distinct from the
landmine clearance problem that is so ubiquitous in
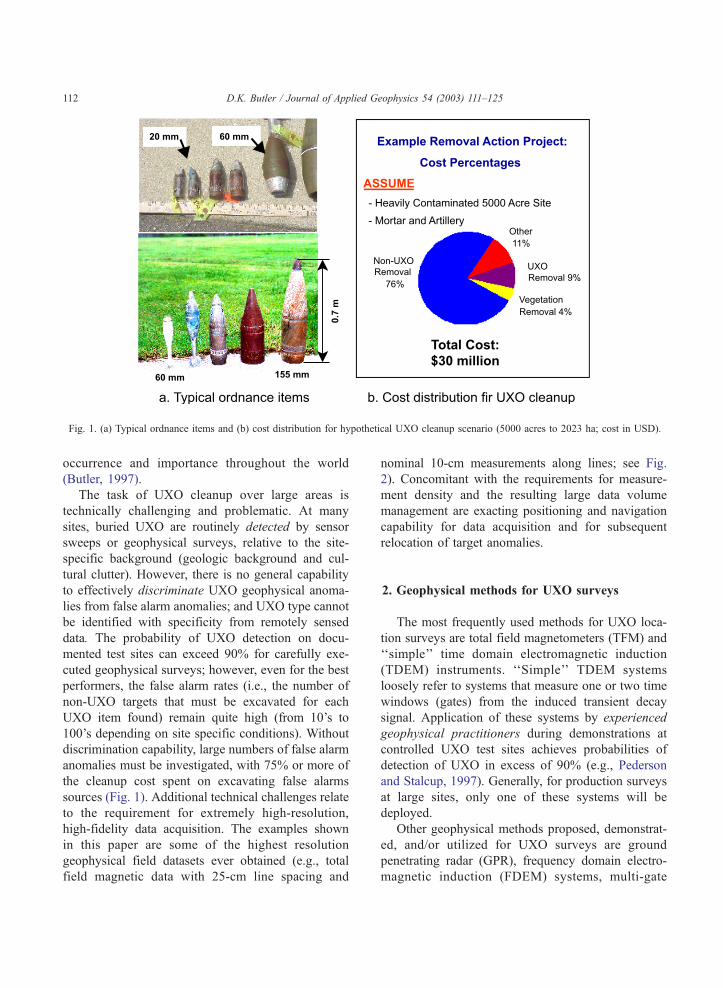
Fig. 1. (a) Typical ordnance items and (b) cost distribution for hypothetical UXO cleanup scenario (5000 acres to 2023 ha; cost in USD).
D.K. Butler / Journal of Applied Geophysics 54 (2003) 111–125112
occurrence and importance throughout the world
(Butler, 1997).
The task of UXO cleanup over large areas is
technically challenging and problematic. At many
sites, buried UXO are routinely detected by sensor
sweeps or geophysical surveys, relative to the site-
specific background (geologic background and cul-
tural clutter). However, there is no general capability
to effectively discriminate UXO geophysical anoma-
lies from false alarm anomalies; and UXO type cannot
be identified with specificity from remotely sensed
data. The probability of UXO detection on docu-
mented test sites can exceed 90% for carefully exe-
cuted geophysical surveys; however, even for the best
performers, the false alarm rates (i.e., the number of
non-UXO targets that must be excavated for each
UXO item found) remain quite high (from 10’s to
100’s depending on site specific conditions). Without
discrimination capability, large numbers of false alarm
anomalies must be investigated, with 75% or more of
the cleanup cost spent on excavating false alarms
sources (Fig. 1). Additional technical challenges relate
to the requirement for extremely high-resolution,
high-fidelity data acquisition. The examples shown
in this paper are some of the highest resolution
geophysical field datasets ever obtained (e.g., total
field magnetic data with 25-cm line spacing and
nominal 10-cm measurements along lines; see Fig.
2). Concomitant with the requirements for measure-
ment density and the resulting large data volume
management are exacting positioning and navigation
capability for data acquisition and for subsequent
relocation of target anomalies.
2. Geophysical methods for UXO surveys
The most frequently used methods for UXO loca-
tion surveys are total field magnetometers (TFM) and
‘‘simple’’ time domain electromagnetic induction
(TDEM) instruments. ‘‘Simple’’ TDEM systems
loosely refer to systems that measure one or two time
windows (gates) from the induced transient decay
signal. Application of these systems by experienced
geophysical practitioners during demonstrations at
controlled UXO test sites achieves probabilities of
detection of UXO in excess of 90% (e.g., Pederson
and Stalcup, 1997). Generally, for production surveys
at large sites, only one of these systems will be
deployed.
Other geophysical methods proposed, demonstrat-
ed, and/or utilized for UXO surveys are ground
penetrating radar (GPR), frequency domain electro-
magnetic induction (FDEM) systems, multi-gate
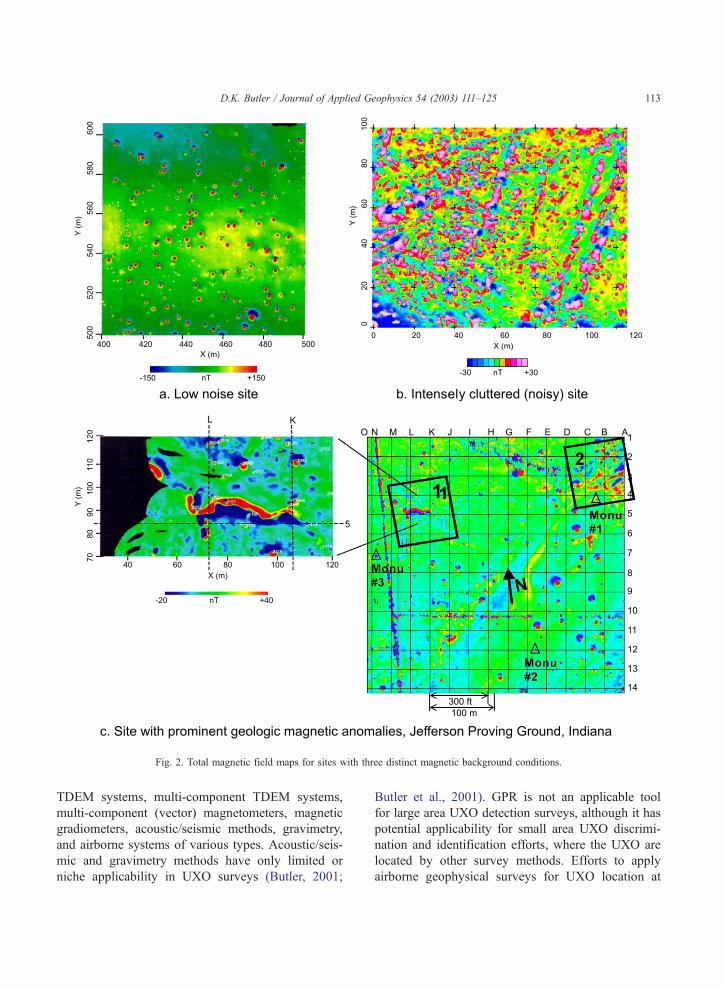
Fig. 2. Total magnetic field maps for sites with three distinct magnetic background conditions.
D.K. Butler / Journal of Applied Geophysics 54 (2003) 111–125 113
TDEM systems, multi-component TDEM systems,
multi-component (vector) magnetometers, magnetic
gradiometers, acoustic/seismic methods, gravimetry,
and airborne systems of various types. Acoustic/seis-
mic and gravimetry methods have only limited or
niche applicability in UXO surveys (Butler, 2001;
Butler et al., 2001). GPR is not an applicable tool
for large area UXO detection surveys, although it has
potential applicability for small area UXO discrimi-
nation and identification efforts, where the UXO are
located by other survey methods. Efforts to apply
airborne geophysical surveys for UXO location at
D.K. Butler / Journal of Applied Geophysics 54 (2003) 111–125114
sensor heights typically greater than 25 m, including
magnetometry, GPR, and SAR, have been failures.
Recently, however, TFM and simple TDEM surveys
from a helicopter platform at 1.0–2.0 m sensor
elevation have shown promise for large area UXO
detection surveys, detecting areas of UXO concentra-
tion, as well as larger individual ordnance items (e.g.,
Gamey 2001). Multi-gate (25–30 time gates), multi-
component TDEM systems and multi-frequency
FDEM systems have potential for large area UXO
detection surveys, as well as near-real-time discrimi-
nation or follow-on small area discrimination of
detected anomalies (Butler et al., 1998a,b; Pasion
and Oldenburg, 2001; Keiswetter, 2000).
3. Geologic and cultural background
considerations for UXO surveys
A common assumption in routine geophysical
surveys for location of buried UXO is that the
electrical conductivity, dielectric permittivity, and
magnetic susceptibility (permeability) of the UXO
are much larger than the host medium, i.e., the
physical property contrasts are very large. In this case
of very large contrasts, location (detection) capability
is virtually independent of the physical properties of
the host medium. However, there are notable excep-
tions, and geophysical surveys for UXO can indeed be
complicated or severely inhibited by the physical
properties of the host medium. Kaho’olawe Island,
HI, is an example of a UXO cleanup site where
problems would be expected, and where, in practice,
high magnetic susceptibility of the host medium
makes magnetic surveys for UXO detection virtually
impossible and complicates electromagnetic surveys
(Khadr et al., 1997; Pasion et al., 2002). The ‘‘soils’’
at Kaho’olawe are derived from a tholeiitic basalt
parent rock with up to 20% magnetite. Other sites,
where problems would not be anticipated, such as
Jefferson Proving Ground (JPG), Indiana, can have
significant variability of near-surface magnetic sus-
ceptibility (Butler et al., 1999). The nature of physical
property variations at JPG, specifically the magnetic
susceptibility, is the source for much of the discussion
in this paper. The soils at JPG are predominantly very
fine, silty sands of glacial origin, with quartz the
dominant mineral and only trace amounts of clay.
JPG is the location of a major UXO detection tech-
nology demonstration program, conducted in five
phases over the period 1994–2001 (e.g., Pederson
and Stalcup, 1997; Butler et al., 1998a,b; Cespedes,
2001; Cespedes and Dinh, 2002).
Geophysical sensor responses in UXO surveys are
a superposition of the signatures of the host medium,
cultural sources, and the buried ordnance. Signatures
due to the host medium and cultural sources constitute
the background. The host medium in most cases is a
soil. Part of the response to the host medium will be
due to materials (soil and rock) below the depth of
burial of the UXO as well as surface topography.
Conditions where the nature of the host medium
makes buried UXO detection problematic include:
soils with high magnetic susceptibility (or with in-
cluded rocks or shallow ‘‘bedrock’’ with high mag-
netic susceptibility); high electrical conductivity soils
that produce large EM induction responses and atten-
uate GPR signals after short distances of propagation;
soils with large rocks, tree roots, and animal burrows
that produce GPR signatures similar in some respects
to GPR signatures from UXO; highly heterogeneous
soils with large contrasts in magnetic susceptibility,
electrical conductivity, and/or dielectric permittivity
with size scales comparable to the buried UXO. Two
types of cultural sources contribute to sensor
responses: (1) objects (‘‘clutter’’) on or buried in the
host medium, such as buildings, fences, exploded
ordnance debris and other metallic objects (false alarm
sources), and (2) interference signals from power lines
and EM transmitters of various types.
Total magnetic field (TMF) anomaly maps for
three sites that illustrate some of the range of back-
grounds encountered at UXO test sites and cleanup
sites are shown in Fig. 2. The three sites all have
buried UXO (for test sites, the buried ordnance items
are inert, but the terminology UXO is used for
simplicity). For the low background noise site (Fig.
2a), the UXO anomalies are readily apparent, and
inversion of the anomalies for details of the sources
should be straightforward. The intensely cluttered site
(Fig. 2b) has so many anomalies due to shallow
ferrous objects that even identification of the UXO
anomalies is extremely difficult; the remains of buried
communication lines cause some of the linear anom-
aly features. For the JPG site (Fig. 2c), identification
of the UXO anomalies becomes problematic when
D.K. Butler / Journal of Applied Geophysics 54 (2003) 111–125 115
located in close proximity to or within the larger
‘‘geologic’’ anomalies (area 1) or cultural feature
anomalies. There are also some geologic anomalies
at the JPG site that are comparable in magnitude and
wavelength to UXO anomalies (e.g., area 2). The
Phase V demonstration at JPG (ca. 2000–2001)
exploited the fact that both areas with ‘‘quiet’’ mag-
netic backgrounds and areas with prominent geologic
magnetic anomalies were present (Cespedes, 2001).
Following the Phase V demonstration at JPG, the
demonstration moved to a test site established on
Kaho’olawe, HI (Cespedes and Dinh, 2002).
4. Magnetic susceptibility: spatial variability
Magnetic susceptibility of near-surface materials
does not normally vary significantly over very short
distances (e.g., a few meters), particularly in a non-
igneous terrain. It is not uncommon, however, for
soils to have higher magnetic susceptibilities than the
parent rocks due to various geochemical processes
during weathering and also selective sorting of heavy
minerals (Burger, 1992; Le Borgne, 1955; Mullins,
1977). Magnetic susceptibility of sedimentary rock
averages 5� 10–4 (SI), while for soils derived from
sedimentary rocks it can be as high as 1.5� 10–3
(SI).1 Soil magnetic susceptibility typically can vary
by factors of 2 to 3 over distances of 10’s of meters.
Commonly, the susceptibility variation of soils in an
area (as portrayed in a histogram of values) will be
unimodal with a rather narrow peak (Scollar et al.,
1990; Dearing, 1994), and there are intuitive magnetic
susceptibility correlations to soil type and well-known
correlations to topography. Anomalously high or
complex spatial variability of magnetic susceptibility
were never anticipated for the JPG sites.
During preparation for and execution of the JPG
Phase IV demonstrations, the presence of significant
and unexplained magnetic anomalies was indicated
by some of the demonstrators, based on their Phase II
and III demonstration experience. Fig. 2c is a TMF
anomaly map from a Phase III demonstration
(McDonald and Nelson, 1999). In addition to mag-
1 To convert the volume magnetic susceptibilities used in this
paper to mass susceptibilities, divide by the bulk density.
netic anomalies due to buried targets (ordnance and
non-ordnance targets), the magnetic map includes
other anomalies caused by cultural and geologic
sources. An obvious cultural feature anomaly is the
linear anomaly pattern that trends nearly due north–
south along the western side of the 16-ha (40-acre)
site that is caused by an existing fence. Another
linear anomaly occurs between east and west grid
lines 10 and 11 and is caused by the buried remnants
of a fence. The longer wavelength anomalies, many
of which are subtle in expression, are geologic in
origin and likely from very shallow-origin sources.
Two significant anomalous areas, which are not
subtle, exist in the northeast and northwest quadrant
of the site (Fig. 2c).
5. JPG magnetic susceptibility measurements and
observations
5.1. Northwest quadrant magnetic anomaly
Grid lines K and M and grid lines 4 and 6
approximately bound the large magnitude geologic
anomaly feature in the northwest quadrant (Fig. 2c).
The anomaly coincides with a notable topographic
depression associated with surface drainage (Butler et
al., 1999). More subtle expressions of the anomaly
extend outside this area to the northeast and south-
west, following the trends of drainage features. An
enlarged view of the magnetic anomaly map of this
feature is also shown. Although the overall anomalous
feature is complex, the most obvious aspect of the
anomaly is a bipolar pattern, with a large magnitude
negative band (f� 130 nT) to the south and a large
magnitude positive band (f + 115 nT) to the north.
Some of the Phase II and III demonstrators expressed
the conviction that the prominent anomaly must be
due to buried ferrous materials that were not detected
during the test site development. However, the relative
signs of the anomaly are opposite to that expected for
a buried ferrous object; this fact and the relatively
sharp definition of the anomaly suggest a shallow,
geologic origin.
Two types of measurements were obtained in situ to
characterize the nature of the anomalous feature. A
frequency domain EM system was used to acquire
terrain conductivity and magnetic susceptibility meas-
D.K. Butler / Journal of Applied Geophysics 54 (2003) 111–125116
urements (Geonics EM38; McNeill, 1986) over the
area bounded by grid lines K, M, 4, and 6 (61� 61-m
or 200� 200-ft area.). Measurements were acquired
approximately on a 6� 2-m grid for terrain conduc-
tivity and on a 6� 6-m grid for magnetic susceptibil-
ity. Magnetic susceptibility measurements with the
EM38 approximate a depth-weighted, volume-aver-
aged value for the upper 0.5 m of the subsurface.
Magnetic susceptibility measurements were also ac-
quired with a laboratory magnetic susceptibility sys-
tem fitted with a field measurement search coil
(Bartington MS2 Magnetic Susceptibility System;
Dearing, 1994) on a 6� 6-m grid within the same area
as the EM38 measurements. In addition, MS2 meas-
urements were acquired along grid lines K, L, and M at
30-m intervals (100 ft). MS2 magnetic susceptibility
measurements approximate volume-averaged values
for the upper 10–15 cm of the subsurface. Both
EM38 and MS2 measurements are magnitudes of the
total, volume magnetic susceptibility.
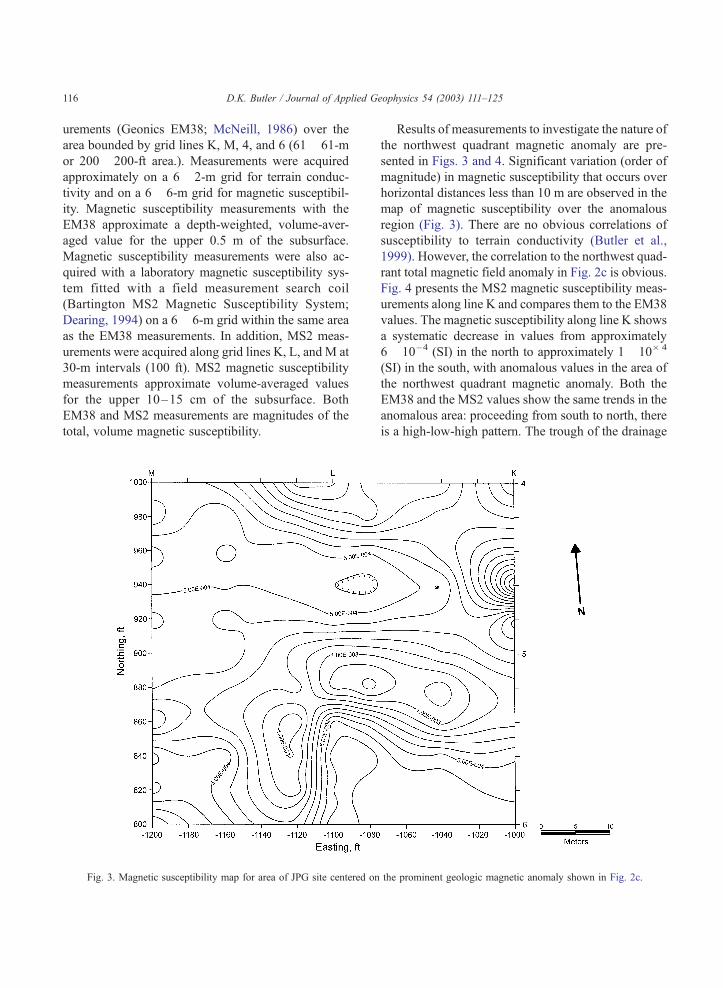
Fig. 3. Magnetic susceptibility map for area of JPG site centered on
Results of measurements to investigate the nature of
the northwest quadrant magnetic anomaly are pre-
sented in Figs. 3 and 4. Significant variation (order of
magnitude) in magnetic susceptibility that occurs over
horizontal distances less than 10 m are observed in the
map of magnetic susceptibility over the anomalous
region (Fig. 3). There are no obvious correlations of
susceptibility to terrain conductivity (Butler et al.,
1999). However, the correlation to the northwest quad-
rant total magnetic field anomaly in Fig. 2c is obvious.
Fig. 4 presents the MS2 magnetic susceptibility meas-
urements along line K and compares them to the EM38
values. The magnetic susceptibility along line K shows
a systematic decrease in values from approximately
6� 10–4 (SI) in the north to approximately 1�10� 4
(SI) in the south, with anomalous values in the area of
the northwest quadrant magnetic anomaly. Both the
EM38 and the MS2 values show the same trends in the
anomalous area: proceeding from south to north, there
is a high-low-high pattern. The trough of the drainage
the prominent geologic magnetic anomaly shown in Fig. 2c.
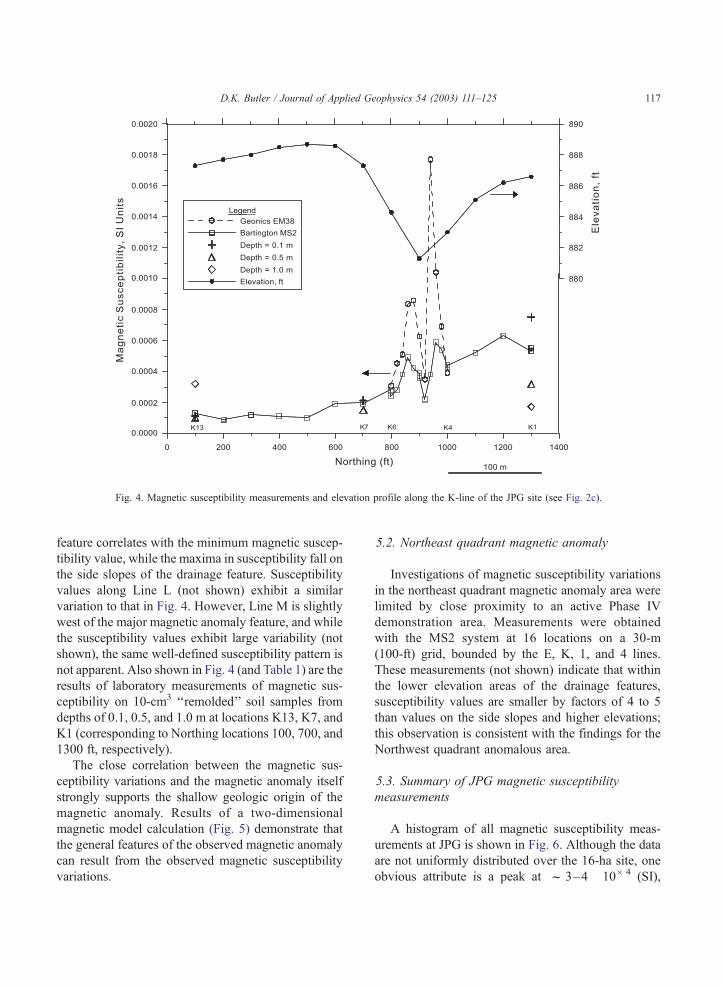
Fig. 4. Magnetic susceptibility measurements and elevation profile along the K-line of the JPG site (see Fig. 2c).
D.K. Butler / Journal of Applied Geophysics 54 (2003) 111–125 117
feature correlates with the minimum magnetic suscep-
tibility value, while the maxima in susceptibility fall on
the side slopes of the drainage feature. Susceptibility
values along Line L (not shown) exhibit a similar
variation to that in Fig. 4. However, Line M is slightly
west of the major magnetic anomaly feature, and while
the susceptibility values exhibit large variability (not
shown), the same well-defined susceptibility pattern is
not apparent. Also shown in Fig. 4 (and Table 1) are the
results of laboratory measurements of magnetic sus-
ceptibility on 10-cm3 ‘‘remolded’’ soil samples from
depths of 0.1, 0.5, and 1.0 m at locations K13, K7, and
K1 (corresponding to Northing locations 100, 700, and
1300 ft, respectively).
The close correlation between the magnetic sus-
ceptibility variations and the magnetic anomaly itself
strongly supports the shallow geologic origin of the
magnetic anomaly. Results of a two-dimensional
magnetic model calculation (Fig. 5) demonstrate that
the general features of the observed magnetic anomaly
can result from the observed magnetic susceptibility
variations.
5.2. Northeast quadrant magnetic anomaly
Investigations of magnetic susceptibility variations
in the northeast quadrant magnetic anomaly area were
limited by close proximity to an active Phase IV
demonstration area. Measurements were obtained
with the MS2 system at 16 locations on a 30-m
(100-ft) grid, bounded by the E, K, 1, and 4 lines.
These measurements (not shown) indicate that within
the lower elevation areas of the drainage features,
susceptibility values are smaller by factors of 4 to 5
than values on the side slopes and higher elevations;
this observation is consistent with the findings for the
Northwest quadrant anomalous area.
5.3. Summary of JPG magnetic susceptibility
measurements
A histogram of all magnetic susceptibility meas-
urements at JPG is shown in Fig. 6. Although the data
are not uniformly distributed over the 16-ha site, one
obvious attribute is a peak at f 3–4� 10� 4 (SI),
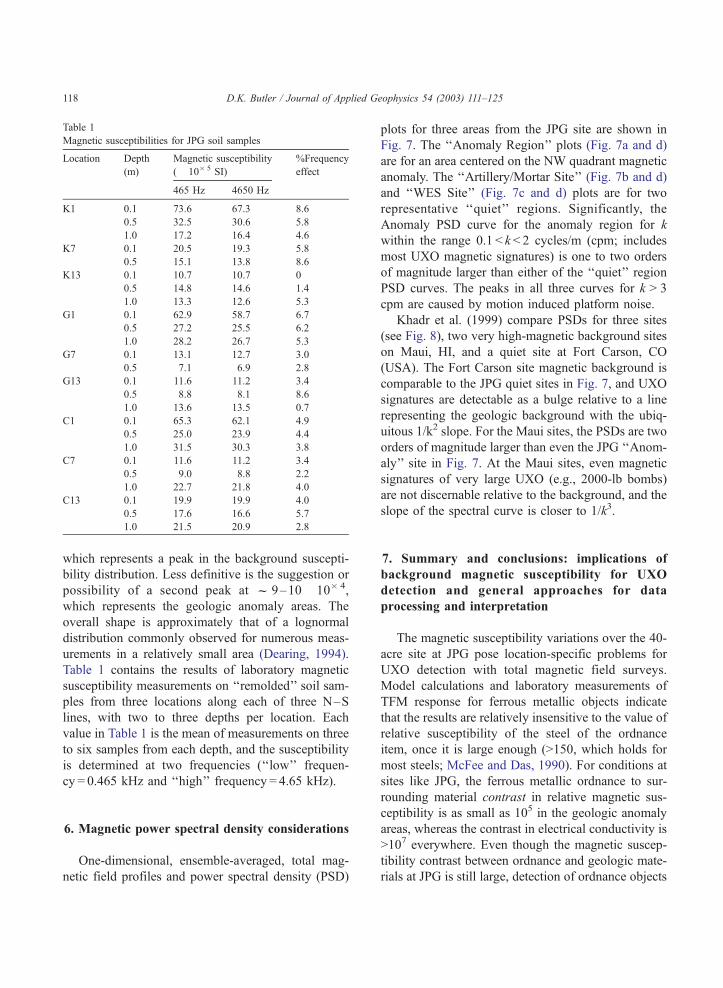
Table 1
Magnetic susceptibilities for JPG soil samples
Location Depth
(m)
Magnetic susceptibility
(� 10� 5 SI)
%Frequency
effect
465 Hz 4650 Hz
K1 0.1 73.6 67.3 8.6
0.5 32.5 30.6 5.8
1.0 17.2 16.4 4.6
K7 0.1 20.5 19.3 5.8
0.5 15.1 13.8 8.6
K13 0.1 10.7 10.7 0
0.5 14.8 14.6 1.4
1.0 13.3 12.6 5.3
G1 0.1 62.9 58.7 6.7
0.5 27.2 25.5 6.2
1.0 28.2 26.7 5.3
G7 0.1 13.1 12.7 3.0
0.5 7.1 6.9 2.8
G13 0.1 11.6 11.2 3.4
0.5 8.8 8.1 8.6
1.0 13.6 13.5 0.7
C1 0.1 65.3 62.1 4.9
0.5 25.0 23.9 4.4
1.0 31.5 30.3 3.8
C7 0.1 11.6 11.2 3.4
0.5 9.0 8.8 2.2
1.0 22.7 21.8 4.0
C13 0.1 19.9 19.9 4.0
0.5 17.6 16.6 5.7
1.0 21.5 20.9 2.8
D.K. Butler / Journal of Applied Geophysics 54 (2003) 111–125118
which represents a peak in the background suscepti-
bility distribution. Less definitive is the suggestion or
possibility of a second peak at f 9–10� 10� 4,
which represents the geologic anomaly areas. The
overall shape is approximately that of a lognormal
distribution commonly observed for numerous meas-
urements in a relatively small area (Dearing, 1994).
Table 1 contains the results of laboratory magnetic
susceptibility measurements on ‘‘remolded’’ soil sam-
ples from three locations along each of three N–S
lines, with two to three depths per location. Each
value in Table 1 is the mean of measurements on three
to six samples from each depth, and the susceptibility
is determined at two frequencies (‘‘low’’ frequen-
cy = 0.465 kHz and ‘‘high’’ frequency = 4.65 kHz).
6. Magnetic power spectral density considerations
One-dimensional, ensemble-averaged, total mag-
netic field profiles and power spectral density (PSD)
plots for three areas from the JPG site are shown in
Fig. 7. The ‘‘Anomaly Region’’ plots (Fig. 7a and d)
are for an area centered on the NW quadrant magnetic
anomaly. The ‘‘Artillery/Mortar Site’’ (Fig. 7b and d)
and ‘‘WES Site’’ (Fig. 7c and d) plots are for two
representative ‘‘quiet’’ regions. Significantly, the
Anomaly PSD curve for the anomaly region for k
within the range 0.1 < k < 2 cycles/m (cpm; includes
most UXO magnetic signatures) is one to two orders
of magnitude larger than either of the ‘‘quiet’’ region
PSD curves. The peaks in all three curves for k > 3
cpm are caused by motion induced platform noise.
Khadr et al. (1999) compare PSDs for three sites
(see Fig. 8), two very high-magnetic background sites
on Maui, HI, and a quiet site at Fort Carson, CO
(USA). The Fort Carson site magnetic background is
comparable to the JPG quiet sites in Fig. 7, and UXO
signatures are detectable as a bulge relative to a line
representing the geologic background with the ubiq-
uitous 1/k2 slope. For the Maui sites, the PSDs are two
orders of magnitude larger than even the JPG ‘‘Anom-
aly’’ site in Fig. 7. At the Maui sites, even magnetic
signatures of very large UXO (e.g., 2000-lb bombs)
are not discernable relative to the background, and the
slope of the spectral curve is closer to 1/k3.
7. Summary and conclusions: implications of
background magnetic susceptibility for UXO
detection and general approaches for data
processing and interpretation
The magnetic susceptibility variations over the 40-
acre site at JPG pose location-specific problems for
UXO detection with total magnetic field surveys.
Model calculations and laboratory measurements of
TFM response for ferrous metallic objects indicate
that the results are relatively insensitive to the value of
relative susceptibility of the steel of the ordnance
item, once it is large enough (>150, which holds for
most steels; McFee and Das, 1990). For conditions at
sites like JPG, the ferrous metallic ordnance to sur-
rounding material contrast in relative magnetic sus-
ceptibility is as small as 105 in the geologic anomaly
areas, whereas the contrast in electrical conductivity is
>107 everywhere. Even though the magnetic suscep-
tibility contrast between ordnance and geologic mate-
rials at JPG is still large, detection of ordnance objects
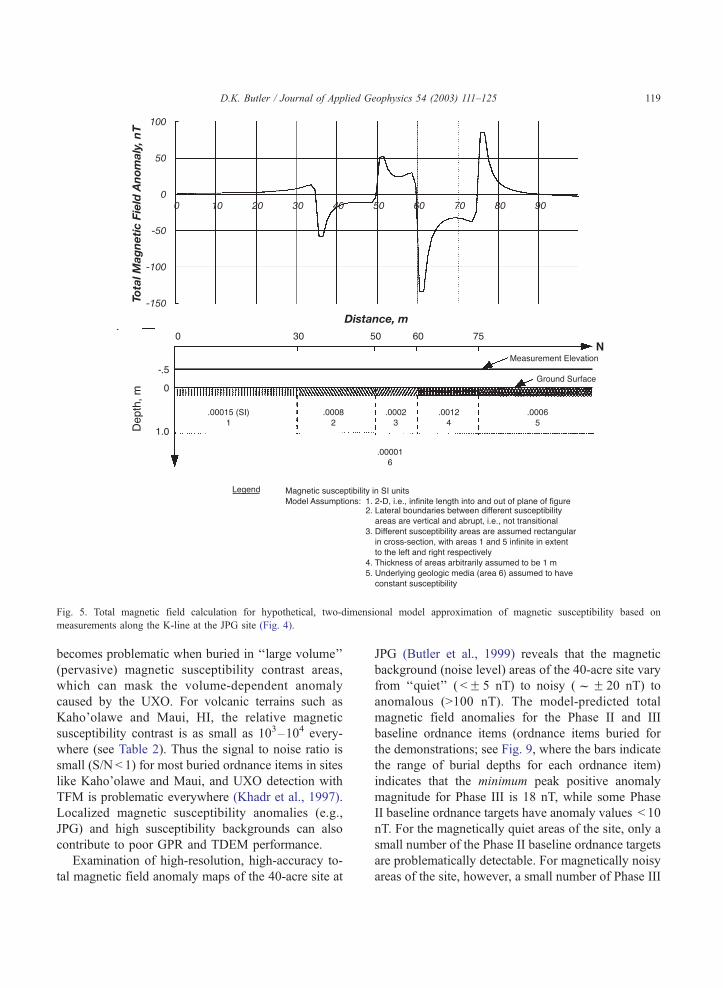
Fig. 5. Total magnetic field calculation for hypothetical, two-dimensional model approximation of magnetic susceptibility based on
measurements along the K-line at the JPG site (Fig. 4).
D.K. Butler / Journal of Applied Geophysics 54 (2003) 111–125 119
becomes problematic when buried in ‘‘large volume’’
(pervasive) magnetic susceptibility contrast areas,
which can mask the volume-dependent anomaly
caused by the UXO. For volcanic terrains such as
Kaho’olawe and Maui, HI, the relative magnetic
susceptibility contrast is as small as 103–104 every-
where (see Table 2). Thus the signal to noise ratio is
small (S/N < 1) for most buried ordnance items in sites
like Kaho’olawe and Maui, and UXO detection with
TFM is problematic everywhere (Khadr et al., 1997).
Localized magnetic susceptibility anomalies (e.g.,
JPG) and high susceptibility backgrounds can also
contribute to poor GPR and TDEM performance.
Examination of high-resolution, high-accuracy to-
tal magnetic field anomaly maps of the 40-acre site at
JPG (Butler et al., 1999) reveals that the magnetic
background (noise level) areas of the 40-acre site vary
from ‘‘quiet’’ ( <F 5 nT) to noisy (fF 20 nT) to
anomalous (>100 nT). The model-predicted total
magnetic field anomalies for the Phase II and III
baseline ordnance items (ordnance items buried for
the demonstrations; see Fig. 9, where the bars indicate
the range of burial depths for each ordnance item)
indicates that the minimum peak positive anomaly
magnitude for Phase III is 18 nT, while some Phase
II baseline ordnance targets have anomaly values < 10
nT. For the magnetically quiet areas of the site, only a
small number of the Phase II baseline ordnance targets
are problematically detectable. For magnetically noisy
areas of the site, however, a small number of Phase III
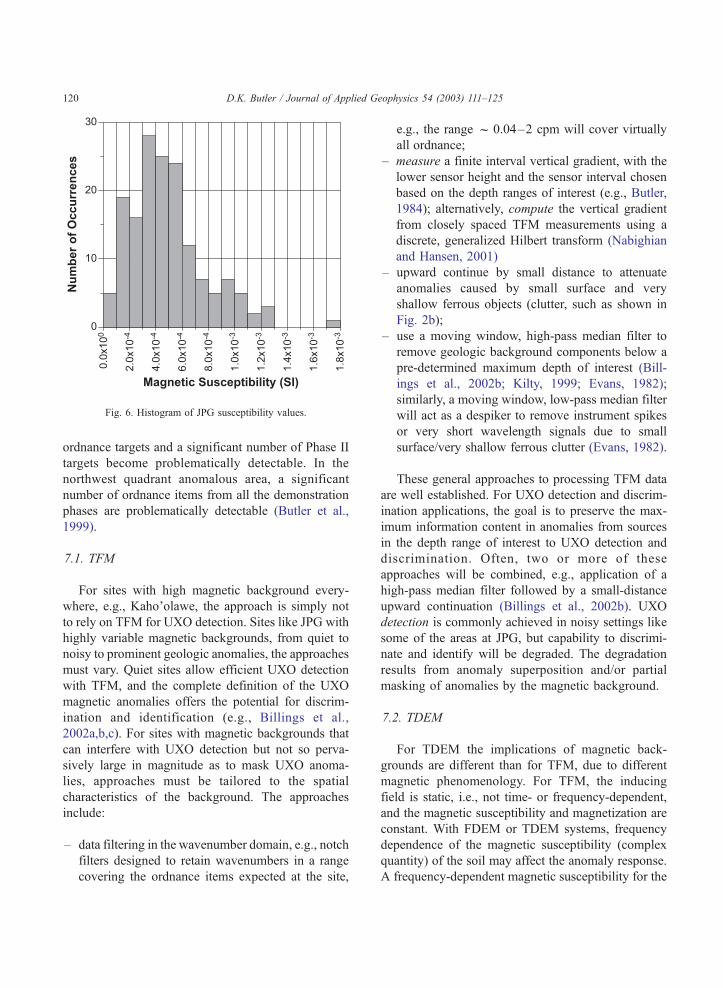
Fig. 6. Histogram of JPG susceptibility values.
D.K. Butler / Journal of Applied Geophysics 54 (2003) 111–125120
ordnance targets and a significant number of Phase II
targets become problematically detectable. In the
northwest quadrant anomalous area, a significant
number of ordnance items from all the demonstration
phases are problematically detectable (Butler et al.,
1999).
7.1. TFM
For sites with high magnetic background every-
where, e.g., Kaho’olawe, the approach is simply not
to rely on TFM for UXO detection. Sites like JPG with
highly variable magnetic backgrounds, from quiet to
noisy to prominent geologic anomalies, the approaches
must vary. Quiet sites allow efficient UXO detection
with TFM, and the complete definition of the UXO
magnetic anomalies offers the potential for discrim-
ination and identification (e.g., Billings et al.,
2002a,b,c). For sites with magnetic backgrounds that
can interfere with UXO detection but not so perva-
sively large in magnitude as to mask UXO anoma-
lies, approaches must be tailored to the spatial
characteristics of the background. The approaches
include:
– data filtering in the wavenumber domain, e.g., notch
filters designed to retain wavenumbers in a range
covering the ordnance items expected at the site,
e.g., the range f 0.04–2 cpm will cover virtually
all ordnance;
– measure a finite interval vertical gradient, with the
lower sensor height and the sensor interval chosen
based on the depth ranges of interest (e.g., Butler,
1984); alternatively, compute the vertical gradient
from closely spaced TFM measurements using a
discrete, generalized Hilbert transform (Nabighian
and Hansen, 2001)
– upward continue by small distance to attenuate
anomalies caused by small surface and very
shallow ferrous objects (clutter, such as shown in
Fig. 2b);
– use a moving window, high-pass median filter to
remove geologic background components below a
pre-determined maximum depth of interest (Bill-
ings et al., 2002b; Kilty, 1999; Evans, 1982);
similarly, a moving window, low-pass median filter
will act as a despiker to remove instrument spikes
or very short wavelength signals due to small
surface/very shallow ferrous clutter (Evans, 1982).
These general approaches to processing TFM data
are well established. For UXO detection and discrim-
ination applications, the goal is to preserve the max-
imum information content in anomalies from sources
in the depth range of interest to UXO detection and
discrimination. Often, two or more of these
approaches will be combined, e.g., application of a
high-pass median filter followed by a small-distance
upward continuation (Billings et al., 2002b). UXO
detection is commonly achieved in noisy settings like
some of the areas at JPG, but capability to discrimi-
nate and identify will be degraded. The degradation
results from anomaly superposition and/or partial
masking of anomalies by the magnetic background.
7.2. TDEM
For TDEM the implications of magnetic back-
grounds are different than for TFM, due to different
magnetic phenomenology. For TFM, the inducing
field is static, i.e., not time- or frequency-dependent,
and the magnetic susceptibility and magnetization are
constant. With FDEM or TDEM systems, frequency
dependence of the magnetic susceptibility (complex
quantity) of the soil may affect the anomaly response.
A frequency-dependent magnetic susceptibility for the
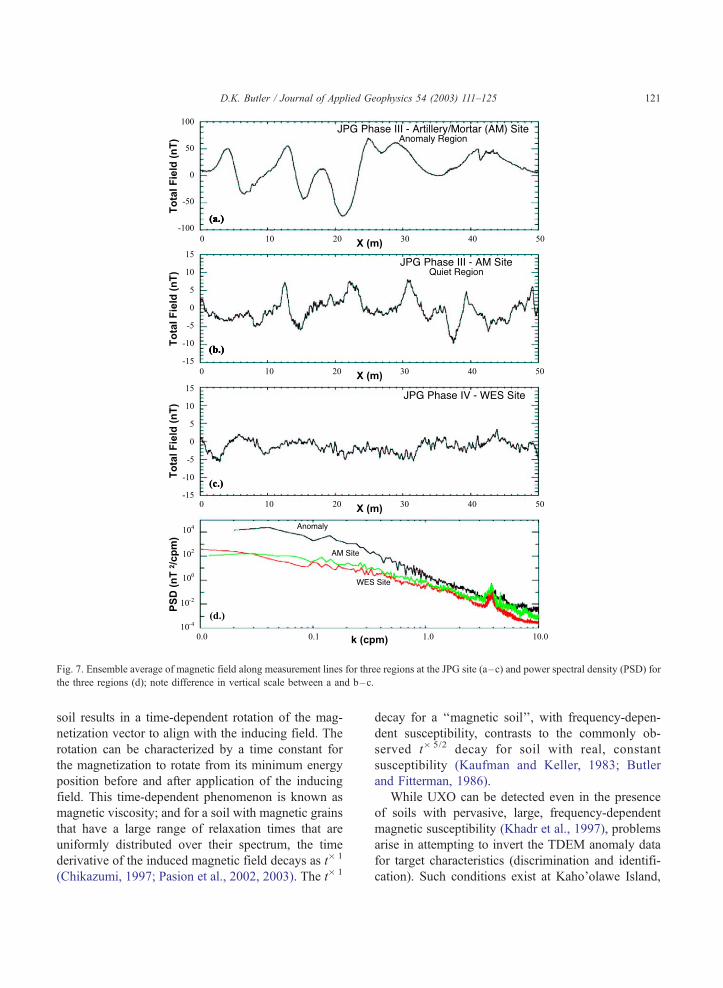
Fig. 7. Ensemble average of magnetic field along measurement lines for three regions at the JPG site (a–c) and power spectral density (PSD) for
the three regions (d); note difference in vertical scale between a and b–c.
D.K. Butler / Journal of Applied Geophysics 54 (2003) 111–125 121
soil results in a time-dependent rotation of the mag-
netization vector to align with the inducing field. The
rotation can be characterized by a time constant for
the magnetization to rotate from its minimum energy
position before and after application of the inducing
field. This time-dependent phenomenon is known as
magnetic viscosity; and for a soil with magnetic grains
that have a large range of relaxation times that are
uniformly distributed over their spectrum, the time
derivative of the induced magnetic field decays as t� 1
(Chikazumi, 1997; Pasion et al., 2002, 2003). The t� 1
decay for a ‘‘magnetic soil’’, with frequency-depen-
dent susceptibility, contrasts to the commonly ob-
served t� 5/2 decay for soil with real, constant
susceptibility (Kaufman and Keller, 1983; Butler
and Fitterman, 1986).
While UXO can be detected even in the presence
of soils with pervasive, large, frequency-dependent
magnetic susceptibility (Khadr et al., 1997), problems
arise in attempting to invert the TDEM anomaly data
for target characteristics (discrimination and identifi-
cation). Such conditions exist at Kaho’olawe Island,
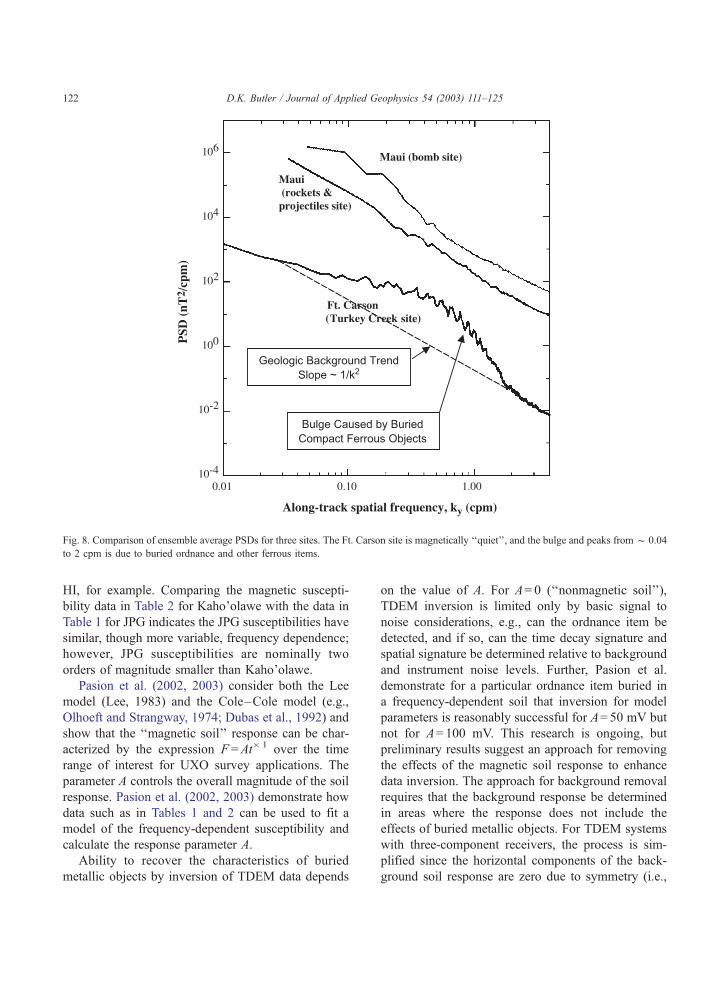
Fig. 8. Comparison of ensemble average PSDs for three sites. The Ft. Carson site is magnetically ‘‘quiet’’, and the bulge and peaks from f 0.04
to 2 cpm is due to buried ordnance and other ferrous items.
D.K. Butler / Journal of Applied Geophysics 54 (2003) 111–125122
HI, for example. Comparing the magnetic suscepti-
bility data in Table 2 for Kaho’olawe with the data in
Table 1 for JPG indicates the JPG susceptibilities have
similar, though more variable, frequency dependence;
however, JPG susceptibilities are nominally two
orders of magnitude smaller than Kaho’olawe.
Pasion et al. (2002, 2003) consider both the Lee
model (Lee, 1983) and the Cole–Cole model (e.g.,
Olhoeft and Strangway, 1974; Dubas et al., 1992) and
show that the ‘‘magnetic soil’’ response can be char-
acterized by the expression F =At� 1 over the time
range of interest for UXO survey applications. The
parameter A controls the overall magnitude of the soil
response. Pasion et al. (2002, 2003) demonstrate how
data such as in Tables 1 and 2 can be used to fit a
model of the frequency-dependent susceptibility and
calculate the response parameter A.
Ability to recover the characteristics of buried
metallic objects by inversion of TDEM data depends
on the value of A. For A= 0 (‘‘nonmagnetic soil’’),
TDEM inversion is limited only by basic signal to
noise considerations, e.g., can the ordnance item be
detected, and if so, can the time decay signature and
spatial signature be determined relative to background
and instrument noise levels. Further, Pasion et al.
demonstrate for a particular ordnance item buried in
a frequency-dependent soil that inversion for model
parameters is reasonably successful for A= 50 mV but
not for A= 100 mV. This research is ongoing, but
preliminary results suggest an approach for removing
the effects of the magnetic soil response to enhance
data inversion. The approach for background removal
requires that the background response be determined
in areas where the response does not include the
effects of buried metallic objects. For TDEM systems
with three-component receivers, the process is sim-
plified since the horizontal components of the back-
ground soil response are zero due to symmetry (i.e.,
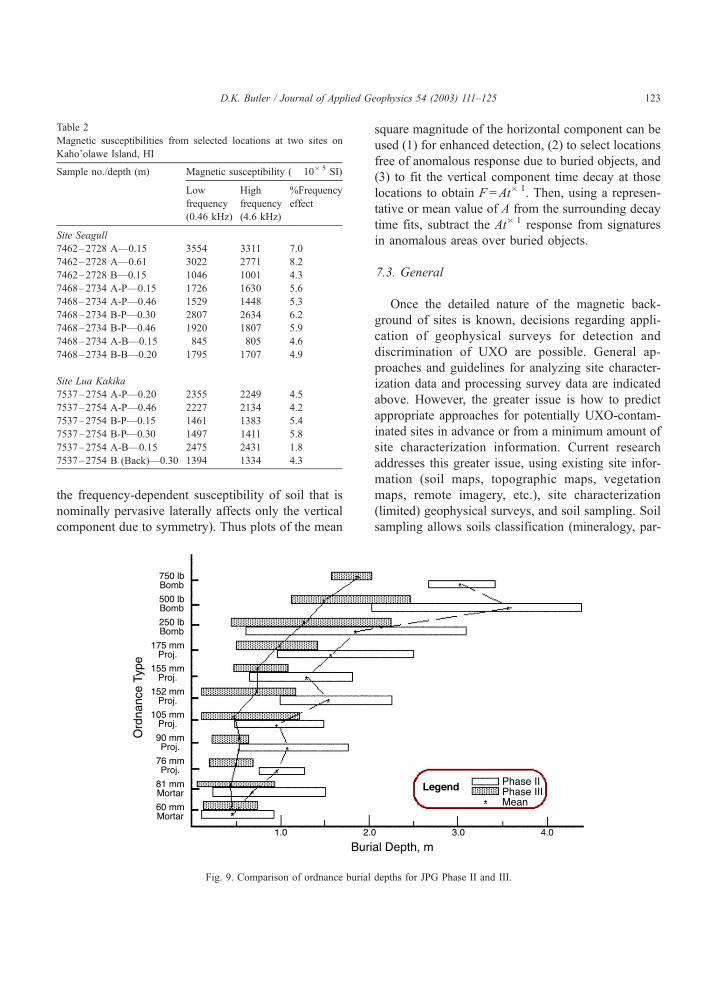
Table 2
Magnetic susceptibilities from selected locations at two sites on
Kaho’olawe Island, HI
Sample no./depth (m) Magnetic susceptibility (� 10� 5 SI)
Low
frequency
(0.46 kHz)
High
frequency
(4.6 kHz)
%Frequency
effect
Site Seagull
7462–2728 A—0.15 3554 3311 7.0
7462–2728 A—0.61 3022 2771 8.2
7462–2728 B—0.15 1046 1001 4.3
7468–2734 A-P—0.15 1726 1630 5.6
7468–2734 A-P—0.46 1529 1448 5.3
7468–2734 B-P—0.30 2807 2634 6.2
7468–2734 B-P—0.46 1920 1807 5.9
7468–2734 A-B—0.15 845 805 4.6
7468–2734 B-B—0.20 1795 1707 4.9
Site Lua Kakika
7537–2754 A-P—0.20 2355 2249 4.5
7537–2754 A-P—0.46 2227 2134 4.2
7537–2754 B-P—0.15 1461 1383 5.4
7537–2754 B-P—0.30 1497 1411 5.8
7537–2754 A-B—0.15 2475 2431 1.8
7537–2754 B (Back)—0.30 1394 1334 4.3
D.K. Butler / Journal of Applied Geophysics 54 (2003) 111–125 123
the frequency-dependent susceptibility of soil that is
nominally pervasive laterally affects only the vertical
component due to symmetry). Thus plots of the mean
Fig. 9. Comparison of ordnance burial
square magnitude of the horizontal component can be
used (1) for enhanced detection, (2) to select locations
free of anomalous response due to buried objects, and
(3) to fit the vertical component time decay at those
locations to obtain F =At� 1. Then, using a represen-
tative or mean value of A from the surrounding decay
time fits, subtract the At� 1 response from signatures
in anomalous areas over buried objects.
7.3. General
Once the detailed nature of the magnetic back-
ground of sites is known, decisions regarding appli-
cation of geophysical surveys for detection and
discrimination of UXO are possible. General ap-
proaches and guidelines for analyzing site character-
ization data and processing survey data are indicated
above. However, the greater issue is how to predict
appropriate approaches for potentially UXO-contam-
inated sites in advance or from a minimum amount of
site characterization information. Current research
addresses this greater issue, using existing site infor-
mation (soil maps, topographic maps, vegetation
maps, remote imagery, etc.), site characterization
(limited) geophysical surveys, and soil sampling. Soil
sampling allows soils classification (mineralogy, par-
depths for JPG Phase II and III.
D.K. Butler / Journal of Applied Geophysics 54 (2003) 111–125124
ticle size gradation) and direct soil property measure-
ments. A fundamental issue currently under investi-
gation is the nature of frequency-dependent magnetic
susceptibility and its effect on TDEM surveys. An-
other fundamental issue relates to the existence, nature
and magnitude of remanent magnetization of intact
UXO and UXO fragments; current approaches to
UXO discrimination using TFM involve assumptions
about remanent magnetization.
Acknowledgements
This paper results from work conducted as part of
the UXO Focus Area of the U.S. Army’s Environ-
mental Quality Technology Research Program by
personnel of the U.S. Army Engineer Research and
Development Center (ERDC) and Alion Science and
Technology Corporation. The author has freely drawn
from superb work done by personnel of the Geo-
physical Inversion Facility, University of British
Columbia (UBC), funded by ERDC. ERDC personnel
who contributed to this work include Janet Simms,
Jose Llopis, and Eric Smith; UBC personnel including
Douglas Oldenburg, Len Pasion, and Stephen Bill-
ings. The author also gratefully acknowledges dis-
cussions with Nagi Khadr and Bruce Barrow, AETC,
and their assistance in developing Fig. 7. The paper, in
its final form, benefited significantly from construc-
tive reviews of the original paper by Dr. Alain
Tabbaugh and a second reviewer.
References
Billings, S.D., Pasion, L.R., Oldenburg, D.W., 2002a. Discrimina-
tion and Identification of UXO by Geophysical Inversion of
Total-Field Magnetic Data, Technical Report ERDC/GSL TR-
02-16, U.S. Army Engineer Research and Development Center,
Vicksburg, MS.
Billings, S.D., Stanley, J.M., Youmans, C., 2002b. Magnetic dis-
crimination that will satisfy regulators. Proceedings of the UXO/
Countermine Forum 2002 (CD), Orlando, FL.
Billings, S.D., Pasion, L.R., Oldenburg, D.W., 2002c. UXO dis-
crimination and identification using magnetometry. Proceedings
of the Symposium on the Application of Geophysics to Environ-
mental and Engineering Problems (CD). Environmental and En-
gineering Geophysical Society, Las Vegas, NV.
Burger, H.R., 1992. Exploration Geophysics of the Shallow Subsur-
face. Prentice Hall, Englewood Cliffs, NJ.
Butler, D.K., 1984. Interval gravity gradient determination con-
cepts. Geophysics 49, 828–832.
Butler, D.K., 1997. Round table: landmines and UXO. The Leading
Edge 16 (10), 1460.
Butler, D.K., 2001. Potential fields methods for location of unex-
ploded ordnance. The Leading Edge 20 (8), 890–895.
Butler, D.K., Fitterman, D.V., 1986. Transient electromagnetic
methods for ground-water assessment, Miscellaneous Paper
G-86-27, US Army Engineer Waterways Experiment Station,
Vicksburg, MS.
Butler, D.K., Cespedes, E.R., Cox, C.B., Wolfe, P.J., 1998a. Mul-
tisensor methods for buried unexploded ordnance detection,
discrimination, and identifications, Technical Report SERDP-
98-10, US Army Engineer Waterways Experiment Station,
Vicksburg, MS.
Butler, D., Cespedes, E., O’Neill, K., Arcone, S., Llopis, J., Curtis,
J., Cullinane, J., Meyer, C., 1998b. Overview of science and
technology program for JPG phase IV. Proceedings of the UXO
Forum ’98, Anaheim, CA.
Butler, D.K., Llopis, J.L., Simms, J.E. 1999. Phenomenological
Investigations of the Jefferson Proving Ground UXO Technol-
ogy Demonstrations, Technical Report GL-99-7, U.S Army En-
gineer Waterways Experiment Station, Vicksburg, MS.
Butler, D.K., Wolfe, P.J., Hansen, R.O., 2001. Analytical modeling
of magnetic and gravity signatures of unexploded ordnance.
Journal of Environmental and Engineering Geophysics 6 (1),
33–46.
Cespedes, E.R., 2001. Advanced UXO detection/discrimination
technology demonstration—U.S. Army Jefferson Proving
Ground, Madison, Indiana, Technical Report ERDC/EL TR01-
1, Engineer Research and Development Center, Vicksburg, MS.
Cespedes, E.R., Dinh, H.Q., 2002. Performance of advanced EMI
systems in difficult magnetic environments. Proceedings of the
UXO/Countermine Forum 2002, Orlando, FL.
Chikazumi, S., 1997. Physics of Ferromagnetism Oxford University
Press, New York.
Dearing, J., 1994. Environmental Magnetic Susceptibility Using the
Bartington MS2 System Chi Publishing, Kenilworth, UK.
Dubas, M., Jolivet, J., Tabbagh, A., 1992. Magnetic susceptibility
and viscosity of soils in a weak time varying field. Geophysical
Journal International 108, 101–109.
Evans, J.R., 1982. Running median filters and a general despiker.
Bulletin of the Seismological Society of America 72 (1),
331–338.
Kaufman, A.A., Keller, G.V., 1983. Frequency and Transient
Soundings Elsevier, New York.
Keiswetter, D., 2000. Advances in frequency domain electromag-
netic induction techniques for improved discrimination and
identification of buried unexploded ordnance. Proceedings of
the UXO/Countermine Forum 2000, Anaheim, CA.
Khadr, N., Bell, T., William, S., Bacon, W.B., 1997. UXO detection
in highly magnetic soils. Proceedings of the UXO Forum 97,
222–228.
Kilty, K.T. 1999. Filtering magnetic data to remove cultural noise.
http://www.kilty.com/filter.htm, n1999, 13 pages (7 June 2002).
Le Borgne, E., 1955. Abnormal magnetic susceptibility of the top
soil. Annals of Geophysics 11, 399–419.
D.K. Butler / Journal of Applied Geophysics 54 (2003) 111–125 125
McDonald, J.R., Nelson, H.H., 1999. Results of the MTADS Tech-
nology Demonstration #3 Naval Research Laboratory, Washing-
ton, DC. NRL/PU/6110-99-375.
McFee, J.E., Das, Y., 1990. A multiple expansion model for com-
pact ferrous object detection. Proceedings of the ANTEM ’90
Symposium on Antenna Technology and Applied Electromag-
netics, Manitoba, Canada, 633–638.
McNeill, J.D., 1986. Geonics EM38 Ground Conductivity Meter,
Operating Instructions and Survey Interpretation Techniques,
Technical Note TN-21, Geonics, Mississauga, Ontario, Canada.
Mullins, C.E., 1977. Magnetic Susceptibility of the soil and its
significance in soil science a review. Journal of Soil Science
28, 223–246.
Nabighian, M.N., Hansen, R.O., 2001. Unification of Euler and
Werner deconvolution in three dimensions via the generalized
Hilbert transform. Geophysics 66, 1805–1810.
Olhoeft, R.R., Strangway, D.W., 1974. Magnetic relaxation and the
electromagnetic response parameter. Geophysics 39, 302–311.
Pasion, L.R., Oldenburg, D.W., 2001. A discrimination algorithm
for UXO using time domain electromagnetics. Journal of Engi-
neering and Environmental Geophysics 6 (2), 91–102.
Pasion, L.R., Billings, S.D., Oldenburg, D.W., 2002. Evaluating the
effects of magnetic soils on TEM measurements for UXO de-
tection. Expanded Abstracts. Society of Exploration Geophysi-
cists, Tulsa, OK, pp. 1428–1431.
Pasion, L.R., Billings, S.D., Oldenburg, D.W., 2003. Evaluating
the effects of magnetic susceptibility in UXO discrimination
problems. Proceedings of the Symposium on the Application
of Geophysics to Environmental and Engineering Problems
(CD). Environmental and Engineering Geophysical Society,
San Antonio, TX.
Pederson, A., Stalcup, B., 1997. Phase III advanced technology
demonstrations at Jefferson proving ground. Proceedings of
the UXO Forum ’97, pp. 281–289.
Scollar, I., Tabbagh, A., Hesse, A., Herzog, I., 1990. Archaeological
Prospecting and Remote Sensing Cambridge Univ. Press, NY.