Embed Size (px)
DESCRIPTION
Implications of Graphics on Usability and Accessibility for the Voter. Sharon Laskowski Svetlana Lowry Benjamin Smith [email protected] http://vote.nist.gov. September 2009. US Help America Vote Act (HAVA) was enacted as Public Law 107-252 in 2002. - PowerPoint PPT Presentation
Citation preview

Implications of Graphics on Usability and Accessibility for the Voter
Sharon Laskowski
Svetlana Lowry
Benjamin Smith
http://vote.nist.gov
September 2009
2
US Help America Vote Act (HAVA) was enacted as Public Law 107-252 in 2002
• Established Election Assistance Commission to help States meet HAVA requirements, adopt voting system standards, and provide a national clearinghouse of information about election administration
• Established minimum election standards for States and units of local government with responsibility for administration of Federal elections
• Provided funds to States to replace punch card voting systems

3
NIST was called upon in HAVAto provide technical assistance to the EAC
• Technical Guidelines Development Committee is developing standards* to improve voting systems
• NIST provides technical support to the TGDC– Research to support standards and test methods
• NIST/EAC-accredited voting system test laboratories certify systems to the standard for purchase by the States
• NIST Usability Group is developing usability, accessibility, and privacy standards
*Called the Voluntary Voting System Guidelines (VVSG)

4
We explored research questions about graphics on the ballot
• The goal for this research was to examine the overall impact of graphics on the usability and accessibility of voting systems
• We also attempted to answer a question posed to us:
“Do graphics help people with cognitive disabilities to vote?”

5
What are the graphical elements?
• Photographs and party logos (to indicate specific candidates or political parties)
• Informational icons (such as arrows and alert symbols)
• Animations or other video (to assist the voter in the process of voting)
6
History of ballots in the United States
• Voting has existed since ancient times, however, graphics have only been a part of voting systems for the past two centuries– “Ballot” comes from Italian ballotta
• A small ball that was dropped in a container to indicate a voter’s choice
• Container with the most "ballotte” indicated the winner
– Voice votes, showing of hands, were popular in early America• They were eliminated due to a lack of secrecy
– Paper ballots were adopted after American Revolution• They were scraps of paper on which voters wrote the names of
preferred candidates
7
History of ballots in the United States
• In the 1830s, printed ballots became legal; the citizens did not need to know how to read or write in order to vote
– Parties printed tickets on colored paper, and used various pictures on the ballot
– Patriotic images• Bald eagle, American flag, ornate, abstract decorations, and names
of political parties in fancy letters
• Ballots for Abraham Lincoln included pictures of naval battles and trains
– Party symbols
8
History of ballots in the United States
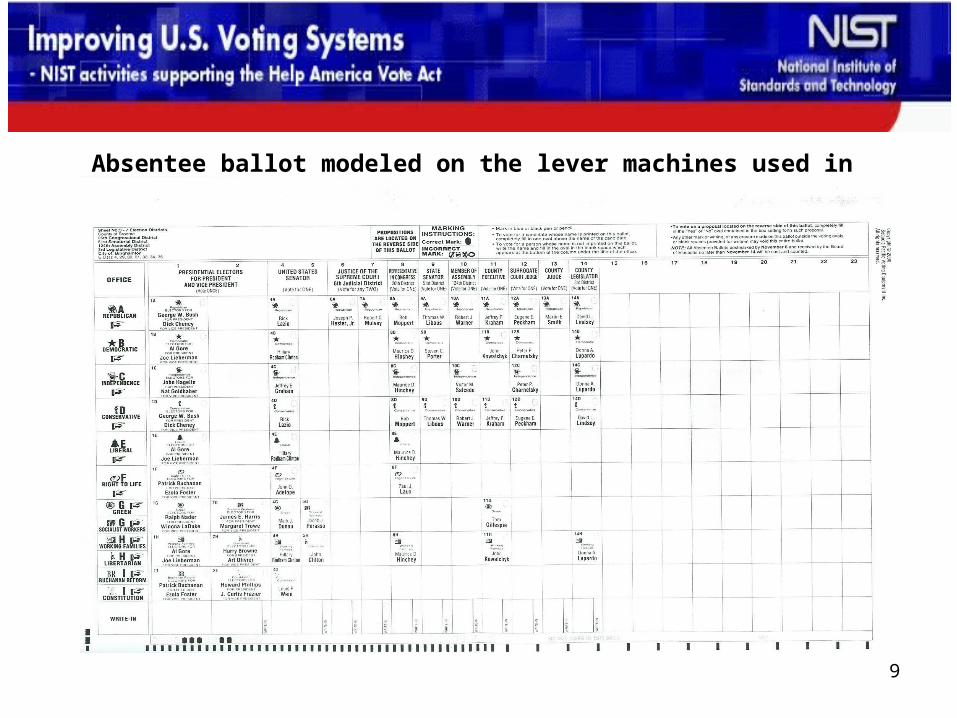
• In the 1890s, gear and lever voting machines were introduced and became dominant voting technology in the US – Next slide shows an absentee ballot modeled on the lever
machines used in New York
• Punch cards and optical-scan ballots were introduced in the 20th century to enable computers to count ballots – Optical-scan systems are marked using a pencil on a paper
ballot, and are similar to the original paper blanket ballots– Party symbols were rarely used in punch-card systems due to
limited space
9
Absentee ballot modeled on the lever machines used in New York
10
History of ballots in the United States
• Touch screen or DRE* replaced paper ballot with an electronic display and recording system – They became the second most popular voting technology in the
US – They generally do not feature party symbols (although this would
be possible)– DREs are based on personal computer technology and
graphical user interfaces, for example:• User interface elements such as scroll bars and arrows (when there
is more information to display than will fit on the screen)
• Interface metaphors such as virtual three-dimensional buttons that react when touched
*Direct Record Electronic
11
History of ballots outside of the United States
• The form of government and the needs of the voters determine many aspects of the ballots
• There are a variety of ballots and voting systems in use outside of the US, for example
– In South Africa, full-color photographs of candidates are printed on paper ballots, along with full-color party logos, and names of parties
• This practice assists people who cannot read
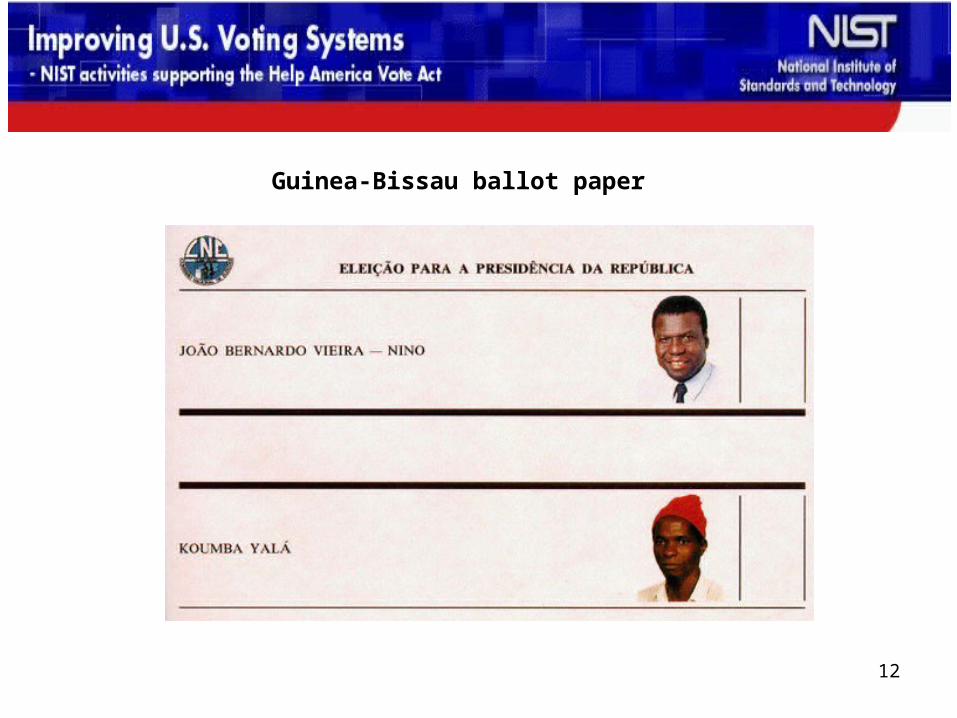
– Guinea-Bissau ballot paper (next slide) simply shows candidate names and photos
12
Guinea-Bissau ballot paper
13
History of ballots outside of the United States
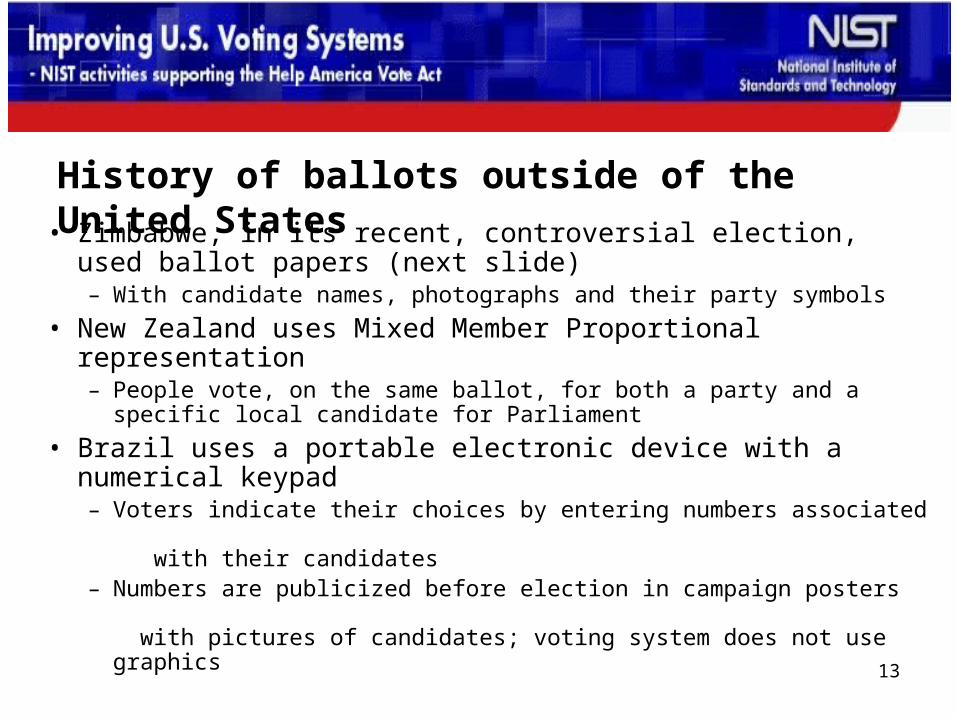
• Zimbabwe, in its recent, controversial election, used ballot papers (next slide)– With candidate names, photographs and their party symbols
• New Zealand uses Mixed Member Proportional representation– People vote, on the same ballot, for both a party and a specific local
candidate for Parliament
• Brazil uses a portable electronic device with a numerical keypad– Voters indicate their choices by entering numbers associated
with their candidates– Numbers are publicized before election in campaign posters
with pictures of candidates; voting system does not use graphics

14
A paper ballot from the controversial 2008 run-off election in Zimbabwe
15
What are potential usability issues for graphics on ballots?
• Use of graphics on ballots has been controversial from the beginning
• We will describe arguments for and against adopting graphics as part of voting systems, particularly in the US– Many issues surrounding use of graphics and implications for
the voter have been resolved, however – New issues related to use of electronic voting technologies as
well as modern printing capabilities have emerged

16
In favor
• Graphics may help people with low reading ability to vote– Voters can recognize party symbol or faces of their preferred
candidates
• Graphics may speed voting for people with good reading ability– People have a remarkable ability to find visual objects – Graphics could help to find the party symbol or candidate quickly
• Graphical user interfaces take advantage of this ability and have become the dominant form of computer interface
17
Against
• Graphics cannot replace words entirely• Ballot questions can be too complex to be translated into
pictures• Graphics are no longer only way for people who cannot
read to vote privately– HAVA requires polling places in US to have at least one accessible
voting station (AVS) – AVS includes an audio interface for voters who cannot see the ballot– Voters who have difficulty reading can also use AVS to vote
independently
18
Against
• Graphics have different appearances on different media and environments
• Paper and electronic systems are not identical– Lighting conditions, visual angle, settings, and wear and tear can alter
images on an electronic display– Alignment errors, variations in ink level, quality, and color blends, and
storage conditions can alter the appearance of printed images– It is difficult to ensure that graphics will appear similar on all machines,
paper ballots, and absentee ballots– Voters who rely on graphics might have difficulty voting if images do not
appear as expected or changed from election to election
19
Against
• Space is at a premium on US ballots– In California gubernatorial recall, there were so many candidates
that they had to be displayed on multiple pages– Any graphics to appear on a ballot must be small, which can
interfere with how recognizable the graphic is – Digital formats resize differently, potentially impacting the quality
of graphics printed at different sizes
• Poorly designed graphics can make it difficult for voters to find candidates they prefer
20
Against
• Providing graphics places extra burdens on candidates and election officials
• Candidates must send the graphics they want to all of the election officials preparing ballots featuring that candidate’s contest
• Election officials must make sure to design the ballot to include these graphics properly– This costs money and takes time– It increases possibility of errors on the ballot and voter confusion
• Voter errors due to poorly designed ballots can be difficult to detect, but can be high enough to affect outcome of an election

21
Party Logos In favor
• Can help voters find their preferred party’s candidates• Can help little-known parties convey a visual message• Symbols can quickly get simple ideas across
22
Party LogosAgainst• Party logos are not standardized
– Democratic donkey and Republican elephant in the US are not standard on ballots
• Competing parties sometimes use similar symbols• Democrats have used a star, flag, Statue of Liberty,
roosters, eagles, and donkeys• Republicans have used eagles and elephants• Libertarian Party used Statue of Liberty in some states
– But in Missouri they used a mule to force Democrats to give up Statue and switch to the well-known donkey
23
Party LogosAgainst
• Party symbols emphasize political parties over individual candidates
• In US political parties are included with candidate’s name– It is ultimately a candidate that is elected, not a party
• Some candidates prefer to use their own logos– Candidates for high office hire graphic designers to create
campaign logos and signs – They might use versions of these symbols in place of generic
party symbols
24
Party LogosAgainst• It is hard to control how a political symbol is used• National parties are protective of their symbols
– Republican Party recently sued cafepress.com for selling goods featuring its elephant logo
• Intellectual property disputes would be likely if party logos became a more important aspect of the electoral process
• Party symbols can be controversial, misleading, or misunderstood– In New York, the Right to Life Party uses a picture of a fetus in
the womb as its ballot symbol– Marijuana Reform Party uses a leaf, presumably representing a
marijuana leaf
25
Candidate PhotographsIn favor
• Candidate photos can help voters find their preferred candidate
• Humans are especially good at recognizing faces• In part, due to specialized brain structures devoted
primarily to face recognition

26
Candidate PhotographsAgainst• Graphical variations can have strong effects on photographs• Pictures may become unrecognizable
– This could skew election even more than hard-to-identify party symbols
– Viewing an LCD screen from an odd angle can cause colors to invert
• Photographs make late changes to the ballot more difficult• Photographs invite prejudices and uninformed decisions
– In recent studies (Todorov, et al., 2005) people were shown pictures of actual candidates in US Senate and House elections
– Participants were not familiar with the candidates, but made judgments based on viewing photographs for a fraction of a second
27
Candidate PhotographsAgainst
• Photographs could encourage snap decision making based on superficial information
• It could facilitate voting based on prejudices about ethnicity, gender, age, or anything else that can be gleaned from a photograph
• Candidates might manipulate photos or use visual codes• Candidates might use photographs from when they were
younger

28
Can ballot graphics help voters with cognitive disabilities?
• Cognitive disabilities are difficulties some people have performing certain mental tasks
• These disabilities may make text-based voting systems difficult to use
• How could graphics on ballots affect voting process for people who have these disabilities?– For accessibility, it is important to understand effects and design
interfaces to make mental tasks easier for people with this disability

29
Who is affected by cognitive disabilities?
• In US learning disabilities affect over 7.5% of population in form of reading difficulties called dyslexia
• Difficulties specific to math and writing also affect some people
• People with learning disabilities have normal or above average intelligence but their specific impairments may persist into adulthood
• Intellectual disabilities are found in about 1% - 3% of the population– Caused by a variety of genetic and environmental factors– Intellectual disabilities can inhibit social behavior in addition to
cognitive skills

30
Designing to accommodate cognitive disabilities
• There are ways of designing technology to be usable by a broad audience– Many innovations improve experience for all users – Using audio and text together may help users with reading
ability, as the audio and text will reinforce each other– Some dyslexics need clear, simple, consistent graphic
navigational icons– Flashing text, font variations, distracting sounds and animations,
and textured, patterned backgrounds will cause problems
31
Plain language makes text easier to understand
• Choose simple words and familiar grammatical structures– US Government moved towards writing documents intended for
public in plain language
• Plain language is not only intended to help people with poor language or reading skills, but also for everyone else
• Short, unambiguous instructions help avoid confusion that leads to spoiled ballots

32
Can ballot graphics help voters with cognitive disabilities?
• It is difficult to know whether graphics would help people by providing an alternative to language, or simply confuse them by adding extraneous information
• Research suggests that for voters with cognitive disabilities, and for all voters, voting technologies must be designed to be universally usable and this includes usability and accessibility of graphical elements

33
What are the directions for future research?
• Analysis reveals the underlying complexity of effect of graphical elements on ballots and electronic voting systems
• Use of graphics on ballots has been suggested as a way to address needs of voters with cognitive disabilities
• However, specific research is needed to establish that graphics indeed will support these voters
• Research does show that basic universal usability concepts and plain language address many of the cognitive issues and is helpful to all voters