Embed Size (px)
Citation preview
Geosciences JournalVol. 20, No. 1, p. 13 26, February 2016DOI 10.1007/s12303-015-0025-2ⓒ The Association of Korean Geoscience Societies and Springer 2016
Implication of the chemical index of alteration as a paleoclimatic perturbation indicator: an example from the lower Neoproterozoic strata of Aksu, Xinjiang, NW China
ABSTRACT: The Neoproterozoic successions in the Aksu region,NW China, which lies unconformably on the Precambrian AksuGroup basement, comprises the Qiaoenbrak, Yuermeinak, Suget-brak, and Chigebrak formations (from bottom to top). The twolowermost units include two distinct glacial diamictites, whichindicate distinct episodes of glaciations. We report the major andtrace element (including rare earth element) data for the Qiaoenbrak,Yuermeinak, and Sugetbrak formations to identify the paleocli-matic perturbations. The chemical index of alteration (CIA) valuesshow variations from Qiaoenbrak to Yuermeinak, then Sugetbrakformations. The diamictites have relatively lower chemical indexof alteration values (45.23–59.64) than inter-, post- and non-glacialsediments (48.28–66.96). This result supported the condition thatthe diamictites underwent relatively weak chemical weathering froma dry-cold sedimentary environment, which is associated with thesedimentary facies description. The lower Neoproterozoic successionsrecoded at least two glaciations, one is Qiaoenbrak glaciation andthe other is Yuermeinak glaciation.
Key words: geochemistry, Neoproterozoic glaciations, palaeoclimate,Aksu, NW China
1. INTRODUCTION
Considerable geological evidence supports that at leastthree glaciations have occurred during the Neoproterozoicperiod (Hoffman and Li, 2009; Halverson et al., 2010; Bus-field and Le Heron, 2014; Kasemann et al., 2014). Severaldiscrete Neoproterozoic diamictites of likely glacial origin areexposed around Tarim Block, Xinjiang, NW China, which canbe corresponded to the Neoproterozoic glaciations fromCryogenian (equivalent to Nanhua in China) to Ediacaran(equivalent to Sinian in China). In these outcrops, the Neo-proterozoic diamictites in Kuluketage, including the Bayixi,Altungal, Tereeken, and Hangelchaok glaciations, are doc-umented in several papers (Xu et al., 2003; Xiao et al., 2004;
Xu et al., 2005; He et al., 2007; Zhan et al., 2007; Xu et al., 2009).The Aksu region, NW of Tarim Block, exposes an extremelythick succession of diamictite, sandstone, and siltstone, whichare thought to have Qiaoenbrak and Yuermeinak glaciationsthat accumulated in the Neoproterozoic period (Gao andQian, 1985).
The major and trace element composition of clastic sed-imentary rocks are useful in crustal evolution studies andprovide constraints on physical and chemical weathering, aswell as sedimentary environment (Nesbitt, 1979; Nesbitt andYoung, 1982, 1984; Taylor and Mclennan, 1985; McLennanand Taylor, 1991; McLennan, 1993; Young and Nesbitt, 1999;Lee, 2002; Young, 2002a; Young et al., 2004; Ghosh and Sarkar,2010). The bulk chemical changes of major elements thatoccur during weathering are used to quantify the weatheringhistory of sedimentary rocks to understand past climatic condi-tions. The importance of chemical weathering increases propor-tionately under humid conditions with the leaching of thealkalis (Na+, K+) and Ca2+, as well as the concentration ofAl and Si in the residue. Conversely, abrasion is the primaryproducer of sediments in a weathering-dominated environ-ment through mechanical breaking of sedimentary rocks intosmaller grains (Goldberg and Humayun, 2010). The chemicalindex of alteration (CIA) values of sediments could reflectthe intensity of chemical weathering and associated climateconditions. Generally, low CIA values indicate a cold-arid cli-matic condition with nearly absence of chemical alteration(Nesbitt et al., 1980; Nesbitt and Young, 1982, 1984; McLen-nan et al., 1993; Young, 1999; Ghosh and Sarkar, 2010; Bahl-burg and Dobrzinski, 2011; Huang et al., 2014). However,the geochemical research for the Neoproterozoic diamictite,including pre-glacial, post-glacial, and interglacial rocks atother areas are scant and necessary to understand the Neo-proterozoic paleoclimatic perturbations in the Aksu region.
In this study, we present the geochemical data for the Qiaoen-
Haifeng Ding*
Dongsheng Ma
Chunyan YaoQizhong LinLinhai Jing }
Institute of Remote Sensing and Digital Earth, Key Laboratory of Digital Earth Science, Chinese Academy of Sciences, Beijing 100094, ChinaState Key Laboratory for Mineral Deposits Research, School of Earth Sciences and Engineering, Nanjing University, Nanjing 210023, China Nanjing Institute of Geology and Mineral Resources, Nanjing 210016, ChinaInstitute of Remote Sensing and Digital Earth, Key Laboratory of Digital Earth Science, Chinese Academy of Sciences, Beijing 100094, China
*Corresponding author: [email protected]
14 Haifeng Ding, Dongsheng Ma, Chunyan Yao, Qizhong Lin, and Linhai Jing
brak, Yuermeinak and Sugetbrak formations of the Neopro-terozoic layer in the Aksu region. The aim of this study is todefine the paleoclimatic perturbation by CIA values duringthe Cryogenian period. And we also compared the CIA valuesof diamictites and other clastic sediments of pre- and post-gla-ciation in previous studies to discuss the use of CIA valuesabout Neoproterozoic glaciations.
2. GEOLOGICAL SETTING AND PETROLOGY
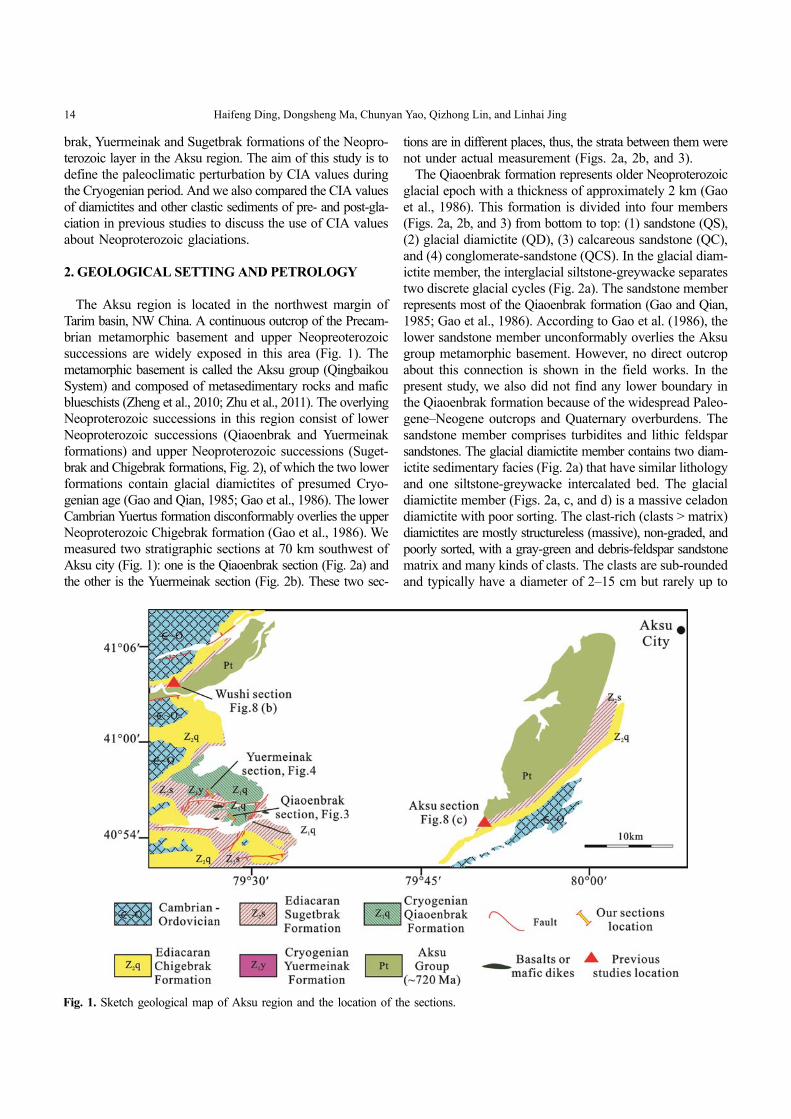
The Aksu region is located in the northwest margin ofTarim basin, NW China. A continuous outcrop of the Precam-brian metamorphic basement and upper Neopreoterozoicsuccessions are widely exposed in this area (Fig. 1). Themetamorphic basement is called the Aksu group (QingbaikouSystem) and composed of metasedimentary rocks and maficblueschists (Zheng et al., 2010; Zhu et al., 2011). The overlyingNeoproterozoic successions in this region consist of lowerNeoproterozoic successions (Qiaoenbrak and Yuermeinakformations) and upper Neoproterozoic successions (Suget-brak and Chigebrak formations, Fig. 2), of which the two lowerformations contain glacial diamictites of presumed Cryo-genian age (Gao and Qian, 1985; Gao et al., 1986). The lowerCambrian Yuertus formation disconformably overlies the upperNeoproterozoic Chigebrak formation (Gao et al., 1986). Wemeasured two stratigraphic sections at 70 km southwest ofAksu city (Fig. 1): one is the Qiaoenbrak section (Fig. 2a) andthe other is the Yuermeinak section (Fig. 2b). These two sec-
tions are in different places, thus, the strata between them werenot under actual measurement (Figs. 2a, 2b, and 3).
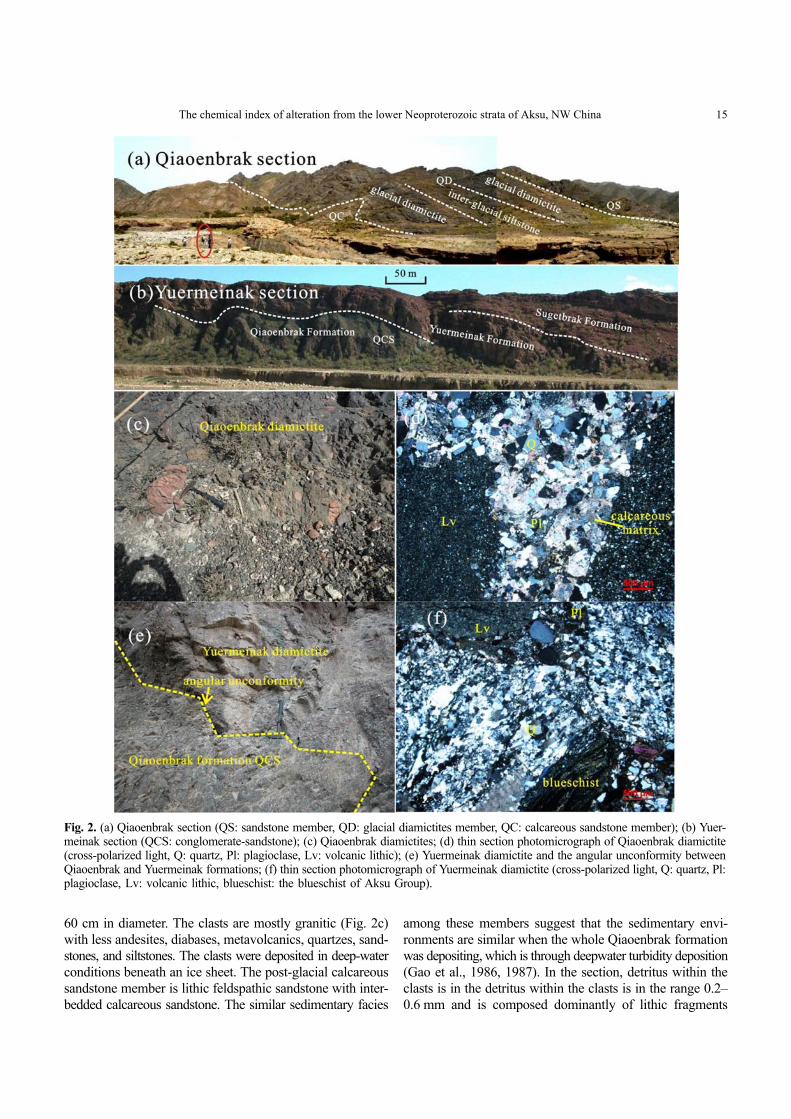
The Qiaoenbrak formation represents older Neoproterozoicglacial epoch with a thickness of approximately 2 km (Gaoet al., 1986). This formation is divided into four members(Figs. 2a, 2b, and 3) from bottom to top: (1) sandstone (QS),(2) glacial diamictite (QD), (3) calcareous sandstone (QC),and (4) conglomerate-sandstone (QCS). In the glacial diam-ictite member, the interglacial siltstone-greywacke separatestwo discrete glacial cycles (Fig. 2a). The sandstone memberrepresents most of the Qiaoenbrak formation (Gao and Qian,1985; Gao et al., 1986). According to Gao et al. (1986), thelower sandstone member unconformably overlies the Aksugroup metamorphic basement. However, no direct outcropabout this connection is shown in the field works. In thepresent study, we also did not find any lower boundary inthe Qiaoenbrak formation because of the widespread Paleo-gene–Neogene outcrops and Quaternary overburdens. Thesandstone member comprises turbidites and lithic feldsparsandstones. The glacial diamictite member contains two diam-ictite sedimentary facies (Fig. 2a) that have similar lithologyand one siltstone-greywacke intercalated bed. The glacialdiamictite member (Figs. 2a, c, and d) is a massive celadondiamictite with poor sorting. The clast-rich (clasts > matrix)diamictites are mostly structureless (massive), non-graded, andpoorly sorted, with a gray-green and debris-feldspar sandstonematrix and many kinds of clasts. The clasts are sub-roundedand typically have a diameter of 2–15 cm but rarely up to
Fig. 1. Sketch geological map of Aksu region and the location of the sections.
The chemical index of alteration from the lower Neoproterozoic strata of Aksu, NW China 15
60 cm in diameter. The clasts are mostly granitic (Fig. 2c)with less andesites, diabases, metavolcanics, quartzes, sand-stones, and siltstones. The clasts were deposited in deep-waterconditions beneath an ice sheet. The post-glacial calcareoussandstone member is lithic feldspathic sandstone with inter-bedded calcareous sandstone. The similar sedimentary facies
among these members suggest that the sedimentary envi-ronments are similar when the whole Qiaoenbrak formationwas depositing, which is through deepwater turbidity deposition(Gao et al., 1986, 1987). In the section, detritus within theclasts is in the detritus within the clasts is in the range 0.2–0.6 mm and is composed dominantly of lithic fragments
Fig. 2. (a) Qiaoenbrak section (QS: sandstone member, QD: glacial diamictites member, QC: calcareous sandstone member); (b) Yuer-meinak section (QCS: conglomerate-sandstone); (c) Qiaoenbrak diamictites; (d) thin section photomicrograph of Qiaoenbrak diamictite(cross-polarized light, Q: quartz, Pl: plagioclase, Lv: volcanic lithic); (e) Yuermeinak diamictite and the angular unconformity betweenQiaoenbrak and Yuermeinak formations; (f) thin section photomicrograph of Yuermeinak diamictite (cross-polarized light, Q: quartz, Pl:plagioclase, Lv: volcanic lithic, blueschist: the blueschist of Aksu Group).
16 Haifeng Ding, Dongsheng Ma, Chunyan Yao, Qizhong Lin, and Linhai Jing
(80–90%) with dominantly plagioclase (mainly with albite,30–50%) and quartz (25–45%), minor sedimentary, meta-morphic and volcanic fragments. The cementation type ofmatrix is porous cement. The cements are chemical sedimentswith some calcareous cementations (Fig. 2d). Siltstone faciesin the lower part and conglomerate facies in the upper partrepresent the conglomerate-siltstone member, which suggeststhat turbidity currents dominated the deposition in a deep-water environment (Gao et al., 1986, 1987). The contact betweenthe conglomerate-siltstone member of the upper Qiaoen-brak formation and overlying lower Yuermeinak formationdiamictites has an angular unconformity (Fig. 2e), whichindicates a significant tectonic event and hiatus between thetwo glacial events.
Yuermeinak formation is thought to represent a youngerdistinct Neoproterozoic glacial epoch in the Aksu area (Gaoet al., 1986) and it overlies the Qiaoenbrak Formation withangular unconformity (Fig. 2e). This formation is composedof purple glacial diamictite. Most of the diamictites are stuc-tureless, weakly stratified, and poorly sorted (Fig. 2e). Angularsubrounded clasts compose 40–50% of the diamictites andinclude quartz, plagioclase, volcanic fragments, and Aksublueschist (Fig. 2f), which is notably absent in older Qiaoen-brak diamictite. The thickness and sedimentary facies of theYuermeinak Formation are highly variable. In our measure-ments, the Yuermeinak Formation consists of glacial diamictitebut is degraded into clast-bearing sandstone in some areas.The Yuermeinak glacial diamictite was likely deposited beneatha continental ice sheet. The different sedimentary facies ofclast bearing and sandstone indicate that these sediments weredeposited at the end of the ice sheet and under the condi-tions of an ice shelf.
The lower Neoproterozoic Sugetbrak formation is 400 mto 450 m thick and composed mainly of the upper part of grayneritic carbonate, lacustrine mudstones with some edgewiseinterbedded limestone, the lower part of red conglomerate, andred fluvial sandstones (Gao et al., 1986; Turner, 2010). The lowerSugetbrak formation paraconformably overlies the Yuermeinakdiamictite (Fig. 2b) in our section (75 km southwest of Aksucity). However, the Sugetbrak formation is in sharp and angularcontact with the Aksu group basement (25 kn southwest ofAksu city).
3. SAMPLING AND ANALYTICAL METHODS
3.1. Sampling
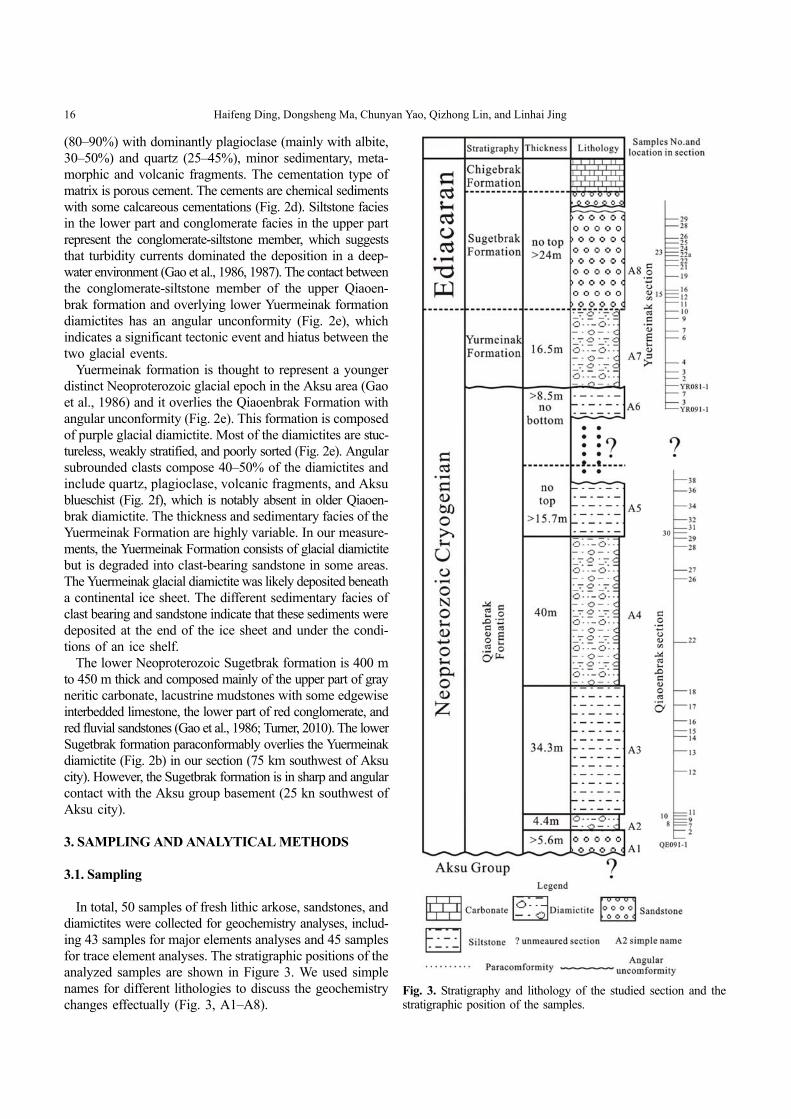
In total, 50 samples of fresh lithic arkose, sandstones, anddiamictites were collected for geochemistry analyses, includ-ing 43 samples for major elements analyses and 45 samplesfor trace element analyses. The stratigraphic positions of theanalyzed samples are shown in Figure 3. We used simplenames for different lithologies to discuss the geochemistrychanges effectually (Fig. 3, A1–A8).
Fig. 3. Stratigraphy and lithology of the studied section and thestratigraphic position of the samples.
The chemical index of alteration from the lower Neoproterozoic strata of Aksu, NW China 17
3.2. Analytical Methods
The samples were first washed in deionized water andthen dried. Diamictites samples were first crushed and thensieved to collect matrix materials (<2 mm). For other lith-ologies, we chose fresh parts for primary bulk crushing. Finally,all samples were pulverized to a 200-mesh in an agate mortarfor chemical analysis.
The major elements were determined at the State KeyLaboratory for Mineral Deposits Research, Nanjing Univer-sity. A 0.1000 g 200-mesh powder was accurately weighedand mixed with 0.125 g of lithium tetraborate, and then themixture was uniformly ground in an agate mortar. The mixedpowder was placed in a Plumbago crucible and heated at1000 °C for 15 min in a muffle furnace. After cooling the cru-cible, the melt columns were removed and placed in 10%hydrochloric acid to dissolve as liquids. The solutions werethen diluted to 100 mL and were analyzed on an ICP-AES(JOBIN YVON, JY38S). The testing errors were less than 2%.
Trace element concentrations were determined using ICP-MS. For each analysis, a 50 mg sample of the 200-mesh pow-der was accurately weighed and placed into a Teflon beaker.
HF (1.0 mL) was then added to the beaker and evaporatedto dryness at 15 °C to remove Si. The sample was then dis-solved in 1.0 mL of HF and 0.6 mL of HNO3, and the mixturewas poured into a Teflon beaker, fitted with a steel bomb,and heated at 190 °C for at least 96 h. The solution was evapo-rated into an emulsion to remove excess HF. The residuewas twice dissolved in 1 mL of concentrated HNO3 and evap-orated into an emulsion. The residue was then dissolved in1.6 mL of HNO3 and heated at 14 °C for 3–5 h and thentransferred to a 50 mL centrifuge tube. The residue was mixedwith 1 mL of 500 ppb Rb Internal Standard, diluted to 50 mLand analyzed using an ICP-MS (FINNIGAN MAT ELEMENT II).Analytical errors for the measured elements were less than 5%.
4. RESULTS
4.1. Major and Trace Elements
The major element compositions and ratios are shown inTable 1. And trace element compositions and ratios are shownin Table 2.
The SiO2 contents of A1–A6 (median range 60.2–67.8 wt%)
Table 1. Major elements and ratios
SiO2 TiO2 Al2O3 Fe2O3T MnO MgO CaO Na2O K2O P2O5 LOI Total ICV CIA Al2O3/
TiO2
K2O/Na2O
SiO2/Al2O3
A8
Median 76.15 0.64 10.4 3.965 0.025 1.29 0.335 2.24 2.085 0.105 2.03 99.81 1.14 62.44 18.00 0.98 7.34
Min 62.25 0.3 6.76 2.54 0.02 0.89 0.24 1.39 1.22 0.08 1.43 99.66 1.07 60.14 14.73 0.73 3.71
Max 85.11 0.93 16.78 6.96 0.05 2.81 0.45 2.56 4.16 0.19 7.54 100.17 1.23 66.96 22.53 1.87 12.59
YR081-29 75.97 0.65 10.25 4.26 0.03 1.46 0.24 2.56 2 0.12 2.24 99.78 1.23 61.1 15.77 0.78 7.41
YR081-28 64.27 0.85 15.48 6.47 0.05 2.81 0.32 2.27 3.49 0.19 3.59 99.79 1.19 66.96 18.21 1.54 4.15
YR081-26 75.7 0.63 10.83 4.03 0.03 1.58 0.33 2.11 2.2 0.12 2.1 99.66 1.14 63.72 17.19 1.04 6.99
YR081-25 76.81 0.57 10.58 3.65 0.02 1.29 0.27 2.25 2.17 0.11 1.97 99.69 1.08 62.76 18.56 0.96 7.26
YR081-24 66.16 0.84 15.08 6.08 0.04 2.18 0.4 2.24 3.61 0.16 2.96 99.75 1.12 65.52 17.95 1.61 4.39
YR081-23 79.34 0.5 9.36 3.43 0.02 0.98 0.33 2.36 1.73 0.09 1.7 99.84 1.1 60.39 18.72 0.73 8.48
YR081-22a 73.66 0.53 9.57 3.27 0.02 1.17 0.3 1.94 1.96 0.1 7.54 100.06 1.07 63.01 18.06 1.01 7.70
YR081-22 62.25 0.93 16.78 6.96 0.05 2.5 0.37 2.22 4.16 0.17 3.38 99.77 1.12 66.59 18.04 1.87 3.71
YR081-21 81.13 0.55 8.1 3.62 0.02 1 0.35 2 1.51 0.08 1.48 99.84 1.23 60.14 14.73 0.76 10.02
YR081-19 76.33 0.68 10.55 4.1 0.03 1.29 0.39 2.27 2.25 0.11 1.83 99.83 1.15 61.46 15.51 0.99 7.24
YR081-16 77.92 0.65 9.87 3.9 0.02 1.16 0.25 2.36 1.93 0.09 1.67 99.82 1.15 61.38 15.18 0.82 7.89
YR081-15 75.54 0.66 10.86 4.18 0.03 1.33 0.45 2.24 2.32 0.1 2.09 99.8 1.14 61.58 16.45 1.04 6.96
YR081-12 85.11 0.3 6.76 2.54 0.02 0.89 0.34 1.39 1.22 0.1 1.43 100.1 1.11 62.91 22.53 0.88 12.59
YR081-11 84.03 0.35 7.12 2.99 0.02 0.91 0.37 1.52 1.3 0.1 1.46 100.17 1.15 62.12 20.34 0.86 11.80
A7
Median 83.8 0.345 6.115 2.535 0.03 0.87 0.505 1.815 0.955 0.08 1.38 99.815 1.375 54.12 18.68 0.54 13.69
Min 74.16 0.28 5.43 2.4 0.02 0.63 0.17 1.53 0.83 0.05 1.14 99.65 1.19 47.79 16.61 0.51 10.84
Max 86.25 0.41 7.55 3.33 0.15 1.03 6.81 1.97 1.05 0.09 6.99 99.85 1.78 59.64 19.39 0.54 14.42
YR081-10 85.73 0.33 6.25 2.4 0.02 0.8 0.17 1.86 0.95 0.07 1.23 99.81 1.19 59.64 18.94 0.51 13.72
YR081-9 86.25 0.36 5.98 2.46 0.02 0.63 0.23 1.77 0.96 0.05 1.14 99.85 1.19 58.46 16.61 0.54 14.42
YR081-7
YR081-6 81.87 0.41 7.55 3.33 0.04 1.03 0.78 1.97 1.05 0.09 1.53 99.65 1.56 49.78 18.41 0.53 10.84
YR081-4
YR081-3 74.16 0.28 5.43 2.61 0.15 0.94 6.81 1.53 0.83 0.09 6.99 99.82 1.78 47.79 19.39 0.54 13.66
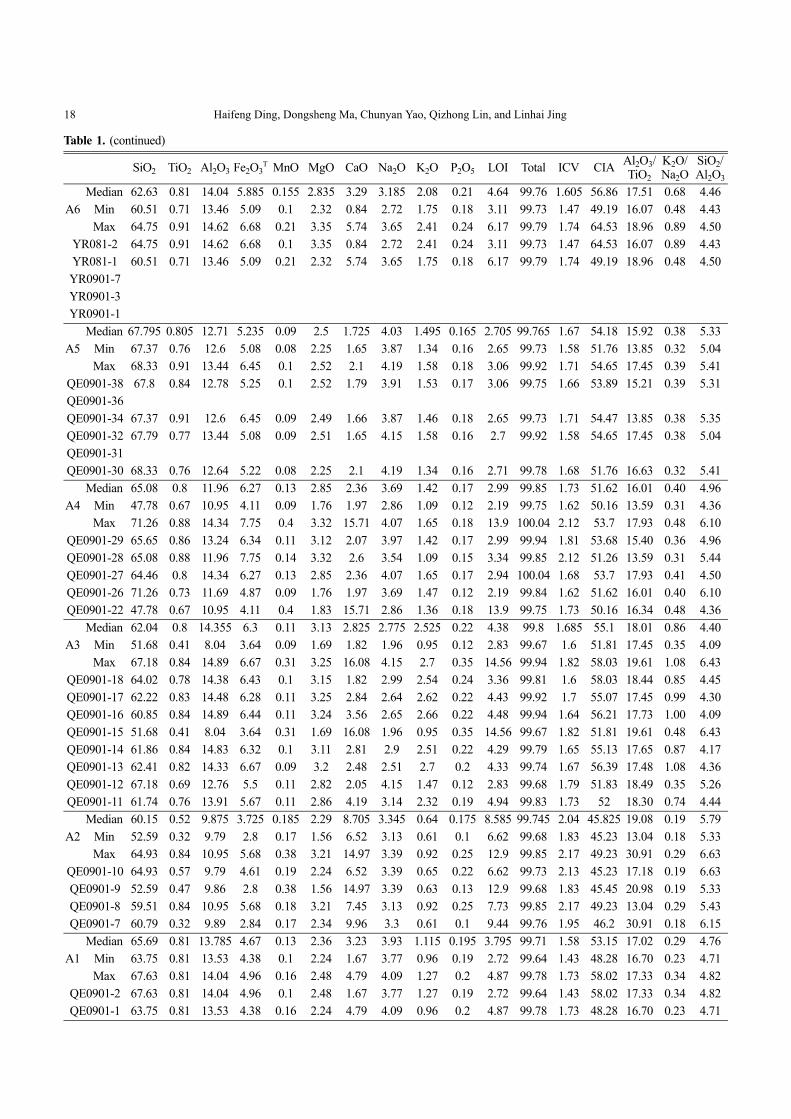
18 Haifeng Ding, Dongsheng Ma, Chunyan Yao, Qizhong Lin, and Linhai Jing
Table 1. (continued)
SiO2 TiO2 Al2O3 Fe2O3T MnO MgO CaO Na2O K2O P2O5 LOI Total ICV CIA Al2O3/
TiO2
K2O/Na2O
SiO2/Al2O3
A6Median 62.63 0.81 14.04 5.885 0.155 2.835 3.29 3.185 2.08 0.21 4.64 99.76 1.605 56.86 17.51 0.68 4.46
Min 60.51 0.71 13.46 5.09 0.1 2.32 0.84 2.72 1.75 0.18 3.11 99.73 1.47 49.19 16.07 0.48 4.43
Max 64.75 0.91 14.62 6.68 0.21 3.35 5.74 3.65 2.41 0.24 6.17 99.79 1.74 64.53 18.96 0.89 4.50YR081-2 64.75 0.91 14.62 6.68 0.1 3.35 0.84 2.72 2.41 0.24 3.11 99.73 1.47 64.53 16.07 0.89 4.43YR081-1 60.51 0.71 13.46 5.09 0.21 2.32 5.74 3.65 1.75 0.18 6.17 99.79 1.74 49.19 18.96 0.48 4.50
YR0901-7YR0901-3YR0901-1
A5Median 67.795 0.805 12.71 5.235 0.09 2.5 1.725 4.03 1.495 0.165 2.705 99.765 1.67 54.18 15.92 0.38 5.33
Min 67.37 0.76 12.6 5.08 0.08 2.25 1.65 3.87 1.34 0.16 2.65 99.73 1.58 51.76 13.85 0.32 5.04Max 68.33 0.91 13.44 6.45 0.1 2.52 2.1 4.19 1.58 0.18 3.06 99.92 1.71 54.65 17.45 0.39 5.41
QE0901-38 67.8 0.84 12.78 5.25 0.1 2.52 1.79 3.91 1.53 0.17 3.06 99.75 1.66 53.89 15.21 0.39 5.31QE0901-36QE0901-34 67.37 0.91 12.6 6.45 0.09 2.49 1.66 3.87 1.46 0.18 2.65 99.73 1.71 54.47 13.85 0.38 5.35
QE0901-32 67.79 0.77 13.44 5.08 0.09 2.51 1.65 4.15 1.58 0.16 2.7 99.92 1.58 54.65 17.45 0.38 5.04QE0901-31QE0901-30 68.33 0.76 12.64 5.22 0.08 2.25 2.1 4.19 1.34 0.16 2.71 99.78 1.68 51.76 16.63 0.32 5.41
A4Median 65.08 0.8 11.96 6.27 0.13 2.85 2.36 3.69 1.42 0.17 2.99 99.85 1.73 51.62 16.01 0.40 4.96
Min 47.78 0.67 10.95 4.11 0.09 1.76 1.97 2.86 1.09 0.12 2.19 99.75 1.62 50.16 13.59 0.31 4.36Max 71.26 0.88 14.34 7.75 0.4 3.32 15.71 4.07 1.65 0.18 13.9 100.04 2.12 53.7 17.93 0.48 6.10
QE0901-29 65.65 0.86 13.24 6.34 0.11 3.12 2.07 3.97 1.42 0.17 2.99 99.94 1.81 53.68 15.40 0.36 4.96QE0901-28 65.08 0.88 11.96 7.75 0.14 3.32 2.6 3.54 1.09 0.15 3.34 99.85 2.12 51.26 13.59 0.31 5.44
QE0901-27 64.46 0.8 14.34 6.27 0.13 2.85 2.36 4.07 1.65 0.17 2.94 100.04 1.68 53.7 17.93 0.41 4.50QE0901-26 71.26 0.73 11.69 4.87 0.09 1.76 1.97 3.69 1.47 0.12 2.19 99.84 1.62 51.62 16.01 0.40 6.10QE0901-22 47.78 0.67 10.95 4.11 0.4 1.83 15.71 2.86 1.36 0.18 13.9 99.75 1.73 50.16 16.34 0.48 4.36
A3Median 62.04 0.8 14.355 6.3 0.11 3.13 2.825 2.775 2.525 0.22 4.38 99.8 1.685 55.1 18.01 0.86 4.40
Min 51.68 0.41 8.04 3.64 0.09 1.69 1.82 1.96 0.95 0.12 2.83 99.67 1.6 51.81 17.45 0.35 4.09Max 67.18 0.84 14.89 6.67 0.31 3.25 16.08 4.15 2.7 0.35 14.56 99.94 1.82 58.03 19.61 1.08 6.43
QE0901-18 64.02 0.78 14.38 6.43 0.1 3.15 1.82 2.99 2.54 0.24 3.36 99.81 1.6 58.03 18.44 0.85 4.45QE0901-17 62.22 0.83 14.48 6.28 0.11 3.25 2.84 2.64 2.62 0.22 4.43 99.92 1.7 55.07 17.45 0.99 4.30QE0901-16 60.85 0.84 14.89 6.44 0.11 3.24 3.56 2.65 2.66 0.22 4.48 99.94 1.64 56.21 17.73 1.00 4.09
QE0901-15 51.68 0.41 8.04 3.64 0.31 1.69 16.08 1.96 0.95 0.35 14.56 99.67 1.82 51.81 19.61 0.48 6.43QE0901-14 61.86 0.84 14.83 6.32 0.1 3.11 2.81 2.9 2.51 0.22 4.29 99.79 1.65 55.13 17.65 0.87 4.17QE0901-13 62.41 0.82 14.33 6.67 0.09 3.2 2.48 2.51 2.7 0.2 4.33 99.74 1.67 56.39 17.48 1.08 4.36
QE0901-12 67.18 0.69 12.76 5.5 0.11 2.82 2.05 4.15 1.47 0.12 2.83 99.68 1.79 51.83 18.49 0.35 5.26QE0901-11 61.74 0.76 13.91 5.67 0.11 2.86 4.19 3.14 2.32 0.19 4.94 99.83 1.73 52 18.30 0.74 4.44
A2
Median 60.15 0.52 9.875 3.725 0.185 2.29 8.705 3.345 0.64 0.175 8.585 99.745 2.04 45.825 19.08 0.19 5.79
Min 52.59 0.32 9.79 2.8 0.17 1.56 6.52 3.13 0.61 0.1 6.62 99.68 1.83 45.23 13.04 0.18 5.33Max 64.93 0.84 10.95 5.68 0.38 3.21 14.97 3.39 0.92 0.25 12.9 99.85 2.17 49.23 30.91 0.29 6.63
QE0901-10 64.93 0.57 9.79 4.61 0.19 2.24 6.52 3.39 0.65 0.22 6.62 99.73 2.13 45.23 17.18 0.19 6.63
QE0901-9 52.59 0.47 9.86 2.8 0.38 1.56 14.97 3.39 0.63 0.13 12.9 99.68 1.83 45.45 20.98 0.19 5.33QE0901-8 59.51 0.84 10.95 5.68 0.18 3.21 7.45 3.13 0.92 0.25 7.73 99.85 2.17 49.23 13.04 0.29 5.43QE0901-7 60.79 0.32 9.89 2.84 0.17 2.34 9.96 3.3 0.61 0.1 9.44 99.76 1.95 46.2 30.91 0.18 6.15
A1Median 65.69 0.81 13.785 4.67 0.13 2.36 3.23 3.93 1.115 0.195 3.795 99.71 1.58 53.15 17.02 0.29 4.76
Min 63.75 0.81 13.53 4.38 0.1 2.24 1.67 3.77 0.96 0.19 2.72 99.64 1.43 48.28 16.70 0.23 4.71Max 67.63 0.81 14.04 4.96 0.16 2.48 4.79 4.09 1.27 0.2 4.87 99.78 1.73 58.02 17.33 0.34 4.82
QE0901-2 67.63 0.81 14.04 4.96 0.1 2.48 1.67 3.77 1.27 0.19 2.72 99.64 1.43 58.02 17.33 0.34 4.82QE0901-1 63.75 0.81 13.53 4.38 0.16 2.24 4.79 4.09 0.96 0.2 4.87 99.78 1.73 48.28 16.70 0.23 4.71
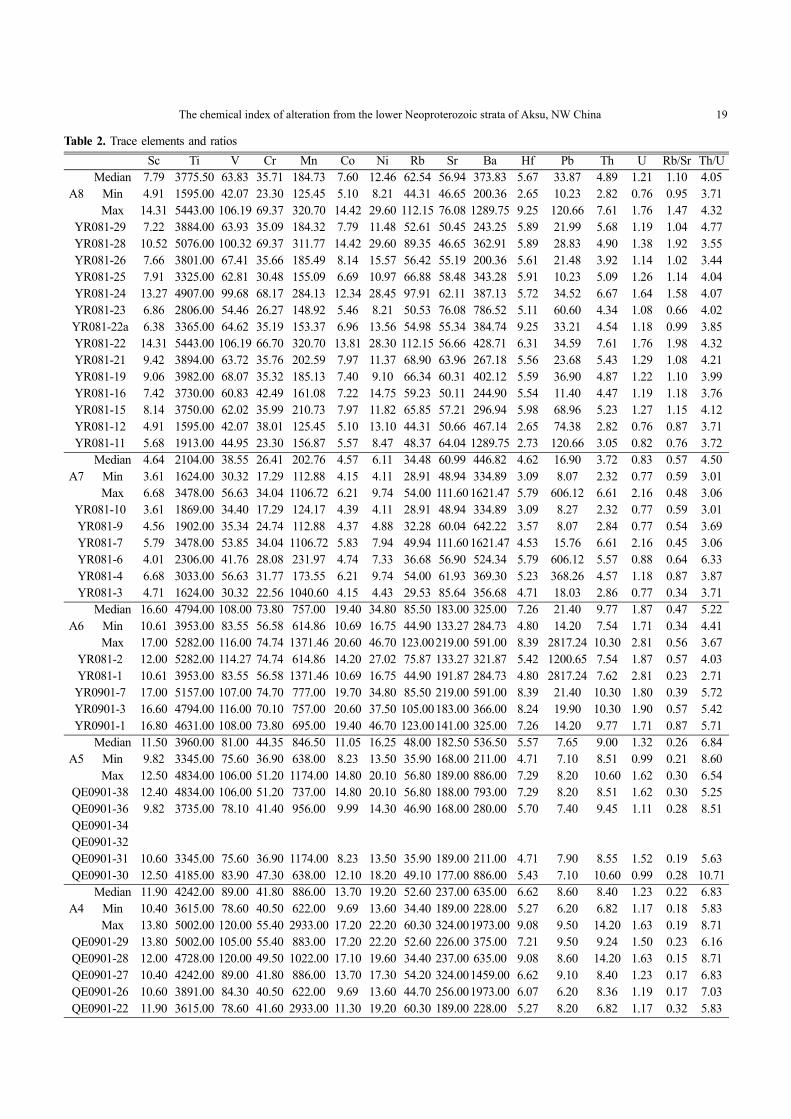
The chemical index of alteration from the lower Neoproterozoic strata of Aksu, NW China 19
Table 2. Trace elements and ratios
Sc Ti V Cr Mn Co Ni Rb Sr Ba Hf Pb Th U Rb/Sr Th/U
A8Median 7.79 3775.50 63.83 35.71 184.73 7.60 12.46 62.54 56.94 373.83 5.67 33.87 4.89 1.21 1.10 4.05
Min 4.91 1595.00 42.07 23.30 125.45 5.10 8.21 44.31 46.65 200.36 2.65 10.23 2.82 0.76 0.95 3.71 Max 14.31 5443.00 106.19 69.37 320.70 14.42 29.60 112.15 76.08 1289.75 9.25 120.66 7.61 1.76 1.47 4.32
YR081-29 7.22 3884.00 63.93 35.09 184.32 7.79 11.48 52.61 50.45 243.25 5.89 21.99 5.68 1.19 1.04 4.77 YR081-28 10.52 5076.00 100.32 69.37 311.77 14.42 29.60 89.35 46.65 362.91 5.89 28.83 4.90 1.38 1.92 3.55 YR081-26 7.66 3801.00 67.41 35.66 185.49 8.14 15.57 56.42 55.19 200.36 5.61 21.48 3.92 1.14 1.02 3.44 YR081-25 7.91 3325.00 62.81 30.48 155.09 6.69 10.97 66.88 58.48 343.28 5.91 10.23 5.09 1.26 1.14 4.04 YR081-24 13.27 4907.00 99.68 68.17 284.13 12.34 28.45 97.91 62.11 387.13 5.72 34.52 6.67 1.64 1.58 4.07 YR081-23 6.86 2806.00 54.46 26.27 148.92 5.46 8.21 50.53 76.08 786.52 5.11 60.60 4.34 1.08 0.66 4.02 YR081-22a 6.38 3365.00 64.62 35.19 153.37 6.96 13.56 54.98 55.34 384.74 9.25 33.21 4.54 1.18 0.99 3.85 YR081-22 14.31 5443.00 106.19 66.70 320.70 13.81 28.30 112.15 56.66 428.71 6.31 34.59 7.61 1.76 1.98 4.32 YR081-21 9.42 3894.00 63.72 35.76 202.59 7.97 11.37 68.90 63.96 267.18 5.56 23.68 5.43 1.29 1.08 4.21 YR081-19 9.06 3982.00 68.07 35.32 185.13 7.40 9.10 66.34 60.31 402.12 5.59 36.90 4.87 1.22 1.10 3.99 YR081-16 7.42 3730.00 60.83 42.49 161.08 7.22 14.75 59.23 50.11 244.90 5.54 11.40 4.47 1.19 1.18 3.76 YR081-15 8.14 3750.00 62.02 35.99 210.73 7.97 11.82 65.85 57.21 296.94 5.98 68.96 5.23 1.27 1.15 4.12 YR081-12 4.91 1595.00 42.07 38.01 125.45 5.10 13.10 44.31 50.66 467.14 2.65 74.38 2.82 0.76 0.87 3.71 YR081-11 5.68 1913.00 44.95 23.30 156.87 5.57 8.47 48.37 64.04 1289.75 2.73 120.66 3.05 0.82 0.76 3.72
A7Median 4.64 2104.00 38.55 26.41 202.76 4.57 6.11 34.48 60.99 446.82 4.62 16.90 3.72 0.83 0.57 4.50
Min 3.61 1624.00 30.32 17.29 112.88 4.15 4.11 28.91 48.94 334.89 3.09 8.07 2.32 0.77 0.59 3.01 Max 6.68 3478.00 56.63 34.04 1106.72 6.21 9.74 54.00 111.60 1621.47 5.79 606.12 6.61 2.16 0.48 3.06
YR081-10 3.61 1869.00 34.40 17.29 124.17 4.39 4.11 28.91 48.94 334.89 3.09 8.27 2.32 0.77 0.59 3.01 YR081-9 4.56 1902.00 35.34 24.74 112.88 4.37 4.88 32.28 60.04 642.22 3.57 8.07 2.84 0.77 0.54 3.69 YR081-7 5.79 3478.00 53.85 34.04 1106.72 5.83 7.94 49.94 111.60 1621.47 4.53 15.76 6.61 2.16 0.45 3.06 YR081-6 4.01 2306.00 41.76 28.08 231.97 4.74 7.33 36.68 56.90 524.34 5.79 606.12 5.57 0.88 0.64 6.33 YR081-4 6.68 3033.00 56.63 31.77 173.55 6.21 9.74 54.00 61.93 369.30 5.23 368.26 4.57 1.18 0.87 3.87 YR081-3 4.71 1624.00 30.32 22.56 1040.60 4.15 4.43 29.53 85.64 356.68 4.71 18.03 2.86 0.77 0.34 3.71
A6Median 16.60 4794.00 108.00 73.80 757.00 19.40 34.80 85.50 183.00 325.00 7.26 21.40 9.77 1.87 0.47 5.22
Min 10.61 3953.00 83.55 56.58 614.86 10.69 16.75 44.90 133.27 284.73 4.80 14.20 7.54 1.71 0.34 4.41 Max 17.00 5282.00 116.00 74.74 1371.46 20.60 46.70 123.00 219.00 591.00 8.39 2817.24 10.30 2.81 0.56 3.67
YR081-2 12.00 5282.00 114.27 74.74 614.86 14.20 27.02 75.87 133.27 321.87 5.42 1200.65 7.54 1.87 0.57 4.03 YR081-1 10.61 3953.00 83.55 56.58 1371.46 10.69 16.75 44.90 191.87 284.73 4.80 2817.24 7.62 2.81 0.23 2.71 YR0901-7 17.00 5157.00 107.00 74.70 777.00 19.70 34.80 85.50 219.00 591.00 8.39 21.40 10.30 1.80 0.39 5.72 YR0901-3 16.60 4794.00 116.00 70.10 757.00 20.60 37.50 105.00 183.00 366.00 8.24 19.90 10.30 1.90 0.57 5.42 YR0901-1 16.80 4631.00 108.00 73.80 695.00 19.40 46.70 123.00 141.00 325.00 7.26 14.20 9.77 1.71 0.87 5.71
A5Median 11.50 3960.00 81.00 44.35 846.50 11.05 16.25 48.00 182.50 536.50 5.57 7.65 9.00 1.32 0.26 6.84
Min 9.82 3345.00 75.60 36.90 638.00 8.23 13.50 35.90 168.00 211.00 4.71 7.10 8.51 0.99 0.21 8.60 Max 12.50 4834.00 106.00 51.20 1174.00 14.80 20.10 56.80 189.00 886.00 7.29 8.20 10.60 1.62 0.30 6.54
QE0901-38 12.40 4834.00 106.00 51.20 737.00 14.80 20.10 56.80 188.00 793.00 7.29 8.20 8.51 1.62 0.30 5.25 QE0901-36 9.82 3735.00 78.10 41.40 956.00 9.99 14.30 46.90 168.00 280.00 5.70 7.40 9.45 1.11 0.28 8.51 QE0901-34QE0901-32QE0901-31 10.60 3345.00 75.60 36.90 1174.00 8.23 13.50 35.90 189.00 211.00 4.71 7.90 8.55 1.52 0.19 5.63 QE0901-30 12.50 4185.00 83.90 47.30 638.00 12.10 18.20 49.10 177.00 886.00 5.43 7.10 10.60 0.99 0.28 10.71
A4Median 11.90 4242.00 89.00 41.80 886.00 13.70 19.20 52.60 237.00 635.00 6.62 8.60 8.40 1.23 0.22 6.83
Min 10.40 3615.00 78.60 40.50 622.00 9.69 13.60 34.40 189.00 228.00 5.27 6.20 6.82 1.17 0.18 5.83 Max 13.80 5002.00 120.00 55.40 2933.00 17.20 22.20 60.30 324.00 1973.00 9.08 9.50 14.20 1.63 0.19 8.71
QE0901-29 13.80 5002.00 105.00 55.40 883.00 17.20 22.20 52.60 226.00 375.00 7.21 9.50 9.24 1.50 0.23 6.16 QE0901-28 12.00 4728.00 120.00 49.50 1022.00 17.10 19.60 34.40 237.00 635.00 9.08 8.60 14.20 1.63 0.15 8.71 QE0901-27 10.40 4242.00 89.00 41.80 886.00 13.70 17.30 54.20 324.00 1459.00 6.62 9.10 8.40 1.23 0.17 6.83 QE0901-26 10.60 3891.00 84.30 40.50 622.00 9.69 13.60 44.70 256.00 1973.00 6.07 6.20 8.36 1.19 0.17 7.03 QE0901-22 11.90 3615.00 78.60 41.60 2933.00 11.30 19.20 60.30 189.00 228.00 5.27 8.20 6.82 1.17 0.32 5.83
20 Haifeng Ding, Dongsheng Ma, Chunyan Yao, Qizhong Lin, and Linhai Jing
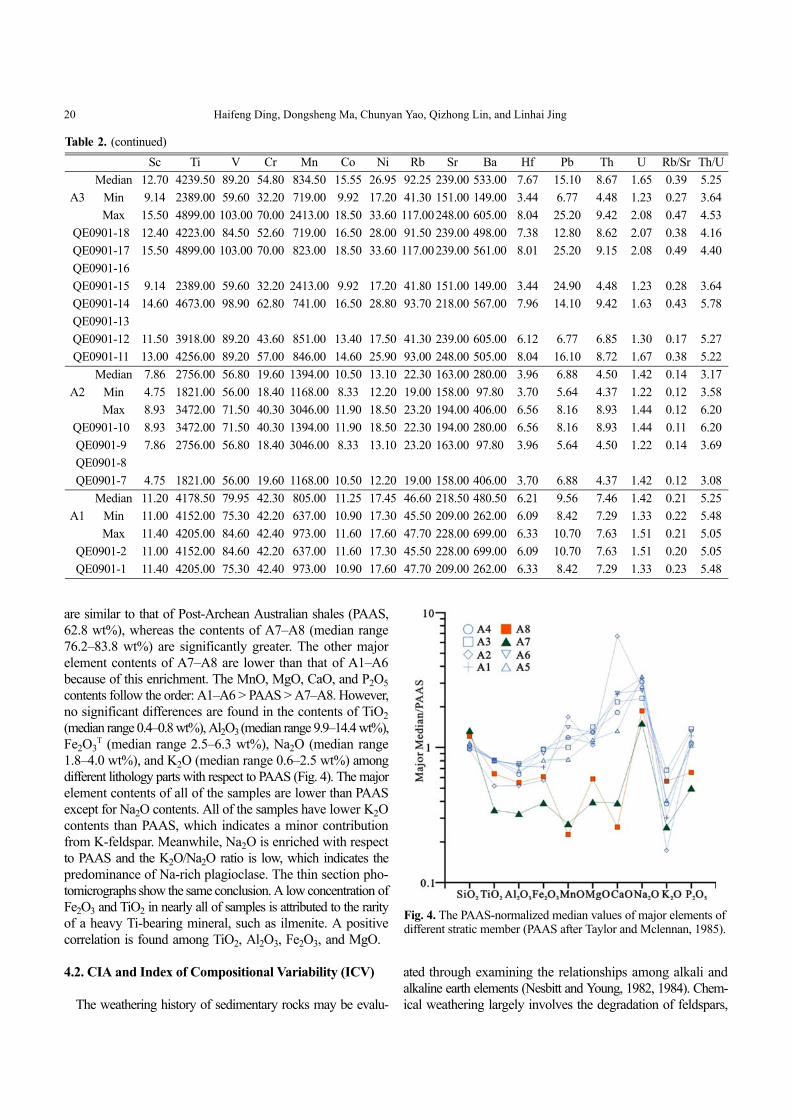
are similar to that of Post-Archean Australian shales (PAAS,62.8 wt%), whereas the contents of A7–A8 (median range76.2–83.8 wt%) are significantly greater. The other majorelement contents of A7–A8 are lower than that of A1–A6because of this enrichment. The MnO, MgO, CaO, and P2O5
contents follow the order: A1–A6 > PAAS > A7–A8. However,no significant differences are found in the contents of TiO2
(median range 0.4–0.8 wt%), Al2O3 (median range 9.9–14.4 wt%),Fe2O3
T (median range 2.5–6.3 wt%), Na2O (median range1.8–4.0 wt%), and K2O (median range 0.6–2.5 wt%) amongdifferent lithology parts with respect to PAAS (Fig. 4). The majorelement contents of all of the samples are lower than PAASexcept for Na2O contents. All of the samples have lower K2Ocontents than PAAS, which indicates a minor contributionfrom K-feldspar. Meanwhile, Na2O is enriched with respectto PAAS and the K2O/Na2O ratio is low, which indicates thepredominance of Na-rich plagioclase. The thin section pho-tomicrographs show the same conclusion. A low concentration ofFe2O3 and TiO2 in nearly all of samples is attributed to the rarityof a heavy Ti-bearing mineral, such as ilmenite. A positivecorrelation is found among TiO2, Al2O3, Fe2O3, and MgO.
4.2. CIA and Index of Compositional Variability (ICV)
The weathering history of sedimentary rocks may be evalu-
ated through examining the relationships among alkali andalkaline earth elements (Nesbitt and Young, 1982, 1984). Chem-ical weathering largely involves the degradation of feldspars,
Table 2. (continued)
Sc Ti V Cr Mn Co Ni Rb Sr Ba Hf Pb Th U Rb/Sr Th/U
A3
Median 12.70 4239.50 89.20 54.80 834.50 15.55 26.95 92.25 239.00 533.00 7.67 15.10 8.67 1.65 0.39 5.25
Min 9.14 2389.00 59.60 32.20 719.00 9.92 17.20 41.30 151.00 149.00 3.44 6.77 4.48 1.23 0.27 3.64
Max 15.50 4899.00 103.00 70.00 2413.00 18.50 33.60 117.00 248.00 605.00 8.04 25.20 9.42 2.08 0.47 4.53
QE0901-18 12.40 4223.00 84.50 52.60 719.00 16.50 28.00 91.50 239.00 498.00 7.38 12.80 8.62 2.07 0.38 4.16
QE0901-17 15.50 4899.00 103.00 70.00 823.00 18.50 33.60 117.00 239.00 561.00 8.01 25.20 9.15 2.08 0.49 4.40
QE0901-16
QE0901-15 9.14 2389.00 59.60 32.20 2413.00 9.92 17.20 41.80 151.00 149.00 3.44 24.90 4.48 1.23 0.28 3.64
QE0901-14 14.60 4673.00 98.90 62.80 741.00 16.50 28.80 93.70 218.00 567.00 7.96 14.10 9.42 1.63 0.43 5.78
QE0901-13
QE0901-12 11.50 3918.00 89.20 43.60 851.00 13.40 17.50 41.30 239.00 605.00 6.12 6.77 6.85 1.30 0.17 5.27
QE0901-11 13.00 4256.00 89.20 57.00 846.00 14.60 25.90 93.00 248.00 505.00 8.04 16.10 8.72 1.67 0.38 5.22
A2
Median 7.86 2756.00 56.80 19.60 1394.00 10.50 13.10 22.30 163.00 280.00 3.96 6.88 4.50 1.42 0.14 3.17
Min 4.75 1821.00 56.00 18.40 1168.00 8.33 12.20 19.00 158.00 97.80 3.70 5.64 4.37 1.22 0.12 3.58
Max 8.93 3472.00 71.50 40.30 3046.00 11.90 18.50 23.20 194.00 406.00 6.56 8.16 8.93 1.44 0.12 6.20
QE0901-10 8.93 3472.00 71.50 40.30 1394.00 11.90 18.50 22.30 194.00 280.00 6.56 8.16 8.93 1.44 0.11 6.20
QE0901-9 7.86 2756.00 56.80 18.40 3046.00 8.33 13.10 23.20 163.00 97.80 3.96 5.64 4.50 1.22 0.14 3.69
QE0901-8
QE0901-7 4.75 1821.00 56.00 19.60 1168.00 10.50 12.20 19.00 158.00 406.00 3.70 6.88 4.37 1.42 0.12 3.08
A1
Median 11.20 4178.50 79.95 42.30 805.00 11.25 17.45 46.60 218.50 480.50 6.21 9.56 7.46 1.42 0.21 5.25
Min 11.00 4152.00 75.30 42.20 637.00 10.90 17.30 45.50 209.00 262.00 6.09 8.42 7.29 1.33 0.22 5.48
Max 11.40 4205.00 84.60 42.40 973.00 11.60 17.60 47.70 228.00 699.00 6.33 10.70 7.63 1.51 0.21 5.05
QE0901-2 11.00 4152.00 84.60 42.20 637.00 11.60 17.30 45.50 228.00 699.00 6.09 10.70 7.63 1.51 0.20 5.05
QE0901-1 11.40 4205.00 75.30 42.40 973.00 10.90 17.60 47.70 209.00 262.00 6.33 8.42 7.29 1.33 0.23 5.48
Fig. 4. The PAAS-normalized median values of major elements ofdifferent stratic member (PAAS after Taylor and Mclennan, 1985).
The chemical index of alteration from the lower Neoproterozoic strata of Aksu, NW China 21
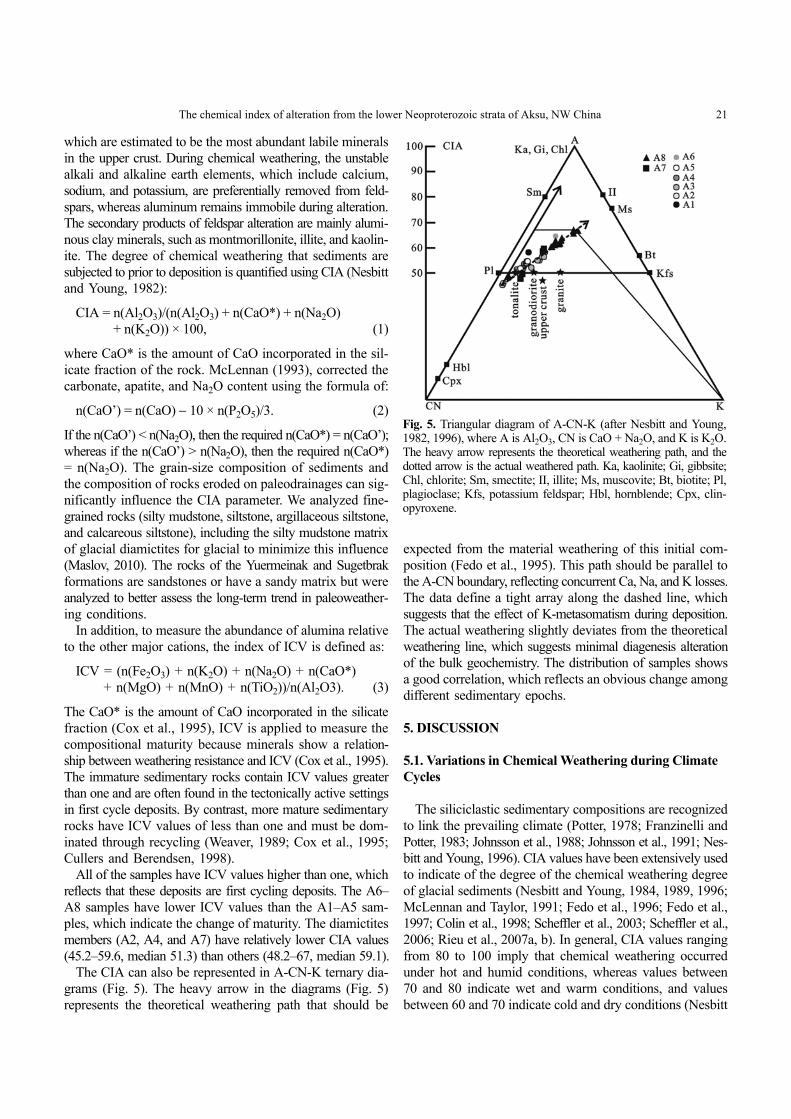
which are estimated to be the most abundant labile mineralsin the upper crust. During chemical weathering, the unstablealkali and alkaline earth elements, which include calcium,sodium, and potassium, are preferentially removed from feld-spars, whereas aluminum remains immobile during alteration.The secondary products of feldspar alteration are mainly alumi-nous clay minerals, such as montmorillonite, illite, and kaolin-ite. The degree of chemical weathering that sediments aresubjected to prior to deposition is quantified using CIA (Nesbittand Young, 1982):
CIA = n(Al2O3)/(n(Al2O3) + n(CaO*) + n(Na2O) + n(K2O)) × 100, (1)
where CaO* is the amount of CaO incorporated in the sil-icate fraction of the rock. McLennan (1993), corrected thecarbonate, apatite, and Na2O content using the formula of:
n(CaO’) = n(CaO) 10 × n(P2O5)/3. (2)
If the n(CaO’) < n(Na2O), then the required n(CaO*) = n(CaO’);whereas if the n(CaO’) > n(Na2O), then the required n(CaO*)= n(Na2O). The grain-size composition of sediments andthe composition of rocks eroded on paleodrainages can sig-nificantly influence the CIA parameter. We analyzed fine-grained rocks (silty mudstone, siltstone, argillaceous siltstone,and calcareous siltstone), including the silty mudstone matrixof glacial diamictites for glacial to minimize this influence(Maslov, 2010). The rocks of the Yuermeinak and Sugetbrakformations are sandstones or have a sandy matrix but wereanalyzed to better assess the long-term trend in paleoweather-ing conditions.
In addition, to measure the abundance of alumina relativeto the other major cations, the index of ICV is defined as:
ICV = (n(Fe2O3) + n(K2O) + n(Na2O) + n(CaO*) + n(MgO) + n(MnO) + n(TiO2))/n(Al2O3). (3)
The CaO* is the amount of CaO incorporated in the silicatefraction (Cox et al., 1995), ICV is applied to measure thecompositional maturity because minerals show a relation-ship between weathering resistance and ICV (Cox et al., 1995).The immature sedimentary rocks contain ICV values greaterthan one and are often found in the tectonically active settingsin first cycle deposits. By contrast, more mature sedimentaryrocks have ICV values of less than one and must be dom-inated through recycling (Weaver, 1989; Cox et al., 1995;Cullers and Berendsen, 1998).
All of the samples have ICV values higher than one, whichreflects that these deposits are first cycling deposits. The A6–A8 samples have lower ICV values than the A1–A5 sam-ples, which indicate the change of maturity. The diamictitesmembers (A2, A4, and A7) have relatively lower CIA values(45.2–59.6, median 51.3) than others (48.2–67, median 59.1).
The CIA can also be represented in A-CN-K ternary dia-grams (Fig. 5). The heavy arrow in the diagrams (Fig. 5)represents the theoretical weathering path that should be
expected from the material weathering of this initial com-position (Fedo et al., 1995). This path should be parallel tothe A-CN boundary, reflecting concurrent Ca, Na, and K losses.The data define a tight array along the dashed line, whichsuggests that the effect of K-metasomatism during deposition.The actual weathering slightly deviates from the theoreticalweathering line, which suggests minimal diagenesis alterationof the bulk geochemistry. The distribution of samples showsa good correlation, which reflects an obvious change amongdifferent sedimentary epochs.
5. DISCUSSION
5.1. Variations in Chemical Weathering during Climate Cycles
The siliciclastic sedimentary compositions are recognizedto link the prevailing climate (Potter, 1978; Franzinelli andPotter, 1983; Johnsson et al., 1988; Johnsson et al., 1991; Nes-bitt and Young, 1996). CIA values have been extensively usedto indicate of the degree of the chemical weathering degreeof glacial sediments (Nesbitt and Young, 1984, 1989, 1996;McLennan and Taylor, 1991; Fedo et al., 1996; Fedo et al.,1997; Colin et al., 1998; Scheffler et al., 2003; Scheffler et al.,2006; Rieu et al., 2007a, b). In general, CIA values rangingfrom 80 to 100 imply that chemical weathering occurredunder hot and humid conditions, whereas values between70 and 80 indicate wet and warm conditions, and valuesbetween 60 and 70 indicate cold and dry conditions (Nesbitt
Fig. 5. Triangular diagram of A-CN-K (after Nesbitt and Young,1982, 1996), where A is Al2O3, CN is CaO + Na2O, and K is K2O.The heavy arrow represents the theoretical weathering path, and thedotted arrow is the actual weathered path. Ka, kaolinite; Gi, gibbsite;Chl, chlorite; Sm, smectite; II, illite; Ms, muscovite; Bt, biotite; Pl,plagioclase; Kfs, potassium feldspar; Hbl, hornblende; Cpx, clin-opyroxene.
22 Haifeng Ding, Dongsheng Ma, Chunyan Yao, Qizhong Lin, and Linhai Jing
and Young, 1982; Fedo et al., 1996; Panahi and Young, 1997;Young and Nesbitt, 1999; Young, 2002a, b). The effects ofchemical weathering on sedimentary rock composition aredependent on climatic conditions and the residence time ofmaterial exposed to chemical weathering while stored incontinental basins (Rieu et al., 2007b). Hence, we must addressthe influence of sediments sources and recycling on the CIAvalues to discuss that if the CIA values could reflect thepaleoclimate. Sedimentary recycling in oxidizing conditionsusually results in the fractionation of Th and U because U4+
is readily oxidized to U6+ during weathering (McLennan andTaylor, 1980; Long et al., 2008). This highly soluble speciescan be removed from the system, whereas Th remains relativelyinsoluble. As a consequence, Th/U ratios increase becauseof the successive weathering and re-deposition cycles, andthus are good indicators of these processes (McLennan andTaylor, 1980; Long et al., 2008). Most Th/U ratios of all ofthe samples and the corresponding median values (Table 2)are close to the average value of the upper crust (3.8, afterTaylor and Mclennan, 1985), which suggests a simple recy-cling history (Long et al., 2008). The Rb/Sr ratios are alsoused to indicate the degree of weathering and re-depositioncycles (Long et al., 2008). In most cases, weathering anddiagenetic processes can lead to a significant increase in theRb/Sr ratios, and high Rb/Sr ratios have been interpreted asan indicator for strong weathering and sedimentary recycling.The median value of the Rb/Sr ratios (0.45) also suggests asimple recycling history compared to upper crust (0.32 afterTaylor and Mclennan, 1985). The geochemical data show thatthe Neoproterozoic sediments experienced a simple recyclinghistory and could reflect the rock sources. However, in thecorrelations diagrams, the lack of correlation between CIA andprovenance indicators (e.g., Th/Sc and Ti/Al, Fig. 6) demon-strates that the first-order changes in CIA reflect weatheringprocesses but not the rock source changes (Taylor and Mclen-
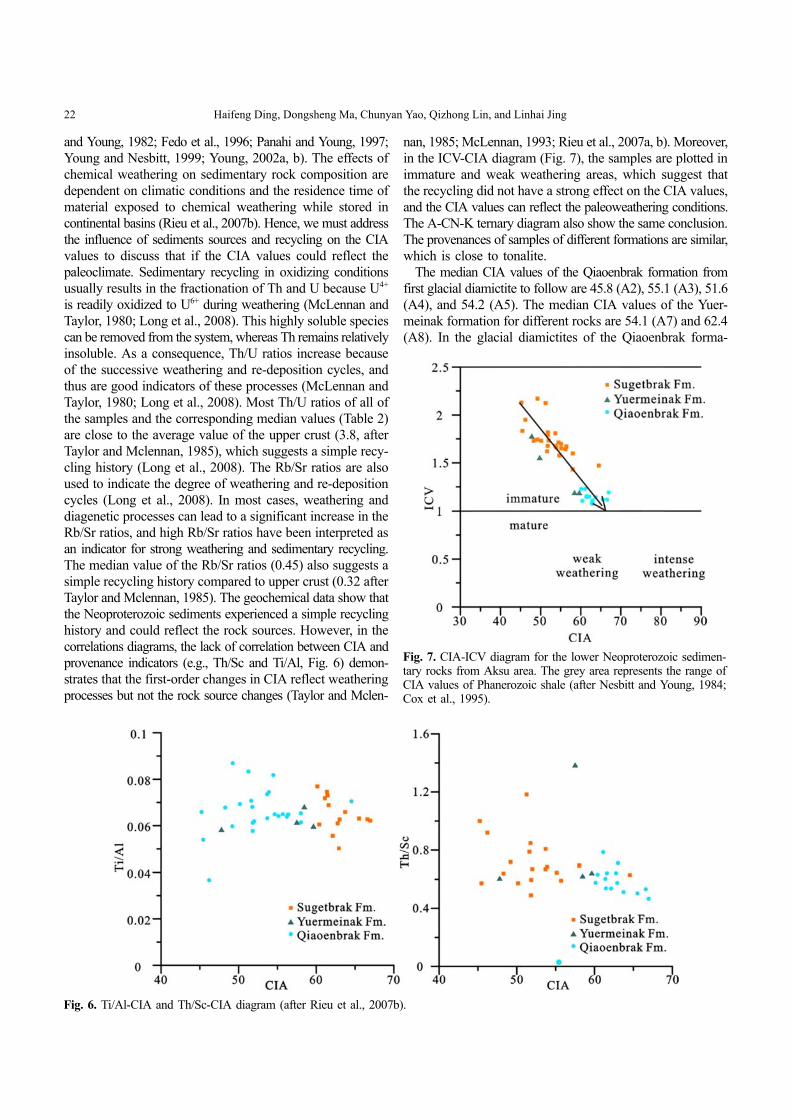
nan, 1985; McLennan, 1993; Rieu et al., 2007a, b). Moreover,in the ICV-CIA diagram (Fig. 7), the samples are plotted inimmature and weak weathering areas, which suggest thatthe recycling did not have a strong effect on the CIA values,and the CIA values can reflect the paleoweathering conditions.The A-CN-K ternary diagram also show the same conclusion.The provenances of samples of different formations are similar,which is close to tonalite.
The median CIA values of the Qiaoenbrak formation fromfirst glacial diamictite to follow are 45.8 (A2), 55.1 (A3), 51.6(A4), and 54.2 (A5). The median CIA values of the Yuer-meinak formation for different rocks are 54.1 (A7) and 62.4(A8). In the glacial diamictites of the Qiaoenbrak forma-
Fig. 6. Ti/Al-CIA and Th/Sc-CIA diagram (after Rieu et al., 2007b).
Fig. 7. CIA-ICV diagram for the lower Neoproterozoic sedimen-tary rocks from Aksu area. The grey area represents the range ofCIA values of Phanerozoic shale (after Nesbitt and Young, 1984;Cox et al., 1995).
The chemical index of alteration from the lower Neoproterozoic strata of Aksu, NW China 23
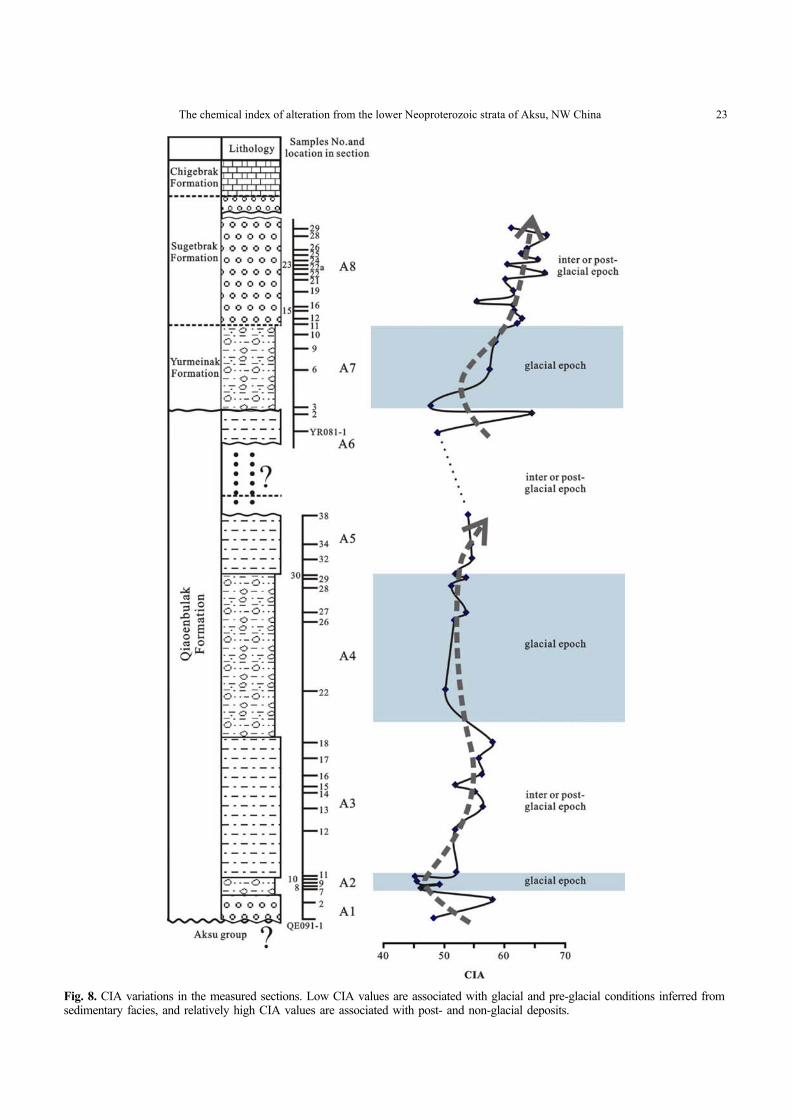
Fig. 8. CIA variations in the measured sections. Low CIA values are associated with glacial and pre-glacial conditions inferred fromsedimentary facies, and relatively high CIA values are associated with post- and non-glacial deposits.
24 Haifeng Ding, Dongsheng Ma, Chunyan Yao, Qizhong Lin, and Linhai Jing
tion, unit A2 is the first glacial epoch, A4 is the second gla-cial epoch, A3 is the inter-glacial epoch between A2 andA4, and A5 is the post-glacial epoch after this complete gla-ciation. In the glacial diamictite of Yuermeinak formation,A7 is the glacial epoch and A8 is the post-glacial epoch.Figure 8 demonstrates variations of weathering conditionsassociated with climate change. Glaciations have low CIAvalues and inter-glacial (or post-glacial) epochs have highCIA values. Moreover, the Yuermeinak and Sugetbrak for-mations have higher CIA values than the Qiaoenbrak for-mation. This result indicates that less chemical weatheringoccurred during glacial times than inter-glacial and post-glacial times, and that the paleoenvironment was colder anddrier during the older (Qiaoenbrak) glaciation than duringthe Yuermeinak glaciation. The change from low median CIAvalues of Qiaoenbrak Formation to intermediate median CIAvalues of Yuermeinak Formation, and then high median CIAvalues of Sugetbrak Formation, suggests enhanced chemicalweathering and gradual climatic amelioration towards aridand cool climatic conditions during the early Neoprotero-zoic strata deposited.
5.2. Implications for Neoproterozoic Glaciations in Aksu Area
In the Neoproterozoic period, the earth experienced anenvironment of a completely frozen Earth from pole toequator and characterized by a hydrological shutdown or amuch-reduced water cycle driven by sublimation (Hoffmanet al., 1998). Although the “Snowball Earth” hypothesis hasbeen questioned, the global sediments record suggests that theabrupt sedimentary change from diamicitites to transgressive,isotopically light cap carbonate and overlying shales, observedin many Neoproterozoic successions world-wide, primarilyreflects post-glacial global warming (Hoffman and Schrag,2002; Rieu et al., 2007b). However, in the northwest of China,around the Tarim Basin, the Neoproterozoic successions con-tain several diamictites lack of cap carbonate after the glacialsediments (e.g., the Qiaoenbrak and Yuermeinak formationsin Aksu area, and the Beiyisi Formation in Kuluketage area).Therefore, in additions to petrology of diamictites, we wantto discuss the implications for Neoproterozoic glaciationsusing the CIA values.
Although the paleo-location and paleogeographic recon-structions for the Neoproterozoic Tarim Block need furtherresearch, the previous paleomagnetic results show that theTarim Block was near equatorial latitudes during the late Neo-proterozoic period (Chen et al., 2004; Huang et al., 2005;Zhan et al., 2007; Li et al., 2008). In the latest research con-tribution, the paleomagnetic results (16.3 ± 5.6°N) from theQiaoenbrak formation constraints the Tarim Block to eitherwest or east of Australia during middle to late Neoproterozoic(Wen et al., 2012). If the reconstruction is accurate, thenpaleoclimatic conditions during the deposition of the Qiaoen-
brak and Yuermeinak formations experienced at least twoglaciations and deposited glacial diamictites. In the Qiaoen-brak Formation, there are two glacial sediments which isalso supported by the CIA values.
Moreover, we used the CIA values of the three Neopro-terozoic diamictites for comparison with the previous pub-lished CIA values of Paleoproterozoic and Neoproterozoicdiamictites. According to previous papers, the CIA valuesvary from 62–80, (Neoproterozoic Dalradian tillite in West-Scotland, Panahi and Young, 1997), 65–70 (NeoproterozoicMineral Fork Formation in northwestern Utah, Young, 2002a),55–81 (Neoproterozoic Hangelchaok tillite in Quruqtagh area,Xinjiang, Li et al., 2004), 53–64 (Neoproterozoic Ayn For-mation in south Oman, Rieu et al., 2007b), and 48–69 (Paleo-proterozoic tillite in Ontario, Canada, Fedo et al., 1995). Thesevalues show a wide range among this research, but previousworks are based on glacial deposits, in terms of lithology andtextures. Thus, some specific parameters, such as rock sources,diagenesis, and recycling, can affect the CIA values, and thechanging trend of CIA can show the changes of paleoweath-ering conditions and paleoclimates. Therefore, it is still needfurther studies to discuss the two glacial sediments reflectedtwo glaciations or two cycles in on glaciation. Because ofthe thin sedimentary thickness (34.3 m field measured), itshould be a paleoclimate change in one glaciation.
6. CONCLUSION
The lack of correlations between CIA values and rocksources factors suggests that CIA values could reflect thepaleoclimate. The diamictite has relatively lower CIA (45.23–59.64) values than inter-, post- and non-glacial sediments(48.28–66.96). This result suggests that the diamictite expe-rienced relatively weak chemical weathering conditions andthe sedimentary environment was dry and cold, which is asso-ciated with the sedimentary facies. The two distinct diamictitesindicate at least two glaciations during Neoproterozoic inAksu area. However, it still needs further researches to dis-cuss the two diamictites outcrops in Qiaoenbrak Formationrepresent two glaciations or a paleoclimate change in oneglaciation. Compared with other CIA values of glacial diamic-tites in other areas in the world, we concluded that rock sources,diagenesis, and recycling can affect the CIA values, but theCIA trend can reflect the change in climate and weatheringconditions. As a conclusion, the results of this study demon-strate that compositional variations in major and trace ele-ment geochemistry may provide useful information whenevaluating the paleoclimatic significance of Neoproterozoicclastic successions.
ACKNOWLEDGMENTS: This study was financially supported bythe China Geological Survey (No. 12120113089200), National BasicResearch Program of China (No. 2007CB411301), National NaturalScience Foundation of China (No. 41171280) and the open funding ofthe State Key Laboratory for Mineral Deposits of Nanjing University.
The chemical index of alteration from the lower Neoproterozoic strata of Aksu, NW China 25
The authors give thanks to Liwen Qiu, Yuping Lin and Tao Yang ofNanjing University for their works of the major and trace elementsanalysis. We are grateful to Dr. Galen P. Halverson of McGill Uni-versity for his useful suggestions and polishing the English.
REFERENCES
Bahlburg, H. and Dobrzinski, N., 2011, A review of the ChemicalIndex of Alteration (CIA) and its application to the study of Neo-proterozoic glacial deposits and climate transitions. In: Arnaud,E., Halverson, G.P., and Shields-Zhou, G. (eds.), The GeologicalRecord of Neoproterozoic Glaciations. Geological Society, Lon-don, p. 81–92.
Busfield, M.E. and Le Heron, D.P., 2014, Sequencing the Sturtianicehouse: dynamic ice behaviour in South Australia. Journal ofthe Geological Society, 171, 443–456.
Chen, Y., Xu, B., Zhan, S., and Li, Y.G., 2004, First mid-Neoprotero-zoic paleomagnetic results from the Tarim Basin (NW China)and their geodynamic implications. Precambrian Research, 133,271–281.
Colin, C., Kissel, C., Blamart, D., and Turpin, L., 1998, Magneticproperties of sediments in the Bay of Bengal and the AndamanSea: impact of rapid North Atlantic Ocean climatic events on thestrength of the Indian monsoon. Earth and Planetary Science Let-ters, 160, 623–635.
Cox, R., Lowe, D.R., and Cullers, R.L., 1995, The Influence of Sed-iment Recycling and Basement Composition on Evolution ofMudrock Chemistry in the Southwestern United-States. Geochim-ica et Cosmochimica Acta, 59, 2919–2940.
Cullers, R.L. and Berendsen, P., 1998, The provenance and chemicalvariation of sandstones associated with the Mid-continent RiftSystem, USA. European Journal of Mineralogy, 10, 987–1002.
Fedo, C.M., Eriksson, K.A., and Krogstad, E.J., 1996, Geochemistryof shales from the Archean (similar to 3.0 Ga) Buhwa greenstonebelt, Zimbabwe: Implications for provenance and source-areaweathering. Geochimica et Cosmochimica Acta, 60, 1751–1763.
Fedo, C.M., Grant, G.M., and Nesbitt, H.W., 1997, Paleoclimaticcontrol on the composition of the Paleoproterozoic Serpent For-mation, Huronian Supergroup, Canada: a greenhouse to icehousetransition. Precambrian Research, 86, 201–223.
Fedo, C.M., Nesbitt, H.W., and Young, G.M., 1995, Unraveling theEffects of Potassium Metasomatism in Sedimentary-Rocks andPaleosols, with Implications for Paleoweathering Conditions andProvenance. Geology, 23, 921–924.
Franzinelli, E. and Potter, P.E., 1983, Petrology, chemistry and textureof modern river sands, Amazon river system. Journal of Geology,91, 23–39.
Gao, Z.J. and Qian, J.X., 1985, Sinian Glacial Deposits in Xinjiang,Northwest China. Precambrian Research, 29, 143–147.
Gao, Z.J., Wang, W.Y., Peng, C.W., Li, Y.A., and Xiao, B., 1986, TheSinian system on Aksu-Wushi region, Xinjiang, China. XinjiangPeople’s Publishing House, Urumuqi, 184 p.
Gao, Z.J., Wang, W.Y., Peng, C.W., Li, Y.A., and Xiao, B., 1987, TheSinian system of Xinjiang. Xinjiang People’s Publishing House,Urumqi, 173 p.
Ghosh, S. and Sarkar, S., 2010, Geochemistry of Permo-Triassicmudstone of the Satpura Gondwana basin, central India: Cluesfor provenance. Chemical Geology, 277, 78–100.
Goldberg, K. and Humayun, M., 2010, The applicability of theChemical Index of Alteration as a paleoclimatic indicator: Anexample from the Permian of the Parana Basin, Brazil. Palaeo-geography Palaeoclimatology Palaeoecology, 293, 175–183.
Halverson, G.P., Wade, B.P., Hurtgen, M.T., and Barovich, K.M.,2010, Neoproterozoic chemostratigraphy. Precambrian Research,182, 337–350.
He, X.B., Xu, B., and Yuan, Z.Y., 2007, C-isotope composition andcorrelation of the Upper Neoproterozoic in Keping area, Xinji-ang. Chinese Science Bulletin, 52, 504–511.
Hoffman, P.F., Kaufman, A.J., Halverson, G.P., and Schrag, D.P.,1998, A Neoproterozoic snowball earth. Science, 281, 1342–1346.
Hoffman, P.F. and Li, Z.X., 2009, A palaeogeographic context forNeoproterozoic glaciation. Palaeogeography PalaeoclimatologyPalaeoecology, 277, 158–172.
Hoffman, P.F. and Schrag, D.P., 2002, The snowball Earth hypoth-esis: testing the limits of global change. Terra Nova, 14, 129–155.
Huang, B.C., Xu, B., Zhang, C.X., Li, Y.A., and Zhu, R.X., 2005,Paleomagnetism of the Baiyisi volcanic rocks (ca. 740 Ma) ofTarim, Northwest China: A continental fragment of neoprotero-zoic Western Australia? Precambrian Research, 142, 83–92.
Huang, J., Feng, L.J., Lu, D.B., Zhang, Q.R., Sun, T., and Chu, X.L.,2014, Multiple climate cooling prior to Sturtian glaciations: Evi-dence from chemical index of alteration of sediments in SouthChina. Scientific Reports, 4, 1–4.
Johnsson, M.J., Stallard, R.F., and Lundberg, N., 1991, Controls onthe composition of fluvial sands from a tropical weathering envi-ronment: sands of the Orinoco River drainage basin, Venezuelaand Columbia. Geological Society of America Bulletin, 103,1622–1647.
Johnsson, M.J., Stallard, R.F., and Meade, R.H., 1988, First-cycle quartzarenites in the Orinoco River basin, Venezuela and Columbia.Journal of Geology, 96, 263–277.
Kasemann, S.A., von Strandmann, P.A.E.P., Prave, A.R., Fallick,A.E., Elliott, T., and Hoffmann, K.H., 2014, Continental weath-ering following a Cryogenian glaciation: Evidence from calciumand magnesium isotopes. Earth and Planetary Science Letters,396, 66–77.
Lee, I.Y., 2002, Provenance derived from the geochemistry of latePaleozoic-early Mesozoic mudrocks of the Pyeongan Supergroup,Korea. Sedimentary Geology, 149, 219–235.
Li, Q.G., Liu, S.W., and Han, B.F., 2004, The geochemical characterof Sinian tillite in Kuruktag, Xinjiang and its implications toprovenance (in Chinese). Progress in Natural Science, 14, 999–1005.
Li, Z.X., Bogdanova, S.V., Collins, A.S., Davidson, A., De Waele, B.,Ernst, R.E., Fitzsimons, I.C.W., Fuck, R.A., Gladkochub, D.P.,Jacobs, J., Karlstrom, K.E., Lu, S., Natapov, L.M., Pease, V., Pis-arevsky, S.A., Thrane, K., and Vernikovsky, V., 2008, Assembly,configuration, and break-up history of Rodinia: A synthesis. Pre-cambrian Research, 160, 179–210.
Long, X.P., Sun, M., Yuan, C., Xiao, W.J., and Cai, K., 2008, EarlyPaleozoic sedimentary record of the Chinese Altai: Implicationsfor its tectonic evolution. Sedimentary Geology, 208, 88–100.
Maslov, A.V., 2010, Glaciogenic and related sedimentary rocks: Mainlithochemical features. Communication 1. Late Archean and Pro-terozoic. Lithology and Mineral Resources, 45, 377–397.
McLennan, S.M., 1993, Weathering and Global Denudation. Journalof Geology, 101, 295–303.
McLennan, S.M., Hemming, S., McDaniel, D.K., and Hanson, G.N.,1993, Geochemical approaches to sedimentation, provenance,and tectonics. Geological Society of America Special Paper, 284,21–40.
McLennan, S.M. and Taylor, S.R., 1980, Th and U in sedimentaryrocks: crustal evolution and sedimentary recycling. Nature, 285,621–624.
McLennan, S.M. and Taylor, S.R., 1991, Sedimentary rocks and crustal
26 Haifeng Ding, Dongsheng Ma, Chunyan Yao, Qizhong Lin, and Linhai Jing
evolution: tectonic setting and secular trends. Journal of Geology,99, 1–21.
Nesbitt, H.W., 1979, Mobility and Fractionation of Rare-Earth Ele-ments during Weathering of a Granodiorite. Nature, 279, 206–210.
Nesbitt, H.W., Markovics, G., and Price, R.C., 1980, Chemical Pro-cesses Affecting Alkalis and Alkaline-Earths during ContinentalWeathering. Geochimica et Cosmochimica Acta, 44, 1659–1666.
Nesbitt, H.W. and Young, G.M., 1982, Early Proterozoic Climatesand Plate Motions Inferred from Major Element Chemistry ofLutites. Nature, 299, 715–717.
Nesbitt, H.W. and Young, G.M., 1984, Prediction of Some WeatheringTrends of Plutonic and Volcanic-Rocks Based on Thermody-namic and Kinetic Considerations. Geochimica et CosmochimicaActa, 48, 1523–1534.
Nesbitt, H.W. and Young, G.M., 1989, Formation and Diagenesis ofWeathering Profiles. Journal of Geology, 97, 129–147.
Nesbitt, H.W. and Young, G.M., 1996, Petrogenesis of sediments inthe absence of chemical weathering: Effects of abrasion and sort-ing on bulk composition and mineralogy. Sedimentology, 43,341–358.
Panahi, A. and Young, G.M., 1997, A geochemical investigation intothe provenance of the Neoproterozoic Port Askaig Tillite, Dal-radian Supergroup, western Scotland. Precambrian Research, 85,81–96.
Potter, P.E., 1978, Petrology and chemistry of modern big riversands. Journal of Geology, 86, 423–449.
Rieu, R., Allen, P.A., Plotze, M., and Pettke, T., 2007a, Climatic cyclesduring a Neoproterozoic “snowball” glacial epoch. Geology, 35,299–302.
Rieu, R., Allen, P.A., Plotze, M., and Pettke, T., 2007b, Composi-tional and mineralogical variations in a Neoproterozoic glaciallyinfluenced succession, Mirbat area, south Oman: Implications forpaleoweathering conditions. Precambrian Research, 154, 248–265.
Scheffler, K., Buehmann, D., and Schwark, L., 2006, Analysis of LatePalaeozoic glacial to postglacial sedimentary successions in SouthAfrica by geochemical proxies – Response to climate evolutionand sedimentary environment. Palaeogeography Palaeoclimatol-ogy Palaeoecology, 240, 184–203.
Scheffler, K., Hoernes, S., and Schwark, L., 2003, Global changesduring Carboniferous-Permian glaciation of Gondwana: Linkingpolar and equatorial climate evolution by geochemical proxies.Geology, 31, 605–608.
Taylor, S.R. and Mclennan, S.M., 1985, The Continental Crust: ItsComposition and Evolution. Blackwell Scientific Publications,Oxford, 312 p.
Turner, S.A., 2010, Sedimentary record of Late Neoproterozoic rift-ing in the NW Tarim Basin, China. Precambrian Research, 181,85–96.
Weaver, C.E., 1989, Clays, muds, and shales. Elsevier, Amsterdam,819 p.
Wen, B., Li, Y.X., and Zhu, W.B., 2012, Peleomagnetism of the Neo-proterozoic Diamictites of the Qiaoenbrak Formation in the AksuArea, NW China: Constraints on the Paleogeographic Position of
the Tarim Block. Precambrian Research, 226, 75–90.Xiao, S.H., Bao, H.M., Wang, H.F., Kaufman, A.J., Zhou, C.M., Li,
G.X., Yuan, X.L., and Ling, H.F., 2004, The NeoproterozoicQuruqtagh Group in eastern Chinese Tianshan: evidence for apost-Marinoan glaciation. Precambrian Research, 130, 1–26.
Xu, B., Jian, P., Zheng, H.F., Zou, H.B., Zhang, L.F., and Liu, D.Y.,2005, U-Pb zircon geochronology and creochemistry of Neopro-terozoic volcanic rocks in the Tarim Block of northwest China:implications for the breakup of Rodinia supercontinent and Neo-proterozoic glaciations. Precambrian Research, 136, 107–123.
Xu, B., Xiao, S.H., Zou, H.B., Chen, Y., Li, Z.X., Song, B., Liu,D.Y., Zhou, C.M., and Yuan, X.L., 2009, SHRIMP zircon U-Pbage constraints on Neoproterozoic Quruqtagh diamictites in NWChina. Precambrian Research, 168, 247–258.
Xu, B., Zheng, H.F., Yao, H.T., and Li, Y.G., 2003, C-isotope com-position and significance of the Sinian on the Tarim plate. Chi-nese Science Bulletin, 48, 385–389.
Young, G.A., Minter, W.L., and Theron, J.N., 2004, Geochemistryand palaeogeography of upper Ordovician glaciogenic sedimen-tary rocks in the Table Mountain Group, South Africa. Palaeo-geography Palaeoclimatology Palaeoecology, 214, 323–345.
Young, G.M., 1999, Some aspects of the geochemistry, provenanceand palaeoclimatology of the Torridonian of NW Scotland. Jour-nal of the Geological Society, 156, 1097–1111.
Young, G.M., 2002a, Geochemical investigation of a Neoproterozoicglacial unit: The Mineral Fork Formation in the Wasatch Range,Utah. Geological Society of America Bulletin, 114, 387–399.
Young, G.M., 2002b, Stratigraphic and tectonic settings of Protero-zoic glaciogenic rocks and banded iron-formations: relevance tothe snowball Earth debate. Journal of African Earth Sciences, 35,451–466.
Young, G.M. and Nesbitt, H.W., 1999, Paleoclimatology and prove-nance of the glaciogenic Gowganda Formation (Paleoproterozoic),Ontario, Canada: A chemostratigraphic approach. Geological Soci-ety of America Bulletin, 111, 264–274.
Zhan, S., Chen, Y., Xu, B., Wang, B., and Faure, M., 2007, Late Neo-proterozoic paleomagnetic results from the Sugetbrak Formationof the Aksu area, Tarim basin (NW China) and their implicationsto paleogeographic reconstructions and the snowball Earth hypoth-esis. Precambrian Research, 154, 143–158.
Zheng, B.H., Zhu, W.B., Jahn, B.M., Shu, L.S., Zhang, Z.Y., and Su,J.B., 2010, Subducted Precambrian oceanic crust: geochemical andSr-Nd isotopic evidence from metabasalts of the Aksu blueschist,NW China. Journal of the Geological Society, 167, 1161–1170.
Zhu, W.B., Zheng, B.H., Shu, L.S., Ma, D.S., Wu, H.L., Li, Y.X.,Huang, W.T., and Yu, J.J., 2011, Neoproterozoic tectonic evolutionof the Precambrian Aksu blueschist terrane, northwestern Tarim,China: Insights from LA-ICP-MS zircon U-Pb ages and geo-chemical data. Precambrian Research, 185, 215–230.
Manuscript received October 22, 2014Manuscript accepted April 14, 2015


![SECTION 17 - airvacuumate.com 17 quick change system ... cylinders tooling ® 17 17:2 ©2011 edco usa. tooling acyl-16x45 qcs-100 qcs-140 axcyl-16x45 & ... [24.6] o-ring](https://img.pdfslide.us/doc/110x75/5acc5fb77f8b9aa1518c3c66/section-17-17-quick-change-system-cylinders-tooling-17-172-2011-edco-usa.jpg)