Embed Size (px)
Citation preview
IMPLEMENTING COMPREHENSIVE
WATERSHED MANAGEMENT
through the
Watershed Management Program
FOR
CITRUS COUNTY
AND
INCORPORATED COMMUNITIES
May 9, 2006
What Does Flood Protection Mean To You?
•Protection of Homes and Structures
•Protection of Areas that Normally, or even Occasionally, Flood
•Loss of Life
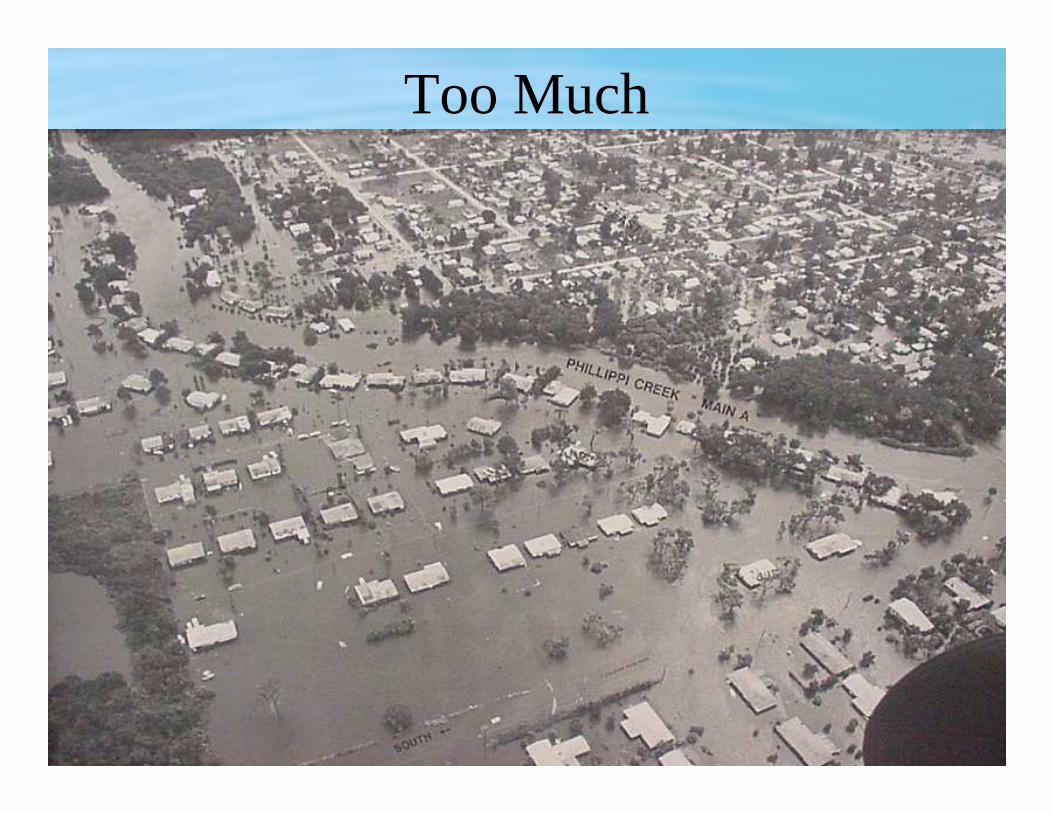
Too Much
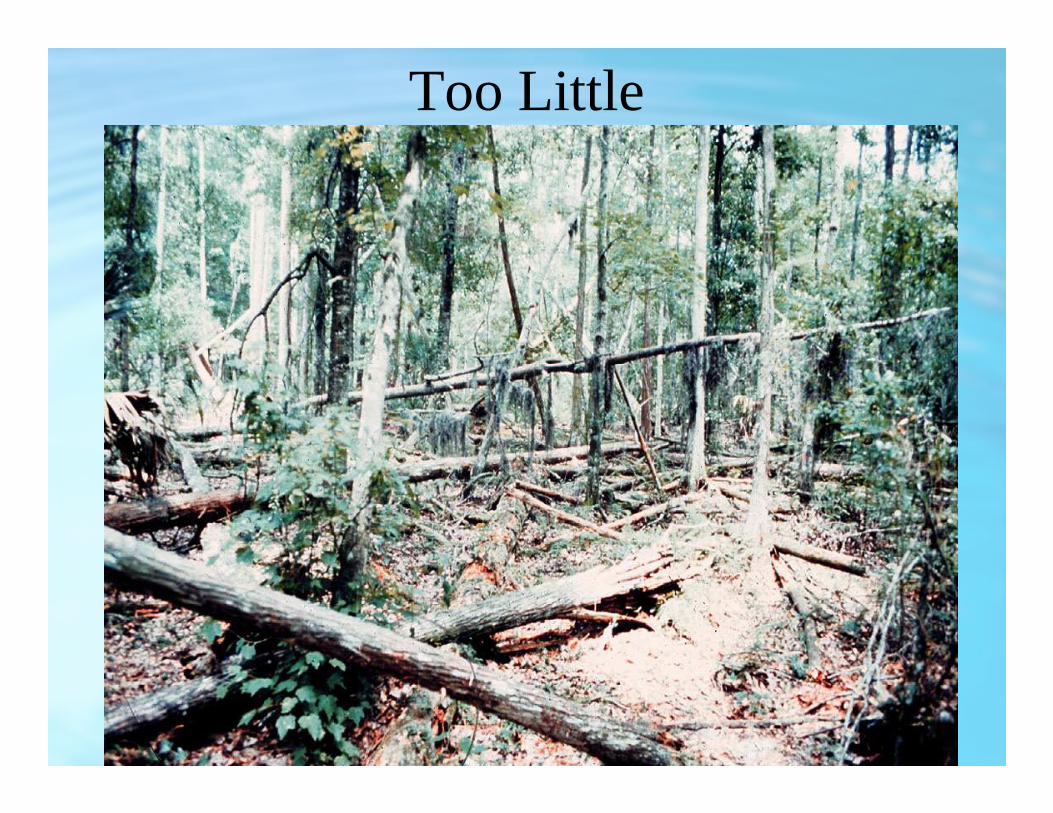
Too Little
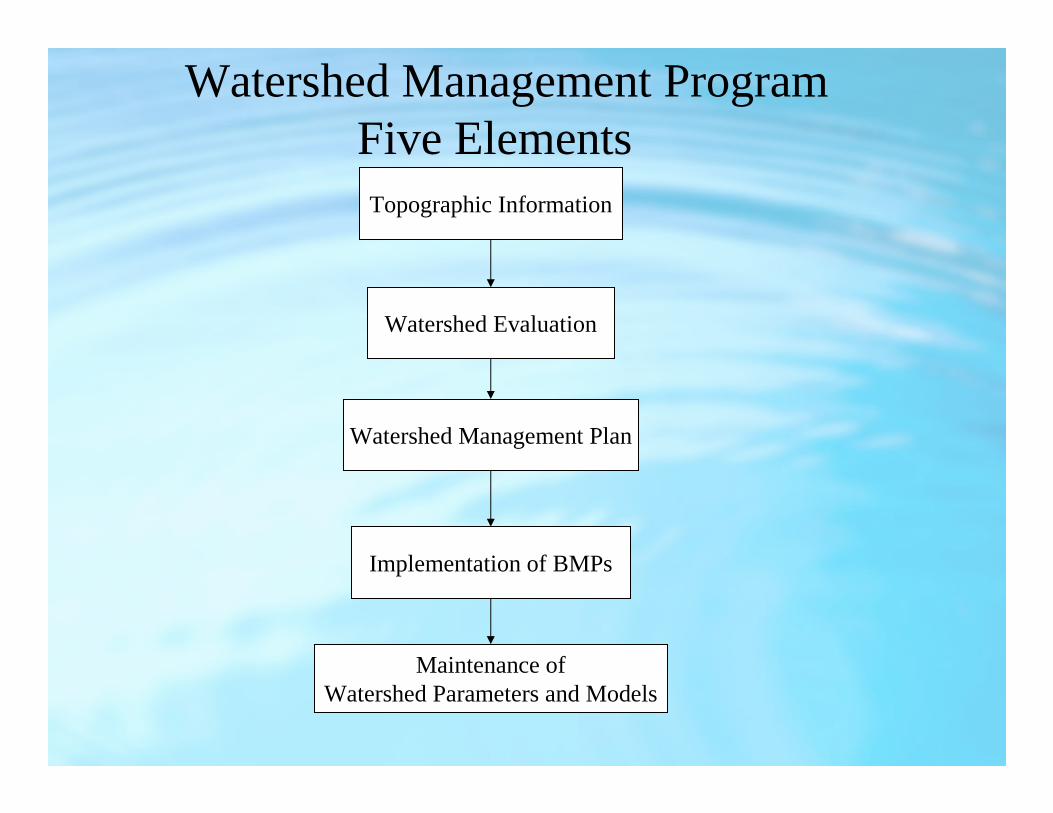
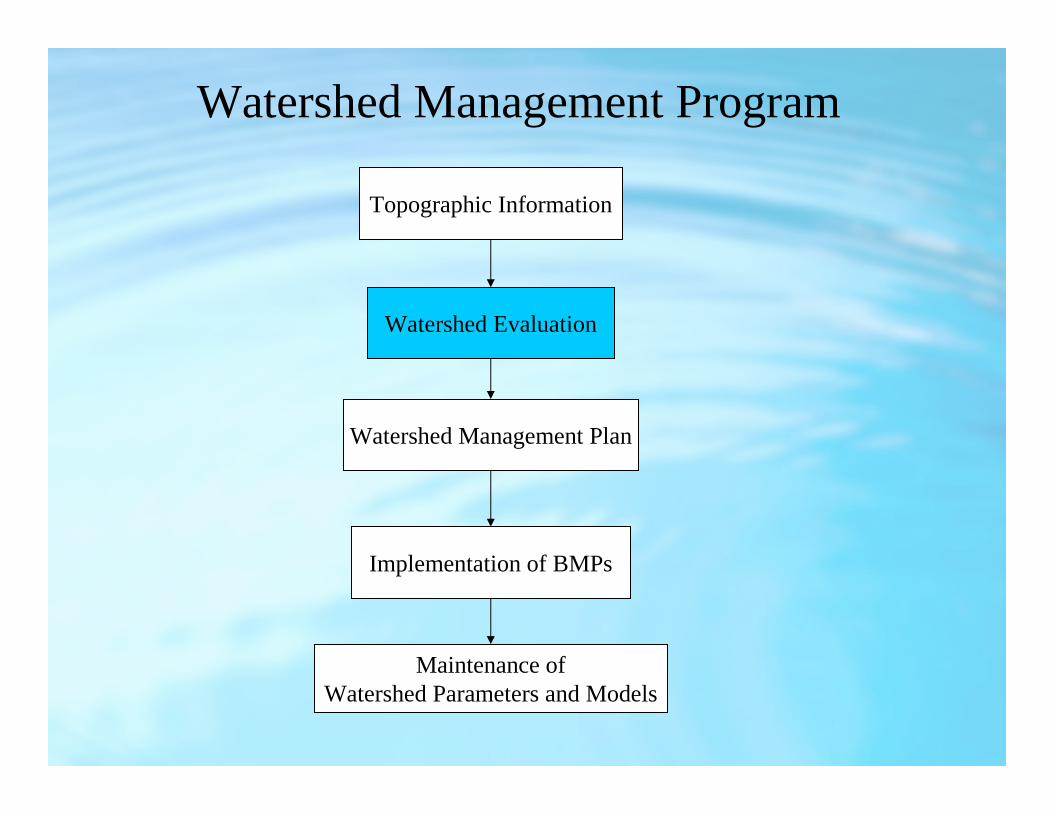
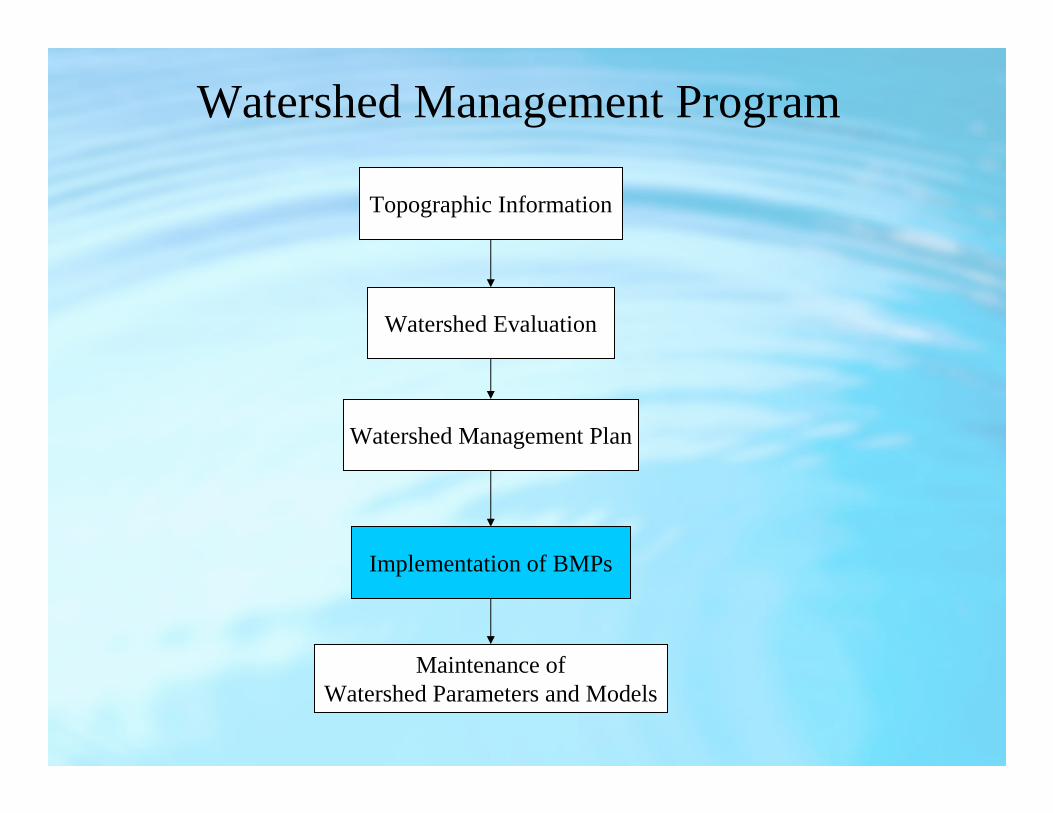
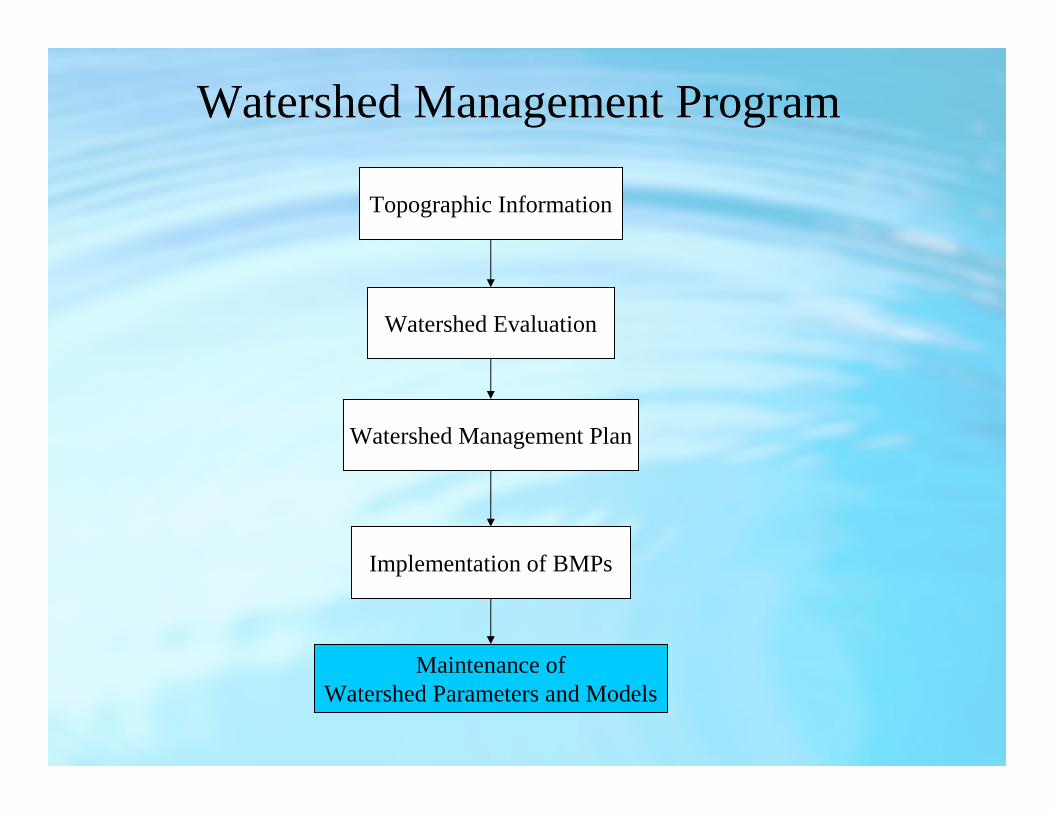
Watershed Evaluation
Watershed Management Plan
Implementation of BMPs
Maintenance ofWatershed Parameters and Models
Topographic Information
Watershed Management ProgramFive Elements

Watershed Evaluation
Watershed Management Plan
Implementation of BMPs
Maintenance ofWatershed Parameters and Models
Topographic Information
Watershed Management ProgramFive Elements
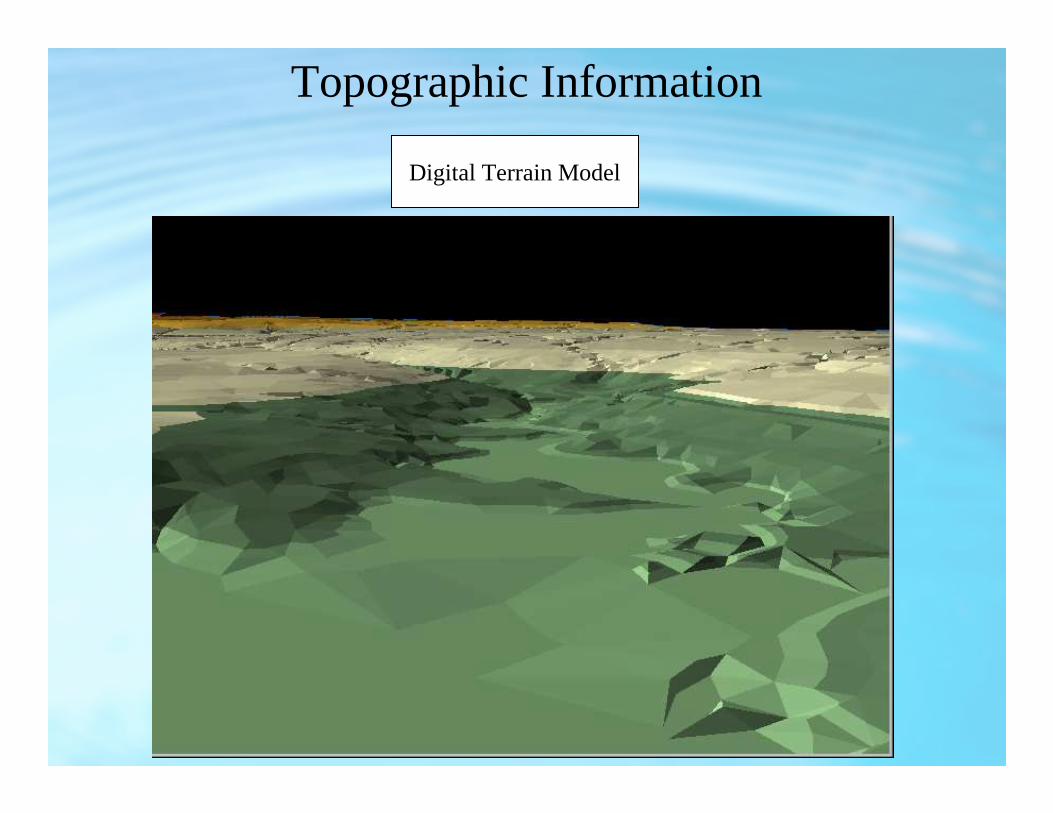
Digital Terrain Model
Topographic Information
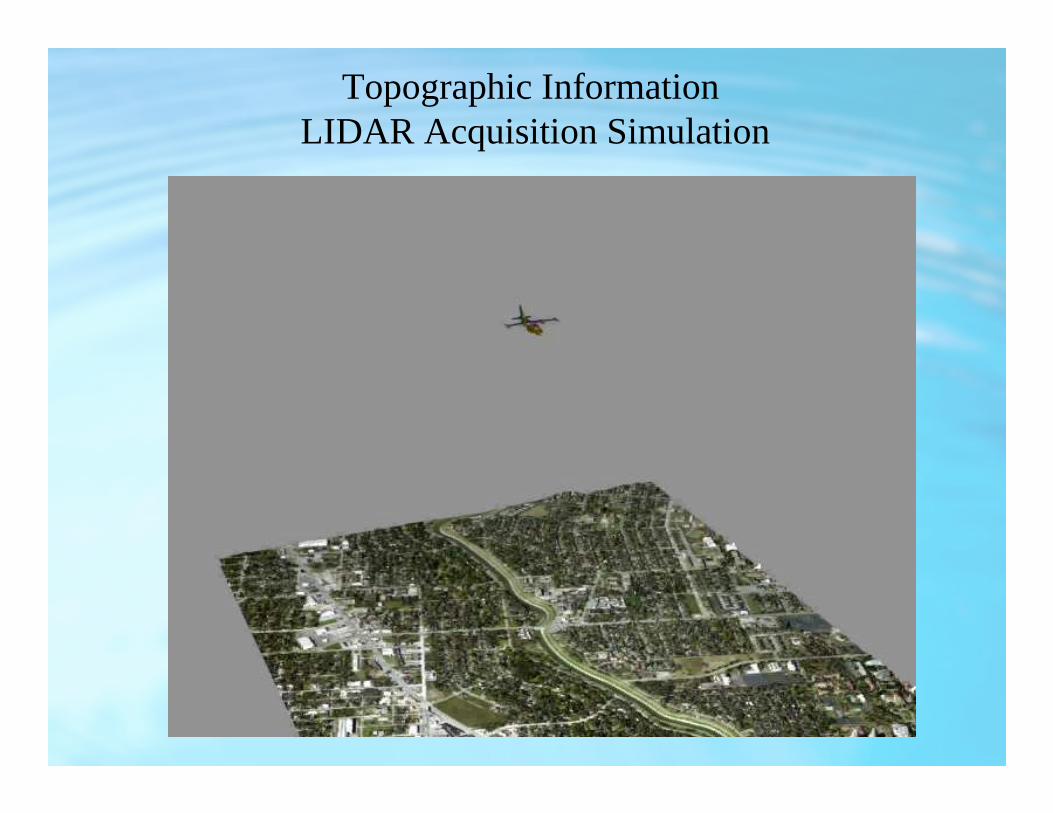
Topographic InformationLIDAR Acquisition Simulation
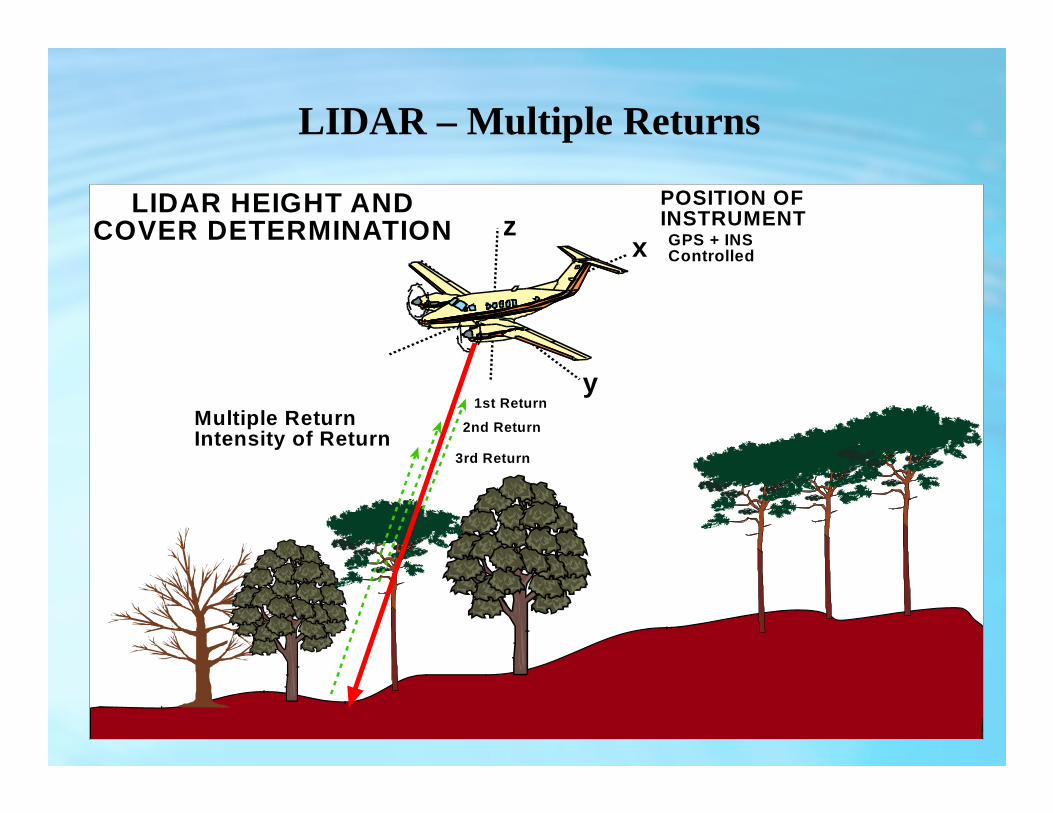
LIDAR – Multiple Returns
zx
y
GPS + INSControlled
1st Return
2nd Return
3rd Return
Multiple ReturnIntensity of Return
POSITION OFINSTRUMENT
LIDAR HEIGHT ANDCOVER DETERMINATION
Watershed Evaluation
Watershed Management Plan
Implementation of BMPs
Maintenance ofWatershed Parameters and Models
Topographic Information
Watershed Management Program
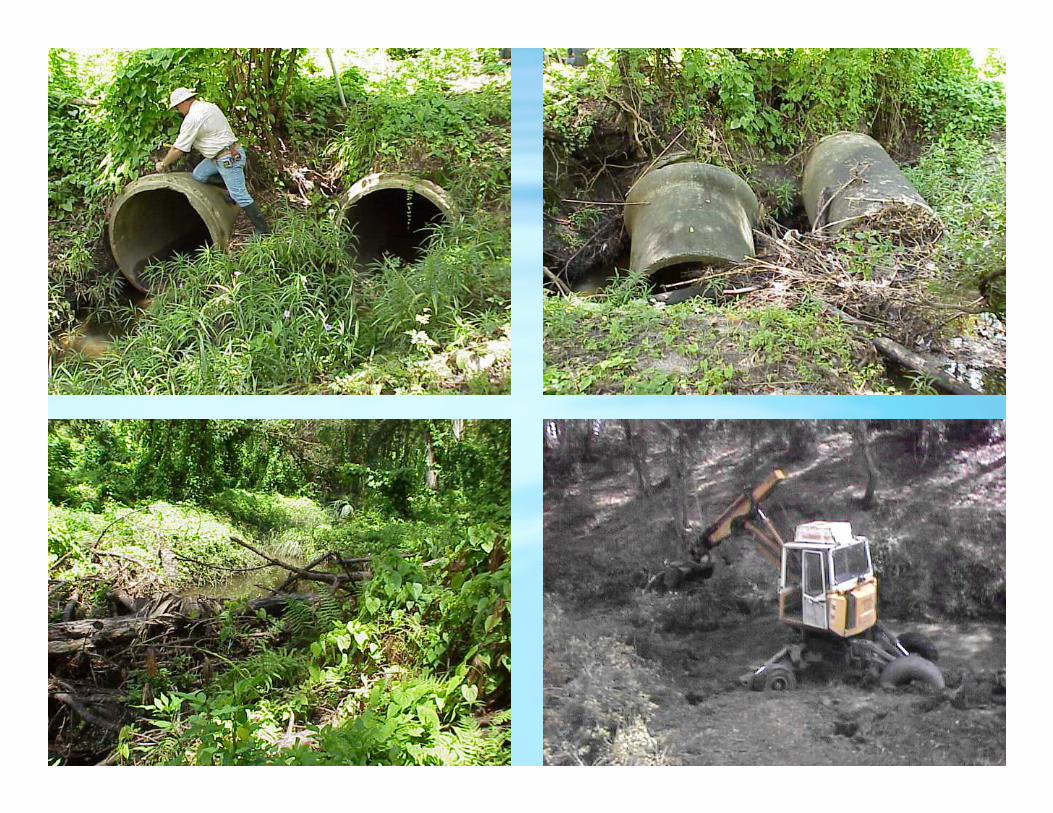
Pictures of a Watershed Evaluation

Watershed Evaluation
Watershed Management Plan
Implementation of BMPs
Watershed Model Updates
Topographic Information
Watershed Management Program
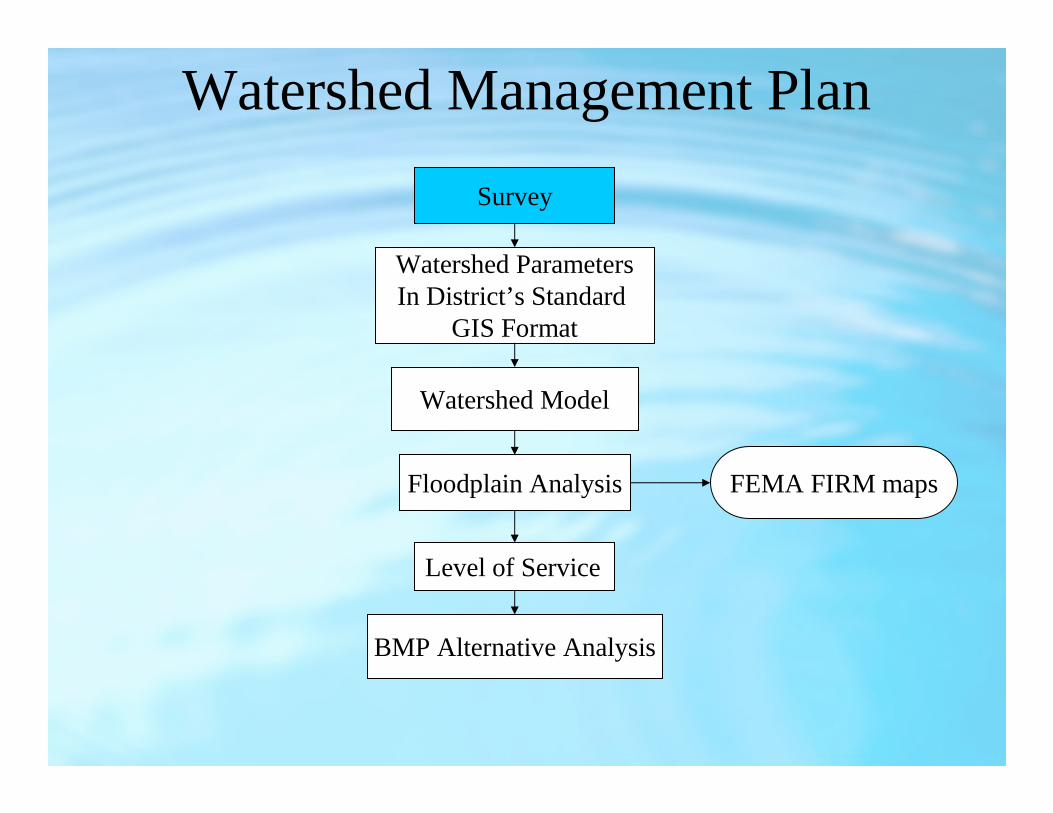
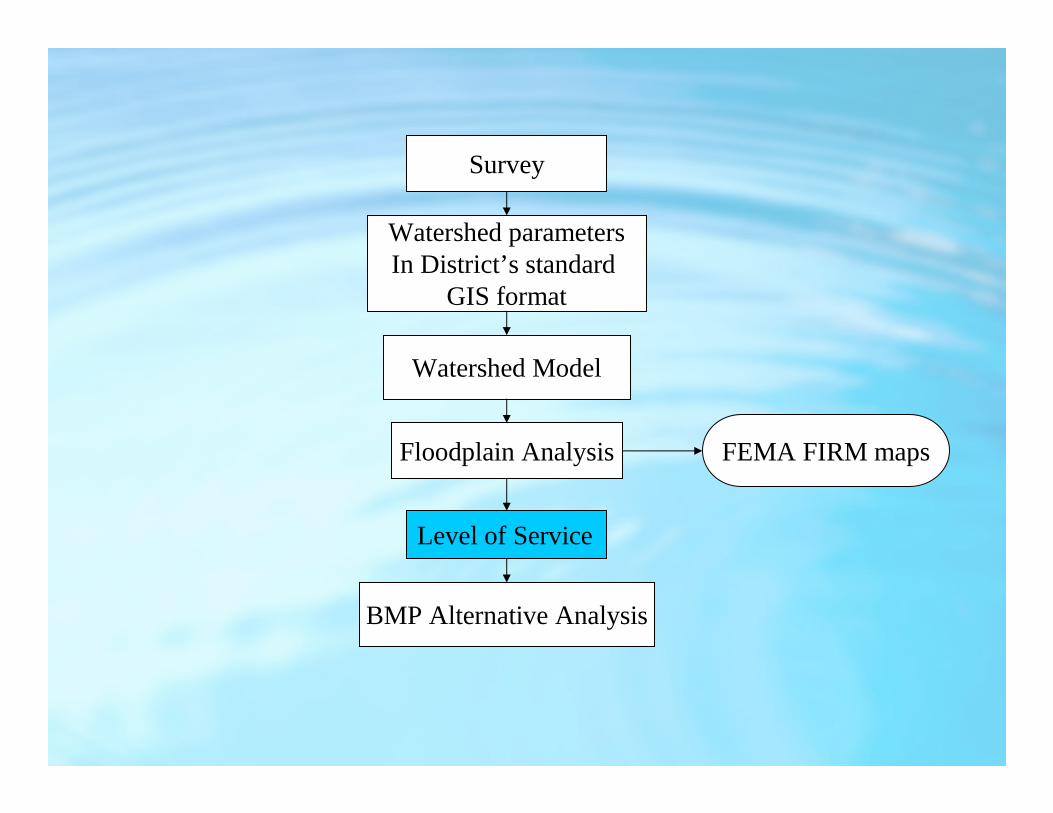
Watershed Model
Floodplain Analysis
Level of Service
BMP Alternative Analysis
Survey
Watershed ParametersIn District’s Standard
GIS Format
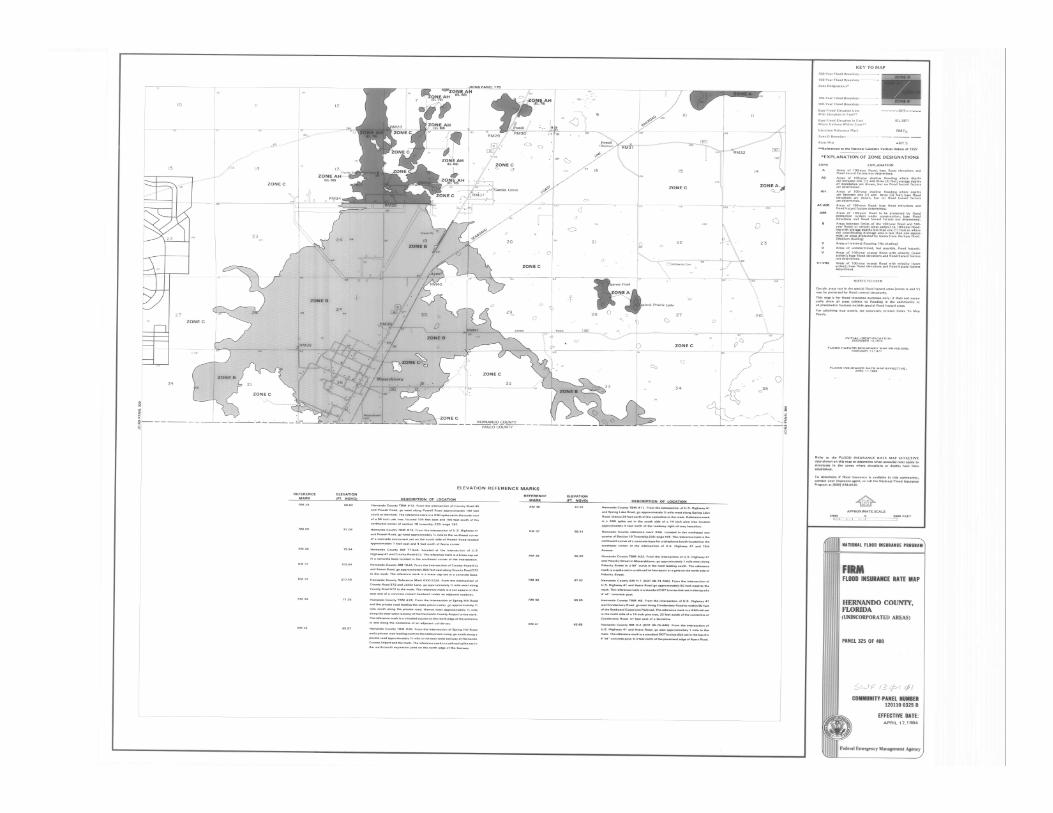
FEMA FIRM maps
Watershed Management Plan
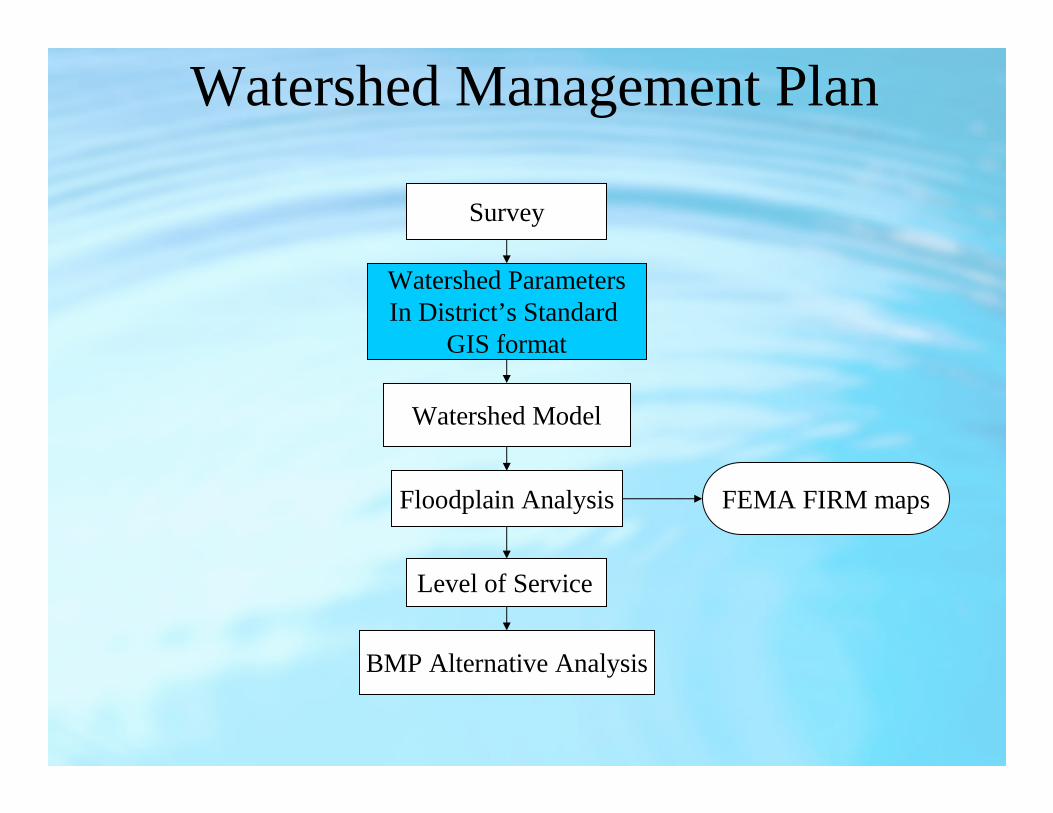
Watershed Management Plan
Watershed Model
Floodplain Analysis
Level of Service
BMP Alternative Analysis
Survey
Watershed ParametersIn District’s Standard
GIS format
FEMA FIRM maps
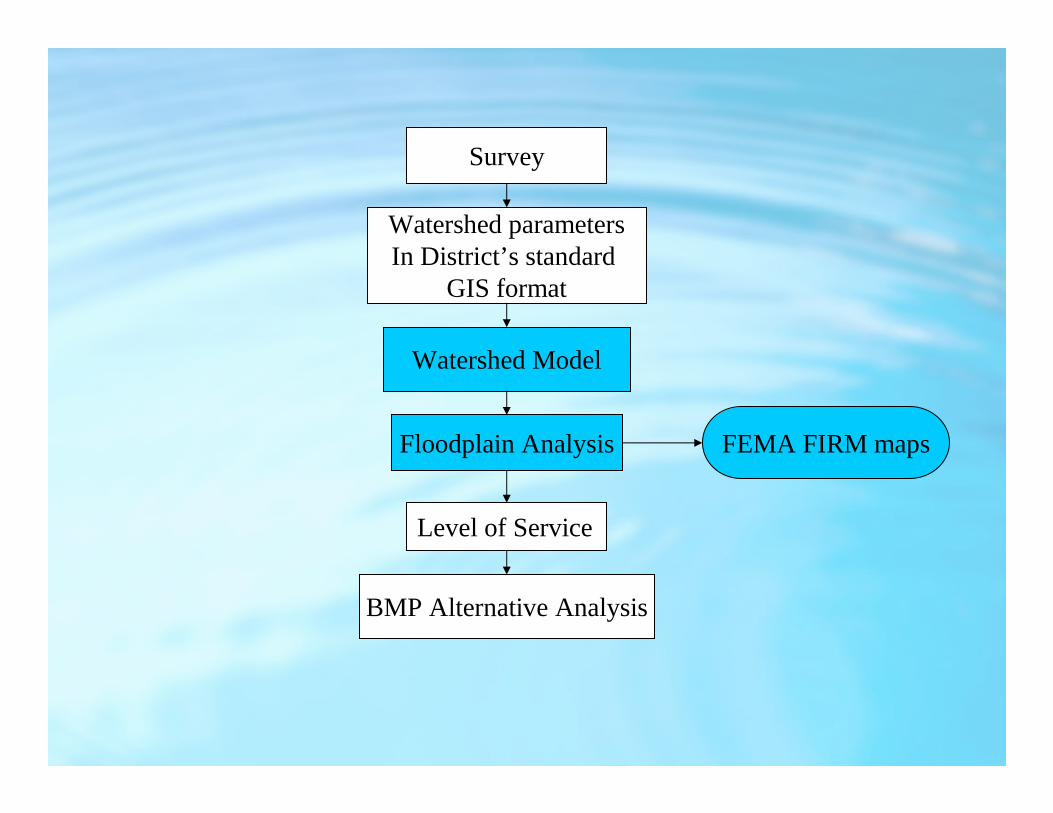
Watershed Model
Floodplain Analysis
Level of Service
BMP Alternative Analysis
Survey
Watershed parametersIn District’s standard
GIS format
FEMA FIRM maps
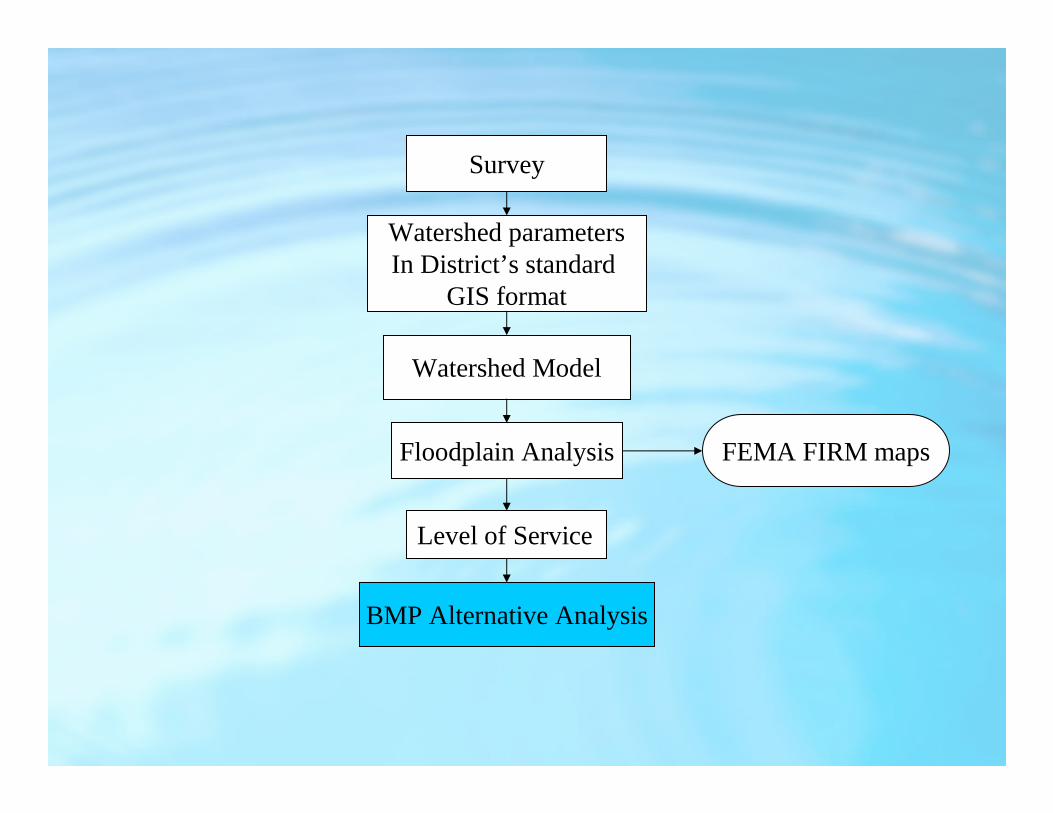
Watershed Model
Floodplain Analysis
Level of Service
BMP Alternative Analysis
Survey
Watershed parametersIn District’s standard
GIS format
FEMA FIRM maps
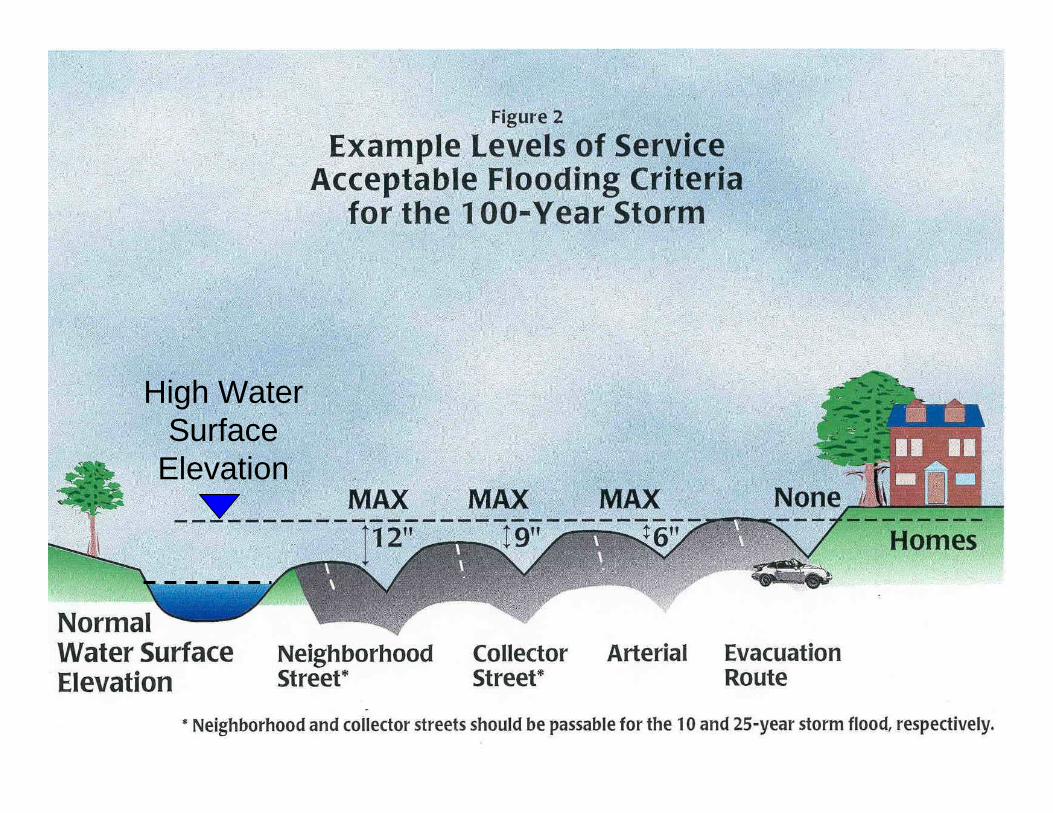
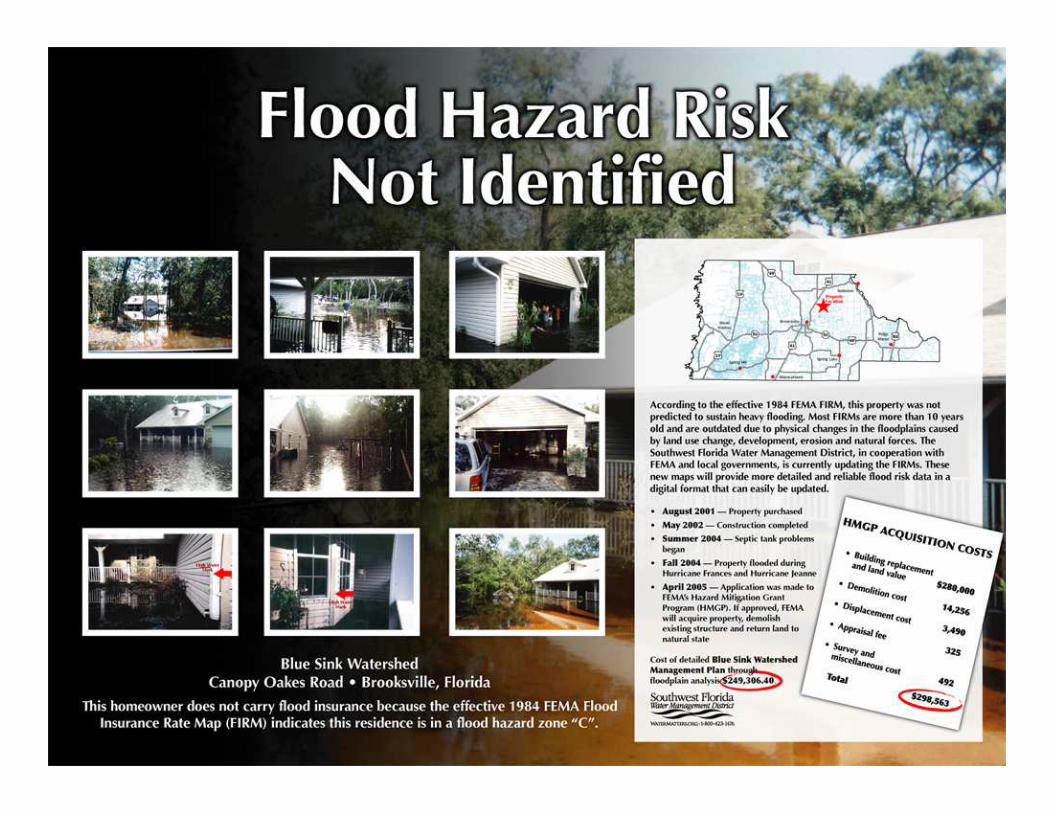
High Water Surface
Elevation
Watershed Model
Floodplain Analysis
Level of Service
BMP Alternative Analysis
Survey
Watershed parametersIn District’s standard
GIS format
FEMA FIRM maps
Watershed Evaluation
Watershed Management Plan
Implementation of BMPs
Maintenance ofWatershed Parameters and Models
Topographic Information
Watershed Management Program
Watershed Evaluation
Watershed Management Plan
Implementation of BMPs
Maintenance ofWatershed Parameters and Models
Topographic Information
Watershed Management Program
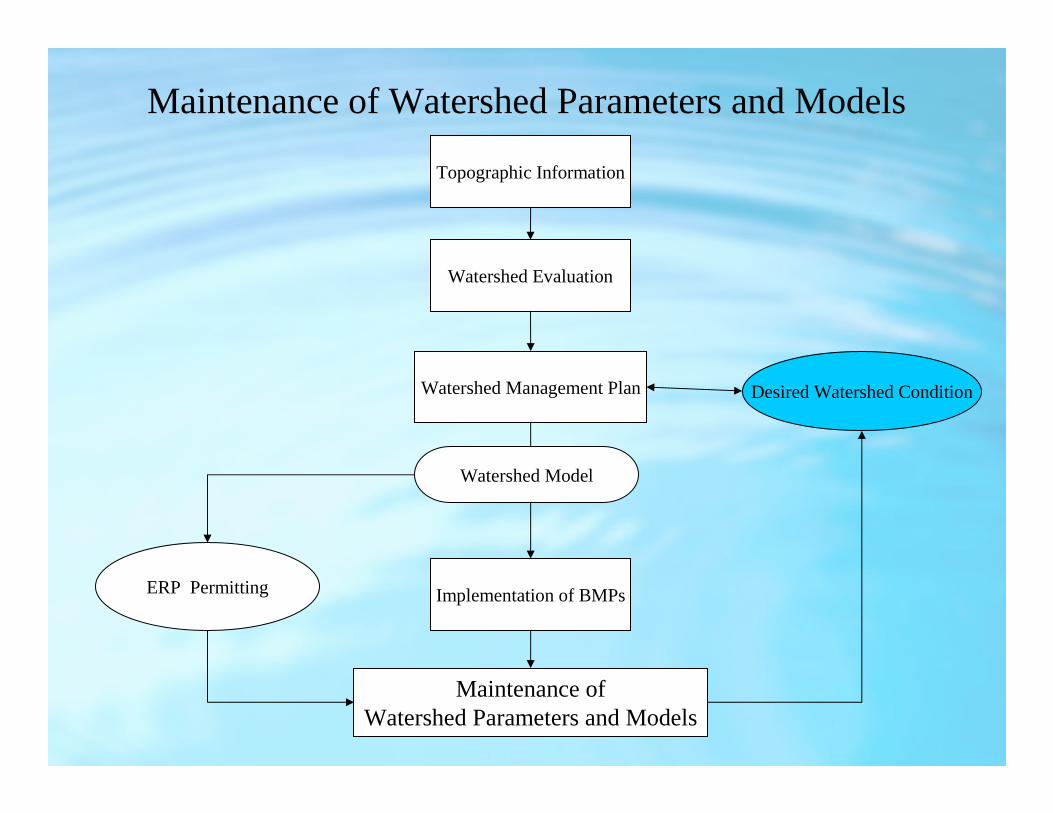
Maintenance of Watershed Parameters and Models
Watershed Evaluation
Watershed Management Plan
Implementation of BMPs
Maintenance ofWatershed Parameters and Models
Topographic Information
ERP Permitting
Desired Watershed Condition
Watershed Model
How do We work toward the Desired Watershed Condition?
COORDINATION
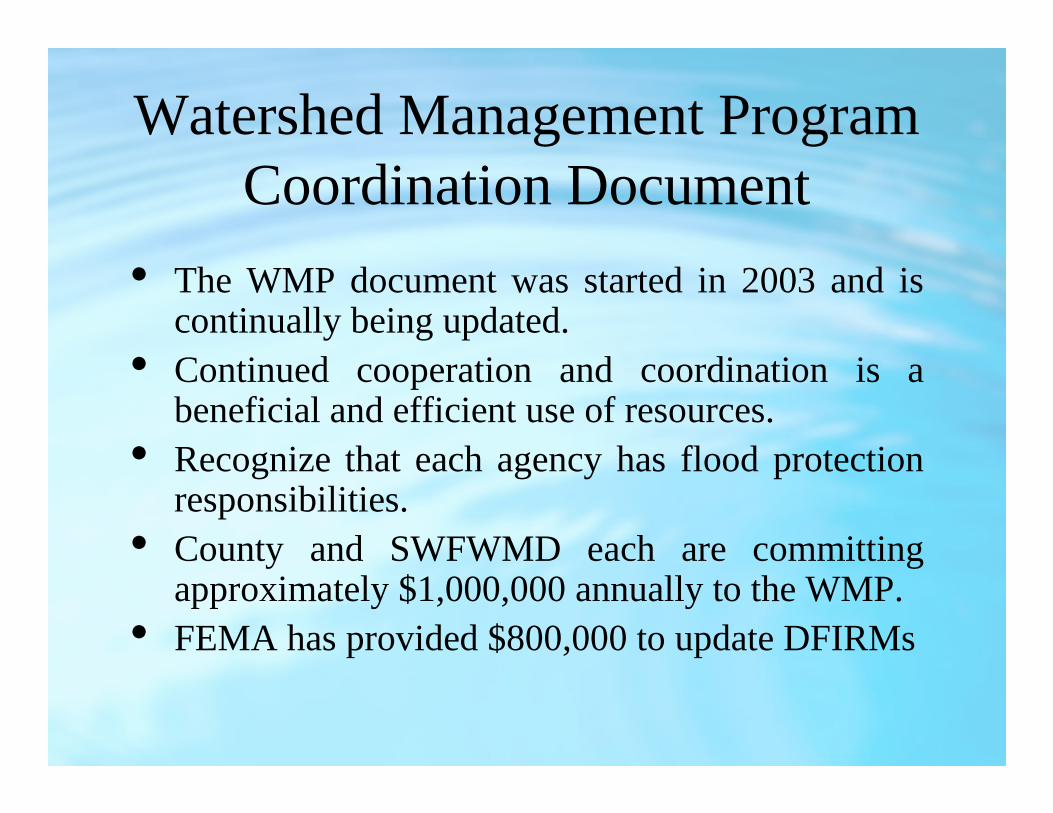
Watershed Management Program Coordination Document
• The WMP document was started in 2003 and is continually being updated.
• Continued cooperation and coordination is a beneficial and efficient use of resources.
• Recognize that each agency has flood protection responsibilities.
• County and SWFWMD each are committing approximately $1,000,000 annually to the WMP.
• FEMA has provided $800,000 to update DFIRMs
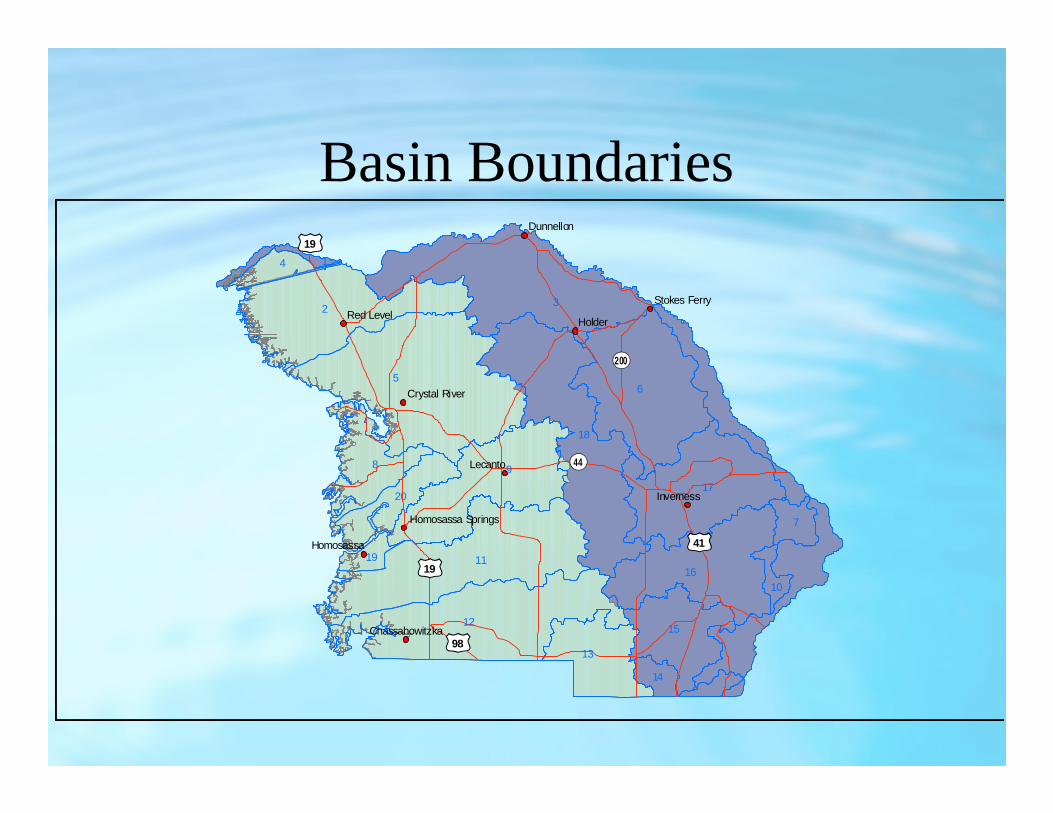
Basin Boundaries
3
56
2
9
18
11
12
17
16
8
15
13
20
7
4
14
19
10
1
tu19
tu41
tu98
tu19
��44
��200
Holder
Lecanto
Dunnellon
Inverness
Homosassa
Red LevelStokes Ferry
Crystal River
Chassahowitzka
Homosassa Springs
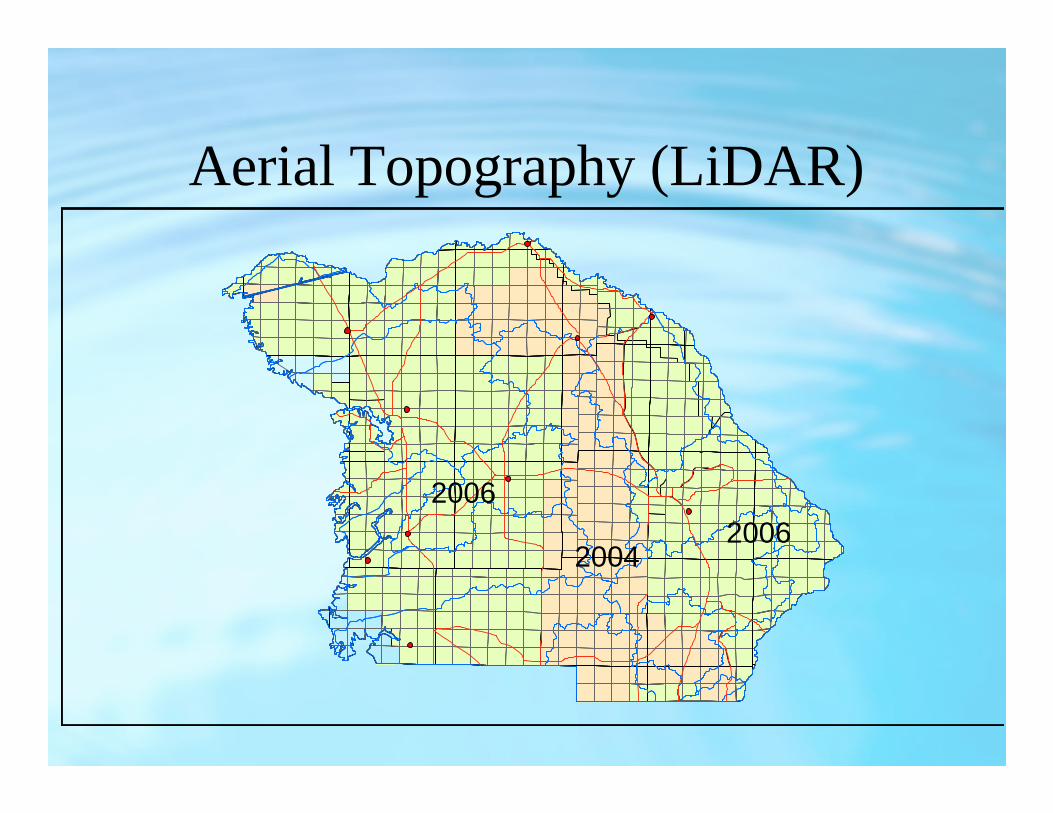
Aerial Topography (LiDAR)
2004
20062006

Cities
Roads
Watershed
Complete
On Going
Not Scheduled
2006
2007
2008
2009
2010
2011
2012 - 2016
Watershed Evaluation
−
4A Citrus County WMPC
3
56
2
9
18
11
12
17
16
8
15
13
20
7
4
14
19
10
1
tu19
tu41
tu98
tu19
��44
��200
Holder
Lecanto
Dunnellon
Inverness
Homosassa
Red LevelStokes Ferry
Crystal River
Chassahowitzka
Homosassa Springs
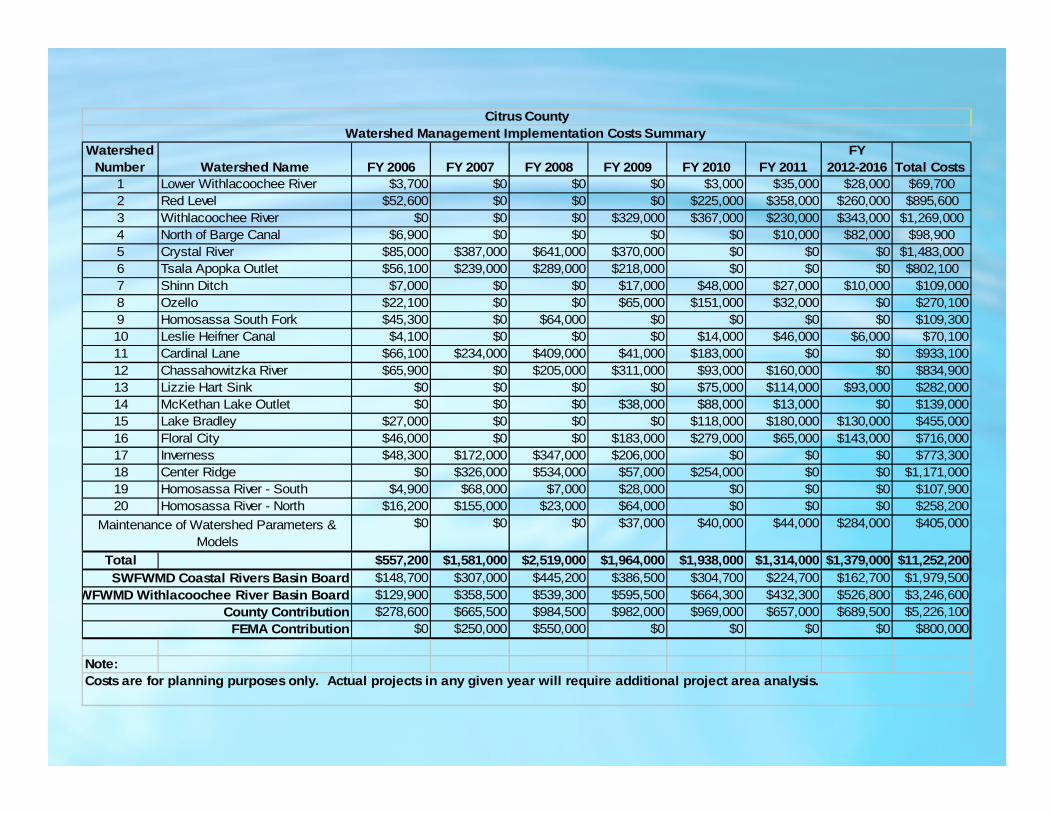
Citrus CountyWatershed Management Implementation Costs Summary
Watershed Number Watershed Name FY 2006 FY 2007 FY 2008 FY 2009 FY 2010 FY 2011
FY 2012-2016 Total Costs
1 Lower Withlacoochee River $3,700 $0 $0 $0 $3,000 $35,000 $28,000 $69,7002 Red Level $52,600 $0 $0 $0 $225,000 $358,000 $260,000 $895,6003 Withlacoochee River $0 $0 $0 $329,000 $367,000 $230,000 $343,000 $1,269,0004 North of Barge Canal $6,900 $0 $0 $0 $0 $10,000 $82,000 $98,9005 Crystal River $85,000 $387,000 $641,000 $370,000 $0 $0 $0 $1,483,0006 Tsala Apopka Outlet $56,100 $239,000 $289,000 $218,000 $0 $0 $0 $802,1007 Shinn Ditch $7,000 $0 $0 $17,000 $48,000 $27,000 $10,000 $109,0008 Ozello $22,100 $0 $0 $65,000 $151,000 $32,000 $0 $270,1009 Homosassa South Fork $45,300 $0 $64,000 $0 $0 $0 $0 $109,30010 Leslie Heifner Canal $4,100 $0 $0 $0 $14,000 $46,000 $6,000 $70,10011 Cardinal Lane $66,100 $234,000 $409,000 $41,000 $183,000 $0 $0 $933,10012 Chassahowitzka River $65,900 $0 $205,000 $311,000 $93,000 $160,000 $0 $834,90013 Lizzie Hart Sink $0 $0 $0 $0 $75,000 $114,000 $93,000 $282,00014 McKethan Lake Outlet $0 $0 $0 $38,000 $88,000 $13,000 $0 $139,00015 Lake Bradley $27,000 $0 $0 $0 $118,000 $180,000 $130,000 $455,00016 Floral City $46,000 $0 $0 $183,000 $279,000 $65,000 $143,000 $716,00017 Inverness $48,300 $172,000 $347,000 $206,000 $0 $0 $0 $773,30018 Center Ridge $0 $326,000 $534,000 $57,000 $254,000 $0 $0 $1,171,00019 Homosassa River - South $4,900 $68,000 $7,000 $28,000 $0 $0 $0 $107,90020 Homosassa River - North $16,200 $155,000 $23,000 $64,000 $0 $0 $0 $258,200
$0 $0 $0 $37,000 $40,000 $44,000 $284,000 $405,000
Total $557,200 $1,581,000 $2,519,000 $1,964,000 $1,938,000 $1,314,000 $1,379,000 $11,252,200$148,700 $307,000 $445,200 $386,500 $304,700 $224,700 $162,700 $1,979,500$129,900 $358,500 $539,300 $595,500 $664,300 $432,300 $526,800 $3,246,600$278,600 $665,500 $984,500 $982,000 $969,000 $657,000 $689,500 $5,226,100
$0 $250,000 $550,000 $0 $0 $0 $0 $800,000
Note:
Maintenance of Watershed Parameters & Models
Costs are for planning purposes only. Actual projects in any given year will require additional project area analysis.
SWFWMD Coastal Rivers Basin Board
County ContributionFEMA Contribution
SWFWMD Withlacoochee River Basin Board
National Flood Insurance Program (NFIP)
• Flood Insurance– Property owners in participating communities
purchase flood insurance
• Floodplain Management– Participating communities adopt and enforce
floodplain management ordinance
• Flood Hazard Mapping– Develop flooding limits
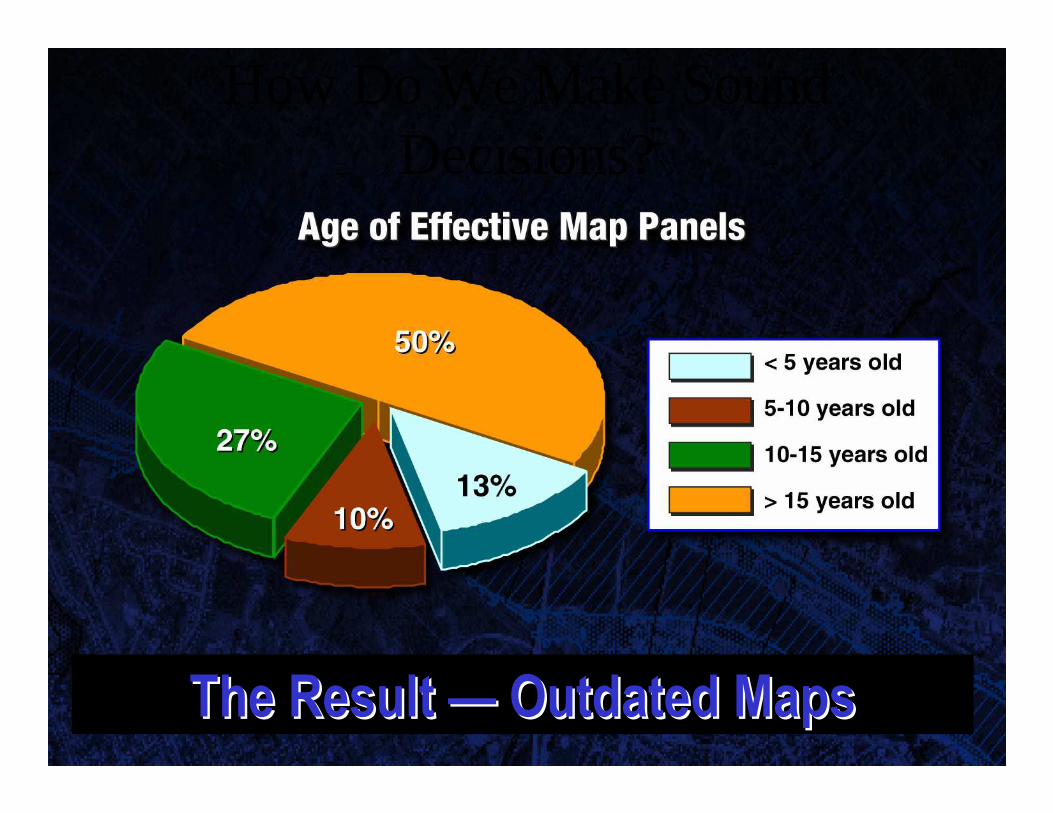
How Do We Make Sound Decisions?
The Result The Result —— Outdated MapsOutdated Maps
Why Update Flood Maps?
• Updated flood maps are critical to:– Reduce potential loss of life and property
through sound floodplain management
– Reduce National Flood Insurance Program (NFIP) and disaster costs
– Protect natural and beneficial values of floodplains
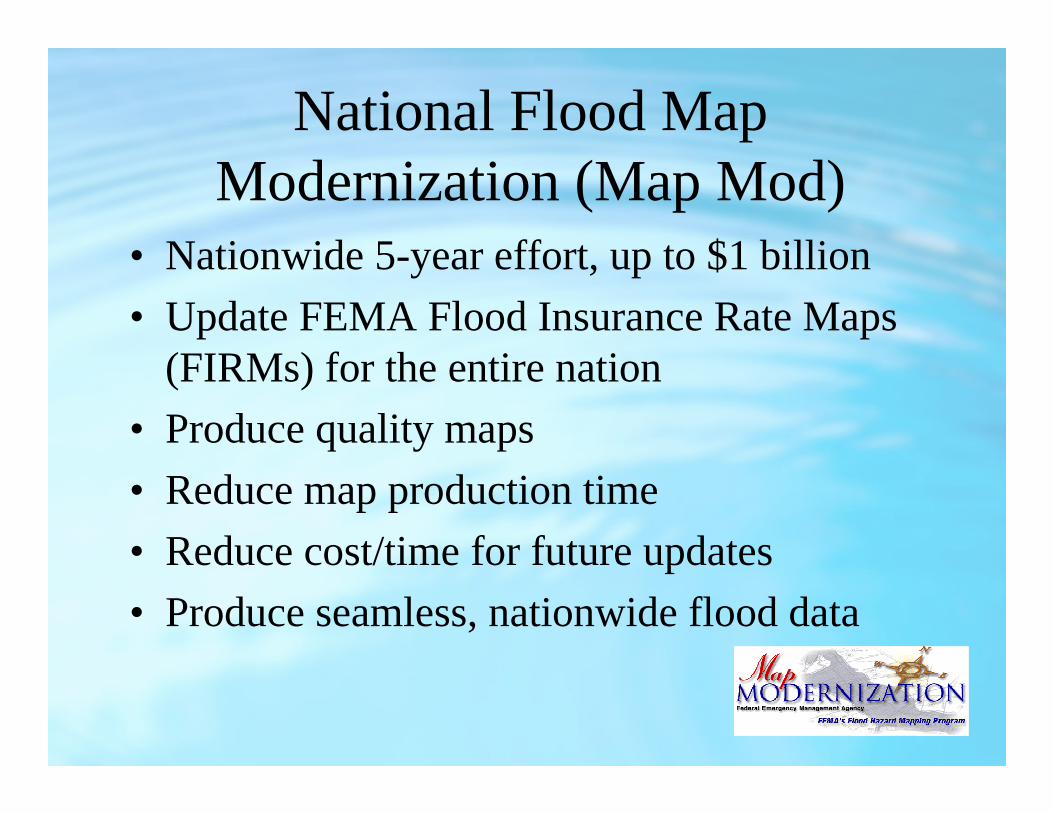
National Flood Map Modernization (Map Mod)
• Nationwide 5-year effort, up to $1 billion
• Update FEMA Flood Insurance Rate Maps (FIRMs) for the entire nation
• Produce quality maps
• Reduce map production time
• Reduce cost/time for future updates
• Produce seamless, nationwide flood data
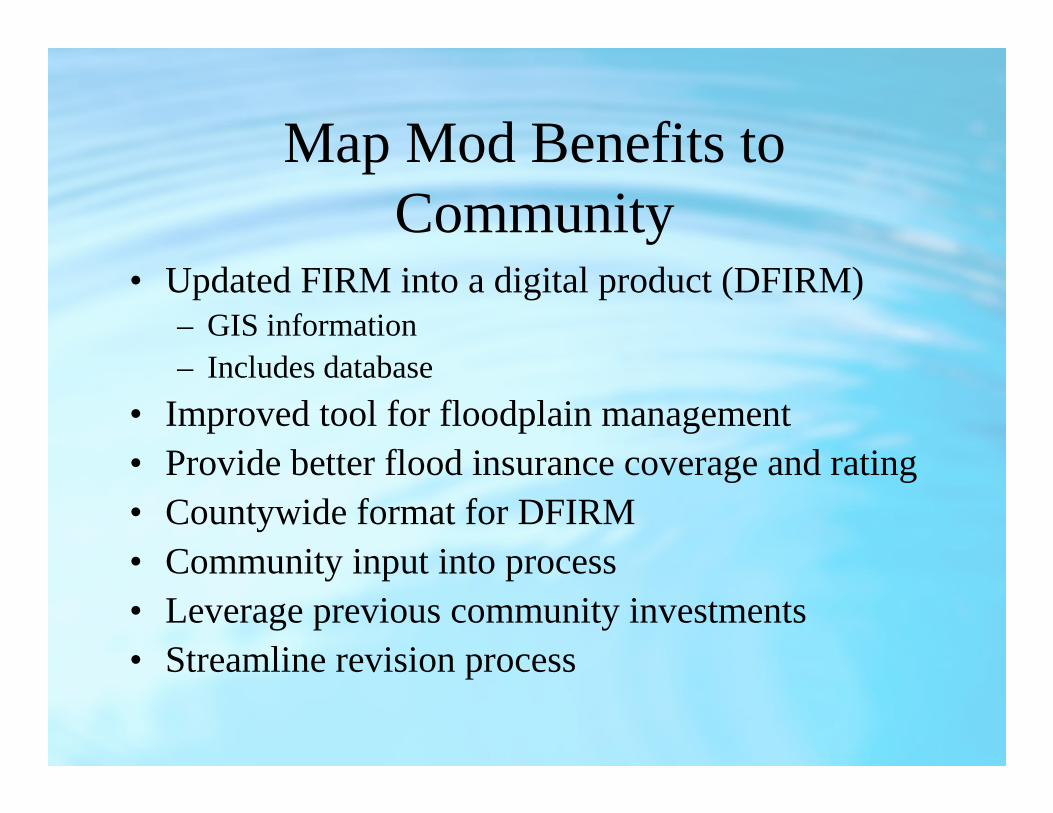
Map Mod Benefits to Community
• Updated FIRM into a digital product (DFIRM)– GIS information– Includes database
• Improved tool for floodplain management• Provide better flood insurance coverage and rating• Countywide format for DFIRM• Community input into process• Leverage previous community investments• Streamline revision process

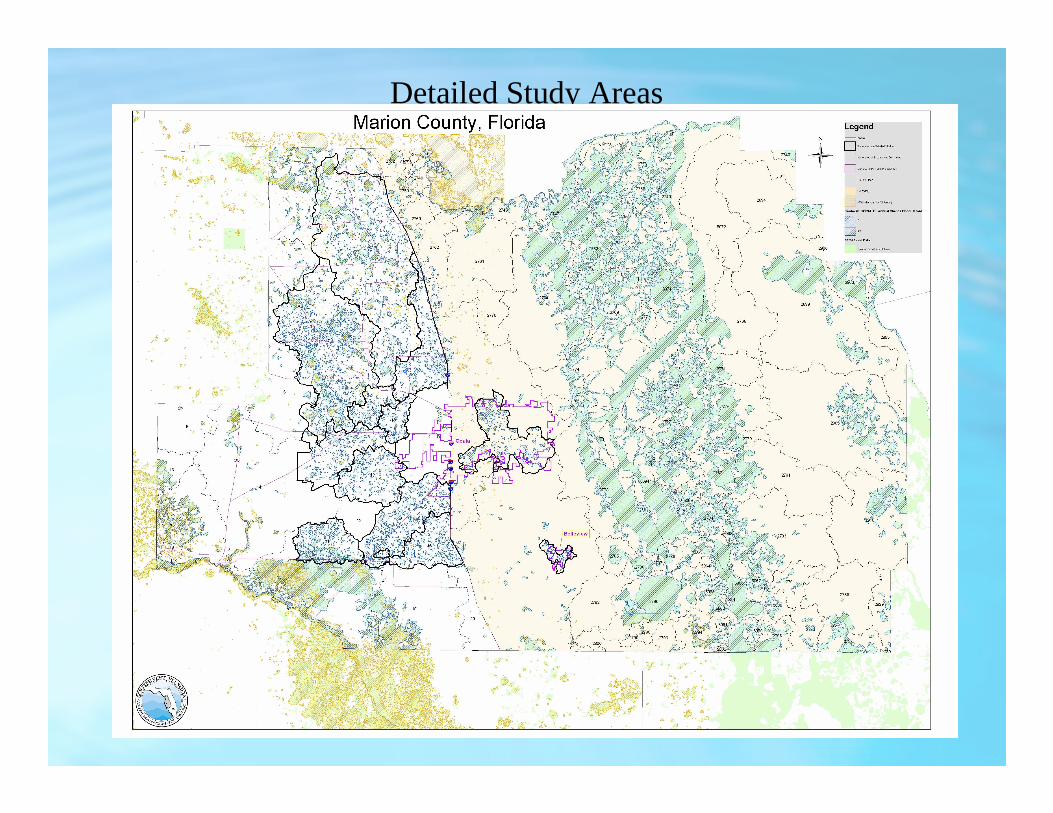
Detailed Study Areas
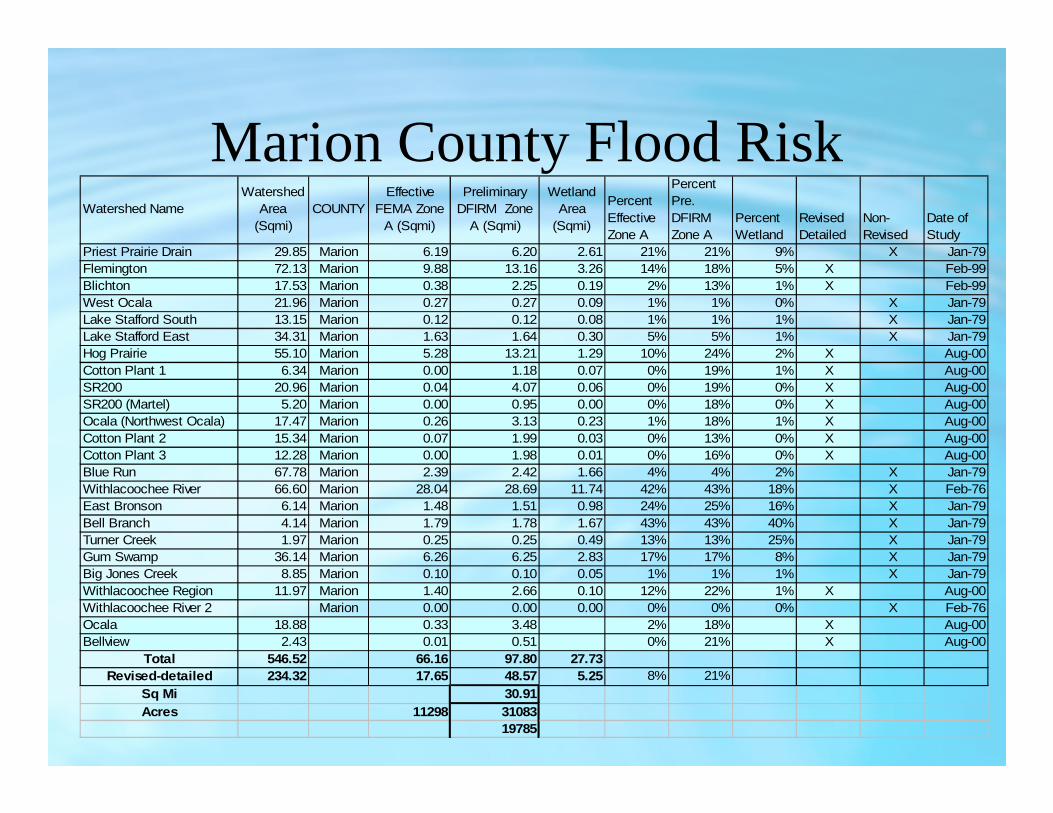
Marion County Flood RiskWatershed Name
Watershed Area
(Sqmi)COUNTY
Effective FEMA Zone
A (Sqmi)
Preliminary DFIRM Zone
A (Sqmi)
Wetland Area
(Sqmi)
Percent Effective Zone A
Percent Pre. DFIRM Zone A
Percent Wetland
Revised Detailed
Non-Revised
Date of Study
Priest Prairie Drain 29.85 Marion 6.19 6.20 2.61 21% 21% 9% X Jan-79Flemington 72.13 Marion 9.88 13.16 3.26 14% 18% 5% X Feb-99Blichton 17.53 Marion 0.38 2.25 0.19 2% 13% 1% X Feb-99West Ocala 21.96 Marion 0.27 0.27 0.09 1% 1% 0% X Jan-79Lake Stafford South 13.15 Marion 0.12 0.12 0.08 1% 1% 1% X Jan-79Lake Stafford East 34.31 Marion 1.63 1.64 0.30 5% 5% 1% X Jan-79Hog Prairie 55.10 Marion 5.28 13.21 1.29 10% 24% 2% X Aug-00Cotton Plant 1 6.34 Marion 0.00 1.18 0.07 0% 19% 1% X Aug-00SR200 20.96 Marion 0.04 4.07 0.06 0% 19% 0% X Aug-00SR200 (Martel) 5.20 Marion 0.00 0.95 0.00 0% 18% 0% X Aug-00Ocala (Northwest Ocala) 17.47 Marion 0.26 3.13 0.23 1% 18% 1% X Aug-00Cotton Plant 2 15.34 Marion 0.07 1.99 0.03 0% 13% 0% X Aug-00Cotton Plant 3 12.28 Marion 0.00 1.98 0.01 0% 16% 0% X Aug-00Blue Run 67.78 Marion 2.39 2.42 1.66 4% 4% 2% X Jan-79Withlacoochee River 66.60 Marion 28.04 28.69 11.74 42% 43% 18% X Feb-76East Bronson 6.14 Marion 1.48 1.51 0.98 24% 25% 16% X Jan-79Bell Branch 4.14 Marion 1.79 1.78 1.67 43% 43% 40% X Jan-79Turner Creek 1.97 Marion 0.25 0.25 0.49 13% 13% 25% X Jan-79Gum Swamp 36.14 Marion 6.26 6.25 2.83 17% 17% 8% X Jan-79Big Jones Creek 8.85 Marion 0.10 0.10 0.05 1% 1% 1% X Jan-79Withlacoochee Region 11.97 Marion 1.40 2.66 0.10 12% 22% 1% X Aug-00Withlacoochee River 2 Marion 0.00 0.00 0.00 0% 0% 0% X Feb-76Ocala 18.88 0.33 3.48 2% 18% X Aug-00Bellview 2.43 0.01 0.51 0% 21% X Aug-00
Total 546.52 66.16 97.80 27.73Revised-detailed 234.32 17.65 48.57 5.25 8% 21%
Sq Mi 30.91Acres 11298 31083
19785
Citrus CountyWATERSHED MANAGEMENT PROGRAM
COORDINATION DOCUMENT
Memorandum of Understanding
• Data Collection
• Watershed Characterization
•Floodplain Analysis
•Implementation
Review and Adoption
DFIRMs - 2009
NEXT STEPS
• Complete LiDAR• Continue Coordination on MOU• Complete Watershed Basin Studies• Create and Adopt DFIRMs• Update when New Studies are Complete• Identify and Construct Stormwater
Improvements to Correct Deficiencies in Level of Service
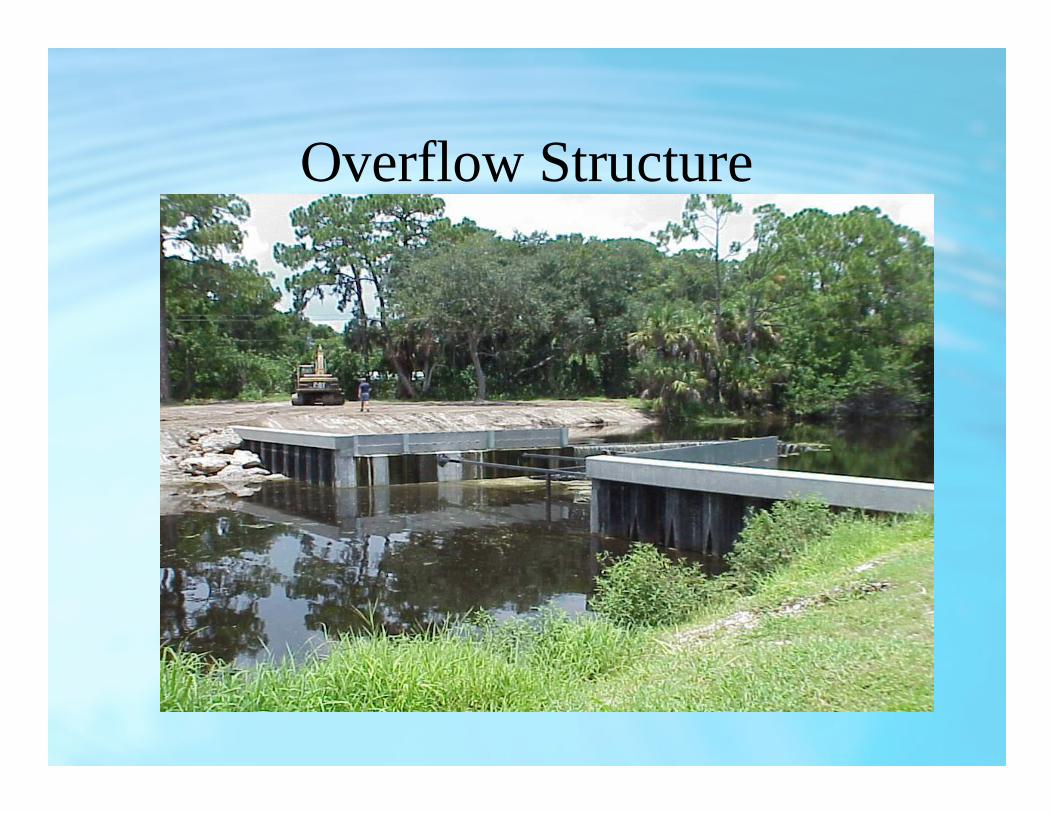
Overflow Structure

Canal Project

Questions?