Embed Size (px)
Citation preview

Graduate Theses and Dissertations Iowa State University Capstones, Theses andDissertations
2012
Implementation of school districts' food safetyplans and perceptions of support for food safetyand training in child nutrition programs in oneUSDA regionCynthia Ann Dawso Van DruffIowa State University
Follow this and additional works at: https://lib.dr.iastate.edu/etd
Part of the Adult and Continuing Education Administration Commons, Adult and ContinuingEducation and Teaching Commons, and the Business Administration, Management, and OperationsCommons
This Dissertation is brought to you for free and open access by the Iowa State University Capstones, Theses and Dissertations at Iowa State UniversityDigital Repository. It has been accepted for inclusion in Graduate Theses and Dissertations by an authorized administrator of Iowa State UniversityDigital Repository. For more information, please contact [email protected].
Recommended CitationDawso Van Druff, Cynthia Ann, "Implementation of school districts' food safety plans and perceptions of support for food safety andtraining in child nutrition programs in one USDA region" (2012). Graduate Theses and Dissertations. 12309.https://lib.dr.iastate.edu/etd/12309

Implementation of school districts’ food safety plans
and perceptions of support for food safety and training in
child nutrition programs in one USDA region
by
Cynthia A. Dawso Van Druff
A dissertation submitted to the graduate faculty
in partial fulfillment of the requirements for the degree of
DOCTOR OF PHILOSOPHY
Major: Hospitality Management
Program of Study Committee:
Catherine Strohbehn, Major Professor
Susan W. Arendt
Robert Bosselman
Angela Laury
Mack Shelley
Iowa State University
Ames, Iowa
2012
Copyright © Cynthia A. Dawso Van Druff, 2012. All rights reserved.
ii
TABLE OF CONTENTS
LIST OF TABLES ................................................................................................................... vi
ACKNOWLEDGMENTS ..................................................................................................... viii
ABSTRACT ............................................................................................................................. ix
CHAPTER 1. INTRODUCTION ............................................................................................. 1 Introduction ......................................................................................................................... 1 Food Safety ......................................................................................................................... 3
Schools and Food Safety ............................................................................................... 4 Training ......................................................................................................................... 7
Support for School Foodservice Program from School Business Officials ........................ 9
Purpose of the Study ......................................................................................................... 11 Significance of the Research ............................................................................................. 12
Assumptions of the Study ................................................................................................. 13 Limitations of the Study.................................................................................................... 13 Definitions of Terms ......................................................................................................... 14
CHAPTER 2. LITERATURE REVIEW ................................................................................ 18 Introduction ....................................................................................................................... 18
Food Safety in Retail Foodservices .................................................................................. 19 Incidences ................................................................................................................... 19
Risk Factors ................................................................................................................ 21 Food Safety Management Systems ............................................................................. 22
Legislation and Oversight of School Meal Programs ....................................................... 23 Historical Overview of School Meal Programs .......................................................... 23 Legislative Impacts on Meals Programs ..................................................................... 26
Schools and Food Safety ................................................................................................... 29 Incidences in Schools .................................................................................................. 30
Food Recalls................................................................................................................ 35 History of HACCP ...................................................................................................... 35
HACCP and Food Safety Mandates for Schools ........................................................ 37 Training ....................................................................................................................... 39
Administrative Program Support ................................................................................ 41
CHAPTER 3. METHODOLOGY .......................................................................................... 45 Introduction ....................................................................................................................... 45 Study Population ............................................................................................................... 46 Sampling Procedures ........................................................................................................ 48
Content Validity ................................................................................................................ 49 Pilot Testing ...................................................................................................................... 49 Data Collection Procedures ............................................................................................... 50
School Foodservice Directors ..................................................................................... 50
School Business Officials ........................................................................................... 52

iii
State Agency Directors ............................................................................................... 52 Data Collection Tools ....................................................................................................... 52
School Foodservice Directors Survey ......................................................................... 52 School Business Officials Survey ............................................................................... 54
State Agency Survey ................................................................................................... 55 Data Analysis .................................................................................................................... 55
CHAPTER 4. RESULTS AND DISCUSSION ...................................................................... 56 Introduction ....................................................................................................................... 56 Demographic Characteristics of School Foodservice Directors ....................................... 58
Respondents ................................................................................................................ 58 Professional Credentials.............................................................................................. 61
School District Characteristics as Reported by School Foodservice Directors ................ 62 Districts ....................................................................................................................... 62 Production Method and Service .................................................................................. 64 Health Department Food Safety Certification ............................................................ 66
Demographic Characteristics of School Business Officials ............................................. 67 School District Characteristics as Reported by School Business Officials ...................... 67
Districts ....................................................................................................................... 67 Financial ...................................................................................................................... 69 Certification for Food Safety ...................................................................................... 70
Perceptions About Board-Level Policies .......................................................................... 70
Existence of District Board-Level Food Safety-Related Policies ............................... 71 Importance of District Board-Level Food Safety-Related Policies ............................ 75 Influencers of Administrative Support and Funding Provided for Food Safety
Training ....................................................................................................................... 78 School Business Officials’ Knowledge of Food Safety Policy Mandates in Child
Nutrition Programs............................................................................................................ 83 Requirements of Legislation ....................................................................................... 85 Essential Elements in the Development of a Food Safety Plan as Identified by
School Business Officials ........................................................................................... 87 District-Wide Staffing Information ................................................................................... 89
Training and Professional Development Support ....................................................... 90
District Requirements for Training by Staff Categories ............................................. 92 Funding Sources for School Foodservice Training .................................................... 93 Training Topics for School Foodservice Staff During District In-Service ................. 95
Completeness of District’s Food Safety Plan ................................................................... 96 Recordkeeping .......................................................................................................... 100 Record Retention ...................................................................................................... 101 Recordkeeping Log Documentation ......................................................................... 102 HACCP-Based Food Safety Plan Documentation .................................................... 103
Food Safety Concepts in Human Resources Management Procedures .......................... 107 Sanitation Inspections ..................................................................................................... 109
Inspection Fees for Additional Health Inspections ................................................... 109
Posting of the Inspection Reports ............................................................................. 110

iv
Critical Violations Cited During Semiannual Health Department Inspections ........ 111 Foodservice Directors’ Perceived Organizational Support for Child Nutrition
Programs from District Administration .......................................................................... 113 School Foodservice Directors’ Attitudes about Food Safety Training ........................... 116
Training Opportunities .............................................................................................. 119 Training Topics ......................................................................................................... 121
Personal Food Safety Practices of School Foodservice Directors .................................. 123 Bleach Storage .......................................................................................................... 124 Thermometer Use...................................................................................................... 125
Cutting Board Use..................................................................................................... 126
Foodservice Directors Reported Food Safety Practices at Home ............................. 127
State Agency ................................................................................................................... 133
CHAPTER 5. SUMMARY AND CONCLUSIONS ............................................................ 138 Summary of Findings ...................................................................................................... 138 Limitations of the Study.................................................................................................. 143
Conclusions ..................................................................................................................... 145 Recommendations for Future Research .......................................................................... 146
REFERENCES ..................................................................................................................... 148
APPENDIX A. INSTITUTIONAL REVIEW BOARD APPROVAL LETTER ................. 168
APPENDIX B. EXPERT PANEL FOODSERVICE DIRECTOR LETTER ....................... 169
APPENDIX C. FOODSERVICE DIRECTOR CONTENT VALIDITY
EVALUATION FORM ........................................................................................................ 170
APPENDIX D. SCHOOL BUSINESS OFFICIAL EXPERT PANEL
REVIEW LETTER ............................................................................................................... 171
APPENDIX E. SCHOOL BUSINESS OFFICIAL CONTENT VALIDITY
EVALUATION FORM ........................................................................................................ 172
APPENDIX F. FOODSERVICE DIRECTOR PILOT LETTER ......................................... 173
APPENDIX G. FOODSERVICE DIRECTOR PILOT EVALUATION FORM ................. 175
APPENDIX H. SCHOOL BUSINESS OFFICIAL PILOT LETTER .................................. 176
APPENDIX I. SCHOOL BUSINESS OFFICIAL PILOT EVALUATION FORM ............ 178
APPENDIX J. FOODSERVICE DIRECTOR PRENOTIFICATION POSTCARD ........... 179
APPENDIX K. SCHOOL BUSINESS OFFICIAL PRENOTIFICATION POSTCARD.... 180
APPENDIX L. FOODSERVICE DIRECTOR CONTACT LETTER ................................. 181
v
APPENDIX M. FOODSERVICE DIRECTOR SURVEY ................................................... 183
APPENDIX N. SCHOOL BUSINESS OFFICIAL CONTACT LETTER .......................... 191
APPENDIX O. SCHOOL BUSINESS OFFICIAL SURVEY ............................................. 193
APPENDIX P. FOODSERVICE DIRECTOR REMINDER POSTCARD ......................... 197
APPENDIX Q. SCHOOL BUSINESS OFFICIAL REMINDER POSTCARD .................. 198
APPENDIX R. FOODSERVICE DIRECTOR REMINDER LETTER ............................... 199
APPENDIX S. SCHOOL BUSINESS OFFICIAL REMINDER LETTER ......................... 201
APPENDIX T. STATE AGENCY CONTACT LETTER ................................................... 203
APPENDIX U. STATE AGENCY SURVEY ...................................................................... 205
APPENDIX V. FOLLOW UP E-MAIL TO STATE AGENCY PARTICIPANTS ............ 206
APPENDIX W. STATE AGENCY PHONE SURVEY ...................................................... 207
APPENDIX X. FOODSERVICE DIRECTOR FINAL REMINDER .................................. 209
vi
LIST OF TABLES
Table 1. USDA Mid-Atlantic Region District Characteristics by State ................................47
Table 2. Number and Percentage of Responses by School Foodservice Directors and
School Business Officials from Districts in the Mid-Atlantic Region States .........57
Table 3. Characteristics of School Foodservice Director Respondents in the
Mid-Atlantic Region................................................................................................59
Table 4. School District Characteristics as Reported by School Foodservice Director
in the Mid-Atlantic Region......................................................................................63
Table 5. Characteristics of School Business Official Respondents in the Mid-Atlantic
Region ......................................................................................................................68
Table 6. Characteristics of District School Meal Programs as Reported by School
Business Officials ....................................................................................................69
Table 7. Foodservice Directors and School Business Officials Identification of
Board-Level Policy Existence in Their Districts .....................................................73
Table 8. Food Service Directors’ and School Business Officials’ Mean Ratings and
Standard Deviations of the Importance of Food Safety District Board-Level
Policy Items .............................................................................................................76
Table 9. Food Service Directors’ and School Business Officials’ Identification of
Items They Perceived Would Positively Influence District Funding for
Food Safety Training ...............................................................................................79
Table 10. School Business Official-Identified Sources of Information About
P.L. 108-265 ............................................................................................................86
Table 11. Essential Elements of a School District HACCP-Based Food Safety Plan as
Identified by School Business Officials ..................................................................89
Table 12. Ranges and Mean Total Hours Reported by SBOs for District Staff Training
in School Year 2007–2008 by Category of Employees ..........................................92
Table 13. General Topics Identified by School Business Officials as Part of District
In-Service Paid Training Required for School Foodservice Staff ...........................95
Table 14. Food-Related Topics Identified by School Business Officials as Part of
District In-Service Paid Training Required for School Foodservice Staff ..............96
Table 15. Food Service Directors’ Assessed Level of Completeness of Standard
Operating Procedures for the District’s Food Safety Plan ......................................98

vii
Table 16. School Foodservice Directors’ Responses to Years School Food Safety
Records Retained ...................................................................................................101
Table 17. School Foodservice Directors’ Responses to Types of Food Safety Records
Retained .................................................................................................................103
Table 18. School Foodservice Directors’ Responses to Documentation Used for
Components of a HACCP-Based Food Safety Plan ..............................................105
Table 19. Foodservice Directors’ Identification of Critical Violations on Semiannual
Inspection Reports .................................................................................................112
Table 20. Mean Ratings and Standard Deviations of Foodservice Directors’ Perceptions
of Administrative Support for Foodservice Operational Issues ............................114
Table 21. Foodservice Directors’ Attitudes Toward Food Safety Training ..........................117
Table 22. Foodservice Directors’ Responses Regarding Scheduled Food Safety
Training .................................................................................................................120
Table 23. Foodservice Directors’ Identification of Topics Included in Foodservice
Staff Food Safety Training ....................................................................................122
Table 24. Foodservice Directors’ Personal Food Safety Practices Related to Bleach
Storage at Home ....................................................................................................124
Table 25. Foodservice Directors’ Personal Food Safety Practices of Thermometer
Type and Use at Home ..........................................................................................125
Table 26. Foodservice Directors’ Identified Type of Cutting Boards Used at Home ...........126
Table 27. Foodservice Directors’ Reported Level of Agreement with Grocery
Shopping Scale Items ............................................................................................128
Table 28. Foodservice Directors’ Personal Food Safety Storage Practices of Food
Items at Home .......................................................................................................130
Table 29. Foodservice Directors’ Preparation and Cooking Practices for Food at Home ....132

viii
ACKNOWLEDGMENTS
I believe in setting goals. My latest goal was to earn a doctoral degree. I also believe
that successfully completing a goal requires perseverance. And, oh did I persevere.
To that end I gratefully dedicate this degree to and thank my family, professors, co-
workers, Iowa State classmates and friends.
To my husband, Robert, a special thank you for his love and steadfast encouragement.
To my mother, Della Dawso, who all my life, with love, supported me in all my endeavors
and could always be counted on, no matter what path I chose. To my sister, Ginger Hartman,
for her continued “cheering me on” and taking care of every holiday detail and understanding
when I was not able to share holiday time with our family. To my cousin, Patricia Durler, for
the endless phone calls to districts to obtain address contacts and talking care of so many
necessary details and to Beth and Roger Hanna for their unwavering support and endless
hospitality.
My gratitude goes to Dr. Mary Gregoire and Dr. Jeannie Sneed for their vision to
create the Child Nutrition Leadership Academy at Iowa State University. A heartfelt thanks
to Dr. Catherine Strohbehn, my major professor, for her continual guidance, support,
reassurance, and endless ability to clarify and read and re-read. I wish to thank my
committee, Dr. Susan W. Arendt, Dr. Robert Bosselman, Dr. Angela Laury, Dr. Mack
Shelley and Dr. Catherine Strohbehn for their support and encouragement.
As I close this latest chapter in my educational journey, who knows what path will
beckon.
ix
ABSTRACT
School foodservice directors (FSDs) and school business officials (SBOs) in public
school districts with enrollments between 2,500 and 25,000 in the USDA Mid-Atlantic
geographic region provided responses to a paper-and-pencil survey. The FSDs assessed the
level of implementation of a mandated school food safety plan in their districts and perceived
administrative support and also identified the district’s food safety training efforts. These
findings were compared with SBOs identified knowledge and levels of support for the
district’s child nutrition program. These variables along with FSD and SBO demographic
data and district characteristics were analyzed to determine if significant differences existed
in their perceptions.
Responses were received from one third of the sample of Mid-Atlantic region
districts’ (N = 498) FSDs (n = 166) and a little less than 20% of the SBOs (n = 91). Study
results found half of the FSDs and one third of SBOs identified the existence of a board-level
district policy about food safety. Both groups rated highly the importance of such a policy,
with means greater than 4.0 (FSDs, M = 4.37; SBOs, M = 4.176) on a 5-point scale ranging
from 1 (very unimportant) to 5 (very important). The FSDs placed more importance on the
need for policies to address foods from home than did SBOs, yet there were no significant
differences in the perceptions of either FSDs or SBOs about the importance of district food
safety policies from all respondents or between FSDs and SBOs from the same district.
The FSDs reported food safety plans as fairly complete (M = 4.67) based on the
presence of written standard operating procedures (SOPs) addressing specific items and
recordkeeping documentation. However, less than one third of respondents documented the

x
use of prerequisite programs. The majority did indicate compliance with semiannual
inspections and posting of inspection reports.
Close to half of the SBOs in the Mid-Atlantic region were unfamiliar with or not
knowledgeable about the food safety component of the Reauthorization Act of 2004. Those
SBOs with knowledge of the mandate reported learning of the requirements of the legislation
through the school FSD, state agency, or other SBOs.
Foodservice directors reported district administration was generally supportive for
training but neutral on the importance of training for foodservice staff and offered minimal
financial support for such training. FSDs and SBOs both identified most frequently that a
state or federal agency mandate for requirement of food safety training would positively
influence district administrative support and funding for this purpose.
Findings from this study suggest greater need for the adoption of district board-level
policies relating to safety of all foods served on school grounds, regardless of preparation
location. This study also showed a need for districts to develop and adopt SOPs to guide
procedures for food preparation, service, and sales district-wide and to provide training for
the FSD and all school staff about food safety and changes in child nutrition program
regulations.
Several limitations were identified in this study including reliance on self-reported
data and possible misrepresentation from the population, the local district’s policy on survey
participation, and method of distribution and collection of the paper survey.
Recommendations for future studies include assessing the effectiveness of an educational
module about child nutrition programs and food safety as a component of school
administrator licensing or certification programs and effectiveness of child nutrition

xi
programs as related to funded and unfunded mandates recommended in the Healthy, Hunger-
Free Kids Act of 2010.

1
CHAPTER 1. INTRODUCTION
Introduction
The Richard B. Russell National School Lunch Act (NSLA) of 1946, established
under Public Law 79-396, provided a foundation for the development of a strong national
child nutrition policy and established the National School Lunch Program (NSLP) on a
permanent basis (J. Martin, 1999a). The intent was declared to be the policy of Congress as a
measure of national security, to safeguard the health and well-being of the nation’s children,
and to encourage domestic consumption of nutritious agricultural commodities by assisting
states in providing nonprofit school lunch programs (J. Martin, 1999a). The School Nutrition
Association ([SNA], 2011b) estimated that the NSLP operated in more than 101,000 public
and nonprofit private schools and resident child care institutions in fiscal year 2010, with
more than 31.6 million children served each school day. During the 2010 fiscal year, a total
of 5.2 billion lunches were served with support from the United States Department of
Agriculture (USDA) of $10.0 billion (USDA, Economic Research Service [USDA-ERS],
2011). During the 2010 fiscal year, an estimated 11.6 million breakfast meals were served
daily (USDA, 2011c; USDA-ERS 2011) in 88,000 school and childcare settings (SNA,
2011b).
USDA administers the following domestic food assistance programs: NSLP, School
Breakfast Program (SBP), After-School Snack Program, Summer Food Service Program, and
Child and Adult Care Food Program. Other key nutrition assistance programs are the Special
Milk Program, Special Supplemental Food Program for Women, Infants, and Children
(WIC), Fresh Fruit and Vegetable Program, and Supplemental Nutrition Assistance Program
(formerly Food Stamps). The SBP was established as a 2-year pilot project designed to assist
2
schools serving breakfast to “nutritional needy” children (USDA, 2011d) under the Child
Nutrition Act of 1966. After many modifications the project received permanent
authorization (J. Martin, 1999b; SNA, 2008). The SBP was designed to ensure that all
children are ready to learn and have access to a healthy breakfast at school (SNA, 2008).
After-school snacks were offered by an estimated 47% of school foodservice operations
(SNA, 2008). In 2009, over 214 million snacks were provided after school (USDA-ERS,
2011). In 1968, the special foodservice program was created as a 3-year pilot. This pilot had
two sections: child care and summer program. In 1975, the two sections separated and were
renamed the Summer Food Service Program under Section 13 of the NSLA and the Child
Nutrition Act of 1966 and Child and Adult Care Food Program (J. Martin, 1999b). The
Child and Adult Care Food Program began as a children-only pilot (SNA, 2008) in 1968 and
was permanently authorized under Section 17 of the NSLA of 1946 in 1975 (J. Martin,
1999b). The Child and Adult Care Food Program serves breakfasts, lunches, suppers, and
snacks to children residing in shelters, licensed childcare facilities, homes and also to
disabled elderly persons in adult day-care facilities (J. Martin, 1999b; SNA, 2008). The
program was expanded to include adults in 1987. Close to 2.2 million children were served
meals at 34,752 sites during the summer of 2009 (USDA-ERS, 2011). The Special Milk
Program initially began in 1954 and operated on a year-to-year basis until permanent
authorization by the Child Nutrition Act of 1966. Close to 6,000 schools, camps, and
residential program participated in the SMP (USDA, 2011e). The Farm Security and Rural
Investment Act of 2002 authorized the pilot and the Food, Conservation, and Energy Act of
2008 expanded the Fresh Fruit and Vegetable Program. The USDA has estimated about one

3
in five Americans participates in at least one food assistance program during a given year
(USDA, 2007c, 2008b).
Public Law 108-265, section 111 of the Child Nutrition and WIC Reauthorization Act
of 2004 amended section 9(h) of the NSLA and required school food authorities and local
educational agencies to implement a food safety plan for the start of the 2005–2006 school
year in each school building in districts participating in the NSLP and/or SBP (USDA, 2005).
“The program must be based on Hazard Analysis and Critical Control Point principles
(HACCP) and conform to guidance issued by the United States Department of Agriculture”
(USDA, Food and Nutrition Service [USDA-FNS], 2005a, p. 4). With enactment of this law,
school meal programs became the first retail sector of the foodservice industry required to
implement a food safety plan based on the HACCP process. Guidance was released by the
USDA July, 2005, and the implementation date was extended to July 1, 2006 (USDA-FNS,
2005a). The systematic HACCP-based approach to food safety was recommended by the
USDA. Congress responded to increasing food safety concerns by enacting the new food
safety requirements (Almanza & Sneed, 2003; Sneed & Henroid, 2007).
Food Safety
Foodborne illness is a major concern to the foodservice industry. Foodborne illness is
carried or transferred to people by food (National Restaurant Association Educational
Foundation [NRAEF], 2008). In 2010, the Centers for Disease Control and Prevention
(CDC) released new estimates of foodborne illness outbreaks in the United States. Each year,
an estimated 9.4 million illnesses, 55,961 hospitalizations, and 1,351 deaths result from
consumption of foods contaminated with known disease agents (Scallan, Griffin, Angulo,
Tauxe, & Hoestra, 2011, Scallan, Hoekstra, et al., 2011) with an additional 38.4 million
4
illnesses, 71,878 hospitalizations, and 1,686 deaths estimated from consumption of foods
contaminated with unspecified agents.
Anyone is at risk to develop a foodborne illness, but those at higher risk include the
elderly, young children, pregnant women, transplant recipients, and the immuno-
compromised, because immune systems are either not fully developed or are compromised
by a weakened condition. A single outbreak can affect many people. The food industry is
regulated to ensure a safe food supply; however, there is some degree of risk. All foods must
be grown, handled, packed, prepared, stored, and served properly to ensure food remains safe
for consumption.
Schools and Food Safety
Preventing foodborne illness is an important concern in school settings because
outbreaks have personal, academic, financial, and legal consequences for each school district
(Marx, 2008). Student absenteeism affects a student’s performance in school, and if a
foodborne illness outbreak occurred, school districts could experience increased insurance
costs, attorney fees, and loss of revenues due to decreased participation in school meals
(Marx, 2008).
Children are an at-risk population and can contract foodborne illness from eating or
drinking a contaminated substance. In a 10-year study conducted between 1990 and 1999 by
the U.S. General Accounting Office ([GAO], 2003), 3% of foodborne illness outbreaks
occurred in schools. Daniels et al. (2002) studied the outbreaks that occurred in the period
between January 1973 and December 1997 and found there were 604 school-related
outbreaks reported to the CDC from state and local health departments. The commonly
implicated food vehicles were poultry (18.6%), salad (6%), Mexican-style food (6%), beef

5
(5.7%), and dairy, not including ice cream (5.1%). The commonly reported food practices
contributing to the school-related outbreaks were improper food storage, food contaminated
by a food handler, and improper holding temperatures (Daniels et al., 2002). Other improper
behaviors noted during observational research and survey studies were poor handwashing
(Henroid & Sneed, 2004), lack of hair restraints (Giampaoli, Cluskey, & Sneed, 2002;
Gilmore, Brown, & Dana, 1998), lack of calibration of thermometers (Henroid & Sneed,
2004), improper reheating (Kim & Shanklin, 1999), inappropriate sanitizing, improper
heating and cooling (Henroid & Sneed, 2004), and consumption of food in a preparation area
(Giampaoli, Cluskey, et al., 2002). In general, these studies found proper food-handling
practices in schools were not being followed consistently.
Prior to the requirement for HACCP implementation, there was evidence that school
foodservice administrators were aware of the need for food safety plans. In different state
and national studies conducted prior to the food safety HACCP policy mandates, foodservice
managers in one study and directors in others were asked their familiarity of knowledge of
HACCP and frequency of policies in place. Hwang, Almanza, and Nelson (2001) conducted
a study among school foodservice managers in Indiana schools to identify factors related to
HACCP implementation. The majority of the responding managers (n = 107, 66.5%)
indicated they were familiar with HACCP, yet of those, only 22 school operations had a
HACCP program in place, although 30 respondents (45%) indicated they were interested or
would be implementing HACCP in the near future. Youn and Sneed (2002) found that 22%
of foodservice directors (FSDs) in Iowa were familiar with HACCP. Giampaoli, Cluskey, et
al. (2002) found in a national study that 30% of school FSDs reported to have implemented
HACCP. Of the 445 schools contacted in the 2006 School Health Policy and Program Study,

6
71.4% of the schools had written HACCP-based plans (O’Toole, Anderson, Miller, &
Guthrie, 2007). Thus, the HACCP mandate did appear to result in plan development. In
another study, the SNA (2008) found that, after the USDA mandate, 85% of schools reported
HACCP implementation.
School foodservice operations use a variety of food production systems, such as
conventional onsite, commissary, satellite, cook–chill, and base kitchens (Unklesbay et al.,
1977). Nettles and Gregoire (2000) identified that school districts with enrollments of less
than 8,500 primarily had conventional onsite kitchens (69.6%) or conventional base kitchens
(54%). The majority of school districts with enrollments greater than 8,500 had conventional
onsite kitchens (31%) or conventional base kitchens (45%). There has been a trend for
school districts to change production systems to central production as a way to streamline
operations and to combat budget constraints. As these changes occur, facilities and
equipment items need to be adequate to ensure proper temperature holding and controls for
products during transportation to service sites (Almanza & Sneed, 2003).
The Food Safety Assurance Pyramid (R. Gravani, personal communication, July 27,
2008) comprises three overarching areas: prerequisite programs, on-going employee training,
and total management commitment. This is the foundation of support not only for the
pyramid but for the success of the HACCP program. Commitment and support from
management and administration are critical; without this support the HACCP program may
not work in school operations (National Advisory Committee on Microbiological Criteria for
Foods [NACMCF], 1998).

7
Training
Training has three key elements: presentation, feedback, and application as defined
by the National Restaurant Association Educational Foundation ([NRAEF], 2008). Training
sessions targeted to adult learners should include why the training is important, how to
perform tasks, and the ability to demonstrate and practice tasks, and should receive feedback
(Oakley, 1999). Presentation is the delivery of the content: feedback covers immediate
reinforcement during the practice time or the application. Once the content is presented, the
learner must have the opportunity to practice, perform tasks, and apply the skills. The
NRAEF (2008) suggested two-thirds of the training time be devoted to application of skills
and practice with feedback.
Oakley (1999) noted training of staff leads to greater job satisfaction, builds program
loyalty, and maybe to lower turnover and decreased absenteeism. Staff development and
professional training benefits the employee through improved morale and the employer by
increasing productivity (Smith & Mazin, 2004). Smith and Mazin (2004) also noted in a
survey conducted by Fortune magazine that the best 100 companies to work for reported
annual training per employee ranged from 5 to 162 hours. This training was company
sponsored and supported. Pannell-Martin (1999) stated the school district “owes it to
employees” (p. 127) to provide training opportunities for personal development. During the
2006 School Health Policy and Program Study, 96.3% of the districts surveyed nationally
provided some funding for staff development (O’Toole et al., 2007). Investing in staff,
whether it is through funds for support of training or time for in-service training, will be
returned by greater productivity, higher-quality meals, and improved service to the students
(Pannell-Martin, 1999).

8
Directors of school meal programs are responsible for encouraging staff to practice
hygiene and food safety procedures. Commitment by directors and school administration is
essential to influence attitudes and actions of staff to ensure goals of the school foodservice
program are met. Although school FSDs believe food safety is important, there is need for
additional training and improvements (Giampaoli, Sneed, Cluskey, & Koenig, 2002).
Giampaoli, Sneed, et al. (2002) also found school FSDs were positive in agreement about
benefits of continuing education in food safety for selves and staff but were neutral on
spending money and time to certify staff. Youn and Sneed (2002) also found school FSDs
identified a need for continued employee training. Food safety training reduces waste, assists
in safe food production, promotes a strong program image, and improves staff retention
(Pannell-Martin, 1999).
Professional and noncertified school foodservice staff are able to join the professional
organization of the SNA. Membership benefits of dues-paying members include on-line
course work, mentor programs, networking, hands-on workshops, and training. Some of the
training program topics are: purchasing, cost control, marketing, and food safety and
sanitation. In 2008, SNA reported 45% of members had received certification for 10 hours
of sanitation and food safety training, and to date, 35,000, or 64%, of the members have
enrolled and received certification for 10 hours of sanitation and food safety training as a
component of the SNA certification process (SNA, 2008).
Training should reach all staff, new and continuing. Employee training has
associated costs, whether these costs are time away from the kitchen for training, trainer fees,
or material and supply expenses. Training programs for new staff should be mandatory and
provide the knowledge and skills needed to handle food safely in school kitchens. Current

9
staff might know the correct procedures, yet continual training will reinforce the concept to
ensure these are followed. Training should be on-going, practiced by staff, and monitored by
management. There is often a gap between what is required and what is demonstrated.
Managers should observe staff and provide feedback to overcome the gaps.
Support for School Foodservice Program from School Business Officials
Financial crises in school districts has led to school administrators looking at ways to
balance the budget and focus on education rather than district services, such as foodservice
(Stracener & Boudreaux, 1997). A deficient budget situation siphons money from a district’s
general fund and means money is used to balance the foodservice fund rather than buy school
books (Smeltz, 2008). The increased pressure on school district budgets decreases the
likelihood that districts will subsidize meal programs if they operate at a loss (Stainbrook,
1991). Increases in food, milk, and energy costs, combined with high labor and benefits
costs, are having an impact on school nutrition program budgets (SNA, 2007; USDA,
2008b). School nutrition programs continue to struggle with lagging reimbursements,
unfunded or underfunded mandates, increased indirect costs, and unpaid student meal
changers. According to the SNA (2010) trends report, responding directors anticipated
increases in budget for food costs (87.6%), labor (63.8%), and indirect costs (55.0%).
Ongoing budget concerns are pressing concerns for districts nationally.
Just as the district provides funding and release time for in-service and professional
development to instructional and administrative staff, noninstructional staff, including those
working in school foodservice programs, should be provided the same educational
opportunities from the same funding source, typically the district’s general fund. Student
meal programs are part of the total educational and school environment and help promote

10
healthy behaviors. School foodservice programs provide critical links between learning and
achievement. These links are defined as improved attendance (Gunderson, 1971), decreased
tardiness, higher test scores (Potts-Datema, 2005), and retaining children in school (J. Martin,
1996). Increased meal participation supports the financial status of the school foodservice
program and provides assurance that children are receiving adequate nutrition, thus ensuring
academic performance is not compromised. School meal programs need the support of the
school district administration to operate as an integral part of the school day.
School business officials (SBOs) are part of the district administration. The SBO has
the important function of ensuring school district budgets are balanced (J. Martin, 1996).
School administrators need to have an understanding of the complexities of the school
foodservice program and be supportive and endorse a positive image of the program.
Examples of demonstrated support for the school foodservice program include providing
adequate meal time periods, assistance with payment collection methods, setting satisfactory
meal prices, providing training funds, setting board-level policies (Strohbehn & Litchfield,
2008), maintaining physical areas, authorizing staff to provide monitoring of children during
mealtime, establishing food safety policies (Sneed & Henroid, 2003), and defending the
program to various stakeholders (March & Gould, 2002).
It is generally recognized that school meal programs should be self-supporting.
Pannell-Martin and Applebaum (1999) observed that school FSDs are often responsible for
operational budgets equivalent to a million-dollar business. These operations are accountable
to taxpayers and must be managed in compliance with regulations of the legislated program.

11
Purpose of the Study
The purpose of this study was to determine support within one USDA region toward
implementation of the food safety plan mandated in the Child Nutrition and WIC
Reauthorization Act of 2004. School FSDs’ assessed level of implementation of a mandated
school food safety plan in their school districts, assessment of district board-level food safety
policies, identification of district food safety training efforts, and perceived support by
district administration for the foodservice program were compared with SBOs’ self-reported
knowledge of food safety plans in their districts, attitudes toward food safety policies, and
identified level of district support for food safety training.
Specific objectives of this study were to determine:
1. What are FSDs’ assessed levels of implementation of a HACCP-based food safety
plan in their districts?
2. What are FSDs’ perceptions of support from district administration for child
nutrition programs?
3. What are the attitudes and knowledge of FSDs toward personal food safety
practices?
4. Do differences exist between FSDs’ attitudes toward food safety training and
personal food safety practices?
5. What is the knowledge and attitudes held by SBOs about HACCP-based food
safety plans in child nutrition programs?
6. Do differences exist between FSDs’ perceptions of support from district
administration for child nutrition programs based on demographic characteristics

12
of age, gender, educational level, years of service, membership, and certification
or credentialed status in SNA?
7. Do differences exist between FSDs’ perceptions of support from SBOs toward
child nutrition programs based on district foodservice programs’ characteristics of
student enrollment, type of production system, number of foodservice staff, and
management?
8. Do differences exist between perceptions of FSDs and SBOs about importance of
district food safety policies?
9. Does a relationship exist between districts’ level of support (release time, funding
for continuing education, and in-service programs) and FSDs’ assessed level of
implementation of a HACCP-based food safety plan in their districts?
10. What role does the state agency play in monitoring and compliance with
reauthorization mandates?
Significance of the Research
This research study will benefit all foodservice operations with programs
administered under USDA federal guidance, including the NSLP, SBP, After-School Snack
Program, Head Start, Residential Child-Care Institutions, Summer Food Service Program,
Child Care and Adult Food Program, Special Milk Program, Supper Program, and the Fruit
and Vegetable Program, as well as school administrators and SBOs. Data will add to the
body of knowledge about food safety program implementation given that the Child Nutrition
and WIC Reauthorization Act of 2004 required HACCP-based plans for districts beginning
with the 2006–2007 school year.

13
To date, little research has been conducted to assess actual perceived levels of
implementation of a school food safety plan, as described in the Guidance for School Food
Authorities (USDA, 2005a), or district administrative support for food safety training. This
exploratory study identified the relationship between the level of implementation of school
food safety plan and administrative support for food safety training. Limited research has
been published about administrative support of food safety programs in school districts.
Therefore, data gathered during this study will be beneficial to school FSDs when planning
future food safety training for child nutrition programs following changes in regulations in
regards to food procurement or handling, when foodborne pathogens increase, as the food
supply changes, and as the staff become more diverse. The USDA (2005a) Guidance for
School Food Authorities outlines the purpose, requirements, and steps in the development of
a school food safety plan program. This study provides informal feedback as to the
effectiveness of this guidance.
Assumptions of the Study
The researcher assumes FSDs and SBOs honestly and accurately reported
information, and returned complete surveys.
Limitations of the Study
The sample of FSDs and SBOs were limited to those from the population of public
school districts serving students in grades K–12 with enrollments from 2,500 to 25,000
students in the states comprising the USDA Mid-Atlantic region . The school districts in this
sample represented districts from rural, suburban, and urban cities. Districts with
enrollments smaller than 2,500 might not have a designated a FSD; might have offered fewer
menu choices and had fewer production and service sites in the district, and/or might have
14
been unable to articulate their food safety process. School districts with over 25,000 students
might have a different infrastructure, larger budget, and additional support staff solely
assigned to monitoring food salary compliance. Although school districts in the territories of
Puerto Rico and U S. Virgin Islands are part of this USDA region they were not surveyed
because both are outside the continental United States, because of the study’s restrictions in
enrollment size, and because of the perceived inability to clarify any survey questions via
telephone. The District of Columbia was not represented because of restrictions in
enrollment size, as the school district’s enrollment exceeds 25,000 students.
The survey response rate may be a factor as a low response rate will not be reflective
of the entire region. Additional limitations may include accuracy of self-reporting
information and lack of cooperation from FSDs or SBOs. Securing valid addresses and
contact information for the sample population may have been problematic. All
communications and surveys were paper-and-pencil and sent via the postal service unless the
participant specifically requested an on-line survey.
Definitions of Terms
The following terms or definitions were used in this study:
Base kitchen: A school kitchen in which foods are prepared and served onsite at the
production school and also transported to other schools or satellites for service; also
known as a regional kitchen (Unklesbay et al., 1977).
Centralized food production facility: Foodservice system design to prepare food for large
groups; may serve food on site or prepare for off-site delivery, catering, or vending
machine; items may require finishing preparation when received or may be ready to
serve (Barry & Litchford, 1998).

15
Central kitchen: A food production facility in which food is produced for service off site in
receiving (satellites), often a large production facility; also known as a commissary
(Unklesbay et al., 1977).
Contract feeding: Foodservice provided through an outside firm; may include outside
management, personnel, and food purchasing (Silberberg, 1997).
Conventional foodservice system: A foodservice system in which ingredients are assembled
and food is produced on site, held either heated or chilled, and served to customers;
some foods are purchased fully prepared and require only portioning and service,
whereas other products require full preparation; it is very labor intense (Unklesbay et
al., 1977).
Flow of food: A path, from receiving through storing, preparation, serving, cooling, and
reheating, that food follows in a foodservice system (Barry & Litchford, 1998).
Food production center: A facility in which food is prepared to be served at another location
(Barry & Litchford, 1998; Silberberg, 1997).
Foodborne disease or illness: Infection or intoxication caused by microbial or chemical
contaminates in food (Healthy People, 2010).
Hazard Analysis Critical Control Point (HACCP): A food safety system that focuses on the
flow of food in a foodservice operation in order to reduce the risk of foodborne illness
(Barry & Litchford, 1998); a systematic approach to construct a food safety program
designed to reduce the risk of foodborne hazards by focusing on each step of the food
preparation process—from receiving to service (USDA-FNS, 2005a).
Kiosk: A small, free-standing structure with open sides (Barry & Litchford, 1998) and a
decentralized dispensing or serving area that is sometimes mobile (Silberberg, 1997).

16
Personal hygiene: Habits of the food handler, which include clean clothes/uniform, hand
washing practices, good health, and neat and clean body (NRAEF, 2008).
On-site kitchen: A kitchen that prepares and serves food at the same location (Barry &
Litchford, 1998; Silberberg, 1997).
Satellite kitchen: A site that receives prepared food from a central kitchen; food is
transported (cold, frozen, or hot) to this location and may be transported in bulk food
containers and portioned and served at the satellite school or sent preplated from the
central kitchen to the satellite school (Barry & Litchford, 1998).
School business official (SBO): Financial officer in a public school; common titles are:
Business Manager, Business Administrator, or Assistant Superintendent for Finance
(M. Braun, July 11, 2008 personal communication).
Self-contained kitchen: A kitchen in which food is prepared and served on the premises; also
called an on-site production kitchen (Barry & Litchford, 1998; Silberberg, 1997).
Standard operating procedure (SOP): A step-by-step written guideline for routine tasks to
reduce food safety hazards; a foundation for the food safety program (USDA-FNS,
2005a).
Traditional system: Referred to as conventional system or self-contained kitchen where food
is prepared and served at the same place; according to National School Foodservice
Management Institute’s (NSFMI) research 70% of schools in the United States use
this type of system (Barry & Litchford, 1998).
Transportation: In the event food is prepared in one place and served in another,
transportation activities include moving food and nonfood products, can storage and

17
cleaning, return of soiled ware for sanitizing or disposal, and the collection and
disposal of plate waste (Barry & Litchford, 1998).

18
CHAPTER 2. LITERATURE REVIEW
Introduction
Serving safe food is critical for school foodservice programs and key to a healthy
school environment (USDA-FNS, 2005a). Protecting customers and employees ensures
repeat business. Safe food handling leads to lower food cost and maintains appearance,
flavor, and texture of foods (NRAEF, 2008). Food that is stored properly, prepared correctly,
and served appropriately yields a quality product. If foodborne illness occurs, attorney fees
and insurance costs escalate and there is loss of revenues due to decreased participation in
school meals (Marx, 2008). Costs associated with foodborne illness also include lower
employee morale, absenteeism, loss of prestige, bad publicity (NRAEF, 2008), and student
absenteeism affecting student performance in school (Marx, 2008). Keeping foods safe is a
critical part of healthy eating, as recommended by the Dietary Guidelines for Americans
2010 (USDA & U.S. Department of Health and Human Services, 2010).
Foodborne illnesses are diseases carried to people by food (NRAEF, 2008). In 2010,
the CDC released new estimates of foodborne illness outbreaks in the United States. Each
year, an estimated 9.4 million illnesses, 55,961 hospitalizations, and 1,351 deaths result from
consumption of foods contaminated with known disease agents (Scallan, Griffin, et al., 2011;
Scallan, Hoekstra, et al., 2011), and an additional 38.4 million illnesses, 71,878
hospitalizations, and 1,686 deaths are estimated from consumption of foods contaminated
with unspecified agents.

19
Food Safety in Retail Foodservices
Incidences
FoodNet data showed Salmonella spp. has not declined in 15 years (CDC, 2011).
Salmonella spp. is the most common infection annually and the most common cause of
hospitalization and death tracked by FoodNet. Salmonella spp. can contaminate a wide range
of foods. There are many different types of Salmonella spp., and each type tends to have
different animal reservoirs and food sources, making control challenging. Vibrio infections
are rare, but often serious, and are caused by eating contaminated seafood or exposing an
open wound to seawater. These cases of infection continue to increase. Infection caused by
Escherichia coli (E. coli) has declined by 44%. Downward trends in food borne infections
can be attributed to: cleaner slaughter methods, microbial testing, better inspections in
ground beef processing plants, regulatory prohibition of beef contaminated with E. coli,
improvements in the U.S. Food and Drug Administration (FDA) model food code (FDA,
2009), and awareness in retail and institutional foodservice sites and consumers’ home for
consumption of undercooked ground beef.
In the winter of 1993, the Jack in the Box restaurant chain was linked to an E. coli
O157:H7outbreak. This bacterial strain normally lives in the intestines of humans and
animals and is known to produce toxins that can cause diarrhea. However, toxin-producing
strains, called Shiga toxin-producing E. coli, can be acquired by eating contaminated food
and consuming meat that is rare or inadequately cooked. One strain from this group, known
as E. coli O157:H7, can cause severe diarrhea and kidney damage. E. coli O157:H7 sickened
over 700 people in four states and led to 171 hospitalizations and 4 deaths. Findings of
causes were twofold: Employees were undercooking the hamburgers and contaminated meat

20
was sourced from undetermined slaughter houses. As a result of the outbreak, the restaurant
chain lost over $160 million in both lost sales and court costs (Marler, 2008). The outbreak
did lead to changes in meat inspection, regulations, and cooking recommendations.
During the early winter of 2006, an outbreak sickened 81 people in three states who
were patrons of Taco John’s. Twenty-six people were hospitalized, and two suffered a type
of kidney failure called hemolytic uremic syndrome. Shredded lettuce was identified as the
likely vehicle of transmission in the outbreak. As late as 2011, the FDA was still conducting
ongoing investigations, as E. coli O157:H7 bacteria in samples were associated with samples
gathered from dairy farms near the lettuce growing areas (FDA, 2011).
During August–September of 2006, CDC (2006b) reported outbreaks in 26 states
with a total of 183 persons infected with a strain of E. coli O157:H7. Of these cases, 95
(52%) people were hospitalized, 29 (16%) had hemolytic uremic syndrome, one person died,
and there were possibly two additional related deaths. Close to 95% of patients reported
consuming raw spinach before showing signs of illness symptoms, and the FDA identified
implicated the spinach was grown in three California counties (CDC, 2006b). Later in 2006,
the CDC reported an outbreak in four northeastern states where public health investigators
identified a few ingredients (lettuce, cheddar cheese, and ground beef) that were consumed
by Taco Bell restaurant patrons who became ill. Of the 71 ill persons, 53 (75%) were
hospitalized, of which 8 (11%) developed hemolytic uremic syndrome, and a total of 52
cases were confirmed for E. coli O157 strains. The CDC (2006a) suggested that, because
many Taco Bell restaurants were involved during the same time period, contamination of
lettuce likely occurred before reaching the restaurants.

21
During 2010, the CDC and the Washington State Department of Health confirmed
food served at Taco Bell restaurants was the source of Salmonella Hartford and Salmonella
Baildon outbreaks, yet a particular food item or supplier had not been identified (Schreck,
2010). Mid-winter of 2011, 14 people in five states were identified with an outbreak of strain
E. coli O157:H7. Food sources appeared to be from Seltzer Brand Lebanon bologna
(Rothschild, 2011). In late summer of 2011, a Salmonella Heidelberg outbreak was traced to
Cargill ground turkey with cases found in 34 states. Over 107 people became sick and one
person died. There were two recalls that included 36 million pounds of ground turkey (H.
Martin, 2011).
In a recent outbreak of Listeria monocytogenus in September and October of 2011,
Colorado cantaloupes from Jenson Farms caused 29 deaths and illness in 139 people (Goetz,
2011). Prior to the Colorado incident, Del Monte cantaloupes were found to be connected to
12 cases of Salmonella Panama poisoning in four states traced to a farm in Asuncion Mita,
Guatemala (Rothschild, 2011). The CDC reported that eight of the people who got sick had
eaten cantaloupes purchased from the same Costco warehouse club. Investigation of whether
the fruit had come from the same Guatemalan farm is still in progress (Neuman, 2011).
Risk Factors
The CDC gathered data on all confirmed foodborne outbreaks from 1982 to 1997.
Clinical profiles were developed based on outbreak characteristics. A total of 2,246
foodborne outbreaks were identified. The outbreaks were divided by strain and whether the
etiology was known or unknown. Of the 697 (31%) with known etiology, Salmonella spp.
accounted for 65% of these outbreak. Of the 1,549 (69%) with undetermined etiology,
norovirus, Clostridium perfringens, Bacillus cereus, Staphylococcus aureus, and Salmonella

22
spp. were suspected. Poor personal hygiene and improper holding times and temperatures
were suspected as contributing factors (Hedberg, Palazzi-Chruas, Radke, Selman, & Tauxe,
2008).
Restaurants are important settings for foodborne disease transmission. The
Environmental Health Specialists Network identified factors in 22 restaurants contributing to
outbreaks from June 2002 through June 2003. The most common foodborne pathogen was
Norovirus, which was responsible for 42% of the confirmed foodborne outbreaks during this
period. Contributing factors were identified as food handling by an infected person (65%)
and bare-hand contact with food (35%). A concurrent study found that, in restaurants that
did not have confirmed outbreaks, 71% employed certified kitchen managers and the
occurrences of bare-hand contact with foods as a contributing factor was fewer. Certification
of kitchen managers in food safety, in addition to food safety training programs, appeared to
be an important outbreak prevention measure (Hedberg et al., 2006). Factors associated with
contributing to occurrence of foodborne outbreaks in restaurant settings include: improper
storage or handling temperature, inadequate cooking, contaminated equipment, poor personal
hygiene of food handler, and food obtained from unsafe sources (Hedberg et al., 2008).
Food Safety Management Systems
K. R. Roberts and Sneed (2003) conducted research to determine the extent to which
prerequisite and HACCP programs were implemented in independent restaurants in Iowa.
HACCP programs are one means to ensure the safety of food. They found only 8% of the
restaurant managers indicated they had a comprehensive HACCP food safety plan in place.
The majority of prerequisite programs were reported as not implemented. The researchers

23
also found a greater number of food safety practices were implemented in restaurants where a
manager had food safely knowledge or training.
K. R. Roberts, Barrett, and Sneed (2005) conducted a study to obtain baseline data
about the presence of HACCP and prerequisite programs in chain and independent
restaurants in Iowa and Kansas through a written questionnaire for sanitarians. The
researchers found prerequisite program most often lacking in independent restaurants with
limited use of HACCP-standardized recipes and little reported progress in prerequisite
program implementation in the previous 5 years. Results indicated that important food safety
practices were not yet implemented in Iowa and Kansas restaurants (K. R. Roberts et al.,
2005).
In another study, Almanza and Ghiselli (1998) evaluated two grill-type foodservice
operations to determine the length of time required to implement a HACCP food safety plan.
Grill-type operations’ procedures and policies were reviewed. A pilot HACCP system was
developed, including flow charts, critical limits, corrective procedures, and checklists for the
two grill operations to pilot during a 2-week period. Data were gathered to determine the
length of time needed to complete the checklists. The study found it took approximately 30
minutes for managers to complete checklists (Almanza & Ghiselli, 1998).
Legislation and Oversight of School Meal Programs
Historical Overview of School Meal Programs
School meal programs that operate during the school year include the NSLP, SBP,
After-School Snack Program, Special Milk Program, and the Fresh Fruit and Vegetable
Program. These programs offer nutritious meals and snacks and provide an opportunity for
children to practice skills learned in classroom nutrition education as well as promote

24
learning readiness and healthy eating behaviors. In addition, the meal programs provide milk
for children who do not have access to school meals and encourage children by regions the
opportunity to choose more fresh fruits and vegetables during the school day. These school
meal programs receive federal assistance and operate in over 101,000 public and non-public
private schools and residential child care institutions in the United States (SNA, 2011b).
The NSLP nutrition standards for lunches are consistent with the Dietary Guidelines
for Americans, which recommend no more that 30% of calories from fat and less than 10%
of these from saturated fat. During the first year of the NSLP in 1946, only 7.1 million
children participated. Currently meals are available to over 50 million children each school
day (Food Research and Action Center ([FRAC], 2007d). An average of 31.6 million per
children per day ate a reimbursable lunch in fiscal year 2010; 64.88% of these meals were
served as free or reduced priced lunches as noted in the Code of Federal Register (USDA,
2011b). Federal support for the NSLP was close to $10 billion in 2010 (USDA-ERS, 2011).
The SBP was established in 1966 as a 2-year pilot program to assist schools serving
breakfast to “nutritionally needy” children. The program was permanently established by
appropriations in 1975. School breakfast meals provide one-fourth of the daily
recommended levels for key nutrients (FRAC, 2007b; USDA 2011d). During 1966, the first
year of the pilot program, 80,000 children received breakfast (USDA, 2011d). The SBP
currently operates in nearly 85% of schools that participate in the NSLP (USDA, 2011d), or
approximately 84,500 schools (FRAC, 2007a; USDA, 2007e, 2007f). More than three out of
four schools that serve lunch also serve breakfast (FRAC, 2007a). In some states, West
Virginia and New Jersey, breakfast is mandated. Over 11.6 million children ate school
breakfast during fiscal year 2010; in this same period 83.63% were served free or reduced-

25
priced breakfasts as identified in the Code of Federal Register (USDA, 2011b). The federal
reimbursements for the SBP during fiscal year 2007 were over $2.0 billion (USDA, 2011d).
The SMP provides milk to children in school and childcare settings who do not
participate or have access to other federal meal programs. However, districts participating in
the NSLP and SBP may participate in the SMP and will be reimbursed for milk served to
enrolled children (J. Martin, 1999b). In 2006, over 96 million half-pints of milk were served
through the SMP at an annual cost to USDA of $14.8 million (USDA, 2011e).
The pilot program for the Fresh Fruit and Vegetable Program (USDA, 2007d) began
in 2002 and operated in only four states. It has since expanded to all 50 states and the
District of Columbia as part of the 2008 Farm Bill. Districts participating in the Fresh Fruit
and Vegetable Program provide free fresh fruits and vegetables to children outside of
children’s regular meal service (USDA, 2007c). Funding was set at $9 million for the first
eight states and reduced to $6 million for the remaining states (USDA, 2007c).
Programs that operate outside the school day or year include summer foodservice and
child and adult care programs. The Special Food Service Program for Children started in
1968 as a 3-year pilot for day-care and summer meals (FRAC, 2007c; USDA, 2007a, 2007b).
Under the NSLA and the Child Nutrition Act of 1966 and the amendment of 1975, the
summer program and the day-care, or Child and Adult Care Food Program ,were split into
two programs. The Summer Food Service program was created in 1968 as an entitlement
food security program. It began as a pilot program with grants to states for meal provision to
low-income children when school was not in session (USDA, 2007g, 2011a). In the first
year, 1969, nearly 1.8 million meals were served to children (USDA, 2007a); currently over
1.9 million meals are served per year (USDA, 2007g, 2011a). Federal support for the

26
program during the fiscal year of 2007 was $286 million dollars (USDA, 2007g, 2011a). The
Child and Adult Care Food Program also was founded in 1968 to provide meals and snacks
to children and adults who receive care in nonresidential day care centers. At the inception
of the program, fiscal year 1969–1970, 39,800 meals were served; currently over three billion
meals and snacks are served to children and adults each year (USDA, 2007b). Of the meals
served, it is estimated over 80% were provided to those at risk of food insecurity. Current
program costs are over $2 billion (USDA, 2007b). The Child and Adult Care Food Program
has expanded to reach children and adults in emergency shelters and after-school care
programs (USDA, 2007a).
Legislative Impacts on Meals Programs
During the 1930s, aid for the school meals program came from the Reconstruction
Finance Corporation (Gunderson, 1971). During the 79th
Congress, Public Law 396
approved a permanent school meals program, which became known as the NSLA
(Gunderson, 1971). Until this time, federal funds were authorized year to year for school
lunch and school milk programs. The underlying foundation of the bill included
comprehensive legislation for assistance to schools that met described meal patterns,
allowances for commodities, support for asset purchases such as startup equipment, and
matching rates for federal funds (Gunderson, 1971). Amendments to the NSLA have
continued over the years to the present. These amendments changed the formula on how
funds were appropriated to schools outside the continental United States (i.e., to U.S.
territories) and extended the SMP (Gunderson, 1971). The SMP became part of the NSLA
and the Child Nutrition Act of 1966. As part of this act, sweeping changes occurred such as
authorization of the pilot breakfast program appropriations, the establishment of National

27
School Lunch Week, the funding of nonfood assistance, provision of state administrative
funding, and the approval of a proposal to authorize all school foodservice programs under
one agency for guidance and supervision (Gunderson, 1971). In May of 1968, Congress
amended the NSLA and Child Nutrition Act of 1966 to include private and nonprofit
institutions, day-care centers, summer programs, and services for handicapped children
(Gunderson, 1971). Prior to the 91st Congress, the NSLA did not address needy children, just
those above poverty levels. In 1970, an amendment to the Richard B. Russell National
School Lunch and Child Nutrition Act of 1966 brought significant changes concerning
requirements for providing free or reduced-price lunches to needy children (Gunderson,
1971). During the next 10 years, further amendments to the National School Lunch and
Child Nutrition Acts were introduced to provide direct certification for those families
receiving food stamps (Pennsylvania Department of Education, 2007). Amendments also
have addressed the Coordinated Review Effort (CRE), School Meals Initiative for Healthy
Children (SMI), and New Menu Planning Systems (Pennsylvania Department of Education,
2007). These amended components of CRE and SMI include a standardized compliance
review process developed by the USDA and conducted by the state agency for schools with
NSLP, SBP, and After-School Snack Programs (SNA, 2008). In 2004, Public Law 108-265,
known as the Child Nutrition and WIC Reauthorization Act, addressed regulations to
strengthen nutrition programs and the health of the child. These federally mandated polices
addressed wellness and food safety but were unfunded. Districts participating in child
nutrition programs were required to develop by June 2005 a district wellness policy and
implement a food safety program for the preparation and service of school meals served to
children based on HACCP principles. Later, the date for compliance was moved to June 30,

28
2006. Another mandate addressing food safety in the Child Nutrition and WIC
Reauthorization Act of 2004 amended section 9(h) of the NSLA and required an increase
from one to two health/safety inspections for each school kitchen participating in the NSLP
and SBP and required inspection reports to be posted each year and available upon request
(P. L. 108-265). This rule enhances the safety of over 38 million meals served in federal
programs to school children daily (USDA, 2009a). Prior to P.L. 108-265, there were no
federal requirements for a HACCP-based food safety plan for school meal programs
participating in the NSLP and SBP. Guidance for these mandates was made available to
schools a year after the reauthorization date in July of 2005 (USDA, 2009a).
The Healthy, Hunger-Free Kids Act of 2010 (P.L. 111-296) was signed into law mid-
December of 2010 with an effective date July 1, 2011 (USDA, 2011b). Section 204
strengthens local wellness policy (LWP) compliance, implementation, evaluation, and
assessment; adds goals for nutrition promotion; and expands LWP membership, requiring
teachers of physical education, school health professionals, parents, students, representatives
of the school food authority, the school board, school administrators, and the public to
participate in the development of wellness policies. The provisions from section 205 address
the flexibility to increase paid lunch prices, as these prices on average must be equal to the
difference in prices between and free and paid lunch reimbursement using USDA guidance;
other school meal prices were not impacted by this legislation. Section 206 requires all
nonreimbursable foods to generate revenue equal to the cost of an item. During the
performance review, as noted in section 207, findings and violations are required to be made
available to the public. In section 210, 243, school and organic gardens and farm to school
activities are noted. Section 306 establishes professional educational standards for staff

29
through training programs, and certification requirements for foodservice staff and directors.
All the sections noted are unfunded mandates with the exception of sections 210, 243, and
306, for which funding was defined, but it’s uncertain how funds will be diverted to local
educational agencies (USDA, 2011b).
Schools and Food Safety
Young children are at increased risk for foodborne illness; thus safe food preparation
in school lunch programs is critical (Richards et al., 1993). The food served as part of the
school meals programs should be healthy and safe (Shield & Mullen, 2002). Preventing
foodborne illness is an important concern in school settings because outbreaks have personal,
academic, financial, and legal consequences for each school district (Marx, 2008). Student
absenteeism affects a student’s performance in school, and if a foodborne illness outbreak
occurs, school districts could experience increased insurance costs, attorney fees, and loss of
revenues due to decreased participation in school meals (Marx, 2008).
The CDC (2005) noted that the nation’s 119,000 schools are ideal settings for
educating the nation’s young people about food safety. The CDC (2005) stated “schools are
the only institutions that can reach nearly all youth; they are in a unique position to improve
both the education and health status of young people throughout the nation” (p. 1). Children
under the age of nine are considered an at-risk population and can more easily contract a
foodborne illness from eating or drinking contaminated substances. In a 10-year study
conducted between 1990 and 1999 by the GAO (2003), 3% of reported foodborne illness
outbreaks occurred in schools. Daniels et al. (2002) studied the outbreaks that occurred in
the period between January 1973 and December 1997 and found there were 604 school-
related outbreaks reported to the CDC from state and local health departments. The
30
commonly implicated food vehicles were poultry (18.6%), salad (6%), Mexican-style food
(6%), beef (5.7%), and dairy not including ice cream (5.1%). The commonly reported food
practices contributing to the school-related outbreaks were improper food storage, food
contaminated by a food handler, and improper holding temperatures (Daniels et al., 2002).
Other improper behaviors that have been noted during observational research and survey
studies in schools are poor handwashing (Henroid & Sneed, 2004; Strohbehn, Sneed, Paez, &
Meyer, 2008), lack of hair restraints (Gilmore et al., 1998; Giampaoli, Cluskey, et al., 2002),
lack of calibration of thermometers (Henroid & Sneed, 2004), improper reheating of foods
(Kim & Shanklin, 1999), inappropriate sanitizing, improper heating and cooling (Henroid &
Sneed, 2004), and consumption of food in a preparation area (Giampaoli, Sneed, et al.,
2002). In general, these studies found proper food-handling practices in schools were not
being followed consistently.
Previous research has focused on risk factors associated with foodborne illnesses in
school foodservice operations including food handling and personal hygiene practices (GAO,
2003; Giampaoli, Clusky, et al., 2002; Gilmore et al., 1998; Sneed & Henroid, 2003; Youn &
Sneed, 2002). Some studies have noted that, although staff knowledge of food safety was
evident, proper food safety practices were not implemented.
Incidences in Schools
The GAO (2002a, 2003) reported a total of 195, or 3%, of the 7,390 foodborne
outbreaks nationwide between 1990 and 1999 occurred in schools. “Few outbreaks of
foodborne illness have been reported in connection with the USDA’s school meals
programs” (GAO, 2000, p. 14). Daniels et al. (2002) found that, between the years of 1973
and 1997, state and local health departments reported 604 outbreaks of foodborne illness in

31
schools, with a annual median number of 25 and a range from 9 to 44. In 60% of the
outbreaks, an etiology was not determined (Daniels et al., 2002). Salmonella spp. was the
most commonly identified pathogen associated with 36% of the outbreaks reported in the
Daniels’ et al. (2002) study. The most commonly associated food handling practices
identified in school-related outbreaks were improper temperatures for storage and holding,
and food contamination by staff (Daniels et al., 2002) and inadequate cooking, poor food
worker hygiene, and improper hot holding and cooling of foods (GAO, 2000).
Between October 1997 and October 1998, there were 16 outbreaks of foodborne
illness associated with eating burritos; all but one of these outbreaks occurred in schools.
Shortly after consuming the burritos over 1,700 children became ill; the cause of the outbreak
was never determined. In March 1997, an outbreak of hepatitis A caused by contaminated
strawberries donated by the USDA sickened more than 200 teachers and students in
Michigan and about 50 people in other states. These foods were contaminated prior to
delivery to the school meal programs. In October 1998, 11 children were infected by E. coli
O157:H7 in school lunch taco meat in Finley, Washington. Three of these children
developed hemolytic uremic syndrome; a jury found that the school district was at fault and
awarded $4.75 million to the affected children (GAO, 2003). Studies from school districts in
the states of Georgia, Oklahoma, Rhode Island, and Massachusetts highlighted foodborne
outbreaks that occurred between 1985 and 1990. In May of 1985, 351 children and staff
from a Georgia elementary school developed fever febrile gastroenteritis. Of the children
tested, 100 were isolated and 23 were hospitalized, but none of the illnesses were fatal (CDC,
1985). The illness was strongly associated with the turkey salad from the school lunch meal.
The turkey was cooked on site by kitchen staff and then deboned. The kitchen inspection did
32
not reveal any malfunctioning equipment; however, the investigation did find that after
deboning the turkey was stored overnight and placed into eight-inch deep pans in the cooler
(CDC, 1985). It is suspected that proper cooling procedures were not followed as the warm
turkey placed in a pan over four inches deep could have maintained a temperature of over 50°
F, which is in the temperature danger zone (CDC, 1985). The pathogen isolated from more
than 100 children was Salmonella spp. In 1986, an outbreak of Salmonella spp. occurred in a
public school system in Oklahoma and affected 2,130 students and staff. Symptoms were
diarrhea, nausea, vomiting, abnormal cramps, and fever. Of these students and staff
exhibiting outbreak-related illnesses, strains of Salmonella Heidelberg (27 cases) and
Salmonella Stanley (58 cases) were found and 22 patients were hospitalized with
gastroenteritis. Students were affected more than were teachers, and 11 cafeteria workers
became ill. Food served in the four schools was prepared at one location. The food
associated with the illness was chicken; the investigation found chicken was left to thaw at
room temperature, cooked for 2 hours in the steamer, and held in the steamer overnight at a
low setting. Thus, this potentially hazardous food was not stored properly under
refrigeration, and bacterial cells were able to reproduce to harmful levels (CDC, 1987).
Outbreaks of Salmonella spp. contamination can be damaging and costly. The medical
expense claims totaled $40,000 for this district. Lost income to the school foodservice
program was not identified (GAO, 2002b).
In 1990, Staphylococcal food poisoning occurred in four elementary schools in a
Rhode Island school district. Over 662 meals were prepared at a central kitchen with 100
cases reported (Richards et al., 1993). Meals served by the school were: 144 lunches at
school A with 67 illness reported, 153 lunches served at school B with 27 illnesses reported,

33
121 lunches served at school C with five illnesses reported, 78 meals served at school D with
one illness reported, and 166 lunches served in the central kitchen with zero cases reported
(Richards et al., 1993). Staphylococcus aureus was present in 67% of the children who
became ill. A case was defined as a person who experienced at least one of the symptoms
within 8 hours of eating lunch at school. All of the food was transported from the centralized
school site. No foodborne incidents were reported at the centralized school site. The menu
was sliced ham, baked beans, corn, bread, butter, and milk. Within 2 hours of eating lunch,
children started to show symptoms of illness such as vomiting, nausea, cramps, headache,
fever, and diarrhea (Richards et al., 1993). The investigation consisted of collection of
clinical specimens, on-site kitchen sanitation inspections of all schools, and face-to-face
interviews with all children in attendance on that day. Of the seven food samples recovered
as part of the kitchen inspections, half were found in the dumpster and mixed with other
foods and debris. Findings suggested a higher rate of incidence occurred in two of the four
satellite schools. Thermometers were not present in any kitchens for food temperature
monitoring, transport/holding units did not maintain proper temperature, and large quantities
of warm food were found stored in closed food cabinets in the refrigerators (Richards et al.,
1993). It was estimated hams were held between 50°F and 120°F for a minimum of 15
hours. Kitchens were found to be clean but did not have written operating procedures for
holding potentially hazards foods cooked a day or more ahead of serving. The thawed hams
were steamed for 105 minutes and allowed to cool at room temperature for 45 minutes. After
cooling, three staff members were assigned to remove the casings; each ham was kept whole
until the next day. The three staff members responsible for the food preparation of the ham
removed the casings and sliced the ham without gloves. Of the three staff members, two

34
were found to be asymptomatic, culture negative, and one staff tested positive for carrying
the implicated enterotoxin strain Staphylococcus aureus. Richards et al. (1993) reported the
staff member testing positive also served the meal at the preparation school. The next day
preparation was also problematic as the food was not reheated to 165°F before parceling for
transport to the four schools. On the day of service, the hams were sliced and warmed for 20
minutes. In this scenario, the centralized food preparation system contributed to the
outbreak. The contamination may have occurred when the casings were removed from two
of the nine hams by a food handler who carried Staphylococcus aureus as well as by the
improper reheating, lack of refrigeration, and prolong handling (Richards et al., 1993).
The Massachusetts Department of Public Health (CDC, 2006a) received multiple
reports about 10 outbreaks of gastrointestinal illness among 309 school age children in nine
different schools between February 2003 and May of 2004. Of these 309 cases, 67 children
became ill. The outbreaks were characterized by a short incubation period and short length
of illness. The neurological symptoms were headache and dizziness, and the gastrointestinal
symptoms included cramping, nausea, and vomiting. Ingredients in the tortillas from a single
processor in Chicago, Illinois were found to be contaminated with chemicals. In another
incident occurring during this 15 month period, 10 separate incidents were reported in
Middlesex and Suffolk counties. A total of 31 children became ill after eating lunch. In the
following year, 2004, a total of 36 children became ill after eating lunch in Suffolk County
(CDC, 2006a).
Because foodborne illnesses have occurred in school settings due to factors including
contaminated food, poor hygiene practices, and improper preparation, a need was identified
to provide further guidance to address food safety. The GAO (2000) noted there was not one

35
federal agency that monitored the safety of school meals. Primarily two federal agencies, the
FDA and USDA, have the responsibility to ensure safety of the nation’s food supply. The
USDA Food Safety and Inspection Service (FSIS) is responsible for the safety of meat,
poultry, dairy, and some egg products, whereas the FDA has regulatory oversight for most
processed foods items, including seafood and shellfish.
Food Recalls
Another limitation of the safety system in schools is notification about recalls, as
commodity-donated foods may not be identified. During 1997 and 1998 five incidents of
USDA-donated foods occurred. The foods implicated were strawberries, poultry, and ground
beef (GAO, 2000). Over 1.7 million pounds of strawberries were known to be associated
with a infectious hepatitis A virus outbreak. The outbreak occurred in four states and
affected 254 children and staff (GAO, 2000). USDA-donated beef was suspected in a
Findley, Washington outbreak that affected 11 school children in September, 1998. A
processing plant recalled 2 million pounds of ground beef that was contaminated with
Salmonella spp. A large food recall occurred in January 2008 from one processor for the
commodities program, Hallmark/Westland meats. No products were associated with
foodborne illness, yet due to questions raised about procedural compliance during an
investigation of humane fabrication processes, the meat was deemed subject to recall
(USDA, 2008a)
History of HACCP
The HACCP system was developed and utilized to assure high microbiological and
sensory quality of food served to astronauts in space (Longree & Armbruster, 1987). This
was a cooperative project between the National Aeronautics Space Administration and

36
Pillsbury Corporation. The system was developed and tested at the Natick Laboratories of
the U.S. Army and U.S. Air Force Space Laboratories (USDA-FNS & National School
Foodservice Management Institute, 2002). Application of the HACCP processes created
food for space programs that approached 100% assurance against contamination by bacterial
and viral pathogens, toxins, and physical and chemical hazards (National Food Service
Management Institute [NFSMI], 2009). The FDA initiated a mandated HACCP program for
low-acid canned foods in the early 1970s after an outbreak of Clostridium botulism in canned
mushrooms. A hazard can occur during any of these phases: growing, harvesting,
processing, manufacturing, distribution, preparation, and serving of food for consumption
(NACMCF, 1998). HACCP was designed to prevent problems and unsafe conditions
through implementation of principles developed by the NACMCF. Prerequisite programs
such as Good Manufacturing Practices are the foundation for the development and
implementation of HACCP plans (R. Graviani, personal communication, July 28, 2008). On
July 25, 1996, FSIS issued a Pathogen Reduction/HACCP systems rule that focused on the
prevention and reduction of microbial pathogens in raw products that can cause illness in
meat and poultry processing facilities (USDA-FSIS, 2007). Implementation of HACCP in
the estimated 6,500 federally inspected and 2,550 state-inspected meat and poultry (slaughter
and processing) plants in the United States took three years, from 1997 until 2000 (USDA-
FSIS, 2007). Food safety systems based on HACCP principles also have been mandated for
seafood processing plants based on USDA/FDA regulations (NRAEF, 2008). Voluntary
implementation of HACCP in healthcare, school foodservice, and commercial food
operations had occurred prior to the HACCP mandate with the Child Nutrition and WIC
Reauthorization Act of 2004 (USDA-FNS & NFSMI, 2002).

37
The Child Nutrition and WIC Reauthorization Act of 2004 (P.L. 108-265) instituted
many changes in school foodservice operations with a mandated food safety plan based on
HACCP principles as one of these changes. With the enactment of this public law, schools
became the first sector of the foodservice industry to require a food safety plan based on
HACCP principles.
HACCP and Food Safety Mandates for Schools
A school food safety program is intended to deliver safer food to children by
controlling hazards during the process between receiving and service (USDA-FNS, 2005a).
To assist in the development of the school food safety plan based on HACCP principles, a
guidance document was created and distributed to school FSDs by USDA-FNS (2005a). The
guidance identified the minimum elements to be included in a food safety program (USDA-
FNS, 2005a). Contents of the guidance document included information on the requirements
and process for development of a written plan for each school site in the district that prepared
and/or served meals (USDA, 2005a). The requirements of a school food safety plan were
identified: written standard operating procedures (SOPs) for specific categories of tasks and
with specific components, documentation of menu items in process category, documentation
of critical control points for each process category, identification of monitoring actions,
establishment and documentation of corrective actions, identification of recordkeeping forms
and processes, and evaluation plan for review of food safety plan. USDA-FNS (2005a) listed
the categories of SOPs to include, however sample SOPs for each category were not
included. For example, sample SOPs for the identified categories of cleaning and sanitizing,
purchasing, and storage of dry goods were missing. USDA’s guidance document refers
readers to www.NFSMI.org for final versions of SOPs. Other resources, such as the SNA

38
and Iowa State University (ISU) Extension are also available to school FSDs. The SNA
(2005a) resource, Keys to Food Safety, in the operations section of the School Nutrition
University (SNA, 2011a) includes information about: establishment of a food safety team,
development of district operation, assessment of current operations, creating SOPs, sample
SOPs, and principles as noted in the USDA guidance document (USDA-FNS, 2005a). ISU
Extension resources include the HACCP Journey in School Foodservice (a series of eight
lesson plans for school foodservice staff; Sneed, Mahoney, & Henroid, 2003), a model
school district food safety policy, sample SOPs that have been updated to reflect Food Code
2005 (FDA, 2005), and assessment and monitoring forms that can be used for recordkeeping
purposes (ISU Extension, 2006). Many of the ISU Extension resources were developed with
grant funding support from USDA. Resources from the NFSMI, which is the research and
educational arm for USDA Child Nutrition Programs, contain training materials for
instructors, participant materials for FSDs, and standardized quantity recipes with critical
control points added. The NFSMI materials were created in cooperation with Kansas State
University.
Prior to the requirement for HACCP implementation, there was evidence that school
foodservice administrators were aware of the need for food safety plans. In different state
and national studies conducted prior to the food safety HACCP policy mandates in 2004,
foodservice managers in one study and directors in others were asked their familiarity of
knowledge of HACCP and frequency of policies in place. Less than half of the respondents
in a national and Iowa schools Youn and Sneed (2003) prerequisite programs study indicated
that they had written SOPs for cleaning and sanitizing equipment and facilities (Almanza &
Sneed, 2003).

39
Hwang et al. (2001) conducted a study among school foodservice managers in
Indiana schools to identify factors related to HACCP implementation. The majority of
responding managers (66.5%) was familiar with HACCP, yet of these, only 22 school
operations had a HACCP program in place, although 45% indicated they were interested or
would be implementing HACCP in the near future. Youn and Sneed (2002) found 22% of
responding FSDs in Iowa were familiar with HACCP. Giampaoli, Cluskey, et al. (2002)
found in a national study that 30% of school FSDs reported to have implemented HACCP.
Of the 445 schools contacted in the 2006 School Health Policy and Program Study (CDC,
2006c), 71.4% of the schools reportedly had written HACCP-based plans (O’Toole et al.,
2007). In another study, the SNA (2008) found that, after the USDA HACCP mandate, only
85% of schools reported HACCP implementation.
Training
For a district to be truly successful, staff development should be based on the premise
that all school staff must continuously expand their knowledge and skills (Pennsylvania
Association of School Business Officials [PASBO], 2002). Benefits of a well-trained and
motivated staff are necessary for improved customer service, higher revenues, dedication,
and employee retention (PASBO, 2002). Employee retention and dedication also are higher
when staff is given the gift of knowledge and tools to perform their job with integrity and
expertise (PASBO, 2002).
Training has three key elements: presentation, feedback, and application (NRAEF,
2008). Training sessions targeted to adult learners should include why the training is
important, how to perform the task, ability to demonstrate and practice task, and receive
feedback (Oakley, 1999). Presentation is the delivery of the content; feedback covers

40
immediate reinforcement during the practice time or the application. Once the content is
presented, the learner must have the opportunity to practice, perform tasks, and apply the
skills. The NRAEF (2008) suggested two-thirds of the training time be devoted to
application of skills and practice with feedback.
Oakley (1999) noted training of staff led to greater job satisfaction, built program
loyalty, and could lead to lower turnover and decreased absenteeism. Staff development and
professional training benefits the employee through improved morale and the employer by
increasing productivity (Smith & Mazin, 2004). These researchers also noted in a survey
conducted by Fortune magazine that the best 100 companies to work for reported that annual
company sponsored and supported training per employee ranged from 5 to 162 hours.
Pannell-Martin (1999) stated the school district “owes it to employees” (p. 127) to provide
training opportunities for personal development. During the 2006 School Health Policy and
Program Study, 96.3% of the districts surveyed nationally provided some funding for staff
development (O’Toole et al., 2007). Investing in staff, whether through funds for support of
training or time for in-service training will be returned by greater productivity, higher-quality
meals, and improved service to the students (Pannell-Martin, 1999).
Directors of school meal programs are responsible for staff practice of proper hygiene
and food safety procedures. Commitment by directors and school administration is essential
to influence attitudes and actions of staff to ensure goals of the school foodservice program
are met. Although school FSDs believe food safety is important, there is need for additional
training and improvements (Giampaoli, Sneed, et al., 2002). These researchers also found
school FSDs were positive in their agreement about benefits of continuing education in food
safety for themselves and staff but were neutral on spending money and time to certify staff.

41
Youn and Sneed (2002) also found school FSDs identified a need for continued employee
training. Food safety training reduces waste, assists in safe food production, promotes a
strong program image, and improves staff retention (Pannell-Martin, 1999).
Professional and noncertified school foodservice staff have the opportunity to join the
professional organization of the SNA. Membership benefits of dues-paying members include
online course work, mentor programs, networking, hands-on workshops, and training. Some
of the training program topics are: purchasing, cost control, marketing, and food safety and
sanitation. In 2008, the SNA reported 45% of its members had received certification for 10
hours of sanitation and food safety training as a component of the organization’s certification
process.
Training should reach all staff, new and continuing. Employee training has
associated costs, such as time away from the kitchen for training, trainer fees, and material or
supply expenses. Training programs for new staff should be mandatory and provide the
knowledge and skills needed to handle food safely in school kitchens. Current staff might
know the correct procedures, yet continual training will reinforce the concept to ensure these
are followed. Training should be ongoing, practiced by staff, and monitored by management.
There is often a gap between what is required and what is demonstrated (Henroid & Sneed,
2004). Managers should observe staff and provide feedback to overcome the gaps.
Administrative Program Support
School foodservice, with interwoven federal, state and local laws and policies, is one
of the most complex departments of a school district (Sackin, 2006). School foodservice
program administration has many facets. Although it’s operated as a nonprofit, it is also an
educational program (J. Martin, 1999b). Programs across the nation are facing challenges of
42
operating with increased efficiency. It is generally recognized that school meal programs
should be self-supporting. Pannell-Martin and Applebaum (1999) observed that school FSDs
often are responsible for operational budgets equivalent to a million-dollar business. These
operations are accountable to taxpayers and must be managed in compliance with regulations
of the legislated program.
School districts have tighter budgets and local school boards are not always willing to
cover deficits in school foodservice funds (Cater & Brown, 2002). School foodservice is
expected to operate quality programs with high nutrition standards and be financially sound
(Cater & Brown, 2002). However, not all programs are self-supporting, as revenues have not
kept pace with expenses (Pannell-Martin &Applebaum, 1999). Cho and Nadow (2004)
found a successful school meal program needed collaborative efforts of school
administration.
Financial crises in school districts has led to school administrators looking at ways to
balance the budget and focus on education rather than district services, such as foodservice
(Stracener & Boudreaux, 1997). A deficit budget situation siphons money from the district’s
general fund and means money is used to balance the foodservice fund rather than buy school
books (Smeltz, 2008). The increased pressure on school district budgets decreases the
likelihood districts would subsidize meal programs if the meal programs operated at a loss
(Stainbrook, 1991). Increases in food, milk, and energy costs, combined with high labor and
benefits costs, also have impacted school nutrition program budgets (SNA, 2007; USDA,
2008a). School nutrition programs have continued to struggle with lagging reimbursements,
unfunded or underfunded mandates, increased indirect costs, and unpaid student meal
changers. According to the SNA (2010) trends report, responding directors anticipated
43
increases in budgets for food costs (87.6%), labor (63.8%), and indirect costs (55.0%).
Ongoing budget concerns were pressing concerns for districts nationally.
Just as the district provides funding and release time for in-service and professional
development to instructional and administrative staff, noninstructional staff, including those
working in school foodservice programs, should be provided the same educational
opportunities from the same funding source, typically the district’s general fund. Student
meal programs are part of the total educational and school environment and help promote
healthy behaviors. School foodservice programs provide critical links between learning and
achievement. These links are defined as improved attendance (Gunderson, 1971) decreased
tardiness, increased test scores (Potts-Datema, 2005), and retention of children in school (J.
Martin, 1996). Increased meal participation supports the financial status of the school
foodservice program and provides assurance that children are receiving adequate nutrition,
thus ensuring academic performance is not compromised. School meal programs need the
support of the school district administration to operate as an integral part of the school day.
School business officials are part of the district administration. The SBO has the
important function of ensuring school district budgets are balanced (J. Martin, 1996). School
administrators need to have an understanding of the complexities of the school foodservice
program and be supportive as well as endorse a positive image of the program. School
administrators play an important role in policy implementation. They may be unaware of
legislation or issues related to policy implementation. Therefore, school FSDs must inform
administration of the knowledge of the policy, assess the intent of the support from the
administration, and identify concerns related to the policy (Molaison & Carr, 2006). Areas
where the SBO can offer support to the school foodservice program include funding and

44
release time to support training to maintain a strong food safety plan, adequate meals times,
facility upkeep, and child nutrition program support.
Examples of demonstrated support for the school foodservice program from district
decision makers include providing adequate meal time periods, providing assistance with
payment collection methods, setting satisfactory meal prices, providing training funds,
setting board-level policies (Strohbehn & Litchfield, 2008), maintaining physical areas,
authorizing staff to provide monitoring of children during mealtime, establishing food safety
policies (Sneed & Henroid, 2003), and defending the program to various stakeholders (March
& Gould, 2002).
Successful implementation of a HACCP program requires a strong commitment from
administration or management (NACMCF, 1998). This commitment is reflected in
awareness of the benefits and cost of HACCP and include education and training for staff
(NACMCF, 1998). Benefits, in addition to assurance of safer foods, are timely response to
problems and better use of resources.
As part of an exploratory study to investigate relationships between SBOs support of
school meal programs and FSDs perceptions of support with implementation of district
HACCP plans, two surveys were developed. Surveys were sent to SBOs and FSDs in one of
the USDA regions.

45
CHAPTER 3. METHODOLOGY
Introduction
The purpose of this study was to determine district support within one USDA
geographic region for implementation of a mandated school food safety plan by location
where food is prepared or served as presented in the Child Nutrition and Reauthorization Act
of 2004 by July 1, 2006. Continental U.S. public school districts in the USDA Mid-Atlantic
region with enrollments between 2,500 and 25,000 students were the population for this
study (N = 1,744) with the exclusion of districts in the District of Columbia, Commonwealth
of Puerto Rico, and U.S. Virgin Islands. Although districts in these territories are part of this
region, they were not surveyed because they did not meet study restrictions for enrollment
size (District of Columbia) and contacting these areas were perceived to be cost prohibitive
for any clarification of questions via telephone, as both Puerto Rico and the Virgin Islands
are located outside the continental United States.
School FSDs assessed levels of implementation of a mandated school food safety
plan in their districts, perceived administrative support, and identification of district’s food
safety training efforts were compared with SBOs’ identified knowledge about child nutrition
programs and level of support for food safety training and state agency’s role in monitoring
and compliance of the reauthorization mandates. A sampling mode of mail surveys was used
to gather data from public school FSDs and SBOs in medium-sized districts of the six states
that comprise the continental USDA Mid-Atlantic region: Delaware, Maryland, New Jersey,
Pennsylvania, Virginia, and West Virginia. Prior to reviewing for content validity and pilot
testing of the two surveys created for this study, all data collection instruments and research
protocol were reviewed and approved by the ISU’s Office of Research Assurances and

46
Human Subjects Review Committee (Appendix A). Study population, sampling procedures,
data collection tools, and data analysis are described below.
Study Population
Medium-sized U.S. public school districts located in the continental USDA Mid-
Atlantic region serving grades K through 12 with enrollments between 2,500 and 25,000
students were the target population because they reflect urban, suburban, and city districts.
Information gathered from districts in these states represented the majority of districts in the
country. According to the SNA (2006), the top 100 school districts in the country by
enrollment have enrollments of 45,000 students or greater, representing only 0.6% of the
enrollment population nationally. Data from the U.S. Department of Education (Dalton,
Sable, & Hoffman, 2006) reflected that, in the 2003–2004 school year, each of the 100
largest districts had an enrollment of at least 46,591 students, with a combined enrollment of
11,280,677, which represented 22.9% of the nation’s enrollment. Districts with enrollments
of 2,500–25,000 are more representative of the average school district population. In this
study, districts with enrollments of 2,500–25,000 represented about half of the students
enrolled in the mid-Atlantic region.
The Mid-Atlantic USDA Region consists of six states. A review of the U.S.
Department of Education database and the National Center for Education Statistics ([NCES],
2007) indicated a total of 1,744 school districts in the region, with 498 districts from the six
states meeting enrollment parameters described previously (shown in Table 1). The average
number of school buildings per district was 10.12, with an average of 577 students per
building.

47
School districts with enrollments of less than 2,499 students represented 69.8% of the
population of the districts in the Mid-Atlantic region. Districts in the region with enrollments
up to 25,000 students represented 28.56% of the population of the public school districts,
whereas the number of districts with 25,001 and more students represented 1.53% of the
districts in the Mid-Atlantic region population. In the Mid-Atlantic region, only 0.005%, or 8
of the 1,744 school districts, have more than 100,000 students enrolled. Thus, the proposed
enrollment parameter reached approximately one third of the number of public school
districts in this UDSA region and represent rural, city, and suburban areas. Although
districts with enrollments of fewer than 2,500 students do represent the majority of districts
in the region, some of these districts consist of vocation–technical schools, nonpublic
schools, and regional school districts that comprise only grades K–6, K–8, 7–12, or 9–12.
Further, some of these districts may serve student meals but may not participate in the SBP
or NSLP. There were 1,744 school districts in the Mid-Atlantic
Table 1
USDA Mid-Atlantic Region District Characteristics by State
All school districts
School districts with student enrollment
between 2,500 and 25,000
State n n %
Delaware 36 13 37.14
Maryland 25 13 52.00
New Jerseya 670 131 19.55
Pennsylvania 730 228 31.23
Virginia 226 76 33.63
West Virginia 57 37 64.91
TOTAL 1,744 498 28.56
aDistricts in New Jersey are configured as K–5, 6–8, 9–12, and/or K-12.
48
region, totaling 5,706,192 students in 8,047 buildings. The population selected for this study
represented 28.56% of the districts in the region and comprised 51.04% of the student
enrollment in the Mid-Atlantic region.
Sampling Procedures
All school FSDs and SBOs in districts with student enrollments between 2,500 and
25,000 in the Mid-Atlantic region received a survey. All contact and mailing information for
the school FSDs was identified from public school district lists provided by each state’s
education agency, personal contacts, and NCES (2007) listings. During 2003–2004, a cohort
of ISU Ph.D. students compiled a master list from the NCES (2007), state departments of
education, state school foodservice, and personal contacts. This list was further filtered and
updated using NCES (2007) data. A list of the names of districts’ SBOs was obtained from
each state’s department of education and matched with the school foodservice names and
schools. The postal surveys for SBOs were mailed jointly with the school FSDs’ survey
packet. Because Dillman (2007) stated a personal letter leads to a greater survey return
response, every effort was made to include a survey cover letter with the recipient’s name
and address. The recipient’s name and address was printed on a label affixed to the cover
letter. Surveys addressed to the school district FSD and the SBOs in the entire population of
districts that met enrollment criteria were mailed jointly under separate cover. All data were
treated confidentially; no district name was placed on the survey. Identification numbers
placed on the lower right corner of the last page of each survey were used to track responses
and removed once data entry was complete. Respondents were asked to include with the
return of the survey a business card, which was separated from the completed survey upon

49
receipt, if they desired a copy of the results. Each state has an agency director, and each was
invited to participate.
Content Validity
Two expert panels reviewed the FSD and SBO surveys for content validity. The
expert panels consisted of school FSDs employed outside the Mid-Atlantic region, members
of the Child Nutrition Academy (ISU classmates) with expertise in research design, and five
graduate SBO students in New Jersey. All comments were reviewed, and the content of the
surveys were revised as needed for the pilot testing. A letter and evaluation form was
developed for FSDs and SBOs (Appendices B, C, D and E).
Pilot Testing
Eight school FSDs and their district SBOs were selected randomly from districts with
enrollments of 2,500 to 25,000 serving school meals to grades K–12 in six other USDA
geographic regions (Northeast, Midwest, Southeast, Southwest, Mountain Plains, and
Western; N = 96). These directors and SBOs were asked to pilot test the appropriate survey
for clarity and estimate the time needed for completion. Two pilot test districts were selected
randomly from each of the following enrollment ranges per region: 2,500–5,000, 5,001–
7,500, 7,501–10,000, and 10,001–25,000. These selections of districts by enrollment had
equal number of districts within each enrollment range. An evaluation matrix was provided
to each member to complete and return via postal mail to the researcher. For convenience,
the districts identified in the pilot test were sent both a FSD and SBO survey and the FSD
collected the evaluation form (Appendices F, G, H and I) and returned it to the researcher.
Distribution of the 60 surveys were as follows to mirror enrollment categories within
the Mid-Atlantic region: 32 survey sets to districts with enrollments of 2,500–7,500, 19
50
survey sets to districts with enrollments of 7,500–15,000, and 21 survey sets to districts
with15, 001–25,000. Eight FSDs returned complete usable surveys and 14 returned partially
completed surveys for a total of 22 surveys responses from FSDs. Two SBOs returned
complete surveys and 10 returned partially completed for a total of 14 SBO surveys. Surveys
were received from at least one FSD and SBO from districts in each category of enrollment,
and responses were received from five of the six regions. As a result of the comments from
those participating in pilot test, modifications were made to the format of the questions in the
survey prior to distribution.
Data Collection Procedures
School Foodservice Directors
In November, the survey packets were sent to school FSDs (N = 498) in all districts
meeting enrollment criteria in each of the six states in the Mid-Atlantic region. They were
asked to distribute the survey to the SBO in their districts. The survey packets consisted of
instructions and color-coded survey, printed on six, 24-pound, high quality, 11” x 17”,
different-colored (blue, ivory, white, tan, gray, and salmon) paper for both the FSD and the
SBO. First class postage was affixed to self-addressed return envelopes and interior sealing
envelopes for the SBO survey. In an effort to maximize the response rate, a presurvey note is
one strategy to encourage a higher rate of survey response (Creswell, 2005; Groves et al.,
2004). Participants had been contacted previously by an introductory presurvey postcard
asking for their participation in the mail survey (Appendix J). The list of districts meeting
enrollment criteria was based on the available information from a compilation of databases
including those from state agencies, personal contacts, and the NCES (2007). Multiple
follow-up procedures also were used (Creswell, 2005; Dillman, 2007). Utilizing Dillman’s

51
(2007) protocol for increasing response rates of mail surveys, the following procedure was
used to distribute mail surveys:
Day 1: A presurvey post card was sent (Appendices J and K).
Day 4: A personalized cover letter with a copy of the instructions, survey, deadline
date of 2 weeks, a self-addressed stamped reply envelope and a SBO packet
containing a personalized cover letter with a copy of the instructions, survey,
and a sealing envelope was sent to the mail list of FSDs (Appendices L, M,
N, and O).
Day 20: A second postcard was sent to FSDs as a reminder notice for nonrespondents
and as a thank you for those who had responded (Appendices P and Q).
Day 30: A second cover letter, instructions, survey, and self-addressed reply envelope
was sent to nonrespondents (Appendices R and S).
Day 31: A follow up e-mail or phone call was made to half of the FSDs using a script
to urge response to the mail survey and to ensure equal representation from
each state in the region. If requested, a third cover letter set of instructions,
survey, and self- addressed reply envelope was sent via postal mail or fax
(Appendices L, M, N, and O). Previous regional and national surveys using
electronic and mail methods to the FSD population have resulted in response
rates ranging from 21–39% (D. Schweitzer, personal communication, July
21, 2008; E. Hanna, personal communication, July 28, 2008; B. W. Rice,
personal communication, July 21, 2008; K. Wilson, personal communication,
March 12, 2008).

52
School Business Officials
The survey packet sent to the FSDs included a packet for the SBO in the district (N =
498). The cover letter for the SBO packet of materials was personalized when possible.
State Agency Directors
A cover letter and copy of the survey questions were sent to state agency directors in
the Mid-Atlantic region (N = 6). The cover letter for each state agency director was
personalized when possible.
Data Collection Tools
School Foodservice Directors Survey
The mail survey developed for FSDs consisted of eight content sections: (a) school
district policies, (b) completeness and use of the district’s food safety plan, (c) foodservice
staff, (d) sanitation inspections, (e) district support for food safety, (f) attitudes toward food
safety training, (g) personal food safety beliefs and practices, and (h) demographic
information. In the first section, participants assessed their perceptions of the importance of
district board-level policies related to food safety on eight questions using a 5-point Likert-
type rating scales ranging from 5 (very important) to 1 (very unimportant), two forced choice
options to assess district board-level policies supporting safe food practices, and one forced
choice checklist identifying factors that would influence district administration support for
funding for school foodservice training. In the second section, a list of 11 SOPs identified
from the USDA guidance document (USDA-FNS 2005a) was presented and participants
were asked to assess level of implementation of SOPs as part of the district’s food safety
plan. Participants used 5-point Likert-type rating scales with definitions of level of
completeness of implementation ranging from 1 (not started) to 5 (complete) that addressed
53
the presence of SOPs such as inclusion of elements specified in the USDA guidance
document (USDA-FNS, 2005) and documentation procedures as defined by the USDA
guidance document. In this section, a forced choice checklist with “yes” or “no” options to
identify whether documentation was used to monitor these SOPs and the presence of other
records kept as part of the district’s food safety plan was also included. In the third section,
five questions about foodservice staff were posed with a forced choice response option of
either “yes” or “no.” Questions addressed food safety concepts that occurred during the
hiring and orientation processes and the presence of these concepts in employee task lists, job
descriptions, and performance appraisal documents. In the fourth section, directors were
asked the frequency of written inspections reports and inspection fees with three forced
choice questions. A branching question about inspection fees was also included. Multiple
choice response options were given for questions about posting the location of written
inspections reports and the frequency of requests for written inspections reports. Four
questions regarding the number of foodservice sites in the district receiving inspections,
identification if the sites receiving any critical violations, and a listing of these critical
violations and defined corrective actions used open-ended choice answers. In the fifth
section, participants were asked about their perceptions of district support from school
administration on 17 questions using a 5-pointLikert-type rating scale ranging from 1 (very
unsupportive) to 5 (very supportive). In the sixth section, respondents were asked about their
attitudes toward food safety training on three questions and their personal food safety beliefs
on four questions using a 5-point Likert-type rating scale ranging from 1 (strongly disagree)
to 5 (strongly agree). Forced choice response options were listed for 21 questions about
training and content areas of training . In the seventh section of the survey, participants

54
assessed their personal safety practices away from the district with eight questions having
response options of “yes” or “no” or having a 5-point Likert-type rating scale ranging from 1
(strongly disagree) to 5 (strongly agree) and one forced choice question. The same response
options were used to address personal shopping, storage, and preparation practices on 29
questions. In the eighth section of the survey, 22 open-ended, “yes” or “no,” forced choice,
and multiple choice questions were used to determine personal characteristics of the school
FSD (such as age, gender, educational level, years of service, membership, certification, and
credentialed) and his/her district characteristics (enrollment, production systems, number of
staff, percentage of need, budget, and independent operations verses contracted operations).
A copy of the survey is in Appendix M.
School Business Officials Survey
The survey for the districts’ SBOs consisted of four sections: (a) school district
policies, (b) knowledge and attitudes about food safety, (c) district’s support of training for
foodservice staff and overall support for district foodservice programs, and (d) demographic
information. Eighteen items in the policy section were the same as those developed for
school FSD questionnaire to allow for comparisons between the SBOs’ and the FSDs’
responses. In the second section, the SBOs were asked one question to rate his/her
knowledge of P.L. 108-265 using a Likert-type rating scale ranging from 1 (no knowledge)
and 5 (very familiar) and three questions using a forced choice checklist to identify how they
learned of the law and elements of the school food safety plan. In the third section, 18
multiple choice and open-ended questions about foodservice staff training, such as the
number of training programs attended, number of foodservice staff supported, amount of
dollars spent by the district, number of training hours for noninstructional staff for school

55
years 2007 – 2008, and district account source of funding (i.e., general fund or foodservice
program account) were posed. In the last section, the SBO was asked through 13 multiple
choice questions to provide information about personal and district characteristics in the
demographic section. A copy of the survey is in Appendix O.
State Agency Survey
The survey for the state agency consisted of two sections with 13 open-ended
questions. Questions were asked either on the phone or via e-mail. Topics included the
current food code adopted by each state, HACCP policy mandates prior to P.L. 108-265, the
review process of food safety plans by the state agency, standard forms used for sanitation
inspections, the frequency of the health inspections statewide, and an estimate of how many
districts have implemented the food safety plan. The final question asked for any additional
information the agency director wanted to share. A copy of the survey is in Appendix U.
Data Analysis
Descriptive statistics, correlations, t tests, and analysis of variance were used. A
Bonferroni post hoc analysis was run to compare differences by personal variables.
Negatively phrased items were reverse coded on the scales. School district variables
included enrollment, type of production system, number of staff, percentage of children
qualifying for free or reduced-price meals, budget, and self-operated versus contract
management. Personal characteristic variables of the FSDs and SBOs included age, gender,
educational level, years of service, membership, and certification and credentialed.

56
CHAPTER 4. RESULTS AND DISCUSSION
Introduction
The purpose of this study was to determine school districts’ support within one
USDA geographic region for implementation of a mandated school food safety policy
presented in the Child Nutrition and Reauthorization Act of 2004. The FSDs and SBOs in
public school districts located in the continental USDA Mid-Atlantic region with enrollments
between 2, 500 and 25,000 students were the population for this study (N = 1,744). Paper-
and-pencil surveys were sent via U.S. Postal Service to all school FSDs and their SBOs in the
study population.
School FSDs’ assessed level of implementation of a mandated school food safety plan
in their districts, perceived administrative support, and identification of the district’s food
safety training efforts were compared with SBOs’ identified levels of support for food safety
training and the child nutrition program. Mail surveys were used to gather data from a
sample (n = 498) of K–12 public schools. FSDs and SBOs in the six states that comprise the
continental USDA Mid-Atlantic region (Delaware, Maryland, New Jersey, Pennsylvania,
Virginia, and West Virginia) were included in this study. Surveys were validated for content
by an expert panel and pilot tested prior to distribution to the population. All data collection
instruments and research protocol were reviewed and approved by ISU’s Office of Research
Assurances and Human Subjects Review Committee (Appendix A).
The paper-and-pencil survey packets were sent to the school FSDs (n = 498) in all
districts of the six states in the Mid-Atlantic region meeting enrollment criteria between
2,500 and 25,000. The FSDs were asked to distribute the survey to the SBO in their districts.
Responses from both groups broken down by states within the region are shown in Table 2.

57
The total response for the returned surveys was 277 with all states in the Mid-Atlantic region
represented. Of this total, the total number of FSD surveys was 176 (35.3%) and the total
number of SBO surveys was 101 (20.3%). Usable surveys were received from 33.3% (n =
166) of the FSDs and a little less than 18.3% (n = 91) of the SBOs. Any survey that was
returned blank was termed unusable, and if an answer was entered into the wrong response
block or line the item was deemed unusable. Over 17% (n = 85) of the FSD and SBO
respondents returned paired surveys. With the exception of a few questions, missing
responses were recoded to 999 as item nonresponse to avoid assuming the number was zero.
The missing data were not configured in the analysis. The SBO section with the least
responses was information requested on staff hours and training hours by staff classification.
Table 2
Number and Percentage of Responses by School Foodservice Directors and School Business
Officials from Districts in the Mid-Atlantic Region States (N = 498)
Districts that Responses Usable surveys FSD/SBO
sent surveys FSD SBO FSD SBO paired responses
State n % n % n % n % n % N %
Delaware 13 2.6 9 5.1 3 3.0 8 4.8 2 2.2 2 2.4
Maryland 13 2.6 8 4.5 6 5.9 7 4.2 6 6.6 5 5.9
West Virginia 37 7.4 13 7.4 9 8.9 13 7.8 9 9.9 8 9.4
Virginia 76 15.3 24 13.6 19 18.8 19 11.4 14 15.4 14 16.5
New Jersey 131 26.3 32 18.2 11 10.9 31 18.7 10 11.0 9 10.5
Pennsylvania 228 45.8 90 51.1 53 52.5 88 53.0 50 54.9 47 55.3
TOTAL 498 176 35.3 101 20.3 166 33.3 91 18.3 85 100.0
Note. FSD = Foodservice Director; SBO = School Business Official.

58
Findings from the survey are presented in the following order: demographic
characteristics of responding districts’ school FSDs, district characteristics as reported by the
school FSD, demographic characteristics of responding districts’ SBOs, district
characteristics as reported by the SBOs, perceptions about board-level policies, SBOs’
knowledge of food safety policy, professional development information, completeness of
districts’ food safety plans, foodservice staff characteristics, sanitation inspection reporting,
perceptions of district administrative support for the school meal program, school FSDs’
attitudes toward food safety training, school FSDs’ personal food safety practices, and state
agency-reported information.
Demographic Characteristics of School Foodservice Directors
Respondents
Demographic characteristics of the FSD respondents are described in Table 3. A total
of 166 (33.3%) completed usable surveys were received. Over 87.3% (n = 145) of the
respondents reported their titles as FSD/child nutrition director, supervisor, or area manager.
These positions oversee all aspects of school foodservice. This is higher than the 68.8%
reported by Story (2008) but lower than the 95% reported by Hanna (2008). The responding
FSDs were primarily female (62.0%), lower than the 79.9% reported by Hanna, the 85.9%
reported by Story, the 88.2% reported by Thornton (2007), and the 88.3% reported by
Stinson, Carr, Nettles, and Johnson (2011) in other studies of child nutrition professionals.
Close to two-thirds 62.7% (n = 104) of the respondents had completed a 4-year degree; of
these 19.3% held advanced degrees. Those respondents with 4-year degrees reflected a
higher percentage than the 41% reported by O’Toole et al. (2007), the 46.5% reported by
Hanna and Stinson et al., and the 32.2% identified by Thornton. The percentage of study

59
Table 3
Characteristics of School Foodservice Director Respondents in the Mid -Atlantic Region
(N = 166)
Characteristic n %
Official title
Foodservice director/child nutrition director
Foodservice supervisor
Area manager
Coordinator
Specialist
Admin-assistant-operations
School kitchen manager
Cook/manager
School business official
Other
No response
133
1
11
0
0
0
0
0
0
13
8
80.12
0.60
6.63
0.00
0.00
0.00
0.00
0.00
0.00
7.83
4.82
Level of education
High school diploma
Some college
Associate degree
Bachelor degree
Some graduate work
Graduate degree
Doctoral degree
No response
17
14
24
50
22
30
2
7
10.25
8.43
14.46
30.12
13.25
18.07
1.20
4.22
School Nutrition Association membership type
Director
Manager
Major city
Educator
I am not a member
No response
110
5
2
0
41
8
66.27
3.01
1.20
0.00
24.70
4.82
Credentialed School Nutrition Specialist
Yes
No
No response
23
131
12
13.86
78.92
7.22
Other credentialsa
Diet Tech
Registered Dietitian
Certified Dietary Manager
ServSafe® certified
State/county agency food handler’s certificate
Dietary manager’s food safety program
NEHA certified
SNA certified
Other
7
14
11
125
51
4
1
35
16
4.22
8.43
6.63
75.30
30.73
2.41
0.60
21.08
9.64
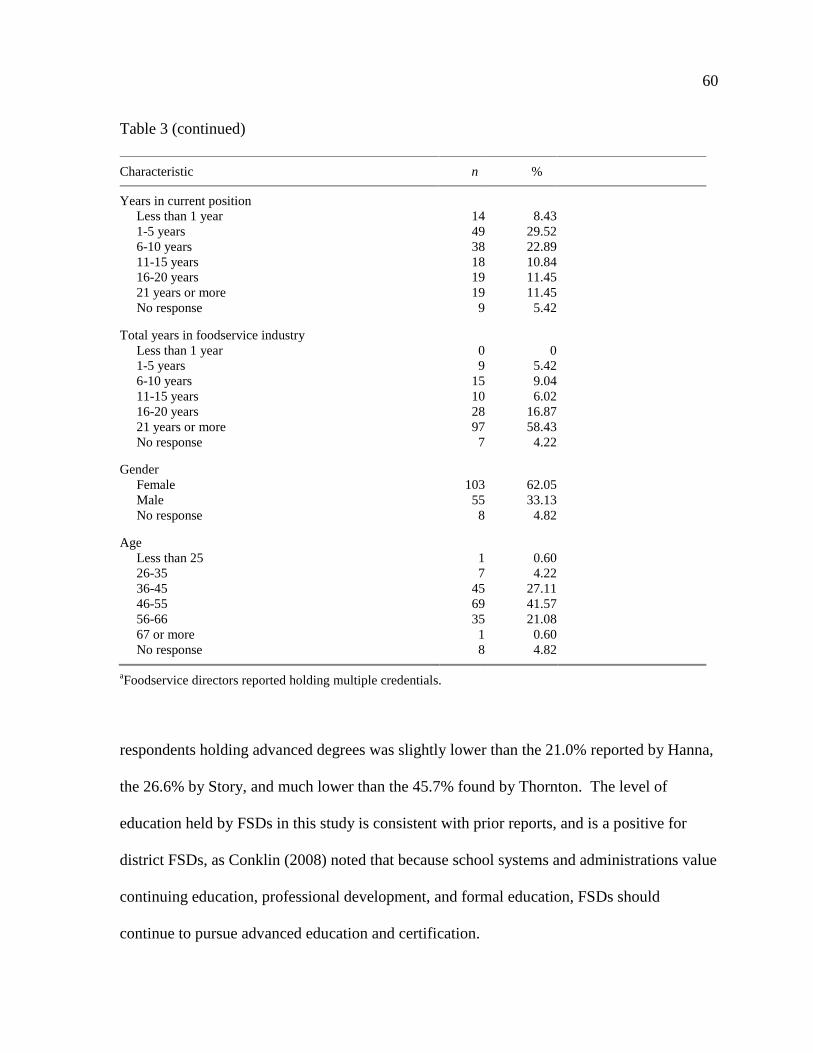
60
Table 3 (continued)
Characteristic n %
Years in current position
Less than 1 year
1-5 years
6-10 years
11-15 years
16-20 years
21 years or more
No response
14
49
38
18
19
19
9
8.43
29.52
22.89
10.84
11.45
11.45
5.42
Total years in foodservice industry
Less than 1 year
1-5 years
6-10 years
11-15 years
16-20 years
21 years or more
No response
0
9
15
10
28
97
7
0
5.42
9.04
6.02
16.87
58.43
4.22
Gender
Female
Male
No response
103
55
8
62.05
33.13
4.82
Age
Less than 25
26-35
36-45
46-55
56-66
67 or more
No response
1
7
45
69
35
1
8
0.60
4.22
27.11
41.57
21.08
0.60
4.82
aFoodservice directors reported holding multiple credentials.
respondents holding advanced degrees was slightly lower than the 21.0% reported by Hanna,
the 26.6% by Story, and much lower than the 45.7% found by Thornton. The level of
education held by FSDs in this study is consistent with prior reports, and is a positive for
district FSDs, as Conklin (2008) noted that because school systems and administrations value
continuing education, professional development, and formal education, FSDs should
continue to pursue advanced education and certification.

61
The highest percentage (41.6%) of respondents was between the ages of 46 and 55
years. The majority of FSDs (58.4%) had a total of 21 or more years of foodservice industry
experience. However, 63 (38.4%) of the 166 respondents had been in their current director’s
position for 5 years or fewer and 56 (33.7%) of the directors had held the position for 6 to 15
years. These findings are similar to previous work by Stinson et al. (2011), who reported
about one third (31.5%) of the respondents in their study were fairly new to their positions
with only 1 to 5 years of experience as the director, and Hanna’s (2008) findings, which
indicated that close to half (43.5%) of the respondents had been directors for 6 to 15 years.
Professional Credentials
Of the 166 FSD respondents,117 (70.5%) indicated they were members of the SNA,
which is a lower percentage than Thornton’s (2007) findings of 89.5% membership held by
FSDs in her survey. The SNA is the professional organization for child nutrition
professionals and offers professional development opportunities leading to levels of
certification followed by the SNA credential. Certification requirements include 10 hours of
food safety training. The School Nutrition Specialist (SNS) credential holds a higher
standard for certification, includes a national exam based on defined competencies, and
offers increased recognition to the FSD. Less than one fourth (21.1%) of the respondents in
this study also reported being certified by SNA; however only 13.9% had earned the SNS
credential. This finding is similar to that of Stinson et al. (2011), who found 16.2% of
respondents in their study were credentialed, but considerably less than Thornton’s finding of
27.3%, Story’s (2008) finding of 32.9%, and Brounstein’s (2003) finding of 46.0%, although
the latter study surveyed only a single state from the Mid-Atlantic region. Conklin, Sneed,
and Martin (1995) found a positive relationship between years of experience for FSDs and
62
holding of SNS credentials. As years of experience increased, so did the tendency to hold the
SNS certification (48%). However, the reverse was found with directors having less than 5
years of experience, as only 23% held the SNS certification.
The majority (75.3%) of FSDs in this study reported holding ServSafe® certification,
and 30.7% reported holding a state or county food handler’s certificate. Thus, almost all
respondents indicated at least some type of certification in food safety was held. This is very
similar to findings reported by Story (2008) for food safety certification. In her study, over
79.7% held a national food safety certificate such as ServSafe®, whereas Stinson et al. (2011)
reported a lower rate (63.9%) of certification.
School District Characteristics as Reported by School Foodservice Directors
Districts
School district characteristics as reported by the FSDs are described in Table 4. The
majority of the districts were suburban (44.6%), with an average enrollment of 5,991
students, and reported average free and reduced participation of 31.5%. Responding FSDs
posted expenditure budgets ranging from less than $1 million to in excess of $12 million.
Close to 47.6% of the budgets were for amounts of $1.9 million or less, which is higher than
the average budget of $1.5 million reported in the SNA 2009 Operations Report (SNA,
2009). About three-fourths (72. 9%) of the responding school foodservice programs were
self-operated. This is lower than the 86.2% reported by Hanna (2008), the 93.5% reported by
Story (2008), and the 97.3% found by SNA (2011c). District FSDs responded as
participating in federal child nutrition SBP and NSLP (90.1% and 99.4%, respectively).
Respondents in this study reported only 41.38% of their districts had after-school programs,
which is lower than 48.4% and 64.5%,reported by both Hanna and Thornton (2007),

63
Table 4
School District Characteristics as Reported by School Foodservice Director in the Mid-
Atlantic Region (N = 166)
Characteristic n %
District type
Urban
Suburban
Rural
No response
19
74
63
10
11.45
44.58
37.95
6.02
Budget expenditure for 2007–2008 school year
Less than $ 1,000.000
$1,000,000 to 1,999,999
$ 2,000,000 to 2, 999,999
$ 3,000,000 to 3, 999,999
$ 4,000,000 to 4, 999,999
$ 5,000,000 or >
No response
13
66
36
12
12
11
16
7.83
39.76
21.69
7.23
7.23
6.63
9.63
Management of program
Contract managed
Self-operated
No response
39
121
6
23.49
72.90
3.61
Federal programs
School Breakfast Program (n = 151)
National School Lunch Program (n = 156)
After School Snack Program (n = 116)
Fresh Fruit and Vegetable Program (n = 100)
Special Milk Program (n = 156)
Summer Foodservice Program (n = 106)
136
155
48
13
21
40
90.07
99.36
41.38
13.00
19.8
37.00
Other programs
Catering
Vending
Day Care/Head Start
122
91
51
82.40
67.90
44.00
Production methoda
Conventional
Commissary
Base kitchen
Satellite kitchen
148
14
48
50
89.16
8.44
28.92
30.12
Serving methodb
Food court
Kiosk
Grab and go
Self-serve
Traditional
Breakfast in the classroom
Breakfast in a bag
Breakfast on the school bus
56
9
87
87
135
38
35
1
33.73
5.42
52.41
52.41
81.33
22.89
21.18
0.06

64
Table 4 (continued)
Characteristic n %
Food safety certified required of FSD by local health department
Yes
No
No response
82
74
10
49.40
44.58
6.02
Food safety certified required of FSD by school district
Yes
No
No response
63
94
9
37.95
56.63
5.42
Food safety certified by approved Conference of Food Protection
designation required of kitchen managers by school district
Yes
No
No response
56
97
13
33.73
58.44
7.83
Food safety certified required of all kitchen staff by school district
Yes
No
No response
30
125
11
18.07
75.30
6.63
aSome districts reported more than one production method.
bSome districts reported more than one serving
method.
respectively. Fresh fruit and vegetable programs were reported by less than 13.0% of the
districts in this study, lower than the 31.8% reported by Hanna. Other programs reported by
the FSDs as operated in their districts were catering (82.4%), vending (67.9%), and
daycare/head start (44.0%).
Production Method and Service
The most commonly utilized production method was a conventional system
(Unklesbay et al., 1977) in which food is prepared in a full production kitchen and served on
site (89.16%), very similar to Stinson et al.’s (2011) findings of 88.1% but lower than the
92.3% reported by SNA(2011c). This system offers greater flexibility in food preparation
with more emphasis on batch cooking and less on cook-and-hold, thus decreasing holding

65
time and increasing freshness of products (Gregoire & Bender, 1999). Limitations of this
production system include increased labor hours, availability of adequate space and
equipment, and food safety concerns. Hanna (2008) found 93.3% of the 534 respondents in
her survey of districts with 2,500 to 10,000 student enrollments indicated conventional
systems were the most often used method of production. The use of base kitchens was
reported by 28.9% of respondents in this study, slightly higher than Stinson et al.’s findings
of 25.5%. Satellite kitchens were reported as being used by 30.1% of FSDs in this study,
slightly higher than Stinson et al.’s findings of 24.8% and Hanna’s findings of 27.1%, and
considerably higher than SNA’s (2008) reported use of this production type kitchen at 11%.
The literature review and findings from this study illustrate how districts will combine
production systems, such as conventional production at some school buildings and satellite
kitchens at others.
Over 93.4% of the districts responding had implemented offer verses serve, which is
designed to increase choices of students and decrease plate waste. Districts indicated types
of service methods used with multiple responses. Traditional serving method was reported as
used most often in the district (81.3%); these findings are consistent with those noted by
SNA in 2008, as well as by Hanna (2008). In the traditional serving method, staff serves thus
controlling portions of all menu items listed as a reimbursable meal to the student. This
method is more common among elementary schools than in high schools, where offer versus
serve is required to be an option. However, both self-service and grab-and-go serving
systems (each identified by 52.41% of responding FSDs as used in their districts) were also
used methods of service. Use of self-service and grab-and-go serving methods, in which

66
students personalize their selections, may resemble a trend to replicating retail operations.
Hanna found use of these methods by 27.1% of her respondents.
Health Department Food Safety Certification
Almost half of responding FSDs (44.6%) indicated they were not required by their
local health departments to be food safety certified; even fewer (38.0%) were required by
their districts. This finding differs from the SNA 2009 Operations Report (SNA, 2009),
which identified 65.9% of districts reported their state, local, or district health department
required certification in food safety for the “person in charge,” and the SNA 2011 Operations
Report (SNA, 2011c), which reported a higher percentage (72.9%) of districts noting
requirements. Recent versions of the food code require the person in charge to demonstrate
knowledge about safe food handling and cleaning and sanitizing practices. Food safety
certification is one way this knowledge can be documented. Thus, as more states adopt more
recent versions of the food code, increases in districts requiring certification can be expected.
In the SNA 2009 Operations Report (SNA, 2009), it was noted that in 87% of schools
foodservice staff received basic food-safety training before handling, preparing, or serving
food. In the 2009 SNA study, 65.9% of the kitchen managers were required to have food
safety certification in their districts, a decrease from the prior study’s (SNA, 2007)
percentage of 70.8%. Yet, only 18.1% of districts required certification for all kitchen staff,
and training requirements reported in a 2002 study by Youn and Sneed found only 14% of
the districts surveyed, had more than 75% of employees certified in food safety. Training
may be occurring by districts, as noted by the SNA reports, but certification or
documentation of food safety knowledge is not a widespread requirement among foodservice
staff.

67
Demographic Characteristics of School Business Officials
Demographic characteristics of the SBO respondents are described in Table 5. A
total of 91 (18.3%) SBOs from districts in the Mid-Atlantic region responded with complete
and useable surveys. The majority (92.1%, n = 81) of the SBO respondents had completed a
4-year college degree and, of those, almost half (48.9%) held advanced degrees. Of the 91
respondents, almost half (46.6%, n = 41) indicated they were fairly new to their current
positions, having been in this position for a period from less than 1 to 5 years. Yet,
responding SBOs did have experience in school administration, as 88.8% (n = 77) reported 6
years or more of experience and 28.4% (n = 25) indicated 21 years or more of tenure. Less
than half (42.0%) had held other school positions; the majority of these previously held
positions were primarily in business-related areas such as SBO/SBO assistant, auditor or
accountant, school administration, and teaching. Sixty-three of the SBO held prior business
administrative positions in nonschool entities outside of education. The majority of SBOs
held membership in professional state organizations (86.4%), with about a third (34.1%)
holding membership at the national or international levels.
School District Characteristics as Reported by School Business Officials
Districts
Three-fourths (75.0%) of the SBO survey respondents indicated their districts had
self-operated school foodservice programs. District characteristics of the SBO respondents
are described in Table 6. Rice (2007) found fewer self-operated school foodservice programs
(66.7%) in her national study than did Hanna (2008) and Story (2008), who reported a higher
percentage of respondents were part of self-operated school foodservice programs (86.2%
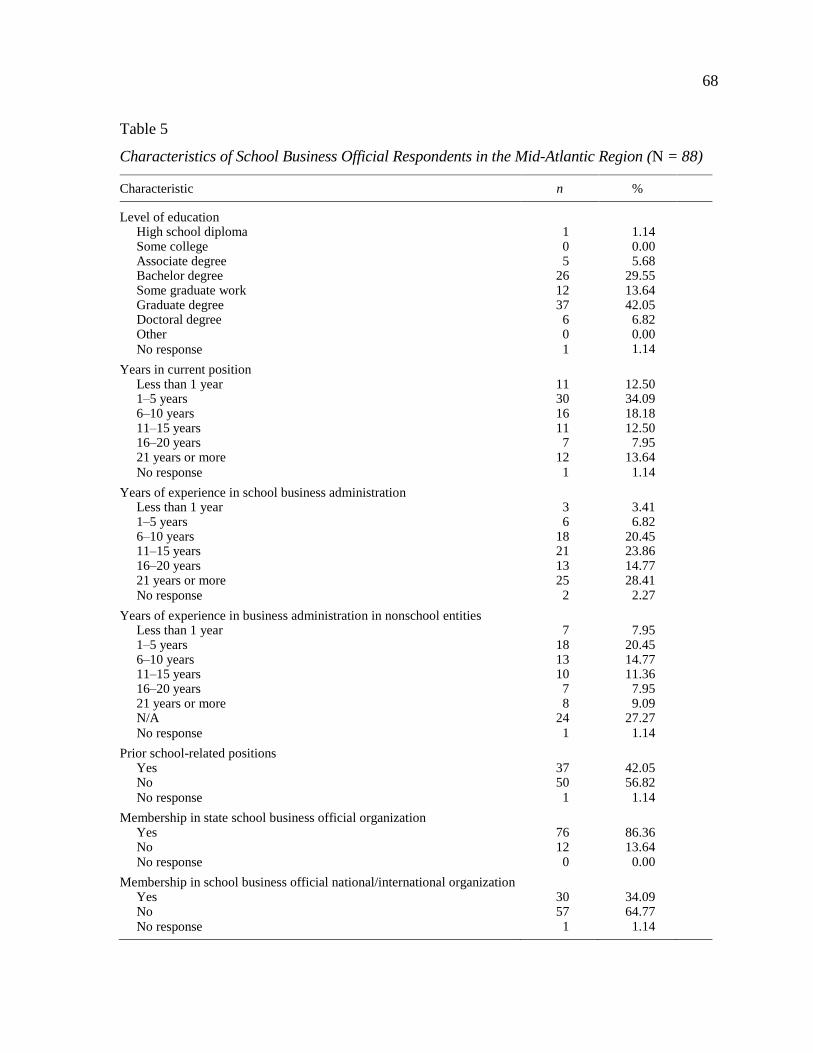
68
Table 5
Characteristics of School Business Official Respondents in the Mid-Atlantic Region (N = 88)
Characteristic n %
Level of education High school diploma Some college Associate degree Bachelor degree Some graduate work Graduate degree Doctoral degree Other
No response
1 0 5
26 12 37 6 0 1
1.14 0.00 5.68
29.55 13.64 42.05
6.82 0.00 1.14
Years in current position Less than 1 year 1–5 years 6–10 years 11–15 years 16–20 years 21 years or more
No response
11 30 16 11 7
12 1
12.50 34.09 18.18 12.50
7.95 13.64
1.14
Years of experience in school business administration Less than 1 year 1–5 years 6–10 years 11–15 years 16–20 years 21 years or more No response
3 6
18 21 13 25 2
3.41 6.82
20.45 23.86 14.77 28.41
2.27
Years of experience in business administration in nonschool entities Less than 1 year 1–5 years 6–10 years 11–15 years 16–20 years 21 years or more N/A
No response
7
18 13 10 7 8
24 1
7.95
20.45 14.77 11.36
7.95 9.09
27.27 1.14
Prior school-related positions Yes No
No response
37 50 1
42.05 56.82
1.14
Membership in state school business official organization Yes No No response
76 12 0
86.36 13.64
0.00
Membership in school business official national/international organization Yes No No response
30 57 1
34.09 64.77
1.14

69
Table 6
Characteristics of District School Meal Programs as Reported by School Business Officials
(N = 88)
Characteristic n %
Food safety certification required by districts for FSD
Yes
No
Don’t know
No response
38
37
10
3
43.18
42.05
11.36
3.41
Food safety certification for kitchen manager required by districts
Yes
No
Don’t know
No response
51
23
8
6
57.95
26.14
9.09
6.82
Management type
Self-operated
Contract company
No response
66
21
1
75.00
23.86
1.14
Funds from the general fund transferred to district foodservice program
Yes
No
Don’t know
No response
29
58
0
1
32.95
65.91
0.00
1.14
District foodservice program financial operational effectiveness
Break-even
Generate profit
Minimize loss
Don’t know
No response
60
19
8
0
1
68.18
21.59
9.09
0.00
1.14
93.8%, respectively). Responses of the SBOs mirrored those of FSDs in this study who
answered this question.
Financial
The range of expenditure budgets fell between $0.6 million and $7.8 million, with an
average of $2.1 million, a budget figure just slightly higher than that reported by FSDs in this
study. The respondents’ indication of financial position of the school foodservice program is
noted in Table 6. Most respondents indicated the effectiveness of financial operations for the

70
meals program was “break-even” (68.2%), and close to two-thirds (65.9%) of the
respondents reported the school foodservice programs did not receive money from the
general fund. Thornton (2007) reported 35% of districts in her survey were financially stable
with three months operating balance.
Certification for Food Safety
The SBO respondents reported their districts required food safety certification more
frequently for kitchen managers than for FSDs (58.0% compared to 43.2%, respectively).
This is still lower than the findings from the SNA 2005 Operations Report (SNA, 2005b) for
kitchen managers at 64.9% and the SNA 2007 Operations Report (SNA, 2007) at 70.8%.
Sneed, Oakley, and Ellis (2006) found few state agencies required food safety certification
for employees, for kitchen managers (12.2%), or for directors (7.3%); requirements that do
exist are based on the food code adopted by the jurisdiction. O’Toole et al. (2007), in a
national study, found professional preparation for newly hired foodservice manager across
the nation were required by 53.9% of districts to have food safety certifications. This may be
due to perceptions that kitchen managers are more directly involved with food preparation
than are FSDs or an assumption that directors with higher educational levels or professional
certifications will have the proper background in all aspects of the position. Food safety
certification requirements are described in Table 6.
Perceptions About Board-Level Policies
FSDs and SBOs were asked whether they thought district board-level polices
supporting safe food practices could help reduce foodborne incidence. Of the 166
responding FSDs and 88 responding SBOs, the majority in each group (FSDs, n = 119;
SBOs, n = 54) thought district board-level polices supporting safe food practices could help
71
reduce foodborne illness. However, a small number of FSDs (n = 16) and SBOs (n = 9)
indicated polices at this level would not help reduce foodborne illness. Some ambivalence
was noted among 20 FSDs who indicated response options of “not sure” and “do not know”
(n = 17 and 3, respectively). A greater number of SBOs indicated uncertainty that board-
level food safety policies could reduce foodborne illness by responding with a “not sure” and
“do not know” (n = 21 and 2, respectively).
Existence of District Board-Level Food Safety-Related Policies
Of the 124 FSDs who responded to a question asking about existence of district
board-level food safety-related policies, 65 indicated these were present whereas 59 reported
the policies were not present. Yet, the majority of all FSDs (n = 96) indicated that policies
did exist in their districts for kitchen/facility use for purposes other operation of the child
nutrition program. Similar findings were reported by the SBOs: 47 of the 91 (51.7%)
indicated district board-level food safety-related policies were in existence, 36 (39.56%)
reported the policies were not in place, and 8 did not respond. A larger percentage of SBOs
than FSDs noted kitchen and facility use policies for purposes other than the child nutrition
program were in place (n = 58, n = 96, respectively). Just over one fourth (27.1%, n = 45) of
FSDs indicated policies were in place for food prepared at home and brought in for resale to
broader groups (such as for bake/hoagie sales). A similar extent of awareness of the
existence of policies related to food prepared at home for resale at school was found by SBOs
(30.8%, n = 28). Just 10.0% (n = 17) of school FSDs indicated polices related to food
prepared at home and brought in for a covered dish dinner (not for resale) were in place, and
findings were similar for the responding SBOs (n = 10, 11.0%). District policies related to

72
food prepared at home and served for classroom policies were identified in place by 58
(34.9%) of the FSDs and 36 (39.6%) of SBOs. Details of the findings are shown in Table 7.
These findings suggest that both groups (FSDs and SBOs) in public school districts in
all states of the Mid-Atlantic region were more concerned with food prepared at home and
either sold to or served to students during class time for parties and celebrations than foods
prepared at home and served to a group of district patrons in a nonschool-sponsored setting.
These differences may be explained by state regulations for foodservice establishments that
do not permit certain foods to be prepared in nonlicensed locations, such as homes, and sold
to the public. The example given on the questionnaire was for a hoagie sandwich, a menu
item that contains ingredients that must be temperature controlled for safety and, thus,
presents a higher level of risk than does a bake sale item, such as a cookie. There were a few
responses by FSDs (n = 10) and SBOs (n = 6) that indicated their districts did not permit any
food prepared at home for resale. In addition, covered dish dinners also were identified by
some as not allowed, thus policies addressing these topics were not necessary, which may
have influenced responses. Given that children under the age of nine are considered at
greater risk of contracting a foodborne illness than are healthy adults, and foods that are
served during the school day could be considered the districts’ responsibility, thus increasing
liability exposure, many districts have specified location and types of food allowed for
classroom parties and other events outside of the school meal setting. Food prepared at home
does pose a risk, given that viral foodborne pathogens such as hepatitis A and norovirus have
been implicated in outbreaks of foods not typically thought of as potentially hazardous, such
as fresh produce and baked goods (NRAEF, 2008)

73
Table 7
Foodservice Directors and School Business Officials Identification of Board-Level Policy
Existence in Their Districts
School FSD responses
(n = 166)
SBO responses
(n = 91)
Board-level policy n % n %
Food safety
Yes
No
No response
65
59
42
39.16
35.54
25.30
47
36
8
51.65
39.56
8.79
Kitchen use by outside groups
Yes
No
No response
96
29
41
57.83
17.47
24.70
58
26
7
63.74
28.57
7.69
Foods prepared at home for resale in school
Yes
No
No response
45
74
47
27.11
44.58
28.31
28
52
11
30.77
57.14
12.09
Foods prepared at home for in-class parties/celebrations/treats
Yes
No
No response
58
62
46
34.94
37.35
27.71
36
41
14
39.57
45.05
15.38
Foods prepared at home for covered dish dinners
Yes
No
No response
17
93
56
10.24
56.02
33.73
10
66
15
10.99
72.53
16.48
Training of all district staff in food safety
Yes
No
No response
4
113
49
2.41
68.07
29.52
13
69
9
14.29
75.82
9.89
Training of all foodservice staff in food safety
Yes
No
No response
51
69
46
30.72
41.57
27.71
35
48
8
38.46
52.75
8.79
Training of volunteer staff in food safety
Yes
No
No response
14
101
51
8.43
60.84
30.72
13
68
10
14.29
74.72
10.99
Note. FSD = Foodservice Director, SBO = School Business Official.

74
Only 2.4% (n = 4) of the FSDs indicated that a board-level policy was in effect that
required food safety training of all district staff, whereas more SBOs (n = 13, 14.3%) noted
the existence of such a policy in their districts. This finding suggests SBOs perceive training
may exist. Less than half of both FSDs (n = 51, 30.7%) and SBOs (n = 35, 38.5%) indicated
food safety training was required by the district for all foodservice staff. This finding varies
with results reported by Youn and Sneed (2002), which indicated that 54% of districts’
managers/supervisors had received food safety training and certification yet only 14% of the
districts indicated that more than 75% of foodservice staff had training and certification. In
the current study, a lower proportion of FSDs (8.4%, n = 14) reported their districts required
food safety training for volunteers than did SBOs (14.3%, n = 13). Various school district
staff and volunteer parents may be involved in food preparations and/or service of foods
throughout the school day, particularly as there is increased focus on nutrition education and
school gardens and with increasing labor costs and budgets cut. In some districts, the school
secretary works the serving area to reduce foodservices costs (E. Hanna, personal
communication, July 1, 2009) and aftercare snacks may be distributed by a teacher’s aide.
Facility or transportation staff may be assigned tasks of receiving or transporting foods
between schools. Teachers frequently serve foods in the classroom as snacks to reinforce
educational concepts with the use of colorful fruits and vegetables, and nurses teach children
hand washing. The H1N1 flu virus threat resulted in many health organizations
recommending vigilant hand washing to reduce the spread of infections. As caregivers,
teachers, and staff become more involved in food handling; there is greater risk for children
(Marx, 2008). Thus, district-wide, board-level policies ensure consistent actions among the

75
school district’s buildings and by school district workers and volunteers. Findings about
existence of various policies are shown in Table 7.
Importance of District Board-Level Food Safety-Related Policies
Foodservice directors rated their perceptions of importance for food safety related
policies using a five-point Likert-type scale ranging from 1 (very unimportant) to 5 (very
important). Findings are shown in Table 8. FSDs (n = 166) indicated the presence of a
board-level related policy about food safety was important with a mean rating of 4.37,
whereas SBOs rated the importance of the existence of such a district policy with a mean
rating of 4.17. The policy rated as most important by FSDs (M = 4.56) and second most
important by SBOs (M = 4.20) was one regarding use of foodservice kitchens by those
outside of the foodservice department. Findings also revealed FSDs rated policies about food
brought from home for resale, use in the classroom, and events where food is not sold, such
as covered dish dinners, as more important than did SBOs, with mean ratings of 4.25
compared to 3.75, 4.27 compared to 3.82, and 3.68 compared to 3.09, respectively.
The FSDs indicated that placed policies to address foods from home were more
important than did SBOs, perhaps due to their greater awareness of how foods can become
contaminated and recognition of the need to protect school children or members of the
community from possible food related illnesses. FSDs and SBOs rated the importance of a
district policy requiring food safety training for foodservice staff similarly as important to
very important (M = 4.46 and M = 4.41, respectively), indicating there is recognition that
staff with primary responsibilities in production and service of food should have the
necessary training.
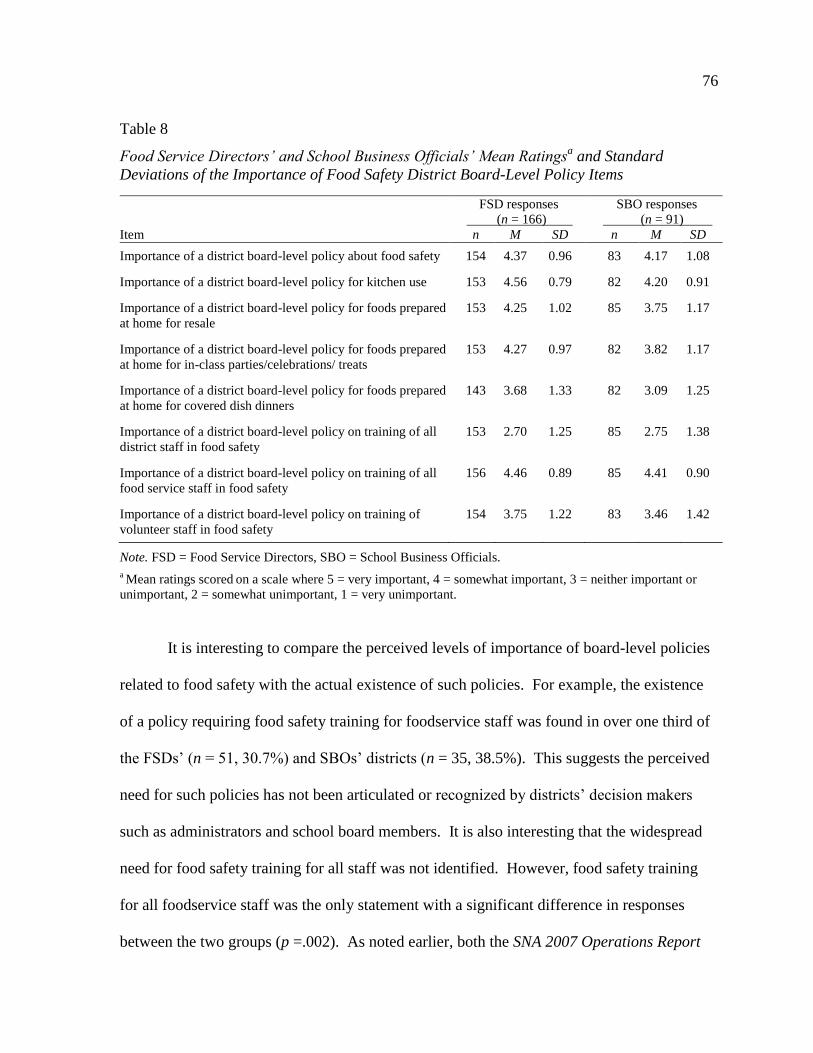
76
Table 8
Food Service Directors’ and School Business Officials’ Mean Ratingsa and Standard
Deviations of the Importance of Food Safety District Board-Level Policy Items
FSD responses
(n = 166)
SBO responses
(n = 91)
Item n M SD n M SD
Importance of a district board-level policy about food safety 154 4.37 0.96 83 4.17 1.08
Importance of a district board-level policy for kitchen use 153 4.56 0.79 82 4.20 0.91
Importance of a district board-level policy for foods prepared
at home for resale
153 4.25 1.02 85 3.75 1.17
Importance of a district board-level policy for foods prepared
at home for in-class parties/celebrations/ treats
153 4.27 0.97 82 3.82 1.17
Importance of a district board-level policy for foods prepared
at home for covered dish dinners
143 3.68 1.33 82 3.09 1.25
Importance of a district board-level policy on training of all
district staff in food safety
153 2.70 1.25 85 2.75 1.38
Importance of a district board-level policy on training of all
food service staff in food safety
156 4.46 0.89 85 4.41 0.90
Importance of a district board-level policy on training of
volunteer staff in food safety
154 3.75 1.22 83 3.46 1.42
Note. FSD = Food Service Directors, SBO = School Business Officials.
a Mean ratings scored
on a scale where 5 = very important, 4 = somewhat important, 3 = neither important or
unimportant, 2 = somewhat unimportant, 1 = very unimportant.
It is interesting to compare the perceived levels of importance of board-level policies
related to food safety with the actual existence of such policies. For example, the existence
of a policy requiring food safety training for foodservice staff was found in over one third of
the FSDs’ (n = 51, 30.7%) and SBOs’ districts (n = 35, 38.5%). This suggests the perceived
need for such policies has not been articulated or recognized by districts’ decision makers
such as administrators and school board members. It is also interesting that the widespread
need for food safety training for all staff was not identified. However, food safety training
for all foodservice staff was the only statement with a significant difference in responses
between the two groups (p =.002). As noted earlier, both the SNA 2007 Operations Report

77
(SNA, 2007) and the SNA 2009 Operations Report (SNA, 2009) found 87% and 90.1%,
respectively, of all foodservice staff received food safety training, which is a considerably
higher percentage than findings in this study. The importance of a policy requirement was
rated lowest, with mean ratings by FSDs of 2.70 and by SBOs of 2.76, yet the perceived
importance for volunteers to receive food safety training was higher (FSDs, M = 3.75; SBOs,
M = 3.46). In many districts, volunteers hold food related fundraisers or operate concessions
at sports, music, and other school events as a means to generate funds. Foods sold by these
groups may be an important revenue source, but they may also sell potentially hazardous
foods such as tacos, burgers, pizza, and hoagie sandwiches with fresh tomato slices. Risks of
foodborne occurrences may increase when non foodservice, noncertified food handlers are
unaware of safe practices during preparation, service, and storage. Given the increased
emphasis on the school health environment, it would seem logical that food safety training
would be made available to protect the children and public at school-related functions.
Responses from all FSDs and SBOs were compared using a t test on whether or not
the policy existed (PE scale) and the importance of the foodservice policy (PI scale). Prior to
completing the t test procedure, PI scale means were calculated for the t test comparison.
Results of the t test for the PE scale indicated the data met the assumption of equal variances
(Levene’s test, p = .494) and there were no statistically significant differences, t (214) =
–.521, p = .603, between all the FSDs’ (M = 2.67, SD = 2.03) and all the SBOs’ (M = 2.82,
SD = 2.17) responses. Results for the t test for PI scale for all the respondents indicated the
data met the assumption of equal variances (Levene’s test, p = .075), and there were
statistically significant differences, t (243) = 2.961, p = .003; findings indicated there were
statistically significant differences in the perceived levels of importance for FSDs and SBOs

78
and that FSDs had a significantly higher mean rating for all eight of the food safety items (M
= 4.01, SD = 0.72) than did SBOs (M = 3.70, SD = 0.840). All FSDs perceived a higher level
of importance for the policy than did the SBOs. Internal consistency and reliability were
assessed for the “Importance” scale items and the “Existence of Policy” scale items. The
Cronbach’s alpha coefficient for the Importance scale items was .844, and the calculated
Cronbach’s alpha coefficient for The Food Safety Policy scale items was .787, indicating the
two scales had a moderately high level of internal consistency and reliability (Slavin, 1992).
Pairs of responses from the FSD and SBO from the same school district were
matched and compared using a t test. In asking whether or not the policy exists (PE scale
items) responses shown in Table 7 were summed and totals were used to compare the FSD
and SBO responses. The PI scale items had scaled responses, and the mean was calculated to
use for the t test comparison. SBO responses indicated they thought that policy existed (PE
scale) more on average then did FSDs, but the differences were not significant. Responses
for the PI scale indicated equal variances could be assumed (Levene’s test, p = .138), and
there were statistically significant differences between the responses of the FSDs (M = 4.05,
SD = 0.71) and SBOs (M = 3.73, SD = 0.81), t (177) = –2.829, p=.005. Responses of the
FSDs indicated they thought the items on the PI scale were of more importance than did
SBOs.
Influencers of Administrative Support and Funding Provided for Food Safety Training
The FSDs and SBOs identified whether they thought nine listed items would
positively influence district administrative support and funding for food safety training.
Findings are shown in Table 9. The item identified most frequently by both FSDs (n = 139,
83.7%) and SBOs (n = 77, 84.6%) was state or federal agency mandate for requirement of

79
such training. Stinson et al. (2011) asked FSDs what motivated their district to develop a
HACCP-based food safety plan; close to 80% of the respondents indicated a state mandated
requirement was the impetus and 56.1% responded that the reason was federal law. Stinson
et al.’s findings suggest that, even after 5 years, some FSDs were unaware of the federal
mandate. Food safety language was present in P.L. 108-265, the 2004 law requiring HACCP
implementation by school year 2006; however, this policy mandate was unfunded at the
district level for the development of and provision of staff training about the HACCP-based
food safety plan. Some food safety training was provided by 35 states, as reported in one
study assessing the period of 2003–2005 (Sneed et al., 2006). During this period, over
24,000 foodservice employees were trained in basic food safety and close to 10,000 received
HACCP-related training provided by state agencies. The majority of training resources
utilized by the state were from USDA-FNS and NSFMI (Sneed et al., 2005); however,
Table 9
Food Service Directors’ and School Business Officials’ Identification of Items They
Perceived Would Positively Influence District Funding for Food Safety Training
Items FSD responses (n = 166) SBO responses (n= 91)
n % n %
Mandated by state/federal guidelines 139 83.73 77 84.62
CRE/SMI requirement 70 42.17 43 47.25
Corrective action during CRE/SMI review/audit 83 50.00 43 47.25
Knowledgeable director 59 35.55 36 39.56
District board policy 80 48.19 52 57.14
Foodborne illness outbreak in district 49 29.52 28 30.77
Attention from media or public relations 71 42.77 34 37.36
Parental demands 36 21.69 25 27.47
Food recall 29 17.49 15 16.48

80
Maryland developed a year-long training program for school foodservice staff, supervisors,
and managers based on skills knowledge and best practices. Recent food code versions place
responsibility on the person in charge to ensure safe food handling practices are followed in
the foodservice. Achievement of good sanitary practice begins with training (Giampaoli,
Sneed, et al., 2002; VanEgmond-Pannell, 1985) and training must be continual (Stinson et
al., 2011).
The second most frequently identified item by the FSDs (n = 83, 50.0%) that would
influence administrative support of food safety was corrective action during a CRE/SMI
audit. District board policy was the second most frequently identified influencer by the
SBOs (n= 52, 57.1%). Directors recognized the need to address deficiencies noted in
external audits, particularly when failure to correct these could result in financial sanctions or
loss of funding for the district’s child nutrition program. The third most likely influencer
identified by the FSDs was district board-level policy (n = 80, 48.2%), whereas SBOs
indicated CRE requirements and corrective action during a CRE/SMI audit as the third most
likely influencer (n = 43, 47.3%). Also noted by both groups was attention from the media
(FSD: n = 71, 42.8%; SBO: n = 34, 37.4%). SBOs also identified that a positive influence
for funding of food safety training was knowledgeable FSDs (n = 36, 39.5%). Thornton
(2007) noted that schools meeting Healthier U.S. School Challenge standards most
frequently had a person who had earned a 4-year college degree administering the child
nutrition program. The importance of improving professional requirements for those
administering child nutrition programs was included in the Child Nutrition Reauthorization
Act of 2010, also known as the Healthy Hunger-Free Kids Act. With the increasing

81
complexity of child nutrition program administration, a director with the necessary
educational background and experiences is needed to successfully manage these programs.
The items least frequently identified by FSDs and SBOs as those that would
positively influence district administrative support and funding for food safety training were
a foodborne outbreak in the district (FSD: n = 49, 29.5%; SBO: n = 28, 30.8%), parental
demands (FSD: n = 36. 21.7%; SBO: n = 25, 27.5%), and a food recall (FSD: n = 29, 17.5%;
SBO: n = 15, 16.5%). National Coalition for Food-Safe Schools (2004) indicated that
administration sends a message that safety is important when training is supported and
activities that prevent foodborne illness are valued. Belo, Giampaoli, and McProud (1996)
identified training as a means to reduce the opportunity for foodborne illness to occur. Marx
(2008) indicated ongoing training is necessary to achieve a safe school environment. Brenda
Greene, Director of School Health Programs at the National School Boards Association
noted in the publication, Eating Safely at School, that involvement of both district and
school-level teams to create a systemic approach to protecting the health of the school
community was needed (Marx, 2008). If there is a concern, the school board and
administration could be held accountable. Creating a policy to prevent foodborne illness
demonstrates board members’ commitment to promoting and safeguarding a healthy school
environment. The direct and indirect costs incurred as a result of a foodborne illness
outbreak in a school such as embarrassment, damaging reputation, reduction in impact
participation rates of school meals, negative press, lawsuits, financial hardship, and possible
fatalities could be prevented with provision of regular training (Lockner, Hildebrant, &
Pacheco, 2003).

82
Findings from this study indicated funding is perceived by both FSDs and SBOs as a
change agent. School FSDs (71.7%) and SBOs (54.5%) were positive when responding to
whether district board-level policies would support safe food practices and help reduce
foodborne incidences. However, Story (2008) found only 65.0% of FSDs reported
confidence that additional food safety policies would result in fewer outbreaks, but these
respondents also indicated appropriate food safety practices were currently followed in their
districts.
Staff trained in safe food handling exhibit more favorable attitudes toward food safety
practices and are more likely to practice appropriate food safety behaviors than those who are
not trained (Henroid & Sneed, 2004; Hwang et al., 2001; Sneed, Strohbehn, & Gilmore,
2004; Youn & Sneed, 2002). Training is not only related to decreased turnover and
increased job satisfaction, it may also lessen absenteeism (Conklin, 2008) and build loyalty
to the child nutrition program (Oakley, 2008). Given the complexity of district
administrators’ positions, the current budgetary issues facing schools, and perhaps their
limited knowledge of specifics of child nutrition program administration, the finding that
there is a perceived need for district board-level policies addressing food safety is not
surprising. Sneed and Henroid (2003) found FSDs responded that an impetus for beginning
food safety HACCP programs was to reduce school district liability, and that HACCP food
safety plans could be viewed as an insurance policy and avoid negative press. Findings from
this study also indicated the provision of food safety training for foodservice and other school
staff is important; thus FSDs could work in concert with SBOs to ensure adequate funding is
allocated for this to occur. Rushing, Nettles, and Johnson (2009) found FSDs identified
themselves as representatives to the administration.
83
School Business Officials’ Knowledge of Food Safety Policy Mandates
in Child Nutrition Programs
The Child Nutrition and WIC Reauthorization Act of 2004 (P.L. 108-265) section
111, required each food production and service site within a school district to implement a
food safety plan based on HACCP principles. A document with information on planning and
implementation of the food safety plan entitled, USDA Guidance for School Food
Authorities: Developing a School Food Safety Program Based on the Process Approach to
HACCP Principles (USDA-FNS, 2005), was prepared. The USDA’s guidance document for
implementation was mailed to the school food authority in each district participating in child
nutrition programs (NSLP and/or SBP). This guidance document identified the minimum
elements for inclusion in the district’s food safety plan based on HACCP principles.
In this study, SBOs responded to three questions about the section of the Child
Nutrition and WIC Reauthorization Act of 2004 (P.L. 108-265) related to food safety plan
implementation. SBOs rated their level of familiarity with the new law using a 5-point scale
ranging from 1 (no knowledge of the law) to 5 (very familiar). SBOs also identified from a
list of resources those that had been used to gain information about the new legislation and
the elements they understood to be required in the district’s food safety plan. The majority of
the 88 responding SBOs self-reported low familiarity with this mandate with a mean rating of
2.70 on the 5-point scale (5 = very familiar). Only 18 SBOs indicated they were either very
familiar (n = 8, 9.1%) or familiar (n = 10, 11.4%), whereas 30 of the 88 (34.1%) reported
they were unfamiliar (rating of 2 on the 5-point scale). Eleven SBOs (12.5%) reported they
did not know about the mandated food safety legislation. This low level of reported

84
familiarity may be due to other requirements of the legislation. P.L. 108-265 also mandated
the development of a board-level approved wellness policy in each school district.
Principals are members of the district administration and have been identified as key
players in the implementation of a school wellness policy (Molaison & Carr, 2006).
Brounstein’s (2003) study focused on school superintendents’ knowledge and familiarity of
the National Association of School Boards’ publication about school based nutrition policies
entitled Fit, Healthy and Ready to Learn (Bogden, 2000). Knowledge about this document
was self-reported as very low by 23% of responding superintendents, with over 44%
indicating they had never seen this publication. It is possible SBOs, who serve in an
administrative role similar to principals and superintendents, were more involved with the
wellness policy aspects of the 2004 Child Nutrition Reauthorization Act than with the food
safety requirements, with delegation of HACCP planning to the FSDs (Story, 2008).
In a study assessing knowledge of school principals about the LWP, Molaison, Carr,
and Hubbard (2007) noted 19% of responding principals were uninformed about school
wellness policy implementation requirements; however, they were knowledgeable about
specifics such as preventing the sale of carbonated beverages and inclusion of the physical
education component in the curriculum. S. Roberts, Pobocik, Deck, Besgrove, and Prostine
(2009) had findings similar to Molaison et al. (2007), who reported principals did not know
the details of the new LWP for their districts. Molaison, Carr, and Federico (2008) further
noted successful implementation of a developed LWP needed support of administration,
teachers, and parents. In a follow-up study to Molaison et al.’s (2007) work, knowledge of
the LWP by principals was significantly higher, as 92.9% of principals reported knowledge

85
about the LWP (Molaison et al., 2011). Furthermore, the later study showed a positive
relationship between knowledge of the LWP requirements and implementation.
Close to half of the SBOs in the Mid-Atlantic region districts were unfamiliar
(34.1%) or did not know (12.5%) about the food safety component of the Reauthorization
Act of 2004 when polled in the fall of 2008 for this study. Based on this data, there appears
to be a need to raise the awareness of SBOs and other administrators about these mandates,
because additional resources from districts may be needed to comply with the regulations.
This finding is a concern as implementation of a food safety plan in each district based on
HACCP principles was required to begin with the start of the school year in 2006. School
FSDs need the support of principals and other school administrators (Barratt, Cross,
Mattfeldt-Beman, & Katz, 2004; Rainville, Choi, & Brown, 2003, 2005), as all play an
important role in helping to create a healthy school environment (Molaison et al., 2007). The
lack of awareness about district food safety plan implementation suggests little discourse
between foodservice department personnel and other school administrators, even though
Rushing et al. (2009) found FSDs agreed strongly they were representatives to the
administration. Story (2008) noted that the perceptions of foodservice administrators of the
inputs required to implement a food safety plan based on HACCP principles required both
direct and indirect costs with financial inputs including dollars and time (labor).
Requirements of Legislation
SBOs identified sources of information about requirements of the new legislation
from a given list. The majority of the SBO responses to these questions indicated learning of
the requirements of the legislation through the school FSD (n = 55, 62.5%); the other
frequently identified sources were state agency/agriculture departments (n = 19, 21.6%) or

86
regional or local SBO meetings (n = 13, 14.8%). The source of information identified least
frequently was the district superintendent (n = 2, 2.3%). These findings suggest FSDs are
considered the resource for a district’s central office about changes to school nutrition
program legislation. In Molaison et al.’s (2007) national study of school administrators, it
was found that principals learned of child nutrition program legislative changes through
principal meetings, district meetings, FSDs, superintendents, the department of education and
conferences. Results from this study were similar, with findings about sources of
information shown in Table 10. However, the USDA guidance document (USDA-FNS,
2005a), which was sent to the school food authority in every district in the country, did not
appear to have been reviewed by SBOs. It could be that SBOs were not the designated
school food authority for their districts or that personalized sources of information were
preferred over written guidance.
Table 10
School Business Official-Identified Sources of Information About P.L. 108-265 (N = 88)
Yes No
Sources of informationa n % n %
School foodservice director 55 62.50 33 37.50
State agency and/or Department of Agriculture 19 21.59 69 78.41
Local and/or regional SBO meeting 13 14.77 75 85.23
USDA guidance document 7 7.95 81 92.05
National SBO meeting 3 3.41 85 96.59
Other sources 4 4.55 84 95.45
Superintendent 2 2.27 86 97.72
TOTAL 103 513
aMultiple responses possible.

87
Essential Elements in the Development of a Food Safety Plan as Identified by School
Business Officials
An effective food safety plan ensures children are served safe food in school meal
programs by controlling hazards that may occur between purchasing of the food until service
to the children. Essential elements in the development of a food safety plan were described
in the USDA guidance document (USDA-FNS, 2005a). SBOs identified whether listed
elements were required of a food safety plan. No responses were interpreted as elements not
required. Overall, SBOs appeared knowledgeable about what elements were essential in a
food safety plan, with correct identification ranging from 22.7% to 69.3%. The majority of
SBOs (n = 61, 69.3%) correctly indicated SOPs were an essential component of a school
food safety plan. SOPs are useful in providing written procedures that address sanitation and
controls to avoid time and temperature abuse of foods. Two other elements recognized by
over 60% of respondents as important components of a food safety plan were recordkeeping
and training (64.8% and 63.6%, respectively). The high recognition by SBOs of the need for
training is not surprising given its basis as an administrative function. Monitoring and
corrective actions were identified by more than 50% of the SBOs (54.6% and 52.3%,
respectively). Written records are essential for documentation, verification, and proof of
safety processes and are indeed a key component of a HACCP-based food safety plan.
Monitoring is a process that involves observations and measurements, such as checking end-
point cooking temperatures. Corrective actions are the steps taken when the monitoring
process identifies established standards are not being met, such as continued cooking of a
product that has not reached required temperature or reporting an out-of-range cooler
temperature.

88
Other elements correctly identified by SBOs as necessary for a food safety plan were
procurement practices (42.1%), an overview of the district and types of meals served (37.5%
each), menu (34.1%), and description of each facility (34.1%). Purchasing of safe food
products from approved suppliers is one of the first steps in ensuring safe food for students.
Suppliers must be reputable, adhere to safe food practices, and be inspected by regulatory
agencies. The menu drives the cold and hot food production and handling procedures as well
as holding of foods until, and during, service. Although it is logical that specific steps in the
flow of food might not be recognized by SBOs, it is surprising that only about one third
grasped the fundamental role the menu plays by identifying it as an essential part of a food
safety plan.
Similarly, assignment of all food menu items into one of three process categories
established by the USDA guidance document (USDA-FNS, 2005a) was identified as an
essential element of a school food safety plan by less than one third (31.8%, n = 28) of the
SBOs. The concept of categorizing each food item into one of the three USDA-identified
process categories is based on when and how the food is prepared: uncooked or ready-to-eat
food; cooked and served the same day; or cooked, cooled, and served on a future day. It may
be that identification of menu item categorization as an essential element of a food safety
plan was due to lack of understanding by SBOs of the complexity of quantity meal
production and service or due to lack of understanding process categories. The use of the
process category approach to HACCP development allows for streamlining of SOPs, critical
limits and standards, monitoring, and corrective action steps into three categories rather than
one for each food item.

89
Table 11
Essential Elements of a School District HACCP-Based Food Safety Plan as Identified by
School Business Officials (N = 88)
Yes No
Essential elements n % n %
SOPs 61 69.32 27 30.68
Recordkeeping 57 64.78 31 35.23
Training 56 63.64 32 36.36
Monitoring responsibly 48 54.55 40 45.46
Corrective actions 46 52.27 42 47.73
Procurement processes 37 42.05 51 57.95
Overview of the district 33 37.50 55 62.50
Type of meals served in school 33 37.50 55 62.50
Menu 30 34.09 58 65.90
Description of each facility/school 30 34.09 58 65.90
Food items identified by category 28 31.82 60 68.18
Kitchen equipment and layout 26 29.55 62 70.45
Organizational chart–school foodservice department 21 23.86 67 76.14
Meal times 20 22.73 68 77.27
Elements identified by fewer than 30% of the SBOs as essential in the development
of a school food safety plan were kitchen equipment and layout, an organizational chart of
the department, and meal times (29.6%, 23.9%, and 22.7%, respectively). Findings for this
section of the survey are shown in Table 11.
District-Wide Staffing Information
School business officials were asked to respond to 18 questions about annual hours
provided through in-service, on-site, and external training to all staff in the district (non-
certified, professional, and administrative) and to noncertified and certified school
foodservice staff. In addition, SBOs were asked to indicate total number and full-time

90
equivalents of staff by these categories, funding sources used for training, topics addressed in
training, and attendance at trainings for the 2007–2008 school year. SBOs used district and
budgetary data to complete the questions. Of the 91 surveys returned, only 88 SBOs
completed this section at least partially. The SBOs response rate for questions in this section
of the survey ranged between 25 and 87 questions. Questions pertaining to total hours of
training by classified groups comprised those with the fewest responses whereas questions
pertaining to funding for foodservice training, participation in district in-service, and training
topics had a response rate of 85.7%.
Training and Professional Development Support
The professional staff category (i.e., teachers) reportedly received the most training
with a mean of 862.3 hours per district and a range between 0 and 7,000 hours. In four
districts from one state, hours of training were noted at 1,000, 2,500, 3,000 and 7,000,
respectively. Four districts in one state indicated hours of training for the administrative staff
category of 200, 250, 500, and 2,000 hours, respectively. SBOs were asked to identify
minimum training hours for foodservice staff; close to one third of the SBOs indicted zero
minimum training hours for all foodservice training. This may be due to their lack of
knowledge about training provided to foodservice personnel or that the directors really do not
provide any training opportunities for staff, including those on the topic of food safety. The
fewest reported training hours among all staff groups were for the categories of noncertified
school food foodservice staff (i.e., hourly workers) and the certified school foodservice staff
(i.e., managers and supervisors) with means of 30.27 and 22.06 hours, respectively. The
range of training hours reported by district SBOs for noncertified school foodservice staff
was zero (in two districts) to 300 hours (in one district). In one state, three districts indicated
91
training hours of 90, 150 and 300 hours, respectively, for noncertified staff, whereas training
hours for certified school foodservice staff ranged from zero (in two districts) to 90 hours (in
one district). Three districts responded training hours were not applicable based on contracts.
SBOs were asked about district support provided for the FSD’s professional
development. Two-thirds of the responding SBOs (n = 60) indicated professional
development day(s) for school FSDs varied based on elements of an agreement or contract,
with the annual number of development days specified ranging from zero days (n = 22) to 20
days (n = 2). However, three districts responded on the survey that the actual number of
professional development days was unlimited; perhaps these districts do not restrict
professional development days in or away from the district. The mean number of
professional development days specified in agreements or contracts reported by 60 SBOs was
2.99. Close to one third of SBOs noted zero days were provided or as identified by
agreement/contract. SBOs also indicated their perceptions of the number of professional
development days used by school FSDs. A mean number of 4.24 days was reported by less
than half of the SBOs (n = 42) with again a range of zero (n = 5) to 18 (n = 1). SBOs
reported similar funding sources for FSD training as for foodservice staff, with both general
fund (n = 69) and school foodservice funds (n = 66) used for directors’ professional
development.
The variability of these findings illustrates the difficulty in quantifying hours of
training for staff in different categories of employment in schools. Nonetheless, results do
provide some data about relative training inputs provided by districts, as reported by SBOs,
for school foodservice personnel. As noted, SBOs may not be aware of all training
opportunities received by staff. Findings are reported in Table 12.

92
Table 12
Ranges and Mean Total Hours Reported by SBOs for District Staff Training in School Year
2007–2008 by Category of Employees (N = 88)
Responses Hours Most frequent response
Staff categories n Minimum Maximum M Hours Districts
Non-certified staff 25 0 1,000 107.30 16 5
Professional staff 44 0 7,000 862.30 18, 24 4
Administrative staff 26 0 2,000 134.31 16, 18 4
Noncertified school foodservice staff 37 0 300 30.27 8 7
Certified foodservice staff 35 0 90 22.06 8 5
Do not know 38
District Requirements for Training by Staff Categories
Less than half of the 88 SBOs who responded to the question about district
requirements for training of noncertified staff in their districts indicated training was required
(n = 36, 40. 9%); another 19.4% (n = 17) did not know if there was a requirement. In asking
SBOs about training topics, only foodservice topics were specified on the survey.
As might be expected, the professional staff category (i.e., teachers) received the most
training with SBOs reporting a minimum number of 16.33 hours of paid training each year
per staff member. Administrators received the next highest amount of training with a
minimum number of 10.12 hours of paid training each year per staff member reported by
SBOs. Of the 40 districts responding to the minimum number of training hours for all staff
categories, close to 50% reported zero hours. Based on information provided by
approximately half of the responding SBOs (n = 46), each certified school foodservice staff
received a mean of 4.99 hours of required training per academic year, whereas 41 SBOs
reported noncertified school foodservice staff each received 3.1 hours and about half of
93
respondents reported zero minimum hours were provided. Responses for zero reported hours
were coded differently from nonresponses. Findings from this survey provide evidence
professional staff in child nutrition programs, classified as certified staff, receive much less
training from their districts than do teachers. Although there may be regulations that dictate
district funding for teacher professional development, the same opportunities clearly are not
available for those administering child nutrition programs.
As reported earlier, SNA (2009) found over 51% of all foodservice staff received 8 or
fewer hours of training annually. This is more than twice the amount of hours identified in
this current study. The current West Virginia state policy 4321.1 series 86 sets training hours
for school foodservice staff at 15 hours annually (Standards for School Nutrition, 2008), the
prior policy, 4320 series 85, set training at 18 hours of job-related staff development
annually. In their study, O’Toole et al. (2007) reported two-thirds of managers received
professional development on food safety, food preparation, use of HACCP principles, and
dietary guidelines. Story (2008) noted 81% of child nutrition program directors in her
national study reported food safety training for staff about HACCP implementation was
higher in 2006–2007 than in years prior.
Funding Sources for School Foodservice Training
Of responding SBOs to this section of the survey (n = 88), only 13 (14.8%) reported
use of the district general fund for school foodservice staff in-service training, whereas 77
(91.8%) indicated that primarily the foodservice fund was used. Five (5.7%) of the district
SBOs indicated use of other funding sources, such as those from contracted management
companies, were used for training of child nutrition staff.

94
Child nutrition programs funds are to be used only for specified purposes; training is
an allowable expense. Implementation of HACCP-based food safety plans requires training
for school foodservice management and hourly staff. However, these finding suggest the
cost of that training was borne by school nutrition funds rather than other sources. O’Toole
et al. (2007) reported over 96% of districts provided funding for staff development or offered
staff development for school foodservice staff on at least one topic and more than three-
quarters of districts provided funding for staff development or offered staff development for
school foodservice staff on food safety, healthy food preparation, menu planning, and
HACCP principles. O’Toole et al. did not identify the funding source for the staff
development. The states of Pennsylvania, West Virginia, and New Jersey noted the funding
for training was either from the general fund or a blend of the general fund and the
foodservice fund. Sneed et al. (2006) reported 35 state agencies offered basic food safety
training from 2003–2005, training over 24,000 foodservice staff. It may be that SBOs
responding to the survey were unaware of school nutrition staff training about HACCP
provided by state agencies or local health departments. Story (2008) noted these two
organizations (state education and health departments) were identified by 40% and 41%,
respectively, of child nutrition program administrators as providers of training about
HACCP. Over three-fourths (n = 67, 76.1%) of the SBOs reported school foodservice staff
were paid to attend training as part of district in-service training days. Generally, foodservice
staff was paid from the foodservice fund. High attendance by school foodservice staff at paid
in-service trainings was reported with 65.9% of SBOs indicating participation and about 13%
not knowing whether or not foodservice staff attended.
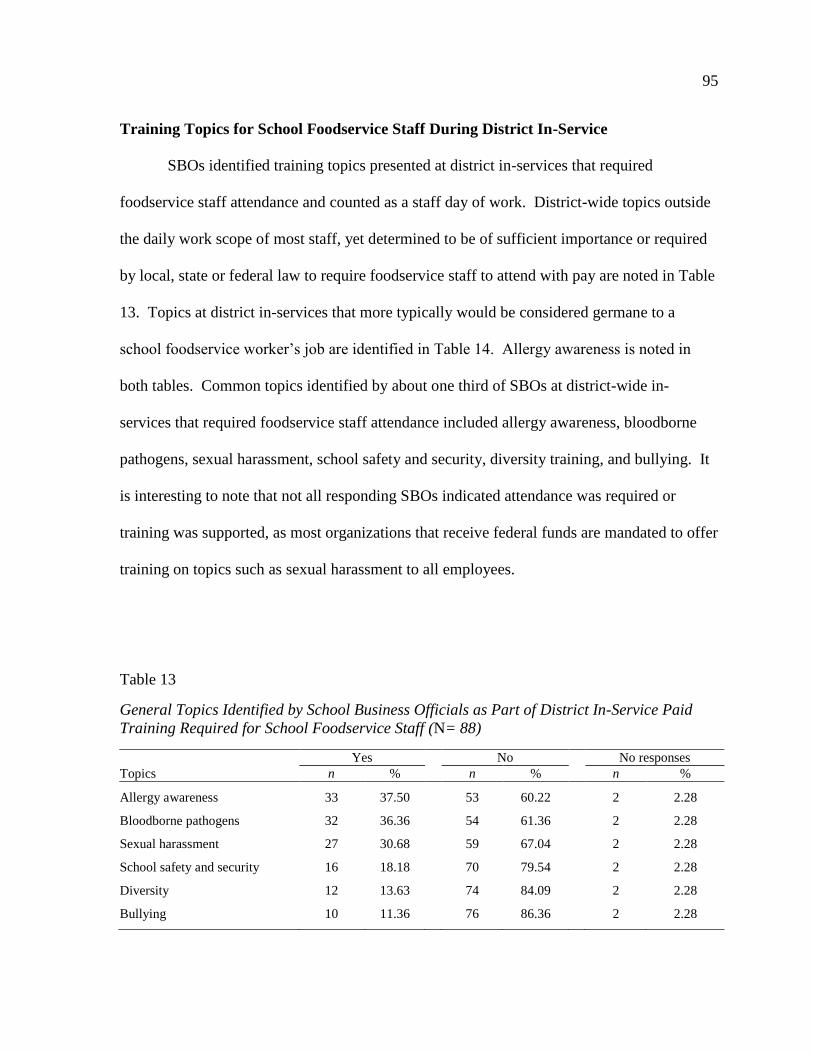
95
Training Topics for School Foodservice Staff During District In-Service
SBOs identified training topics presented at district in-services that required
foodservice staff attendance and counted as a staff day of work. District-wide topics outside
the daily work scope of most staff, yet determined to be of sufficient importance or required
by local, state or federal law to require foodservice staff to attend with pay are noted in Table
13. Topics at district in-services that more typically would be considered germane to a
school foodservice worker’s job are identified in Table 14. Allergy awareness is noted in
both tables. Common topics identified by about one third of SBOs at district-wide in-
services that required foodservice staff attendance included allergy awareness, bloodborne
pathogens, sexual harassment, school safety and security, diversity training, and bullying. It
is interesting to note that not all responding SBOs indicated attendance was required or
training was supported, as most organizations that receive federal funds are mandated to offer
training on topics such as sexual harassment to all employees.
Table 13
General Topics Identified by School Business Officials as Part of District In-Service Paid
Training Required for School Foodservice Staff (N= 88)
Yes No No responses
Topics n % n % n %
Allergy awareness 33 37.50 53 60.22 2 2.28
Bloodborne pathogens 32 36.36 54 61.36 2 2.28
Sexual harassment 27 30.68 59 67.04 2 2.28
School safety and security 16 18.18 70 79.54 2 2.28
Diversity 12 13.63 74 84.09 2 2.28
Bullying 10 11.36 76 86.36 2 2.28

96
Table 14
Food-Related Topics Identified by School Business Officials as Part of District In-Service
Paid Training Required for School Foodservice Staff (N = 88)
Yes No No responses
Topics n % n % n %
Food safety 49 55.68 37 42.04 2 2.28
Kitchen safety 41 46.59 45 51.13 2 2.28
Nutrition education 40 45.45 46 52.27 2 2.28
Material safety data sheets (MSDS) 36 40.90 50 56.82 2 2.28
Allergy awareness 33 37.50 53 60.22 2 2.28
Wellness and healthy behaviors 11 12.50 75 85.22 2 2.28
Healthy school environment 22 25.00 64 72.72 2 2.30
First aid 15 17.05 71 80.68 2 2.30
Fire safety 15 17.05 71 80.68 2 2.30
Heimlich maneuver 10 11.36 76 86.36 2 2.30
Cardiopulmonary resuscitation (CPR) 7 7.95 79 89.78 2 2.30
Automated external defibrillator (AED) 3 3.41 83 94.18 2 2.30
Topics related more closely to the work of school foodservice personnel, such as food
safety, kitchen safety, nutrition education, material safety data sheets, and allergy awareness,
were identified frequently by SBOs as subjects at district in-services that required and
supported foodservice staff attendance. These topics were identified more frequently than
were general subject matter topics, perhaps because it was assumed school foodservice staff
would have greater interest and district support, and having attendance as a work day was
considered more appropriate, for these work-related subjects.
Completeness of District’s Food Safety Plan
School FSDs (n = 166) rated their perceptions of the level of completeness in
development and implementation of the written instructions or SOPs for their district’s food
safety plan, as outlined in the USDA Guidance for School Food Authorities: (USDA-FNS,

97
2005a). FSDs used a 5-point rating scale ranging from 1 (nothing in writing or not started)
to 5 (complete) in assessing levels of completion for 11 listed SOPs. The majority of the
FSDs (n = 156, 93.9%) indicated that completion and implementation of the identified SOPs
in their districts were fairly complete (M = 4.67). The top three SOPs identified with greatest
levels of completeness and implementation reported were: washing hands (n = 135, 81.3%);
cooking potentially hazardous foods (n = 127, 76.5%); and holding of hot and cold
potentially hazardous foods (n = 127, 76.5%). The SOPs identified with the lowest
completeness and implementation levels were: date marking of ready-to-eat potentially
hazardous foods (n = 110, 66.3%); receiving of deliveries (n = 114, 68.7%); and storing
and/or using poisonous or toxic chemicals (n = 118, 71.1%). Other SOPs identified by the
school FSDs noted as complete or fairly complete were availability of material safety data
sheets, calibration of thermometers, and an employee health policy. Findings are shown in
Table 15.
Close to 30% of the school districts reported a lack of completeness with SOPs
related to date marking of ready-to-eat potentially hazardous foods and receiving of
deliveries. Dating of supplies and food products during receiving, storage, food preparation,
and service assists staff in using oldest product first and knowing when to discard old
products or following “first in–first out” best practice. Approved suppliers must be used by
all retail foodservices (NRAEF, 2008). Generally, this means suppliers have the necessary
licenses and have met standards of required inspections. In addition, as found in Serving It
Safe (NSFMI, 2009), directors or assigned staff should observe cleanliness of delivery trucks,
review these vendor health inspection reports or keep letters of assurance from vendors on
file, coordinate delivery schedules with school times to ensure staff is available to receive
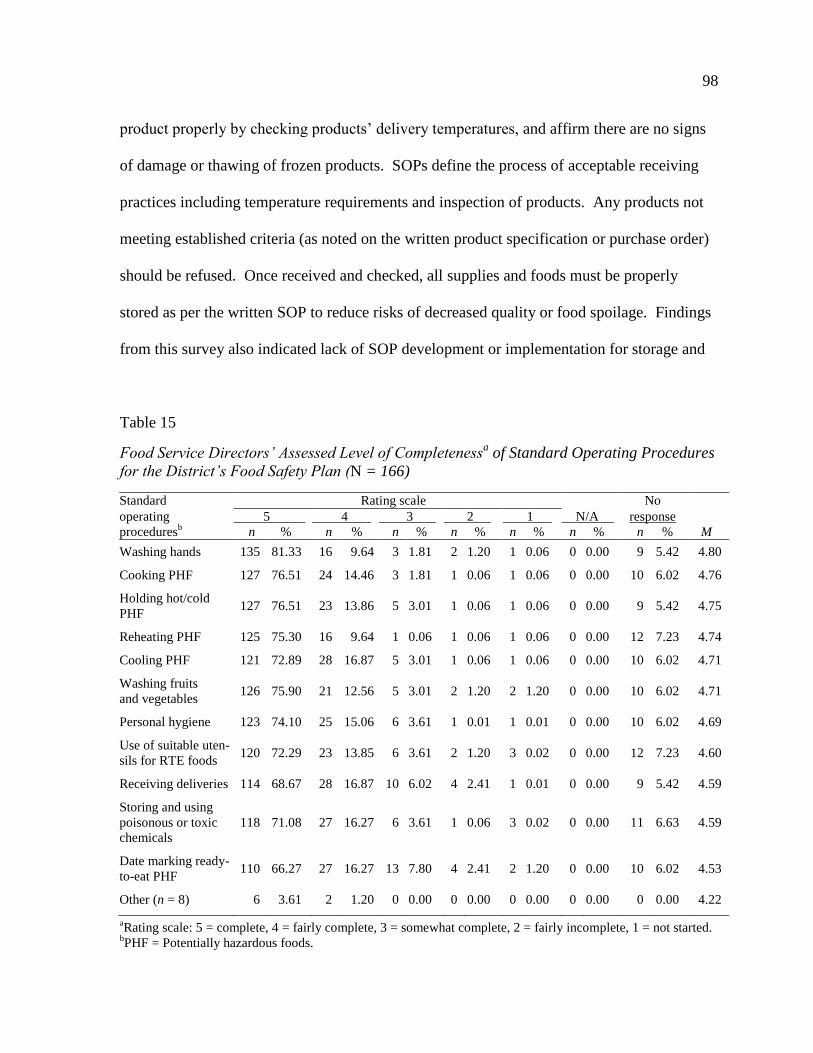
98
product properly by checking products’ delivery temperatures, and affirm there are no signs
of damage or thawing of frozen products. SOPs define the process of acceptable receiving
practices including temperature requirements and inspection of products. Any products not
meeting established criteria (as noted on the written product specification or purchase order)
should be refused. Once received and checked, all supplies and foods must be properly
stored as per the written SOP to reduce risks of decreased quality or food spoilage. Findings
from this survey also indicated lack of SOP development or implementation for storage and
Table 15
Food Service Directors’ Assessed Level of Completenessa of Standard Operating Procedures
for the District’s Food Safety Plan (N = 166)
Standard Rating scale No
operating 5 4 3 2 1 N/A response
proceduresb n % n % n % n % n % n % n % M
Washing hands 135 81.33 16 9.64 3 1.81 2 1.20 1 0.06 0 0.00 9 5.42 4.80
Cooking PHF 127 76.51 24 14.46 3 1.81 1 0.06 1 0.06 0 0.00 10 6.02 4.76
Holding hot/cold
PHF 127 76.51 23 13.86 5 3.01 1 0.06 1 0.06 0 0.00 9 5.42 4.75
Reheating PHF 125 75.30 16 9.64 1 0.06 1 0.06 1 0.06 0 0.00 12 7.23 4.74
Cooling PHF 121 72.89 28 16.87 5 3.01 1 0.06 1 0.06 0 0.00 10 6.02 4.71
Washing fruits
and vegetables 126 75.90 21 12.56 5 3.01 2 1.20 2 1.20 0 0.00 10 6.02 4.71
Personal hygiene 123 74.10 25 15.06 6 3.61 1 0.01 1 0.01 0 0.00 10 6.02 4.69
Use of suitable uten-
sils for RTE foods 120 72.29 23 13.85 6 3.61 2 1.20 3 0.02 0 0.00 12 7.23 4.60
Receiving deliveries 114 68.67 28 16.87 10 6.02 4 2.41 1 0.01 0 0.00 9 5.42 4.59
Storing and using
poisonous or toxic
chemicals
118 71.08 27 16.27 6 3.61 1 0.06 3 0.02 0 0.00 11 6.63 4.59
Date marking ready-
to-eat PHF 110 66.27 27 16.27 13 7.80 4 2.41 2 1.20 0 0.00 10 6.02 4.53
Other (n = 8) 6 3.61 2 1.20 0 0.00 0 0.00 0 0.00 0 0.00 0 0.00 4.22
aRating scale: 5 = complete, 4 = fairly complete, 3 = somewhat complete, 2 = fairly incomplete, 1 = not started.
bPHF = Potentially hazardous foods.

99
use of poisonous or toxic chemicals (71.1%). This is a concern, as chemicals frequently used
for cleaning purposes can inadvertently or intentionally contaminate food and supplies if not
stored or used properly. It is recommended cleaning and sanitizing agents be kept in an
original container, away from all food and other supplies, in a locked storage area (NSFMI,
2009). If transferred to another container, it is recommended the new container be labeled
with the name of the product.
In the NSFMI survey conducted in 2009, findings showed a vast majority of school
nutrition directors and managers reported that their districts and schools, respectively, had
implemented food safety programs based on HACCP principles (Molaison et al., 2011).
However, additional assessments concluded that the implementation process often was not
complete. The NSFMI study also found that the school food safety programs did not include
all the components required for a program based on HACCP principles as outlined in the
USDA guidance document (USDA-FNS, 2005a). Thornton (2007) found only 2.3% of
schools in her national sample reported no implemented food safety plan. Past research of
FSDs’ perceptions regarding food safety plan development indicated plans are in place
(SNA, 2007). The SNA 2007 Operational Report (SNA, 2007) found that 90.3% of schools
reported a formal food safety policy was in place. However, research such as this project and
the NSFMI study, which assessed additional levels of implementation such as documentation
and recordkeeping, suggested HACCP-based food safety plans are not completely integrated
into child nutrition programs. It should be noted that both reports from SNA were from
national samples, whereas the present study focused on the Mid-Atlantic region and asked
about specific SOP implementation. The timing of data collection for all the studies also
should be noted. This study’s survey data were gathered in 2008, 2 years after the required
100
July 2006 implementation date of the HACCP-based food safety plan. Information about
readily available customized SOP templates from ISU Extension (2007, 2008), NSFMI, and
other resources have been promoted to FSDs.
Recordkeeping
In this study, FSDs responded to questions about recordkeeping and documentation of
the food safety plans in their programs. Documentation of specified tasks can prove care was
exercised in a school operation. FNS (2005a) suggested seven steps in developing a school
food safety plan; step six is recordkeeping. Records suggested by FNS entail aspects of the
food safety plan related to monitoring and corrective action. Recordkeeping provides a basis
for periodic review of the overall food safety program, and certain written records or
documentation are needed to verify that the program is working. Respondents indicated if
written records of the district’s food safety plans were kept by each school building with a
“yes” or “no” response. Of the 155 FSDs responding to this question, the majority (94.2%, n
= 146) indicated they kept written records of the district’s food safety plans by each school
building. This is the correct method of recordkeeping as outlined in the USDA school
HACCP guidance document (USDA-FNS-2005a). Two FSDs noted records were kept in the
district office only. In these cases, it is possible the school office and the district office are
the same. The remaining FSDs (3.2%) indicated written records were not kept. Detailed and
proper records serve as support in demonstrating that food was prepared and served in a safe
and sanitary manner and that established standards related to cleaning and sanitizing were
met. This is a critical principle in the HACCP-based school food safety plan and, as noted, a
fundamental requirement.

101
Record Retention
The FSDs identified the length of time that school food safety records were retained
(Table 16). A total of 149 FSDs responded to this question. The most frequent responses
were: 3 years (n = 61, 40.9% of all respondents); 3 plus the current year (n = 27, 18. %); and
2 years (n = 24, 16. %). Over 23% of respondents indicated a time frame for recordkeeping
of 5 to 7 years or more, with one district reporting records were kept for 10 years; the
average number of years in this study was 3.6. The USDA Guidance for School Food
Authorities (USDA-FNS, 2005a) and NSFMI (2009) recommended written logs be
maintained a minimum of one year, yet no maximum time period was specified. Further
clarification was requested from NSFMI in a personal communication (E. Howell, October
12, 2009). This contact indicated each state agency establishes the policy for length of time
for recordkeeping, as time frames may be based on general liability requirements of each
Table 16
School Foodservice Directors’ Responses to Years School Food Safety Records Retained
(N = 149)
Responses
Number of years retained n %
1 24 16.11
2 1 0.67
3 61 40.94
4 27 18.12
5 13 8.72
6 3 2.01
7 19 12.75
8 0 0.00
9 0 0.00
10 1 0.67

102
state. This clarification may explain why the responses were greater than recommended
length of 1 year.
Recordkeeping Log Documentation
Responses to questions about use of specific recordkeeping logs identified in the
HACCP guidance document (USDA-FNS, 2005a) ranged from 63.3% to 92.8% compliance
(Table 17). FSDs responded if recordkeeping documents were present with a “yes,” “no,” or
“do not know.” Refrigeration logs were rated as present in most of the districts (92.8%, n =
154), whereas records for damaged or discarded products were identified as present in fewer
districts (63.3%, n = 105). Although logs may be in place, Henroid and Sneed (2004) found
areas of improvement where training and education about food safety practices and increased
documentation of practices for end-point cooking temperatures, refrigerator and freezer
storage, and dish machine effectiveness were needed. The FNS suggested a food safety
program review checklist to be used to document review of the school food safety program
annually (USDA-FNS, 2005a). In this current study, no FSDs identified creating this log,
thus it is suspected that school food safety program plans may not be reviewed with staff and
updated annually. In training by Gilbert (2010), food safety plans must be signed off and
posted in each food safety manual annually. The FNS further identified the four areas to be
documented weekly as reviewed in the food safety program review check list: SOPs, food
preparation processes, control measures, and corrective actions (USDA-FNS, 2005a). Only
one FSD listed a corrective action log, which is a component of the food safety program
review check list. Other recordkeeping logs identified by many of the FSDs were dishwasher
sanitizing temperatures (n = 8), transport/satellite times and temperatures (n = 3), sanitizer
solution concentrations (n = 5), freezer storage temperatures (n = 3), thermometer calibration

103
(n = 3), storage room temperatures (n = 3), ice machine (n = 2), and production reports (n =
2). The listing of logs was adopted form the FNS guide; however more logs are readily
available from ISU Extension. Other logs not identified by FSD but available from ISU
Extension in cooperation with the state agency are: annual calendar for training, hot holding
log, menu planning worksheet, and menu production planning.
Table 17
School Foodservice Directors’ Responses to Types of Food Safety Records Retained
(N = 166)
Responses
Yes No Do not know No response
Recordkeeping documents n % n % n % n %
Refrigeration log 154 92.77 2 1.20 0 0.00 10 6.02
Cooking and reheating temperature log 149 89.76 8 4.82 0 0.00 9 5.42
Receiving log 121 72.89 27 16.27 1 0.06 17 10.24
Cooling temperature log 118 71.08 32 19.28 1 1.20 15 9.04
Damaged or discarded product log 105 63.25 42 25.31 3 1.81 16 9.64
HACCP-Based Food Safety Plan Documentation
The FSDs also identified whether documentation was in place for components of a
HACCP-based food safety plan: prerequisite programs, hazard analysis, menu item
identification in process category, critical control points, corrective actions, monitoring
activities, and verification. Respondents indicated presence of these components with a
“yes,” “no,” or “don’t know.” The most frequently reported documents present were for
components of critical control points (n = 134, 80.7%); corrective actions (n = 133, 80.1%);
and hazard analysis (n = 126, 75.9%). The documented use of prerequisite programs was
least utilized as reported by these FSDs. Close to one third (28.9%, n = 48) of the
104
respondents identified that documentation of prerequisite programs, such as SOPs, were in
place, whereas slightly less (26.5%, n = 44) stated they did not know whether this type of
record was present. A summary record documenting prerequisite programs may be seen as
duplicative, and it should be noted, given the high number and percentage of respondents
who indicated the presence of SOPs and other documentation, that a conclusion that
prerequisite programs were not in place could be in error. The benefits of prerequisite
programs were noted in the HACCP implementation in K-12 schools guidance document
(USDA-FNS, 2005a). The HACCP guidance document (USDA-FNS, 2005a) recommends a
standardized checklist documenting the presence of a prerequisite program, including SOPs,
be included in the district’s food safety plan. The checklist also identifies other prerequisites
such as supplier assurance or approvals, sanitation practices, training, employee health and
hygiene, chemicals, storage, pest, and temperature control. Prerequisite programs are the
foundation of a HACCP plan and are basic operating conditions for producing safe food
(NRAEF, 2008). A prerequisite checklist can be useful in determining areas of the school
food safety plan that are less completely developed. Although this prerequisite program
checklist was not included in the USDA guidance document (USDA-FNS, 2005a), it was
readily available to school FSDs through ISU Extension and the NSFMI. Sneed and Henroid
(2007) found 32% of respondents who used the prerequisite process checklist found it very
useful, 65% rated the SOP check list as very useful (65%), and 71% found the documentation
forms were very useful. With the exception of prerequisite programs, all the other listed
components of a HACCP-based food safety plan were reported by three-fourths or more of
the responding FSDs as ones with documentation in place. Findings are shown in Table 18.

105
Table 18
School Foodservice Directors’ Responses to Documentation Used for Components of a
HACCP-Based Food Safety Plan (N = 166)
Yes No Do not know No response
Recordkeeping documents n % n % n % n %
Prerequisite program 48 28.92 46 27.71 44 26.51 28 16.87
Hazard analysis 126 75.90 16 96.38 9 54.22 15 90.36
Menu classification 114 68.67 29 17.47 6 3.61 17 10.24
Critical control points 134 80.72 14 84.34 5 3.01 13 7.83
Corrective action 133 80.12 15 9.04 4 2.41 14 8.43
Monitoring activities 122 73.49 19 1.45 11 6.63 14 8.43
Verification 112 67.47 22 13.25 16 9.64 16 9.64
Story (2008) reported 62% of respondents reported the purchase of bimetallic stem
thermometers, 85% had purchased refrigerator thermometers, and 48% had purchased digital
probes. Over 70% various thermometers were purchased prior to the implementation of their
food safety plan, as they were aware to check temperatures of food products, and 20%
indicated thermometers were purchased after the mandate. Cooling chill sticks were
purchased by less than 25% of districts prior to or after the mandate. Story found
thermometer calibration records were kept and calibrations varied by district, one district
reporting calibration occurred one to two times per month and another district one to two
times per day or as needed. Managers indicated logs were reviewed daily to verify the food
safety plan was working; in one district the logs were signed after review, whereas the other
district simply stated their logs were reviewed.
Critical control points are steps in the handling/cooking process where a control
action is essential to assure food safety. Corrective action documentation records an action
needed to be taken when a critical limit or standard was not met. Examples of the type of
106
corrective action that would be documented include rejection of dented cans at receiving, as
per the SOP and established standard, or discarding of food from a refrigeration unit in which
failure to maintain adequate cooling temperatures was noted in excess of four hours.
Completeness of the SOP for receiving was rated at less than 75% complete, an area where
an occurrence of mishandling of foods should have documentation. Henroid and Sneed
(2004) found in a study of Iowa schools prior to HACCP implementation that greater
documentation was needed to verify appropriate food-handling practices were occurring in
school meals programs. They noted recordkeeping of control points and critical control
points was not found. Although FSDs in this study indicated documentation of critical
control points occurred, prior research had not found that to be the case. The difference may
be due to the elapse of time between studies and increased training about HACCP-based food
safety plans.
The manager and foodservice staff share in the responsibilities of monitoring.
Monitoring activities involve the act of observation to make sure critical limits are being met
and maintained, whereas verification confirms your food safety plan is working. In this
study, perhaps the FSDs just noted “yes” to each area of documentation or they did not
understand what documentation practices involved. Results of semiannual health inspections
continue to show similar lapses in food handling best practices as found in previous research.
Results of this study are not consistent with Giampaoli, Sneed, et al.’s (2002), Sneed et al.’s
(2004), or Henroid and Sneed’s (2004) observations of documentation of temperatures during
prepreparation, cold holding, end-cooking temperatures, and reheating processes, as well as
cooler/freezer temperatures and dishwasher temperatures. Specifically, thermometer
calibration records (Sneed & Henroid, 2003) and temperature logs of food items were not

107
found (Giampaoli, Sneed, et al., 2002). Olds and Sneed (2005) recommended appropriate
documentation procedures for cooling, and Giampaoli, Sneed, et al. (2002) suggested audits
be conducted on an ongoing basis as part of the monitoring compliance. Sneed et al. (2004)
also noted a verification process needed to be established in foodservices observed. Findings
from this study are surprising as lower levels of adoption of documentation of prerequisite
programs, a fundamental step in HACCP plan development, was found than for monitoring
and verification documentation. Responses by FSDs about documentation are show in Table
18.
Food Safety Concepts in Human Resources Management Procedures
School FSDs responded to five questions about inclusion of food safety concepts in
components of human resources management processes for staff: interview, orientation
training, task lists, job description, and performance appraisals. FSDs indicated a response of
“yes,” “no,” or “did not respond.” The majority of respondents indicated food safety
concepts were included in all five of the listed processes of human resources management,
with the number of “yes” responses ranging from 101 to 144. The highest reported inclusion
of food safety concepts was noted for orientation (n = 144) and in specific task lists (n =
134); lowest inclusion was reported in interviews (n = 106) and performance appraisals (n =
101). Inclusion of food safety training in foodservice staff orientation suggests recognition
by FSDs that fundamental knowledge about safe food handling is critical to protect health of
students. However, it is interesting that food safety concepts are not part of the interview
process. This may be due to the historical description of line-level foodservice jobs not
requiring any specific knowledge or skills. The Healthy, Hunger – Free Kids Act of 2010
does specify the need for specific knowledge and skills, which eventually may mean a

108
transition from the workplace providing training to an expectation that new hires possess the
necessary knowledge and skills prior to employment. It is also interesting, given that food
safety training is included in most orientation programs, that there is no integration of this
training into expectations for work performance through job descriptions or performance
appraisals. Ideally, there should be alignment with posted job announcements, provided
training, job descriptions, and performance reviews. Findings from this study show less
frequent inclusion of food safety components in personnel processes could be caused by
school district governance in which FSDs are not included in the interview process or FSDs
not having control of performance reviews due to union organization contracts or the use of
standardized district-wide forms for staff at specific classifications. What is not clear from
these findings is whether written job descriptions for foodservice staff positions actually
existed and which of the respondents actually had the authority and responsibility to create
these and performance evaluation forms. Cross, Asperin, and Nettles (2009) conducted
research to develop competency-based performance appraisals for evaluation of school
nutrition managers and assistants. They indicated effective performance appraisals should
have criteria: instructions, comment space, plan for improvement, and clearly defined
expected performances, as well as include functions essential to their job, one being
sanitation and safety for both school nutrition managers and assistants. Stinson et al. (2011)
also suggested making food safety practices a part of the evaluation. Span of control and
scope of authority and responsibility vary greatly among administrators of child nutrition
programs in school districts. More frequent inclusion of food safety concepts noted by 134
FSDs in actual day-to-day operational aspects of the task lists suggests management control
over these activities is in place to a certain degree.

109
Sanitation Inspections
In this section of the survey, FSDs responded to questions related to sanitation
inspections in their districts for the 2007–2008 school year. The Child Nutrition and WIC
Reauthorization Act of 2004 required that, effective at the start of the 2006 school year,
districts participating in child nutrition programs were to receive two health inspections
annually, post results of the inspection reports, and implement a food safety plan based on
HACCP principles for each foodservice site where food is produced or served in the district.
A total of 158 FSDs (95.2%) of the 166 completed surveys responded to two yes/no and
three open-ended questions. In addition, FSDs identified which critical violations had been
noted on the most recent inspection. The majority of FSDs responding to this section of the
survey (94.3%, n = 149) indicated two written inspection reports were received annually by
local health inspectors for their districts, a finding consistent with Stinson et al.’s (2011)
study. However, this finding was not consistent with an article that appeared in USA TODAY
(Eisler & Morrison, 2009), in which USDA data was cited that 30% of the 26,500 school
building cafeterias across the nation lacked required semiannual inspections. A
representative from the SNA responded to the story with several talking points posted on the
SNA website and a comment that the SNA had been in conversations with the authors
regarding food safety facts and practices (personal communication, D. Pratt-Heavner, SNA,
December 19, 2009).
Inspection Fees for Additional Health Inspections
A total of 21 (13.7%) districts reported a fee, in excess of the current license fee
which covers annual inspections, was charged by their regulatory agency for completion of
the second health inspection. Therefore 86.3% of responding districts had not incurred added

110
costs for inspections, a finding similar to that of Story (2008). Of the 21 districts that were
imposed an additional fee, 17 identified the amount charged. The reported fees to conduct
two inspections per year as required by the Reauthorization Act of 2004 ranged from $35 (n
= 1) to $7,884 (n = 1). The mean additional fee per district for semiannual inspections, based
on the 17 districts that identified a fee, was $2,405. The median fee charged for these
districts was $ 2000. Story found similar fee ranges in her national study of school
foodservice authorities’ perceived costs in implementing HACCP food safety plans, which
FSDs reported as ranging from an additional $25 to $5,125. Although it is unclear whether
the fees were charged by these regulatory agencies prior to the 2004 Act, findings indicated a
significant financial burden was placed on some districts to comply with the mandated two
inspections per year for each foodservice site in the district.
Posting of the Inspection Reports
The Reauthorization Act also required inspection reports to be posted in public view
and available upon request. Of the 141 FSDs responding to the question regarding location
of inspection reports, 36 indicated inspection reports were posted in two or more places.
Surprisingly, 9 directors indicated inspection reports were not posted in any manner,
including in school buildings, in district administration offices, or electronically on the
districts’ web site. A total of 24 directors indicated compliance was achieved using alternate
methods of dissemination by posting in school buildings, on the district’s web site, or
submission of the health inspection report to the newspaper. The most frequently reported
posting location for an inspection report in the district was in the cafeteria serving line (n =
98), foodservice kitchen (n = 27), or site manager’s office window (n = 21). Findings
indicated there were multiple interpretations of what was meant by public view and

111
availability. The small percentage of districts that appeared to be in noncompliance suggests
the need for further education and/or monitoring during state agency reviews of the
programs.
The majority of FSD respondents (84.9%, n = 141) indicated a request for a copy of a
health inspection report from the general public or nonschool representative had not been
received. Of the remaining respondents, 10 (6.0%) directors stated a request had been made
once, three directors (1.8%) reported requests had been received two to five times, and 12
FSDs did not respond to this question.
Critical Violations Cited During Semiannual Health Department Inspections
Findings from the directors in the Mid-Atlantic region who participated in this study
supervised child nutrition programs in a mean number of 10 buildings per districts; a span of
supervision similar to that identified in Rice’s (2007) study. In this study, a total of 1,522
school foodservice sites were under the direction of 155 FSDs. Of the 149 FSDs who
identified critical violations had been noted in an inspection report for their districts, 28
indicated multiple types of violations with totals exceeding 90 counts. A list of violations
categorized similar to the food code inspection reports were presented to FSDs on the survey.
As shown in Table 19, FSDs identified categories of violations as: food temperatures (n = 6);
faulty equipment (hot and cold production and holding, cleaning and sanitizing; n = 25);
storage (n = 10); chemical handling (improper sanitizer concentrations; n = 4); hygiene
practices (n = 15); and structural areas (interior and exterior facilities; n = 31).
Findings from this study of reported violations are similar to those noted in a
longitudinal study of restaurants in Tennessee (Jones, Pavlin, La Fleur, Ingram, & Schaffner,
2004) and the Sports Arena in Washington (Jenkins-McLean, Skilton, & Sellers, 2004).
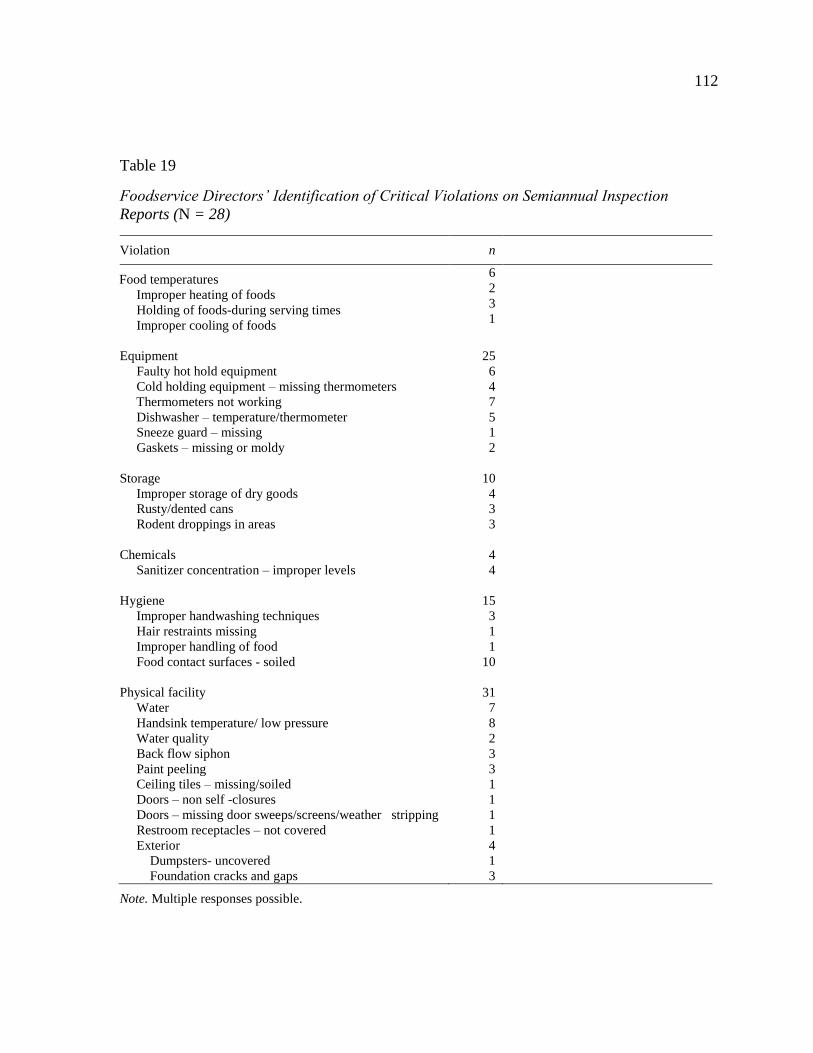
112
Table 19
Foodservice Directors’ Identification of Critical Violations on Semiannual Inspection
Reports (N = 28)
Violation n
Food temperatures
Improper heating of foods
Holding of foods-during serving times
Improper cooling of foods
6
2
3
1
Equipment
Faulty hot hold equipment
Cold holding equipment – missing thermometers
Thermometers not working
Dishwasher – temperature/thermometer
Sneeze guard – missing
Gaskets – missing or moldy
25
6
4
7
5
1
2
Storage
Improper storage of dry goods
Rusty/dented cans
Rodent droppings in areas
10
4
3
3
Chemicals
Sanitizer concentration – improper levels
4
4
Hygiene
Improper handwashing techniques
Hair restraints missing
Improper handling of food
Food contact surfaces - soiled
15
3
1
1
10
Physical facility
Water
Handsink temperature/ low pressure
Water quality
Back flow siphon
Paint peeling
Ceiling tiles – missing/soiled
Doors – non self -closures
Doors – missing door sweeps/screens/weather stripping
Restroom receptacles – not covered
Exterior
Dumpsters- uncovered
Foundation cracks and gaps
31
7
8
2
3
3
1
1
1
1
4
1
3
Note. Multiple responses possible.

113
Violations identified in these commercial operations were for unclean nonfood equipment
surfaces, walls/ceilings, and food-contact surfaces; inadequate food protection and door
closures; improper sanitizing solutions; and improper storage of foods. Story’s (2008) study
also noted the reported lack of compliance with HACCP-based food safety plans by FSDs
with improper equipment along with needed facility repairs and maintenance identified as
issues. Not all FSDs in the current study identified violations and corrective actions. A total
of 41 FSDs reported action steps to correct identified critical violations: training of staff;
discarding of improperly stored or heated food; removal, repair or replacement of faulty
pieces of equipment; introducing integrated pest management practices; and correcting
structural deficiencies, such as painting of ceiling tiles and closing gaps in foundations. It is
interesting to note the three SOPs identified by most FSDs in this study as complete and
implemented in the districts were also areas identified as the top three violations. These
violations also have been reported in past research (FDA, 2000; Sneed et al., 2004). The
FDA made the following recommendations for out-of-compliance risk factors: develop and
implement SOPs specifically for time and temperature abuse and personal hygiene, and
create measures to prevent food contamination. The FDA further recommended
establishment of critical limits and methods to assess the effectiveness of the SOPs.
Reported critical violations in school foodservices are shown in Table 19.
Foodservice Directors’ Perceived Organizational Support for Child Nutrition
Programs from District Administration
School FSDs rated 17 items to assess their perceptions of administrative support for
the child nutrition program in their districts. A 5-point Likert-type rating scale ranging from
1 (very unsupportive) to 5 (very supportive) was used. A total of 158 (95.0%) FSDs

114
responded to this section of the questionnaire. As shown in Table 20, the majority of FSDs
identified five items for which they perceived strong support from the administration:
implementing mandated laws (M = 4.23), crisis management (M = 4.16), maintaining kitchen
and facilities (M = 4.13), meal price increases (M = 4.03), and personnel issues (M = 4.01).
Six items for which administration was viewed as somewhat supportive (mean ratings
ranging from 3.82–3.97) were: facility use by outside groups, policy implementation, capital
Table 20
Mean Ratingsa and Standard Deviations of Foodservice Directors’ Perceptions of
Administrative Support for Foodservice Operational Issues (N = 158)
Operational issues M SD
Implementing mandated laws 4.23 0.95
Crisis management 4.16 0.92
Maintaining kitchen and facilities 4.13 0.84
Meal price increases 4.03 1.10
Personnel issues 4.01 1.03
Policy implementation 3.97 1.0
Capital purchases greater than $ 500.00 3.96 1.09
Training opportunities for school foodservice 3.95 1.08
Staffing needs 3.91 1.07
Community response to program changes 3.86 1.03
Student charging of meals 3.82 1.01
Facility use by outside groups 3.82 1.08
Increases to annual foodservice budget 3.79 1.22
Funding operating costs i.e. garbage and utilities 3.72 1.45
Financial support for foodservice fund 3.37 1.55
Negative balance of monthly financial reports 3.20 1.54
Negative net operating income 2.91 1.61
aBased on a rating of 5 = very supportive, 4 = generally supportive, 3 = neither supportive or unsupportive, 2 =
unsupportive, 1 = very unsupportive.

115
purchases greater than $500, training opportunities for school foodservice, staffing needs,
community response to program changes, and student charges of meals. FSDs in contracted
management foodservice programs responded with greater levels of perceived support (M =
4.23, SD = .546) than did self-operated program directors (M = 3.85, SD = .744), and other
findings showed there was less perceived support (mean ratings below 3.80) for financial-
related matters or items requiring monetary inputs, such as increases to the annual
foodservice budget (M = 3.79), financial support for the foodservice fund (M = 3.37),
negative balance in the monthly financial reports (M = 3.20), and negative net operating
income (M = 2.91). These findings could be reflective of an administrative view that the
child nutrition program should be self-supporting and that general fund money should not be
taken away from educational purposes.
March and Gould (2002) found administrative support was provided in the form of
assistance with meal-time supervision (92%) and general child nutrition program support
(90%). Wilson (2007) found foodservice employees perceived organizational support from
school administration as neutral. Story (2008) found in a case study of two districts that
there was strong perceived support from the superintendent and board of education but
neutral perceived support from the facilities department. She also found perceived support
by foodservice management from administration in staff release time and site-based training
for food safety, approval of job descriptions that required foodservice staff to recertify every
three years, and board-level policies supporting a safe food environment. In this current
study, SBOs recognized that training and documentation were an important component of the
school food safety plan, yet were neutral on the importance of training for the entire
foodservice staff (M = 2.76), as only 14.8% of responding SBOs reported funding from the
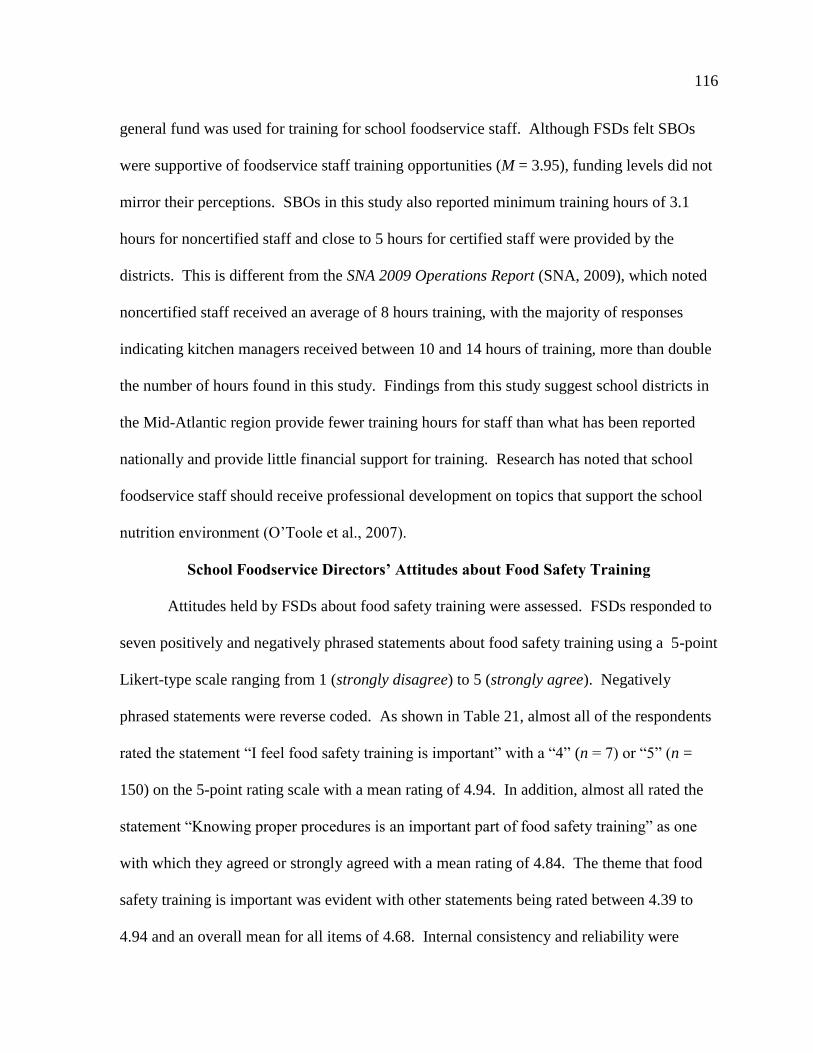
116
general fund was used for training for school foodservice staff. Although FSDs felt SBOs
were supportive of foodservice staff training opportunities (M = 3.95), funding levels did not
mirror their perceptions. SBOs in this study also reported minimum training hours of 3.1
hours for noncertified staff and close to 5 hours for certified staff were provided by the
districts. This is different from the SNA 2009 Operations Report (SNA, 2009), which noted
noncertified staff received an average of 8 hours training, with the majority of responses
indicating kitchen managers received between 10 and 14 hours of training, more than double
the number of hours found in this study. Findings from this study suggest school districts in
the Mid-Atlantic region provide fewer training hours for staff than what has been reported
nationally and provide little financial support for training. Research has noted that school
foodservice staff should receive professional development on topics that support the school
nutrition environment (O’Toole et al., 2007).
School Foodservice Directors’ Attitudes about Food Safety Training
Attitudes held by FSDs about food safety training were assessed. FSDs responded to
seven positively and negatively phrased statements about food safety training using a 5-point
Likert-type scale ranging from 1 (strongly disagree) to 5 (strongly agree). Negatively
phrased statements were reverse coded. As shown in Table 21, almost all of the respondents
rated the statement “I feel food safety training is important” with a “4” (n = 7) or “5” (n =
150) on the 5-point rating scale with a mean rating of 4.94. In addition, almost all rated the
statement “Knowing proper procedures is an important part of food safety training” as one
with which they agreed or strongly agreed with a mean rating of 4.84. The theme that food
safety training is important was evident with other statements being rated between 4.39 to
4.94 and an overall mean for all items of 4.68. Internal consistency and reliability were

117
assessed for the FSDs’ attitudes toward food safety training items. The Cronbach’s alpha
coefficient for attitude was .908, indicating an extremely high level of internal consistency
and reliability. FSDs indicated in their opinions that food safety training helped staff develop
professionally (M = 4.78), which, given the new requirements of the Healthy, Hunger-Free
Kids Act of 2010 (USDA, 2011b), is important. Only two FSDs rated all items with all fives.
Given that three of the statements were negatively stated, it could be speculated that perhaps
the statements were not read carefully, respondents did not consider their assessment, or were
Table 21
Foodservice Directors’ Attitudes Toward Food Safety Training (N = 166)
Ratingsa
5 4 3 2 1
n % n % n % n % n % M SD
I feel food safety training is
important (n = 158) 150 94.94 7 4.43 1 0.63 0 0.00 0 0.00 4.94 0.26
Knowing proper procedures is an
important part of food safety
training (n = 160)
137 85.63 20 12.50 3 1.88 0 0.00 0 0.00 4.84 0.33
Food safety training helps my
staff develop professionally (n =
158)
128 81.01 26 16.46 3 1.90 1 0.63 0 0.00 4.78 0.50
The safety of food served to
children in my district can be
ensured by trained staff (n = 159)
122 76.73 31 19.50 5 3.14 1 0.63 0 0.00 4.72 0.55
I do not feel the responsibility to
provide food safety training to my
staffb (n = 159)
126 79.25 18 11.32 3 1.89 5 3.14 7 4.40 4.58 1.00
Food safety training is not needed
for my staff b (n = 157)
120 76.43 21 13.38 5 3.18 4 2.55 7 4.46 4.55 1.00
Providing opportunities to staff to
practice a new skill is not
necessaryb (n = 160)
111 69.38 26 16.25 8 5.00 5 3.13 10 6.25 4.39 1.13
aRating scale used: 5 = strongly agree, 4 = agree, 3 = neither agree nor disagree, 2 = disagree, and 1 = strongly
disagree. bNegatively phrased items were reverse coded.

118
not vested in the project. Findings overall suggest responding FSDs had very positive
attitudes toward food safety practices.
Giampaoli, Sneed, et al. (2002) previously had found positive responses and
perceived advantages by FSDs to certification and food safety education. These researchers
found FSDs perceived food safety certification as one means to ensure food was served
safely in the schools and that staff with certification practiced safe food behaviors more
frequently. Henroid and Sneed (2004) and Sneed et al. (2004) found managers with
certification had higher knowledge scores and more favorable attitudes toward food safety
than did those without food safety certification. FSDs in this study rated continued education
in food safety as important and had a positive attitude toward learning about food safety and
training for staff as a means to improve safe food handling practices. This finding is
consistent with results from Youn and Sneed’s (2002) study, which found respondents
strongly agreed that foodservice staff needed more training to improve food safety practices.
Sullivan, Harper, and West (2002) studied training needs of site managers in school
foodservice and found there was a need for practical skills training such as the “how to” of
properly cooling, heating, thawing, and preparing foods. This current study yielded similar
findings in that time and temperature abuse of foods, such as inappropriate cold food holding,
lack of proper hygiene practices, and improperly working equipment, were identified as
needs. Continuous food safety education is necessary for both managers and staff. Research
has shown high knowledge scores about safe food practices were not necessarily consistent
with observed staff food-handling behaviors (Henroid & Sneed, 2004; Sneed et al., 2004).
Thus, continual training is needed to improve food safety practices and to ensure
documentation of the food safety process as part of HACCP plans become a priority in

119
foodservice (Giampaoli, Sneed, et al., 2002; Sneed et al., 2004; Stinson et al., 2011;
Strohbehn et al., 2008).
The Healthy, Hunger-Free Kids Act of 2010 established training requirements for
those involved with child nutrition programs. These requirements included annual training in
administrative procedures for a representative from each local educational agency and annual
training and certification for all local foodservice staff in program compliance, nutrition, and
food safety practices.
In conversations with FSDs and school nutrition professionals, the FNS found
perceived needs for greater support from school and district personnel, including teachers,
principals, and superintendents, to implement and enforce LWPs (USDA-FNS, U.S.
Department of Education, & CDC, 2011). The FNS also found in conversations with school
administration and school boards of directors that there is a need for standardized tools for
implementation, monitoring, and reporting about LWPs, evaluation guidance, and suggested
model polices. Although the focus of this data pertains to LWPs, the foundation and premise
is easily transferred to support for school food safety plans. These plans need support from
the school administration for resources and funding, training opportunities, and assistance in
district-wide implementation.
Training Opportunities
The FSDs indicated when training was typically provided and whether listed topics
were included by responding with a “yes” or “no.” As shown in Table 22, the majority
(83.7%, n = 139) of FSDs indicated that training had been conducted. Training occurred
predominately during the school year (n = 129, 77.71%); however, 68 FSDs indicated

120
summer sessions were also provided. These may be offered through the state agency. The
directors who indicated training occurred away from the district (n = 49) may have been
referencing state agency sponsored sessions in their responses. Some districts did hold food
safety trainings during school in-service days (n = 51), although it is not clear whether these
were full-day sessions or sessions of a few hours.
Sullivan et al. (2002) found highly preferred methods of training delivery were
theme-based seminars, state agency sponsored conference/workshops, and sessions
sponsored by the foodservice industry. Story (2008) found two-thirds of the FSDs in her
study conducted food safety training courses and that state agencies, such as health
departments or departments of education also provided trainings. Training workshops
provided by state agencies or vendors or conducted by the FSD were likely to be lower in
cost due to outside funding or sponsorship, thus minimizing budgetary concerns. The
potential need to pay staff for time at and away from school can impact foodservice
departments’ operating budgets.
Table 22
Foodservice Directors’ Responses Regarding Scheduled Food Safety Training (N = 166)
Yes No Do not know No response
Food safety training venues n % n % n % n %
During the school year 129 77.71 23 13.86 2 1.20 12 7.23
Only during school in-service day 51 30.72 72 43.37 2 1.20 41 24.70
Away from district 49 29.52 76 45.78 2 1.20 39 23.49
During the summer 68 40.96 60 36.75 2 1.20 36 21.69
Food safety training was not provided 4 2.41 87 52.41 4 2.41 71 42.77

121
Training Topics
As shown in Table 23, six training topics were identified by over 90% of respondents
as part of food safety training for school foodservice personnel: use of food thermometers,
bare hand contact of ready-to-eat food, hand washing, and personal health and hygiene (n =
156, 93.97%), hot and cold food holding (n = 154, 92.8%), and cooling techniques (n = 151,
91.0%). Other frequently offered training topics (identified as included in training sessions
by more than 80% of respondents) were: thermometer calibration and reheating of leftovers
(n = 149, 89.8%), storage procedures (n = 148, 89.2%), sanitizing solutions (n = 147, 88.7%),
recordkeeping and chemical storage (n = 144, 86.57%), corrective actions (n = 139, 83.7%),
and critical control points and monitoring (n = 138, 83.1%).
Story (2008) found food safety training for both foodservice staff and site level
managers had increased between 2005 and 2007, with more food safety training provided to
staff than in years prior to 2004, the year in which HACCP-based food safety plans were
included in child nutrition program reauthorization. Topics identified by 90% or more of
respondents in Story’s study as being included in food safety trainings were: safe cooling,
holding temperature, food safety principles, hygiene, and time and temperature abuse. Other
topics reported by some of participants in both Story’s and this current study were allergies
and chemical use and storage. Interestingly, two topics frequently covered in the popular
press yet not identified as frequently included in foodservice staff training were allergens (n
= 110, 66.27%) and food recalls (n = 107, 64.46%). Increased prevalence of allergens in
school-age children has been recognized by USDA and the scientific community as a
concern. Responses from the SBO survey on the topic of allergy awareness were similar to
those from the FSD survey. Managers must train staff on food handling, cleaning, and

122
Table 23
Foodservice Directors’ Identification of Topics Included in Foodservice Staff Food Safety
Training (N = 166)
Yes No Do not know No response
Food safety training components n % n % n % n %
Bare hand contact of ready-to-eat foods 156 94.00 2 1.20 1 0.60 7 4.22
Handwashing 156 94.00 2 1.20 2 1.20 6 3.61
Personal health and hygiene 156 94.00 4 2.41 1 0.60 5 3.01
Use of food thermometers 156 93.68 2 1.20 1 0.60 7 4.22
Hot and cold food holding 154 92.77 2 1.20 1 0.60 9 5.42
Cooling techniques 151 90.96 6 3.61 2 1.20 7 4.22
Reheating of leftovers 149 89.76 4 2.41 2 1.20 11 6.63
Thermometer calibration 149 89.76 9 5.42 1 0.60 7 4.22
Storage procedures 148 89.17 9 4.52 1 0.60 8 4.82
Sanitizing solutions 147 88.55 7 4.22 3 1.81 9 5.42
Chemical storage 144 86.75 8 4.82 3 1.81 11 6.62
Recordkeeping 144 86.75 12 7.23 3 1.81 7 4.22
Corrective actions 139 83.73 11 9.77 4 2.41 12 7.23
Monitoring procedures 138 83.13 14 8.43 4 2.41 10 6.02
Critical control points 138 83.13 13 7.83 4 2.41 11 6.62
Critical limits 132 79.52 15 9.04 6 3.61 13 7.83
Self-inspection 127 76.51 19 11.45 6 3.61 14 8.43
Recipe processes 125 75.30 27 16.27 3 1.81 11 6.63
Standardizing recipes 125 75.30 25 15.06 6 3.61 10 6.02
Allergens 110 66.27 36 12.69 3 1.81 17 10.24
Food recall procedures 107 64.46 40 24.10 6 3.61 13 7.83

123
sanitizing practices to avoid cross-contamination of potential food allergens; how to read
food ingredient labels (Massachusetts Department of Education, 2002); and the ability to
recognize symptoms of anaphylaxis (Sampson et al., 2005). In addition, the increased
prevalence of allergens presents operational issues to child nutrition programs as reported in
SNA 2010 Back to School Trends Report (SNA, 2010). Survey data for the current study was
collected in 2008, prior to the release of Food Code 2009 (FDA, 2009), which stipulated all
workers in a foodservice setting should have an understanding of common food allergens.
Thus, allergens may currently be included by more districts in trainings provided to
foodservice personnel than what was found at the time of data collection. Also since the time
of data collection, USDA (2009b) released a guidance document for districts to meet the
needs of children with special dietary needs, including allergens. Currently, four of the six
states in the Mid-Atlantic region have food allergy management guidelines. Nationally, there
are about 15 states with the same guidance (Food Allergy Initiative, 2011). 2010-2011
Pennsylvania School Laws and Rules of (Levin, 2010), the most current update to the Public
School Code of 1949, mandates the Department of Education to develop guidance for
managing life-threatening food allergies in schools as a component of the LWP
(Pennsylvania Public School Code of 1949, 2011). The less frequent inclusion of food
recalls as a training topic could be due to directors’ feelings this was a management or central
office response and staff did not need to know if a recall had occurred.
Personal Food Safety Practices of School Foodservice Directors
The FSDs disclosed their personal food safety practices used at home for food
purchasing, storage, preparation, and cooking. Respondents answered one open-ended
question and two yes/no questions and rated three categories of items using a 5-point Likert-

124
type scale ranging from 1 (strongly disagree) to 5 (strongly agree). Tables 24 through 29
show FSDs’ responses to questions about food safety practices used in their homes.
Bleach Storage
Respondents (n = 94, 60.3%) identified their primary storage location for chlorine
bleach by responding to an open-ended question. As shown in Table 24, frequent responses
indication storage was in the laundry room area or a combination of laundry, kitchen, and
bath (n = 16, 10.3%). Six respondents indicated they stored chlorine bleach in the kitchen
area. A chlorine bleach solution can be a reliable disinfecting and sanitizing agent beyond
the laundry and can kill common food pathogens such as Campylobacter spp., Salmonella
spp., and E. coli 0157:H7 that may be present on sinks, preparation areas, and counters.
Chlorine-based sanitizing solutions are one of three chemical types approved by the food
code for use in commercial kitchens. It is likely FSDs supervise the use of this or some type
of sanitizing agent at work; however, the findings suggest there is limited application of this
practice in home kitchens.
Table 24
Foodservice Directors’ Personal Food Safety Practices Related to Bleach Storage at Home
(N = 156)
Storage of bleach at home n %
Laundry room 94 60.26
Basement 22 14.10
Combined response: Laundry/kitchen/bath 16 10.26
Do not use 8 5.13
Sink 8 5.13
Kitchen sink 6 3.85
Storeroom/garage 2 1.28
Note. Multiple responses were possible.

125
Thermometer Use
The FSDs were also asked about the type of thermometers used at home. As shown
in Table 25, more than 55% of the 166 respondents reported use of thermometers at home to
check hot and cold food temperatures as well as in refrigerator and freezer storage. The
bimetallic stemmed thermometer was the type indicated as used most often (n = 112, 67.5%)
followed by refrigerator/freezer thermometers (n = 109, 65.7%). One component of the
consumer targeted Fight BAC!® campaign is cooking foods to proper temperatures in order
to kill harmful bacteria that cause illness (Partnership for Food Safety Education [PFSE],
1997). Use of a food thermometer is one method of accurately measuring internal
temperatures to be sure products are thoroughly cooked, as color is not an accurate indicator
of doneness for ground meats. A refrigerator thermometer ensures temperature is
consistently 40°F or below, the recommended range for foods that are temperature controlled
for safety.
Table 25
Foodservice Directors’ Personal Food Safety Practices of Thermometer Type and Use at
Home (N = 166)
Yes No No response
Thermometer types n % n % n %
Bimetallic-stemmed 112 67.47 30 18.07 24 14.46
Refrigerator/Freezer 109 65.66 31 18.67 26 15.66
Oven 103 62.05 35 21.08 28 16.87
Digital 80 48.19 52 31.33 34 20.48
Note. Multiple responses were possible.

126
Cutting Board Use
The FSDs were asked about type and use of cutting boards at home. As shown in
Table 26, almost all of the respondents (n = 158, 95.2%) reported having cutting boards
available for use at home. Polyethylene/synthetic was the most frequently identified material
used (n = 145, 87.3%). It was interesting that FSDs reported use of wooden cutting boards at
home (n = 55, 33.1%) as this material is not allowed in retail foodservices. Flexible mat
(rubber type material) cutting boards also were identified frequently as a type used at home
(n = 42, 25.3%).
Prior research has shown the material composition of the cutting board is important;
however, cutting boards of any material can develop cuts and grooves from knives over time,
providing a place for food debris and bacteria to grow and reproduce. Knife-scarred cutting
boards are more difficult to clean and sanitize. Previous research by the International Food
Information Council Foundation (2010) found proper use and cleaning procedures were
followed by few consumers, resulting in contamination potential between raw and ready-to-
eat foods prepared at home. Story (2008) noted in a national survey of school districts that
Table 26
Foodservice Directors’ Identified Type of Cutting Boards Used at Home (N = 166)
Yes No No response
Cutting board types n % n % n %
Polyethylene/synthetic 145 87.35 11 6.62 10 6.02
Wooden 55 33.13 67 40.36 44 26.51
Flexible 42 25.30 73 4.98 51 30.72
Disposable 16 9.4 93 56.02 57 34.34
Note. Multiple responses were possible.

127
color-coded cutting boards were used infrequently. Color-coded cutting boards provide
visual cues to staff to reinforce concepts related to separation of raw and ready to eat foods.
Findings from the current study suggest even professionals in foodservice management do
not report application of best practice at home.
Foodservice Directors Reported Food Safety Practices at Home
The FSDs rated level of agreement to food safety practices using a 5-point Likert-
type scale ranging from 1 (strongly disagree) to 5 (strongly agree). There were three scales
included in this section on food safety practices at home: shopping (GS), home storage (HS),
and home food prep (HP). Prior to the analysis of each scale, the items in each scale were
submitted to reliability analysis using Cronbach’s alpha. This was done to ensure coding of
each item was scaled in the appropriate direction, because some of the items included the use
of the word not or were negatively phrased. Of the nine items in the GS scale five negatively
phrased items were recoded. The Cronbach’s alpha reliability coefficient for the GS scale
with the recoded items was .160. There were six items in the HS scale with one negatively
phrased item recoded. The Cronbach’s alpha reliability coefficient for the HS scale with the
recoded items was .506. There were 12 items in the HP scale and 6 items were recoded. The
Cronbach’s alpha reliability coefficient for the recoded items for the HP scale was .595.
Means were calculated for each item and an overall mean for each separate category of items,
GS, HS, and HP, was calculated.
Grocery shopping. The number, percentage, and means of responses for GS items,
the FSDs reported levels of agreement with recommended food safety practices while
shopping for personal grocery items, are shown in Table 27. The FSDs reported positive
shopping practices with the highest mean ratings of agreement with the statements about

128
keeping raw meats and poultry separate from fresh fruits and vegetables in the cart (M =
4.53), avoidance of comingling cleaning agents and food items in shopping carts (M = 4.16),
shopping for frozen foods at the end of shopping trip (M = 4.34), and purchasing products by
date (M = 4.45). The FSDs did not always report out-of-date items to the customer service
center in the store (M = 2.85) and left out-of-code products on the shelves (M = 4.04). The
Table 27
Foodservice Directors’ Reported Level of Agreement with Grocery Shopping Scale Items
(N = 166)
Ratingsa
SA A A/D D SD
Grocery Shopping scale item n % n % n % n % n % M SD
The grocery store is my first stop
when running errandsb
11 7.00 8 5.09 42 26.75 28 17.83 68 43.31 3.85 1.23
I check expiration dates of foods in
the store, but leave out-of-date
items on the shelf
79 50.31 38 24.20 19 12.01 9 5.73 12 7.64 4.04 1.24
I purchase out-of-date items for
immediate useb
5 3.18 2 1.27 12 7.64 36 22.93 102 64.97 4.45 .92
I do not place refrigerated items such
as meat, poultry, and dairy foods in
the cart first
73 46.20 35 22.15 27 7.09 9 5.57 14 8.86 3.91 1.28
I keep packages of raw meat and
poultry separate from bags of fresh
fruits and vegetables
112 70.44 29 18.24 10 6.29 6 3.77 2 1.26 4.53 0.87
I shop for frozen foods at beginning
of my shopping tripb
5 3.16 6 3.79 16 10.13 34 21.52 97 61.39 4.34 1.02
I do not keep packages of cleaning
agents separate from food productsb 92 58.59 27 17.19 21 13.37 6 3.82 11 7.00 4.16 1.21
During warm weather, I do not bring
a cooler filled with ice to keep
purchases frozen/refrigerated foods
at a proper temperature because my
drive is greater than 15 minutesb
55 35.71 16 10.38 39 25.32 22 14.28 22 14.28 3.38 1.45
I report out-of-date items to
customer service center of the store 36 23.53 25 16.33 44 28.75 22 14.37 26 16.99 2.85 1.38
aRating scale: SA = strongly agree, A = agree, A/D = neither agree nor disagree, D = disagree SD = strongly
disagree. bNegatively phrased items reverse coded.

129
FSDs varied in their levels of agreement to timing of their shopping trips with over half
disagreeing it was their first stop in running errands (M = 3.85). Findings may be distorted
due to particular situations of the FSDs. In some cases, a trip to the grocery store is a
relatively short distance from the home, thus there is not a need for a cooler in warmer
weather, or there may not have been consistent understandings of the statement. The overall
mean for the GS items for all the respondents was 3.95.
Home Storage. FSD’s rated level of agreement to six positively and negatively
phrased items in the HS scale about storage of food and nonfood items at home, using the
same 5-point Likert-type scale ranging from 1 (strongly disagree) to 5 (strongly agree). The
overall mean for these questions was 4.15. As shown in Table 28, the FSDs reported positive
home storage practices including keeping chemical agents in original containers (M = 4.77)
and thermometers in the refrigerator to monitor cold storage (M = 3.70). However, there was
less vigilance noted on whether the refrigerated storage temperature was checked daily (M =
2.81). Although just over one fourth of respondents either strongly agreed (n = 29, 18.2%) or
agreed (n = 18, 11.6%) to statements about checking refrigerator temperature daily, this is a
larger percentage than the findings in a national study conducted by the Fight BAC!®
organization, the Partnership of Food Safety Education in 1997. In the earlier study, only
20% of consumers actually used thermometers in the refrigerator. The FSDs self-reported
that they covered leftovers (M = 4.55), kept raw meats and poultry separate from fresh fruits
and vegetables (M = 4.66), and canned foods and nonperishables are not the first foods
unpacked (M = 4.43). Fight BAC!® suggests refrigerating or freezing perishables such as
meat, poultry, and eggs as soon as one returns home from the store. Increased frequencies of
the number and percentage of responses indicating high levels of agreement with these

130
Table 28
Foodservice Directors’ Personal Food Safety Storage Practices of Food Items at Home
(N = 166)
Ratingsa
SA A A/D D SD
Home Storage scale item n % n % n % n % n % M SD
I have a thermometer inside the
refrigerator 81 50.94 25 15.72 3 1.86 25 15.72 25 15.72 3.70 1.58
I store leftovers uncovered in the
refrigerator 6 3.75 0 0.0 6 3.75 35 21.87 113 70.63 4.55 0.88
I check the refrigerator
thermometer daily 29 18.24 18 11.32 38 23.89 41 25.79 33 20.75 2.81 1.38
I store raw meat/poultry together in
refrigerator drawers with fresh fruits
and vegetables
6 3.75 1 0.62 1 0.62 24 15.00 128 80.00 4.66 0.85
I keep chemicals in the original
containers 132 82.50 22 13.75 2 1.87 1 0.62 3 1.87 4.77 0.62
When I return home from shopping,
non-refrigerated foods, such as
canned goods are put away firstb
8 5.00 1 0.62 9 5.62 37 23.12 105 65.62 4.43 1.00
aRating scale: SA = strongly agree, A = agree, A/D = neither agree nor disagree D = disagree SA = strongly
disagree. bNegatively phrased item reverse coded.
statements were expected given the educational level and food safety training reported by
FSDs. The lower than expected levels of agreement to recommended food safety practices
may be due to a less active monitoring role at home or presumed decline in risk given less
amount of foods and ages served. Findings from this survey on home storage can be found in
Table 28.
Home Preparation. The FSDs rated 12 positively and negatively phrased statements
about food preparation and cooking at home on the HP scale using the same 5-point Likert-
type scale ranging from 1 (strongly disagree) to 5 (strongly agree). Six of the items were
reverse-coded. Directors indicated they used recommended preparation and good cooking
practices at home with an overall mean of 4.30 calculated for the 12 items. As shown in

131
Table 29, the FSDs reported hands were washed before starting food preparation (M = 4.81).
Cutting boards were reported as being washed in hot soapy water and rinsed between uses (M
= 4.58) and placed into the dishwasher for cleaning (M = 4.07) rather than just brushing
crumbs away (M = 4.76). FSDs also used different cutting boards at home for raw meats and
fresh produce (M = 4.06). Other recommended practices identified as used at home were the
use of a different plate for holding cooked meat than the one used for raw meats when
grilling (M = 4.76), not thawing foods on counters (M = 4.62) or cooling cooked foods on
counters (M = 4.07). Food was not thawed partially in the microwave and then placed in the
refrigerator (M = 4.00); partial cooking or thawing in the microwave does run the risk of
temperature abuse of foods. Both Fight BAC!® (PFSE, 1997) and the food code (FDA,
2005) recommend microwave ovens be used to thaw foods only if these foods are to be
cooked immediately. Clearly, food safety training messages about cross-contamination and
improper cooling risks in schools have been heard with FSDs reporting these safe practices at
home. In addition, both references caution against food resting on the counters at room
temperature for more than 2 hours. Findings from this study indicate both of these flawed
practices appear to be occurring in FSDs’ homes. The FSDs were less in agreement about
practices of checking end-point cooking temperatures with thermometers on foods prepared
in the microwave (M = 3.15) or in checking temperatures of meat, poultry, and fish (M =
4.23). Although appearances may indicate a product is completely cooked, microwave ovens
do not heat evenly, thus appearances may be deceiving. These findings suggest further re-
education on the use of thermometers is needed.

132
Table 29
Foodservice Directors’ Preparation and Cooking Practices for Food at Home (N = 166)
Ratingsa
SA A A/D D SD
Home Preparation scale item n % n % n % n % n % M SD
I wash my hands before starting
food preparation 135 84.91 20 12.57 2 1.26 2 1.26 0 0 4.81 .50
I thaw foods partly in the micro-
wave and then thaw the rest of the
way in the refrigeratorb
14 8.88 9 5.66 22 13.84 32 20.12 82 51.57 4.00 1.29
I use a different cutting board for
raw meats and fresh produce 89 55.26 28 17.50 17 10.63 15 9.37 11 6.87 4.06 1.29
I just brush off the cutting board
before putting awayb
3 1.85 1 0.62 1 0.62 21 13.12 134 83.87 4.76 0.67
I wash the cutting board in hot
soapy water and rinse between uses 119 75.31 28 17.72 2 1.26 2 1.26 7 4.43 4.58 0.93
I only rinse knives between usesb 4 2.56 8 5.13 7 4.48 28 17.95 109 69.87 4.47 0.98
I wash cutting boards in the
dishwasher 93 59.61 22 14.10 16 10.25 9 5.76 16 10.25 4.07 1.36
I thaw foods on the counter 2 1.27 1 0.63 8 5.09 32 20.38 114 72.61 4.62 0.72
I use the firmness test on meats to
determine doneness of meats,
poultry, and fish in place of a
thermometerb
5 3.12 13 8.12 21 13.13 22 13.75 99 61.87 4.23 1.14
I use the same plate to take meat to
the grill and return the cooked meatb
2 1.26 0 0.0 3 1.89 23 14.57 130 82.27 4.76 0.60
I usually let leftover foods rest on
the counter until cooled to room
temperature before placing in
refrigeratorb
11 6.92 18 11.32 8 5.00 33 20.75 89 55.97 4.07 1.30
I use a thermometer to check final
temperatures of foods cooked in
the microwave
30 19.10 25 15.92 36 22.93 23 14.65 43 27.38 3.15 1.48
aRating scale: SA = strongly agree, A = agree, A/D = neither agree nor disagree D = disagree SA = strongly
disagree. bNegatively phrased items reverse coded.

133
State Agency
There are six state agency-level directors in the Mid-Atlantic region. Each received
an invitation with a packet of information to participate in this study through the U.S. Postal
Service in November, 2008. The packet consisted of a cover letter invitation to participate in
an electronic or phone survey, sample questions about his or her state’s child nutrition
program food safety regulatory requirements, and phone survey guidelines. Follow-up
reminders were sent via electronic communication and fax. A total of 5 state agency level
directors responded, for a response rate of 83%. Of the 5 state agency level directors
responding to the survey, 4 (80%) of the directors were housed in their state’s Department of
Education and one (20%) in the Department of Agriculture. Of these 5 state agency
directors, 3 (60%) responded to the electronic survey and 2 (40%) responded by completing
the questions and returning by fax. The fax respondents requested a phone survey and were
contacted by the researcher. The phone call interview ranged between 10 and 12 minutes.
The same open-ended questions presented on the electronic survey were asked in a similar
sequence. Collectively, these state directors oversee programs in 8,128 public schools.
State agencies were asked to identify the current food code used in their states;
different versions of the FDA Food Codes from 1999 to 2005 were reported as being used.
HACCP food safety plans were not mandated in four of the five states prior to the Child
Nutrition and WIC Reauthorization Act of 2004. However, HACCP-based principles were
introduced with Food Code 1993, thus all states foodservices should have had familiarity
with food safety plans. One state agency director reported all components related to a
HACCP- based food safety plan had been required since 1980, but the term “HACCP” was
not referenced until 2008. State agency directors were asked if additional regulations or

134
processes were required. Four of the 5 directors responded none beyond USDA guidance
and 1 state reported detailed foodservice facility regulations were in place. However, it is not
clear whether these detailed facility regulations indeed were more rigorous than the state’s
adopted food code or the Reauthorization Act requirements of 2004.
State agency directors were asked whether districts were required to submit food
safety plans for agency review. Of the 5 agencies, 4 did not require submission to the state
agency. Of the 4 that did not require submission, 1 agency indicated the plan was submitted
locally to the health department for review and approval. The only state requiring
submission indicated that an abbreviated copy of the district’s food safety plan based on
HACCP principles was kept in the state’s permanent file for the district. Interestingly, school
FSDs in a survey by Story (2008) indicated a copy of the district’s food safety plan based on
HACCP principles had been evaluated by their state agency, and that of these submitted
plans, they received a 97.0% approved by the state agency. At the time of this study,
evaluation criteria templates from USDA to state agencies did not exist. Based on the
districts that required submission or review of the food safety plan, some states in the Mid-
Atlantic region were proactive in requiring oversight by state agencies of districts’ HACCP
plans.
State agency directors were also asked about the timing of the food safety plan
reviews. Four state agencies indicated plans were reviewed during a CRE/SMI audit, during
a commodity review, or as part of a technical assistance review. Of the 4 state agencies that
outlined the process, 1 state agency indicated field staff checked to see if there was a food
safety plan and whether foodservice staff were trained; a second state agency director
indicated that field staff checked for SOPs and documented temperatures; a third state agency

135
director reported that the food safety plan in the state agency file was compared with
observations of school district staff; and the fourth state agency director indicated the plan
was examined, training recommended, and implementation needs identified. The fifth state
agency director reported local health department inspectors reviewed plans annually as part
of the comprehensive food safety inspection process and that the components reviewed
included presence of SOPs, critical control points, monitoring, and corrective action plans;
documentation of training; inclusion of steps to include menu processes in the plan; and
procedures to revise the plan.
State agency directors were asked if they believed all districts were in compliance
with the presence of a food safety plan at each site where food was prepared or served as
required by the Child Nutrition and WIC Reauthorization Act of 2004. Only 3 state agency
directors responded positively, indicating all districts were in compliance. Of the 4 states
that conducted training about HACCP implementation, 3 state agency directors believed
districts in their states had plans in place due to a provision of training and technical
assistance, including creation of a model template with standards to help districts develop
their own plans. Thornton (2007) reported that 93.8% of respondents in a regional study of
FSDs indicated districts had developed and implemented food safety plan.
State agency directors in this study were asked what agency or department in their
states had oversight responsibility for the sanitation inspections in school districts. The
state’s Department of Agriculture (n = 1), local/county health departments under the
Department of Agriculture (n = 2), and departments within the state overseeing health and
human services or mental hygiene (n = 2) were identified. Sanitation inspections were
reported as conducted by the Department of Agriculture (n = 1); local county, municipal or

136
city health departments (n = 3); and the state department/division of public health (n = 1).
Story (2008) also found in her national study of school FSDs that the department most
frequently reported as conducting sanitation inspections was the local health department
(74.2%).
State agency directors reported that the frequency of health inspections ranged
between one to two inspections (n = 1), nearly two inspections (n = 1), two inspections (n =
2), or up to three inspections annually (n = 1). In memo SP-24 from Stanley Garnett,
Director of the Child Nutrition Division of the USDA (USDA-FNS, 2005b), state agency
directors were required to collect and report to the FNS the number of schools that had zero,
one, two, and more than two health inspections during the school year. USDA data based on
state agency reporting indicated that during the 2005–2006 school year, only 58% of schools
met or exceeded the recommended semiannual inspection, with an increase by 9% the
following year to overall compliance of 67%. For the 2007-2008 school year, a 3% increase
was reported, with 70% of districts in compliance with the Reauthorization Act requirement
of two health inspections annually (USDA, 2009a.).
Only 4 state agency directors recounted how they received copies of inspections: via
paper submission (n = 1), electronic submission (n = 1), or self-reports (n = 2). All 5 state
directors were asked about the posting of inspection results electronically. Each state
responded that some results were posted electronically by one agency, 2 states noted they
were either not sure or that inspection results were not posted electronically, and the
remaining state agency reported inspection result postings varied throughout the state. State
directors were asked whether a standard sanitation inspection form was used statewide; only

137
4 state directors responded, with half reporting a standardized form was used and the others
not certain.
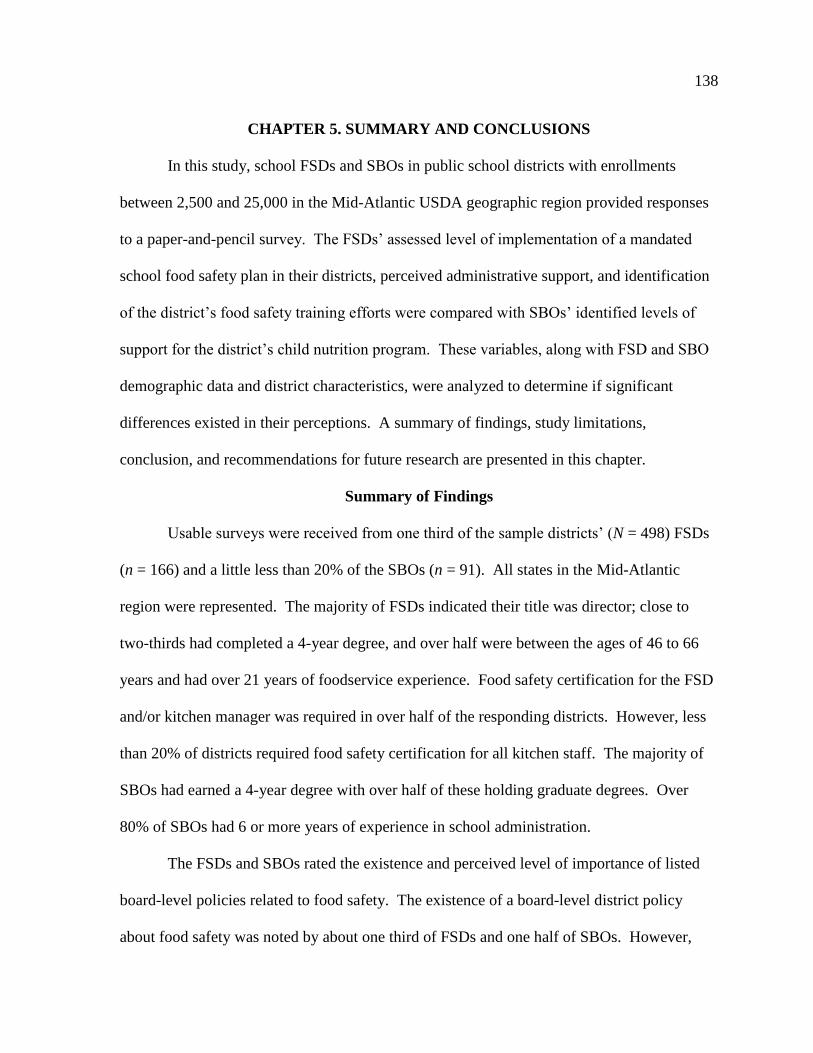
138
CHAPTER 5. SUMMARY AND CONCLUSIONS
In this study, school FSDs and SBOs in public school districts with enrollments
between 2,500 and 25,000 in the Mid-Atlantic USDA geographic region provided responses
to a paper-and-pencil survey. The FSDs’ assessed level of implementation of a mandated
school food safety plan in their districts, perceived administrative support, and identification
of the district’s food safety training efforts were compared with SBOs’ identified levels of
support for the district’s child nutrition program. These variables, along with FSD and SBO
demographic data and district characteristics, were analyzed to determine if significant
differences existed in their perceptions. A summary of findings, study limitations,
conclusion, and recommendations for future research are presented in this chapter.
Summary of Findings
Usable surveys were received from one third of the sample districts’ (N = 498) FSDs
(n = 166) and a little less than 20% of the SBOs (n = 91). All states in the Mid-Atlantic
region were represented. The majority of FSDs indicated their title was director; close to
two-thirds had completed a 4-year degree, and over half were between the ages of 46 to 66
years and had over 21 years of foodservice experience. Food safety certification for the FSD
and/or kitchen manager was required in over half of the responding districts. However, less
than 20% of districts required food safety certification for all kitchen staff. The majority of
SBOs had earned a 4-year degree with over half of these holding graduate degrees. Over
80% of SBOs had 6 or more years of experience in school administration.
The FSDs and SBOs rated the existence and perceived level of importance of listed
board-level policies related to food safety. The existence of a board-level district policy
about food safety was noted by about one third of FSDs and one half of SBOs. However,

139
both groups rated highly the importance of such a policy with means over 4.0 on a 5.0 scale
(FSDs, M = 4.37; SBOs, M = 4.176). Over half of both groups identified the existence of
board-level policies in their districts regarding use of school meal production and service
areas for non-child nutrition program use. The FSDs placed more importance on the need for
policies to address foods from home than did SBOs, perhaps due to their greater awareness of
how foods can become contaminated and recognition of the need to protect school children
or members of the community from possible food-related illnesses. The perceived
importance of volunteers receiving food safety training was higher for FSDs than for SBOs
(FSDs, M = 3.75; SBOs, M = 3.46). In many districts, volunteers hold food-related
fundraisers or operate concessions at sports, music, and other school events as a means to
generate funds. Risks of foodborne occurrences may increase when nonfoodservice,
noncertified food handlers are unaware of safe practices during preparation, service, and
storage of food.
Additional formal SOPs need to be added to the district food safety plans to provide
clear processes and communications for food safety assurances of local-source foods, school
gardens, and farm-to-school foods. These reflect the Healthy, Hunger-Free Kids Act of
2010, which looks to now include these local sources in meals served in school.
Given the increased emphasis on the school health environment, it would seem
logical that food safety training would be made available to protect the child and take added
steps to serve safe food. FSDs and SBOs identified whether they thought nine listed items
would positively influence district administrative support and funding for food safety
training. The item identified most frequently by both FSDs and SBOs was state or federal
agency mandate requiring such training. The second most frequently identified item by the
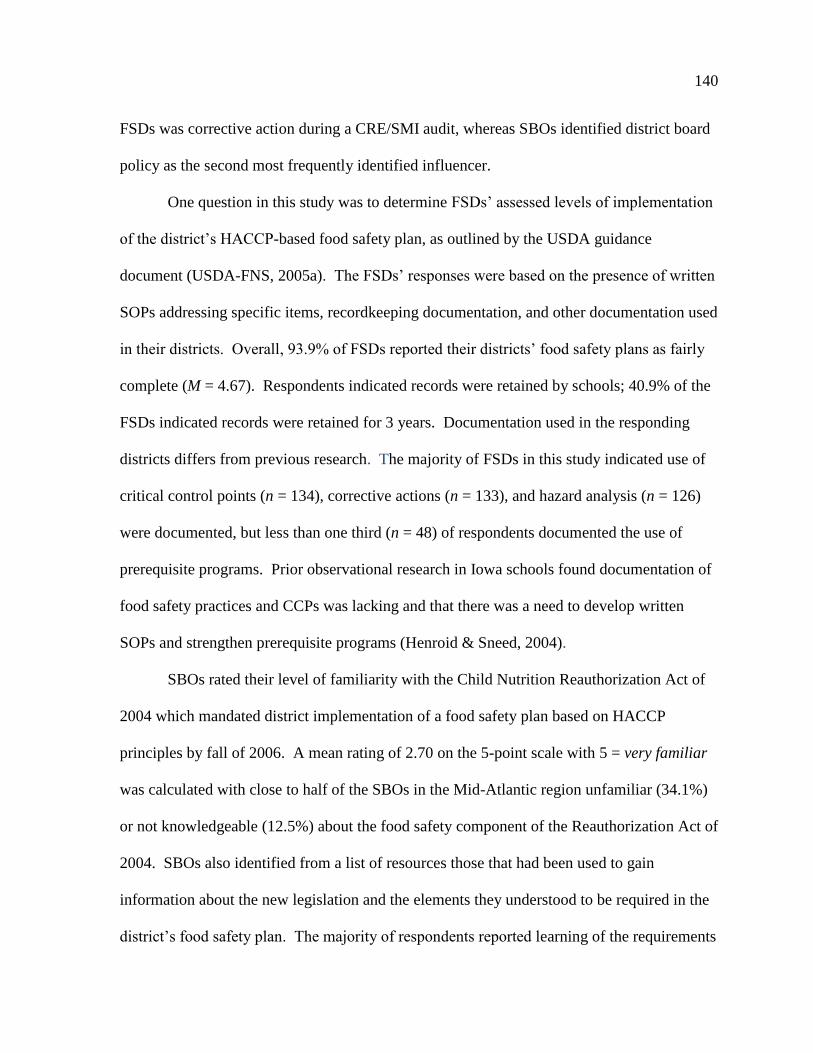
140
FSDs was corrective action during a CRE/SMI audit, whereas SBOs identified district board
policy as the second most frequently identified influencer.
One question in this study was to determine FSDs’ assessed levels of implementation
of the district’s HACCP-based food safety plan, as outlined by the USDA guidance
document (USDA-FNS, 2005a). The FSDs’ responses were based on the presence of written
SOPs addressing specific items, recordkeeping documentation, and other documentation used
in their districts. Overall, 93.9% of FSDs reported their districts’ food safety plans as fairly
complete (M = 4.67). Respondents indicated records were retained by schools; 40.9% of the
FSDs indicated records were retained for 3 years. Documentation used in the responding
districts differs from previous research. The majority of FSDs in this study indicated use of
critical control points (n = 134), corrective actions (n = 133), and hazard analysis (n = 126)
were documented, but less than one third (n = 48) of respondents documented the use of
prerequisite programs. Prior observational research in Iowa schools found documentation of
food safety practices and CCPs was lacking and that there was a need to develop written
SOPs and strengthen prerequisite programs (Henroid & Sneed, 2004).
SBOs rated their level of familiarity with the Child Nutrition Reauthorization Act of
2004 which mandated district implementation of a food safety plan based on HACCP
principles by fall of 2006. A mean rating of 2.70 on the 5-point scale with 5 = very familiar
was calculated with close to half of the SBOs in the Mid-Atlantic region unfamiliar (34.1%)
or not knowledgeable (12.5%) about the food safety component of the Reauthorization Act of
2004. SBOs also identified from a list of resources those that had been used to gain
information about the new legislation and the elements they understood to be required in the
district’s food safety plan. The majority of respondents reported learning of the requirements
141
of the legislation through the school FSD (n = 55); other frequently identified sources were
state agency/agriculture departments (n = 19) or regional or local SBO meetings (n = 13).
Overall, FSDs in the Mid-Atlantic region perceived support from district
administration for child nutrition programs, with mean ratings ranging from 4.23 to 2.91 on a
5-point Likert-type scale, with 5 = very supportive. FSDs reported district administration
was generally supportive of training (M = 3.95) but neutral on the importance of training for
foodservice staff with minimal financial support provided for this effort. No significant
differences were found among FSDs’ ratings and their age, gender, or years of foodservice
experience.
Attitudes and knowledge of FSDs toward food safety practices were assessed,
including items addressing personal practices used at home. The majority of FSDs did own a
bimetallic stemmed thermometer and a refrigerator/freezer thermometer. Although use of the
bimetallic stemmed thermometer for cooking at home was noted (M = 4.23), refrigerator/
freezer thermometers were not checked with regularity (M = 2.81).
The FSDs’ attitudes toward food safety training and personal food safety practices
when grocery shopping (GS scale), how they stored foods at home (HS scale), and cooking
and preparing foods at home (HP scale) were assessed with a mean rating calculated for each
scale. Analyses were conducted to determine whether significant differences existed by age,
years of foodservice experience, or gender. Significant differences were found between
FSDs in the age groups of 25 to 45 years and 46 to 66 years for home storage of foods (HS
scale) as well as between those in the age groups of 25 to 45 years and 46 to 55 years for
attitudes related to training. When total years of service were compared for those FSDs with
1–20 years of foodservice experience and those with 21 years or more of service, findings

142
indicated significance differences for the HS scale. Findings also were compared between
males’ and females’ attitudes toward training, GS, HS, and HP with significant differences
found between ratings by men and women on items on the HP scale.
Using district enrollments and their years in current position, SBOs’ attitudes and
knowledge about child nutrition programs were compared to their familiarity with the food
safety policy mandate. Findings of the analysis indicated there were no statistically
significant differences when SBOs were compared by district enrollment or the number of
years the SBOs had been in their current position. SBOs with the most familiarity with the
food safety plan mandate had been in their current positions 6–10 years (M = 3.07).
The FSDs’ perceptions of support from SBOs toward child nutrition programs were
analyzed based on the variables of age, gender, educational level, years in current position,
total years of service, and SNA credential. Results indicated there were no statistically
significant differences for any of these variables.
The FSDs’ perceptions of support from SBOs toward child nutrition programs based
on district foodservice programs characteristics of student enrollment, type of production
system, number of foodservice staff, and style of program management (self-operated or
contracted foodservice) were compared. A mean perceived organizational support score was
calculated and used as the dependent variable. There were no statistically significant
differences found for the support mean score when compared by enrollment group; urban,
suburban, or rural district designation; or production system. Statistically significant
differences were found between mean perceived levels of support by FSDs of self-operated
foodservice programs and contract management programs, with FSDs in contract managed

143
child nutrition programs identifying higher levels of administrative support for the
foodservice program (M = 4.23, SD = 0.546 versus M = 3.85, SD = 0.744).
Differences in perceptions of FSDs and SBOs about the importance of district food
safety policies were not statistically significant. Pairs of responses with the FSD and SBO
from the same school district were matched and compared; no statistically significant
differences between the paired data were found.
No relationships existed between districts’ level of support in release time, funding
for continuing education and in-service programs, and FSDs’ assessed level of
implementation of the HACCP-based food safety plan in their districts. A statistically
significant but moderate relationship did exist between support in release time and actual
number of days used for continuing education.
Limitations of the Study
Several limitations were identified for this study. With any study relying on self-
reported data, the accuracy of the findings is dependent upon truthfulness in responses. FSDs
were asked to provide data 2 years after the mandated policy went into effect on the level of
completeness of the food-safety plan based on HACCP principles, recordkeeping documents
and practices, and semiannual inspection results. Some directors reported they were new,
others may not have recalled properly, and still others may not have read the question
thoroughly or were not vested in the project. Both FSDs and SBOs skipped over survey
questions or sections on the survey. The survey for the FSD was lengthy and some questions
were not answered, although no concerns were identified in the pilot. There may have been
some confusion in the first section regarding policy existence and policy importance, as some
responses for importance were recorded as numeric and entered in the yes/no existence

144
column, thus the data were unusable. SBOs were asked to provide district staffing data by
classified and nonclassified groups on number of staff, FTEs, total number of training hours
by group, and minimums of district training hours. Much of these data were not provided.
The study sample is limited to one of the seven USDA FNS regions; findings may or may not
be generalizable to other regions.
A few factors impacting the response rate were use of personalized names and
addresses, local district policy on participating in external surveys, and method of survey
distribution and collection. A paper-and-pencil survey was selected for three key reasons: to
provide time for participants to gather data for the survey and to avoid problems of blocked
e-mail servers by district firewalls and inaccurate or unobtainable e-mail addresses. NCES
data were the foundation for listing of schools by state and enrollment; much of the contact
information for FSDs and SBOs was not current. Alternative sources, such state agency
sites, state association membership lists, district websites, and personal calls, were used to
locate street addresses, phone numbers, fax numbers and e-mail addresses of current staff.
The FSD was asked to deliver the prenotification postcard and survey packet to the SBO,
pick up the survey from the SBO, and return both sealed envelopes inside a larger prepaid
mailing envelope. Some surveys were returned by mail or fax by FSDs and SBOs
independently.
If planning such a paired design the following suggestions are made: Both the FSD
and SBO would receive a prenotification post card; the design would allow the FSD to self-
select either a paper-and-pencil survey or on-line survey. This would reduce the incorrect e-
mail addresses for the FSD. The SBO packet would still be mailed to the FSD for delivery;
and all SBO responses would be entered into the on-line survey, thus reducing data entry of
145
both surveys. In addition, 25% of the respondents would be asked to participate in a phase
two follow up. Agreement to this phase would be included with the survey to the FSDs and
would request the board-level policy on food safety and the recordkeeping documents.
Conclusions
Foodservice directors typically are considered middle managers within school district
organizations. They serve as chief administrators of the district’s Child Nutrition Program.
District goals related to the program are accomplished in part through effective
communication between the director and district stakeholders using established structures
and channels. Findings from this study suggest that FSDs need to continue to work toward
keeping communication channels open. Resources are available from the professional
organization, SNA, on how to communicate with various audiences within a district.
This study also indicated a need for greater adoption of district board-level policies to
provide vision and structure on matters relating to safety of all foods prepared and/or served
on school grounds. Policies reflect the mission of the district, health and well-being of the
child, and communicating to district stakeholders the philosophy of the district while
providing authority and guidance; findings from this study showed policies were perceived as
needed and identified as important by both FSDs and SBOs, yet there was limited use of
these. Involvement of both district and school-level teams to create a systemic approach to
protecting the health of the school community is needed, as any food safety issues occurring
within the district could result in the district being held accountable. Creating a policy
related to food safety demonstrates board members’ commitment to promoting and
safeguarding a healthy school environment. The direct and indirect costs incurred as a result

146
of a foodborne illness outbreak in a school could be prevented with the provision of regular
training and establishment of policies and SOPs.
Findings from this study showed a need for districts to develop and adopt SOPs to
guide procedures for food preparation, service, and sales district-wide. To assist districts in
updating and refining their food safety plans through policy and SOP development, model
food safety policy and SOP templates are readily available. Training for the FSD and school
staff about changes in child nutrition program regulations and to provide opportunities to
develop necessary skills to perform duties of the job are critical to the adoption of best
practices and implementation of districts’ food safety plans. Food safety training should not
be limited to foodservice staff but should be offered for anyone involved with food prepared,
served, or sold in the district. This includes school board members, district administrators,
management and hourly foodservice workers, noncertified and certified school staff, student
groups, and volunteers. Planned and organized, regularly scheduled, and documented staff
development provides for continuity within a district for new and returning staff members or
those positions made available due to staff turnover.
Given current economic constraints experienced by many school districts and the new
requirements of the Healthy Hunger Free Kids Act of 2010 (the Child Nutrition
Reauthorization Act), foodservice budgets will be challenged. Investment by the district in
their human resources will protect the health of children and others. District decision makers
should ensure district-wide food safety policies, SOPs and training are provided.
Recommendations for Future Research
There continues to be a knowledge gap between administrative requirements of child
nutrition programs and school district decision makers who allocate resources. Additional

147
studies should be conducted to assess the effectiveness of a child nutrition program and food
safety educational component in school administrator licensing or certification programs.
Currently, there are no requirements, yet many school food authorities are district
administrators. Further studies should explore the educational preparation of the FSD and
the impact on effectiveness of the child nutrition program, addressing financial, food safety,
and nutritional adequacy of program. In many districts, the model or management practice of
cook/supervisor is still used. To address the changing requirements for child nutrition
programs, such as HACCP plan adoption, on-the-job experience, and production skills may
not be sufficient preparation or ensure the skill sets needed to fulfill the responsibilities of
this key position within the district. Such studies could be done among USDA regions and
use quantitative and qualitative approaches to data collection.
The effectiveness of recent Child Nutrition Program Reauthorization regulations as
well as funded and unfunded mandates also should be assessed. These include HACCP
implementation, LWP changes, and training requirements as well as program changes
impacting food costs (such as proposed portion changes in fruits and vegetables, addition of a
meat/meat alternative to school breakfast meals, and encouragement of farm-to-school
programs).

148
REFERENCES
Almanza, B. A., & Ghiselli, R. (1998). Implementation and cost of HACCP in a grill
type operation. Journal of Foodservice Systems, 10, 107–124.
Almanza, B., & Sneed, J. (2003). Food safety and HACCP in schools. Journal of Child
Nutrition & Management, 27(1). Retrieved from http://www.asfsa.org/childnutrition
/jcnm/03spring/almanza/
Barratt, R. D., Cross, N. A., Mattfeldt-Beman, M. K., & Katz, B. M. (2004). School policies
that promote healthy eating: A survey of foodservice directors in North Carolina
Public Schools. Journal of Child Nutrition and Management, 28(1). Retrieved from
http://docs.schoolnutrition.org/newsroom/jcnm/04spring/barratt/
Belo, P., Giampaoli, J., & McProud, L. (1996). Attitudes and knowledge of food safety
among Santa Clara County, California restaurant operators. Journal of Food Safety
Systems, 9, 117–129.
Berry, B., & Litchford, M. D. (1998). A guide to purchasing foodservice equipment.
University, MS: National Food Service Management Institute.
Bogden, J. F. (2000). Fit, healthy, and ready to learn. Alexandria, VA: National Association
of School Boards of Education.
Brounstein, A. (2003). Survey of NJ public school district superintendents’ attitudes,
practices, and policies regarding school food and nutrition services (Unpublished
master’s thesis). University of Medicine and Dentistry of New Jersey, Stratford, NJ.
Cater, J., & Brown, D. (2002). Quality financial decision making: Insight # 19. University,
MS: National Food Service Management Institute.
149
Centers for Disease Control and Prevention. (1985). Turkey associated salmonellosis at an
elementary school – Georgia. MMWR (No. RR-34). Retrieved from
http://www.cdc.gov/mmwr/preview/mmwrhtml/00000641.htm
Centers for Disease Control and Prevention. (1987). Epidemiologic notes and reports
salmonellosis in a school system-Oklahoma. MMWR (No. RR-36). Retrieved from
http://www.cdc.gov/mmwr/preview/mmwrhtml/00000868.htm
Centers for Disease Control and Prevention. (2005). Healthy youth! Health topics: Food
safety. Retrieved from http://www.cdc.gov/healthyyouth/foodsafety/strategies.htm
Centers for Disease Control and Prevention. (2006a). Multiple outbreaks of gastrointestinal
illness among school children associated with the consumption of flour tortillas -
Massachusetts, 2003–2004. MMWR (No. RR-55). Retrieved from http://www.cdc.gov
/mmwr/preview/mmwrhtml/mm5501a3.htm
Centers for Disease Control and Prevention. (2006b). Ongoing multistate outbreak of
Escherichia coli serotype O157:H7 infections associated with consumption of fresh
spinach—United States, September 2006. MMWR (No. 55). Retrieved from
http://www.cdc.gov/mmwr/preview/mmwrhtml/mm55d926a1.htm
Centers for Disease Control and Prevention. (2006c). Healthy youth! SHPPS 2000 fact
sheets. Retrieved from http://www.cdc.gov/healthyyouth/shpps/factsheets
/food_service.htm
Centers for Disease Control and Prevention. (2011). Vital signs: Incidence and trends of
infected pathogens transmitted commonly through food – Foodborne diseases active
surveillance network, 10 U.S. sites, 1996–2010. MMWR, 60(22), 749–755. Retrieved
150
from http://www.cdc.gov/mmwr/preview/mmwrhtml/mm6022a5.htm?s_cid
=mm6022a5_w
Cho, H., & Nadow, M. Z. (2004). Understanding barriers to implementing quality lunch and
nutrition education. Journal of Community Health, 29, 421–435.
Child Nutrition and WIC Reauthorization Act of 2004, Pub. L. No. 108-265, 42 USC § 1751
(2004).
Conklin, M. T. (2008). Human resources. In J. Martin & C. Oakley (Eds.), Managing child
nutrition programs: Leadership in excellence (pp. 227–251). Sunbury, MD: Jones
and Bartlett.
Conklin, M. T., Sneed, J., & Martin, J. (1995). Preparing child nutrition professionals for the
21st century. School Food Service Research Review, 19(1), 6–13.
Creswell, J. W. (2005). Educational research: Planning, conducting, and evaluating
quantitative and qualitative research (2nd
ed.). Upper Saddle River, NJ: Pearson
Education.
Cross, B. W., Asperin, A. E., & Nettles, M. F. (2009). Competency-based performance
appraisals improving performance evaluation of school nutrition managers and
assistants/technical. Journal of Child Nutrition & Management, 33(2). Retrieved from
http://www.schoolnutrition.org/Content.aspx?id=15329
Dalton, B., Sable, J., & Hoffman, L. (2006). Characteristics of the 100 largest public
elementary and secondary school districts in the United States: 2003–2004.
(Publication No. 2006-329). Washington, DC: U.S. Department of Education,
National Center for Education Statistics.
151
Daniels, N. A., Mackinnon, L. Rowe, S. W., Bean, N. H., Griffin, P. M., & Mead, P. S.
(2002). Foodborne disease outbreaks in United States schools. Pediatric Infectious
Disease Journal, 21, 623–628.
Dillman, D. A. (2007). Mail and internet surveys: The tailored design method (2nd ed.).
Hoboken, NJ: John Wiley and Sons.
Eisler, P., & Morrison, B., (2009, December 15). 26,500 school cafeterias lack required
inspections. USA TODAY. Retrieved from http://www.usatoday.com/news/education
/2009-12-15-school-lunches-health-inspections_N.htm
Food Allergy Initiative. (2011). In school. Retrieved from http://faiusa.org/page.aspx
?pid=407
Food Research and Action Center. (2007a). Child nutrition fact sheet: National school lunch
program. Retrieved from http://www.frac.org/pdf/cnnslp.pdf
Food Research and Action Center. (2007b). Child nutrition fact sheet: School breakfast
program. Retrieved from http://www.frac.org/pdf/cnsbp.pdf
Food Research and Action Center. (2007c). Child nutrition fact sheet: Summer food service
program. Retrieved from http://www.frac.org/pdf/CNSFSP.pdf
Food Research and Action Center. (2007d). National school lunch program. Retrieved from
http://www.frac.org/html/federal_food_programs/programs/nslp.html
Giampaoli, J., Cluskey, M., & Sneed, J. (2002). Developing a practical audit tool for
assessing employees’ food-handling practices. Journal of Child Nutrition &
Management, 26/ Retrieved from http://www.asfsa.org/childnutrition/jcnm/02spring
/giampaoli2/

152
Giampaoli, J., Sneed, J., Cluskey, M., & Koenig, H. (2002).School foodservice directors’
attitudes and perceived challenges to implementing food safety and HACCP
programs. Journal of Child Nutrition & Management, 26. Retrieved from
http://www.asfsa.org/childnutrition/jcnm/02spring/giampaoli/
Gilbert, C. H. (2010, April). Presentation at the Pennsylvania Department of Education, Food
Safety Regional Training, Malvern, PA.
Gilmore, S., Brown, N. E., & Dana, J. T. (1998). A food quality model for school
foodservices. Journal of Child Nutrition & Management, 22, 32–39.
Goetz, G. (2011, November). Melon growers should heed safety guidelines. Food Safety
News. Retrieved from http://www.foodsafetynews.com/admin/mt-search.cgi?
blog_id=1&tag=cantaloupes&limit=20
Gregoire, M. B., & Bender, B. (1999). Food production systems for the future. In J. Martin &
M. T. Conklin (Eds.), Managing child nutrition programs: Leaders for excellence
(pp. 433–466). Gaithersburg, MD: Aspen.
Groves, R. M., Fowler, F. J., Couper, M. P., Lepkowski, J. M., Singer, E., & Tourangeau, R.
(2004). Survey methodology. Hoboken, NJ: John Wiley and Sons.
Gunderson, G. (1971). The national school lunch program: Background and development.
(Report No. 0-429-783), Washington, DC: U.S. Government Printing Office.
Hanna, E. N. (2008). An assessment of performance measures in child nutrition programs
(Unpublished doctoral thesis). Iowa State University, Ames, IA.
Healthy People 2010 (2007). Food safety. Retrieved from http://www.healthypeople.gov
/2010/Document/HTML/Volume1/10Food.htm

153
Hedberg, C. W., Palazzi-Churas, K. L., Radke, V. J., Selman, C. A., & Tauxe, R. V. (2008).
The use of clinical profiles in the investigation of foodborne outbreaks in restaurants:
United States, 1982–1997. Epidemiology and Infection, 136(1), 65–72.
Hedberg, C. W., Smith, S. J., Kirkland, E., Radke, V., Jones, T. F., Selman, C. A., and the
EHS Networking Group. (2006). Systematic environmental evaluations to identify
food safety differences between outbreak and non-outbreak restaurants. Journal of
Food Protection, 69, 2697–2702.
Henroid, D., & Sneed, J. (2004). Readiness to implement hazard analysis and critical control
point (HACCP) systems in Iowa schools. Journal of the American Dietetic
Association, 104, 180–185.
Hwang, J. H., Almanza, B. A., & Nelson, D. C. (2001). Factors influencing Indiana school
foodservice directors/managers’ plans to implement a hazard analysis critical control
point (HACCP) program. Journal of Child Nutrition & Management, 25(1), 24–29.
International Food Information Council Foundation. (2010). 2010 food and health survey:
Consumer attitudes toward food safety, nutrition & health. Washington, DC: Author.
Iowa State University Extension. (2006). Model school district safety policy. Retrieved from
http://www.extension.iastate.edu/HRIM/HACCP/schoolfoodservice.htm
Iowa State University Extension. (2007). Safe food lesson 1. Food safety and quality project.
Retrieved from http://www.extension.iastate.edu/foodsafety/Lesson/L1/L1p1.html
Iowa State University Extension. (2008). Standard operating procedures (SOPs). Retrieved
from http://www.extension.iastate.edu/HRIM/HACCP/schoolfoodservice.htm

154
Jenkins-McLean, T., Skilton, C., & Sellers, C. (2004). Engaging food service workers in
behavioral-change partnerships. Journal of Environmental Health, 66(9), 15–20.
Retrieved from http://www.ncbi.nlm.nih.gov/pubmed/15137345
Jones, T. F., Pavlin, B. I., LaFleur, B. J., Ingram, A. A., & Schaffner, W. (2004). Restaurant
inspection scores and foodborne disease. Emerging Infectious Diseases, 10(4),
Retrieved from http:llwww.medscape.com/viewarticle/473164_print
Kim, T., & Shanklin, C. W. (1999). Time and temperature analysis of a school lunch meal
prepared in a commissary with conventional versus cook-chill systems. Foodservice
Research International, 11, 237–249.
Levin, M. (2010). 2010–2011 Pennsylvania school laws and rule (Vol. 1). Eagan, MN: West.
Lockner, D. W., Hildebrandt, M. E., & Pacheco, G. (2003). Food safety risks at school not
related to schools meals: Should school foodservice managers be concerned? Journal
of Child Nutrition and Management, 27(2). Retrieved from http://docs.schoolnutrition
.org/newsroom/jcnm/03fall/lockner/
Longree, K., & Armbruster, G. (1987). Quantity food sanitation (4th
ed.). New York, NY:
John Wiley and Sons.
Marler, B. (2008). Jack in the Box E. coli outbreak. Retrieved from http://www.billmarler
.com/key_case/jack-in-the-box-e-coli-outbreak/
March, L. D., & Gould, R. (2002). Superintendents’ perceptions of public school foodservice
programs in Kansas. Journal of Child Nutrition & Management, 26. Retrieved from
http://www.asfsa.org/childnutrition/jcnm/02spring/march/

155
Martin, H. (2011, September 12). More ground turkey is recalled over Salmonella. Los
Angeles Times. Retrieved from http://articles.latimes.com/2011/sep/12/business/la-fi-
turkey-recall-20110912
Martin, J. (1996). The national school lunch program: A continuing commitment. Journal of
the American Dietetic Association, 96, 857–858.
Martin, J. (1999a). Perspectives on managing child nutrition programs. In J. Martin & M. T.
Conklin (Eds.), Managing child nutrition programs: Leadership in excellence (pp. 3–
28). Gaithersburg, MD: Aspen.
Martin, J. (1999b). Overview of federal child nutrition legislation. In J. Martin & M. T.
Conklin (Eds.), Managing child nutrition programs: Leadership in excellence (pp.
88–110). Gaithersburg, MD: Aspen.
Marx, E. (2008). Eating safely at school: What education policymakers need to know and do
to prevent and respond to food-related illness in schools. Alexandra, VA: National
School Boards Association.
Massachusetts Department of Education. (2002). Managing life threatening food allergies in
schools. Malden, MA: Author.
Molaison, E. F., & Carr, D. H., (2006). School wellness policy: Readiness of principles to
implement changes. University, MS: National Food Service Management Institute.
Molaison, E. F., Carr, D. H., & Federico, H. A. (2008). School wellness policy
implementation: Attitudes of school professionals and parents in elementary schools.
Journal of Child Nutrition & Management, 32(1). Retrieved from
http://www.schoolnutrition.org/Content.aspx?id=10606

156
Molaison, E. F., Carr, D. H., & Hubbard, S. (2007). School principals are key to
implementing a local wellness policy. University, MS: National Food Service
Management Institute.
Molaison, E. F., Howie, S., Kolbo, J., Rushing, K., Zhang, L., & Hanes, M. (2011).
Comparison of the local wellness policy implementation between 2006 and 2008.
Journal of Nutrition and Management, 32(1). Retrieved from http://www
.schoolnutrition.org/Content.aspx?id=15330
National Advisory Committee on Microbiological Criteria for Foods. (1998). Hazard analysis
and critical control point principles and application guidelines. Journal of Food
Protection, 61, 1246–1259.
National Center for Education Statistics. (2007). Search for public school districts. Retrieved
from http://www.nces.ed.gov/ccd/districtsearch/district_list.asp?
National Coalition for Food-Safe Schools. (2004). Food-safe schools action guide. Retrieved
from http://www.foodsafeschools.org/
National Restaurant Association Educational Foundation. (2008). ServSafe®
coursebook.
Chicago, IL: Author.
National Food Service Management Institute. (2009). Serving it safe. University, MS:
Author.
National School Lunch Act, 42 U.S.C., Stat. 281, § 2 (1946).
Nettles, M. F., & Gregoire, M. B. (2000). Analysis of the process used to select a food
production system for school foodservice. Journal of Child Nutrition & Management,
24, 84–91.
157
Neuman, W. (2011, September 29). Costco urges sticker safety measures on cantaloupes. The
New York Times. Retrieved from http://www.nytimes.com/2011/09/29/business
/costco-urges-stricter-safety-measures-on-cantaloupes.html
Oakley, C. B. (1999). Perspectives on managing child nutrition programs. In J. Martin & M.
T. Conklin (Eds.), Managing child nutrition programs: Leadership in excellence (pp.
467–509). Gaithersburg, MD: Aspen.
Oakley, C. B. (2008). Preparation of nutritious school meals. In J. Martin & M. T. Conklin
(Eds.), Managing child nutrition programs: Leadership in excellence (pp. 567–599).
Sudbury, MA: Jones and Bartlett.
Olds, D., & Sneed, J. (2005). Cooling rates of chili using refrigerator, blast chiller, and chill
stick cooling methods. Journal of Child Nutrition & Management, 29(1). Retrieved
from http://docs.schoolnutrition.org/newsroom/jcnm/05spring/olds/index.asp
O’Toole, T. P., Anderson, S., Miller, C. & Guthrie, J. (2007). Nutrition services and foods
and beverages available at school: Results from the school health policies and
programs study 2006. Journal of School Health, 77, 500–521.
Pannell-Martin, D. (1999). School foodservice management for the 21st century (5th ed.).
Alexandria, VA: inTEAM Associates.
Pannell-Martin, D., & Applebaum, G. (1999). Perspectives on managing child nutrition
programs. In J. Martin & M. T. Conklin (Eds.), Managing child nutrition programs:
Leadership in excellence (pp. 467–509). Gaithersburg, MD: Aspen.
Partnership for Food Safety Education. (1997). Our history. Arlington, VA: Author.
Retrieved from http://www.fightbac.org/component/content/article/2/53-our-history

158
Pennsylvania Association of School Business Officials. (2002). The role of food service in
school entities. Harrisburg, PA: Author.
Pennsylvania Department of Education. (2007). Food and nutrition programs: National
school lunch program. Retrieved from http://www.able.state.ps.us/food_nutrition
/cwp/view.asp?a=5&Q=45622&pp=12&n=1
Pennsylvania Public School Code of 1949, Article XIV, School Health Services, 24 P.S. 14-
1401 (2011).
Potts-Datema, B. (2005). The bottom line: Improving nutrition and health. School Business
Affairs, 71(1), 13–15.
Rainville, A. J., Choi, K., & Brown, D. M. (2003). Healthy school nutrition environments:
Results of a nationwide survey of school personnel. University, MS: National Food
Service Management Institute.
Rainville, A. J., Choi, K., & Brown, D. M. (2005). Healthy school nutrition environments:
Views of school foodservice personnel compared to other school personnel. Journal
of Child Nutrition & Management, 29(2). Retrieved from http://docs.schoolnutrition
.org/newsroom/jcnm/05fall/rainville/index.asp
Rice, F. W. (2007). Comparison of cooperative and non-cooperative purchasing in school
foodservice (Unpublished doctoral dissertation). Iowa State University, Ames, IA.
Richards, M. S., Rittman, M., Gilbert, T. T., Opal, S. M., DeBuonon, B. A., Neill, R. J., &
Gemski, P. (1993). Investigation of a Staphylococcal food poisoning outbreak in a
centralized school lunch program. Public Health Reports,108, 775–771.

159
Roberts, K. R., Barrett, B., & Sneed, J. (2005). Status of prerequisite and HACCP program
implementation in Iowa and Kansas Restaurants. Food Protection Trends, 25, 694–
700.
Roberts, K. R., & Sneed, J. (2003). Status of prerequisite and HACCP program
implementation in Iowa restaurants. Food Protection Trends, 23, 1541–9576.
Roberts, S., Pobocik, R. S., Deek, R., Besgrove, A., & Prostine, B. A. (2009). Qualitative
study of junior high school principals and school food service directors’ experiences
with the Texas school nutrition policy. Journal of Nutrition Education and Behavior,
41, 293–299.
Rothschild, M. (2011, March 23). 14 ill in E. Coli outbreak tied to bologna. Food Safety
News. Retrieved from http://www.foodsafetynews.com/2011/03/e-coli-o157h7-
outbreak-tied-to-beef-bologna/
Rushing, K., Nettles, M. F., Johnson, J. T. (2009). Operational issues encountered by school
nutrition directors with less than 30,000 student enrollment. Journal of Child
Nutrition & Management, 33(2). Retrieved from http://www.schoolnutrition.org
/Content.aspx?id=13213School Nutrition Association.
Sackin, B. (2006). School foodservice – outsource or self-op? Journal of Child & Nutrition
Management. Retrieved from http://docs.schoolnutrition.org/newsroom/jcnm
/06spring/sackin/index.asp
Sampson, H. A., Munoz-Furlong, A. Bock, A., Schmitt, C., Bass, R., Chowdhury, B., . . .
Carmago, C. A. (2005). Symposium on the definition and management of
anaphylaxis: Summary report. Journal of Allergy and Clinical Immunology, 115,
548–91.

160
Scallan, E., Griffin, P. M., Angulo, F. J., Tauxe, R. V., & Hoestra, R. M. (2011a). Foodborne
illness acquired in the United States: Unspecified agents. Emerging Infection Disease,
17, 16–22.
Scallan, E., Hoekstra, R. M., Angulo, F. J., Tauxe, R. V., Widdowson, M. A., Roy, S. L., . . .
Griffin, P.M. (2011b). Foodborne illness acquired in the United States: Major
pathogens. Emerging Infectious Diseases, 17, 7–15.
School Nutrition Association. (2005a). Keys to food safety: Writing and implementing a
school food safety program based on HACCP principles. Alexandra, VA: Author.
School Nutrition Association. (2005b). SNA 2005 operations report. Alexandria, VA:
Author.
School Nutrition Association. (2006). Little big fact book: The essential guide to school
nutrition. Alexandria, VA: Author.
School Nutrition Association. (2007). SNA 2007 operations report. Alexandria, VA: Author.
School Nutrition Association. (2008). Little big fact book: The essential guide to school
nutrition. Alexandria, VA: Author.
School Nutrition Association. (2009). SNA 2009 operations report. Alexandria, VA: Author.
School Nutrition Association. (2010). SNA 2010 back to school trends report. National
Harbor, MD: Author.
School Nutrition Association. (2011a). Key Area 1- Operations. School Nutrition University.
National Harbor, MD: Author.
School Nutrition Association. (2011b). Little big fact book: The essential guide to school
nutrition. National Harbor, MD: Author.

161
School Nutrition Association. (2011c). SNA 2011 operations report. Alexandria, VA:
Author.
Schreck, S. (2010, August 6). Taco Bell source of Salmonella. Food Safety News. Retrieved
from http://www.foodsafetynews.com/2010/08/taco-bell-source-of-salmonella/
Shield, J., & Mullen, C. (2002).The American Dietetic Association guide to healthy eating
for kids. Hoboken, NJ: John Wiley and Sons, Inc.
Silberberg, S. C. (1997). The new design handbook. University, MS: National Food Service
Management Institute.
Slavin, R. E. (1992). Research methods in education. Needham Heights, MA: Allyn and
Bacon
Smeltz, A. (2008, July 6). City may reform free school meal plan. Courier-Post, B3.
Smith, S. & Mazin, R. (2004). The HR answer book: An indispensable guide for managers
and human resources professionals. New York, NY: AMACOM.
Sneed, J. & Henroid, D. (2003). HACCP implementation in school foodservice: Perspectives
of foodservice directors. Journal of Child Nutrition & Management, 27. Retrieved
from http://docs.schoolnutrition.org/newsroom/jcnm/03spring/sneed/
Sneed, J., & Henroid, D. (2007). Impact of educational interventions on Hazard Analysis
Critical Control Point (HACCP) program implementation in Iowa schools. Journal of
Child Nutrition & Management, 31. Retrieved from http://docs.schoolnutrition.org
/newsroom/jcnm/07spring/sneed/index.asp
Sneed, J., Mahoney, M., & Henroid, D. (2003). HACCP system overview. In HACCP
journey in school foodservice, Ames, IA: Iowa State University.

162
Sneed, J., Oakley, C. B, & Ellis, J. D. (2006). State agency involved in food safety training
for child nutrition programs. Journal of Child Nutrition & Management, 30(2).
Retrieved from http://docs.schoolnutrition.org/newsroom/jcnm/06spring/sneed
/index.asp
Sneed, J., Strohbehn, C., & Gilmore, S. A. (2004). Food safety practices and readiness to
implement HACCP programs in assisted-living facilities in Iowa. Journal of the
American Dietetic Association, 104, 1678–1683.
Stainbrook, R. (1991). The question for a completely self-supporting foodservice program.
School Business Affairs, 57(11), 4–9.
Standards for School Nutrition (4321.1), Series 86. Title 126. Legislative Rule, West
Virginia Board of Education (2008). Retrieved from http://wvde.state.wv.us
/policies/p4321.1.pdf
Stinson, W. B., Carr, D., Nettles, F., & Johnson, J. T. (2011). Food safety programs based on
HACCP principles in school nutrition programs: Implementation status and factors
relating to implementation. Journal of Child Nutrition & Management, 35(1).
Retrieved from http://www.schoolnutritionorg/Content.aspx?id=15329
Stracener, J. G., & Boudreaux, L. J. (1997). Contract food service management in schools:
Administrators’ decision factors and satisfaction. School Food Service Research
Review, 21, 70–76.
Story, C. A. (2008). School foodservice administrators' perceptions of required and/or
desired inputs to implement a HACCP-based food safety plan: A national study
(Unpublished doctoral dissertation). Iowa State University, Ames, IA.

163
Strohbehn, C. A., & Litchfield, R. (2008). School meal program updates for district decision
makers [Brochure]. Ames, IA: Iowa State University Extension.
Strohbehn, C. A., Sneed, J., Paez, P., & Meyer, J. (2008). Handwashing frequencies and
procedures used in retail food services. Journal of Food Protection, 71, 1641–1650.
Sullivan, K., Harper, M., & West, C. K. (2002). Training needs of school foodservice site
managers. Journal of Child Nutrition and Management, 26(1). Retrieved from
http://www.asfsa.org/childnutrition/jcnm/02spring/sullivan
Thornton, J. K. (2007). Factors influencing the effectiveness of school foodservice programs
(Unpublished doctoral dissertation). Iowa State University, Ames, IA.
U.S. Department of Agriculture. (2007a). Child and adult care food program. Retrieved from
http://www.fns.usda.gov/cnd/Care/CACFP/aboutcacfp.htm
U.S. Department of Agriculture. (2007b). Child and adult care food program: Annual
summary. Retrieved from http://www.fns.usda.gov/pd/ccsummar.htm
U.S. Department of Agriculture. (2007c). Fresh fruit and vegetable program. Retrieved from
http://www.fns.usda.gov/cnd/FFVP/FFVPdefault.htm
U.S. Department of Agriculture. (2007d). Fresh fruit and vegetable program: Program
history. Retrieved from http://www.fns.usda.gov/cnd/FFVP/FFVPHistory.htm
U.S. Department of Agriculture. (2007e). National school lunch program. Retrieved from
http://www.fns.usda.gov/cnd/Lunch/Default.htm
U.S. Department of Agriculture. (2007f). National school lunch program: Participation and
lunches served. [Table]. Retrieved from http://www.fns.usda.gov/pd/slsummar.htm
U.S. Department of Agriculture. (2007g). Summer food service program: Program history.
Retrieved from http://www.fns.usda.gov/cnd/summer/about/program_history.htm

164
U.S. Department of Agriculture. (2008ba, February 13). [Memo to regional directors, Special
Nutrition Programs]. Suspension of Westland Meat Company and Mr. Stan Mendell
(Memo-SP 10-2008). Retrieved from http://www.fns.usda.gov/cnd/governance
/Policy-Memos/2008/SP_10-2008-OS.pdf
U.S. Department of Agriculture. (2008b). National school lunch program: Background,
trends, and issues. Retrieved from www.ers.usda.gov/publications/err61/err61.pdf
U.S. Department of Agriculture. (2009a). School food safety inspections. Code of Federal
Register, 74, 45305–45307.
U.S. Department of Agriculture. (2009b). School food safety program based on hazard
analysis and critical control point principles. Code of Federal Register, 74(239),
66213–66217.
U.S. Department of Agriculture. (2011a). CNP: Summer food service program. Retrieved
from http://www.ers.usda.gov/Briefing/ChildNutrition/Summer.htm
U.S. Department of Agriculture. (2011b). National school lunch program: School food
service account revenue amendments related to the Healthy, Hunger-Free Kids Act of
2010. Code of Federal Register, 76(117), 35301–35318
U.S. Department of Agriculture. (2011c). Program data: CNP tables. Retrieved from
http://www.fns.usda.gov/pd/CNPMain.htm
U.S. Department of Agriculture. (2011d). School breakfast program: Program history.
Retrieved from http://www.fns.usda.gov/cnd/breakfast/AboutBFast/SBPFactsheet.pdf
U.S. Department of Agriculture. (2011e). Special milk program. Retrieved from
http://www.fns.usda.gov/AboutMilk/SMPFactSheet.pdf

165
U.S. Department of Agriculture, Economic Research Service. (2011). Child nutrition
programs. Retrieved from http://www.ers.usda.gov/Briefing/ChildNutrition
/lunch.htm
U.S. Department of Agriculture, Food and Nutrition Service. (2005a). Guidance for school
food authorities: Developing a school food safety program based on the process
approach to HACCP principles. Washington, DC: Author.
U.S. Department of Agriculture, Food and Nutrition Service. (2005b, January 10). [Memo to
Special Nutrition Programs]. Hazard analysis and critical control point (HACCP) in
schools reauthorization 2004: Implementation memo– SP 11. Retrieved from
http://www.fns.usda.gov/cnd/governance/Reauthorization_Policy_04/Reauthorization
_04/2005-01-10.pdf
U.S. Department of Agriculture, Food and Nutrition Service, & National Food Service
Management Institute. (2002). HACCP implementation for child nutrition programs:
Building on the basic. University, MS: Author.
U.S. Department of Agriculture, Food and Nutrition Service, U.S. Department of Education,
& Centers for Disease Control and Prevention. (2011, September 2). Healthy,
Hunger‐Free Kids Act of 2010, Section 204: Local School Wellness Policies 5‐Year
Technical Assistance and Guidance Plan. Retrieved from http://www.fns.usda.gov/tn
/healthy/lwp5yrplan.pdf
U.S. Department of Agriculture, Food Safety and Inspection Service. (2007). About FSIS:
Agency history. Retrieved from http://www.fsis.usda.gov/About_FSIS
/Agency_History/index/asp

166
U.S. Department Agriculture and U. S. Department of Health and Human Services. (2010).
Dietary Guidelines for Americans, 2010. Washington, DC: Author.
U.S. Food and Drug Administration. (2000). Report of the FDA retail food program
database of foodborne illness risk factors. Retrieved from http://www.fns.usda.gov
/oane/menu/Published/CNP/cnp-archive.htm
U.S. Department of Health and Human Services, Public Health Service, & U.S. Food and
Drug Administration. (2005). Food Code 2005. Retrieved September 5, 2011, from
http://www.fda.gov/Food/FoodSafety/RetailFoodProtection/FoodCode/FoodCode200
9/default.htm
U.S. Department of Health and Human Services, Public Health Service, & U.S. Food and
Drug Administration. (2009). Food Code 2009. Retrieved September 5, 2011, from
http://www.fda.gov/Food/FoodSafety/RetailFoodProtection/FoodCode/FoodCode200
9/default.htm
U.S. Food and Drug Administration. (2011). Federal and state officials confirm link between
bagged romaine lettuce and E. coli O145 illness outbreak. Retrieved from
http://www.fda.gov/NewsEvents/Newsroom/PressAnnouncements/ucm211529.htm
U.S. General Accounting Office. (2000). School meals programs: Few outbreaks of
foodborne illness reported (Publication No. GAO/RCED-00-53). Retrieved from
http://www.fns.usda.gov/oane/menu/Published/CNP/cnp-archive.htm
U.S. General Accounting Office. (2002a). Food safety: Continued vigilance needed to ensure
safety of school meals (Publication No.GAO-02-669T). Retrieved from
http://www.fns.usda.gov/oane/menu/Published/CNP/cnp-archive.htm

167
U.S. General Accounting Office. (2002b). School meal programs: Established costs for three
administrative processes at selected locations (Publication No.GAO-02-944).
Washington, DC: Author.
U.S. General Accounting Office. (2003). School meals programs: Few instances of
foodborne outbreaks reported, but opportunities exist to enhance outbreak data and
food safety practices (Publication No.GAO-03-530). Retrieved from http://www.fns
.usda.gov/oane/menu/Published/CNP/cnp-archive.htm
U.S. Food and Drug Administration. (2005). Food code 2005. Washington, DC: U.S.
Department of Health and Human Services.
Unklesbay, N. F., Maxcy, R. B., Knickrehm, M. E., Stevenson, K. E., Cremer, M. L., &
Matthews, M. E. (1977). Foodservice systems: Product flow and microbial quality
and safety of foods (No. 245 North Central Regional Research Publication).
Columbia, MO: University of Missouri-Columbia College of Agriculture, Agriculture
Experiment Station.
VanEgmond-Pannell, D. (1985). School foodservice (3rd
ed.). Westport, CT: AVI.
Wilson, K. T. (2007). Technology usefulness and impact on school foodservice employees’
perceptions of organizational support (Unpublished doctoral dissertation). Iowa
State University, Ames, IA.
Youn, S., & Sneed, J. (2002).Training and perceived barriers to implementing food safety
practices in school foodservice. Journal of Child Nutrition & Management, 26,
Retrieved from http://www.asfsa.org/childnutrition/jcnm/02fall/youn/
Youn, S, & Sneed, J. (2003). Implementation of HACCP and prerequisite programs in school
Foodservice. Journal of the American Dietetic Association, 103, 55–60.

168
APPENDIX A. INSTITUTIONAL REVIEW BOARD APPROVAL LETTER

169
APPENDIX B. EXPERT PANEL FOODSERVICE DIRECTOR LETTER
October, 2008
Dear Colleague,
Thank you for your assistance.
This packet of material contains the survey and an evaluation form for you to complete.
Earlier this week, you agreed to review my survey for school foodservice directors for
content validity. The survey data will be part of the research project for completion of my
doctoral degree from Iowa State University. The research goal is to assess perceptions held
by school foodservice directors and school business officials in the Mid-Atlantic region about
levels of district support for food safety training and implementation of a food safety plan
mandated in the Child Nutrition and Reauthorization Act of 2004. Other areas that will be
measured are food safety beliefs, attitudes toward staff training, personal and district
characteristics.
School Foodservice Directors and School Business Administrators from the same K-12
public school districts with enrollments between 2,500 and 25,000 located in the Mid-
Atlantic geographic USDA region states in the continental United States and state agencies
directors are being sent surveys. It is imperative that we receive a response since my census
study (n = 498) and I need the findings to accurately reflect this population.
Please review the survey for relevant content and complete the attached evaluation form and
return to me via e-mail within two weeks of the postmark on the outer envelope. If for some
reason, you cannot complete the content evaluation, please send me a note to my e-mail and
add “Content Eval-FSD” in the text box. My contact information is on the evaluation form.
Thank you so much for your assistance.
PhD Candidate, Iowa State University Adjunct Associate Professor/HRIM
Director of Food Services Extension Specialist
Upper Moreland School District Iowa State University
Willow Grove, PA Ames, Iowa
E-mail:[email protected] Email:[email protected]
Phone: 215-830-1522 Phone-515-294-3527
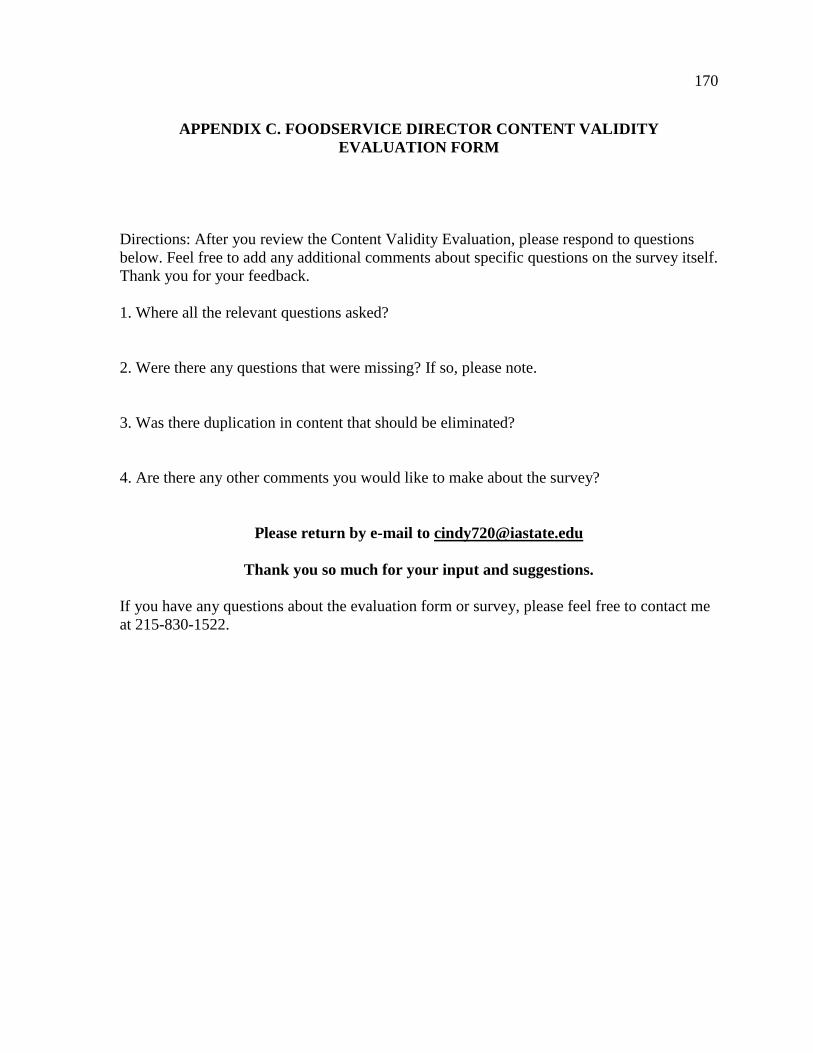
170
APPENDIX C. FOODSERVICE DIRECTOR CONTENT VALIDITY
EVALUATION FORM
Directions: After you review the Content Validity Evaluation, please respond to questions
below. Feel free to add any additional comments about specific questions on the survey itself.
Thank you for your feedback.
1. Where all the relevant questions asked?
2. Were there any questions that were missing? If so, please note.
3. Was there duplication in content that should be eliminated?
4. Are there any other comments you would like to make about the survey?
Please return by e-mail to [email protected]
Thank you so much for your input and suggestions.
If you have any questions about the evaluation form or survey, please feel free to contact me
at 215-830-1522.

171
APPENDIX D. SCHOOL BUSINESS OFFICIAL EXPERT PANEL
REVIEW LETTER
October, 2008
Dear School Business Manager Graduate Student,
This packet of material contains the survey and an evaluation form for you to complete.
Earlier this week, I received permission for you to review my survey for school business
officials for content validity. The survey data will be part of the research project for
completion of my doctoral degree from Iowa State University. The research goal is to assess
perceptions held by school foodservice directors and school business officials in the Mid-
Atlantic region about levels of implementation of a food safety plan mandated in the Child
Nutrition and Reauthorization Act of 2004. Other areas that will be measured are attitudes
toward staff food safety training, personal, and school district characteristics.
School Foodservice Directors and School Business Administrators from the same K-12
public school districts with enrollments between 2,500 and 25,000 located in the Mid-
Atlantic geographic USDA region states in the continental United States and state agency
directors are included in this study. My census study (n = 498) and it is imperative that we
receive a response from all schools to ensure the findings accurately reflect this population.
Please review the survey for relevant content and complete the attached evaluation form and
return to me via e-mail on or within seven business days if the date if the postmark on the
outer envelope. If for some reason you are unable to complete the content evaluation, please
send me an e-mail at [email protected] and place “Content Eval-SBO” in the text box.
My contact information is on the evaluation form.
Thank you so much for your assistance.
PhD Candidate, Iowa State University Adjunct Associate Professor/HRIM
Director of Food Services Extension Specialist
Upper Moreland School District Iowa State University
Willow Grove, PA Ames, Iowa
E-mail:[email protected] Email:[email protected]
Phone: 215-830-1522 Phone-515-294-3527

172
APPENDIX E. SCHOOL BUSINESS OFFICIAL CONTENT VALIDITY
EVALUATION FORM
Directions: After you review the Content Validity Evaluation, please respond to questions
below. Feel free to add any additional comments about specific questions on the survey itself.
Thank you for your feedback.
1. Were all the relevant questions asked?
2. Were there any questions that were missing? If so, please note.
3. Was than any duplication in content that should be eliminated?
4. Are there any other comments you would like to make about the survey?
Please return by e-mail to [email protected]
Thank you for your input and suggestions.
If you have any questions about the evaluation form or survey, please feel free to contact me
at 215-830-1522.

173
APPENDIX F. FOODSERVICE DIRECTOR PILOT LETTER
October, 2008
Dear Colleague,
This packet of material contains the pilot survey. Thank you for agreeing to pilot test my
survey. The survey data will be part of the research project for completion of my doctoral
degree from Iowa State University. The research goal is to assess perceptions held by school
foodservice directors and school business officials in the Mid-Atlantic region about levels of
district support for food safety training and implementation of a food safety plan mandated in
the Child Nutrition and Reauthorization Act of 2004. Other areas that will be measured are
food safety beliefs, attitudes toward staff training, personal and district characteristics.
School Foodservice Directors and School Business Administrators from the same K-12
public school districts with enrollments between 2,500 and 25,000 located in the Mid-
Atlantic geographic USDA region states in the continental United States and State Agency
Directors are included in the study. It is imperative that we receive a response from those
selected to participate to ensure the findings accurately reflect this population; therefore your
input to the survey is very critical.
This assessment is a one-time only pilot test survey. It will be easier to complete the survey if
you have ready access to the following data for the year ending May, 2008:
Total district enrollment
Combined percent of children approved for free and reduced meals
Total foodservice department expenditure budget for the 2007-2008 school year
Total number of FTE’s in the foodservice department (including secretary support,
warehouse staff, and truck drivers)
Information on number of staff with food safety certifications, hours of training for
SNA certification, National Restaurant Association, and/or local health department)
District foodservice sites’ 2007-2008 inspection reports from local health department
There is limited research about the extent and effects of the HACCP implementation
mandate. Your review and comments of this survey will help all Child Nutrition Program
directors to understand how polices are accepted and implemented in school districts, and
what factors are believed to influence school administration support for the district’s
foodservice program.

174
Special Instructions:
There are two surveys in your packet with evaluation sheets. The survey marked FSD, is
your pilot test survey. The survey in the unsealed inner envelope marked SBO is for your
School Business Administrator to pilot test. Please give the survey packet marked SBO to
your School Business Administrator. They are asked to review and evaluate the entire
survey. They will include the evaluation form and survey, seal it, and return to you within 10
days of receiving the packet. Place both into the self-addressed envelope, seal it, and return to
me by within two weeks of the postmark on the outer envelope. Please complete your test
pilot survey and survey evaluation form and return to the address on the envelope along with
the SBO’s packet with evaluation form.
Your participation in this research is, of course, voluntary. Your confidentiality and
anonymity are assured. Return of the surveys is implied consent for responses to be compiled
with others. Although the survey is coded to allow for follow-up with non-respondents, you
will not be individually identified with your questionnaire or responses. Please understand
that use of this data will be limited to this research, as authorized by the Iowa State
University, (located in Ames, Iowa). Results may ultimately be presented in formats other
than the dissertation, such as journal articles, or conference presentations, but the data will be
summarized. You also have the right to express concerns to me at the number below, to my
major professor Dr. Catherine Strohbehn, and/or the ISU Institutional Review Board.
We greatly appreciate your participation in this research. Please collect the SBOs pilot test
and evaluation form in a sealed envelope and place your pilot test survey and evaluation and
return to me in the enclosed, self-addressed, stamped envelope within two weeks of the
postmark on the outer envelope. If for any reason you are unable to complete the pilot test,
please contact me by e-mail [email protected] and place “Pilot survey-FSD” in the text
box.
We genuinely appreciate your time.
PhD Candidate, Iowa State University Adjunct Associate Professor/HRIM
Director of Food Services Extension Specialist
Upper Moreland School District Iowa State University
Willow Grove, PA Ames, Iowa
E-mail:[email protected] Email:[email protected]
Phone: 215-830-1522 Phone-515-294-3527

175
APPENDIX G. FOODSERVICE DIRECTOR PILOT EVALUATION FORM
Directions: After you complete the Pilot Survey, please respond to questions below. Feel free
to add any additional comments about specific questions on the survey itself. Thank you for
your feedback. Please collect the SBOs packet and return with your packet to:
Please return in self-addressed stamped envelope to:
Cynthia Dawso Van Druff, 5 Autumn Ridge Drive, Glassboro, NJ 08028
215-830-1522 (work) 856-582-0741 (home) [email protected]
1. How long did it take you to complete the survey?
◊ Less than 10 minutes
◊ 10-20 minutes
◊ 20-30 minutes
◊ 30-35 minutes
◊ more than 35 minutes
2. Did you have any difficulty understanding the instructions?
◊ Yes ◊ No
If yes, which sections of instruction were difficult to understand ?
3. Did you have any difficulty understanding the questions?
◊ Yes ◊ No
If yes, which questions were difficult to understand _______________________ ?
4. Are there any questions you would eliminate?
◊ Yes ◊ No
If yes, which ones ____________________________________________________
5. Are there any questions you would change or simplify?
◊ Yes ◊ No
If yes, which ones ____________________________________________________
Please comment directly on the survey.
6. Do you think the school foodservice directors will complete this survey if they receive the
survey in the mail?
◊ Yes ◊ No
If no, why not?
_________________________________________________________________
7. Are there any other comments you would like to make about the survey?
◊ Yes ◊ No

176
APPENDIX H. SCHOOL BUSINESS OFFICIAL PILOT LETTER
October, 2008
Dear School Business Administrator,
This packet of material contains the pilot survey. Thank you for agreeing to pilot test my
survey. The survey data will be part of the research project for completion of my doctoral
degree from Iowa State University. The research goal is to assess perceptions held by school
foodservice directors and school business officials in the Mid-Atlantic region about levels of
implementation of a food safety plan mandated in the Child Nutrition and Reauthorization
Act of 2004. Other areas that will be measured are attitudes toward staff food safety training,
personal, and school district characteristics.
School Foodservice Directors and School Business Administrators from the same K-12
public school district with enrollments between 2,500 and 25,000 located in the Mid-Atlantic
geographic USDA region states in the continental United States that comprise the Mid-
Atlantic geographic USDA region and State Agency Directors are part of this study. It is
imperative that we receive a response from those selected to participate to ensure the findings
accurately reflect this population; therefore your input and assessment is vital.
We ask that you complete this one time only pilot test survey. It will be easier to complete
the survey if you have ready access to the following data for the year ending, May, 2008.
▪ Total school district expenditure budget for the 2007-2008 school year
▪ School district expenditure budget for training of staff for the 2007-2008
school year
▪ Number of FTE’s in the district for each of following categories of
employees: teachers, administrators, and non-instructional/support staff
There is limited research about the extent and effects of the HACCP implementation
mandate. Your comments and suggestions to this survey will greatly enhance our
understanding of how polices are accepted and implemented in school districts, and what
factors are believed to influence school administrators views about districts’ foodservice
programs.

177
Special Instructions:
You will receive an envelope marked “SBO” and a paper survey and test pilot evaluation
form. Please complete the survey and test pilot evaluation form, place it in the envelope
marked “SBO” and return to your school foodservice director within 10 days of receiving the
packet. Then the school foodservice director will combine your survey and evaluation form
with the completed FSD survey and place both into the self-addressed envelope, seal it, and
return to me.
Your participation in this research is, of course, voluntary. Your confidentiality and
anonymity are assured. Return of the survey to me is your implied consent for your responses
to be compiled with others. Although the survey is coded to allow for follow-up with non-
respondents, you will not be individually identified with your questionnaire or responses.
Please understand that use if this data will be limited to this research, as authorized by Iowa
State University (located in Ames, Iowa). Results may ultimately be presented in formats
other than the dissertation such as journal articles, or conference presentations, but the data
will be summarized. You also have the right to express concerns to me at the number below,
my major professor Dr. Catherine Strohbehn, and/or the ISU Institutional Review Board.
We greatly appreciate your participation in this research. Please place the completed pilot test
survey and evaluation form in the enclosed, sealing envelope and return to your school
foodservice director. If for any reason you are unable to complete the pilot test, please
contact me by e-mail [email protected] and place “Pilot survey-SBO” in the text box.
We genuinely appreciate your time.
PhD Candidate, Iowa State University Adjunct Associate Professor/HRIM
Director of Food Services Extension Specialist
Upper Moreland School District Iowa State University
Willow Grove, PA Ames, Iowa
E-mail:[email protected] Email:[email protected]
Phone: 215-830-1522 Phone-515-294-3527

178
APPENDIX I. SCHOOL BUSINESS OFFICIAL PILOT EVALUATION FORM
Directions: After you complete the Pilot Survey, please respond to questions below. Feel free
to add any additional comments about specific questions on the survey itself. Thank you for
your feedback. Please collect the SBOs packet and return with your packet to:
Please return in self-addressed stamped envelope to:
Cynthia Dawso Van Druff, 5 Autumn Ridge Drive, Glassboro, NJ 08028
215-830-1522 (work) 856-582-0741 (home) [email protected]
1. How long did it take you to complete the survey?
◊ Less than 10 minutes
◊ 10-20 minutes
◊ 20-30 minutes
◊ 30-325 minutes
◊ more than 35 minutes
2. Did you have any difficulty understanding the instructions?
◊ Yes ◊ No
If yes, which sections of instruction were difficult to understand _____________?
3. Did you have any difficulty understanding the questions?
◊ Yes ◊ No
If yes, which questions were difficult to understand _______________________?
4. Are there any questions you would eliminate?
◊ Yes ◊ No
If yes, which ones ______________________________________________
5. Are there any questions you would change or simplify?
◊ Yes ◊ No
If yes, which ones ______________________________________________
Please comment directly on the survey.
6. Do you think the school business official will complete this survey if they receive the
survey in the mail?
◊ Yes ◊ No
If no, why not?
______________________________________________________________
7. Are there any other comments you would like to make about the survey?
◊ Yes ◊ No
__________________________________________________________________

179
APPENDIX J. FOODSERVICE DIRECTOR PRENOTIFICATION POSTCARD
November, 2008
Dear School Foodservice Director,
In about five days you and other school foodservice directors and school business
administrators in the Mid-Atlantic USDA Region will receive a short survey by mail.
The purpose of the survey is to assess the level of district support for food safety training
and implementation of a food safety plan mandated in the Child Nutrition and
Reauthorization Act of 2004.
This pre-survey notification is being sent to encourage your participation. The beginning
of the school year is very busy and we want to be sure you can plan your time to
complete the survey. We need input from those in charge of Child Nutrition Programs
that fully understand the implications of the HACCP mandate.
Please watch your mail. The survey packet will contain complete instructions for you and
your school business administrator along with a self-addressed return envelope.
If you have any questions please send me an e-mail with “FOOD SAFETY SURVEY-
FSD” in the text box to [email protected].
Thank you,
PhD Candidate, Iowa State University Adjunct Associate Professor/HRIM
Director of Food Services Extension Specialist
Upper Moreland School District Iowa State University
Willow Grove, PA Ames, Iowa
E-mail:[email protected] Email:[email protected]
Phone: 215-830-1522 Phone-515-294-3527

180
APPENDIX K. SCHOOL BUSINESS OFFICIAL PRENOTIFICATION POSTCARD
November, 2008
Dear School Business Administrator,
In about five days you and other school business administrators and school
foodservice directors in the Mid-Atlantic USDA Region will receive a short survey
by mail. The purpose of the survey is to assess the level of district support for food
safety training and implementation of a food safety plan mandated in the Child
Nutrition and Reauthorization Act of 2004.
This pre-survey notification is being sent to encourage your participation. The
beginning of the school year is a very busy time and we want to be sure you can plan
your time to complete the survey. We need input from School Business
Administrators that fully understand their impact on Child Nutrition Programs and
policy mandates.
Please watch your mail. The survey packet will be mailed via your school
foodservice director and will contain complete instructions for you and your school
foodservice director. Your school foodservice director will deliver and collect your
survey.
If you have any questions please send me an e-mail with “FOOD SAFETY
SURVEY-SBO” noted in the text box to [email protected].
Thank you,
PhD Candidate, Iowa State University Adjunct Associate Professor/HRIM
Director of Food Services Extension Specialist
Upper Moreland School District Iowa State University
Willow Grove, PA Ames, Iowa
E-mail:[email protected] Email:[email protected]
Phone: 215-830-1522 Phone-515-294-3527

181
APPENDIX L. FOODSERVICE DIRECTOR CONTACT LETTER
November, 2008
Dear Colleague,
This packet of material contains the survey you were notified about earlier this week. The
survey data will be part of the research project for completion of my doctoral degree from
Iowa State University. The research goal is to assess perceptions held by school foodservice
directors and school business officials in the Mid-Atlantic region about levels of district
support for food safety training and implementation of a food safety plan mandated in the
Child Nutrition and Reauthorization Act of 2004. Other areas that will be measured are food
safety beliefs, attitudes toward staff training, personal and district characteristics.
School Foodservice Directors and School Business Administrators from the same K-12
public school districts with enrollments between 2,500 and 25,000 located in the Mid-
Atlantic geographic USDA region states in the continental United States are being sent
surveys. It is imperative that we receive a response from those selected to participate to
ensure the findings accurately reflect this population.
We ask that you take the 20 minutes or so that will be needed to complete this one-time only
survey. It will be easier to complete the survey if you have ready access to the following data
for the year ending May, 2008:
Total district enrollment
Combined percent of children approved for free and reduced meals
Total foodservice department expenditure budget for the 2007-2008 school year
Total number of FTE’s in the foodservice department (including secretary support,
warehouse staff, and truck drivers)
Information on number of staff with food safety certifications, hours of training for
SNA certification, National Restaurant Association, and/or local health department)
District foodservice sites’ 2007-2008 inspection reports from local health department
There is limited research about the extent and effects of the HACCP implementation
mandate. Your response to this survey will greatly enhance our understanding of how polices
are accepted and implemented in school districts, and what factors are believed to influence
school administration support for the district’s foodservice program.

182
Special Instructions:
There are two surveys in your packet. The survey marked FSD, is your survey. The survey in
the unsealed inner envelope marked SBO is for your School Business Administrator. Please
give the survey packet marked SBO to your School Business Administrator. They are asked
to complete the survey, seal it, and return to you within 10 days of receiving the packet. Place
both into the self-addressed envelope, seal it, and return to me.
Your participation in this research is, of course, voluntary. Your confidentiality and
anonymity are assured. Return of the surveys is implied consent for responses to be compiled
with others. Although the survey is coded to allow for follow-up with non-respondents, you
will not be individually identified with your questionnaire or responses. Please understand
that use of this data will be limited to this research, as authorized by the Iowa State
University, (located in Ames, Iowa). Results may ultimately be presented in formats other
than the dissertation, such as journal articles, or conference presentations, but the data will be
summarized. You also have the right to express concerns to me at the number below, to my
major professor Dr. Catherine Strohbehn, and/or the ISU Institutional Review Board.
We greatly appreciate your participation in this research. Please return the survey within two
weeks of the posted date on the out envelope in the enclosed, self-addressed, stamped
envelope. This will save a follow-up mailing to you.
Thank you for your interest and participation in this study. We genuinely appreciate your
time.
PhD Candidate, Iowa State University Adjunct Associate Professor/HRIM
Director of Food Services Extension Specialist
Upper Moreland School District Iowa State University
Willow Grove, PA Ames, Iowa
E-mail:[email protected] Email:[email protected]
Phone: 215-830-1522 Phone-515-294-3527

183
APPENDIX M. FOODSERVICE DIRECTOR SURVEY
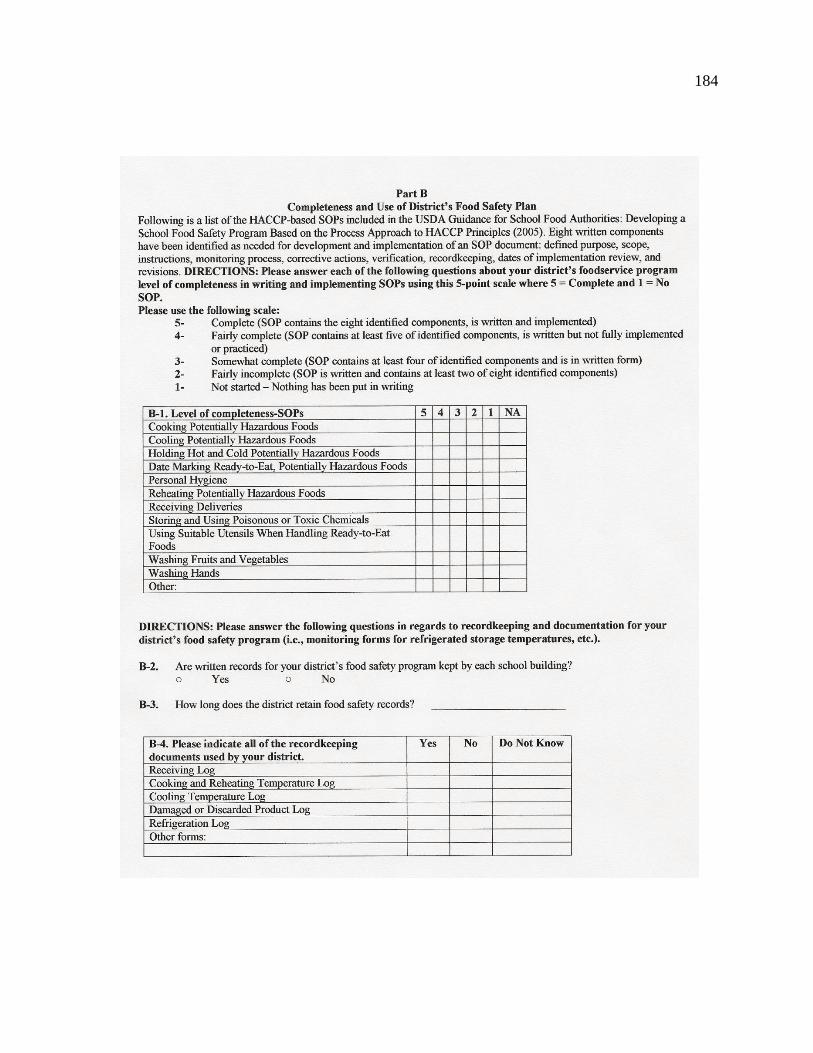
184

185

186
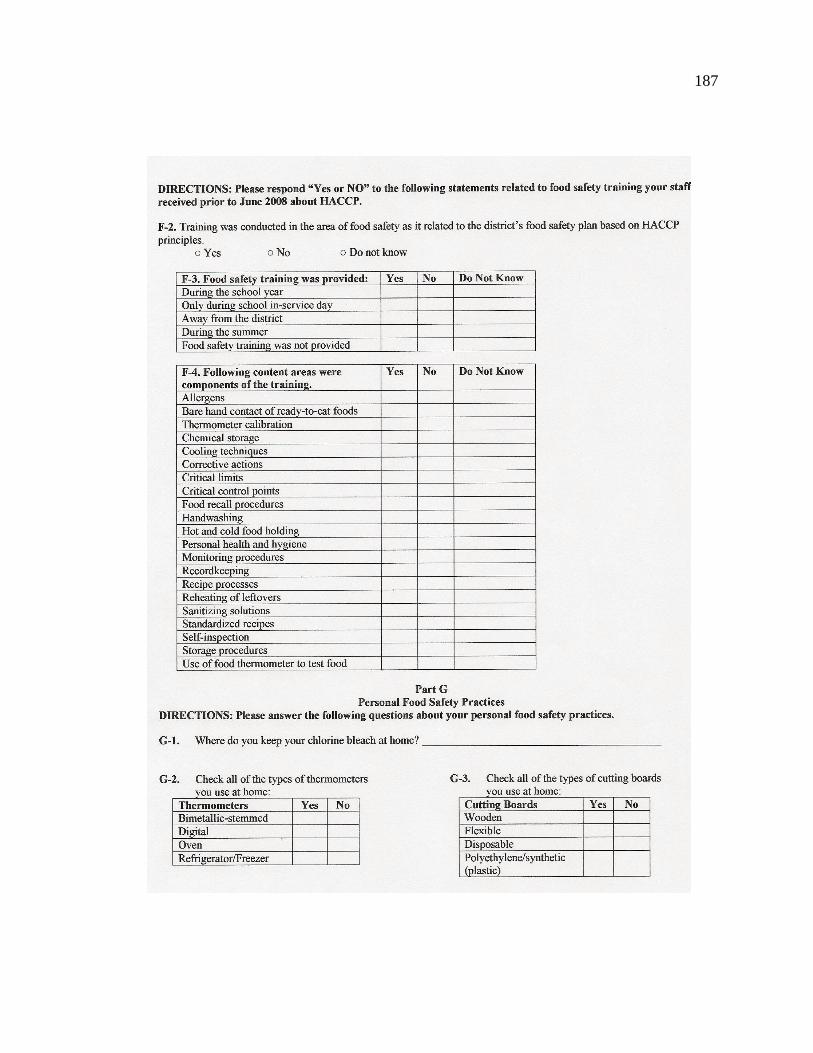
187

188

189

190

191
APPENDIX N. SCHOOL BUSINESS OFFICIAL CONTACT LETTER
November, 2008
Dear School Business Administrator,
This packet of material contains the survey you were notified about earlier this week. The
survey data will be part of the research project for completion of my doctoral degree from
Iowa State University. The research goal is to assess perceptions held by school foodservice
directors and school business officials in the Mid-Atlantic region about levels of
implementation of a food safety plan mandated in the Child Nutrition and Reauthorization
Act of 2004. Other areas that will be measured are attitudes toward staff food safety training,
personal, and school district characteristics.
School Foodservice Directors and School Business Administrators from the same K-12
public school district with enrollments between 2,500 and 25,000 located in the Mid-Atlantic
geographic USDA region states in the continental United States that comprise the Mid-
Atlantic geographic USDA region are being sent surveys. It is imperative that we receive a
response from those selected to participate to ensure the findings accurately reflect this
population.
We ask that you take the 20 minutes or so that will be needed to complete this one time only
survey. It will be easier to complete the survey if you have ready access to the following data
for the year ending, May, 2008.
▪ Total school district expenditure budget for the 2007-2008 school year
▪ School district expenditure budget for training of staff for the 2007-2008 school year
▪ Number of FTE’s in the district for each of following categories of employees:
teachers, administrators, and non-instructional/support staff
There is limited research about the extent and effects of the HACCP implementation
mandate. Your response to this survey will greatly enhance our understanding of how polices
are accepted and implemented in school districts, and what factors are believed to influence
school administrators views about districts’ foodservice programs.

192
Special Instructions:
You will receive an envelope marked “SBO” and a paper survey. Please complete the survey,
place it in the envelope marked “SBO” and return to your school foodservice director within
10 days of receiving the packet. Then the school foodservice director will combine your
survey with the completed FSD survey and place both into the self-addressed envelope, seal
it, and return to me.
Your participation in this research is, of course, voluntary. Your confidentiality and
anonymity are assured. Return of the survey to me is your implied consent for your responses
to be compiled with others. Although the survey is coded to allow for follow-up with non-
respondents, you will not be individually identified with your questionnaire or responses.
Please understand that use if this data will be limited to this research, as authorized by Iowa
State University (located in Ames, Iowa). Results may ultimately be presented in formats
other than the dissertation such as journal articles, or conference presentations, but the data
will be summarized. You also have the right to express concerns to me at the number below,
my major professor Dr. Catherine Strohbehn, and/or the ISU Institutional Review Board.
We greatly appreciate your participation in this research. Please return the survey in the
enclosed. This will save a follow-up mailing to you.
Thank you for your interest and participation in this study. We genuinely appreciate your
time.
Cynthia Dawso Van Druff, M. Ed., SNS Catherine Strohbehn, PhD, RD
PhD Candidate, Iowa State University Adjunct Associate Professor/HRIM
Director of Food Services Extension Specialist
Upper Moreland School District Iowa State University
Willow Grove, PA Ames, Iowa
E-mail:[email protected] Email:[email protected]
Phone: 215-830-1522 Phone-515-294-3527

193
APPENDIX O. SCHOOL BUSINESS OFFICIAL SURVEY

194

195

196

197
APPENDIX P. FOODSERVICE DIRECTOR REMINDER POSTCARD
November, 2008
Dear School Foodservice Director,
About three weeks ago you received a short survey by mail. Perhaps your completed the
survey and it is in the mail. If not, please consider returning the packet today.
The purpose of the survey is to assess the level of district support for food safety training
and implementation of a food safety plan mandated in the Child Nutrition and
Reauthorization Act of 2004.
This is regional survey of directors just like you. We need input from those in charge of
Child Nutrition Programs that fully understand the implications of the HACCP mandate.
If you have lost or misplaced your survey packet please contact me by e-mail for a
replacement copy. Please send me an e-mail with “FOOD SAFETY SURVEY-FSD” in
the text box to [email protected].
The survey packet will contain complete instructions for you and your school business
administrator along with a self-addressed return envelope.
Thank you,
PhD Candidate, Iowa State University Adjunct Associate Professor/HRIM
Director of Food Services Extension Specialist
Upper Moreland School District Iowa State University
Willow Grove, PA Ames, Iowa
E-mail:[email protected] Email:[email protected]
Phone: 215-830-1522 Phone-515-294-3527
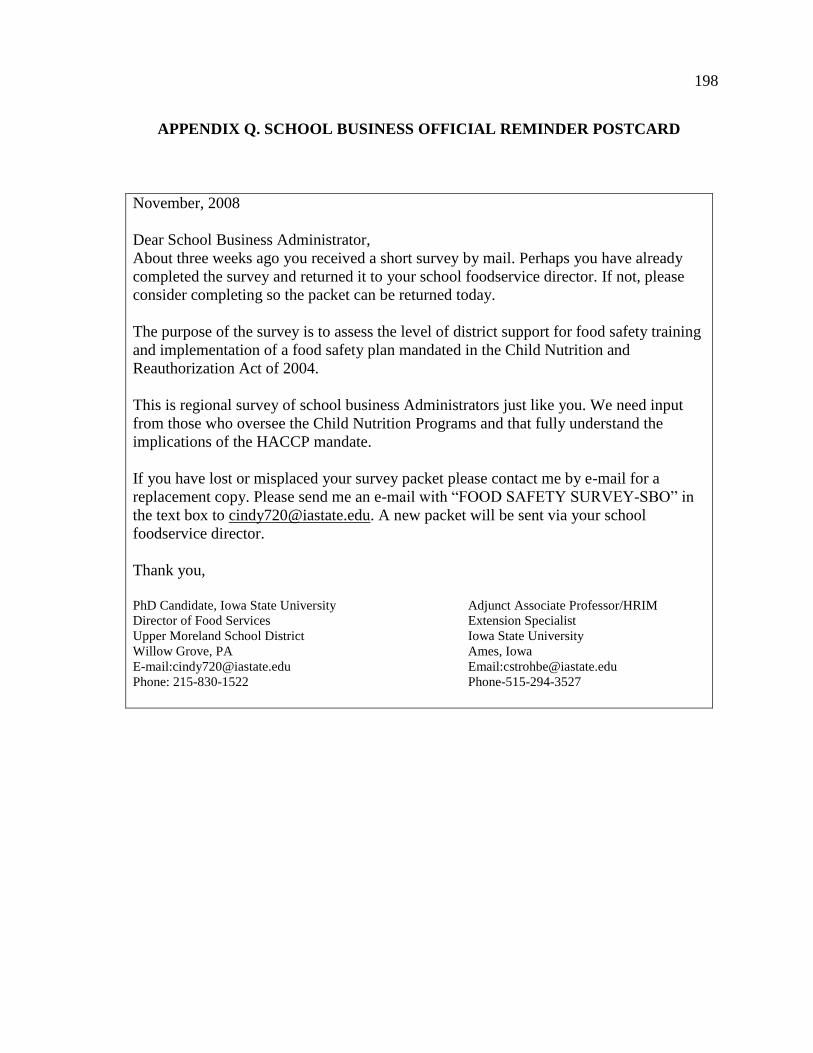
198
APPENDIX Q. SCHOOL BUSINESS OFFICIAL REMINDER POSTCARD
November, 2008
Dear School Business Administrator,
About three weeks ago you received a short survey by mail. Perhaps you have already
completed the survey and returned it to your school foodservice director. If not, please
consider completing so the packet can be returned today.
The purpose of the survey is to assess the level of district support for food safety training
and implementation of a food safety plan mandated in the Child Nutrition and
Reauthorization Act of 2004.
This is regional survey of school business Administrators just like you. We need input
from those who oversee the Child Nutrition Programs and that fully understand the
implications of the HACCP mandate.
If you have lost or misplaced your survey packet please contact me by e-mail for a
replacement copy. Please send me an e-mail with “FOOD SAFETY SURVEY-SBO” in
the text box to [email protected]. A new packet will be sent via your school
foodservice director.
Thank you,
PhD Candidate, Iowa State University Adjunct Associate Professor/HRIM
Director of Food Services Extension Specialist
Upper Moreland School District Iowa State University
Willow Grove, PA Ames, Iowa
E-mail:[email protected] Email:[email protected]
Phone: 215-830-1522 Phone-515-294-3527

199
APPENDIX R. FOODSERVICE DIRECTOR REMINDER LETTER
December, 2008
Survey Reminder
Dear Colleague,
Over three weeks ago you received a packet of material containing a survey for you and your
School Business Official. To date we have not received your returned packet. Please return
by the end of next week. Each completed survey benefits you and other foodservice directors.
This is a very focused regionalized survey and each response is very important to our region.
Your district is a vital to our study. As a thank you, each district will receive a copy of the
results, please indicate by including your business card with the completed survey.
The research goal is to assess perceptions held by school foodservice directors and school
business officials in the Mid-Atlantic region about levels of district support for food safety
training and implementation of a food safety plan mandated in the Child Nutrition and
Reauthorization Act of 2004. Other areas that will be measured are food safety beliefs,
attitudes toward staff training, personal and district characteristics.
Only 498 School Foodservice Directors and School Business Administrators from the same
K-12 public school districts with enrollments between 2,500 and 25,000 located in the Mid-
Atlantic geographic USDA region states in the continental United States were include in this
study and received surveys. It is imperative that we receive a response from those selected to
participate to ensure the findings accurately reflect this population.
We ask that you take the 20 minutes or so that will be needed to complete this one-time only
survey. It will be easier to complete the survey if you have ready access to the following data
for the year ending May, 2008:
Total district enrollment
Combined percent of children approved for free and reduced meals
Total foodservice department expenditure budget for the 2007-2008 school year
Total number of FTE’s in the foodservice department (including secretary support,
warehouse staff, and truck drivers)
Information on number of staff with food safety certifications, hours of training for
SNA certification, National Restaurant Association, and/or local health department)
District foodservice sites’ 2007-2008 inspection reports from local health department
There is limited research about the extent and effects of the HACCP implementation
mandate. Your response to this survey will greatly enhance our understanding of how polices
are accepted and implemented in school districts, and what factors are believed to influence
school administration support for the district’s foodservice program.

200
Special Instructions:
There are two surveys in your packet. The survey marked FSD, is your survey. The survey in
the unsealed inner envelope marked SBO is for your School Business Administrator. Please
give the survey packet marked SBO to your School Business Administrator. They are asked
to complete the survey, seal it, and return to you within 10 days of receiving the packet. Place
both into the self-addressed envelope, seal it, and return to me.
Your participation in this research is, of course, voluntary. Your confidentiality and
anonymity are assured. Return of the surveys is implied consent for responses to be compiled
with others. Although the survey is coded to allow for follow-up with non-respondents, you
will not be individually identified with your questionnaire or responses. Please understand
that use of this data will be limited to this research, as authorized by the Iowa State
University, (located in Ames, Iowa). Results may ultimately be presented in formats other
than the dissertation, such as journal articles, or conference presentations, but the data will be
summarized. You also have the right to express concerns to me at the number below, to my
major professor Dr. Catherine Strohbehn, and/or the ISU Institutional Review Board.
We greatly appreciate your participation in this research. Please return the survey within two
weeks of the posted date on the outer mailing envelope in the enclosed, self-addressed,
stamped envelope. This will save a follow-up mailing to you.
If you are having difficulty in completing the survey, please feel free to send me an e-mail at
[email protected] or call at 215-830-1522. I will be looking forward to receiving your
district information.
We genuinely appreciate your time.
PhD Candidate, Iowa State University Adjunct Associate Professor/HRIM
Director of Food Services Extension Specialist
Upper Moreland School District Iowa State University
Willow Grove, PA Ames, Iowa
E-mail:[email protected] Email:[email protected]
Phone: 215-830-1522 Phone-515-294-3527

201
APPENDIX S. SCHOOL BUSINESS OFFICIAL REMINDER LETTER
December, 2008
Survey Reminder
Dear School Business Administrator,
About three weeks ago a packet of material containing a survey for you and your School
Food Service Director. To date we have not received your returned packet. Please return by
the end of next week. Each completed survey benefits you and other foodservice directors.
The survey data will be part of the research project for completion of my doctoral degree
from Iowa State University. The research goal is to assess perceptions held by school
foodservice directors and school business officials in the Mid-Atlantic region about levels of
implementation of a food safety plan mandated in the Child Nutrition and Reauthorization
Act of 2004. Other areas that will be measured are attitudes toward staff food safety training,
personal, and school district characteristics.
School Foodservice Directors and School Business Administrators from the same K-12
public school district with enrollments between 2,500 and 25,000 located in the Mid-Atlantic
geographic USDA region states in the continental United States that comprise the Mid-
Atlantic geographic USDA region are being sent surveys. It is imperative that we receive a
response from those selected to participate to ensure the findings accurately reflect this
population.
We ask that you take the 20 minutes or so that will be needed to complete this one time only
survey. It will be easier to complete the survey if you have ready access to the following data
for the year ending, May, 2008.
▪ Total school district expenditure budget for the 2007-2008 school year
▪ School district expenditure budget for training of staff for the 2007-2008 school year
▪ Number of FTE’s in the district for each of following categories of employees:
teachers, administrators, and non-instructional/support staff
There is limited research about the extent and effects of the HACCP implementation
mandate. Your response to this survey will greatly enhance our understanding of how polices
are accepted and implemented in school districts, and what factors are believed to influence
school administrators views about districts’ foodservice programs.

202
Special Instructions:
You will receive an envelope marked “SBO” and a paper survey. Please complete the survey,
place it in the envelope marked “SBO” and return to your school foodservice director within
10 days of receiving the packet (TBD). Then the school foodservice director will combine
your survey with the completed FSD survey and place both into the self-addressed envelope,
seal it, and return to me.
Your participation in this research is, of course, voluntary. Your confidentiality and
anonymity are assured. Return of the survey to me is your implied consent for your responses
to be compiled with others. Although the survey is coded to allow for follow-up with non-
respondents, you will not be individually identified with your questionnaire or responses.
Please understand that use if this data will be limited to this research, as authorized by Iowa
State University (located in Ames, Iowa). Results may ultimately be presented in formats
other than the dissertation such as journal articles, or conference presentations, but the data
will be summarized. You also have the right to express concerns to me at the number below,
my major professor Dr. Catherine Strohbehn, and/or the ISU Institutional Review Board.
We greatly appreciate your participation in this research. Please return this second copy of
the survey in the enclosed envelope. This will save a follow-up mailing to you.
If you are having difficulty in completing the survey, please feel free to send me an e-mail at
[email protected] or call at 215-830-1522. I will be looking forward to receiving your
district information.
Thank you for your interest and participation in this study. We genuinely appreciate your
time.
Cynthia Dawso Van Druff, M. Ed., SNS Catherine Strohbehn, PhD, RD
PhD Candidate, Iowa State University Adjunct Associate Professor/HRIM
Director of Food Services Extension Specialist
Upper Moreland School District Iowa State University
Willow Grove, PA Ames, Iowa
E-mail:[email protected] Email:[email protected]
Phone: 215-830-1522 Phone-515-294-3527
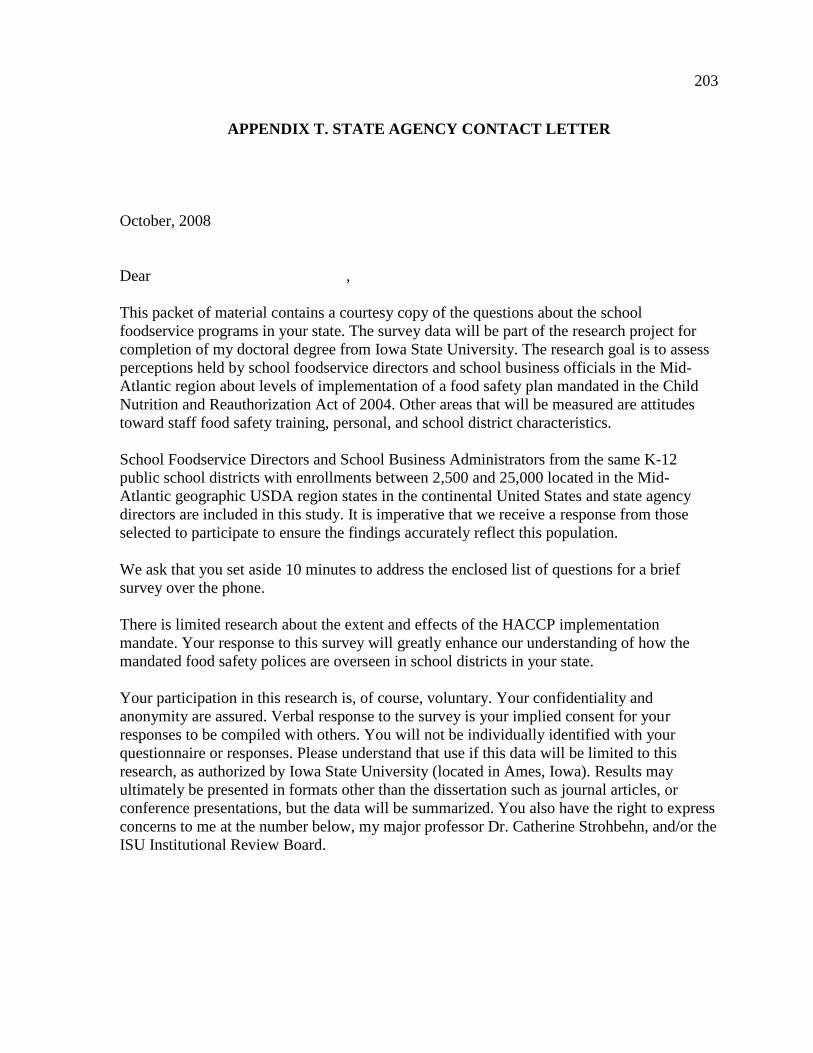
203
APPENDIX T. STATE AGENCY CONTACT LETTER
October, 2008
Dear ,
This packet of material contains a courtesy copy of the questions about the school
foodservice programs in your state. The survey data will be part of the research project for
completion of my doctoral degree from Iowa State University. The research goal is to assess
perceptions held by school foodservice directors and school business officials in the Mid-
Atlantic region about levels of implementation of a food safety plan mandated in the Child
Nutrition and Reauthorization Act of 2004. Other areas that will be measured are attitudes
toward staff food safety training, personal, and school district characteristics.
School Foodservice Directors and School Business Administrators from the same K-12
public school districts with enrollments between 2,500 and 25,000 located in the Mid-
Atlantic geographic USDA region states in the continental United States and state agency
directors are included in this study. It is imperative that we receive a response from those
selected to participate to ensure the findings accurately reflect this population.
We ask that you set aside 10 minutes to address the enclosed list of questions for a brief
survey over the phone.
There is limited research about the extent and effects of the HACCP implementation
mandate. Your response to this survey will greatly enhance our understanding of how the
mandated food safety polices are overseen in school districts in your state.
Your participation in this research is, of course, voluntary. Your confidentiality and
anonymity are assured. Verbal response to the survey is your implied consent for your
responses to be compiled with others. You will not be individually identified with your
questionnaire or responses. Please understand that use if this data will be limited to this
research, as authorized by Iowa State University (located in Ames, Iowa). Results may
ultimately be presented in formats other than the dissertation such as journal articles, or
conference presentations, but the data will be summarized. You also have the right to express
concerns to me at the number below, my major professor Dr. Catherine Strohbehn, and/or the
ISU Institutional Review Board.

204
We greatly appreciate your participation in this research. Please select your first and second
choice of phone survey times.
Monday, (TBD) ___ 8:00 a.m. 10:00 a.m. 1:00 p.m.
___ 8:30 a.m. 10:30 a.m. 1:30 p.m.
Tuesday, (TBD) ___ 8:00 a.m. 10:00 a.m. 1:00 p.m.
___ 8:30 a.m. 10:30 a.m. 1:30 p.m.
Wed., (TBD) ___ 8:00 a.m. 10:00 a.m. 1:00 p.m.
___ 8:30 a.m. 10:30 a.m. 1:30 p.m.
What is the best phone number for contact: _________________________________
Please send me an e-mail to [email protected] within two weeks of receiving this letter
and include your first and second choice of phone survey times. I will follow up with a
confirmation schedule.
Thank you for your interest and participation in this study. We genuinely appreciate your
time.
Cynthia Dawso Van Druff, M. Ed., SNS Catherine Strohbehn, PhD, RD
PhD Candidate, Iowa State University Adjunct Associate Professor/HRIM
Director of Food Services Extension Specialist
Upper Moreland School District Iowa State University
Willow Grove, PA Ames, Iowa
E-mail:[email protected] Email:[email protected]
Phone: 215-830-1522 Phone-515-294-3527

205
APPENDIX U. STATE AGENCY SURVEY
Instructions: There are two parts to this survey; Part A and Part B.
We will discuss the following questions during our phone survey interview.
Please feel free to add any other relevant information related to food safety aspects in your
state for part B. Thank you
PART A
Food Safety questions and information for your state
1. Please identify the current Food Code in use in your state.
2. Was HACCP mandated in schools in your state by your agency prior to the Child
Nutrition and WIC Reauthorization Act of 2004?
If so, when?
3. Are there any other regulations or processes beyond USDA guidance required by
your state?
4. Will you require school districts to forward food safety plans to be submitted to the
State Agency for review?
5. When are HACCP plans reviewed in each district for each school with a NSLP and or
SBP?
6. During the CRE/SMI review process how will the school food safety plan be
reviewed?
7. Do you believe all districts in your state have food safety plans in place by school
site?
8. What state agency or department oversees sanitation inspections for school districts?
9. Who conducts sanitation inspections in your state?
10. What is the frequency of actual health inspections in schools in your state _______ ?
11. Is there a standard sanitation inspection form used statewide?
12. Please identify the total number of public schools in your state.
Part B
Information you’d like to share.

206
APPENDIX V. FOLLOW UP E-MAIL TO STATE AGENCY PARTICIPANTS
Dear ,
Thank you. Earlier this week, you agreed to participate in the survey for school foodservice
programs in your state.
I look forward to learning more about school foodservice safety plans in your state.
Please see your confirmed time below.
We greatly appreciate your participation in this research. Please feel free to use your courtesy
survey copy as a guide for our conversation.
Date: ___ 8:00 a.m. 10:00 a.m. 1:00 p.m.
Thank you for your interest and participation in this study. We genuinely appreciate your
time.
PhD Candidate, Iowa State University Adjunct Associate Professor/HRIM
Director of Food Services Extension Specialist
Upper Moreland School District Iowa State University
Willow Grove, PA Ames, Iowa
E-mail:[email protected] Email:[email protected]
Phone: 215-830-1522 Phone-515-294-3527
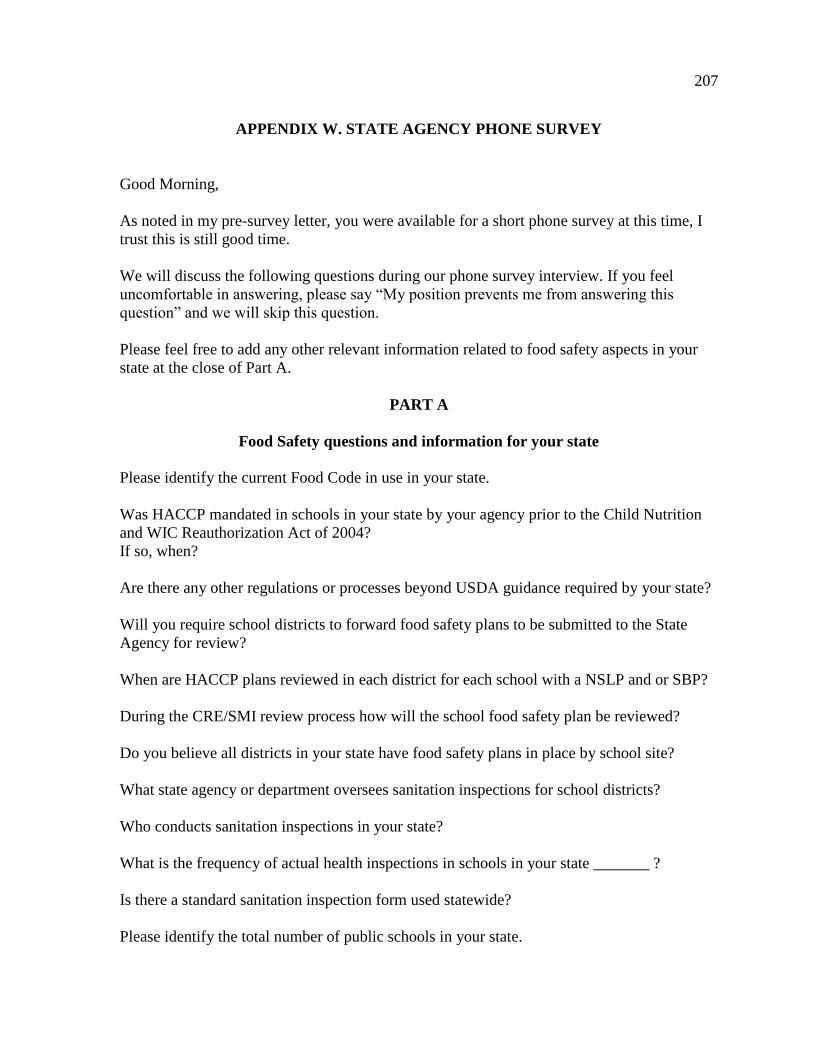
207
APPENDIX W. STATE AGENCY PHONE SURVEY
Good Morning,
As noted in my pre-survey letter, you were available for a short phone survey at this time, I
trust this is still good time.
We will discuss the following questions during our phone survey interview. If you feel
uncomfortable in answering, please say “My position prevents me from answering this
question” and we will skip this question.
Please feel free to add any other relevant information related to food safety aspects in your
state at the close of Part A.
PART A
Food Safety questions and information for your state
Please identify the current Food Code in use in your state.
Was HACCP mandated in schools in your state by your agency prior to the Child Nutrition
and WIC Reauthorization Act of 2004?
If so, when?
Are there any other regulations or processes beyond USDA guidance required by your state?
Will you require school districts to forward food safety plans to be submitted to the State
Agency for review?
When are HACCP plans reviewed in each district for each school with a NSLP and or SBP?
During the CRE/SMI review process how will the school food safety plan be reviewed?
Do you believe all districts in your state have food safety plans in place by school site?
What state agency or department oversees sanitation inspections for school districts?
Who conducts sanitation inspections in your state?
What is the frequency of actual health inspections in schools in your state _______ ?
Is there a standard sanitation inspection form used statewide?
Please identify the total number of public schools in your state.
208
Part B
Information you’d like to share.
Thank you very much. If you would like a copy of the research study, please indicate by
sending an e-mail to [email protected].
Thank you

209
APPENDIX X. FOODSERVICE DIRECTOR FINAL REMINDER
December, 2008
Survey Reminder
Good Morning or Afternoon,
This is Cynthia Dawso Van Druff, the Food Service Director from Upper Moreland
Township School District in Willow Grove, Pennsylvania and doctoral candidate from Iowa
State. Several weeks ago, you were invited to become part of a research study especially
tailored and created for the MARO region.
The packet contained a survey for both you and your School Business Official. To date we
have not received your returned packet.
There are only 498 schools in this study, to perform the analysis and share meaningful data I
just need about (X) more surveys.
What do you need? A new packet, I can drop in mail today. Is your address still?
As you recall, the research goal is to assess perceptions held by school foodservice directors
and school business officials in the Mid-Atlantic region about levels of district support for
food safety training and implementation of a food safety plan mandated in the Child
Nutrition and Reauthorization Act of 2004.
Thanks and we are glad we can count on you. As a thank you, each district will receive a
copy of the results, please indicate by including your business card with the completed
survey.
The research goal is to assess perceptions held by school foodservice directors and school
business officials in the Mid-Atlantic region about levels of district support for food safety
training and implementation of a food safety plan mandated in the Child Nutrition and
Reauthorization Act of 2004.
We genuinely appreciate your time.
PhD Candidate, Iowa State University Adjunct Associate Professor/HRIM
Director of Food Services Extension Specialist
Upper Moreland School District Iowa State University
Willow Grove, PA Ames, Iowa
E-mail:[email protected] Email:[email protected]
Phone: 215-830-1522 Phone-515-294-3527