Embed Size (px)
Citation preview
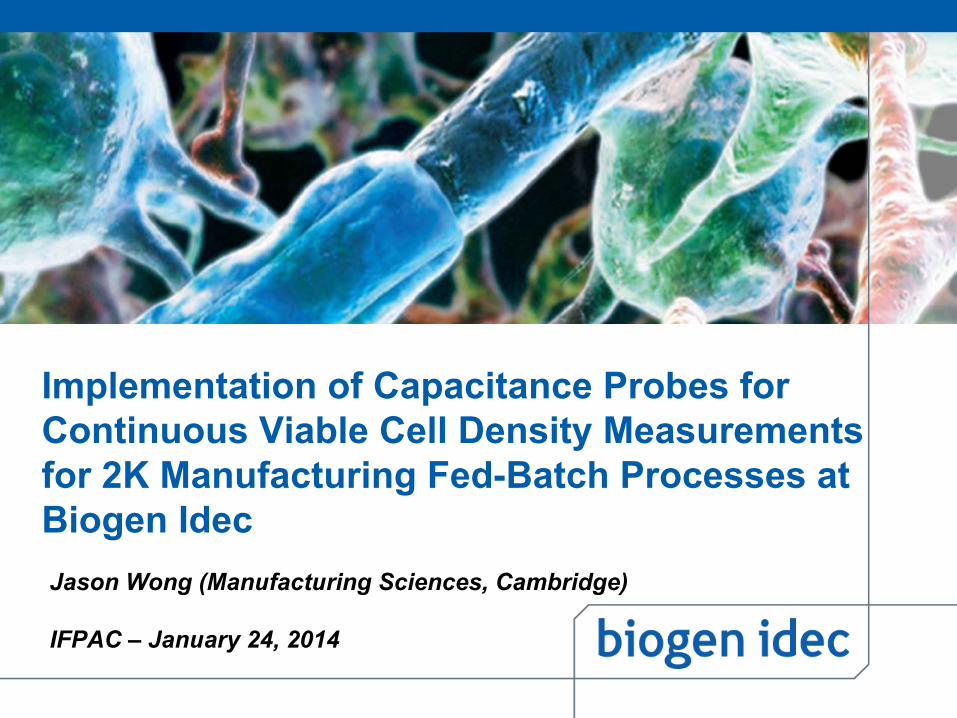
Implementation of Capacitance Probes for Continuous Viable Cell Density Measurements for 2K Manufacturing Fed-Batch Processes at Biogen Idec Jason Wong (Manufacturing Sciences, Cambridge)
IFPAC – January 24, 2014

Outline
2
• Introduction• Technology • Implementation Strategy• Example: Process X Commercial Manufacturing Process
Introduction
3
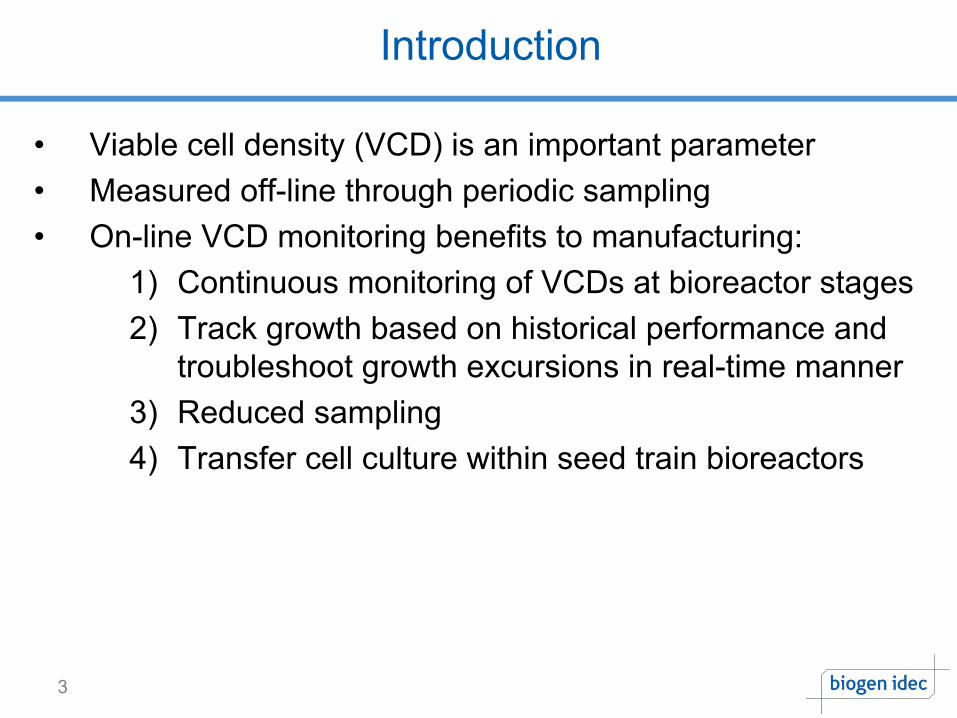
• Viable cell density (VCD) is an important parameter• Measured off-line through periodic sampling • On-line VCD monitoring benefits to manufacturing:
1) Continuous monitoring of VCDs at bioreactor stages2) Track growth based on historical performance and
troubleshoot growth excursions in real-time manner3) Reduced sampling4) Transfer cell culture within seed train bioreactors

Technology
4
• Dielectric spectroscopy (Harris et al., 1987, Kell et al. 1990; and Yardley et al., 2000)
• Measures the dielectric properties of the medium as a function of frequency
• Suspension of cells composed of three separate parts:1. Medium2. Cytoplasm3. Plasma Membrane (Non-Conducting)
• Electrically speaking, Cell Suspension = Suspension of spherical capacitors each containing a conducting matrix and all surrounded by a conducting medium
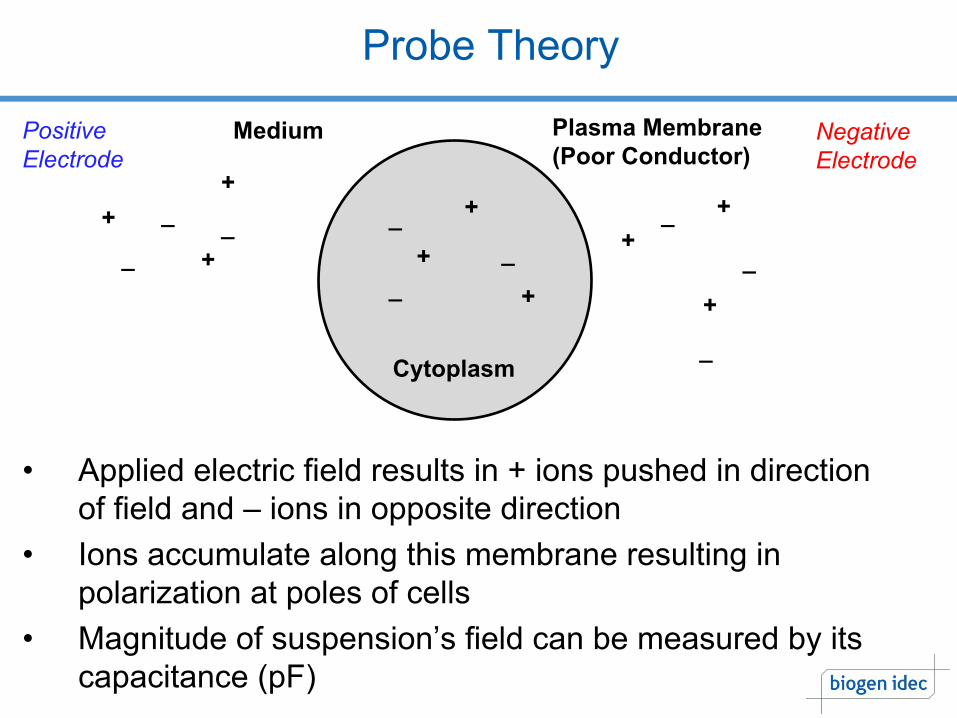
Probe Theory
Medium
Cytoplasm
_
+
+ +_ ++
__
+
_ _
Plasma Membrane(Poor Conductor)
++
+
_
_
_
Positive Electrode
Negative Electrode
• Applied electric field results in + ions pushed in direction of field and – ions in opposite direction
• Ions accumulate along this membrane resulting in polarization at poles of cells
• Magnitude of suspension’s field can be measured by its capacitance (pF)
Factors Influencing Capacitance Measurements
6
• Frequency Settingo # of times electric field changes direction per secondo Low frequency vs. high frequency
• Cell Growth (Increase in cell diameter)o Can increase capacitance by increase of cell volume
• Non-biomass solidso Dead cells, oil droplets, debris, gas bubbleso Reduce capacitance by reducing cellular volume
fraction
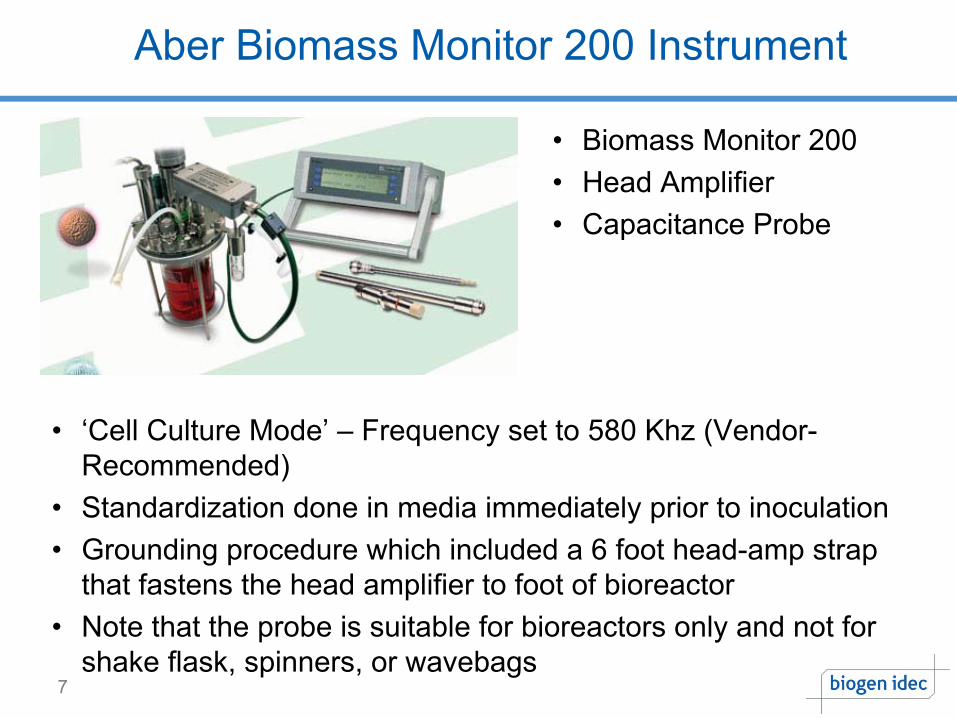
Aber Biomass Monitor 200 Instrument
7
• Biomass Monitor 200 • Head Amplifier• Capacitance Probe
• ‘Cell Culture Mode’ – Frequency set to 580 Khz (Vendor-Recommended)
• Standardization done in media immediately prior to inoculation• Grounding procedure which included a 6 foot head-amp strap
that fastens the head amplifier to foot of bioreactor• Note that the probe is suitable for bioreactors only and not for
shake flask, spinners, or wavebags
Implementation Strategy
8
• New processes evaluated in pilot & full-scale batches o Technical Development to determine feasibilityo Bench-scale experiments using capacitance probe o Pilot-scale, engineering and clinical batches can
provide opportunity to assess operational and scale-related issues
• Existing processes developed using off-line methodo Perform studies to correlate capacitance with offline
readings

Seed Train Transfers for Batch Process
9
• Fixed Time and Variable Transfer Volumeo Important to have accurate readings at end of
culture
• Variable Time and Full Transfer Volumeo Project target transfer time by leveraging growth
rate calculation using two time points during the ‘n-1’ process
• Variable Time and Partial Transfer Volumeo Hybrid of the first and second types
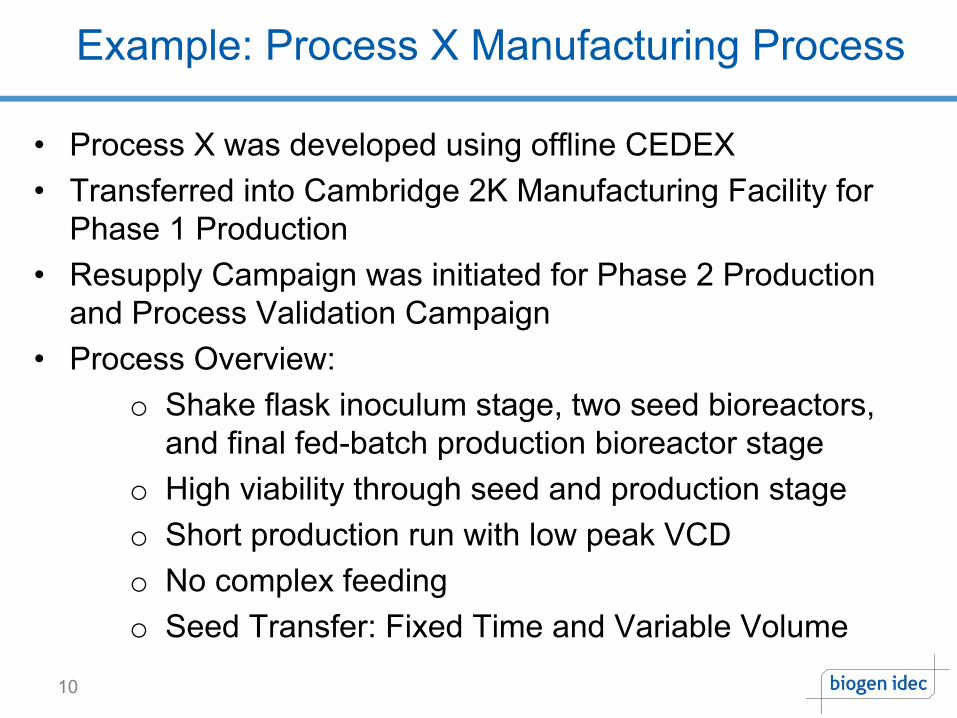
Example: Process X Manufacturing Process
10
• Process X was developed using offline CEDEX• Transferred into Cambridge 2K Manufacturing Facility for
Phase 1 Production• Resupply Campaign was initiated for Phase 2 Production
and Process Validation Campaign • Process Overview:
o Shake flask inoculum stage, two seed bioreactors, and final fed-batch production bioreactor stage
o High viability through seed and production stageo Short production run with low peak VCDo No complex feedingo Seed Transfer: Fixed Time and Variable Volume
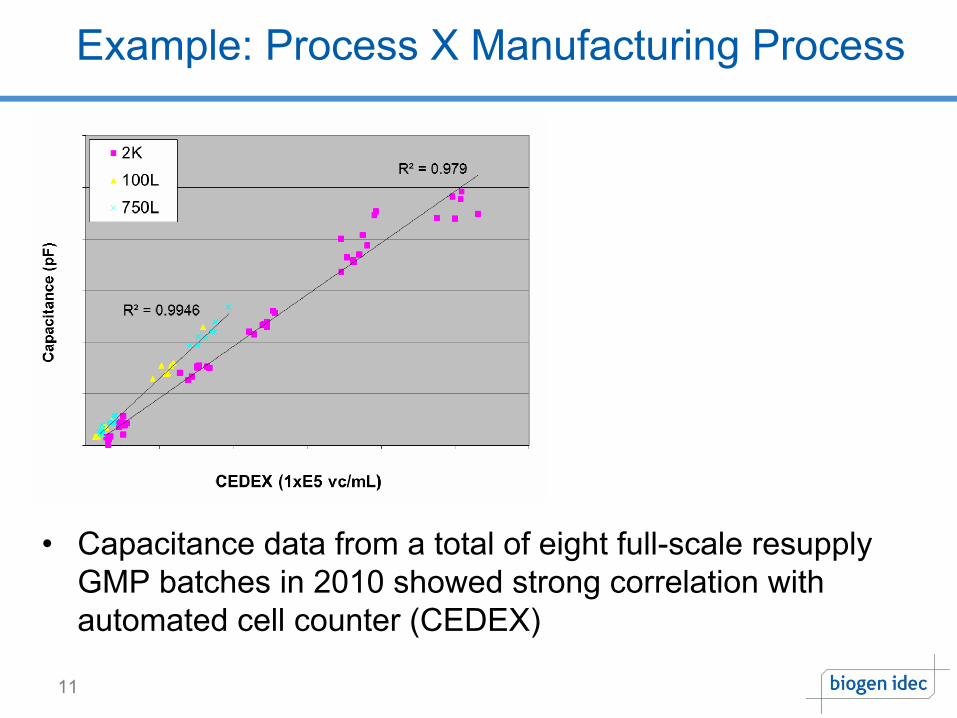
Example: Process X Manufacturing Process
11
• Capacitance data from a total of eight full-scale resupply GMP batches in 2010 showed strong correlation with automated cell counter (CEDEX)
Example: Process X Manufacturing Process
12
• Methods for measuring VCD were not filed• Viability measurements were stated in the filing only at the
inoculum and production stage• Due to high viabilities demonstrated in clinical batches,
discontinuation of viability measurements pose minimal risk to product quality and process performance
• Proposed maintenance of viability measurements throughout the inoculum shake flask stage (using CEDEX) and a final viability measurement at end of production bioreactor (harvest)
Implementation Strategy for Process X
13
• Track VCD (vc/mL) of culture using a simple linear regression model that relates capacitance to VCD
o One equation for 100L & 750Lo Different equation for 2K
• Created report justifying use of the capacitance probe:1. State probe as equivalent VCD measuring device2. Analysis of Fit and Summary of Equations3. Automation & Engineering Decisions4. Details of Process Monitoring and Risk Mitigation
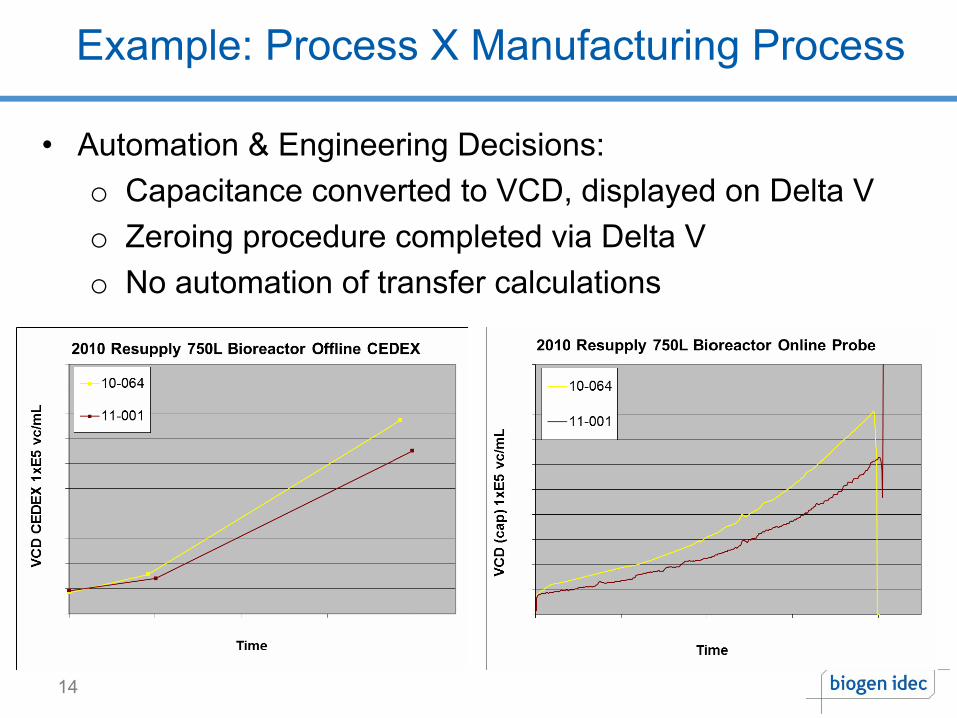
Example: Process X Manufacturing Process
14
• Automation & Engineering Decisions:o Capacitance converted to VCD, displayed on Delta V o Zeroing procedure completed via Delta Vo No automation of transfer calculations
Example: Process X Manufacturing Process
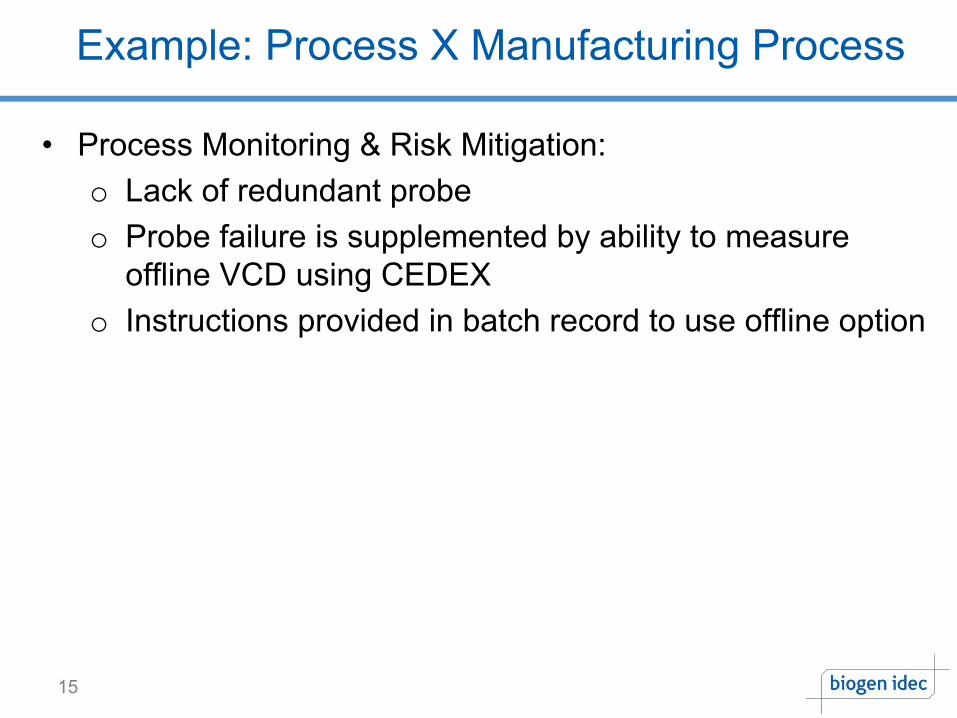
15
• Process Monitoring & Risk Mitigation:o Lack of redundant probeo Probe failure is supplemented by ability to measure
offline VCD using CEDEX o Instructions provided in batch record to use offline option
Example: Process X Manufacturing Process
16
0
10
20
30
40
50
60
70
80
90
100
0.0 0.5 1.0 1.5 2.0 2.5 3.0 3.5 4.0 4.5 5.0 5.5 6.0
VC
D (v
c/m
L)_T
1
Days2000L (smoothed and shifted)
FVIII_2000L_T1_COMv1 - Unitgroup ., Unit -, Sub-Batch _, M1VCD (vc/mL)_T1 +3 std. dev.
Average Batch-3 std. dev.RECD19052-13-003
M1
SIMCA-Batch On-Line Client 3.4.0.3 - 2013-08-05 10:53:11 (UTC-5)
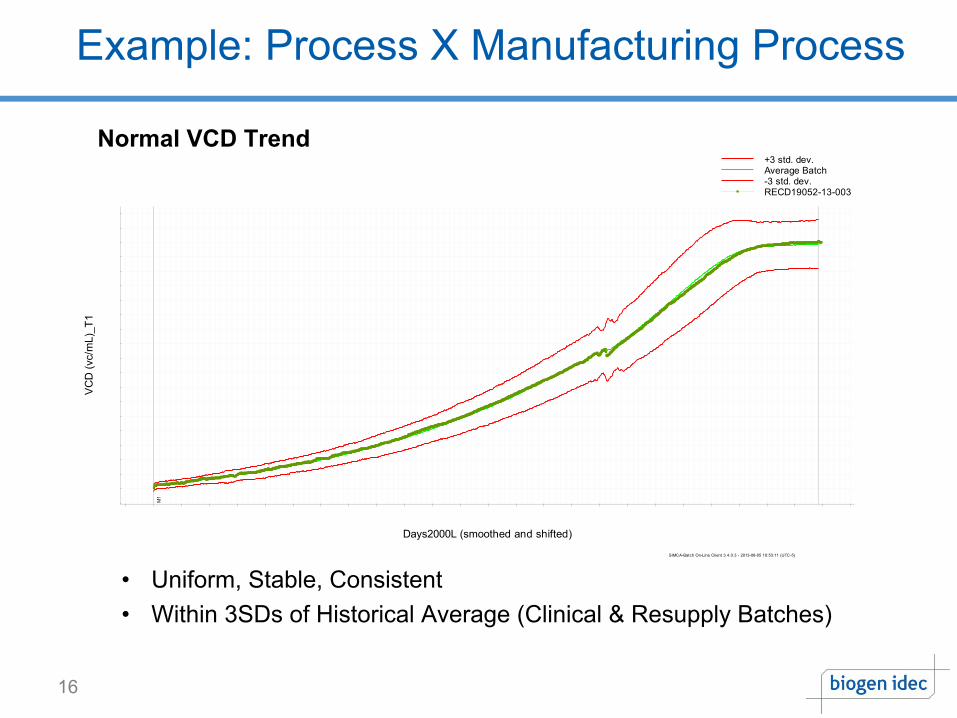
Normal VCD Trend
• Uniform, Stable, Consistent• Within 3SDs of Historical Average (Clinical & Resupply Batches)
Example: Process X Manufacturing Process
17
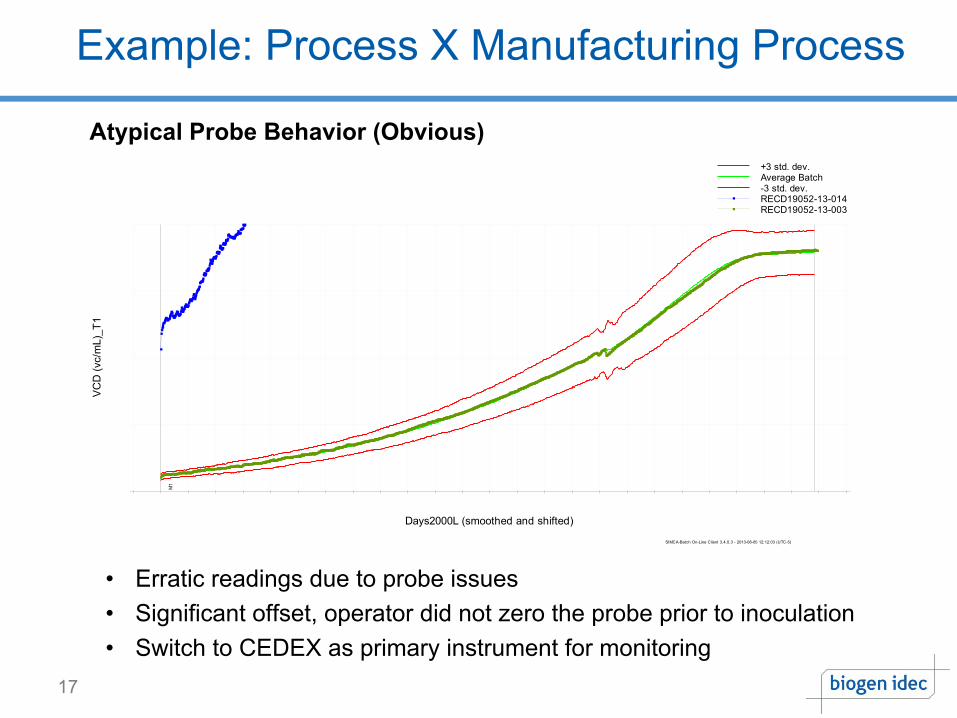
Atypical Probe Behavior (Obvious)
0
10
20
30
40
50
60
70
80
90
100
0.0 0.5 1.0 1.5 2.0 2.5 3.0 3.5 4.0 4.5 5.0 5.5 6.0
VC
D (v
c/m
L)_T
1
Days2000L (smoothed and shifted)
FVIII_2000L_T1_COMv1 - Unitgroup ., Unit -, Sub-Batch _, M1VCD (vc/mL)_T1 +3 std. dev.
Average Batch-3 std. dev.RECD19052-13-014RECD19052-13-003
M1
SIMCA-Batch On-Line Client 3.4.0.3 - 2013-08-05 12:12:03 (UTC-5)
• Erratic readings due to probe issues• Significant offset, operator did not zero the probe prior to inoculation• Switch to CEDEX as primary instrument for monitoring

Example: Process X Manufacturing Process
18
Atypical Probe Behavior (Non-Obvious)
• Non-Routine Offline CEDEX Sample on Day 0 and 1 to confirm results • Seed density confirmed low, probe results comparable to CEDEX• Continued to use probe as primary instrument for monitoring
0
10
20
30
40
50
60
70
80
90
100
0.0 0.5 1.0 1.5 2.0 2.5 3.0 3.5 4.0 4.5 5.0 5.5 6.0
VCD
(vc/
mL)
_T1
Days2000L (smoothed and shifted)
FVIII_2000L_T1_COMv1 - Unitgroup ., Unit -, Sub-Batch _, M1VCD (vc/mL)_T1 +3 std. dev.
Average Batch-3 std. dev.RECD19052-12-186
M1
SIMCA-Batch On-Line Client 3.4.0.3 - 2013-08-05 11:13:12 (UTC-5)
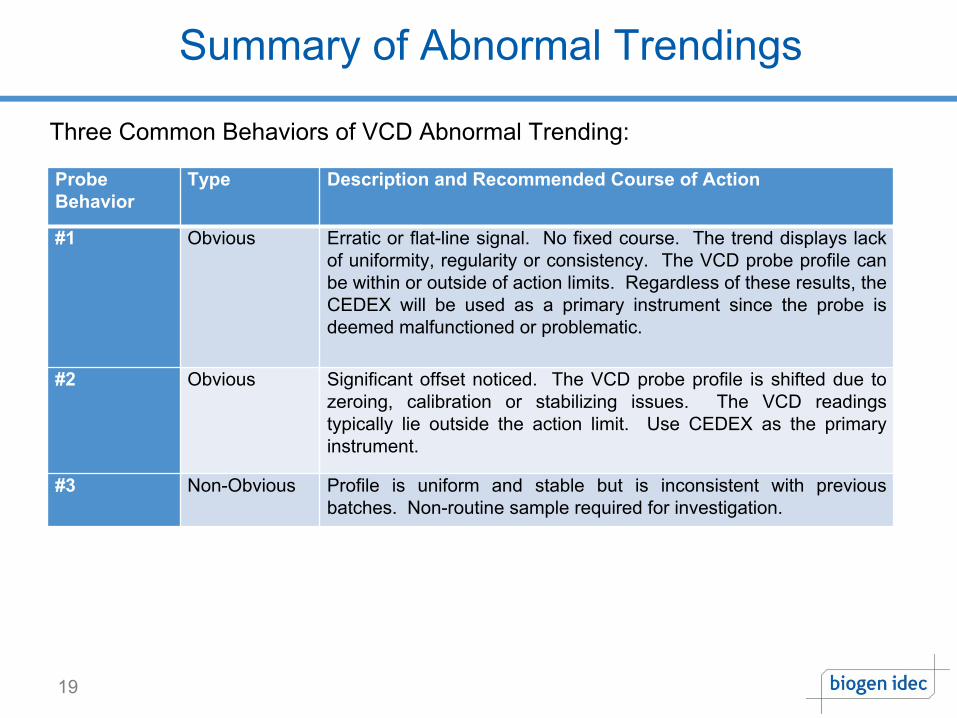
Summary of Abnormal Trendings
19
Probe Behavior
Type Description and Recommended Course of Action
#1 Obvious Erratic or flat-line signal. No fixed course. The trend displays lack of uniformity, regularity or consistency. The VCD probe profile can be within or outside of action limits. Regardless of these results, the CEDEX will be used as a primary instrument since the probe is deemed malfunctioned or problematic.
#2 Obvious Significant offset noticed. The VCD probe profile is shifted due to zeroing, calibration or stabilizing issues. The VCD readings typically lie outside the action limit. Use CEDEX as the primary instrument.
#3 Non-Obvious Profile is uniform and stable but is inconsistent with previous batches. Non-routine sample required for investigation.
Three Common Behaviors of VCD Abnormal Trending:
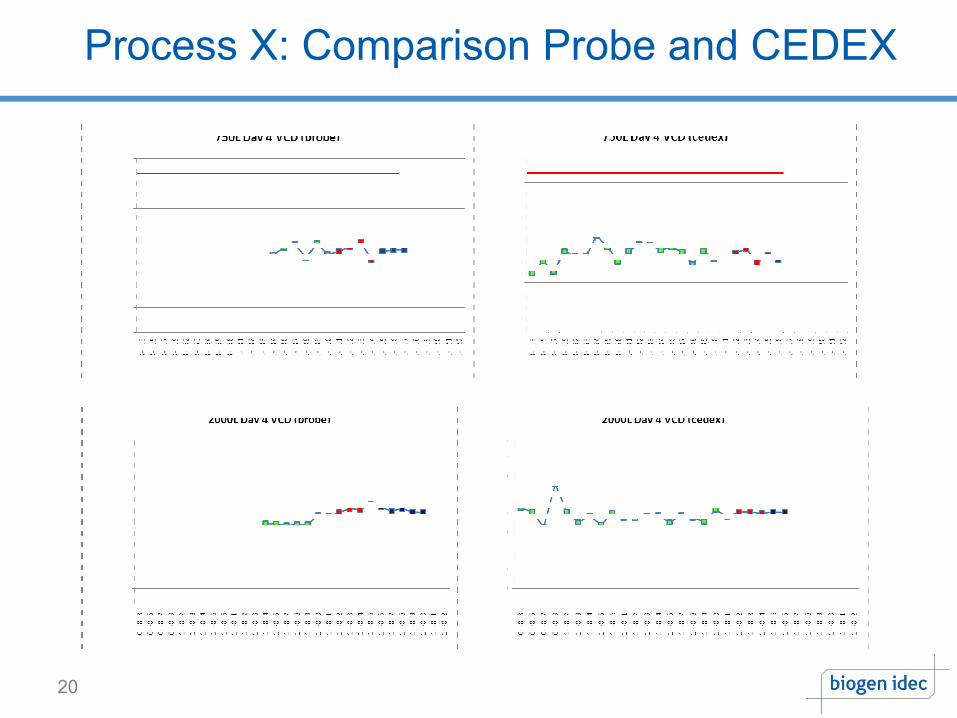
Process X: Comparison Probe and CEDEX
20
Summary: Process X Manufacturing Process
21
• Capacitance showed consistency and comparability with offline CEDEX
• Probe performance during PVR and commercial batches were good
• Created a risk mitigation strategy and identified common atypical VCD trends and proposed course of action

Acknowledgements
22
• Mark Byers (Manufacturing Sciences)• Jeff Simeone (Manufacturing Sciences)• Sriram Ramakrishnan (Manufacturing Sciences)• John Jewett (Manufacturing)• Matt Leprohon (Manufacturing)• James Sur (Manufacturing)• David Winters (Automation)• Barbara Woppmann (Technical Development)• Valerie Tsang (Technical Development)• Mitch Bennett (Quality)• Elijah Tan (Regulatory)


![Permittivity Measurements using coaxial probes ... · Figure 4: Equivalent open-ended coaxial line circuit [5] Where C is the capacitance between the internal and external wire out](https://img.pdfslide.us/doc/110x75/5d4eb56c88c9934b5e8bd004/permittivity-measurements-using-coaxial-probes-figure-4-equivalent-open-ended.jpg)