Embed Size (px)
Citation preview
RPIC – FCS Workshop: April 14-16, 2014 Ottawa
Implementation of a Thin Layer Cap on Lake Superior in Marathon, Ontario
David Wilson: AECOM
Implementation of a Thin Layer Cap on Lake Superior in Marathon, Ontario
David Wilson: AECOM Nicholas Rudolfo: AECOM Bruce Noble: AECOM John Lally: Lally Consulting Ronald Hewitt: Public Works and Government Services Canada Kay Kim: Environment Canada Barry Grover: Milestone Environmental
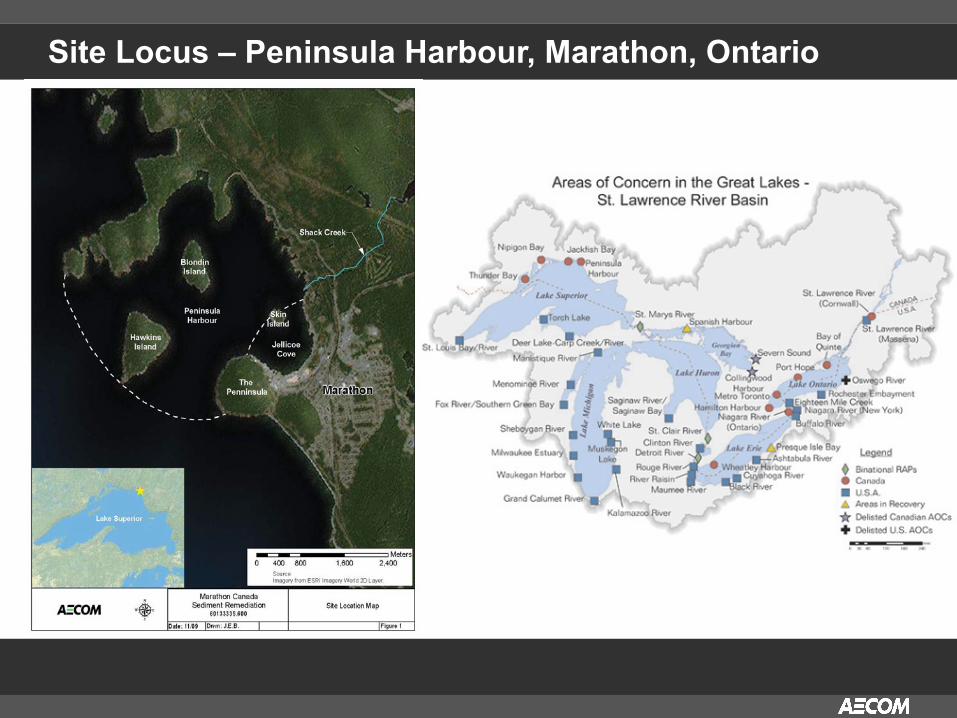
Site Locus – Peninsula Harbour, Marathon, Ontario

History
• Marathon renaissance in 1946 with construction of Marathon Pulp and Paper - Town motto: “Built on paper, laced with gold”
• Bleached kraft pulp mill which operated on the shores of Jellicoe Cove from 1946 until 2009
• Principal discharges resulted from untreated pulp mill effluent and treated effluent from a chlor-alkali plant which operated from 1977 to 1984
• Marathon Pulp and Paper filed for bankruptcy in 2009 and ceased operation
• Investigations dating back to 1980 have measured elevated mercury and PCBs in Cove sediments

Extent of Contamination & Regulatory Action • Identified as an Area of Concern (AOC) in
1985 by the Water Quality Board of the International Joint Commission
• 1991 – 2008: RAP, Feasibility, ERA & SMO
• Hg in sediment in Jellicoe Cove is elevated with higher concentrations at depth.
• Erosion possible during storm events, but under most scenarios sediments are stable.
• Net accumulation of sediments in Jellicoe Cove is low.
• Sediments not toxic to benthic organisms, but affect upper trophic community including reproductive success of bottom feeding fish

Sediment Management Options – Selected Alternative
• Options considered included dredging and capping alternatives
• Presence of higher levels of contamination at depth and risk of resuspension were concerns with dredge options
• ERA/SMO predicted natural recovery of site in ~ 70 yrs
• Thin layer sand cap provided ability to achieve adequate risk reduction and to provide enhanced natural recovery of the site
• Prescribed remedy is placement of 15 - 20 cm layer of clean sand over defined contaminated “hot spots”

Geotechnical Assessment

Geotechnical Parameters of Lakebed Sediment Parameter Characteristic
Value Remarks
Water Content, w 40% Average
Liquid Limit, LL 24% Average
Plasticity Index, PI 0 (non-plastic) ≤ 10%, but generally zero
Specific Gravity, G 2.69 Average
Void Ratio, e0 1.1 Average
Organic Content 4.7% Surficial sediments only; deeper sediments are inorganic.
Percent Silt Sized Particles 55% Average (< 0.075 mm; > 0.005 mm)
Percent Clay Sized Particles 12% Average (< 0.005 mm)
D85 Size 0.12 mm Average
Unit Weight (Saturated) 17.8 kN/m3 (113 pcf) Average. Assumes G = 2.69
Pre-consolidation Stress N/A Assume normally consolidated
Compression Index, Cc 0.40 Correlation with water content (Holtz & Kovacs 1981)
Coefficient of Consolidation, cv 18.9 m2/year (203 ft2/year) Correlation with Liquid Limit (Holtz & Kovacs 1981)
Drained Friction Angle, φ 27 degrees Correlation with PI and USC system (Holtz & Kovacs 1981)
Undrained Shear Strength, c c/p = 0.22 Correlation with effective overburden pressure, p(Holtz & Kovacs, 1981)
• Soft native sediments support the cap. • Compression of sediments from cap's weight will be ~25% to 33% of cap thickness. • Cap settlement estimated to be substantially complete in 13 months. • Transition zones provided near the edges of the cap for stability.

Cap Coverage, Stability, and Gradation Requirements
• 15-20 cm of medium to coarse sand able to withstand storm events and prevailing currents
• Flow velocities at the lake bottom due to storm waves estimated at 0.44 m/s at the western side of the cap area, 0.22 at the center of the cap area, and 0.09 at the eastern side of the cap area.
Medium sand
Coarse sand
Size % passing % passing
25 mm 100 100
12 mm 100 90-100
#10 sieve 50-80 20-45
#40 sieve 10-40 0-10
#100 sieve <10 <10
#200 sieve <6 <6
Uniformity coefficient <8 <8
Plasticity (fine fraction) non-plastic non-plastic
D50 mm 0.5 2.25
Specific Gravity <2.64 <2.64

Design Layout
SL11-001

Design & Specification Considerations – Cap Thickness
Page 10
• Test plots constructed at operations start-up to monitor effectiveness of placement operations across range of site conditions
• Core samples extracted to measure cap thickness, sediment/cap material mixing
• Secondary cap thickness verification through use of volumetric placement data
• Resultant data used to confirm effectiveness of placement methodologies and performance criteria

Design & Specification Considerations – Key Issues
Page 11
• Schedule: Defined work window limited to May – August due to fisheries restrictions
• Sourcing of two grades of sand – variable sources
• Placement sequencing adaptation to progress, weather, mechanical issues
• Space limited and third party controlled staging area
• Water quality controls vs. sand placement productivity in defined schedule window

Design Considerations - Construction Monitoring Plan
• Measurements performed using boat-based nephelometer with direct turbidity readout (also monitor temperature, specific conductance and DO with depth) – Turbidity an analogue for TSS
• Measurements made at baseline, initial intensive, standard conditions and any change therein
• During intensive conditions water sample collection and analysis for SS, total Hg and PCBs conducted
• Monitoring control limit set at 100m from point of operation
• Preliminary actionable level is set at 25 NTU above baseline or background condition with 50 NTU as hard limit
• Selected near shore areas prescribed for additional protection ( silt curtains)

Construction Schedule and Approach • Construction Tender by PWGSC: March 2012 • Construction Award: May 2012 to Milestone
Environmental Contracting • Mobilization and site prep: May 2012 • Construction Start: June 2012 – test cell first week of
June; Construction Completion: August 5, 2012 • Medium Sand sourced locally – Coarse sand shipped
from remote • Mechanical Placement:
– Long reach excavator (Sennebogen) with 2 m3 bucket on spudded capping barge
– Supported by material barge – Tug supported navigation and landing craft for personnel
transport – RTK GPS and DREDGEPAK Electronic positioning
Page 13

Implementation – Key Issues
Page 14
• Water Quality Monitoring/Control • Cap Thickness Verification • Production Rate within schedule,
mechanical, weather and water quality constraints

Water Quality Control During Sand Placement
• No water quality related work stoppages • Turbidity to TSS relationship adequate for construction water quality control • Effective sand placement approach and cell sequencing derived from test phase

Cap Thickness Verification – Piston Coring

Sand Cap Thickness Verification
• 5 cores per hectare • Average thickness
per cell (15 cm / 20 cm medium / coarse)
• Individual core max and min (30 cm / 10 cm)
• Secondary verification using ullages from barges

Capping Production
Page 18
• Average Production Rate: ~4,600 m2/day; ~ 930 m3/day over 48 production days @ 12 hours/day
• Capping completed 25 days ahead of schedule;
• Additional capping area completed within existing project budgets/timeframes;
• No weather or water quality control related work stoppages;

Record of Cap Progress and Completion
• Sequencing of cells by sand grade and water column depth
• Completion of additional ~ 30,000 m2
• Adaptability to weather, water quality, mechanical factors
• Strong Owner, Resident Engineer, Contractor relationship and cooperation

Post - Construction Monitoring Plan – Long Term
• Assess the physical stability of the placed thin layer cap
• Compare fish tissue concentrations of mercury and PCBs from the Peninsula Harbour AOC with those of suitable reference areas
• Compare sediment concentrations of mercury and PCBs in the thin cap and natural recovery areas within the AOC with suitable reference areas
• Compare the benthic community structure in the thin cap and natural recovery areas within the AOC with suitable reference areas
• Compare benthic macroinvertebrate tissue concentrations of mercury and PCBs from the AOC with those of suitable reference areas
• Evaluate temporal trends in sediment concentrations and fish and benthic macroinvertebrate tissue concentrations of mercury and PCBs in the thin cap and natural recovery areas of the AOC

David Wilson - AECOM Federal Contaminated Sites Lead 905 477 8400 x385 [email protected]
Questions?
Thank You
Ronald Hewitt, P.Eng. (PWGSC, Toronto, Ontario) Kay Kim (Environment Canada,
Toronto, Ontario)
John Lally, P,E. (Lally Consulting, Seattle, WA) [email protected]
Barry Grover/Mark Seaman
(Milestone Environmental Contracting Inc., Ottawa, Ontario)