Embed Size (px)
Citation preview
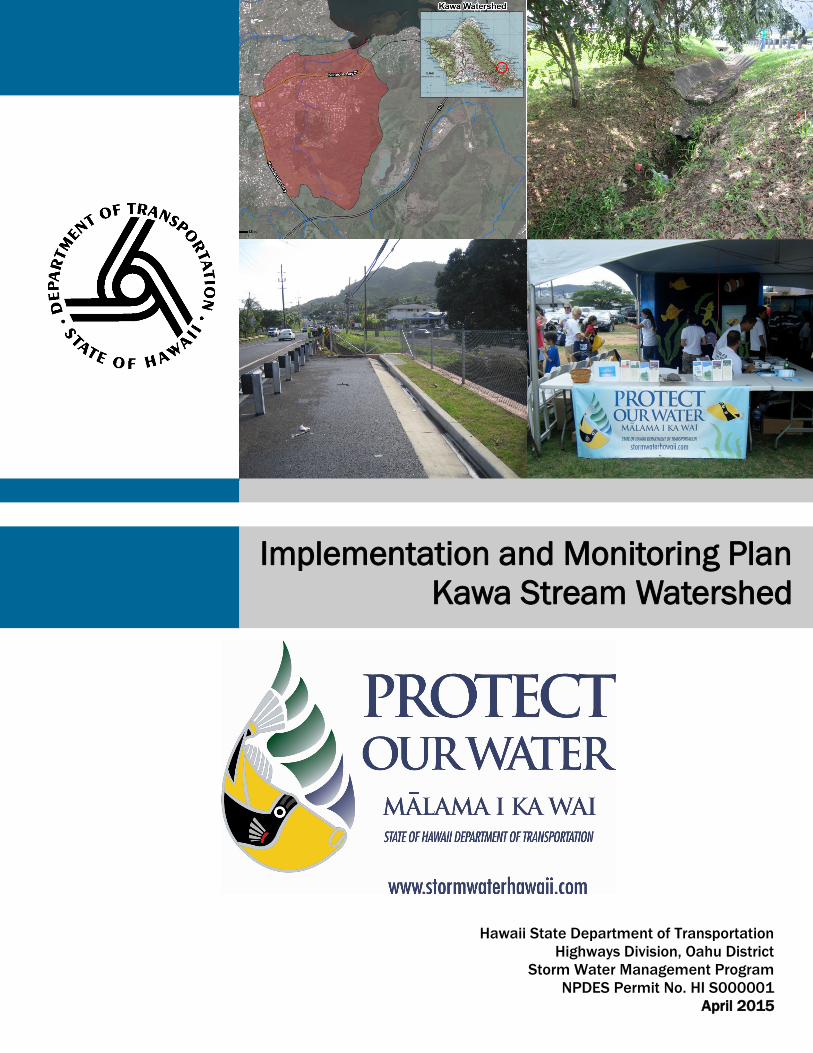
Hawaii State Department of Transportation
Highways Division, Oahu District
Storm Water Management Program
NPDES Permit No. HI S000001
April 2015
Implementation and Monitoring Plan
Kawa Stream Watershed

This page intentionally left blank.
Total Maximum Daily Load
Implementation and Monitoring Plan
Kawa Stream Watershed Waste Load Allocations
State of Hawaii Department of Transportation
Highways Division, Oahu District
April 2015
Version: Final
I&M Plan for Kawa Stream Watershed
State of Hawaii Department of Transportation, Highways Division, Oahu District
April 2015 i
This page intentionally left blank.
I&M Plan for Kawa Stream Watershed
State of Hawaii Department of Transportation, Highways Division, Oahu District
April 2015 ii
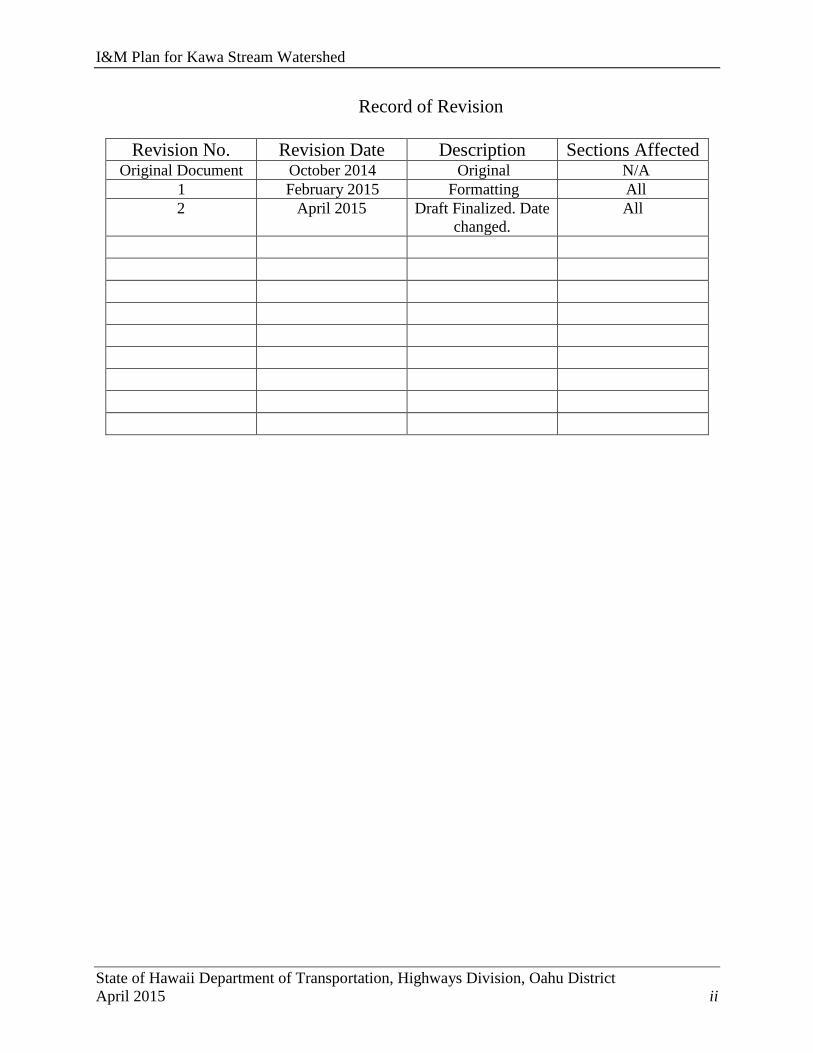
Record of Revision
Revision No. Revision Date Description Sections Affected Original Document October 2014 Original N/A
1 February 2015 Formatting All
2 April 2015 Draft Finalized. Date
changed.
All

I&M Plan for Kawa Stream Watershed
State of Hawaii Department of Transportation, Highways Division, Oahu District
April 2015 iii
This page intentionally left blank.
I&M Plan for Kawa Stream Watershed
State of Hawaii Department of Transportation, Highways Division, Oahu District
April 2015 iv
TABLE OF CONTENTS
LIST OF FIGURES ..................................................................................................................... vi
LIST OF TABLES ...................................................................................................................... vii
ACRONYMS AND ABBREVIATIONS .................................................................................. viii
REFERENCES ............................................................................................................................. ix
EXECUTIVE SUMMARY .................................................................................................... ES-1
1. SUMMARY OF TOTAL MAXIMUM DAILY LOAD AND WASTE LOAD
ALLOCATION REDUCTIONS ASSIGNED ................................................................... 1-1
1.1 TMDL for Kawa Stream ............................................................................................ 1-4
1.2 DOT-HWYS’ WLA Reductions for Kawa Stream ................................................... 1-7
2. DOT-HWYS’ STORM WATER MANAGEMENT PROGRAM ACTIVITIES .......... 2-1
2.1 Street Sweeping (Debris Control Program) ............................................................... 2-1
2.2 Cleaning of MS4 Structures (Debris Control Program) ............................................ 2-2
2.3 PBMPs ....................................................................................................................... 2-2
2.4 Erosion Control Program ........................................................................................... 2-3
2.5 Construction Site Runoff Control Program ............................................................... 2-4
2.6 Industrial and Commercial Activities Discharge Management (IC Program) &
Illicit Discharge Detection and Elimination (IDDE Program) .................................. 2-4
2.7 Public Education and Outreach Program ................................................................... 2-5
3. QUANTITATIVE ANALYSIS OF PROPOSED ACTIVITIES IN KAWA
STREAM WATERSHED ................................................................................................... 3-1
3.1 Street Sweeping in Kawa Stream Watershed............................................................. 3-1
3.1.1 Data on Street Sweeping Operations ............................................................. 3-1
3.1.2 Literature Data on Concentrations of Nutrients and Suspended Solids
per Kg of Debris Collected ............................................................................ 3-2
3.2 Cleaning of MS4 Structures in Kawa Stream Watershed .......................................... 3-4
3.3 PBMPs in Kawa Stream Watershed .......................................................................... 3-6
3.3.1 Reduction Calculations .................................................................................. 3-6
3.3.2 Literature Data on Pollutant Removal Efficiencies for Selected PBMPs ...... 3-6
3.4 Erosion Control Program in Kawa Stream Watershed .............................................. 3-9
I&M Plan for Kawa Stream Watershed
State of Hawaii Department of Transportation, Highways Division, Oahu District
April 2015 v
3.5 Construction Site Runoff Control Program Activities in Kawa Stream
Watershed ................................................................................................................ 3-10
3.6 Industrial and Commercial Activities Discharge Management (IC Program) and
Illicit Discharge Detection and Elimination (IDDE Program) in Kawa Stream
Watershed ................................................................................................................ 3-10
3.7 Public Education and Outreach in Kawa Stream Watershed ................................... 3-10
3.8 Summary of Anticipated Annual Load Reductions in Kawa Stream Watershed .... 3-11
4. MONITORING PLAN ........................................................................................................ 4-1
4.1 Street Sweeping and MS4 Cleaning .......................................................................... 4-1
4.2 PBMPs ....................................................................................................................... 4-1
4.3 Other BMP Programs ................................................................................................. 4-1
4.4 Overall Compliance Reportin .................................................................................... 4-1
I&M Plan for Kawa Stream Watershed
State of Hawaii Department of Transportation, Highways Division, Oahu District
April 2015 vi
LIST OF FIGURES
Figure Title Page
Figure 1-1. Kawa Stream Watershed Map ................................................................. 1-5
Figure 3-1. Cubic yards of street sweeping debris collected in Kawa Stream
Watershed, 2009-2013 ............................................................................. 3-2
Figure 3-2. Cubic yards of debris removed from inlets and manholes in Kawa
Stream Watershed, 2009-2013 ................................................................. 3-4
Figure 3-3. Identified PBMP Sites in Kawa Stream Watershed ................................. 3-8
I&M Plan for Kawa Stream Watershed
State of Hawaii Department of Transportation, Highways Division, Oahu District
April 2015 vii
LIST OF TABLES
Table Title Page
Table ES-1. Anticipated Annual Pollutant Load Reduction for TMDL
Compliance ............................................................................................ES-2
Table 1-1. Permit Requirements and Corresponding Plan Sections ......................... 1-2
Table 1-2. Schedule of Compliance for Kawa Stream Watershed ............................ 1-3
Table 1-3. Kawa Stream Watershed WLA Reductions - Permit Part F.3.b.(2) ........ 1-7
Table 3-1. Conversion Calculations for TN Removal through Street Sweeping
Operations ................................................................................................ 3-3
Table 3-2. Conversion Calculations for TP Removal through Street Sweeping
Operations ................................................................................................ 3-3
Table 3-3. Conversion Calculations for TSS Removal through Street Sweeping
Operations ................................................................................................ 3-3
Table 3-4. Conversion Calculations for TN Removal through Cleaning of Inlets
and Manholes ........................................................................................... 3-5
Table 3-5. Conversion Calculations for TP Removal through Cleaning of Inlets
and Manholes ........................................................................................... 3-5
Table 3-6. Conversion Calculations for TSS Removal through Cleaning of Inlets
and Manholes ........................................................................................... 3-5
Table 3-7. Literature Data on Pollutant Removal Efficiencies for Selected
PBMPs ..................................................................................................... 3-6
Table 3-8. PBMP Projects in Kawa Stream Watershed ............................................ 3-7
Table 3-9. Status of Identified Erosion Sites in Kawa Stream Watershed ................ 3-9
Table 3-10. Calculation of Additional Annual Pollutant Removal Due to
Increased Street Sweeping in Kawa Stream Watershed ........................ 3-11
Table 3-11. Anticipated Annual Pollutant Load Reduction for TMDL Compliance 3-12
I&M Plan for Kawa Stream Watershed
State of Hawaii Department of Transportation, Highways Division, Oahu District
April 2015 viii
ACRONYMS AND ABBREVIATIONS
BMP Best Management Practice
CM Curb mile
CY Cubic yard
DCA Debris Cleaning Assessment
DOH State of Hawaii Department of Health
DOT-HWYS State of Hawaii Department of Transportation, Highways Division, Oahu
District
EDOP Effective date of permit
EPA United States Environmental Protection Agency
HWY-OM DOT-HWYS Oahu District Maintenance Section
I&M Implementation & Monitoring
IC Program Industrial and Commercial Activities Discharge Management Program
IDDE Program Illicit Discharge Detection and Elimination Program
KG Kilograms
MEP Maximum Extent Practicable
MG Milligram
MS4 DOT-HWYS’ Municipal Separate Storm Sewer System
MS4 Permit DOT-HWYS’ NPDES Permit No. HI S000001
NPDES National Pollutant Discharge Elimination System
NSBB Nutrient separating baffle box
PID Point Identification Number
PBMPs Permanent Best Management Practices
PS&E Plans, Specifications & Estimates
ROW Right-of-way
SWMP Storm Water Management Program
SWMPP Storm Water Management Program Plan
TMDL Total Maximum Daily Load
TMK Tax map key
TN Total nitrogen
TP Total phosphorus
TSS Total suspended solids
WLA Waste load allocation
WQBEL Water quality based effluent limits
I&M Plan for Kawa Stream Watershed
State of Hawaii Department of Transportation, Highways Division, Oahu District
April 2015 ix
REFERENCES
Berretta, C., S. Saurabh and J.J. Sansalone (2011). Quantifying Nutrient Loads Associated With
Urban Particulate Matter (PM) and Biogenic/Litter Recovery Through Current MS4
Source Control and Maintenance Practices. Final Report to Florida Stormwater
Association Educational Foundation. 31 May.
Chesapeake Stormwater Network (2011). Nutrient Accounting Methods to Document Local
Stormwater Load Reductions in the Chesapeake Bay Watershed. CSN Technical Bulletin
No. 9. October. http://chesapeakestormwater.net/wp-
content/uploads/downloads/2012/03/TB-9-Nutrient-Accounting-FINAL-FINAL.pdf
EPA (1983). “Results of the Nationwide Urban Runoff Program, Volume 1 - Final Report,”
Environmental Protection Agency, Water Planning Division, Washington, DC, NTIS
PB84- 185552.
Giambelluca, T.W., Q. Chen, A.G. Frazier, J.P. Price, Y.-L. Chen, P.-S. Chu, J.K. Eischeid, and
D.M. Delparte (2012). Online Rainfall Atlas of Hawai‘i. Bull. Amer. Meteor. Soc., doi:
10.1175/BAMS-D-11-00228.1.
Government of Saskatchewan Ministry of Agriculture (2008). Composting Solid Manure.
http://www.agriculture.gov.sk.ca/composting_solid_manure.
Pitt, R., A. Maestre, and R. Morquecho (2003). “The National Stormwater Quality Database,”
NSQD version 1.0, University of Alabama and Center for Watershed Protection. (See
Table A-1, Urban Subwatershed Restoration Manual 1, Center for Watershed Protection).
Schueler, T. (1987). Controlling urban runoff: a practical manual for planning and designing
urban BMPs. Metropolitan Washington Council of Governments. Washington, DC.
Schueler, T., and H.K. Holland (2000). New Developments in Street Sweeper Technology
(Article 121). In: The Practice of Watershed Protection. Center for Watershed Protection,
Ellicott City, MD. 742 pp + appendices.
State of Oregon Department of Environmental Quality (2003). Biofilters (Bioswales, Vegetative
Buffers & Constructed Wetlands) For Storm Water Discharge Pollution Removal.
January. http://www.deq.state.or.us/wq/stormwater/docs/nwr/biofilters.pdf
SunTree Technologies, Inc. (2006). Nutrient Separating Baffle Box – Removal Efficiencies.
http://suntreetech.com/files/Documents/Products/Nutrient-Separating-Baffle-
Box/Reports/NSBB%20Removal%20Efficiencies.pdf
I&M Plan for Kawa Stream Watershed
State of Hawaii Department of Transportation, Highways Division, Oahu District
April 2015 ES-1
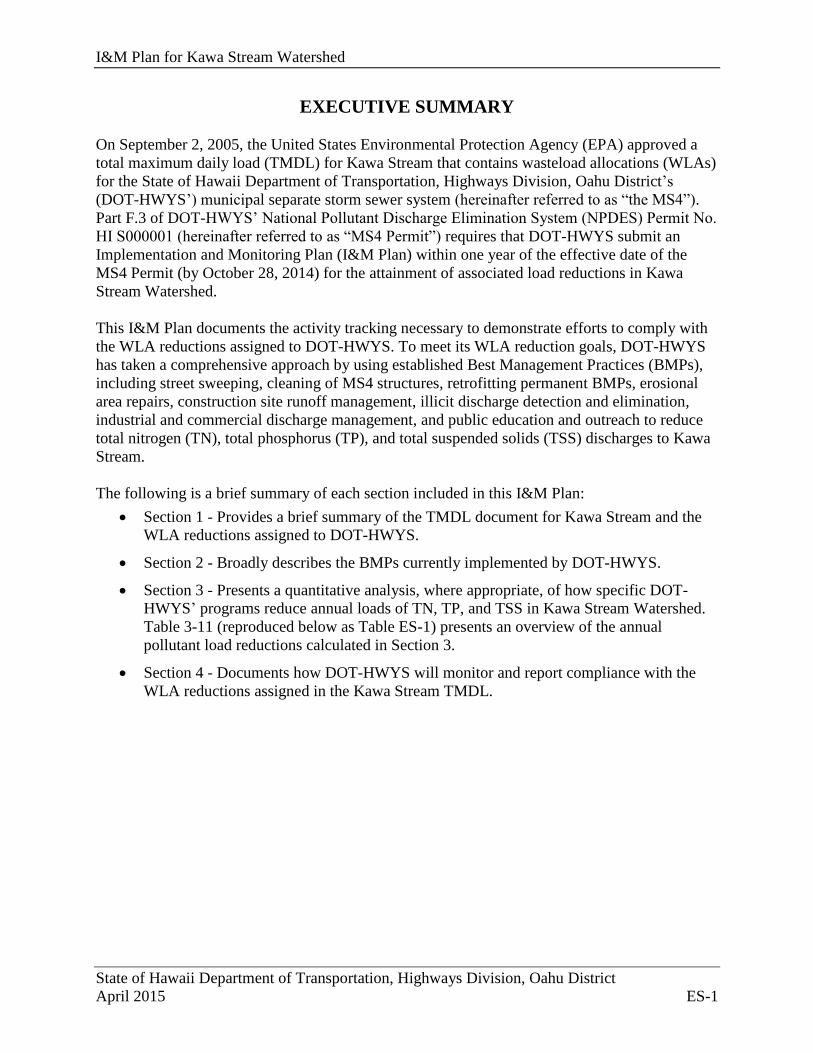
EXECUTIVE SUMMARY
On September 2, 2005, the United States Environmental Protection Agency (EPA) approved a
total maximum daily load (TMDL) for Kawa Stream that contains wasteload allocations (WLAs)
for the State of Hawaii Department of Transportation, Highways Division, Oahu District’s
(DOT-HWYS’) municipal separate storm sewer system (hereinafter referred to as “the MS4”).
Part F.3 of DOT-HWYS’ National Pollutant Discharge Elimination System (NPDES) Permit No.
HI S000001 (hereinafter referred to as “MS4 Permit”) requires that DOT-HWYS submit an
Implementation and Monitoring Plan (I&M Plan) within one year of the effective date of the
MS4 Permit (by October 28, 2014) for the attainment of associated load reductions in Kawa
Stream Watershed.
This I&M Plan documents the activity tracking necessary to demonstrate efforts to comply with
the WLA reductions assigned to DOT-HWYS. To meet its WLA reduction goals, DOT-HWYS
has taken a comprehensive approach by using established Best Management Practices (BMPs),
including street sweeping, cleaning of MS4 structures, retrofitting permanent BMPs, erosional
area repairs, construction site runoff management, illicit discharge detection and elimination,
industrial and commercial discharge management, and public education and outreach to reduce
total nitrogen (TN), total phosphorus (TP), and total suspended solids (TSS) discharges to Kawa
Stream.
The following is a brief summary of each section included in this I&M Plan:
Section 1 - Provides a brief summary of the TMDL document for Kawa Stream and the
WLA reductions assigned to DOT-HWYS.
Section 2 - Broadly describes the BMPs currently implemented by DOT-HWYS.
Section 3 - Presents a quantitative analysis, where appropriate, of how specific DOT-
HWYS’ programs reduce annual loads of TN, TP, and TSS in Kawa Stream Watershed.
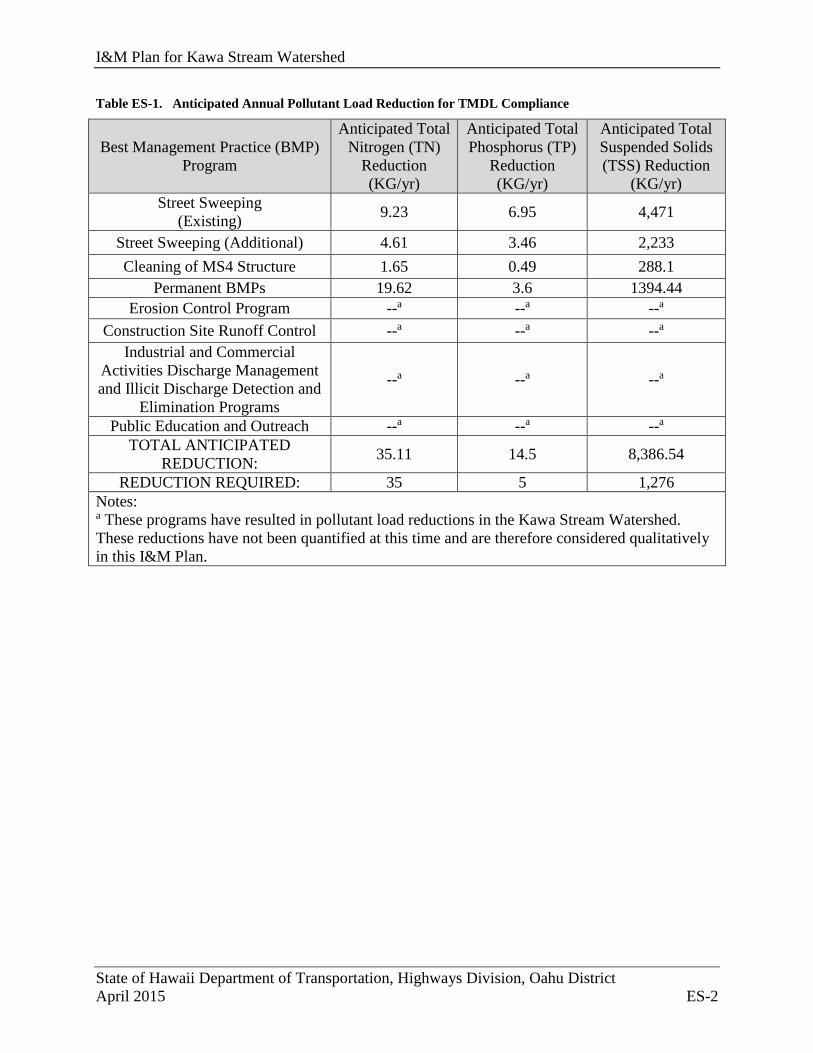
Table 3-11 (reproduced below as Table ES-1) presents an overview of the annual
pollutant load reductions calculated in Section 3.
Section 4 - Documents how DOT-HWYS will monitor and report compliance with the
WLA reductions assigned in the Kawa Stream TMDL.
I&M Plan for Kawa Stream Watershed
State of Hawaii Department of Transportation, Highways Division, Oahu District
April 2015 ES-2
Table ES-1. Anticipated Annual Pollutant Load Reduction for TMDL Compliance
Best Management Practice (BMP)
Program
Anticipated Total
Nitrogen (TN)
Reduction
(KG/yr)
Anticipated Total
Phosphorus (TP)
Reduction
(KG/yr)
Anticipated Total
Suspended Solids
(TSS) Reduction
(KG/yr)
Street Sweeping
(Existing) 9.23 6.95 4,471
Street Sweeping (Additional) 4.61 3.46 2,233
Cleaning of MS4 Structure 1.65 0.49 288.1
Permanent BMPs 19.62 3.6 1394.44
Erosion Control Program --a --a --a
Construction Site Runoff Control --a --a --a
Industrial and Commercial
Activities Discharge Management
and Illicit Discharge Detection and
Elimination Programs
--a --a --a
Public Education and Outreach --a --a --a
TOTAL ANTICIPATED
REDUCTION: 35.11 14.5 8,386.54
REDUCTION REQUIRED: 35 5 1,276
Notes: a These programs have resulted in pollutant load reductions in the Kawa Stream Watershed.
These reductions have not been quantified at this time and are therefore considered qualitatively
in this I&M Plan.
I&M Plan for Kawa Stream Watershed
State of Hawaii Department of Transportation, Highways Division, Oahu District
April 2015 1-1
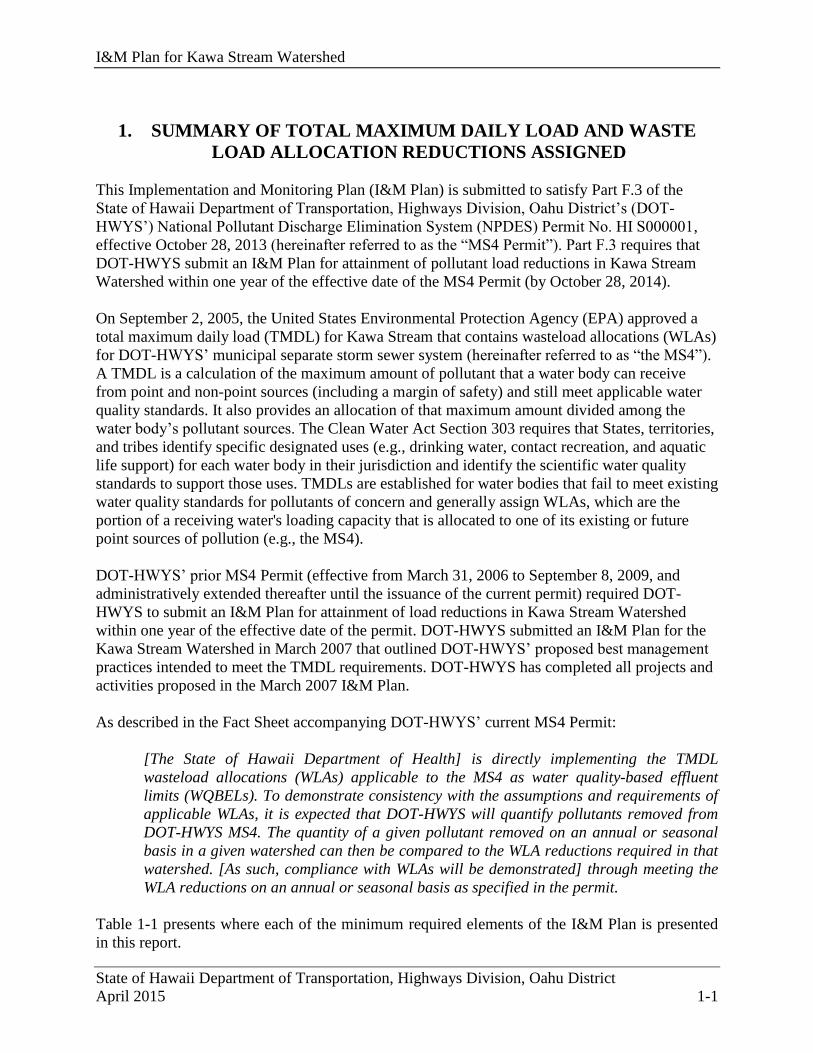
1. SUMMARY OF TOTAL MAXIMUM DAILY LOAD AND WASTE
LOAD ALLOCATION REDUCTIONS ASSIGNED
This Implementation and Monitoring Plan (I&M Plan) is submitted to satisfy Part F.3 of the
State of Hawaii Department of Transportation, Highways Division, Oahu District’s (DOT-
HWYS’) National Pollutant Discharge Elimination System (NPDES) Permit No. HI S000001,
effective October 28, 2013 (hereinafter referred to as the “MS4 Permit”). Part F.3 requires that
DOT-HWYS submit an I&M Plan for attainment of pollutant load reductions in Kawa Stream
Watershed within one year of the effective date of the MS4 Permit (by October 28, 2014).
On September 2, 2005, the United States Environmental Protection Agency (EPA) approved a
total maximum daily load (TMDL) for Kawa Stream that contains wasteload allocations (WLAs)
for DOT-HWYS’ municipal separate storm sewer system (hereinafter referred to as “the MS4”).
A TMDL is a calculation of the maximum amount of pollutant that a water body can receive
from point and non-point sources (including a margin of safety) and still meet applicable water
quality standards. It also provides an allocation of that maximum amount divided among the
water body’s pollutant sources. The Clean Water Act Section 303 requires that States, territories,
and tribes identify specific designated uses (e.g., drinking water, contact recreation, and aquatic
life support) for each water body in their jurisdiction and identify the scientific water quality
standards to support those uses. TMDLs are established for water bodies that fail to meet existing
water quality standards for pollutants of concern and generally assign WLAs, which are the
portion of a receiving water's loading capacity that is allocated to one of its existing or future
point sources of pollution (e.g., the MS4).
DOT-HWYS’ prior MS4 Permit (effective from March 31, 2006 to September 8, 2009, and
administratively extended thereafter until the issuance of the current permit) required DOT-
HWYS to submit an I&M Plan for attainment of load reductions in Kawa Stream Watershed
within one year of the effective date of the permit. DOT-HWYS submitted an I&M Plan for the
Kawa Stream Watershed in March 2007 that outlined DOT-HWYS’ proposed best management
practices intended to meet the TMDL requirements. DOT-HWYS has completed all projects and
activities proposed in the March 2007 I&M Plan.
As described in the Fact Sheet accompanying DOT-HWYS’ current MS4 Permit:
[The State of Hawaii Department of Health] is directly implementing the TMDL
wasteload allocations (WLAs) applicable to the MS4 as water quality-based effluent
limits (WQBELs). To demonstrate consistency with the assumptions and requirements of
applicable WLAs, it is expected that DOT-HWYS will quantify pollutants removed from
DOT-HWYS MS4. The quantity of a given pollutant removed on an annual or seasonal
basis in a given watershed can then be compared to the WLA reductions required in that
watershed. [As such, compliance with WLAs will be demonstrated] through meeting the
WLA reductions on an annual or seasonal basis as specified in the permit.
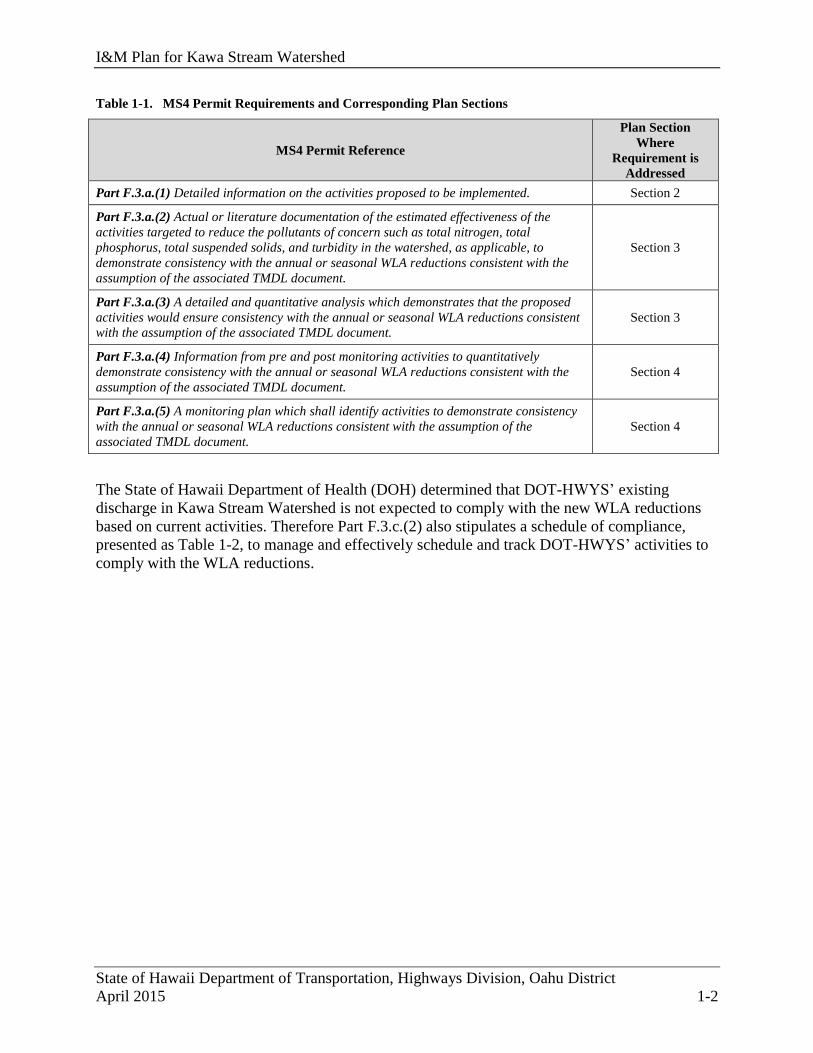
Table 1-1 presents where each of the minimum required elements of the I&M Plan is presented
in this report.
I&M Plan for Kawa Stream Watershed
State of Hawaii Department of Transportation, Highways Division, Oahu District
April 2015 1-2
Table 1-1. MS4 Permit Requirements and Corresponding Plan Sections
MS4 Permit Reference
Plan Section
Where
Requirement is
Addressed
Part F.3.a.(1) Detailed information on the activities proposed to be implemented. Section 2
Part F.3.a.(2) Actual or literature documentation of the estimated effectiveness of the
activities targeted to reduce the pollutants of concern such as total nitrogen, total
phosphorus, total suspended solids, and turbidity in the watershed, as applicable, to
demonstrate consistency with the annual or seasonal WLA reductions consistent with the
assumption of the associated TMDL document.
Section 3
Part F.3.a.(3) A detailed and quantitative analysis which demonstrates that the proposed
activities would ensure consistency with the annual or seasonal WLA reductions consistent
with the assumption of the associated TMDL document.
Section 3
Part F.3.a.(4) Information from pre and post monitoring activities to quantitatively
demonstrate consistency with the annual or seasonal WLA reductions consistent with the
assumption of the associated TMDL document.
Section 4
Part F.3.a.(5) A monitoring plan which shall identify activities to demonstrate consistency
with the annual or seasonal WLA reductions consistent with the assumption of the
associated TMDL document.
Section 4
The State of Hawaii Department of Health (DOH) determined that DOT-HWYS’ existing
discharge in Kawa Stream Watershed is not expected to comply with the new WLA reductions
based on current activities. Therefore Part F.3.c.(2) also stipulates a schedule of compliance,
presented as Table 1-2, to manage and effectively schedule and track DOT-HWYS’ activities to
comply with the WLA reductions.
I&M Plan for Kawa Stream Watershed
State of Hawaii Department of Transportation, Highways Division, Oahu District
April 2015 1-3
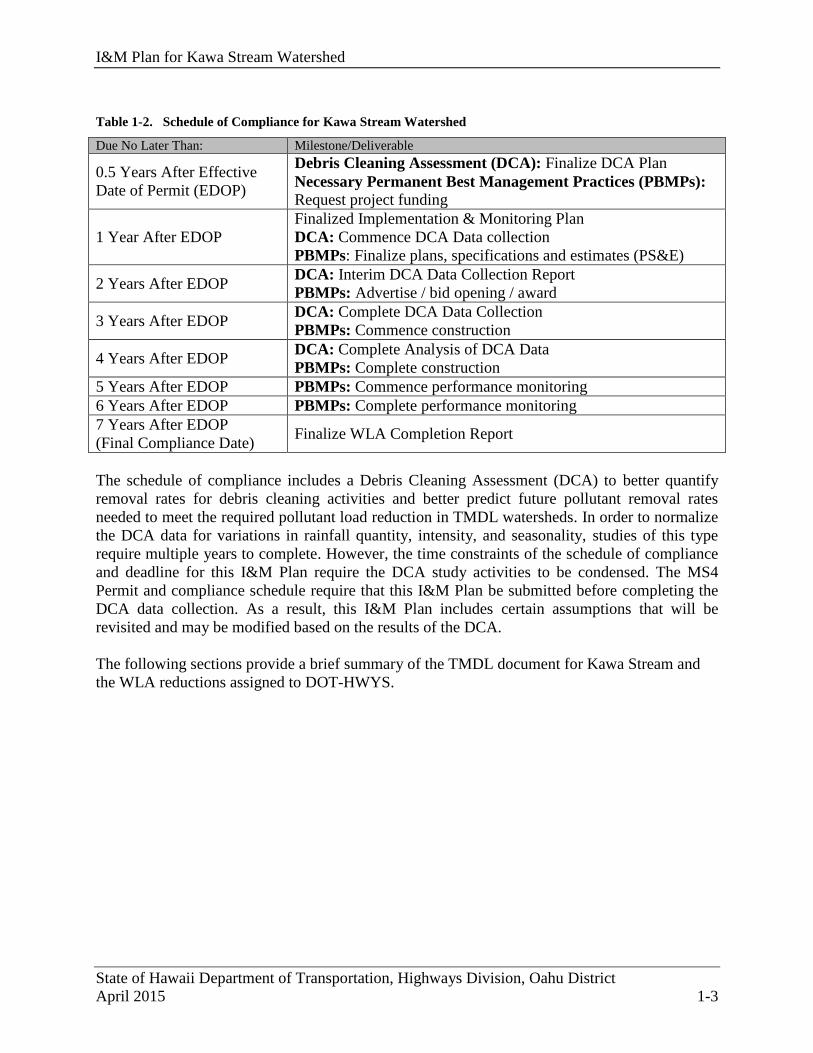
Table 1-2. Schedule of Compliance for Kawa Stream Watershed
Due No Later Than: Milestone/Deliverable
0.5 Years After Effective
Date of Permit (EDOP)
Debris Cleaning Assessment (DCA): Finalize DCA Plan
Necessary Permanent Best Management Practices (PBMPs):
Request project funding
1 Year After EDOP
Finalized Implementation & Monitoring Plan
DCA: Commence DCA Data collection
PBMPs: Finalize plans, specifications and estimates (PS&E)
2 Years After EDOP DCA: Interim DCA Data Collection Report
PBMPs: Advertise / bid opening / award
3 Years After EDOP DCA: Complete DCA Data Collection
PBMPs: Commence construction
4 Years After EDOP DCA: Complete Analysis of DCA Data
PBMPs: Complete construction
5 Years After EDOP PBMPs: Commence performance monitoring
6 Years After EDOP PBMPs: Complete performance monitoring
7 Years After EDOP
(Final Compliance Date) Finalize WLA Completion Report
The schedule of compliance includes a Debris Cleaning Assessment (DCA) to better quantify
removal rates for debris cleaning activities and better predict future pollutant removal rates
needed to meet the required pollutant load reduction in TMDL watersheds. In order to normalize
the DCA data for variations in rainfall quantity, intensity, and seasonality, studies of this type
require multiple years to complete. However, the time constraints of the schedule of compliance
and deadline for this I&M Plan require the DCA study activities to be condensed. The MS4
Permit and compliance schedule require that this I&M Plan be submitted before completing the
DCA data collection. As a result, this I&M Plan includes certain assumptions that will be
revisited and may be modified based on the results of the DCA.
The following sections provide a brief summary of the TMDL document for Kawa Stream and
the WLA reductions assigned to DOT-HWYS.

I&M Plan for Kawa Stream Watershed
State of Hawaii Department of Transportation, Highways Division, Oahu District
April 2015 1-4
1.1 TMDL FOR KAWA STREAM
As described in the TMDL document, the Kawa Stream watershed (Figure 1-1), located on the
windward side of the island of Oahu, covers 1,000 acres (1.5 square miles) and flows into the
southern portion of Kaneohe Bay. Land uses in the watershed consist of forest and preservation,
schools, golf, cemetery lawn, urban residential, commercial shopping complex, park, and streets.
The Kawa Stream watershed is primarily subject to rainfall resulting from oceanic tradewind
showers and from large weather systems causing rainfall over the entire island. The stream is
included on the State’s Clean Water Act Section 303(d) list of impaired waters that do not meet
State Water Quality Standards and is considered to be impaired by sediments, turbidity, and the
nutrients nitrogen and phosphorus. These pollutants may augment unwanted algae growth in the
stream and impact coral reef resources in the receiving waters of Kaneohe Bay.
DOT-HWYS owns and operates approximately 1.8 miles of highways in the Kawa Stream
Watershed, including portions of State Routes 65 (Kawa Bay Drive), and 83 (Kamehameha
Highway) (Figure 1-1). A portion of the runoff from DOT-HWYS’ right-of-way (ROW) for
these highway segments drains to the MS4.
I&M Plan for Kawa Stream Watershed
State of Hawaii Department of Transportation, Highways Division, Oahu District
April 2015 1-5
Figure 1-1. Kawa Stream Watershed Map
I&M Plan for Kawa Stream Watershed
State of Hawaii Department of Transportation, Highways Division, Oahu District
April 2015 1-6
This page intentionally left blank.
I&M Plan for Kawa Stream Watershed
State of Hawaii Department of Transportation, Highways Division, Oahu District
April 2015 1-7
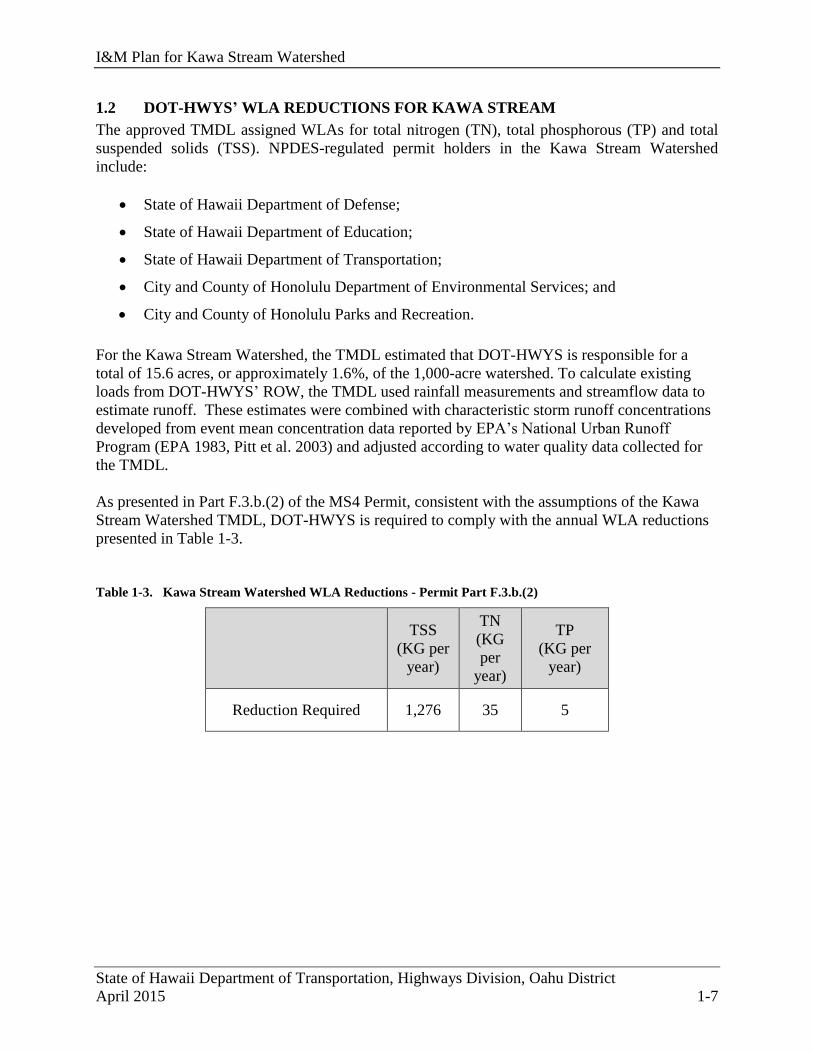
1.2 DOT-HWYS’ WLA REDUCTIONS FOR KAWA STREAM
The approved TMDL assigned WLAs for total nitrogen (TN), total phosphorous (TP) and total
suspended solids (TSS). NPDES-regulated permit holders in the Kawa Stream Watershed
include:
State of Hawaii Department of Defense;
State of Hawaii Department of Education;
State of Hawaii Department of Transportation;
City and County of Honolulu Department of Environmental Services; and
City and County of Honolulu Parks and Recreation.
For the Kawa Stream Watershed, the TMDL estimated that DOT-HWYS is responsible for a
total of 15.6 acres, or approximately 1.6%, of the 1,000-acre watershed. To calculate existing
loads from DOT-HWYS’ ROW, the TMDL used rainfall measurements and streamflow data to
estimate runoff. These estimates were combined with characteristic storm runoff concentrations
developed from event mean concentration data reported by EPA’s National Urban Runoff
Program (EPA 1983, Pitt et al. 2003) and adjusted according to water quality data collected for
the TMDL.
As presented in Part F.3.b.(2) of the MS4 Permit, consistent with the assumptions of the Kawa
Stream Watershed TMDL, DOT-HWYS is required to comply with the annual WLA reductions
presented in Table 1-3.
Table 1-3. Kawa Stream Watershed WLA Reductions - Permit Part F.3.b.(2)
TSS
(KG per
year)
TN
(KG
per
year)
TP
(KG per
year)
Reduction Required 1,276 35 5

I&M Plan for Kawa Stream Watershed
State of Hawaii Department of Transportation, Highways Division, Oahu District
April 2015 1-8
This page intentionally left blank.
I&M Plan for Kawa Stream Watershed
State of Hawaii Department of Transportation, Highways Division, Oahu District
April 2015 2-1
2. DOT-HWYS’ STORM WATER MANAGEMENT PROGRAM
ACTIVITIES
To meet its WLA reduction goals, DOT-HWYS intends to take a comprehensive approach by
using established best management practices (BMPs). As used in this document, the term BMP
refers to operational activities or physical controls applied to storm water and other runoff to
reduce pollution. BMP programs currently implemented by DOT-HWYS include:
Street sweeping;
Cleaning of MS4 structures;
PBMPs;
Erosional area repairs;
Construction site runoff management;
Illicit discharge detection and elimination;
Industrial and commercial activities discharge management; and
Public education and outreach.
Each of these BMP programs continues to reduce TN, TP, and TSS discharges from DOT-
HWYS’ ROW to the Kawa Stream Watershed. These BMP programs are discussed below and
more detail about each program can be found in the comprehensive DOT-HWYS Storm Water
Management Program Plan (SWMPP).
2.1 STREET SWEEPING (DEBRIS CONTROL PROGRAM)
Street sweeping has been identified as one of the most cost-effective methods of removing
particulate debris from streets and roadways. Street sweeping removes particulate pollutants on
roads before they are introduced to the MS4 by runoff events. The removal of fine particulate
will also remove pollutants such as nutrients that are associated with particulates (Schueler and
Holland 2000). Traditionally, street sweeping has focused on the removal of litter, leaves, and
other large debris, but effective street sweeping will remove/reduce pollutant loads associated
with fine particulates.
DOT-HWYS’ personnel and service contractors regularly sweep highways on the island of
Oahu. DOT-HWYS Oahu District Maintenance Section (HWY-OM) and service contractors are
responsible for removing any litter, debris, sediment, or other matter that accumulates within
DOT-HWYS’ ROW, including the MS4. Pollutants typically found on roadways that could enter
the MS4 include:

I&M Plan for Kawa Stream Watershed
State of Hawaii Department of Transportation, Highways Division, Oahu District
April 2015 2-2
Material from illegal dumping;
Runoff from construction activities within and adjacent to DOT-HWYS’ ROW;
Litter from motorists and pedestrians;
Debris from vehicles;
Loose paving materials and aggregate from cracked pavements and potholes;
Vegetative debris; and
Sediment accumulation.
Service contractors conduct much of the street sweeping on Oahu. Debris Control Program
personnel conduct inspections of these activities. HWY-OM personnel conduct their own
inspections and street sweeping on various routes.
2.2 CLEANING OF MS4 STRUCTURES (DEBRIS CONTROL PROGRAM)
Catch basins typically include an inlet grate and/or drop structure that is connected to a drainage
outfall. Manholes are structures where drainage pipes meet or change direction and often have a
sump that accumulates solids and sediment. The cleaning of these structures has proven to be a
cost-effective method to capture and remove gross pollutants in the MS4. Removing debris from
storm drainage structures reduces the amount of pollutant material flushed into receiving waters
by storm water runoff.
DOT-HWYS clears debris and other materials that accumulate in drainage structures through
mechanical (e.g., vacuuming) or manual means. High priority inlets and their associated catch
basins are inspected at least once every six months. Portions of selected State routes have been
classified as low priority due to their relatively low traffic volume. These low priority drains are
inspected once per year and cleaned if necessary. Similar to the sweeping schedule, the
inspection schedule of drainage infrastructure is evaluated annually for possible changes. Large
debris (e.g., wood or trash) accumulating on top of or blocking drainage structures is removed
promptly. Cleaning activities are observed by an inspector who records the amount of material
removed from the drainage structure, including the percentage of organic matter, trash and
sediment.
2.3 PBMPS
DOT-HWYS has developed an Action Plan for retrofitting PBMPs into its existing MS4 system.
The purpose of the Action Plan is to reduce storm water pollution by designing and
constructing/installing appropriate and cost-effective BMPs (retrofits) in strategic locations and
structures within the DOT-HWYS’ existing MS4. Potential retrofit sites were selected from a
review of previous studies that identified potential sites and a review of data collected during
routine MS4 monitoring and maintenance activities.
The Post-Construction Storm Water Management in New Development and Redevelopment
Program (Post-Construction Program) institutes procedures to incorporate the installation of
appropriate PBMPs for certain new development and significant redevelopment projects that
DOT-HWYS undertakes (e.g., contract projects), as well as certain types of encroachment

I&M Plan for Kawa Stream Watershed
State of Hawaii Department of Transportation, Highways Division, Oahu District
April 2015 2-3
projects. PBMPs are designed to be installed and remain in place as part of a project to provide
for long-term storm water quality or quantity control. New development and significant
redevelopment projects include, but are not limited to, new roadways and roadway and
intersection improvements or modifications, such as widening.
Specific elements of the Post-Construction Program include:
Revising DOT-HWYS’ standards for addressing post-construction PBMPs to include
Low Impact Development requirements;
Instituting PBMP considerations throughout the life-cycles of both DOT-HWYS’ and
encroachment projects;
Implementing an Asset Management System to track the frequency of inspections and
maintenance of PBMPs; and
Supporting a training program and providing outreach materials
so that people involved in DOT-HWYS-related new developments or significant redevelopments
(e.g., DOT-HWYS’ and utility company personnel, design consultants, contractors, etc.) are
familiar with PBMP criteria, methods, specifications, and permitting requirements.
2.4 EROSION CONTROL PROGRAM
The function of the Erosion Control BMPs Program (Erosion Control Program) is to implement
permanent erosion control improvements, ensuring that erosional areas with the potential for
significant water quality impact, but with limited public safety concerns, are also addressed.
The Erosion Control Program is responsible for implementing the following BMPs:
Identify erosional areas with the potential for significant water quality impact for the
purpose of implementing erosion control improvements.
Submit to DOH a list of projects with an implementation schedule for permanent erosion
control improvements.
Implement temporary erosion control measures on erosional areas (i.e., highway-adjacent
eroded slopes) within DOT-HWYS’ ROW with the potential for significant water quality
impact, if a permanent solution is not immediately possible.
Provide DOH with an Action Plan to address erosion at DOT-HWYS’ storm drain system
outlets with significant potential for water quality impacts.
Develop a maintenance plan for vegetated portions of the drainage system used for
erosion and sediment control.
I&M Plan for Kawa Stream Watershed
State of Hawaii Department of Transportation, Highways Division, Oahu District
April 2015 2-4
2.5 CONSTRUCTION SITE RUNOFF CONTROL PROGRAM
The objective of the Construction Site Runoff Control Program (Construction Program) is to
reduce, to the Maximum Extent Practicable (MEP), the discharge of pollutants from both private
and public construction projects. The program includes the following components:
Plan review and approval process, which includes reviewing site-specific BMP plans and
storm water pollution prevention plans;
An inspection program to ensure that construction BMPs are properly installed for
contract, in-house, maintenance, and encroachment permit projects; and
A program to provide annual training on elements of the Construction Program to DOT-
HWYS’ staff with construction storm water responsibilities.
2.6 INDUSTRIAL AND COMMERCIAL ACTIVITIES DISCHARGE
MANAGEMENT (IC PROGRAM) & ILLICIT DISCHARGE DETECTION AND
ELIMINATION (IDDE PROGRAM)
Storm water flowing from industrial and commercial areas may be a significant source of
pollutants that enter the MS4. Therefore, the Industrial and Commercial Activities Discharge
Management Program (IC Program) is designed to reduce, to the MEP, the discharge of
pollutants from industrial and commercial facilities and activities that initially discharge into the
MS4. While listed as separate programs in the SWMPP, in practice, this program is related to the
Illicit Discharge Detection and Elimination Program (IDDE Program), because industrial and
commercial facilities activities are susceptible to causing illicit discharges. DOT-HWYS takes a
proactive approach in reducing illicit discharges by identifying industrial and commercial areas
that drain into the MS4 for priority inspections.
The IC Program consists of:
Developing a comprehensive database to track industrial and commercial facilities and
activities whose storm water runoff initially discharges into the MS4;
Developing prioritized areas for inspection of industrial and commercial facilities and
activities;
Ranking the commercial facilities and activities according to relative risk of discharge of
contaminated runoff to the MS4;
Conducting inspections or investigations of industrial and highly ranked commercial
facilities and parcels within the designated prioritized areas; and
Supporting a training program so that those involved in this program have the necessary
knowledge and skills to conduct investigations.
DOT-HWYS requires a connection permit for all properties initially discharging storm water into
the MS4. Owners of properties adjacent to DOT-HWYS’ ROW were required to self-report
connections to the MS4 in a mail survey. If unpermitted connections are discovered during
routine field investigations, these property owners are required to obtain a connection permit.
Additionally, any new construction that involves private connections to the MS4 requires a
connection permit. To obtain a connection permit, property owners are required to describe the
I&M Plan for Kawa Stream Watershed
State of Hawaii Department of Transportation, Highways Division, Oahu District
April 2015 2-5
size of connection, type of discharge and flow rate, as well as other characteristics of the
property (e.g., industrial land uses) which may require further review by DOT-HWYS.
DOT-HWYS has developed a Prioritized Area Plan that designates priority areas for industrial
and commercial facility and activity inspections according to the relative risk that any discharge
may be contaminated with pollutants. The Prioritized Area Plan includes an inspection schedule
that establishes inspection frequencies for industrial and commercial facilities and activities. All
highly ranked commercial facilities are inspected at least once every five years. If an industrial
facility or activity on the prioritized list does not have NPDES permit coverage, this facility or
activity would be subject to inspection at least twice every five years. If an industrial facility has
NPDES permit coverage, this facility or activity would be subject to inspection at least once
every five years.
The IDDE Program screens for and addresses any illicit discharge that drains into the MS4
within the watershed, including discharges sourced from industrial, commercial, and residential
land uses. In addition to administering a connection and discharge permitting program, the IDDE
Program conducts investigations of parcels suspected of illicit discharges or illegal connections
identified through:
Routine inspections of parcels designated by the industrial and commercial database and
inventory list;
Field screening of major and minor outfalls;
Public complaints; and
Complaints from DOH.
2.7 PUBLIC EDUCATION AND OUTREACH PROGRAM
The Public Education and Outreach Program (Public Education Program) addresses the need to
inform the general public about how their daily activities may affect the quality of receiving
waters. The Public Education Program is a community involvement program that focuses on
informing the public about MS4 pollution issues and provides citizens with the tools and ideas to
help eliminate the causes of pollution. The purpose of the Public Education Program is to
motivate the community to control pollution at the source by increasing public awareness of
storm water pollution issues. By educating the public on methods to reduce the generation of
pollutants, public participation can reduce the quantity of pollutants introduced into the MS4.
I&M Plan for Kawa Stream Watershed
State of Hawaii Department of Transportation, Highways Division, Oahu District
April 2015 2-6
This page intentionally left blank.
I&M Plan for Kawa Stream Watershed
State of Hawaii Department of Transportation, Highways Division, Oahu District
April 2015 3-1
3. QUANTITATIVE ANALYSIS OF PROPOSED ACTIVITIES IN KAWA
STREAM WATERSHED
This section describes the quantitative analysis of specific DOT-HWYS’ programs to document
compliance with the required WLA reductions. The anticipated annual pollutant reductions for
specific programs have been quantitatively analyzed and aggregated to provide the total
anticipated annual pollutant reduction for each pollutant. This total anticipated annual mass
reduction was then compared to the annual reductions required in Table 1-3 to assess consistency
with the WLA reductions assigned to DOT-HWYS.
The TMDL document assessed DOT-HWYS’ existing pollutant loads based on storm runoff
concentrations collected in the early 1980’s as part of the EPA’s National Urban Runoff Program
(EPA 1983, Pitt et al. 2003). To be consistent with the assumptions and data used in the TMDL
decision document, DOT-HWYS has set 1980 as the baseline condition for DOT-HWYS’
pollution reduction program, and the quantitative analyses presented here measure pollution
reduction efforts from the 1980 baseline.
The following sub-sections present a quantitative analysis, where appropriate, of how specific
DOT-HWYS’ programs reduce annual loads of TN, TP, and TSS in Kawa Stream Watershed.
Section 3.8 summarizes the average anticipated annual reductions of TN, TP, and TSS in
kilograms (KG). While some of the programs and activities lend themselves to direct
measurement and estimation of pollutant reduction, pollutant reductions from several of the
programs and activities have instead been considered qualitatively in this I&M Plan.
3.1 STREET SWEEPING IN KAWA STREAM WATERSHED
Anticipated annual reductions in TN, TP, and TSS loads due to street sweeping were calculated
by assessing data from DOT-HWYS’ 2009-2013 street sweeping operations in Kawa Stream
Watershed in conjunction with literature data on concentrations of nutrients and suspended solids
per KG of debris collected. This data will serve as a basis for projecting future annual reductions.
3.1.1 Data on Street Sweeping Operations
DOT-HWYS tracks debris removed through street sweeping operations for all DOT-HWYS’
routes intersecting the Kawa Stream Watershed. At the end of each street sweeping event,
inspectors record the total cubic yards (CY) of debris removed and estimate a rough percentage
of sediment, organic matter, and trash found in the street sweeping hopper. DOT-HWYS chose
to average data from 2009-2013 (with the highest value for sediment and organic matter
excluded from each annual average to generate a conservative estimate) to provide a
representative estimate of debris removal to use on an annual basis for Kawa Stream Watershed.
A summary of the data is provided in Figure 3-1. Averaging data from these years yields an
average anticipated annual removal of 7.93 CY of sediment and 7.33 CY of organic matter.
I&M Plan for Kawa Stream Watershed
State of Hawaii Department of Transportation, Highways Division, Oahu District
April 2015 3-2
Figure 3-1. Cubic yards of street sweeping debris collected in Kawa Stream Watershed, 2009-2013
3.1.2 Literature Data on Concentrations of Nutrients and Suspended Solids per Kg of
Debris Collected
DOT-HWYS reviewed existing literature on the concentration of nutrients in debris removed
through street sweeping and MS4 structure cleaning. A 2011 study in Florida summarized results
from 14 MS4s and 459 individual samples to establish concentrations of nutrients per KG of
debris recovered in street sweeping and catch basin cleaning (Berretta et al. 2011). These data
were specific to highway land use and unique concentrations were presented for street sweeping
and catch basin cleaning, respectively.
In the absence of highway-specific data in Hawaii, these literature values were used to convert
dry-equivalent debris into KG of TN and TP recovered. For TSS, DOT-HWYS used study
results from the Chesapeake Stormwater Network (2011) which established that estimated TSS
removal from street sweeping is approximately 30% of the total dry sweeping solids load
recovered. DOT-HWYS is carrying out a sampling effort during the DCA study to confirm that
results from the Berretta et al. (2011) and Chesapeake Stormwater Network (2011) studies are
applicable to conditions in Hawaii. As part of the WLA Completion Report, these literature
values will be re-evaluated and adjusted as necessary to reflect the results of the DCA data
collected. Final compliance calculations will also be revised as necessary.
Tables 3-1, 3-2, and 3-3 present the conversion from an average anticipated annual wet-weight
volume of debris removed to a dry mass of TN, TP, and TSS removed from Kawa Stream
Watershed through street sweeping on an annual basis. In these tables, the wet-weight volume of
debris is multiplied by three constants (bulk density, moisture content, and nutrient or suspended
solid content) to calculate the dry mass of TN, TP, and TSS.
0
2
4
6
8
10
12
14
16
2009 2010 2011 2012 2013
cub
ic y
ard
s o
f d
ebri
sSediment (cy) Organic Matter (cy)
Excl
uded
fro
m a
ver
age
Ex
clu
ded
fro
m a
ver
age

I&M Plan for Kawa Stream Watershed
State of Hawaii Department of Transportation, Highways Division, Oahu District
April 2015 3-3
Table 3-1. Conversion Calculations for TN Removal through Street Sweeping Operations
Sediment Organic
matter TOTAL
Average anticipated annual debris removed (CY) 7.93 7.33
Bulk density (KG/CY) 1039 a 497 b
Moisture content conversion factor for street
sweeping debris (%) 94 a 94 a
TN conversion factor for street sweeping debris
(KG TN/KG dry mass)
0.0008266 a
0.0008266 a
Average anticipated annual TN removed through
street sweeping (KG) 6.40 2.83 9.23
a Source: Berretta et al. (2011) b Source: Government of Saskatchewan Ministry of Agriculture (2008) presented as wet bulk density of
compost
Table 3-2. Conversion Calculations for TP Removal through Street Sweeping Operations
Sediment Organic
matter TOTAL
Average anticipated annual debris removed (CY) 7.93 7.33
Bulk density (KG/CY) 1039 a 497 b
Moisture content conversion factor for street
sweeping debris (%) 94 a 94 a
TP conversion factor for street sweeping debris
(KG TP/KG dry mass) 0.000622 a 0.000622 a
Average annual TP removed through street
sweeping (KG) 4.82 2.13 6.95
a Source: Berretta et al. (2011) b Source: Government of Saskatchewan Ministry of Agriculture (2008) presented as wet bulk density of
compost
Table 3-3. Conversion Calculations for TSS Removal through Street Sweeping Operations
Sediment Organic
matter TOTAL
Average anticipated annual debris removed (CY) 7.93 7.33
Bulk density (KG/CY) 1039 a 1039 a
Moisture content conversion factor for street
sweeping debris (%) 94 a 94 a
TSS conversion factor for street sweeping debris
(KG TSS/KG dry mass) 0.3 c 0.3 c
Average annual TSS removed through street
sweeping (KG) 2,323 2,148 4,471
a Source: Berretta et al. (2011) b Source: Government of Saskatchewan Ministry of Agriculture (2008) presented as wet bulk density of
compost c Source: Chesapeake Stormwater Network (2011)

I&M Plan for Kawa Stream Watershed
State of Hawaii Department of Transportation, Highways Division, Oahu District
April 2015 3-4
3.2 CLEANING OF MS4 STRUCTURES IN KAWA STREAM WATERSHED
DOT-HWYS tracks debris removed through the cleaning of MS4 structures for all routes
intersecting Kawa Stream Watershed. At the end of each cleaning event, inspectors record the
total CY of debris removed and estimate a rough percentage of sediment, organic matter, and
trash removed. DOT-HWYS averaged data from 2009-2013 (with the highest value for sediment
and organic matter excluded from each annual average to generate a conservative estimate) to
provide a representative estimate of debris removal to use on an annual basis. This data will
serve as a basis for projecting future annual reductions.
A summary of the data is provided in Figure 3-2. Averaging data from these years yields an
average anticipated annual removal of 0.92 CY of sediment and 0.25 CY of organic matter.
Figure 3-2. Cubic yards of debris removed from inlets and manholes in Kawa Stream Watershed, 2009-2013
Tables 3-4, 3-5, and 3-6 present the conversion from an average anticipated annual wet-weight
volume of debris removed to a dry mass of TN, TP, and TSS removed from Kawa Stream
Watershed through cleaning of MS4 structures.
0
5
10
15
20
25
2009 2010 2011 2012 2013
cub
ic y
ard
s o
f d
ebri
s
Sediment (cy) Organic Matter (cy)
Excl
uded
fro
m a
ver
age
Excl
uded
fro
m a
ver
age
I&M Plan for Kawa Stream Watershed
State of Hawaii Department of Transportation, Highways Division, Oahu District
April 2015 3-5
Table 3-4. Conversion Calculations for TN Removal through Cleaning of Inlets and Manholes
Sediment Organic
matter TOTAL
Average anticipated annual debris removed (CY) 0.92 0.25
Bulk density (KG/CY) 1039 a 497 b
Moisture content conversion factor for catch
basin debris (%) 79 a 79 a
TN conversion factor for catch basin debris (KG
TN/KG dry mass) 0.0019263 a 0.0019263 a
Average anticipated annual TN removed through
MS4 cleaning (KG) 1.46 0.19 1.65
a Source: Berretta et al. (2011 ) b Source: Government of Saskatchewan Ministry of Agriculture (2008) presented as wet bulk density of
compost
Table 3-5. Conversion Calculations for TP Removal through Cleaning of Inlets and Manholes
Sediment
Organic
matter TOTAL
Average anticipated annual debris removed (CY) 0.92 0.25
Bulk density (KG/CY) 1039 a 497 b
Moisture content conversion factor for catch
basin debris (%) 79 a 79 a
TP conversion factor for catch basin debris (KG
TP/KG dry mass) 0.0005666 a 0.0005666 a
Average anticipated annual TP removed through
MS4 cleaning (KG) 0.43 0.06 0.49
a Source: Berretta et al. (2011 ) b Source: Government of Saskatchewan Ministry of Agriculture (2008) presented as wet bulk density of
compost
Table 3-6. Conversion Calculations for TSS Removal through Cleaning of Inlets and Manholes
Sediment
Organic
matter TOTAL
Average anticipated annual debris removed (CY) 0.92 0.25
Bulk density (KG/CY) 1039 a 1039 a
Moisture content conversion factor for catch
basin debris (%) 79 a 79 a
TSS conversion factor for catch basin debris (KG
TSS/KG dry mass) 0.3c 0.3c
Average anticipated annual TSS removed through
MS4 cleaning (KG) 226.5 61.6 288.1
a Source: Berretta et al. (2011 ) b Source: Government of Saskatchewan Ministry of Agriculture (2008) presented as wet bulk density of
compost c Source: Chesapeake Stormwater Network (2011)

I&M Plan for Kawa Stream Watershed
State of Hawaii Department of Transportation, Highways Division, Oahu District
April 2015 3-6
3.3 PBMPS IN KAWA STREAM WATERSHED
No new development or significant redevelopment projects have occurred in Kawa Stream
Watershed that would necessitate the construction of PBMPs. Should any such development or
redevelopment take place along DOT-HWYS’ ROW within Kawa Stream Watershed, DOT-
HWYS will follow their MS4 Permit requirements to implement appropriate PBMPs.
DOT-HWYS has identified two locations in Kawa Stream Watershed where retrofitting PBMPs
may be appropriate (Figure 3-3).
3.3.1 Reduction Calculations
The Simple Method (Schueler 1987) was used to estimate the anticipated pollutant removal
achieved by installing the PBMPs described in Table 3-8. Concentrations of TN, TP and TSS in
DOT-HWYS’ runoff were calculated as geometric mean values of all available sampling data
from Kawa Watershed (81 automatic samples from 2006-2007).
3.3.2 Literature Data on Pollutant Removal Efficiencies for Selected PBMPs
DOT-HWYS reviewed existing literature to determine characteristic pollutant removal
efficiencies for various PBMPs. Results of this review are presented in Table 3-7. Where
appropriate, the lowest and highest removal efficiencies were averaged to provide an average
value. Characteristic removal efficiencies may be confirmed through in-situ sampling following
installation of selected representative PBMPs (described further in Section 4.2).
Table 3-7. Literature Data on Pollutant Removal Efficiencies for Selected PBMPs
PBMP Type
TN
(% removal)
TP
(% removal)
TSS
(% removal)
Source
Lo
wes
t
Hig
hes
t
Av
erag
e
Lo
wes
t
Hig
hes
t
Av
erag
e
Lo
wes
t
Hig
hes
t
Av
erag
e
Bioswale 39 89 64 29 80 54.5 83 92 87.5 [1]
Nutrient Separating Baffle Box (NSBB) 43 63 53 18 70 44 39 93 66 [2]
Sources:
[1] State of Oregon Department of Environmental Quality (2003)
[2] SunTree Technologies Inc. (2006)

I&M Plan for Kawa Stream Watershed
State of Hawaii Department of Transportation, Highways Division, Oahu District
April 2015 3-7
Table 3-8. PBMP Projects in Kawa Stream Watershed S
ite
#
Associated
PID
Proposed
BMP
A
area
(acres)
Ia
impervious fraction
(%)
Rv
Runoff
coefficient
P
Annual rainfall
(inches)
R
Annual runoff
(inches)
TNRed%
TN removal
efficiency (%)
TPRed%
TP removal
efficiency (%)
TSSRed%
TSS removal
efficiency (%)
TN
TN load reduction
(KG)
TP
TP load reduction
(KG)
TSS
TSS load reduction
(KG)
1 108140 NSBB 7 71 0.69 56 34.92 53.0 44.0 66.0 12.75 2.32 875.86
2 601391 Bioswale 4.79 36 0.38 67 22.78 64.0 54.5 87.5 6.87 1.28 518.58
Total 19.62 3.6 1394.44
Notes:
PID = Unique Point Identification Number for MS4 structure
A = Contributing drainage area (acres)
Ia = Impervious fraction (%)
Pj = Fraction of annual rainfall events that produce runoff = 0.9
Rv = Runoff coefficient = 0.05 + 0.9(Ia)
P = Annual rainfall (inches) from Giambelluca et al. (2012)
R = Annual runoff (inches) = P * Pj * Rv
TNRed% = TN removal efficiency (%)
TPRed% = TP removal efficiency (%)
TSSRed% = TSS removal efficiency (%)
TNConc = CharacteristicTN concentration in DOT-HWYS runoff in Kawa Stream Watershed = 0.96mg/L
TPConc = Characteristic TP concentration in DOT-HWYS runoff in Kawa Stream Watershed = 0.21 MG/L
TSSConc = Characteristic TP concentration in DOT-HWYS runoff in Kawa Stream Watershed = 53 MG/L
CF = Unit conversion factor = 6272640 in2/acre * 0.0163871 L/in3 * 0.000001 KG/MG = 0.1
TN = Annual TN load reduction (KG) = A * RW * TNConc * TNRed% * CF
TP = Annual TP load reduction (KG) = A * RW * TPConc * TPRed% * CF
TSS = Annual TSS load reduction (KG) = A * RW * TSSConc * TSSRed% * CF

I&M Plan for Kawa Stream Watershed
State of Hawaii Department of Transportation, Highways Division, Oahu District
April 2015 3-8
Figure 3-3. Identified PBMP Sites in Kawa Stream Watershed

I&M Plan for Kawa Stream Watershed
State of Hawaii Department of Transportation, Highways Division, Oahu District
April 2015 3-9
3.4 EROSION CONTROL PROGRAM IN KAWA STREAM WATERSHED
The 2007 Islandwide Assessment of Erosional Areas on the Island of Oahu identified two
erosional areas of concern in Kawa Stream Watershed. Table 3-9 identifies the status of each
site. Implementing these projects has resulted in reductions in loadings of TN, TP, and TSS
within Kawa Stream Watershed. Substantial pollutant reductions in discharges from the MS4 are
attributed to the repair of these erosional areas, but these reductions have not been quantified at
this time and are therefore considered qualitatively in this I&M Plan.
Table 3-9. Status of Identified Erosion Sites in Kawa Stream Watershed
PID Route
Temporary
Projects
Completed
Permanent
Projects
Under
Design/
Construction
Permanent
Projects
Completed
123 65 -- -- X
416 83 -- -- X
I&M Plan for Kawa Stream Watershed
State of Hawaii Department of Transportation, Highways Division, Oahu District
April 2015 3-10
3.5 CONSTRUCTION SITE RUNOFF CONTROL PROGRAM ACTIVITIES IN
KAWA STREAM WATERSHED
DOT-HWYS will continue to verify that site-specific BMPs have been installed in accordance
with their approved site-specific BMP plans prior to the commencement of any ground
disturbing activities. Additionally, independent inspections will continue to be conducted as
required in the MS4 permit to ensure BMPs are installed and maintained per the approved plan.
DOT-HWYS has developed checklists, inspection forms, and corrective action and reporting
procedures for construction projects and has conducted numerous annual construction activities
BMP trainings for its staff and contractors. Should any new construction take place along DOT-
HWYS’ ROW within Kawa Stream Watershed, DOT-HWYS will follow their MS4 Permit
requirements to implement appropriate construction site runoff control BMPs.
Substantial pollutant reductions in discharges from the MS4 are attributed to the Construction
Program, but these reductions have not been quantified at this time and are therefore considered
qualitatively in this I&M Plan.
3.6 INDUSTRIAL AND COMMERCIAL ACTIVITIES DISCHARGE
MANAGEMENT (IC PROGRAM) AND ILLICIT DISCHARGE DETECTION
AND ELIMINATION (IDDE PROGRAM) IN KAWA STREAM WATERSHED
As of October 2014, eight industrial and commercial facilities were located adjacent to DOT-
HWYS’ ROW within Kawa Stream Watershed. One of these facilities holds a permit to connect
to the MS4. Since the tracking of deficiencies began in 2000, there have been no deficiencies
recorded in Kawa Stream Watershed. During routine inspections, owners of the sites or facilities
have been provided educational material to encourage best practices at their facilities. Substantial
pollutant reductions in discharges from the MS4 are attributed to the IC and IDDE Programs, but
these reductions have not been quantified at this time and are therefore considered qualitatively
in this I&M Plan.
3.7 PUBLIC EDUCATION AND OUTREACH IN KAWA STREAM WATERSHED
DOT-HWYS will continue to evaluate potential partnerships with agencies and other
stakeholders to more effectively promote storm water awareness and affect behavioral change
within the watershed.
In addition, DOT-HWYS sponsors an Adopt-A-Highway program that allows volunteers from
any organization to pick up litter along Hawaii’s State highways. Adopt-A-Highway groups
agree to adopt a portion of State highway for a minimum of two years, pick up litter on that
highway at least four times a year, and provide safety training for their volunteers before each
cleanup. DOT-HWYS provides all safety materials and trash bags, schedules trash pick-ups and
erects highway signs to recognize the sponsoring groups’ cleaning efforts. Two Adopt-A-
Highway groups are responsible for all 1.8 miles of highway within Kawa Stream Watershed.
Substantial pollutant reductions in discharges from the DOT-HWYS MS4 are attributed to the
Public Education and Outreach Program, but these reductions have not been quantified at this
time and are therefore considered qualitatively in this I&M Plan.
I&M Plan for Kawa Stream Watershed
State of Hawaii Department of Transportation, Highways Division, Oahu District
April 2015 3-11
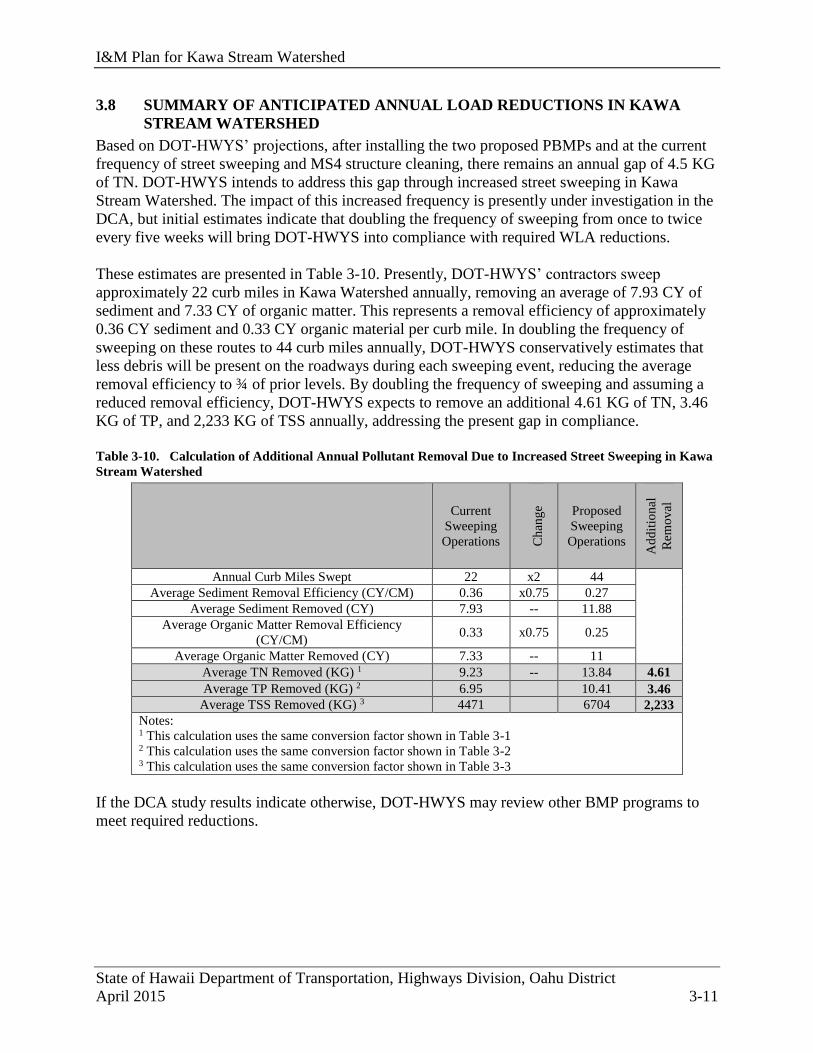
3.8 SUMMARY OF ANTICIPATED ANNUAL LOAD REDUCTIONS IN KAWA
STREAM WATERSHED
Based on DOT-HWYS’ projections, after installing the two proposed PBMPs and at the current
frequency of street sweeping and MS4 structure cleaning, there remains an annual gap of 4.5 KG
of TN. DOT-HWYS intends to address this gap through increased street sweeping in Kawa
Stream Watershed. The impact of this increased frequency is presently under investigation in the
DCA, but initial estimates indicate that doubling the frequency of sweeping from once to twice
every five weeks will bring DOT-HWYS into compliance with required WLA reductions.
These estimates are presented in Table 3-10. Presently, DOT-HWYS’ contractors sweep
approximately 22 curb miles in Kawa Watershed annually, removing an average of 7.93 CY of
sediment and 7.33 CY of organic matter. This represents a removal efficiency of approximately
0.36 CY sediment and 0.33 CY organic material per curb mile. In doubling the frequency of
sweeping on these routes to 44 curb miles annually, DOT-HWYS conservatively estimates that
less debris will be present on the roadways during each sweeping event, reducing the average
removal efficiency to ¾ of prior levels. By doubling the frequency of sweeping and assuming a
reduced removal efficiency, DOT-HWYS expects to remove an additional 4.61 KG of TN, 3.46
KG of TP, and 2,233 KG of TSS annually, addressing the present gap in compliance.
Table 3-10. Calculation of Additional Annual Pollutant Removal Due to Increased Street Sweeping in Kawa
Stream Watershed
Current
Sweeping
Operations Ch
ang
e Proposed
Sweeping
Operations
Ad
dit
ion
al
Rem
ov
al
Annual Curb Miles Swept 22 x2 44
Average Sediment Removal Efficiency (CY/CM) 0.36 x0.75 0.27
Average Sediment Removed (CY) 7.93 -- 11.88
Average Organic Matter Removal Efficiency
(CY/CM) 0.33 x0.75 0.25
Average Organic Matter Removed (CY) 7.33 -- 11
Average TN Removed (KG) 1 9.23 -- 13.84 4.61
Average TP Removed (KG) 2 6.95 10.41 3.46
Average TSS Removed (KG) 3 4471 6704 2,233
Notes: 1 This calculation uses the same conversion factor shown in Table 3-1 2 This calculation uses the same conversion factor shown in Table 3-2 3 This calculation uses the same conversion factor shown in Table 3-3
If the DCA study results indicate otherwise, DOT-HWYS may review other BMP programs to
meet required reductions.

I&M Plan for Kawa Stream Watershed
State of Hawaii Department of Transportation, Highways Division, Oahu District
April 2015 3-12
Table 3-11 presents a summary of the anticipated annual pollutant load reductions calculated in
Sections 3.1 to 3.7, where appropriate, and Table 3-10.
Table 3-11. Anticipated Annual Pollutant Load Reduction for TMDL Compliance
Best Management Practice (BMP) Program
Anticipated Total
Nitrogen (TN)
Reduction
(KG)
Anticipated Total
Phosphorus (TP)
Reduction
(KG)
Anticipated Total
Suspended Solids
(TSS) Reduction
(KG)
Street Sweeping
(Existing) 9.23 6.95 4,471
Street Sweeping (Additional) 4.61 3.46 2,233
Cleaning of MS4 Structure 1.65 0.49 288.1
Permanent BMPs 19.62 3.6 1394.44
Erosion Control Program --a --a
--a
Construction Site Runoff Control --a --a
--a
Industrial and Commercial Activities
Discharge Management and Illicit
Discharge Detection and Elimination
Programs
--a --a
--a
Public Education and Outreach --a --a
--a
TOTAL ANTICIPATED REDUCTION: 35.11 14.5 8,386.54
REDUCTION REQUIRED: 35 5 1,276
Notes: a These programs have resulted in pollutant load reductions in the Kawa Stream Watershed. These reductions have
not been quantified at this time and are therefore considered qualitatively in this I&M Plan.
I&M Plan for Kawa Stream Watershed
State of Hawaii Department of Transportation, Highways Division, Oahu District
April 2015 4-1
4. MONITORING PLAN
The following sub-sections document how DOT-HWYS will monitor and report compliance
with assigned WLA reductions in the Kawa Stream Watershed.
DOT-HWYS is currently reviewing methods to optimize TN, TP, and TSS removals wherever
practicable, such as increasing the frequency of sweeping in TMDL watersheds. Nonetheless,
there are natural variables such as the timing, intensity, and duration of precipitation, which
influence these removals and are fully outside the control of DOT-HWYS. For example, there is
strong evidence that rainfall in Hawaii is affected on a year-to-year time scale by the occurrence
of El Niño and La Niña events in the tropical Pacific, which give rise to large year-to-year
variability in rainfall in Hawaii (Giambelluca et al. 2012). Corresponding variability in pollutant
removals can be seen in Figures 3-1 and 3-2 of this report. As such, DOT-HWYS intends to
demonstrate compliance with WLA reductions based on a three-year running average of TN, TP,
and TSS reductions.
4.1 STREET SWEEPING AND MS4 CLEANING
DOT-HWYS will continue to track removals from street sweeping and MS4 structure cleaning,
as described in Section 3.1 and 3.2, respectively.
4.2 PBMPS
In accordance with Part F.1 of the MS4 Permit, a detailed Annual Monitoring Plan will discuss
any TMDL-related monitoring planned for that year. This will include pre- and post-sampling
following the installation of selected representative PBMPs to confirm characteristic removal
efficiencies. Per the Schedule of Compliance, this sampling will occur no later than 5 years after
the effective date of the MS4 Permit.
Monitoring of annual reductions resulting from PBMPs may involve modeling similar to the
Simple Method presented in Section 3.3 (for non-structural PBMPs such as bioswales) or by
measuring the amount of debris removed (for structural PBMPs such as continuous deflection
separator units).
4.3 OTHER BMP PROGRAMS
Other BMP programs whose associated reductions have not been quantified in this report will
continue to be documented in the Annual Report.
4.4 OVERALL COMPLIANCE REPORTIN
Following the WLA Completion Report (no later than 7 years after the effective date of the MS4
Permit), the results of this monitoring will be reported annually in the SWMP Annual Report.