Embed Size (px)
Citation preview

IMPERIAL OIL & GAS PTY LTD Australian Office
Level 7, 151 Macquarie Street Sydney NSW 2000 Australia
T: +61 2 9251 1846 F: +61 2 9251 0244
Key words:
Saint Vidgeon Project, McArthur Basin, unconventional and conventional oil and gas, Barney Creek Formation, Coxco Dolomite Member, equivalency, collaboration.
Imperial Oil & Gas
Geophysics and Drilling Collaboration
Final Report for Saint Vidgeon Project
EP184
June – August 2014
Contact: [email protected] Datum/Zone: GDA 94 – Zone 53 1:250,000: Urapunga SD5310 Target: Saint Vidgeon Formation
Saint Vidgeon Drilling Collaboration Final Report 2 | P a g e
SUMMARY
The Saint Vidgeon Project area is located in the northwest of tenement EP184 held by Imperial Oil & Gas (IOG) for the purpose of petroleum exploration. In the 2014 field season IOG undertook the drilling of four shallow partially cored holes and re-entered and deepened one of these wells. The first well was spudded on the 12/07/2014. Rig release on the last well was on the 18/08/2014. The target was the Saint Vidgeon Formation of the Vizard Group. The wells are located within the Urapunga Fault Zone, a structural sub-basin in the McArthur Basin, previously not known as a possible petroleum system. The shallow core holes reached a depth of between 102 - 120 m. The re-entered hole, BCF SC 04-a, deepened the original well BCF SC 04 to 273 m. This project is part of on-going program to understand the depositional environments and petroleum potentials of the region.
The objective of the four shallow exploration holes was to:
1. Obtain fresh unweathered rock samples of the Saint Vidgeon Formation to obtain material sufficient for various geochemical analyses.
2. Verify that the Saint Vidgeon Formation in the Urapunga Fault Zone contains zones within its upper section (Unit 2) that contain carbonaceous black shale.
3. Determine equivalency of the upper Saint Vidgeon Formation to a proven unconventional target in the Batten Fault Zone, the Barney Creek Formation (BCF).
The objective of the re-drilled and deepened well BCF SC 04-a was to:
4. Test if the lower section of the Saint Vidgeon Formation (Unit 1) is equivalent to the Coxco Dolomite Member within the Batten Fault Zone. Within the Batten Fault Zone this dolomite is recognised as a conventional petroleum target.
Drill sites were chosen in vicinity of outcrops marked on the NTGS published 250K geology maps and positioned to penetrate the target formation below the predicted zone of oxidation at ~50 m. Varying weathering profiles were encountered at the four locations, indicating that the depth of oxidation is highly dependent on the local geology. Black carbonaceous shales were encountered in the second and subsequently deepened well, BCF SC 04. This verifies that the Saint Vidgeon Formation of the Urapunga Fault Zone contains black shales. The Coxco Dolomite Member has not been identified in the deepened well.
Source rock potential and mineralogy analysis were conducted by the Sprigg Research Laboratories at the Mawson Centre at the University of Adelaide on a series of samples taken from the core. Total organic carbon contents were relatively low between 0.98 to 1.52 %. RockEval pyrolysis results indicated that the organic material is overmature, and can be classified as residual inert kerogen. Because of low S2 values, other source rock parameters like Tmax and %Ro (calc.) could not be reliably determined.
Analytical results from these samples were compared with the data and conclusion collected by the Australian Shale Carbon Sequestration Group of the University of Adelaide in 2013 on samples from the BCF. Parallels were found in the geochemical characteristics and north-south trends, including even-over-odd predominance of short-chain alkanes, increasing thermal maturity and decreasing organic richness towards the north, limited residual potential and high concentration of silica in combination with low carbonate.
Through the Saint Vidgeon Project IOG was able to show that carbonaceous shales exist in the Urapunga Fault Zone and that parallels exist between the organic matter and mineralogy of the
Saint Vidgeon and BCF.
Saint Vidgeon Drilling Collaboration Final Report 3 | P a g e
Contents
Summary .............................................................................................................................. 2
1 Introduction ................................................................................................................... 7
1.1 Location, Access and Area Description ................................................................... 7
1.2 Tenure .................................................................................................................... 7
2 Geology ....................................................................................................................... 10
2.1 Regional Geology ................................................................................................. 10
2.2 Local Geology ....................................................................................................... 12
2.2.1 BCF SC 05 .................................................................................................... 13
2.2.2 BCF SC 04 .................................................................................................... 13
2.2.3 BCF SC 04-a ................................................................................................. 13
2.2.4 BCF SC 03 .................................................................................................... 13
2.2.5 BCF SC 02 .................................................................................................... 13
3 Previous Exploration ................................................................................................... 15
3.1 Wells in proximity .................................................................................................. 15
3.1.1 Mineral Wells ................................................................................................. 15
3.1.2 Petroleum Wells ............................................................................................. 16
3.2 Gas discoveries in the McArthur Group of the McArthur Basin .............................. 17
4 Exploration Concept .................................................................................................... 19
5 Details of the Collaboration Program ........................................................................... 20
5.1 Details on wells ..................................................................................................... 20
5.2 Wireline logging .................................................................................................... 23
5.3 Geochemistry ........................................................................................................ 24
6 Results and Interpretation ........................................................................................... 26
6.1 Drilling results ....................................................................................................... 26
6.1.1 Well BCF SC 05 ............................................................................................. 26
6.1.2 Well BCF SC 04 ............................................................................................. 27
6.1.3 Well BCF SC 04-a ......................................................................................... 27
6.1.4 Well BCF SC 03 ............................................................................................. 29
6.1.5 Well BCF SC 02 ............................................................................................. 30
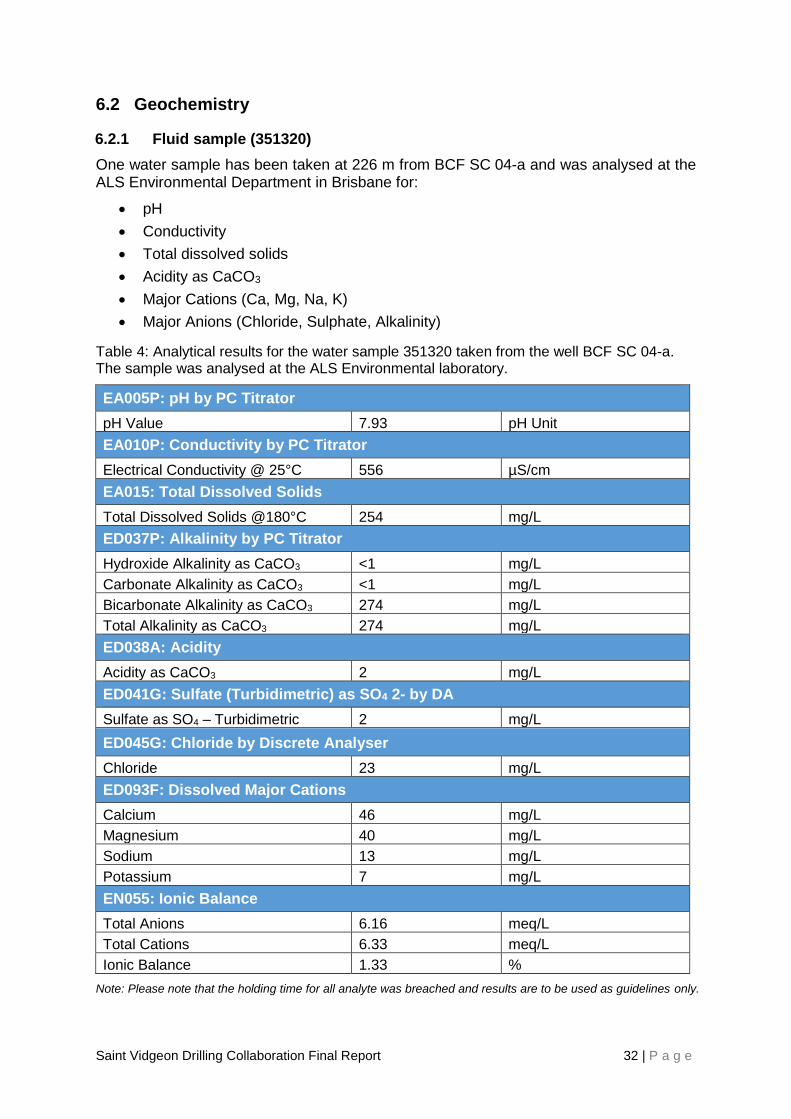
6.2 Geochemistry ........................................................................................................ 32
6.2.1 Fluid sample (351320) ................................................................................... 32
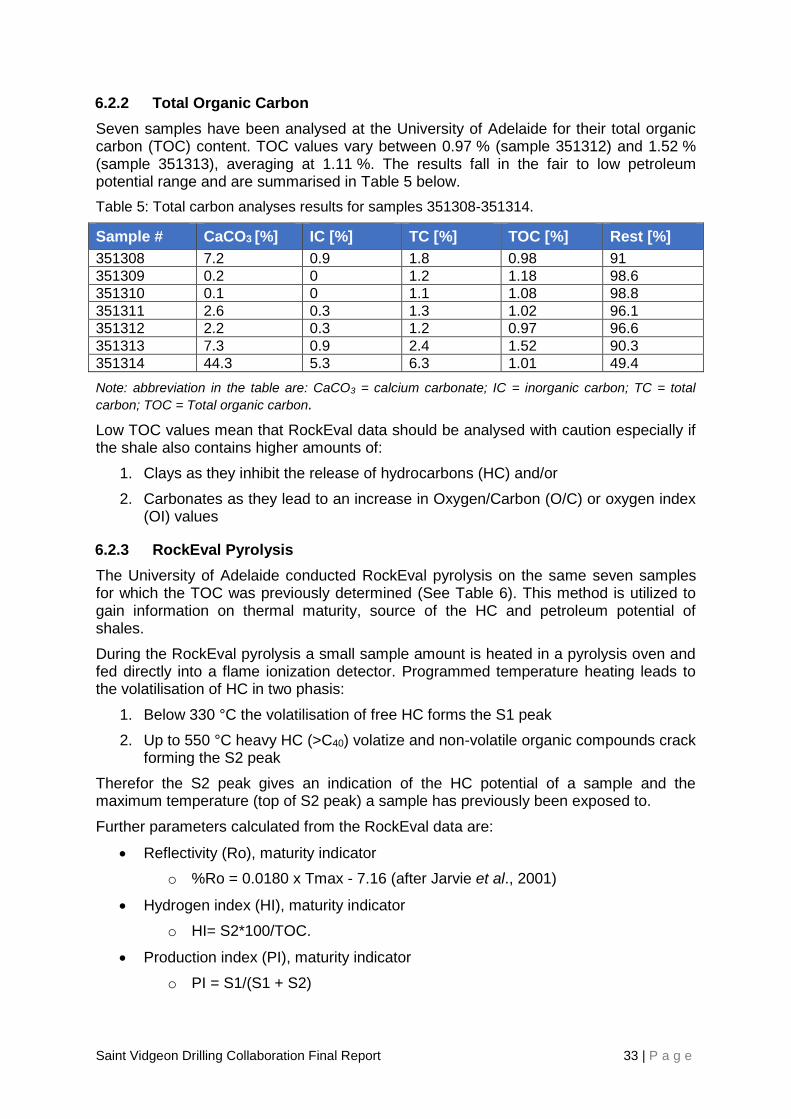
6.2.2 Total Organic Carbon ..................................................................................... 33
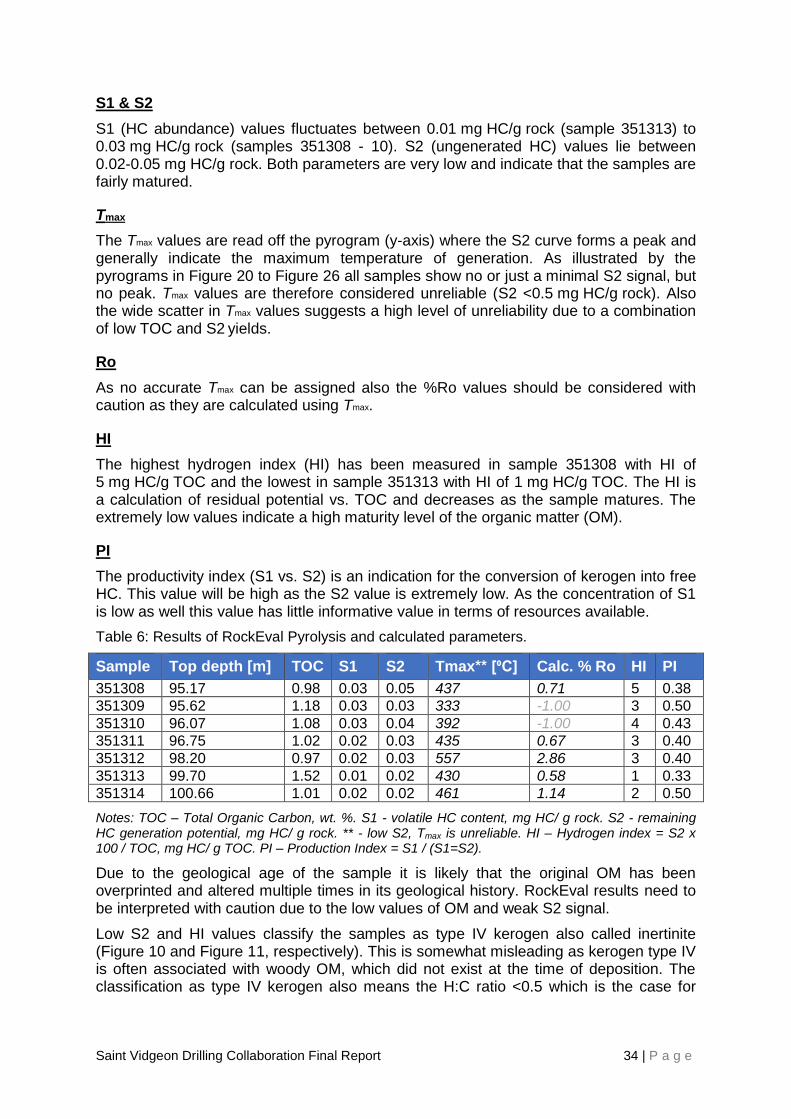
6.2.3 RockEval Pyrolysis ........................................................................................ 33
6.2.4 GCMS ............................................................................................................ 36
6.2.5 X-ray diffraction .............................................................................................. 37
6.2.6 X-ray fluorecense ........................................................................................... 40
6.2.7 ICP- tace element analysis ............................................................................ 48
6.3 Geophysics ........................................................................................................... 53
7 Conclusion .................................................................................................................. 59
References ...................................................................................................................... 60
Appendix I: Pyrogramms ..................................................................................................... 63
Appendix II: Chromatograms ............................................................................................... 67
Saint Vidgeon Drilling Collaboration Final Report 4 | P a g e
List of Figures:
Figure 1: Location of shallow core holes drilled during the Saint Vidgeon Project on topography (AUSMEC Geoscience, 2014). 8
Figure 2: Mean monthly rainfall in the Ngukurr community. Data were retrieved from the Australian Government Bureau of Meteorology site http://www.bom.gov.au at the 28/05/2014. 9
Figure 3: Geological setting of the McArthur Basin modified after Rawlings, 1999 (ARI 2013). 11
Figure 4: Simplified stratigraphy comparison between the Batten Fault Zone and Urapunga Fault Zone (AUSMEC Geoscience 2014). 12
Figure 5: Location of shallow core holes drilled during the Saint Vidgeon Project shown on surface geology obtained from the Urapunga-Roper River 1:250k sheet (AUSMEC Geoscience, 2014). 14
Figure 6: BCF SC 05 wireline log and preliminary lithology and stratigraphy interpretation. 26
Figure 7: BCF SC 04 and BCF SC 04-a wireline log and preliminary lithology and stratigraphy interpretation. 28
Figure 8: BCF SC 03 wireline log and preliminary lithology and stratigraphy interpretation. 29
Figure 9: BCF SC 02 wireline log and preliminary lithology and stratigraphy interpretation. 31
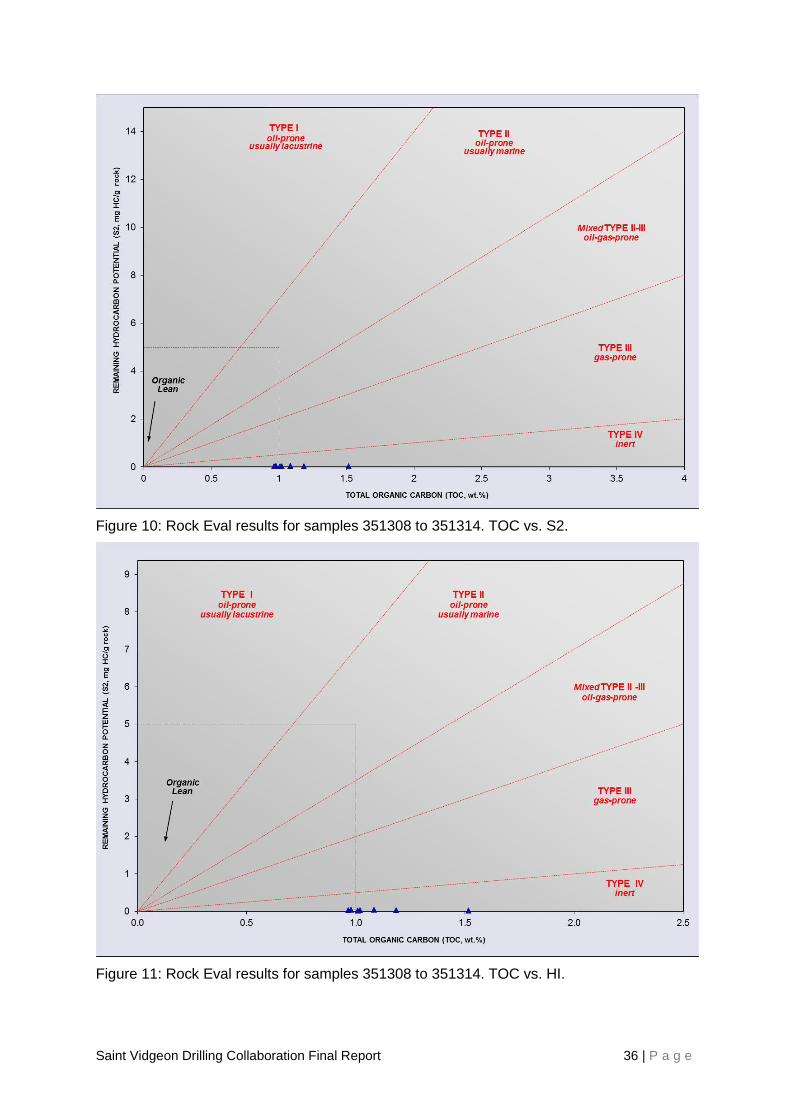
Figure 10: Rock Eval results for samples 351308 to 351314. TOC vs. S2. 36
Figure 11: Rock Eval results for samples 351308 to 351314. TOC vs. HI. 36
Figure 12: Preliminary XRD data for sample 351308. 38
Figure 13: Preliminary XRD results for sample 351310. 39
Figure 14: Major elements vs. depth of the samples 351301, 05, 09, 13 and 16 from the wells BCF SC 04 (blue dots) and 05 (red dot) collected during the 2014 drilling season. 47
Figure 15: BCF SC 04-a strip log – Lithology cross plotted with gamma (blue), density (black) and calliper (red) logs. NB: Log does not show overlap with BCF SC 04 above 50 m.54
Figure 16: BCF SC 04 composite wireline log from 80 m to TD. 55
Figure 17: Comparison of logs between BCF SC 03 and 04. 56
Figure 18: Comparison of logs between BCF SC 04 and 05. 57
Figure 19: Fence diagram of stratigraphy for Rio Tinto wells (1997) and Saint Vidgeon Project wells. From left to right wells are orientated from north to south on the north-western boundary of the UFZ, besides BCF SC 02 which is located on the north-eastern boundary of the UFZ. 58
Figure 20: Pyrogram of sample 351308. 63
Figure 21: Pyrogram of sample 351309. 63
Figure 22: Pyrogram of sample 351310. 64
Figure 23: Pyrogram of sample 351311. 64
Figure 24: Pyrogram of sample 351312. 65
Figure 25: Pyrogram of sample 351313. 65
Figure 26: Pyrogram of sample 351314. 66
Figure 27: Chromatogram of sample 351308. Total ion current (all compounds). 67
Saint Vidgeon Drilling Collaboration Final Report 5 | P a g e
Figure 28: Chromatogram of sample 351308 showing only the compounds containing m/z 57 fragment (characteristic of n-alkanes). Peak distribution shows pronounced even-over-odd (EOP) chain length predominance of short chained n-alkanes. 67
Figure 29: Chromatogram of sample 351310. Total ion current (all compounds). 68
Figure 30: Chromatogram of sample 351310 showing only the compounds containing m/z 57 fragment (characteristic of n-alkanes). Peak distribution shows pronounced even-over-odd (EOP) chain length predominance of short chained n-alkanes. 68
Saint Vidgeon Drilling Collaboration Final Report 6 | P a g e
List of Tables:
Table 1: Exploration tenement 184 overview with relevant dates. 7
Table 2: Summary of well details for shallow core holes drilled during the Saint Vidgeon Project. Coordinates are given in MGA, Zone 53. 22
Table 3: Summary of samples taken during 2014 drilling season in EP184 and analysis done. Y= Yes. 25
Table 4: Analytical results for the water sample 351320 taken from the well BCF SC 04-a. The sample was analysed at the ALS Environmental laboratory. 32
Table 5: Total carbon analyses results for samples 351308-351314. 33
Table 6: Results of RockEval Pyrolysis and calculated parameters. 34
Table 7: Results from major element analysis given in % of samples from the 2014 core wells BCF SC 04 (four samples) BCF SC 05 (one sample). 42
Table 8: Comparison of average composition of samples from the 2014 drilling program, with average shale values from 3rd party studies. Averages used were North American Shale Composite (NASC) from Gromet et al. (1984), and Pettijohn (1975) and Turekian. 43
Table 9: Pearson correlation coefficient (r) between major elements measured on the samples 01, 05, 09, 13 and 16. Negative correlations > 0.80 have been marked in orange while positive correlations > 0.8 have been marked in green. 43
Table 10: Range of element ratios for Saint Vidgeon Project samples compared to black shale samples from eastern India (Mir, 2014), felsic rocks and mafic rocks (data retrieved from Mir, 2014). The ranges that the Saint Vidgeon samples fall into have been marked in grey. 49
Table 11: Trace element results for samples from Saint Vidgeon Project and average shale data for comparison (determined by Wedepohl (1971, 1991) (sourced from Ross et al. 2009)). All concentration are given in µg/g. Values from IOG samples that exceed the average shale value have been marked in red. 51
Table 12: Rare earth element results for samples from Saint Vidgeon Project and average shale data for comparison (determined by Wedepohl (1971, 1991) (sourced from Ross et al. 2009). All concentration are given in µg/g. Values from IOG samples that exceed the average shale value have been marked in red. 52

Saint Vidgeon Drilling Collaboration Final Report 7 | P a g e
1 INTRODUCTION
1.1 Location, Access and Area Description
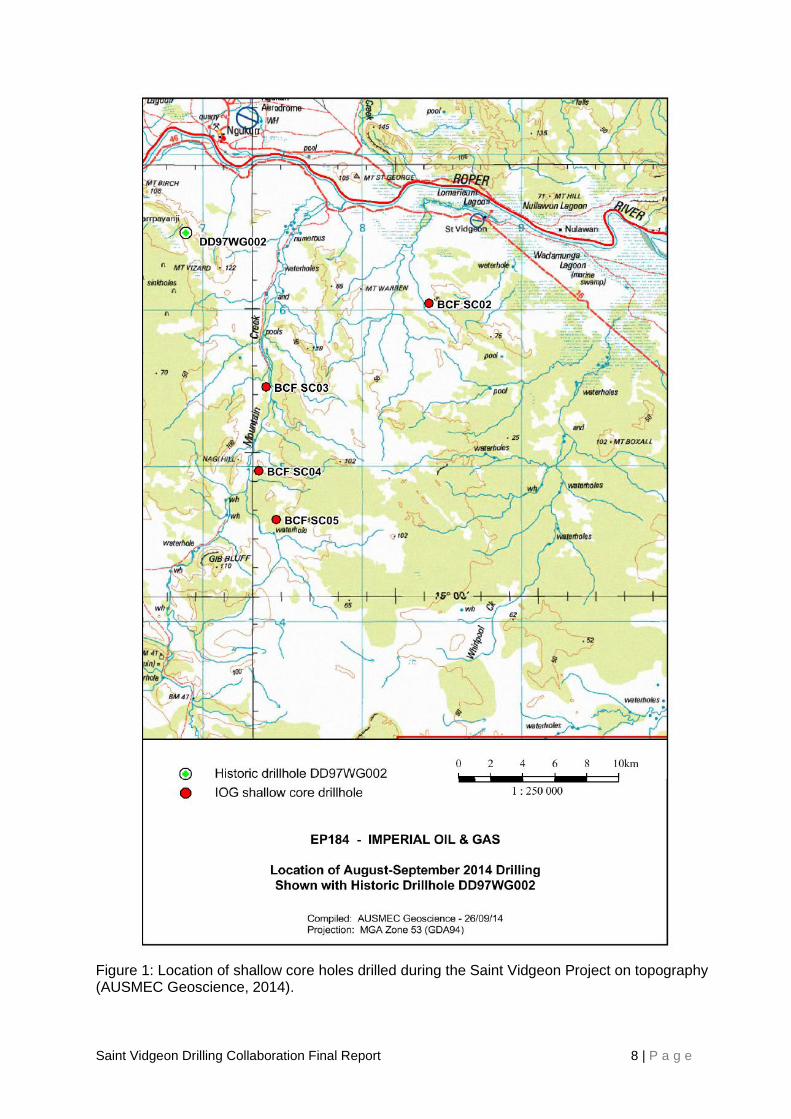
The Saint Vidgeon Project area is located in the north-west corner of exploration tenement 184 (EP184) south of the Arnhem Land in the Roper River Region of eastern Northern Territory. It is situated ~500 km southeast of Darwin and ~180 km east of Mataranka.
To access the Project area coming from Darwin follow the Stuart Highway south for ~425 km until the turnoff to Roper Bar is reached ~5 km south of Mataranka. The single strip, sealed Roper Highway after ~175 km leads to Roper Bar. From Roper Bar the core hole locations are four-wheel drive accessible via old station, military tacks and newly developed purpose specific access tracks.
The Saint Vidgeon Project is located in the Urapunga (SE53-10) 1:250 000 scale topographic sheets.
Based on the Köppen-Geiger climate classification the project area is situated in the transition zone between the tropical and semi-arid zones and experiences tropical savannah climate with a distinct wet and dry season that limits the field season to April till October. The local area experience an average rainfall between 600 – 800 mm per year. Figure 2 displays the mean monthly rainfall for the Ngukurr region at the northern end of the tenement from 1910 - 2012.
1.2 Tenure
Much of the sections of EP184 is Native Title land, held by the Wandarang, Alawa, Marra and Ngalakan Peoples. The project area is located in the Limmen National Park. In conjunction with approvals from the relevant traditional land owners and the Dept. Mines and Energy, approvals from the Northern Territory Parks and Wildlife Services have been provided to conduct operations within the park boundary.
Table 1: Exploration tenement 184 overview with relevant dates.
Tenement Number of Blocks Application Date Grant Date Expiry Date
EP184 173 12/04/2014 21/08/2013 20/08/2018
Saint Vidgeon Drilling Collaboration Final Report 8 | P a g e
Figure 1: Location of shallow core holes drilled during the Saint Vidgeon Project on topography (AUSMEC Geoscience, 2014).

Saint Vidgeon Drilling Collaboration Final Report 9 | P a g e
Figure 2: Mean monthly rainfall in the Ngukurr community. Data were retrieved from the Australian Government Bureau of Meteorology site http://www.bom.gov.au at the 28/05/2014.

Saint Vidgeon Drilling Collaboration Final Report 10 | P a g e
2 GEOLOGY
2.1 Regional Geology
The regional geology of the McArthur Basin (c. 1 860- c. 1 500 Ma) is well summarised by Jackson et al. (1987), Plumb and Roberts (1992), Plumb et al. (1990), Madigan and Rawlings (1994) and Pietsch et al. (1994).
The Paleo- to Mesoproterozoic McArthur Basin stretches from the Queensland-Northern Territory border, along the west coast of the Gulf of Carpentaria into Arnhem Land (See Figure 3). Its outcropping extension has been reported as 170 000 km2 by Crick (1989) and 200 000 km2 by Goodwin (1996), with a relatively unknown, but large section, which sub-crops below younger sequences. The basin contains successions of unmetamorphosed sediments and minor volcanics ranging from 5 - 12 km in thickness (Crick, 1989 and Plumb and Wellman, 1987).
The main structural features reflecting the tectonic evolution of the McArthur Basin are east-west trending basement ridges such as the Murphy and the Urapunga Ridges, northwest-trending strike-slip faults, such as the Calvert, Mallapunyah and Bulman Faults and north-trending high angle older normal faults with later inversion, such as the Emu, Tawallah and Four Arches faults.
The McArthur Basin is geographically and tectonically separated into the northern and the southern McArthur Basin by the Urapunga Fault Zone, an east-west trending structural sub-basin. In the northern McArthur Basin the Walker Trough is a major structural feature flanked by the Caledon Shelf to the East and the Arnhem Shelf to the West. The major fault zone in the southern McArthur Basin is the Batten Fault Zone, flanked by the Bauhinia Shelf to the West and the Wearyan Shelf to the East.
The lithostratigraphic groups in these regions are not always identical (See Figure 4).
In the southern McArthur Basin the stratigraphy is subdivided into four stratigraphic groups separated by regional unconformities. The groups of the Paleo- to Mesoproterozoic are the Tawallah, McArthur, Nathan, and Roper Groups. An unnamed sequence of Neoproterozoic sediments accumulated over the Roper Group. Organic-rich source rocks with the potential to generate both oil and gas are present in several intervals within thick shales of the McArthur Group such as the Barney Creek Formation (BCF). Carbonate reservoirs with good vuggy porosities have been observed in the Coxco Dolomite Member underlying the BCF.
In the Urapunga Fault Zone the same time span is represented by the Vizard, Nathan and Roper Groups, and no equivalent to the lowermost Tawallah Group has been currently identified and is considered not to exist. The Vizard Group is proposed to be a chronostratigraphic equivalent to parts of the McArthur Group and is therefore seen as a potential conventional and unconventional oil and gas target.

Saint Vidgeon Drilling Collaboration Final Report 11 | P a g e
Figure 3: Geological setting of the McArthur Basin modified after Rawlings, 1999 (ARI 2013).
Saint Vidgeon Drilling Collaboration Final Report 12 | P a g e
Figure 4: Simplified stratigraphy comparison between the Batten Fault Zone and Urapunga Fault Zone (AUSMEC Geoscience 2014).
2.2 Local Geology
The northern section of EP184 is dominated by the Urapunga Fault Zone, an extensively faulted structural sub-basin, approximately 50 to 70 km wide.
The Urapunga Fault Zone is proposed to have been a paleo-high called the, Urapunga Tectonic Ridge (Crick, 1989). Later occurring tectonic activity formed a thrust fault zone known as the Urapunga Fault Zone. While up to 12 km thick successions of McArthur Group accumulated in the Batten Trough, and 4 - 9 km on the Bauhinia and Wearyan Shelves, the sediment cover on the Urapunga Tectonic Ridge was much thinner (Crick, 1989).
The stratigraphy of the Urapunga Fault Zone is subdivided into three stratigraphic groups separated by regional unconformities, the Vizard, Nathan and Roper Groups.
The Vizard Group is proposed to be an equivalent to the McArthur Group in the southern McArthur Basin. It is subdivided into the Nagi and Saint Vidgeon Formations. The Australian Stratigraphic Units Database describes the Nagi Formation as a dolomitic and feldspathic sandstone, dolomitic siltstone and dolarenite. The Saint Vidgeon Formation has been divided into two major units. The upper unit (Unit 2) is proposed to be equivalent to the BCF while the lower section (Unit 1) is equivalent to the Coxco Dolomite Member. These units have been described in the NTGS 250k Maps and Explanatory Notes as followed:
Upper part:
Tuffaceous and dolomitic SILTSTONE: grey and purple, locally ripple x-laminated;
Stromatolitic DOLOLUTITE: abundant pink tuff beds. Lower part:
DOLOSTONE: buff, laminated to structureless, locally stromatolitic, small "cauliflower" chert nodules, pseudomorphs of radiating acicular crystals, patchy silicification (Coxco needles);
Minor dolomitic SILTSTONE: minor thin pink tuffaceous beds.
Saint Vidgeon Drilling Collaboration Final Report 13 | P a g e
The Australian Stratigraphic Units Database on the other hand refers to the Saint Vidgeon Formation as being carbonaceous-pyritic shale and dolomitic siltstone, dolostone; minor pink chert beds (tuff?).
2.2.1 BCF SC 05
The well was positioned between an outcrop of Saint Vidgeon Formation, 90 m south and dipping 15° NNW, and an outcrop of Nagi Formation, 140 m to the north dipping 10° NE (See Figure 5). The contact between the Nagi and Saint Vidgeon Formation is covered by Quaternary sediments in this location. Using the given distances to the outcrops and dips the well was prognosed to drill into the Saint Vidgeon Formation at around 25 m, after going through minor amounts of cover sediments and the Nagi Formation.
2.2.2 BCF SC 04
Utilizing the NTGS 250k surface geology map, BCF SC 04 was positioned 150 m east of a Saint Vidgeon Formation outcrop with an inferred dip of 20°, using dip information from the closest Saint Vidgeon outcrop about 1 km south (See Figure 5). On the basis of this information, the well was prognosed to be collared in the Nagi Formation, and it was calculated to hit the Saint Vidgeon Formation around 55 m.
2.2.3 BCF SC 04-a
Analysis of BCF SC 04 chip and core samples suggest that at this location the top of the Saint Vidgeon Formation is at 51 m. Outcrops in the area suggest an average thickness of the Saint Vidgeon Formation of about 320 m, which would put the base of the Saint Vidgeon at around 370 m. It was therefore prognosed that the well would penetrate into the lower unit of the Saint Vidgeon Formation.
2.2.4 BCF SC 03
According to the NTGS 250k surface geology map BCF SC 03 was prognosed to collard in Quaternary cover (See Figure 5). As the boundary between the Nagi and Saint Vidgeon Formations is covered by Quaternary sediments in this area, the top of the Saint Vidgeon Formation has been inferred using outcrops to the south and north, which locates the top of Saint Vidgeon Formation about 130 m southwest of the drill site. With a dip of 20°, theoretically the Saint Vidgeon should have been penetrated at a depth of 50 m.
2.2.5 BCF SC 02
The well was proposed to be collared on an outcrop of Saint Vidgeon Formation, the only outcrop of Saint Vidgeon Formation on the other side (northeast) of the basin, from the side drilled by the other holes (See Figure 5). The basin here being the structural entity of the Urapunga Fault Zone (UFZ), comprising Vizard Group overlain by Nathan Group, and bounded by thrust faults. The outcrop is located between two thrust faults and has uplifted older units relative to the surrounding formations and has a width of 250 m. Dips in the thrust fault zone are shown to be 50° and 70° to the SW on the 250k geology map. Due to the shallow nature of the well, uncertainties about the formation boundaries, dips and faults, and its unique location between two thrust faults, there was a high risk that the Saint Vidgeon Formation might be lower, higher or not even present in this location.
Saint Vidgeon Drilling Collaboration Final Report 14 | P a g e
Figure 5: Location of shallow core holes drilled during the Saint Vidgeon Project shown on surface geology obtained from the Urapunga-Roper River 1:250k sheet (AUSMEC Geoscience, 2014).

Saint Vidgeon Drilling Collaboration Final Report 15 | P a g e
3 PREVIOUS EXPLORATION
A search of the NT Drill Holes data base for hydrocarbon and mineral holes has shown previous limited shallow drilling in close proximity to the proposed location by the Bureau of Mineral Resources, Pacific Oil & Gas and Rio Tinto.
The nearest existing wells found in the records are two mineral wells to the north (DD97WG001 and 002) and five mineral wells DD98WG003 – 007, all drilled by Rio Tinto in 1987 and 1998, respectively. The nearest existing petroleum wells in the Urapunga area are to the northwest of the proposed locations, Urapunga 4 to 6. Also of significance but in a fair distance to the Saint Vidgeon Project are the and petroleum wells, Alexander-1 and Scarborough-1 drilled to the south in 1987 by Pacific Oil & Gas and encountered hydrocarbons in the Velkerri Formation, as well as Shea-1 to the west.
3.1 Wells in proximity
The closest historical wells in the area are two Rio Tinto mineral core-holes from 1997 (DD97WG001 and DD97WG002), sited 11 km north of BCF SC 03, and five wells from 1998 (DD97WG003-007) just 1 km south of BCF SC 05. DD97WG001 and DD97WG002 were the only holes reporting to have penetrated the Saint Vidgeon Formation (Company Report: CR19980574).
DD97WG001 was abandoned at 81.9 m after hitting a fracture at 74.6 m indicated by a 1 m cavity. The diamond drill hole ledger shows possible Saint Vidgeon Formation between 22.60 to 74.6 m.
The diamond core hole DD97WG002 was collared in the lower Nagi Formation and at 25.6 m the well went into the Saint Vidgeon Formation, where it terminated at a depth of 179.2 m MD after 14 days of drilling. The lithology of the Nagi Formation is dominated by a medium grained, quartz and feldspar-rich sandstone and quartz-lithic conglomerate. The main lithology of the Saint Vidgeon Formation are shale and sandstone. The dominant colour in the top part is light to dark grey and changes to varieties of pink at around 55 m. Weathering is reported throughout the entire well with minor sections described as fresh and/or silicified. Core loss occurred frequently.
3.1.1 Mineral Wells
The diamond core hole DD97WG001 and DD97WG002 were drilled in 1997 by Rio Tinto at the Mt Birch prospect to explore for stratabound base metal mineralisation, within the mid-Proterozoic Vizard and Nathan Groups. The two wells lie only 130 m apart and 16 km north of the proposed drill location BCF SC 04-a.
The diamond core hole DD97WG001 was drilled to 81.9 m. The well was collard in the Nagi Formation at 468808 mE and 836489 mS. The well was drilled at an inclination of -60⁰ with an azimuth of 215⁰ and went into the Saint Vidgeon Formation around 23 m. The hole intersected a fault zone at 20 m within the upper Saint Vidgeon Formation dolomites and siltstones. Core loss and poor sample return were frequent. The rock was silicified from 76 m down hole.
The diamond core hole DD97WG002 (COREDAT ID: 3422) was collared in the lower Nagi Formation of the Vizard Group, a quartz sandstone and conglomerate. The top of the water table was encountered at 49 m. No significant water influx was recorded in the Drill Hole Ledger (Report CR19980574_1998_GA). At 25.6 m the well went into the Saint Vidgeon Formation, the (reported) Barney Creek Formation equivalent in the Urapunga Fault Zone, where it terminated at a depth of 179.2 m MD after 14 days of drilling. The lithology of the Nagi Formation is dominated by a medium grained, quartz
Saint Vidgeon Drilling Collaboration Final Report 16 | P a g e
and feldspar rich sandstone and quartz-lithic conglomerate. The main lithology of the Saint Vidgeon Formation are shale and sandstone. The dominant colour in the top part is light to dark grey and changes to varieties of pink at around 55 m. Weathering is reported throughout the entire well with minor sections described as fresh and/or silicified. Core loss occurred frequently.
Five diamond core holes (DD98WG003 - 007) were drilled by Rio Tinto in 1998 at Mountain Creek prospect, approx. 5 km south of BCF SC 04-a. All five wells were interpreted to lie entirely in the Knuckey Formation (Pnk) of the Nathan Group, but frequent intersection of pinkite (pink tuff layers) might indicate intersection of Saint Vidgeon or Nagi Formation instead.
Diamond hole DD98WG003 consisted of 36 m of RC collar with a diamond core tail extending to 236.2 m. Drilling took 8 days, the top of the water table was intersected at 45 m
Diamond hole DD98WG004 was drilled to 217.7 m. The base of weathering was at 33 m and primarily dark-grey carbonaceous carbonates of the Knuckey Formation was intersecting.
DD98WG005 was originally drilled with a 42 m RC pre-collar and diamond tail to 74.4 m, but very broken and faulted ground forced re-drilling of this hole about 2 m away with 118 m RC pre-collar and a diamond tail of 165.8 m. Strong fracturing and faulting forced the abandonment of the hole. Intersected weathered siltstone and shales.
DD98WG006 was a core extension of RC98WG006 to 219.2 m. The hole intersected fresh laminated dolomitic, carbonaceous siltstones and stromatolites, evaporitic, sandy and massive light grey dolomitic siltstone of the Knuckey Fm.
DD98WG007 had a 30 m RC pre-collar and a diamond core tail extending to 131.1 m depth the base of oxidation was encountered at 24 m and the entire section was interpreted as Knuckey Formation.
The Urapunga wells (1 - 6) were drilled by the Bureau of Mineral Resources to obtain fresh core material from the Roper Group to study stratigraphy, sedimentology and hydrocarbons (HC). Three shallow cores (1-3) were drilled in 1983 which supplement three fully cored holes drilled in 1985 (4-6).
3.1.2 Petroleum Wells
BMR Urapunga 4 was collard 66 km northwest of BCF SC 04-a and went vertically to a TD of 532 m. Stratigraphy encountered in this well include McMinn Formation (0 - 41.2 m), Velkerri Formation (41.2 – 372.1 m), Bessie Creek Sandstone (372.1 - 397.6 m) and Corcoran Formation (397.6 – 532 m). The thick intersection of Velkerri Formation contains several extensive layers of organic rich shale. Live oil was encountered at 342.8 m and 346.0 – 347.5 m. Further evidence of a good HC source rock was found in the Moroak Sandstone Member of the McMinn Formation and Bessie Creek Sandstone where bitumen and oil stains in vuggy intervals point towards HC migration.
BMR Urapunga 5 (TD 604 m) is located 43 km northwest of BCF SC 04-a and was collard in the Munyi Member. It intersected the Abner Sandstone and Crawford Formation and reached TD in the Mainoru Formation. No HC were encountered in this well.
BRM Urapunga 6 is located 31 km northwest of BCF SC 04-a and was drilled to a total depth of 422.8 m through the Limmen Sandstone into the Mantungula Formation of the Lower Roper Group. The well was therefore stopped above our target formation. Neither

Saint Vidgeon Drilling Collaboration Final Report 17 | P a g e
of the two intersected formations show source rock potential or adequate porosity and permeability.
Scarborough-1 is a petroleum well drilled by Pacific Oil & Gas in 1987. The well is located 190 km east of Mataranka and 28 km south of BCF SC 04-a. It intersected five different formations being from top to TD: Kyalla Member (0 – 52 m), Moroak Sandstone Member (52 – 122 m), Velkerri Formation (122 – 621 m), Bessie Creek Sandstone (621 – 667 m) and Corcoran Formation (667 - 691.3 m TD). In total 499 m of Velkerri Formation were intersected. The Velkerri Formation was divided into three section: “upper” Velkerri from 122-295 m (thickness 173 m), “middle” Velkerri from 295 – 457 m (thickness 162 m) and “lower” Velkerri from 457 – 621 m (thickness 164 m). Different HC occurrences were reported in the Moroak Member, Velkerri Formation and Bessie Creek Sandstone. The Moroak Member showed bitumen blebs in vugs and oil and bitumen staining throughout. The Velkerri Formation showed occasional kerosene odour throughout the section, minor oil bleeds in association with carbonate veinlets as well as all colours of fluorescence between 270 – 470 m. The Bessie Creek Sandstone had bitumen pore-fillings throughout as well as rare yellow/green fluorescence and relict oil/water contact at 642.7 m.
Alexander-1 was drilled in 1987 by Pacific Oil & Gas to a TD of 689.6 m. The well lies 29 km south southeast of BCF SC 04-a. Sections intersected are almost identical to those drilled in Scarborough-1. Moroak sandstone Member 0- 62 m, Velkerri Formation 62 – 617 m (thickness 555 m), Bessie Creek Sandstone 617 – 661 m and Corcoran Formation 661 – 689.6 m (TD). The Velkerri Formation was divided into three section. The “upper” Velkerri extends from 62-280 m with a thickness of 218 m. The “middle” Velkerri was intersected from 280 – 446 m (thickness 166 m) and described as highly carbonaceous mudstone/shale with common Pyrite, occasional oil bleeds and olive black to black colouring. The “lower” Velkerri extends from 446 – 617 m (thickness 171 m) and is described as a partly glauconitic carbonaceous mudstone.
Shea-1 is a stratigraphic well that was drilled in 1991 by Pacific Oil & Gas and CSIRO in a joint research project. The well is located about 75 km east-southeast of Mataranka and 108 km west of BCF SC 04-a. The objective to the CSIRO was to determine in-situ rock properties of the “middle” Velkerri Formation. The well was spudded in the Proterozoic Bukalorkmi Member of the McMinn Formation, followed by a thicker than prognosed Kyalla Member. Moroak Sandstone Members and the McMinn Formation were also intersected before entering the “upper” Velkerri Formation at 284.89 m interbeds of mudstone and siltstone. The black, carbonaceous mudstone of the “middle” Velkerri Formation was intersected between 468.9 – 609 m. The hole was terminated at 616 m in the bluish grey claystone of the “lower” Velkerri Formation.
3.2 Gas discoveries in the McArthur Group of the McArthur Basin
In 1979 Amoco Minerals and Kennecott Exploration drilled in the Glyde sub-basin of the Batten Fault Zone in the southern McArthur Basin, exploring for zinc. The narrow diameter drill hole GRNT-79-encountered 413 m of dolomitic bituminous Barney Creek Formation overlaying a very porous and fractured Coxco Dolomite Member of the McArthur Group, containing bitumen clots in open fractures. Towards the base of the drill wet gas flowed to surface at approximately 300 000 standard cubic feet per day from the Coxco Dolomite from a depth of ~500 m.
In May 2012 Armour Energy drilled their first well Cow Lagoon 1 ~90 km to the north of the discovery in 1979 to a total depth of 1 804 m. Gas was discovered in the Lynott and Reward Dolomite Formations overlying the Barney Creek Formation.

Saint Vidgeon Drilling Collaboration Final Report 18 | P a g e
In July/August 2012 Armour Energy drilled Glyde# 1 and a highly deviated lateral well Glyde 1 ST1 in close vicinity to the original GR9 discovery from Amoco. Glyde# 1 was drilled to a total depth of 698 m. 132 m of black, gas-charged, naturally-fractured, Barney Creek Shale were intersected before entering the Coxco Dolomite Formation. Armour Energy reported consistent background and peak gas while drilling the shale interval.
Glyde #1 lateral well was drilled sub‐horizontally to a measured depth of 840 m (~500 m true vertical depth) and was estimated to intersected the down hole location of the historic GR9 well. Gas concentration were high throughout the dolomites and dolomitic shales.
Saint Vidgeon Drilling Collaboration Final Report 19 | P a g e
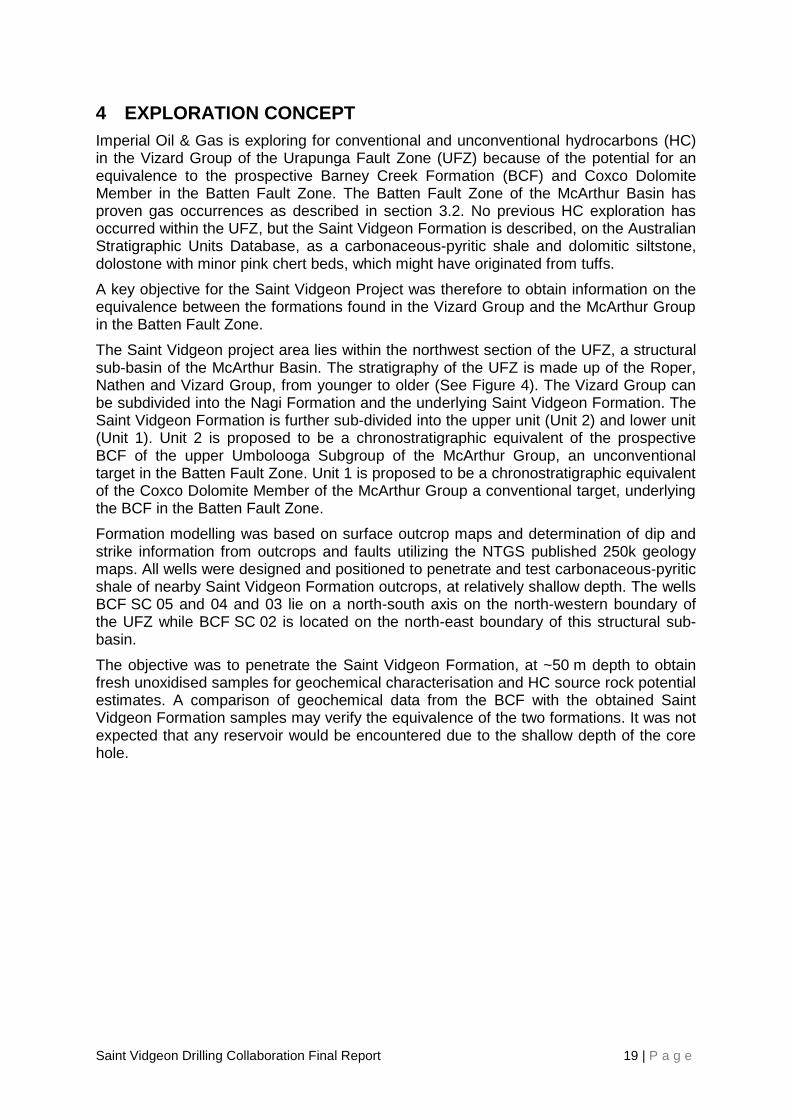
4 EXPLORATION CONCEPT
Imperial Oil & Gas is exploring for conventional and unconventional hydrocarbons (HC) in the Vizard Group of the Urapunga Fault Zone (UFZ) because of the potential for an equivalence to the prospective Barney Creek Formation (BCF) and Coxco Dolomite Member in the Batten Fault Zone. The Batten Fault Zone of the McArthur Basin has proven gas occurrences as described in section 3.2. No previous HC exploration has occurred within the UFZ, but the Saint Vidgeon Formation is described, on the Australian Stratigraphic Units Database, as a carbonaceous-pyritic shale and dolomitic siltstone, dolostone with minor pink chert beds, which might have originated from tuffs.
A key objective for the Saint Vidgeon Project was therefore to obtain information on the equivalence between the formations found in the Vizard Group and the McArthur Group in the Batten Fault Zone.
The Saint Vidgeon project area lies within the northwest section of the UFZ, a structural sub-basin of the McArthur Basin. The stratigraphy of the UFZ is made up of the Roper, Nathen and Vizard Group, from younger to older (See Figure 4). The Vizard Group can be subdivided into the Nagi Formation and the underlying Saint Vidgeon Formation. The Saint Vidgeon Formation is further sub-divided into the upper unit (Unit 2) and lower unit (Unit 1). Unit 2 is proposed to be a chronostratigraphic equivalent of the prospective BCF of the upper Umbolooga Subgroup of the McArthur Group, an unconventional target in the Batten Fault Zone. Unit 1 is proposed to be a chronostratigraphic equivalent of the Coxco Dolomite Member of the McArthur Group a conventional target, underlying the BCF in the Batten Fault Zone.
Formation modelling was based on surface outcrop maps and determination of dip and strike information from outcrops and faults utilizing the NTGS published 250k geology maps. All wells were designed and positioned to penetrate and test carbonaceous-pyritic shale of nearby Saint Vidgeon Formation outcrops, at relatively shallow depth. The wells BCF SC 05 and 04 and 03 lie on a north-south axis on the north-western boundary of the UFZ while BCF SC 02 is located on the north-east boundary of this structural sub-basin.
The objective was to penetrate the Saint Vidgeon Formation, at ~50 m depth to obtain fresh unoxidised samples for geochemical characterisation and HC source rock potential estimates. A comparison of geochemical data from the BCF with the obtained Saint Vidgeon Formation samples may verify the equivalence of the two formations. It was not expected that any reservoir would be encountered due to the shallow depth of the core hole.
Saint Vidgeon Drilling Collaboration Final Report 20 | P a g e
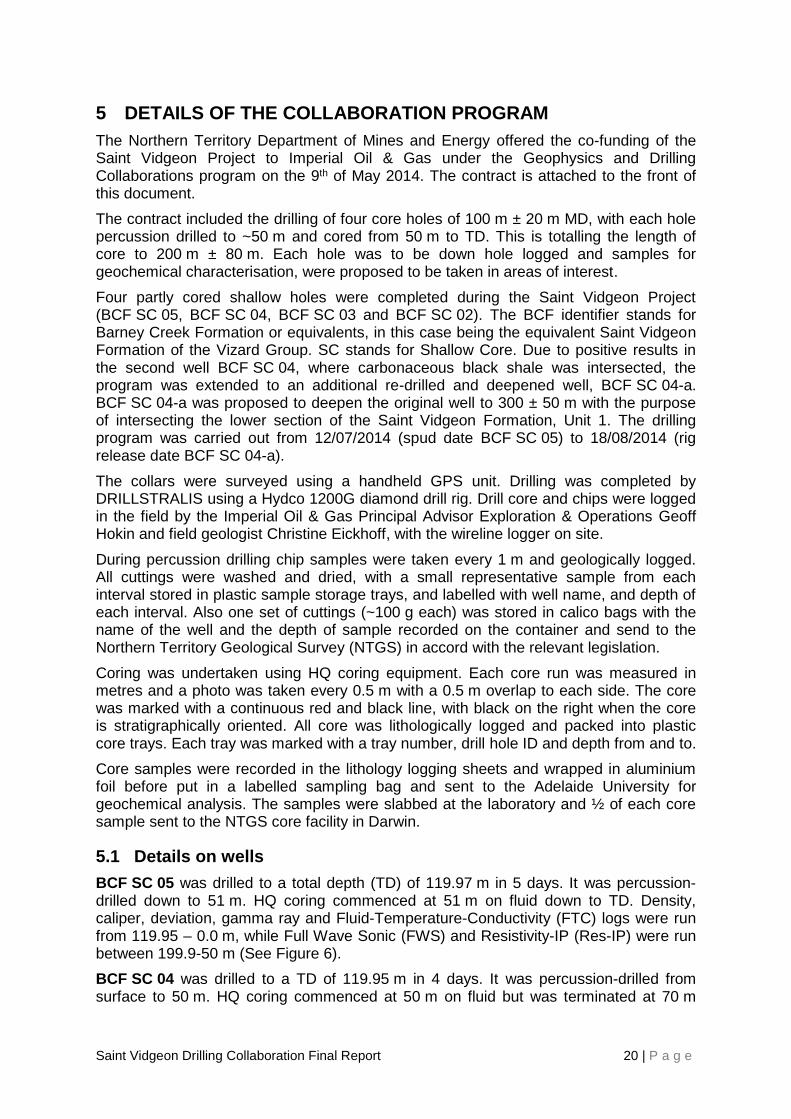
5 DETAILS OF THE COLLABORATION PROGRAM
The Northern Territory Department of Mines and Energy offered the co-funding of the Saint Vidgeon Project to Imperial Oil & Gas under the Geophysics and Drilling Collaborations program on the 9th of May 2014. The contract is attached to the front of this document.
The contract included the drilling of four core holes of 100 m ± 20 m MD, with each hole percussion drilled to ~50 m and cored from 50 m to TD. This is totalling the length of core to 200 m ± 80 m. Each hole was to be down hole logged and samples for geochemical characterisation, were proposed to be taken in areas of interest.
Four partly cored shallow holes were completed during the Saint Vidgeon Project (BCF SC 05, BCF SC 04, BCF SC 03 and BCF SC 02). The BCF identifier stands for Barney Creek Formation or equivalents, in this case being the equivalent Saint Vidgeon Formation of the Vizard Group. SC stands for Shallow Core. Due to positive results in the second well BCF SC 04, where carbonaceous black shale was intersected, the program was extended to an additional re-drilled and deepened well, BCF SC 04-a. BCF SC 04-a was proposed to deepen the original well to 300 ± 50 m with the purpose of intersecting the lower section of the Saint Vidgeon Formation, Unit 1. The drilling program was carried out from 12/07/2014 (spud date BCF SC 05) to 18/08/2014 (rig release date BCF SC 04-a).
The collars were surveyed using a handheld GPS unit. Drilling was completed by DRILLSTRALIS using a Hydco 1200G diamond drill rig. Drill core and chips were logged in the field by the Imperial Oil & Gas Principal Advisor Exploration & Operations Geoff Hokin and field geologist Christine Eickhoff, with the wireline logger on site.
During percussion drilling chip samples were taken every 1 m and geologically logged. All cuttings were washed and dried, with a small representative sample from each interval stored in plastic sample storage trays, and labelled with well name, and depth of each interval. Also one set of cuttings (~100 g each) was stored in calico bags with the name of the well and the depth of sample recorded on the container and send to the Northern Territory Geological Survey (NTGS) in accord with the relevant legislation.
Coring was undertaken using HQ coring equipment. Each core run was measured in metres and a photo was taken every 0.5 m with a 0.5 m overlap to each side. The core was marked with a continuous red and black line, with black on the right when the core is stratigraphically oriented. All core was lithologically logged and packed into plastic core trays. Each tray was marked with a tray number, drill hole ID and depth from and to.
Core samples were recorded in the lithology logging sheets and wrapped in aluminium foil before put in a labelled sampling bag and sent to the Adelaide University for geochemical analysis. The samples were slabbed at the laboratory and ½ of each core sample sent to the NTGS core facility in Darwin.
5.1 Details on wells
BCF SC 05 was drilled to a total depth (TD) of 119.97 m in 5 days. It was percussion-drilled down to 51 m. HQ coring commenced at 51 m on fluid down to TD. Density, caliper, deviation, gamma ray and Fluid-Temperature-Conductivity (FTC) logs were run from 119.95 – 0.0 m, while Full Wave Sonic (FWS) and Resistivity-IP (Res-IP) were run between 199.9-50 m (See Figure 6).
BCF SC 04 was drilled to a TD of 119.95 m in 4 days. It was percussion-drilled from surface to 50 m. HQ coring commenced at 50 m on fluid but was terminated at 70 m
Saint Vidgeon Drilling Collaboration Final Report 21 | P a g e
when the formation got to abrasive to continue coring with the available bits. The 20 m of cored section was reamed with a percussion bit and continued to a depth of 85 m. The basal 35 m of the hole was again cored. FWS and Res-IP were measured between 119.95- 82 m (base of the HWT casing) and density, caliper, deviation, gamma ray and FTC logs between 119.9-0 m.
BCF SC 03 was drilled to a TD of 119.95 m in 2 days. It was percussion-drilled down to 50 m. HQ coring commenced at 50 m on fluid down to TD. Core loss was around 32%. Density, caliper, FWS, deviation, gamma ray and FTC logs were run through the HWT casing from 0-50 m and then down to TD in open-hole, with the exception of FWS, which was only run between 199.9-82 m.
BCF SC 02 was drilled to a TD of 102 m in 3 days. It was percussion-drilled down to 53.8 m. HQ coring commenced at 53.8 m on fluid, but due to high core loss coring was cut short at 65.46 m. The cored section was then reamed out with a larger hammer bit which was also used to drill the lower 36.54 m down to TD (65.46 m – 102 m). Due to the instability of the well, the logs had to be run through the drill pipe and only density, gamma ray and FWS were able to be run.
BCF SC 04-a was a re-entry and deepening of the previously plugged and abandoned well BCF SC 04. It was drilled to a TD of 273.95 m in 10 days. It was percussion-drilled from the surface through to 225 m. No chip samples were taken in the duplicate section of BCF SC 04 between 0 – 120 m. 1 m chip samples were taken between 120 – 225 m and were geologically characterised. HQ coring commenced at 225 m and continued for 48.95 m until TD was reached. FWS and Res-IP were measured between 273.7 - 119 m (base of the HWT casing) and density, caliper, deviation, gamma ray and FTC logs between 273.7-119.9 m.
Saint Vidgeon Drilling Collaboration Final Report 22 | P a g e
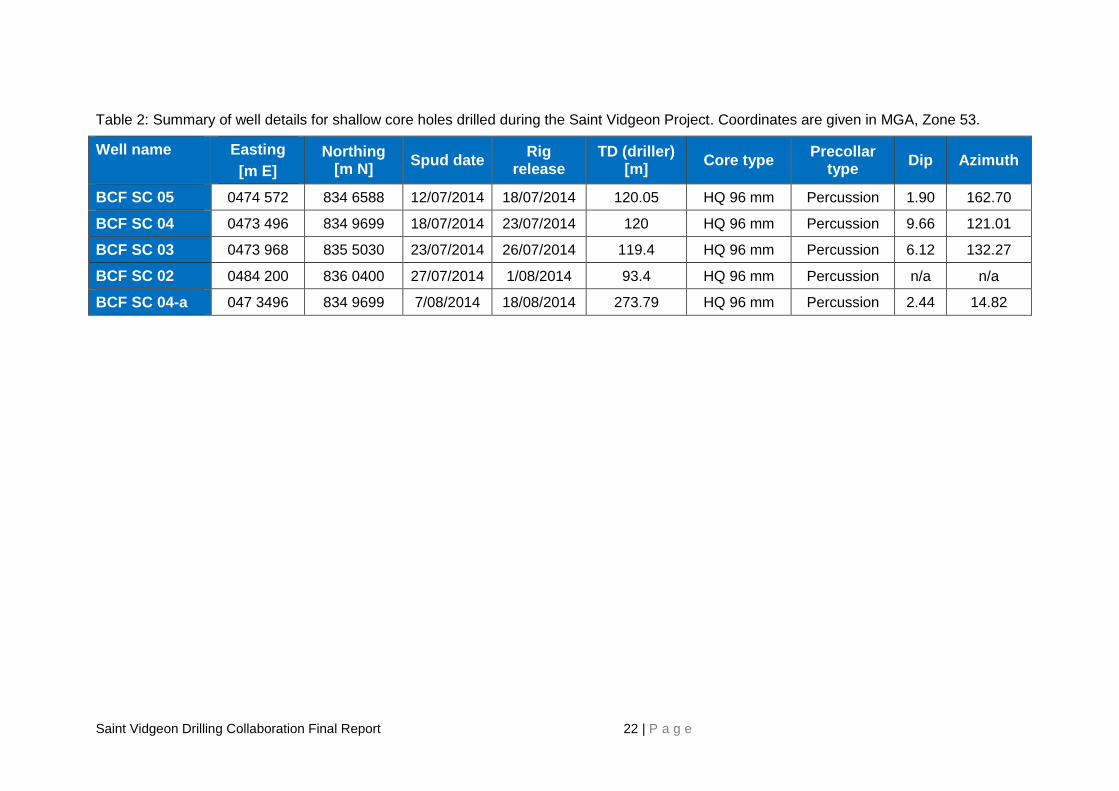
Table 2: Summary of well details for shallow core holes drilled during the Saint Vidgeon Project. Coordinates are given in MGA, Zone 53.
Well name Easting
[m E]
Northing [m N]
Spud date Rig
release TD (driller)
[m] Core type
Precollar type
Dip Azimuth
BCF SC 05 0474 572 834 6588 12/07/2014 18/07/2014 120.05 HQ 96 mm Percussion 1.90 162.70
BCF SC 04 0473 496 834 9699 18/07/2014 23/07/2014 120 HQ 96 mm Percussion 9.66 121.01
BCF SC 03 0473 968 835 5030 23/07/2014 26/07/2014 119.4 HQ 96 mm Percussion 6.12 132.27
BCF SC 02 0484 200 836 0400 27/07/2014 1/08/2014 93.4 HQ 96 mm Percussion n/a n/a
BCF SC 04-a 047 3496 834 9699 7/08/2014 18/08/2014 273.79 HQ 96 mm Percussion 2.44 14.82
Saint Vidgeon Drilling Collaboration Final Report 23 | P a g e
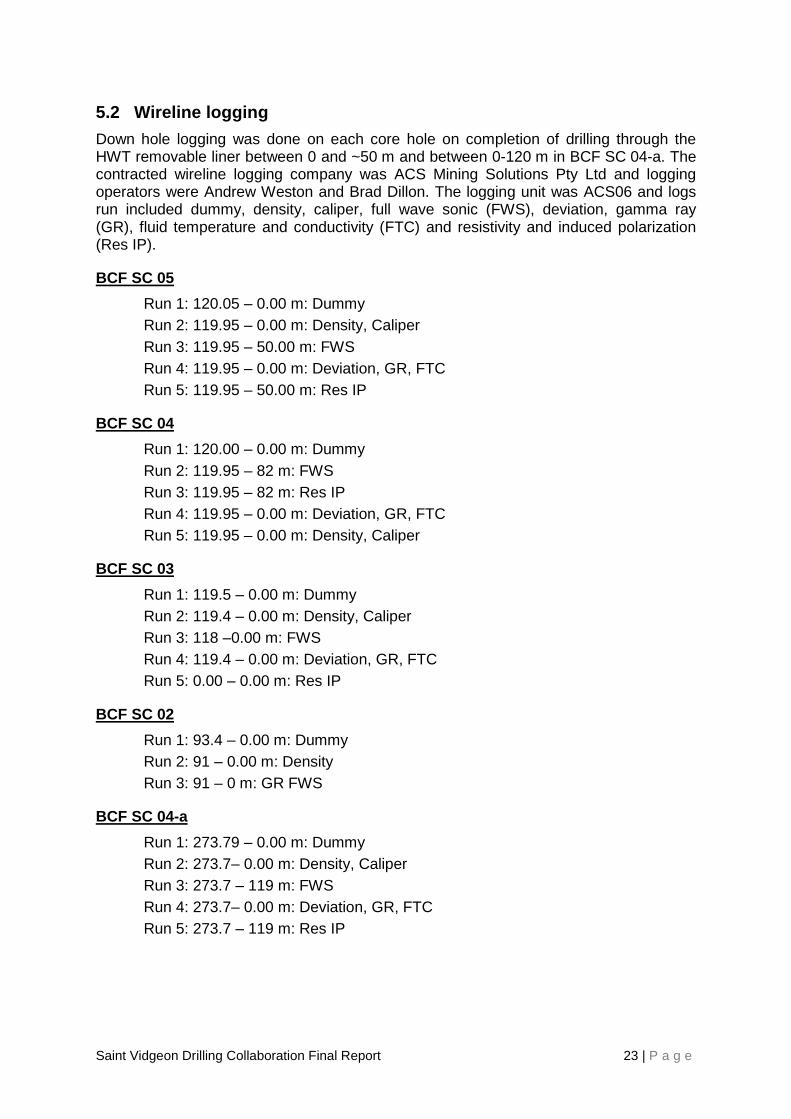
5.2 Wireline logging
Down hole logging was done on each core hole on completion of drilling through the HWT removable liner between 0 and ~50 m and between 0-120 m in BCF SC 04-a. The contracted wireline logging company was ACS Mining Solutions Pty Ltd and logging operators were Andrew Weston and Brad Dillon. The logging unit was ACS06 and logs run included dummy, density, caliper, full wave sonic (FWS), deviation, gamma ray (GR), fluid temperature and conductivity (FTC) and resistivity and induced polarization (Res IP).
BCF SC 05
Run 1: 120.05 – 0.00 m: Dummy
Run 2: 119.95 – 0.00 m: Density, Caliper
Run 3: 119.95 – 50.00 m: FWS
Run 4: 119.95 – 0.00 m: Deviation, GR, FTC
Run 5: 119.95 – 50.00 m: Res IP
BCF SC 04
Run 1: 120.00 – 0.00 m: Dummy
Run 2: 119.95 – 82 m: FWS
Run 3: 119.95 – 82 m: Res IP
Run 4: 119.95 – 0.00 m: Deviation, GR, FTC
Run 5: 119.95 – 0.00 m: Density, Caliper
BCF SC 03
Run 1: 119.5 – 0.00 m: Dummy
Run 2: 119.4 – 0.00 m: Density, Caliper
Run 3: 118 –0.00 m: FWS
Run 4: 119.4 – 0.00 m: Deviation, GR, FTC
Run 5: 0.00 – 0.00 m: Res IP
BCF SC 02
Run 1: 93.4 – 0.00 m: Dummy
Run 2: 91 – 0.00 m: Density
Run 3: 91 – 0 m: GR FWS
BCF SC 04-a
Run 1: 273.79 – 0.00 m: Dummy
Run 2: 273.7– 0.00 m: Density, Caliper
Run 3: 273.7 – 119 m: FWS
Run 4: 273.7– 0.00 m: Deviation, GR, FTC
Run 5: 273.7 – 119 m: Res IP
Saint Vidgeon Drilling Collaboration Final Report 24 | P a g e
5.3 Geochemistry
Samples acquired through the program have been provided to the Sprigg Research Laboratories at the Mawson Centre; University of Adelaide, Southern Australia for geochemical and mineralogical analysis.
During the drilling program of the Saint Vidgeon Program a total of 20 samples were taken from four of the five drilled wells (See Table 2).
Sample 351301 to 351307 are dark grey to black rock chips from a depth range between 24 – 47 m, possibly organic rich shales from the percussion drilling section of the well BCF SC 04. Samples 351308 to 351315 are core samples from the same well from a depth ranging between 95.17 – 107.94 m. These have as well been lithologically logged as mainly carbonaceous dark grey to black shale. Sample 351316 is a core sample taken from the bottom of BCF SC 05 at a depth of 119.95 m. Sample 351317 is a possible tuff from around 93 m and may be used for dating purposes at a later stage.
Three fluid samples (351318-351320) have been taken at BCF SC 04-a. A suspected oil show was noted in the drill mud at 44 m while redrilling the original well section of BCF SC 04. A sample (351318) of the drill mud was taken for analysis and sent to the University of Adelaide. This depth coincides with the penetration of a black carbonaceous chert encountered in the original well. Later testing in the office found that the sludge contained carbonaceous material that floated on water and that smudged paper like a lead pencil. It was described as “coaly” by one geologist. No “oiliness” was noted with this primitive testing. A further suspected oil sample was taken from the drill mud at 96.6 m (sample 351319). Both samples were sent to the University of Adelaide but excluded from further analysis due to the outcome of the office test. Sample 351320 is a sample of the formation fluid encountered at 226 m and has been analysed by ALS Brisbane.
Initial Total Organic Carbon (TOC) and Total Inorganic Carbon (TIC) content were analysed on seven samples (sample 351308-351314). These samples were further characterised by Source Rock Analysis (SRA) to determine their hydrocarbon generation potential and maturity level.
X-ray diffraction (XRD) and gas-chromatograph mass-spectrometer (GCMS) analysis were carried out on two samples recovered from well BCF SC 04, 351308 and 351310.
X-ray fluorescence (XRF) analysis performed on five sample, from which four samples (351301, 351305, 351309, 351313 and 351316) were from BCF SC 04 and one sample from BCF SC 05.
27 Trace elements (TE) and 15 rare earth element (REE) were quantified using the inductively coupled plasma – mass spectrometer (ICP-MS) on the same samples that were analysed by the XRF. An additional samples 351317 was a possible tuff from 93 m at BCF SC 02 (Table 3).
REE measured are : lanthanum (La), cerium (Ce), praseodymium (Pr), neodymium (Nd), samarium (Sm), europium (Eu), gadolinium (Gd), terbium (Tb), dysprosium (Dy), holmium (Ho), erbium (Er), thulium (Tm), ytterbium (Yb) and lutetium (Lu), in addition to yttrium (Y), which shows similar physical and chemical properties to the lanthanides.
The formation fluid sample 351320 was analysed at the ALS Environmental Department in Brisbane.
Saint Vidgeon Drilling Collaboration Final Report 25 | P a g e
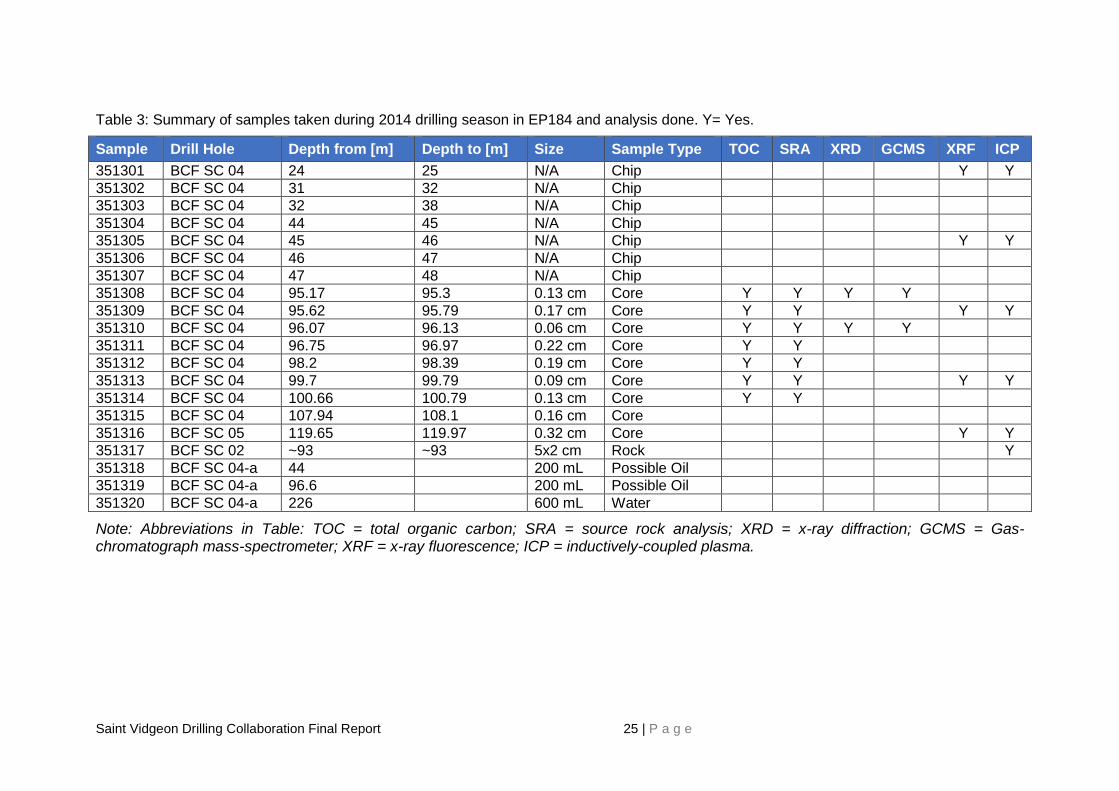
Table 3: Summary of samples taken during 2014 drilling season in EP184 and analysis done. Y= Yes.
Sample Drill Hole Depth from [m] Depth to [m] Size Sample Type TOC SRA XRD GCMS XRF ICP
351301 BCF SC 04 24 25 N/A Chip Y Y
351302 BCF SC 04 31 32 N/A Chip
351303 BCF SC 04 32 38 N/A Chip
351304 BCF SC 04 44 45 N/A Chip
351305 BCF SC 04 45 46 N/A Chip Y Y
351306 BCF SC 04 46 47 N/A Chip
351307 BCF SC 04 47 48 N/A Chip
351308 BCF SC 04 95.17 95.3 0.13 cm Core Y Y Y Y
351309 BCF SC 04 95.62 95.79 0.17 cm Core Y Y Y Y
351310 BCF SC 04 96.07 96.13 0.06 cm Core Y Y Y Y
351311 BCF SC 04 96.75 96.97 0.22 cm Core Y Y
351312 BCF SC 04 98.2 98.39 0.19 cm Core Y Y
351313 BCF SC 04 99.7 99.79 0.09 cm Core Y Y Y Y
351314 BCF SC 04 100.66 100.79 0.13 cm Core Y Y
351315 BCF SC 04 107.94 108.1 0.16 cm Core
351316 BCF SC 05 119.65 119.97 0.32 cm Core Y Y
351317 BCF SC 02 ~93 ~93 5x2 cm Rock Y
351318 BCF SC 04-a 44 200 mL Possible Oil
351319 BCF SC 04-a 96.6 200 mL Possible Oil
351320 BCF SC 04-a 226 600 mL Water
Note: Abbreviations in Table: TOC = total organic carbon; SRA = source rock analysis; XRD = x-ray diffraction; GCMS = Gas-chromatograph mass-spectrometer; XRF = x-ray fluorescence; ICP = inductively-coupled plasma.

Saint Vidgeon Drilling Collaboration Final Report 26 | P a g e
6 RESULTS AND INTERPRETATION
6.1 Drilling results
6.1.1 Well BCF SC 05
BCF SC 05 intersected dull red to yellow highly weathered ironstone in the first 3.2 m and siltstone down to 13.5 m. Between 13.5 and 38 m the lithology changed from clay to dolomite, siltstone and conglomerate (See Figure 6). The occurrence of conglomerates and minor pebbles might indicate paleo-river deposits. The abundance of silcrete and lateritic ironstones may also indicate a deep lateritic weathering profile which would likely be of Tertiary age. The percussion drilling process destroyed clear evidence of whether these materials were in situ or transported.
Between 38 m and total depth there were only minor changes in the lithology, which consisted of a light grey to grey shale with abundant pyrite and minor mudstone partings. This section fits the description of the Saint Vidgeon Formation from the Australian Stratigraphic Units Database of a pyritic shale.
No hydrocarbons were encountered at BCF SC 05 and no black shale with the potential to produce hydrocarbons was penetrated. The well was plugged and abandoned.
Figure 6: BCF SC 05 wireline log and preliminary lithology and stratigraphy interpretation.
Saint Vidgeon Drilling Collaboration Final Report 27 | P a g e
6.1.2 Well BCF SC 04
BCF SC 04 intersected a thick band of dull red to yellow highly weathered silcrete, a rock formed through cementation of surface rock through silica rich fluids, in the first 6 m of the well. Between 6-51 m the lithology mainly varied between sandstone and siltstone with two distinct variations. Firstly, a pink highly siliceous possible tuff band at 27-28 m, and then a 2 m band of shiny black, possible carbonaceous chert at 45 m. The lithology changed at 51 m to a highly silicified, abrasive rock possibly a siderite or dolomite. Between 78 – 120 m (TD) the lithology was dominated by light grey to grey shales, with minor mudstone and dolomite partings coming in at 78 m. Three distinguish zones of dark grey to black shale were identified in this section: 94.9 – 96.68 m, 96.72 - 105.06 m and 107.94 – 108.5 m.
BCF SC 04 was most likely collared in the more sandstone dominated Nagi Formation before it went into the dolomites and shales of the Saint Vidgeon Formation around 51 m (See Figure 7). The massive and highly silicified zone above between 51 – 78 m might have worked as a seal/ cap rock for the black shale, protecting it from weathering, and possibly, hydrocarbons from migration.
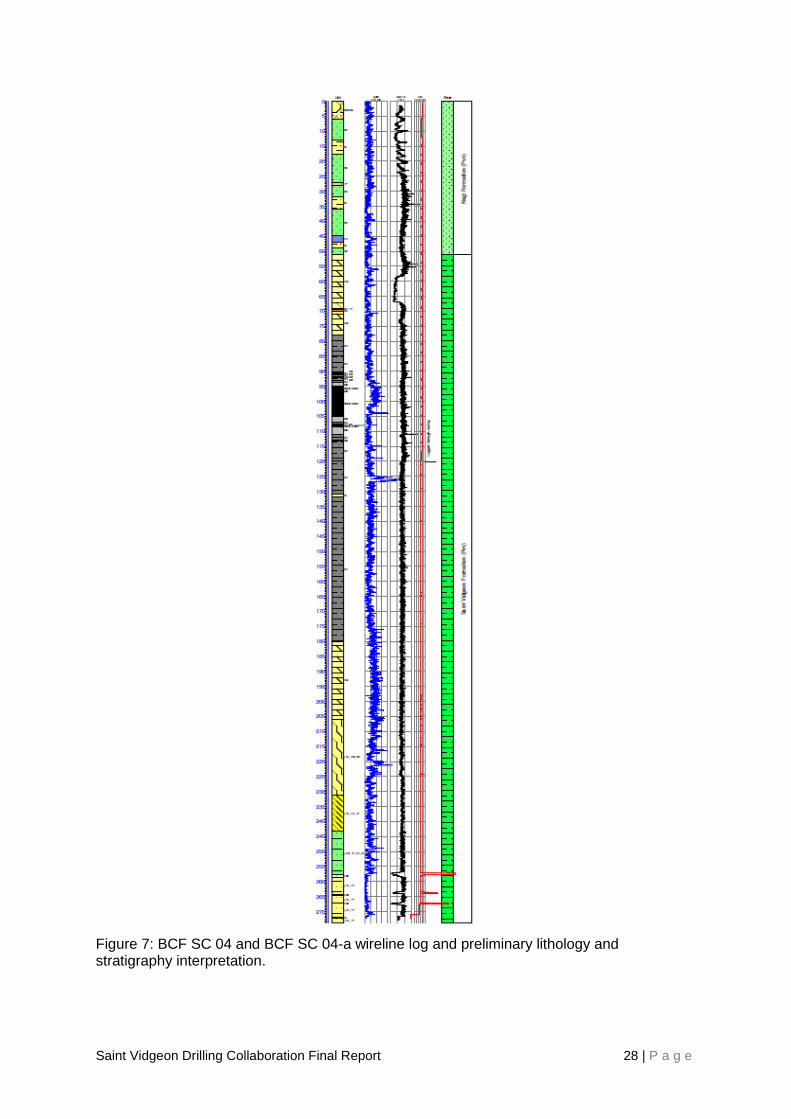
6.1.3 Well BCF SC 04-a
As the well was a re-entry and deepening of the original well BCF SC 04, the same lithology was assumed in the duplicate section between 0-120 m. Dark black drilling sludge emerged from the hole at around 44 m. A sample of this was taken for analysis. This depth coincides with the penetration of the black carbonaceous chert encountered in the original well.
Between 120-180 m the lithology stayed fairly homogenous and was described as light grey to grey shales with a minor 1 m siltstone section at 131 m. Of note is a sudden increase in gamma radiation between 124.5 – 127 m, which might be a thin band of organic rich shale. The lithology changed to a dolomite from 180 – 206 m, and then to a siltstone with interbedded dolomite and sandstone (206 – 231 m), and further to a siltstone with interbedded chert (231 – 243.5 m), then to a sandstone with interbedded tuff chert and siltstone (243.5 – 257.73 m), before encountering a highly weathered zone of siltstone interbedded with tuff (258.66 – 273.95 m).
Three cavities were intersected in this lower siltstone section between 257.73 – 258.66 m (0.93 m), 264.25 – 264.68 m (0.43 m) and 272.03 – 272.05 m (0.06 m), as logged by the wellsite geologist (See Figure 7).
Saint Vidgeon Drilling Collaboration Final Report 28 | P a g e
Figure 7: BCF SC 04 and BCF SC 04-a wireline log and preliminary lithology and stratigraphy interpretation.
Saint Vidgeon Drilling Collaboration Final Report 29 | P a g e
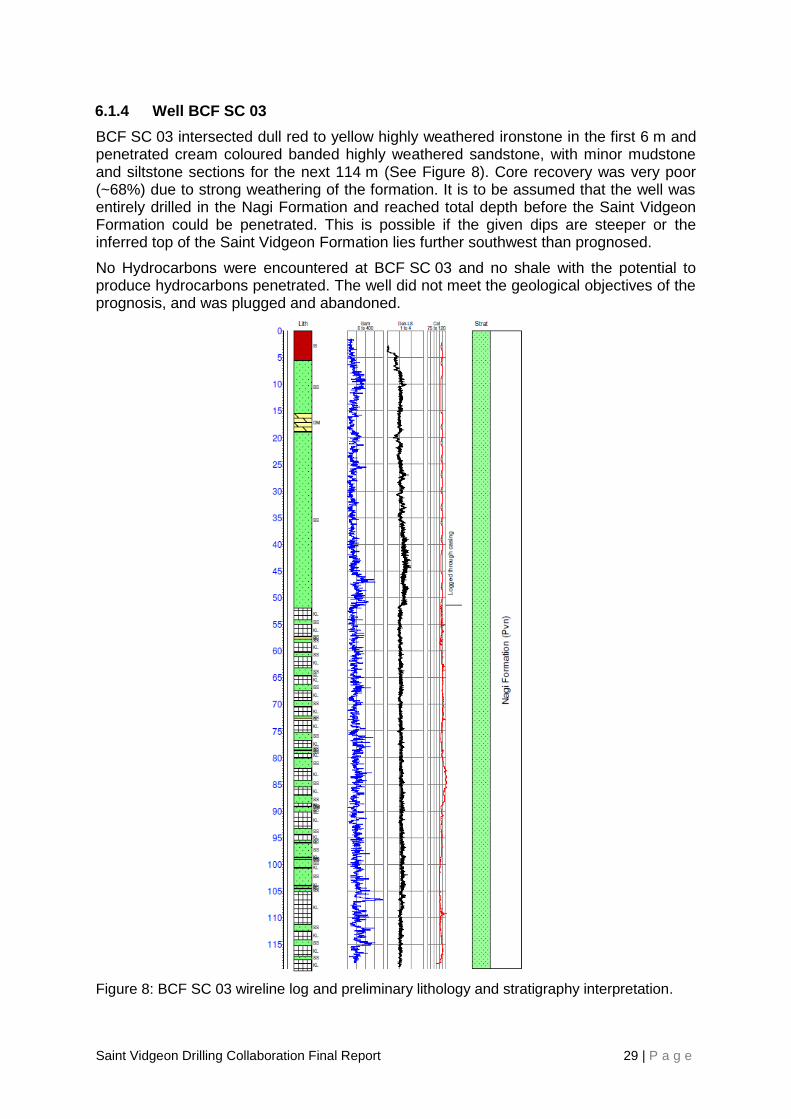
6.1.4 Well BCF SC 03
BCF SC 03 intersected dull red to yellow highly weathered ironstone in the first 6 m and penetrated cream coloured banded highly weathered sandstone, with minor mudstone and siltstone sections for the next 114 m (See Figure 8). Core recovery was very poor (~68%) due to strong weathering of the formation. It is to be assumed that the well was entirely drilled in the Nagi Formation and reached total depth before the Saint Vidgeon Formation could be penetrated. This is possible if the given dips are steeper or the inferred top of the Saint Vidgeon Formation lies further southwest than prognosed.
No Hydrocarbons were encountered at BCF SC 03 and no shale with the potential to produce hydrocarbons penetrated. The well did not meet the geological objectives of the prognosis, and was plugged and abandoned.
Figure 8: BCF SC 03 wireline log and preliminary lithology and stratigraphy interpretation.
Saint Vidgeon Drilling Collaboration Final Report 30 | P a g e
6.1.5 Well BCF SC 02
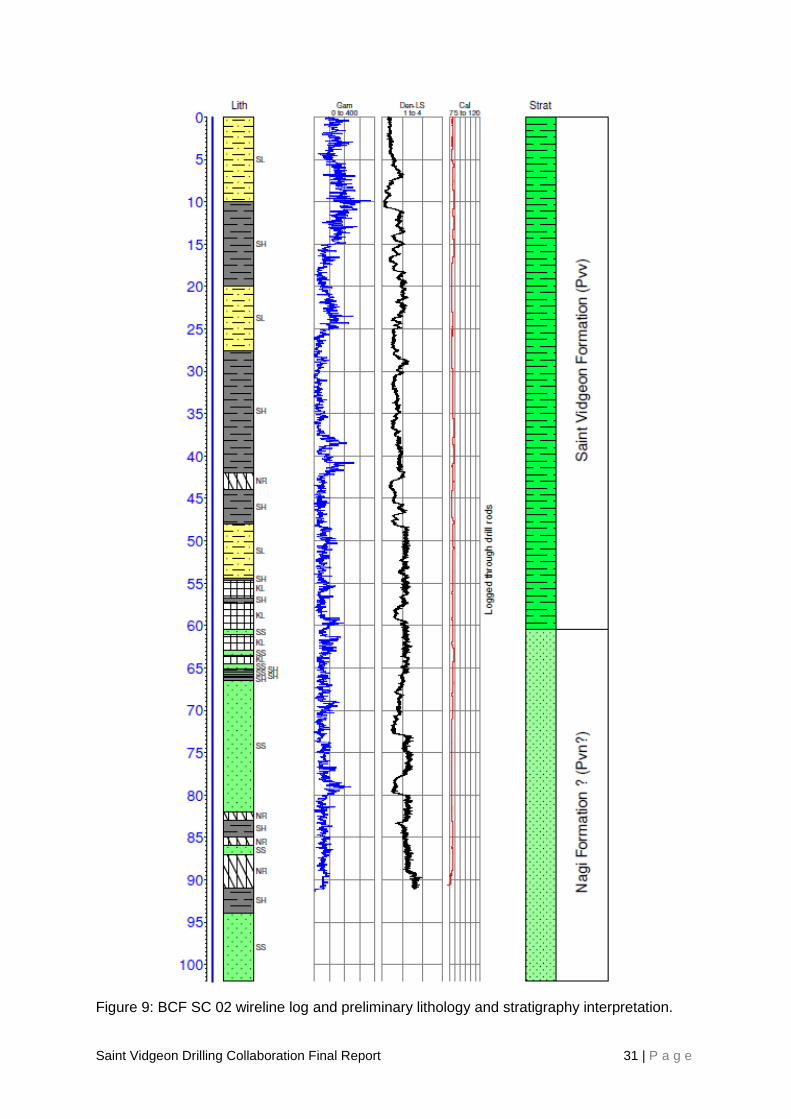
The intersected formations in BCF SC 02 vary between highly weathered siltstone, sandstone and shale.
Between 0 – 48 m the rock chips were mainly comprised of dull red to yellow highly weathered siltstones with interbedded shales and abundant chert, quartz and iron staining towards the top of the interval, with minor tuff bands at the bottom. This was followed by a section of red to cream-coloured, banded highly weathered shales with minor siltstone and mudstone, with high core loss between 48 – 65 m. The bottom section from 65 to 102 m consisted mainly of sandstone with minor interbanded shales (See Figure 9). This section is quartzose in part with minor tuff bands. Core recovery was very poor due to strong weathering of the formation.
Geologically the well can be divided into three main sections, the Saint Vidgeon Formation dominated by shale and siltstone, a fault zone as indicated by high weathering and frequent core loss, and the Nagi Formation, dominated by sandstone.
This would mean a younging of the geology going down the hole. Being in a thrust zone and showing indications for a fault zone, a structural inversion is proposed to explain the younger Nagi Formation lying below the Saint Vidgeon Formation. The Mt Birch Sandstone (Pnb) of the Nathan Group (postdating the Vizard Group) outcrops only 2.5 km to the southeast, therefore the formation underlying the Saint Vidgeon Formation might be even younger.
No Hydrocarbons were encountered in BCF SC 02 and no shale with the potential to produce hydrocarbons penetrated. The well did not meet the geological objectives of the prognosis, and was plugged and abandoned.
Saint Vidgeon Drilling Collaboration Final Report 31 | P a g e
Figure 9: BCF SC 02 wireline log and preliminary lithology and stratigraphy interpretation.
Saint Vidgeon Drilling Collaboration Final Report 32 | P a g e
6.2 Geochemistry
6.2.1 Fluid sample (351320)
One water sample has been taken at 226 m from BCF SC 04-a and was analysed at the ALS Environmental Department in Brisbane for:
pH
Conductivity
Total dissolved solids
Acidity as CaCO3
Major Cations (Ca, Mg, Na, K)
Major Anions (Chloride, Sulphate, Alkalinity)
Table 4: Analytical results for the water sample 351320 taken from the well BCF SC 04-a. The sample was analysed at the ALS Environmental laboratory.
EA005P: pH by PC Titrator
pH Value 7.93 pH Unit
EA010P: Conductivity by PC Titrator
Electrical Conductivity @ 25°C 556 µS/cm
EA015: Total Dissolved Solids
Total Dissolved Solids @180°C 254 mg/L
ED037P: Alkalinity by PC Titrator
Hydroxide Alkalinity as CaCO3 <1 mg/L
Carbonate Alkalinity as CaCO3 <1 mg/L
Bicarbonate Alkalinity as CaCO3 274 mg/L
Total Alkalinity as CaCO3 274 mg/L
ED038A: Acidity
Acidity as CaCO3 2 mg/L
ED041G: Sulfate (Turbidimetric) as SO4 2- by DA
Sulfate as SO4 – Turbidimetric 2 mg/L
ED045G: Chloride by Discrete Analyser
Chloride 23 mg/L
ED093F: Dissolved Major Cations
Calcium 46 mg/L
Magnesium 40 mg/L
Sodium 13 mg/L
Potassium 7 mg/L
EN055: Ionic Balance
Total Anions 6.16 meq/L
Total Cations 6.33 meq/L
Ionic Balance 1.33 %
Note: Please note that the holding time for all analyte was breached and results are to be used as guidelines only.
Saint Vidgeon Drilling Collaboration Final Report 33 | P a g e
6.2.2 Total Organic Carbon
Seven samples have been analysed at the University of Adelaide for their total organic carbon (TOC) content. TOC values vary between 0.97 % (sample 351312) and 1.52 % (sample 351313), averaging at 1.11 %. The results fall in the fair to low petroleum potential range and are summarised in Table 5 below.
Table 5: Total carbon analyses results for samples 351308-351314.
Sample # CaCO3 [%] IC [%] TC [%] TOC [%] Rest [%]
351308 7.2 0.9 1.8 0.98 91
351309 0.2 0 1.2 1.18 98.6
351310 0.1 0 1.1 1.08 98.8
351311 2.6 0.3 1.3 1.02 96.1
351312 2.2 0.3 1.2 0.97 96.6
351313 7.3 0.9 2.4 1.52 90.3
351314 44.3 5.3 6.3 1.01 49.4
Note: abbreviation in the table are: CaCO3 = calcium carbonate; IC = inorganic carbon; TC = total
carbon; TOC = Total organic carbon.
Low TOC values mean that RockEval data should be analysed with caution especially if the shale also contains higher amounts of:
1. Clays as they inhibit the release of hydrocarbons (HC) and/or
2. Carbonates as they lead to an increase in Oxygen/Carbon (O/C) or oxygen index (OI) values
6.2.3 RockEval Pyrolysis
The University of Adelaide conducted RockEval pyrolysis on the same seven samples for which the TOC was previously determined (See Table 6). This method is utilized to gain information on thermal maturity, source of the HC and petroleum potential of shales.
During the RockEval pyrolysis a small sample amount is heated in a pyrolysis oven and fed directly into a flame ionization detector. Programmed temperature heating leads to the volatilisation of HC in two phasis:
1. Below 330 °C the volatilisation of free HC forms the S1 peak
2. Up to 550 °C heavy HC (>C40) volatize and non-volatile organic compounds crack forming the S2 peak
Therefor the S2 peak gives an indication of the HC potential of a sample and the maximum temperature (top of S2 peak) a sample has previously been exposed to.
Further parameters calculated from the RockEval data are:
Reflectivity (Ro), maturity indicator
o %Ro = 0.0180 x Tmax - 7.16 (after Jarvie et al., 2001)
Hydrogen index (HI), maturity indicator
o HI= S2*100/TOC.
Production index (PI), maturity indicator
o PI = S1/(S1 + S2)
Saint Vidgeon Drilling Collaboration Final Report 34 | P a g e
S1 & S2
S1 (HC abundance) values fluctuates between 0.01 mg HC/g rock (sample 351313) to 0.03 mg HC/g rock (samples 351308 - 10). S2 (ungenerated HC) values lie between 0.02-0.05 mg HC/g rock. Both parameters are very low and indicate that the samples are fairly matured.
Tmax
The Tmax values are read off the pyrogram (y-axis) where the S2 curve forms a peak and generally indicate the maximum temperature of generation. As illustrated by the pyrograms in Figure 20 to Figure 26 all samples show no or just a minimal S2 signal, but no peak. Tmax values are therefore considered unreliable (S2 <0.5 mg HC/g rock). Also the wide scatter in Tmax values suggests a high level of unreliability due to a combination of low TOC and S2 yields.
Ro
As no accurate Tmax can be assigned also the %Ro values should be considered with caution as they are calculated using Tmax.
HI
The highest hydrogen index (HI) has been measured in sample 351308 with HI of 5 mg HC/g TOC and the lowest in sample 351313 with HI of 1 mg HC/g TOC. The HI is a calculation of residual potential vs. TOC and decreases as the sample matures. The extremely low values indicate a high maturity level of the organic matter (OM).
PI
The productivity index (S1 vs. S2) is an indication for the conversion of kerogen into free HC. This value will be high as the S2 value is extremely low. As the concentration of S1 is low as well this value has little informative value in terms of resources available.
Table 6: Results of RockEval Pyrolysis and calculated parameters.
Sample Top depth [m] TOC S1 S2 Tmax** [⁰C] Calc. % Ro HI PI
351308 95.17 0.98 0.03 0.05 437 0.71 5 0.38
351309 95.62 1.18 0.03 0.03 333 -1.00 3 0.50
351310 96.07 1.08 0.03 0.04 392 -1.00 4 0.43
351311 96.75 1.02 0.02 0.03 435 0.67 3 0.40
351312 98.20 0.97 0.02 0.03 557 2.86 3 0.40
351313 99.70 1.52 0.01 0.02 430 0.58 1 0.33
351314 100.66 1.01 0.02 0.02 461 1.14 2 0.50
Notes: TOC – Total Organic Carbon, wt. %. S1 - volatile HC content, mg HC/ g rock. S2 - remaining HC generation potential, mg HC/ g rock. ** - low S2, Tmax is unreliable. HI – Hydrogen index = S2 x 100 / TOC, mg HC/ g TOC. PI – Production Index = S1 / (S1=S2).
Due to the geological age of the sample it is likely that the original OM has been overprinted and altered multiple times in its geological history. RockEval results need to be interpreted with caution due to the low values of OM and weak S2 signal.
Low S2 and HI values classify the samples as type IV kerogen also called inertinite (Figure 10 and Figure 11, respectively). This is somewhat misleading as kerogen type IV is often associated with woody OM, which did not exist at the time of deposition. The classification as type IV kerogen also means the H:C ratio <0.5 which is the case for

Saint Vidgeon Drilling Collaboration Final Report 35 | P a g e
highly oxidised and hydrogen-poor, dead OM. The OM can therefore be described as charcoal or oxidised tissue with no hydrocarbon potential left, a residual inert kerogen.
As the S2 value usually decreases with depth the extremely low values may indicate a deep burial of the formation during the geological time prior to uplift to its present depth. The S2 value gives an indication for the amount of HC the rock can produce if further burial and maturation occurs. Low S2 values therefore may mean that the rock has already reached its maximum capacity of HC formation. If the same rock is found in an enclosed structure it might be associated with gas.
Additionally RockEval data can be compromised by secondary processes:
A low initial TOC content (~ <0.5 wt%) leads to small S1 and S2 signals and unreliable results
>10 wt% carbonate (Peters, 1986)
Weathering may alter the S2 value as oxidation reduces the atomic H/C ratio (van Krevelen, 1984)
Saltwater/ mineral decomposition can cause salt ionisation and affect the S2 value (Espitalie et al., 1985)
Another possibility is that the OM has been highly oxidised for example through a change in the redox-milieu or biodegradation through the invasion of oxidising meteoric water and bacteria which might have oxidised the OM.
In summary the RockEval results so far are pointing towards a residual inert kerogen type. Given the level of residual ‘dead’ carbon though, it is likely that there was a significant level of much higher potential kerogen there originally.
Saint Vidgeon Drilling Collaboration Final Report 36 | P a g e
Figure 10: Rock Eval results for samples 351308 to 351314. TOC vs. S2.
Figure 11: Rock Eval results for samples 351308 to 351314. TOC vs. HI.
Saint Vidgeon Drilling Collaboration Final Report 37 | P a g e
6.2.4 GCMS
Gas chromatography–mass spectrometry (GCMS) is an analysis consisting of two parts. The sample is injected into the gas chromatograph where the different components are feed through a column which separates molecules based on their volatility. In the mass spectrometer the molecules are ionized and filtered by mass. The mass detector counts the number of ions with a specific mass passing through at a specific time (retention time) forming a mass spectrum.
Initial GCMS analysis were conducted at the University of Adelaide on two selected samples 351308 and 351310. Results for sample 351508 and 351310 are presented in a mass chromatogram in Figure 27 and Figure 28 and Figure 29 and Figure 30, respectively. On the x-axis is the retention time vs. the signal intensity on the y-axis.
Peaks were recorded at retention times of 5.3, 9.1 and 12.6, interpreted as C10 (decane), C12 (dodecan) and C14 (tetradecane) alkanes. This is a clear and very unusual even-over-odd preference (EOP) of short chain n-alkanes.
Usually higher land plants are fingerprinted by long-chain alkanes (>C27) while bacterial or algal sources are short chained (<C21) (Myers, 1993). Natural sources generally produce n-alkanes with an odd-over-even predominance. This ratio decreases with increasing maturity (Lu, 2008).The results may therefore indicate a highly mature (even-over-odd predominance) bacterial or algal source (short chained).
However an EOP signature in short chained n-alkanes has also been reported in central Queensland where bushfires are common (Kuhn, 2010). Ground water carrying the OM from overlying bush fires may have penetrated through faults and cracks into the shale and overprinted the original signature. Also Lu (2008) reported the finding of unusual EOP n-alkanes in the short chain molecules (<C20) in relatively young sediments in Lake Erie.
This unusual n-alkane signature has also been described by the Adelaide Research & Innovation Pty Ltd in 2013. In three of their analysed cores from the Barney Creek Formation (two of them in the north of the Batten Fault Zone) they noticed an unusual EOP chain length nC10 - nC14, which in one of the wells increased with depth.
This might indicate that the nC10 - nC14 EOP dominance in the Saint Vidgeon Project area is an indicator for historical/ previous deep burial of the target formation, before it got uplifted to its present shallow depth.
6.2.5 X-ray diffraction
X-ray diffraction, short XRD measures the diffraction of x-rays to qualify and quantify the crystalline nature of materials. XRD analysis were conducted on sample 351308 and 351310 and are displayed in Figure 12 and Figure 13, respectively.
In sample 351310 the dominant component was quartz (SiO2) followed by orthoclase (KAlSi3O8), muscovite (KAl2(AlSi3O10)(F,OH)2) and pyrite (FeS2), in decreasing occurrence. Sample 351308 additionally contained dolomite (CaMg(CO3)2) as the third largest component after orthoclase and before pyrite.
The clay mineral illite oxidises to muscovite in a late-diagenetic state or early metamorphism. The presence of muscovite in both samples might be an indicator for the maturity of the samples.
A low content of clay in combination with the high silica content is favourable for fracking.
Saint Vidgeon Drilling Collaboration Final Report 38 | P a g e
Figure 12: Preliminary XRD data for sample 351308.
Saint Vidgeon Drilling Collaboration Final Report 39 | P a g e
Figure 13: Preliminary XRD results for sample 351310.
Saint Vidgeon Drilling Collaboration Final Report 40 | P a g e
6.2.6 X-ray fluorecense
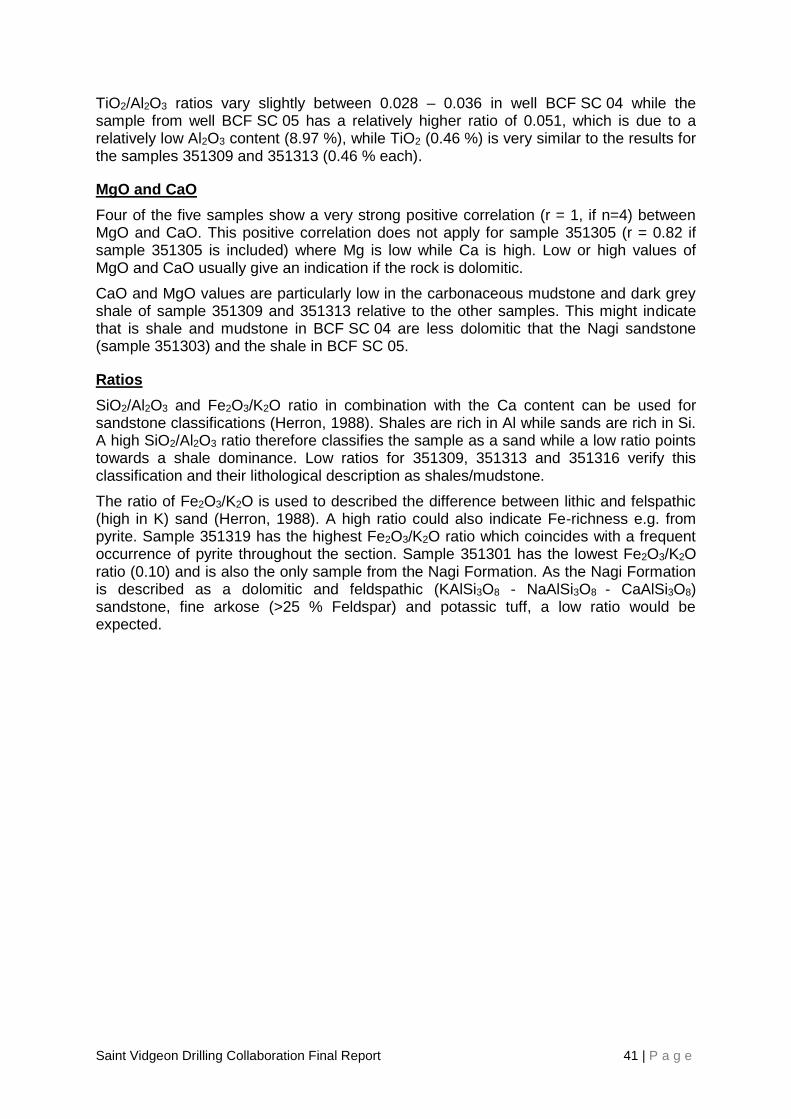
The depositional environment, diagenesis and origin of shales can be reflected by their content of major elements and trace metals (Ross and Bustin, 2009).
Major elements have been measured on five whole rock samples taken during the Saint Vidgeon Project. Four of these samples 351301, 351305, 351309 and 351313 (increasing in depth) are from the well BCF SC 04 while the deepest sample 351316 was collected from the well BCF SC 05. The major components measured are SiO2, TiO2, Al2O3, Fe2O3, MnO, MgO, CaO, Na2O, K2O, P2O5 and loss on ignition (LOI) by XRF at the University of Adelaide.
Results from the analysis are summarised in Table 7 and have been plotted vs. depth in Figure 14. The average concentration of the 10 analytes of all five samples, as well as only the samples from BCF SC 04 and just the two samples from the shale section (sample 351309 and 351316) has been calculated and are presented in Table 8. The average concentrations of the major elements in all samples decreases from SiO2 > Al2O3 > K2O > CaO > MgO, Fe2O3 > FeO > TiO2 > P2O5 > MnO > Na2O. TiO2, MnO, Na2O and P2O5 concentration were low in all five samples (< 1 wt%) collectively lying between 0.33 and 0.71 wt%.
The Pearson correlation coefficient (r) was used to calculate correlation between the measured major elements. Results are summarized in Table 9. The definition of a significant positive or negative correlation was set to 0.80 and -0.80, respectively.
Results for sample 351309 and 351313 shale/mudstone section are fairly similar, which might be due to their proximity (4.08 m apart).
Silica (SiO2)
The silica content varies between 48.83 % (sample 351316) and 72.19 % (sample 351305) and forms the dominant constituent of all five samples. The average content of silica in all five samples is 62.38 %. The highest value occurs in sample 351305 and verifies the lithological interpretation as a chert or highly silicified fine grained section.
The Pearson correlation coefficient shows no strong positive correlations (r ≥ 0.80) between SiO2 and any other component but strong negative correlation to FeO (-0.85) and Na2O (-0.81) and a very strong negative correlation (-0.98) to MgO become apparent.
Aluminium (Al2O3)
The aluminium content varies strongly between the five samples with the highest occurrence in sample 351313 with 13.04 % and the lowest content in sample 351305 with 5.41 %. A peak in aluminium is apparent in sample 351309 and 351313.
The average for all five samples lies at 9.65 % which is below all average shale studies listed in Table 8 that vary between 15 – 18.63 %. The Proterozoic shales from Cameron and Garrels (1980) and Ronov and Migdisov (1971) seem to have elevated Al2O3 values (16.67 and 18.63 %, respectively).
Al2O3 is commonly used as a proxy for detrital/ terrigenous influx. It shows a positive correlation to FeO and K2O (r = 0.84 and 0.99, respectively).
Aluminia contents are recorded high in clayey and argillaceous sediments.
Saint Vidgeon Drilling Collaboration Final Report 41 | P a g e
TiO2/Al2O3 ratios vary slightly between 0.028 – 0.036 in well BCF SC 04 while the sample from well BCF SC 05 has a relatively higher ratio of 0.051, which is due to a relatively low Al2O3 content (8.97 %), while TiO2 (0.46 %) is very similar to the results for the samples 351309 and 351313 (0.46 % each).
MgO and CaO
Four of the five samples show a very strong positive correlation (r = 1, if n=4) between MgO and CaO. This positive correlation does not apply for sample 351305 (r = 0.82 if sample 351305 is included) where Mg is low while Ca is high. Low or high values of MgO and CaO usually give an indication if the rock is dolomitic.
CaO and MgO values are particularly low in the carbonaceous mudstone and dark grey shale of sample 351309 and 351313 relative to the other samples. This might indicate that is shale and mudstone in BCF SC 04 are less dolomitic that the Nagi sandstone (sample 351303) and the shale in BCF SC 05.
Ratios
SiO2/Al2O3 and Fe2O3/K2O ratio in combination with the Ca content can be used for sandstone classifications (Herron, 1988). Shales are rich in Al while sands are rich in Si. A high SiO2/Al2O3 ratio therefore classifies the sample as a sand while a low ratio points towards a shale dominance. Low ratios for 351309, 351313 and 351316 verify this classification and their lithological description as shales/mudstone.
The ratio of Fe2O3/K2O is used to described the difference between lithic and felspathic (high in K) sand (Herron, 1988). A high ratio could also indicate Fe-richness e.g. from pyrite. Sample 351319 has the highest Fe2O3/K2O ratio which coincides with a frequent occurrence of pyrite throughout the section. Sample 351301 has the lowest Fe2O3/K2O ratio (0.10) and is also the only sample from the Nagi Formation. As the Nagi Formation is described as a dolomitic and feldspathic (KAlSi3O8 - NaAlSi3O8 - CaAlSi3O8) sandstone, fine arkose (>25 % Feldspar) and potassic tuff, a low ratio would be expected.
Saint Vidgeon Drilling Collaboration Final Report 42 | P a g e
Table 7: Results from major element analysis given in % of samples from the 2014 core wells BCF SC 04 (four samples) BCF SC 05 (one sample).
Sample number 351301 351305 351309 351313 351316
Well BCFSC04 BCFSC04 BCFSC04 BCFSC04 BCFSC05
Formation Nagi Saint Vidgeon Saint Vidgeon Saint
Vidgeon Saint
Vidgeon
Lithology sandstone carbonaceous
chert carbonaceous
mudstone dark grey
shale dark grey
shale
Depth [m] 24 45 95.62 99.7 119.65
TOC [wt%] N/A N/A 1.18 1.52 N/A
XRF results
SiO2 [%] 55.05 72.19 70.38 65.40 48.83
TiO2 [%] 0.26 0.15 0.47 0.47 0.46
Al2O3 [%] 7.99 5.41 12.84 13.04 8.97
Fe2O3 [%] 0.52 0.44 1.93 1.34 1.41
FeO [%] 2.26 0.52 0.38 0.46 1.64
MnO [%] 0.08 0.05 0.01 0.04 0.05
MgO [%] 6.56 0.93 0.71 1.98 7.06
CaO [%] 8.12 6.28 0.20 2.25 9.90
Na2O [%] 0.03 0.01 0.03 0.04 0.09
K2O [%] 5.04 4.09 8.99 9.55 5.96
P2O5 [%] 0.10 0.12 0.11 0.10 0.11
LOI [%] 13.58 9.45 3.69 4.91 15.16
Total [%] 99.59 99.64 99.74 99.58 99.64
Element Ratios
SiO2/Al2O3 6.89 13.34 5.48 5.02 5.44
Fe2O3/ K2O 0.10 0.11 0.21 0.14 0.24

Saint Vidgeon Drilling Collaboration Final Report 43 | P a g e
Table 8: Comparison of average composition of samples from the 2014 drilling program, with average shale values from 3rd party studies. Averages used were North American Shale Composite (NASC) from Gromet et al. (1984), and Pettijohn (1975) and Turekian.
Average St Vidgeon sample
(n = 5)
Average of samples 351309 & 13
Average of BCFSC04 samples
(n = 4) NASC
Average shale (Pettijohn 1975)
Turekian and Wedepohl (1961)
Average Canadian Proterozoic (Aphebian) shale
Average Russian Proterozoic shale
SiO2 62.37 67.9 65.8 64.8 58.1 58.5 66.9 63.04
TiO2 0.362 0.5 0.3 0.7 0.6 0.77 0.78 0.94
Al2O3 9.65 12.9 9.8 16.9 15.4 15 16.67 18.63
Fe2O3 1.128 1.6 1.1 6.9 4.72
FeO 5.66 5.87 7.66
MnO 0.06 0.06 0.12
MgO 3.448 1.3 2.5 2.86 2.44 2.5 2.59 2.6
CaO 5.35 1.2 4.2 3.63 3.11 3.1 0.53 1.31
Na2O 0.04 0.0 0.0 1.44 1.3 1.3 1.5 1.02
K2O 6.726 9.3 6.9 3.58 3.24 3.1 4.97 4.57
P2O5 0.108 0.1 0.1 0.19 0.2 0.16 0.14 0.1

Saint Vidgeon Drilling Collaboration Final Report 44 | P a g e
Table 9: Pearson correlation coefficient (r) between major elements measured on the samples 351301, 351305, 351309, 351313 and 351316. Negative correlations > 0.80 have been marked in orange while positive correlations > 0.8 have been marked in green.
SiO2 TiO2 Al2O3 Fe2O3 FeO MnO MgO CaO Na2O K2O P2O5 LOI
SiO2 1.00
TiO2 -0.25 1.00
Al2O3 0.12 0.88 1.00
Fe2O3 0.04 0.91 0.84 1.00
FeO -0.85 -0.18 -0.39 -0.40 1.00
MnO -0.56 -0.57 -0.64 -0.82 0.81 1.00
MgO -0.98 0.06 -0.26 -0.21 0.94 0.70 1.00
CaO -0.76 -0.38 -0.73 -0.57 0.79 0.79 0.82 1.00
Na2O -0.81 0.63 0.20 0.43 0.39 0.03 0.68 0.46 1.00
K2O 0.24 0.84 0.99 0.82 -0.52 -0.70 -0.39 -0.79 0.12 1.00
P2O5 0.42 -0.44 -0.54 -0.14 -0.40 -0.29 -0.40 0.09 -0.20 -0.47 1.00
LOI -0.82 -0.32 -0.67 -0.50 0.86 0.78 0.88 0.99 0.49 -0.75 0.02 1.00

Saint Vidgeon Drilling Collaboration Final Report 45 | P a g e

Saint Vidgeon Drilling Collaboration Final Report 46 | P a g e

Saint Vidgeon Drilling Collaboration Final Report 47 | P a g e
Figure 14: Major elements vs. depth of the samples 351301, 05, 09, 13 and 16 from the wells BCF SC 04 (blue dots) and 05 (red dot) collected during the 2014 drilling season.
Saint Vidgeon Drilling Collaboration Final Report 48 | P a g e
6.2.7 ICP- tace element analysis
Redox conditions of the overlying water influence the mobility of redox-sensitive trace elements (TE) in the sediment, leading to a relative enrichment or depletion (Meyer, 2008). TE can therefore be used as a geochemical proxy for paleoredox conditions. Under reducing conditions (gaining of electrons) trace metals appear to be less soluble and enrich in the sediment. Tribovillard et al. (2006) found that useful paleoredox proxies are U, V and Mo, and to a lesser extent Cr and Co, whereas Ni, Cu, Zn, Cd are delivered to the sediment mainly in association with organic matter.
TE and REE analysis results of Saint Vidgeon Project samples are given in Table 11 and Table 12, respectively, with a comparison of the TE concentration in average shales (Wedepohl 1971, 1991). A relative enrichment compared to the average shale of Wedepohl (1971, 1991) is shown in red.
Akhtar R. Mir (2014) reports an enrichment in copper (Cu), nickel (Ni), cobalt (Co), vanadium (V) and chromium (Cr) as well as radioactive TE (Th and U) in Proterozoic black shales in India, relative to the “North American Shale Composite” (NASC). The sample that shows the most similarity in elevated TE to their findings is 351313, the sample with the highest TOC content. The only element that is not elevated in 51313 but described by Mir (2014) is V. Additionally rubidium (Rb), arsenic (As) and to a minor amount hafnium (Hf) are enriched.
Sample 351307 was sampled from well BCF SC 02 as a tuff for possible later dating purposed this sample is enriched in 12 of the 27 trace elements, including Be (6.7 µg/g), Sc (13 µg/g), Cr (129 µg/g), Sr (298 µg/g), Cs, Ba, Pb, Bi, Th, U, Zr.
The only sample from BCF SC 05 (351316) a dark grey shale taken at a depth of 119 m is enriched in Co (21 µg/g), Zn (128 µg/g) and Cs (6 µg/g)
Every of the 16 REE measured is enriched in sample 351317, beside Tm as the measured concentration is under the detection limit (<1 µg/g). The only other sample that shows an enrichment in REE relative to the average shale is 351309 for the elements La (47.9 µg/g), Ce (92.95 µg/g), Pr (9.95 µg/g) and Nd (34.27 µg/g). High REE are typical for tuffs which verifies the lithology of sample 351317.
TE ratios have been compared with ratios typical for felsic and mafic rocks (See
Saint Vidgeon Drilling Collaboration Final Report 49 | P a g e
Table 10) for an indication of the bulk composition of the provenance (Taylor and McLennan 1985). Th/Sc values in the rage of 0.84 - 20.5 indicates a felsic (continental crust) source as it is enriched in an incompatible elements, whereas, a Th/Sc ratios ranging from 0.05 - 0.22 are found in more mafic sources as they are enriched in compatible elements. Further indicators for the origin of the source material are ratios between immobile elements like La/Sc, Th/Sc, Th/Co, and Th/Cr. A comparison of these ratios with typical ranges for felsic and mafic rock indicates a more felsic source for the samples from the Saint Vidgeon Project.
Jones and Manning (1994) and Nagarajan (2007) have previously used TE ratios such as Ni/Co, V/Cr, and V/(V + Ni) to evaluate paleoredox conditions. In the Saint Vidgeon Project area samples Ni/Co ratio varies from 0.5 to 6.20, V/Cr from 0.2 to 5.8 and V/(V+Ni) varies from 0.44 to 0.81. These values point to nearly anoxic condition during time of deposition (Jones and Manning, 1994).

Saint Vidgeon Drilling Collaboration Final Report 50 | P a g e
Table 10: Range of element ratios for Saint Vidgeon Project samples compared to black shale samples from eastern India (Mir, 2014), felsic rocks and mafic rocks (data sourced from Mir, 2014). The ranges that the Saint Vidgeon samples fall into have been marked in grey.
ratio Range of black shale samples from IOG
Range of black shale Samples from SMB
Range of Sediments (Felsic rocks)
Range of Sedi-ments (Mafic rocks)
Th/Sc 1.3 – 2.2 0.46-1.14 0.84 - 20.5 0.05 - 0.22
Th/ Co 0.15 – 0.52 0.01-4.97 0.67 - 19.4 0.04 - 1.4
Th/Cr 0.08 – 0.57 0.01-0.17 0.13 - 2.7 0.018 - 0.046
Cr/Th 1.75 – 13.28 5.83- 106.95 4.00 - 15 25 - 500
La/Sc 0.46 – 5.81 1.17-2.76 2.5 - 16.3 0.43 - 0.86
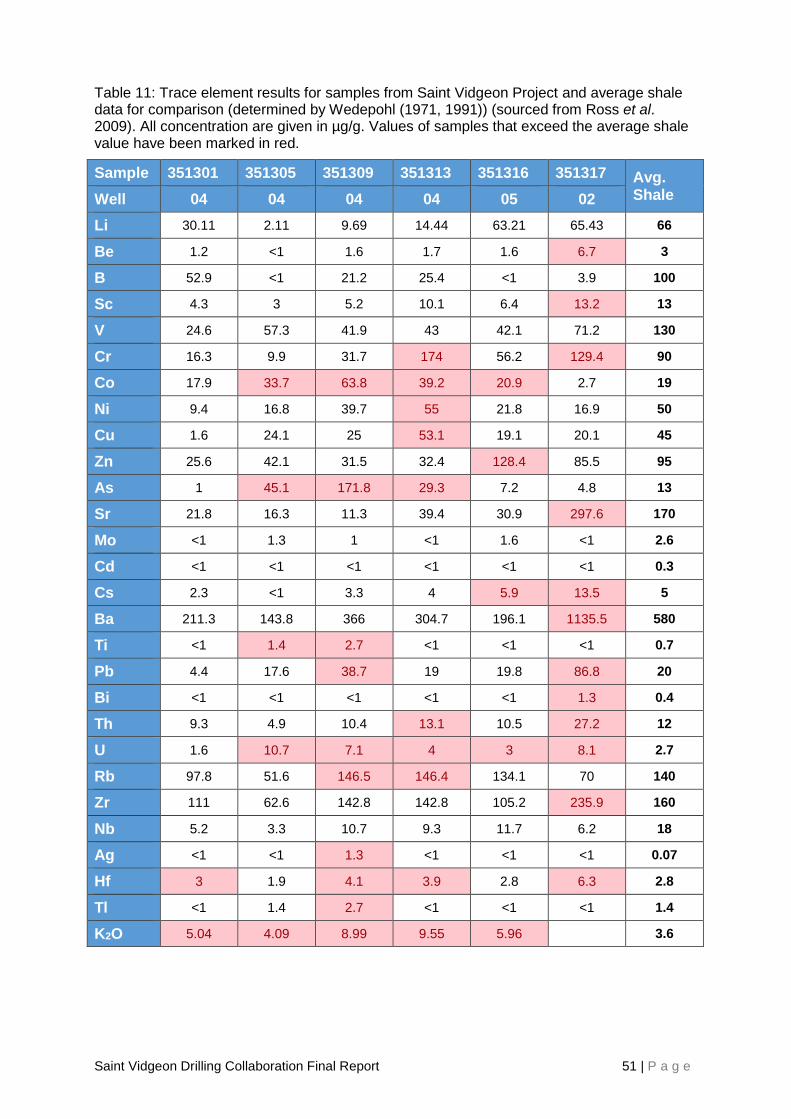
Saint Vidgeon Drilling Collaboration Final Report 51 | P a g e
Table 11: Trace element results for samples from Saint Vidgeon Project and average shale data for comparison (determined by Wedepohl (1971, 1991)) (sourced from Ross et al. 2009). All concentration are given in µg/g. Values of samples that exceed the average shale value have been marked in red.
Sample 351301 351305 351309 351313 351316 351317 Avg. Shale Well 04 04 04 04 05 02
Li 30.11 2.11 9.69 14.44 63.21 65.43 66
Be 1.2 <1 1.6 1.7 1.6 6.7 3
B 52.9 <1 21.2 25.4 <1 3.9 100
Sc 4.3 3 5.2 10.1 6.4 13.2 13
V 24.6 57.3 41.9 43 42.1 71.2 130
Cr 16.3 9.9 31.7 174 56.2 129.4 90
Co 17.9 33.7 63.8 39.2 20.9 2.7 19
Ni 9.4 16.8 39.7 55 21.8 16.9 50
Cu 1.6 24.1 25 53.1 19.1 20.1 45
Zn 25.6 42.1 31.5 32.4 128.4 85.5 95
As 1 45.1 171.8 29.3 7.2 4.8 13
Sr 21.8 16.3 11.3 39.4 30.9 297.6 170
Mo <1 1.3 1 <1 1.6 <1 2.6
Cd <1 <1 <1 <1 <1 <1 0.3
Cs 2.3 <1 3.3 4 5.9 13.5 5
Ba 211.3 143.8 366 304.7 196.1 1135.5 580
Ti <1 1.4 2.7 <1 <1 <1 0.7
Pb 4.4 17.6 38.7 19 19.8 86.8 20
Bi <1 <1 <1 <1 <1 1.3 0.4
Th 9.3 4.9 10.4 13.1 10.5 27.2 12
U 1.6 10.7 7.1 4 3 8.1 2.7
Rb 97.8 51.6 146.5 146.4 134.1 70 140
Zr 111 62.6 142.8 142.8 105.2 235.9 160
Nb 5.2 3.3 10.7 9.3 11.7 6.2 18
Ag <1 <1 1.3 <1 <1 <1 0.07
Hf 3 1.9 4.1 3.9 2.8 6.3 2.8
Tl <1 1.4 2.7 <1 <1 <1 1.4
K2O 5.04 4.09 8.99 9.55 5.96
3.6

Saint Vidgeon Drilling Collaboration Final Report 52 | P a g e
Table 12: Rare earth element results for samples from Saint Vidgeon Project and average shale data for comparison (determined by Wedepohl (1971, 1991)) (sourced from Ross et al. 2009). All concentration are given in µg/g. Samples that exceed the average shale value have been marked in red.
Sample Name La Ce Pr Nd Sm Eu Gd Tb Dy Ho Y Er Tm Yb Lu
351301 26.68 55.43 5.93 21.10 3.72 <1 3.23 <1 2.52 <1 13.58 1.56 <1 1.52 <1
351305 11.14 23.81 2.68 9.79 1.90 <1 1.82 <1 1.53 <1 8.15 <1 <1 <1 <1
351309 47.90 92.95 9.95 34.27 5.27 <1 4.13 <1 2.76 <1 14.79 1.78 <1 1.77 <1
351313 34.98 70.75 7.57 27.11 4.94 <1 4.27 <1 3.42 <1 18.09 2.15 <1 2.14 <1
351316 26.55 53.74 5.91 21.20 4.07 <1 3.81 <1 3.08 <1 17.21 1.84 <1 1.78 <1
351317 125.60 257.13 40.59 184.85 46.79 11.81 63.89 9.37 52.01 9.97 301.16 25.48 <1 17.19 2.56
Avg. Shale 43 82 9.8 33 6.2 1.2 5.1 0.8 4.7 1.1 26 3 0.4 2.8 0.42
Saint Vidgeon Drilling Collaboration Final Report 53 | P a g e
6.3 Geophysics
The Figure 16 geophysics log for hole BCF SC 04 shows a high gamma response between ~92 m and 104 m depth. This is matched by a relatively low density response from ~85 m to 102.5 m indicating a high potential shale containing the necessary petroleum generation organic matter characteristics within the 92 to 105 m interval and potentially even as shallow as 85 m.
Figure 16 also shows in the cross plot of the VSP and the IP log a preferential zone of high potential shale between the ~95 m and 102.5 m interval and this interval also matches the response in the full wave sonic (FWS) log across the same interval.
The stratigraphic strip log presented at Figure 15 for the well BCF SC 04-a confirms the presence of a black organic shale through the interval of ~95 m to ~105 m. Additionally, while not evident on the wireline gamma or density log, the IP and the sonic both indicate a further zone of potential response to hydrocarbon in the interval ~106.5 m to 110.6 m. This interval on the stratigraphic strip log at Figure 15 correlates to a chert, black shale and mudstone interval.
Figure 17 is a correlation of log response between BCF SC 03 and BCF SC 04 examining specifically the interval between 85 to 115 m depth. While there is no significant gamma or density response in the BCF SC 03 log, there can be seen in the 03 log that the velocity log indicates a response between ~97 m to 105 m this interval is marked on the stratigraphic strip log in Figure 19 as a sandstone. Also the signature velocity response at this depth may indicate either a fluid or gas response within the strata. However the lithology log for the hole does not record any fluid present at this interval.
The lithology log for this interval is recorded as a sandstone with mudstone bands and dolomitic chert.
A second band of velocity response in BCF SC 03 between ~108 m and ~111.5 m also correlates on the lithology log with a sandstone with mudstone bands. These two zones may correlate to the velocity intervals of ~97 to 105 m and ~106.5 to 110.6 m respectively on the BCF SC 04 log.
The comparison of logs between BCF SC 04 and BCF SC 05 in Figure 18 indicates a FWS log response in the interval ca 90.5 to 96 m and a second response between ~107.5m and ~112.5 m. This interval in the Figure 18 stratigraphic log is shown as an undifferentiated shale. The lithology log records the interval as a shale, light grey to grey with abundant pyrite along bedding planes, minor dark grey interbedded shales occasionally cross laminated.
The interval between 107.46 and 107.90 m in the core log is marked as having an oil stain and also has the comment that this may be from the rig in retrieving the core.
Minor velocity responses are recorded at 105 m, 112 m and 115 m for BCF SC 03 and this velocity response correlates with a minor FWS log response at the same depth.
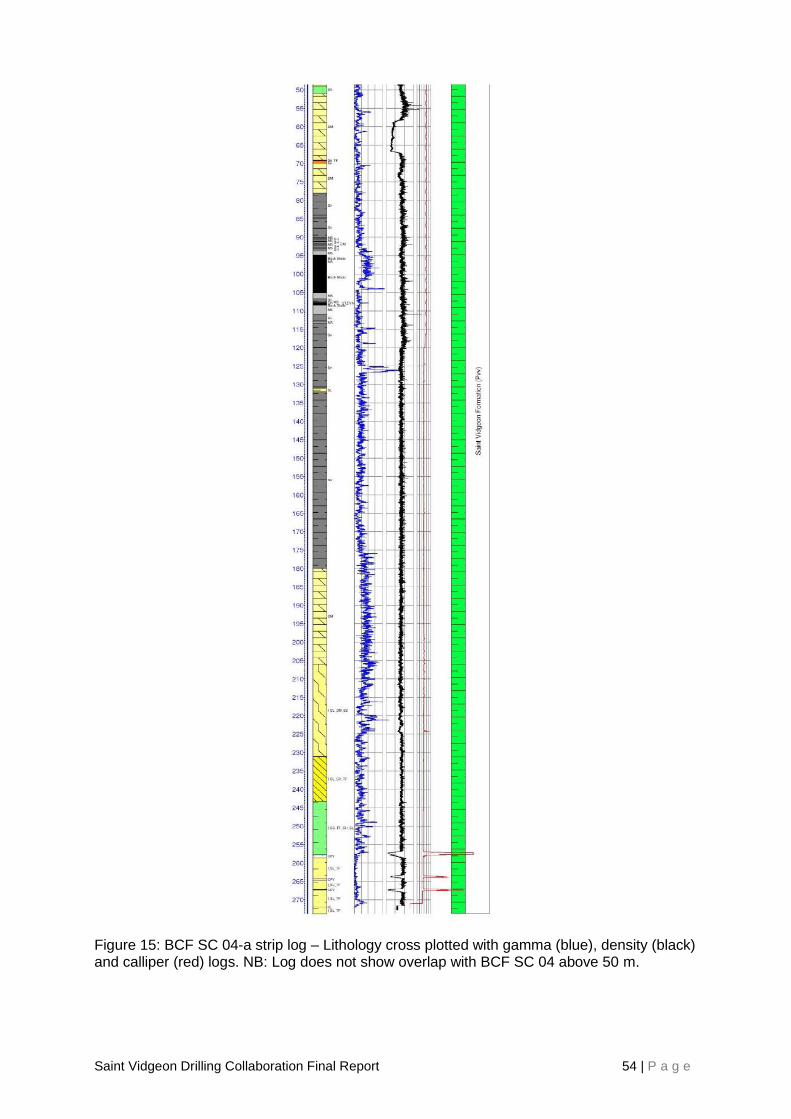
Saint Vidgeon Drilling Collaboration Final Report 54 | P a g e
Figure 15: BCF SC 04-a strip log – Lithology cross plotted with gamma (blue), density (black) and calliper (red) logs. NB: Log does not show overlap with BCF SC 04 above 50 m.

Saint Vidgeon Drilling Collaboration Final Report 55 | P a g e
Figure 16: BCF SC 04 composite wireline log from 80 m to TD.

Saint Vidgeon Drilling Collaboration Final Report 56 | P a g e
Figure 17: Comparison of logs between BCF SC 03 and 04.

Saint Vidgeon Drilling Collaboration Final Report 57 | P a g e
Figure 18: Comparison of logs between BCF SC 04 and 05.
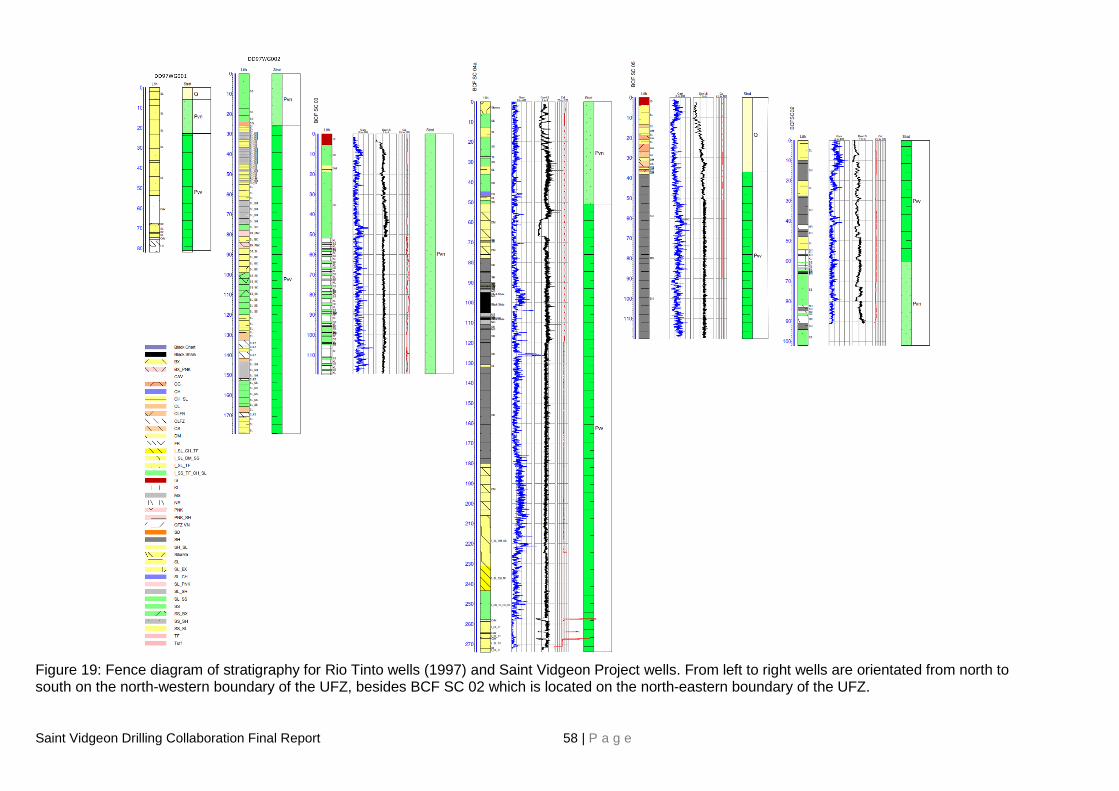
Saint Vidgeon Drilling Collaboration Final Report 58 | P a g e
Figure 19: Fence diagram of stratigraphy for Rio Tinto wells (1997) and Saint Vidgeon Project wells. From left to right wells are orientated from north to south on the north-western boundary of the UFZ, besides BCF SC 02 which is located on the north-eastern boundary of the UFZ.

Saint Vidgeon Drilling Collaboration Final Report 59 | P a g e
7 CONCLUSION
The first four shallow core holes BCF SC 05, 04, 03 and 02 targeted the upper unit of the Saint Vidgeon Formation (Unit 2), a possible equivalent to the prospective unconventional Barney Creek Formation (BCF) occurring in the Batten Fault Zone. The fifth well BCF SC 04-a, a re-entry and deepened well, targeted the lower unit of the Saint Vidgeon Formation (Unit 1) a possible equivalent to the prospective conventional Coxco Dolomite Member occurring just below the BCF in the Batten Fault Zone.
One of the shallow core holes, BCF SC 04, encountered a section of black shale. The Coxco Dolomite Member was not identified in the re-entered and deepened well.
Even though geochemical data exist for the BCF in the Batten Fault Zone no geochemical data are available to characterise organic shales of the Saint Vidgeon Formation within the Urapunga Fault Zone to this date, to prove the validity of them being equivalent.
A chemo-stratigraphic equivalency of the Saint Vidgeon Formation Unit 1 with the BCF might be implied by a comparison of conclusion outlined by the University of Adelaide in 2013. The following BCF characteristics and north-south trends observed by the University of Adelaide during their 2013 research are in line with findings during the Saint Vidgeon Project:
1. Unusual even-over-odd dominance of short chained n-alkanes, found in two wells in the northern Batten Fault Zone (BB5 and McA5) and less obvious towards the south (GR9 and GR10)
2. Samples of the BCF are dominated by quartz, dolomite and feldspar
3. Organic richness, calculates as the sum of S1+ S2, decreased towards the north
4. Thermal maturity increases towards the north
5. Sources display limited residual potential (S2) towards the north
Further key outcomes from the Project:
Brittleness of the formation is given by a high concentration of silica, which makes the formation favourable for fracking.
Migrating mineralising fluids can cause hydrothermal alteration of original organic matter (OM) causing degradation and overprinting by allochthonous OM (Holman et. al., 2014) raising the question if traditional techniques can deliver adequate information on depositional environment and thermal maturity.
The relative low thickness of the source rock might be explained by a model where the Urapunga Fault Zone is proposed to be a paleo-high (Urapunga Tectonic Ridge) during time of deposition. The encountered source rock thickness in the Saint Vidgeon area might therefore not be representative for the greater area.
Rare earth element ratios indicate a felsic source and deposition under unoxic conditions.
Through the Saint Vidgeon Project Imperial Oil & Gas was able to take samples of black shale from the upper unit of the Saint Vidgeon Formation and for the first time geochemically characterise this new frontier unconventional target formation.
Saint Vidgeon Drilling Collaboration Final Report 60 | P a g e
References
Adelaide Research & Innovation Pty Ltd (2013). Geologic controls of black shale deposition in the Palaeo-Proterozoic of the McArthur Basin. A research project for Imperial Oil and Gas. Australian Shale Carbon Sequestration Group Sprigg Geobiology Centre. University of Adelaide
AttiaTemraz, M.G.M. (2005). Mineralogical and Geochemical Studies of Carbonaceous Shale Deposits from Egypt. Dissertation at the Technische Universität Berlin.
Birdwell, J.E., T.E. Ruble, C.D. Laughrey, D.R. Roper and G. Walker (2010). Differentiating organic carbon residues in spent oil shale. 30th Oil shale symposium Colorado School of Mines.
Clarke, F.W. (1924). The data of geochemistry. U.S. Geol. SUIV. Bull. 770.
Cameron, E.M. and R.M. Garrel (1980). Geochemical compositions of some Precambrian shales from the Canadian Shield. Chem. Geol. 28. 18 l-197.
Espitalie, J., G. Deroo, and F. Marquis (1985). La pyrolyse Rock-Eval et ses applications (deuxieme partie): Revue Institut Francais du Petrole, v. 40, p. 755-784.
Farbiszewska, T., J. Farbiszewska-Kiczma, E. Jażdżyk, Z. Sadowski, A. Szubert (2006). “Kinetic Study Of Biodegradation Of Organic Matter Extracted From Black Shale Ore”. Physicochemical Problems of Mineral Processing, 40 (2006), 317-325
Gromet, L.P., R.F. Dymek, L.A. Haskin and R.L. Korotev (1984). The ״North American Shale Composite 1 :״st compilations, major and trace element characteristics.-
Herron, M.M., Geochemical classification of terrigenous sands and shales from core or log data (2006). Journal of Sedimentary Research. V. 58, no. 5, p. 820-829.
Jackson M.J., M.D. Muir and K.A. Plumb (1987). Geology of the southern McArthur Basin, Northern Territory. Bureau of Mineral Resources, Canberra, Bulletin 220.
Jarvie, D.M., F. Behar and L. Mazéas (2010). Genesis of Shale Gas--Physicochemical and Geochemical Constraints Affecting Methane Adsorption and Desorption, at AAPG Annual Convention, New Orleans, LA. Geochim. Cosmochim. Acta, 48, 2469-2482, London.
Jones, B., and D.C. Manning (1994). Comparison of geochemical indices used for the interpretation of paleo-redox conditions in Ancient mudstones. Chem. Geol., 111(1-4), 111.
Korth, J. (1987). Analytical studies on Australian oil shales. University of Wollongong thesis collection.
Kuhn, T.W., E.S. Krull, A. Bowater, K. Grice and G. Geixner (2010). The occurrence of short chain n-alkanes with an even over odd predominance in higher plants and soils. Organic geochemistry Volume 41, Issue 2.
Lewis, R., Ingraham D., Pearcy M, Williamson J., Sawyer W., Frantz J 2004. New Evaluation Techniques for Gas Shale Reservoirs. Reservoir Symposium.
Lu, Yuehan (2008). Evaluation of Organic Geochemical Proxies in Sediments as Recorders of the History of Biogeochemical Dynamics in Lake Erie over the Last Century. Dissertation at The University of Michigan.
Lyons, T. W., A.D. Anbar, S. Severmann, C. Scott, and B.C. Gill (2009) Tracking Euxinia in the Ancient Ocean: A Multiproxy Perspective and Proterozoic Case Study. Annual Review of Earth and Planetary Sciences. Vol. 37: 507-534.
Matchette-Downes C.J. Geochemical Analytical Techniques And Interpretation. Mdoil Ltd.
Saint Vidgeon Drilling Collaboration Final Report 61 | P a g e
Madigan T.L. and D.J. Rawlings (1994). Low-pressure regional metamorphism in the Bradshaw Complex, northeast Arnhem Land, Northern Territory, Australia. Geological Society of Australia, Abstracts 37, 260.
Meyer, K.M. and Lee R. Kump (2008). Oceanic Euxinia in Earth History: Causes and Consequences. Annu. Rev. Earth Planet. Sci. 2008. 36:251–88.
Meyers, P. A., and B. J. Eadie (1993). Sources, degradation and recycling of organic matter associated with sinking particles in lake-michigan. Organic Geochemistry 20: 47-56.
Meyers, P. A., and R. Ishiwatari (1993). Lacustrine organic geochemistry - an overview of indicators of organic-matter sources and diagenesis in lake-sediments. Organic Geochemistry 20: 867-900.
Mir, A.R., Z.A. Bhat, S.H. Alvi and V.Balaram (2014). Trace Element Geochemistry of Black Shales in Singhbhum Mobile Belt, Eastern India: Implications For Source Rock and Paleoredox Conditions. International Jurnal of scientific research. Volume: 3, Issue 1. ISSN No. 2277 – 8179.
McCarthy, K., Rojas K., Niemann M., Palmowski d., Peters k., Stankiewicz A (2011). Basic Petroleum geochemistry for Source Rock Evaluation. Oifield Review 23, no. 2.
Nagarajan, R., Madhavaraju, J., Nagendra, R., Selvamony, J., Armstrong-Altrin & Moutte, J. (2007). Geochemistry of Neoproterozoic shales of the Rabanpalli Formation, Bhima Basin, Northern Karnataka, southern India: implications for provenance and paleoredox conditions. Revista Mexicana de Ciencias Geológicas, 24(2), 150.
Newell, D. K. (1998). Comparison Of Maturation Data And Fluid-Inclusion Homogenization Temperatures to Simple Thermal Models: Implications for Thermal History and Fluid Flow In The Midcontinent. Kansas Geological Survey, Lawrence, KS 66047
Page, R.W. and I.P. Sweet (1998). Geochronology of basin phases in the western Mt Isa Inlier, and correlation with the McArthur Basin. Australian Journal of Earth Sciences: An International Geoscience Journal of the Geological Society of Australia. Volume 45, Issue 2, 1998. Special Issue: Application of radiogenic isotopes to the study of Australian ore deposits.
Pers. Com Eickhoff C. (2014) Field Season to End-August EP184 Saint Vidgeon Shallow Core Wells. Imperial Oil & Gas ltd company report.
Peters, K.E. and M.R. Cassa (1994). Applied Source Rock Geochemistry: Chapter 5: Part II. Essential Elements. AAPG Special Publications Memoir 60.
Pettijohn, F.J. (1975): Sdimentary Rocks. - 3rd Ed., 628 pp., New York (Harper & Row).
Peucker-Ehrenbrink, B., K.W.W Sims, L.A. Jaffe, S. Petsch and N. Shimizu (2001). Dating Weathering Of Organic-Rich Shales With U-Series Disequilibrium Techniques. Eleventh Annual V. M. Goldschmidt Conference.
Pietsch B.A., K.A. Plumb, R.W. Page, P.W. Haines, D.J. Rawlings and I.P. Sweet (1994). A revised stratigraphic framework for the McArthur Basin, NT: in Hallenstein CP (editor) 'Australian mining looks north – the challenges and choices.' 1994 AusIMM Annual Conference, Darwin 5–9 August 1994, Technical Program Proceedings.The Australasian Institute of Mining and Metallurgy, Melbourne, 135–138.
Plumb, K.A. and H.G. Roberts (1992). The geology of Arnhem Land, Northern Territory. Bureau of Mineral Resources, Australia, Record 1992/55.
Plumb K.A., M. Ahmad and A.S. Wygralak (1990). Mid-Proterozoic basins of the North Australian Craton –regional geology and mineralisation: in Hughes FE (editor) 'Geology of the mineral deposits of Australia and Papua New Guinea.' Australasian Institute of Mining and Metallurgy, Monograph 14, 881–902.
Saint Vidgeon Drilling Collaboration Final Report 62 | P a g e
Ronov, A.B. and A.A. Migdisov (1971). Geochemical history of the crystalline basement and sedimentary cover of the Russian and North American platforms. Sedimentology 16, 137-185.
Taylor, S. R. & McLennan, S. M. (1985). The Continental Crust: Its Composition and Evolution: Blackwell, Oxford, 312 p.
Tribovillard N., J.A. Thomas, T Lyons and A. Riboulleau (2006). Trace metals as paleoredox and paleoproductivity proxies: An update. Chemical Geology. Volume 232, Issues 1–2, 30 August 2006, Pages 12–32.
Turekian, K.K. and K.H. Wedepohl (1961): Distribution of the elements in some major units of the earth’s crust.- Bull. Geol. Soc. Amer., 72, 175-192, Baltimore.
Uysal, I.T., M. Glikson, S.D. Golding and P.N. Southgate (2004). Hydrothermal control on organic matter alteration and illite precipitation, Mt Isa Basin, Australia. Geofluids (2004) 4, 131-142.
Uzoegbu, M.U., N.G. Obaje and I.A. Ekeleme (2013). Geochemical Characterization And Paleoenviroment Of Turonian Dukul Formation, Ne Nigeria. Scientific Research Journal (SCIRJ), Volume I, Issue II, September 2013 5 ISSN 2201-2796
van Krevelen, D.W. (1984). Organic geochemistry – old and new. Organic Geochemistry, 6:1–10.

Saint Vidgeon Drilling Collaboration Final Report 63 | P a g e
APPENDIX I: PYROGRAMMS
Figure 20: Pyrogram of sample 351308.
Figure 21: Pyrogram of sample 351309.
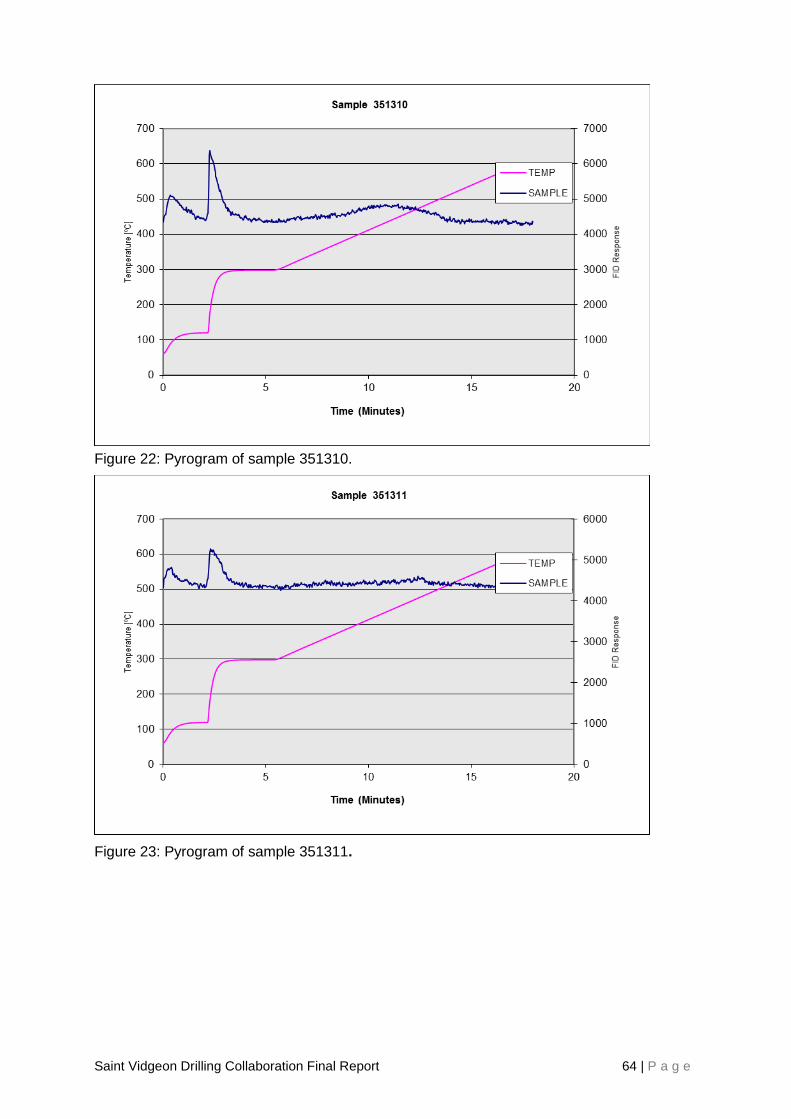
Saint Vidgeon Drilling Collaboration Final Report 64 | P a g e
Figure 22: Pyrogram of sample 351310.
Figure 23: Pyrogram of sample 351311.

Saint Vidgeon Drilling Collaboration Final Report 65 | P a g e
Figure 24: Pyrogram of sample 351312.
Figure 25: Pyrogram of sample 351313.
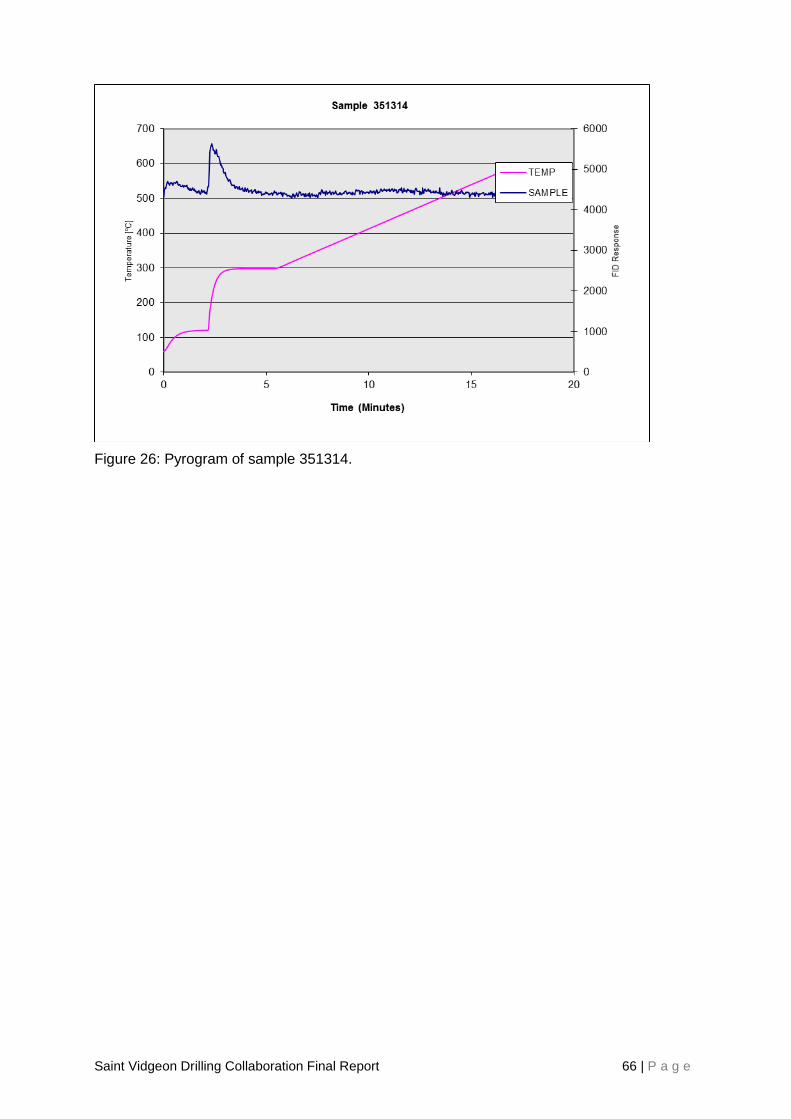
Saint Vidgeon Drilling Collaboration Final Report 66 | P a g e
Figure 26: Pyrogram of sample 351314.
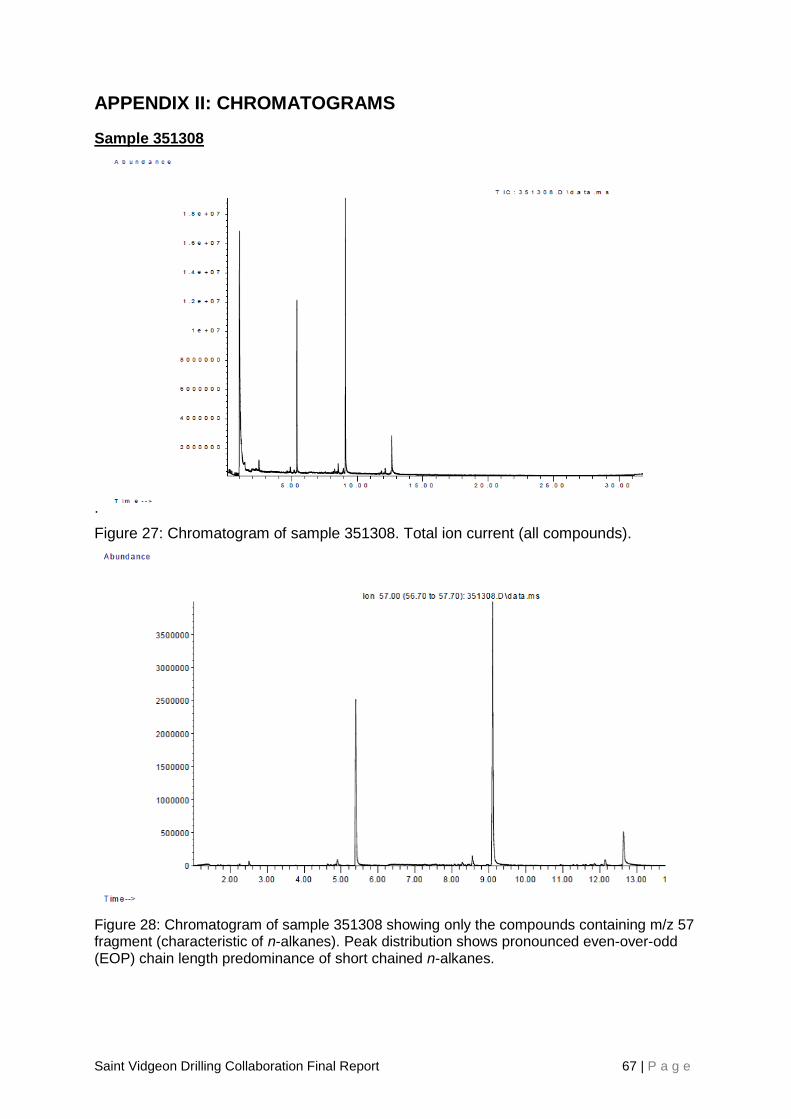
Saint Vidgeon Drilling Collaboration Final Report 67 | P a g e
APPENDIX II: CHROMATOGRAMS
Sample 351308
.
Figure 27: Chromatogram of sample 351308. Total ion current (all compounds).
Figure 28: Chromatogram of sample 351308 showing only the compounds containing m/z 57 fragment (characteristic of n-alkanes). Peak distribution shows pronounced even-over-odd (EOP) chain length predominance of short chained n-alkanes.

Saint Vidgeon Drilling Collaboration Final Report 68 | P a g e
Sample 351310
Figure 29: Chromatogram of sample 351310. Total ion current (all compounds).
Figure 30: Chromatogram of sample 351310 showing only the compounds containing m/z 57 fragment (characteristic of n-alkanes). Peak distribution shows pronounced even-over-odd (EOP) chain length predominance of short chained n-alkanes.