Embed Size (px)
Citation preview
Impacts of Wide-Base Tires on
Pavement Performance
Imad Al-Qadi Jaime Hernandez
Hao Wang Eric Weaver
9/10/2013

2
Agenda 2:00 – 2:05 Software Instructions: Lisa Marflak/Andrew Bevington 2:05 – 2:10 Introduction: Eric Weaver, FHWA 2:10 – 2:25 Introduction and Background on Wide-Base Tires:
Imad Al-Qadi, UIUC 2:25 – 2:40 Tire-Pavement 3D Contact: Imad Al-Qadi, UIUC 2:40 – 3:00 Pavement Modeling and Impact of 3D Moving Tire
Loading: Jaime Hernandez, UIUC 3:00 – 3:15 Failure Prediction Considering Contact Stress
Variations: Hao Wang, Rutgers 3:15 – 3:25 Cost Impact of Using Wide-Base Tires: Hao Wang,
Rutgers 3:25 – 3:35 Ongoing Work and Final Remarks: Imad Al-Qadi, UIUC 3:35 – 4:00 Question: Trenton Clark

Introduction
Eric Weaver

Introduction and Background on Wide-Base Tires
Imad Al-Qadi

5
Wide-Base Tire WBT 445/50 R22.5 DTA 275/80 R22.5

6
Wide-Base Tire Nominal tire width 400~460 mm Low Profile 385/65R22.5; 425/65R22.5; 455/55R22.5
Dual Tire Nominal tire width 250~305mm High Profile 12-22.5; 12R22.5; 275/80R22.5
Code Tire width (mm)/ tire aspect ratio (the ratio of section
height to width)/ radial ply (R)/ rim diameter code (in)
Wide-Base Tire
7
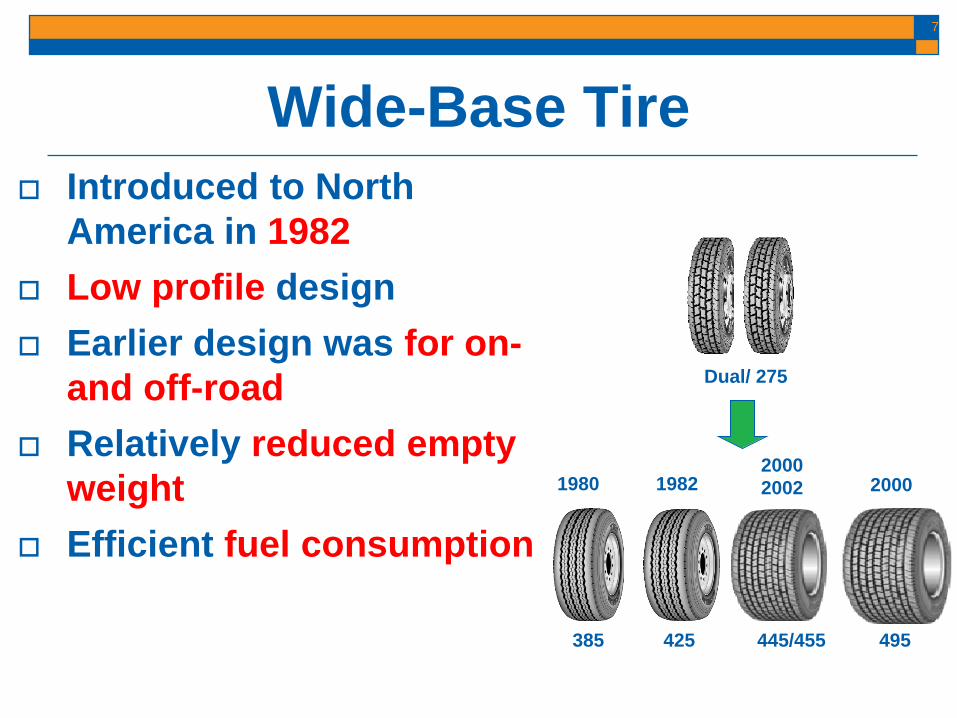
Introduced to North America in 1982
Low profile design Earlier design was for on-
and off-road Relatively reduced empty
weight Efficient fuel consumption
Wide-Base Tire
1980 1982 2000 2002 2000
385 425 445/455 495
Dual/ 275

8
Wide-base tires have been used in Europe since early 1980s
In some countries more than 80% of trailers use wide-base tires
Earlier generation of wide-base tires were proven more detrimental to flexible pavement systems than regular dual tires
Wide-Base Tire

9
Impact of Wide-Base Tires on… Road Infrastructure Accelerated pavement testing Numerical modeling and analytical methods
Dynamic Tire Loading Trucking Operation Fuel economy; hauling capacity; tire cost and
repair; safety; ride and comfort Environment Gas emissions; tire recycling; noise

10
Impact on Road Infrastructure First Generation WBT (FG-WBT) Finland: FG-WBT caused 1.2 to 1.4 times
the damage by DTA1
Virginia: FG-WBT produced 2 times greater permanent deformation and 25% less fatigue life2
Pennsylvania: FG-WBT resulted in 50-70% greater damage3
California: Overlay systems - Number of repetitions to failure was 50-70% lower4 1. Huhtala, 1986; 1989
2. Bonaquist, 1992 3. Sebaaly and Tabatabaee, 1992 4. Harvey and Popescu, 2000

11
Impact on Road Infrastructure Europe1:
UK: WBT-495 caused 50-70% more rutting than WBT-385 for thin and medium-thick flexible pavements, respectively
Germany: WBT-495 produced 30% greater rutting than DTA (315/80R22.5) for thick pavements
France: No significant difference between tires when using very thick and stiff pavements
Finland: WBT-495 greater response when considering dynamic loading
1. COST 334, 2001

12
Impact on Road Infrastructure New Generation WBT
Virginia Smart Road1: Combined damage ratio showed NG-WBT and DTA had similar overall damage
Canada2: Comparison of damage depended on environmental conditions
Illinois3: High-volume roads: WBT-425 more damaging than
WBT-455 Low-volume roads: NG-WBT more damaging
Florida4: WBT-455 tire performed as good or better than DTA in rutting and cracking 1. Al-Qadi et al., 2001-2005
2. Pierre et al., 2003 3. Al-Qadi and Wang, 2009, 2009a 4. Greene et al, 2009

13
Impact on Dynamic Tire Loading WBT is more flexible than DTA (two
walls instead of four) Transmissibility1: WBT-425 has less transmissibility than DTA Transmissibility is not affected by load and
slightly affected by tire-inflation pressure WBT produced a dynamic load
coefficient between 10 and 12% lower than that of DTA2
1. Tielking, 1994 2. Streit et al., 1998

14
At 60 mph (100 kmh), aerodynamic drag consumes approximately 40% of the fuel Mechanical losses consume approximately 25% of the fuel Rolling resistance accounts for approximately 35% of the fuel consumed
aerodynamic drag
Impact on Trucking Operation
mechanical losses
rolling resistance
Truck’s fuel consumptions:

15
Impact on Trucking Operation WBT reduces rolling resistance
coefficient (10% greater fuel efficiency)1
WBT combined with aerodynamic devices can improve fuel efficiency by 18%2
Hauling companies reported savings between 3.5 and 12% in gas3
Fuel consumption is reduced by 10% (instrumented trucks were used)4
1. Muster, 2000 2. Bachman et al., 2005 3. Genivar, 2005 4. Franzese, 2010

16
Impact on Trucking Operation Hauling Capacity: WBT is lighter; hauling
capacity is increased1
Tire Cost and Repair: WBT is easier to inspect, repair, and maintain2
Safety: WBT has similar or slightly better performance after sudden-air-loss test1
Ride and Comfort: WBT reduces vibration; WBT and DTA require similar degree of handling1
1. Markstaller, 2000 2. Genivar, 2005

17
Impact on Environment Gas Emissions: Reduction in emissions due to less gas
consumption1,2
Reduction in NOx emission (9-45%)3
Tire Recycling: savings if WBT was disposed instead of DTA1
Noise is slightly reduced when using WBT4
1. Genivar, 2005 2. Ang-Olson, 2002 3. Bachman, 2005 4. Markstaller, 2000

18
Summary WBT advantages over DTA include: Fuel savings Increase hauling capacity Environment friendly
FG-WBT were proven to be more damaging than DTA
Damage between NG-WBT and DTA needs to be further studied

Tire-Pavement 3D Contact
Imad Al-Qadi

20
Tire-Pavement 3D Contact Conventional pavement analysis
assumptions includes: Circular tire-pavement contact area Contact stresses in the vertical direction
only Uniform contact stresses Static loading
Conventional analysis cannot compare WBT and DTA

21
Contact Area
Circular Contact Area Actual Contact Area
Circular contact area does not accurately represent the actual geometry of the tire-pavement contact

22
Stress Distribution Conventional Assumption: Uniform magnitude and vertical direction only

23
Stress Distribution Actual Distribution: Nonuniform magnitude and three-dimensional

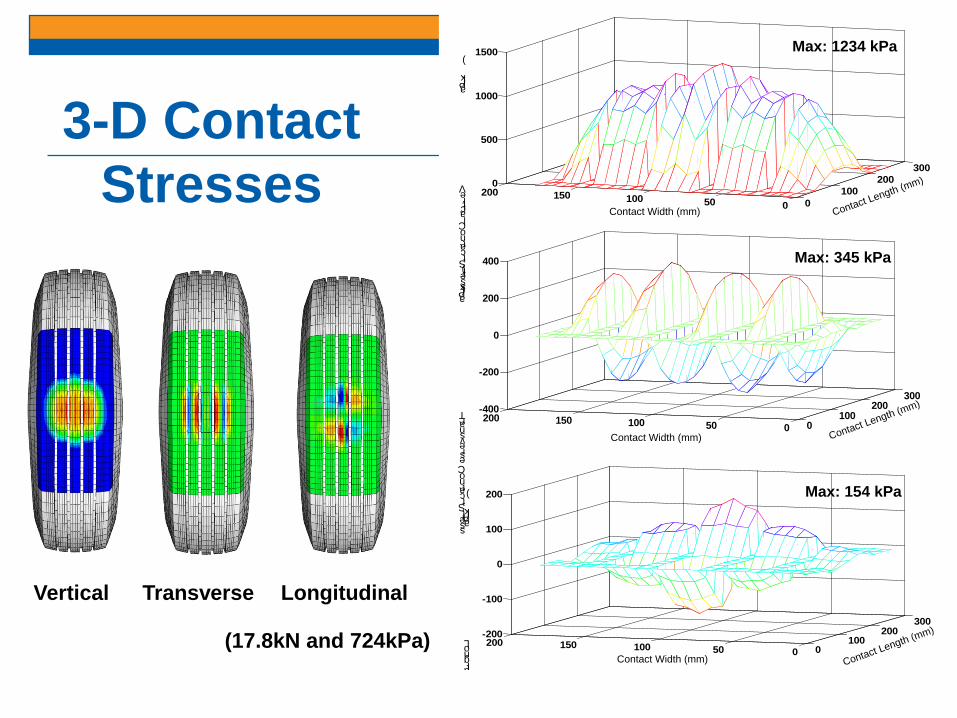
3-D Contact Stresses
0100
200300
050100150200-400
-200
0
200
400Transverse Contact Stress
(kPa
)
Contact Width (mm) Contact Length (mm)
Max: 345 kPa
Vertical Contact Stress
(kPa
)
Contact Width (mm) Contact Length (mm)
0100
200300
0501001502000
500
1000
1500 Max: 1234 kPa
0100
200300
050100150200-200
-100
0
100
200
Longitudinal C
(kPa
)
Contact Width (mm) Contact Length (mm)
Max: 154 kPa
Vertical Longitudinal Transverse
(17.8kN and 724kPa)
25
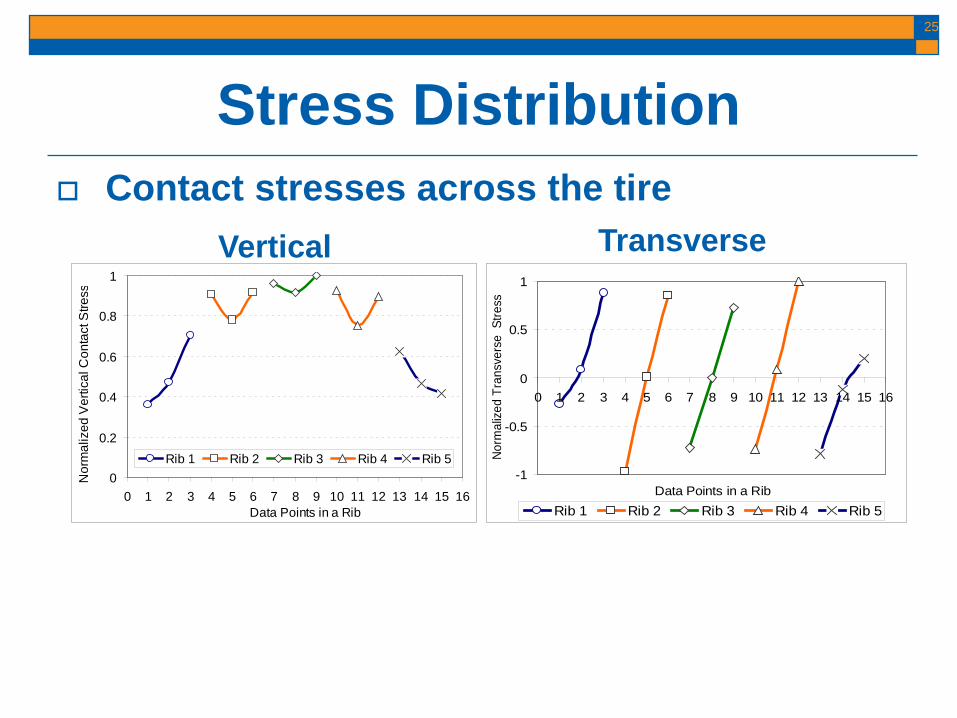
Stress Distribution Contact stresses across the tire
0
0.2
0.4
0.6
0.8
1
0 1 2 3 4 5 6 7 8 9 10 11 12 13 14 15 16Data Points in a Rib
Nor
mal
ized
Ver
tical
Con
tact
Stre
ss
Rib 1 Rib 2 Rib 3 Rib 4 Rib 5-1
-0.5
0
0.5
1
0 1 2 3 4 5 6 7 8 9 10 11 12 13 14 15 16
Data Points in a RibN
orm
aliz
ed T
rans
vers
e S
tress
Rib 1 Rib 2 Rib 3 Rib 4 Rib 5
Vertical Transverse

26
3D Contact Stresses 3D contact stresses are crucial to
compare effect of WBT and DTA on pavement and the resultant damage
Two alternatives to determined 3D contact stresses: Experimental Measurements Modeling

27
Measurement of 3D Contact Stresses
Pad Assemblies
HVS Machine

28
Relevance of in-Plane Stresses Transverse Contact Stresses
29
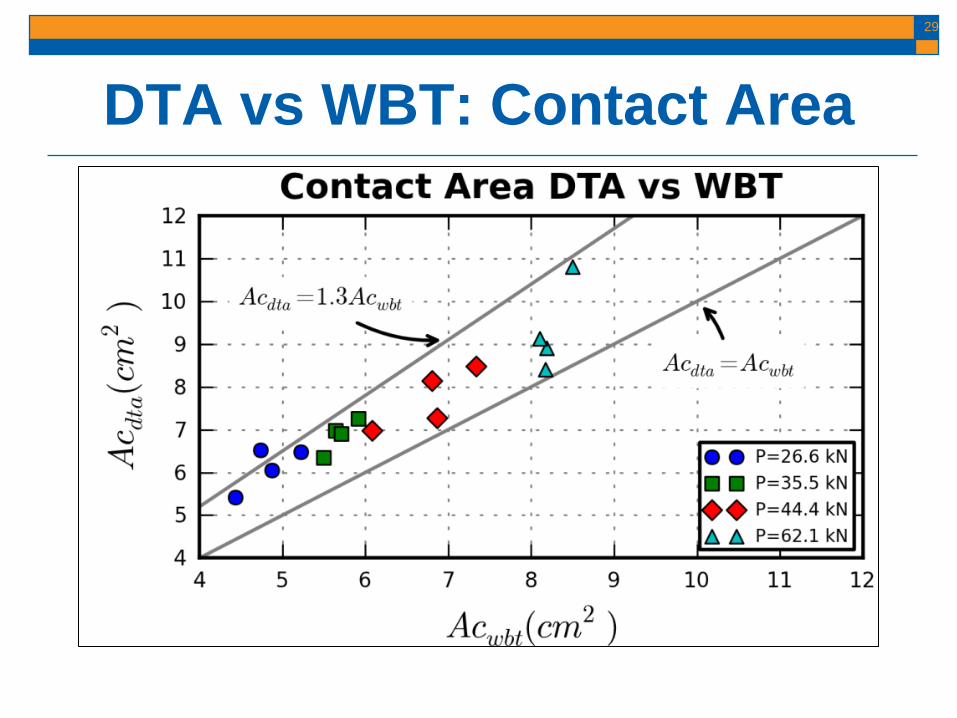
DTA vs WBT: Contact Area
30
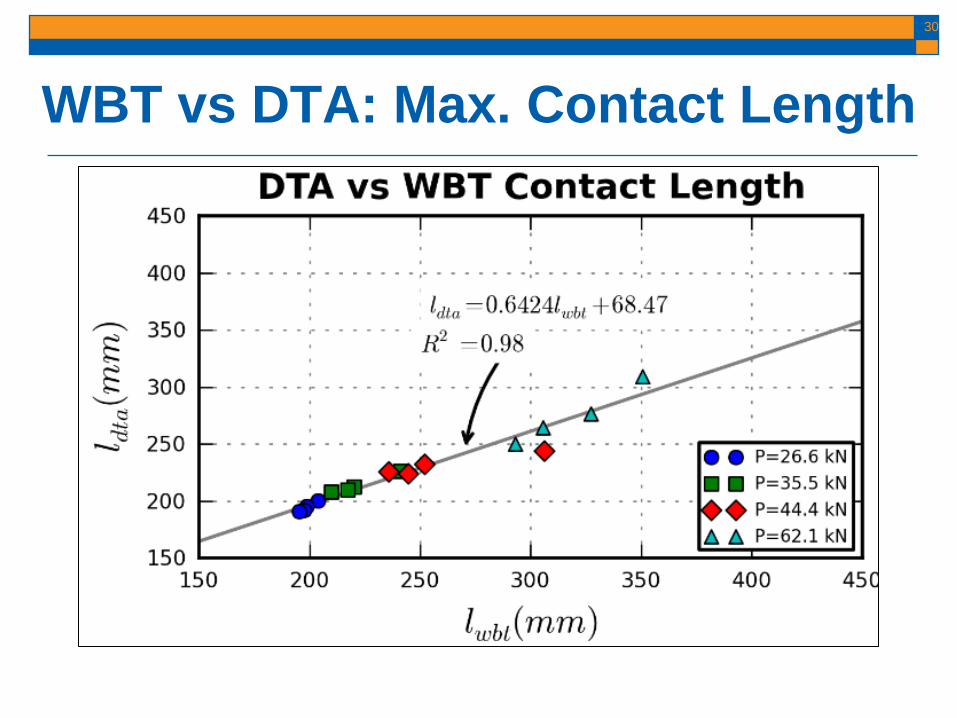
WBT vs DTA: Max. Contact Length

Tire Modeling Allows characterizing tire-pavement
contact under various scenarios Different loading cases Rolling conditions: Braking, accelerating,
cornering
Utilize experimental measurements for validation
31

Simulation Process
Radial PlyBeads
Steel Betls
Ribs
Sidewall
Grooves
(After Michelin website)
32

Comparison between Prediction and Measurements 0
5
10
15
20
25
30
0 20 40 60 80Deflection (mm)
Load
on
Tire
(kN
)
Measurement at 828kPaCalulation at 828kPaMeasurement at 414kPaCalculation at 414kPa
0
300
600
900
1200
1500
0 1 2 3 4 5 6 7 8 9 10111213141516Points at Each Rib
Ver
tical
Con
tact
Stre
ss (k
Pa)
PredictionMeasurement
-400
-200
0
200
400
0 1 2 3 4 5 6 7 8 9 10111213141516
Ponits at Each Rib
Tran
sver
se C
onta
ct S
tress
(k
Pa)
Prediction Measurement
33
34
Summary Conventional pavement analysis
does not properly consider tire-pavement interaction
Tire-pavement load-transfer mechanism depends on tire type

Pavement Modeling and Impact of 3D Moving Tire
Loading
Jaime Hernandez

36
Pavement Modeling Successful pavement models
requires: Appropriate input: materials, loading, etc. Accurate representation of reality: moving
load, layer interaction, etc. Validation using experimental
measurements: pavement instrumentation

37
Pavement Modeling Conventional 3D FEM
AC Materials Linear elastic Viscoelastic Granular Materials
Linear elastic Nonlinear cross-anisotropic (stress- and direction-
dependent) Loading Area Circular Versatile Loading Static Static/ dynamic
and 3D Layer Interaction NO YES
38
Dynamic Analysis Considers mass inertia and
damping forces effect on pavement response
Different contact areas of tire imprint can affect inertia force values
Pavement response is affected by loading amplitude
39
Material Characterization AC: Linear-viscoelastic: Dynamic modulus test (E* ) Prony series expansion
Granular materials: Thin pavement: Nonlinear cross-
anisotropic stress-dependent Thick pavement: Linear Elastic
40
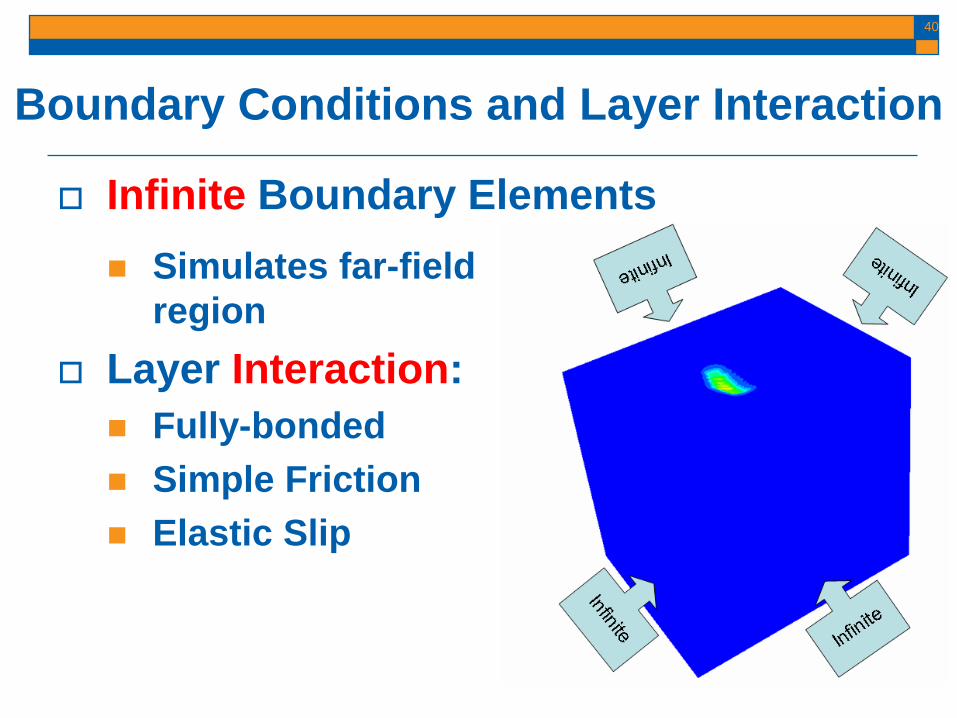
Boundary Conditions and Layer Interaction
Infinite Boundary Elements Simulates far-field
region Layer Interaction: Fully-bonded Simple Friction Elastic Slip

41
3D Contact Stresses Uniform constant
stresses underestimate response close to surface
3D contact stresses may create greater compressive strain on top of subgrade and transverse tensile strain

3D Contact Stresses
Measured Imprint (mm) Discretized Imprint Finite Element
Discretization into FE
A4
A3
A2
A1
A5
A6
A7
A8
20 mm 33.8 29.9 32.4 29.9
33.8
11.4 14.6 14.6
11.4
Discretization of tire footprint
42

43
3D Contact Stresses
Measurements Footprint’s
element size in plain view (20 mm)

44
FEM Input
Finite Element Model Contact Stresses From measurements to FEM

45
Moving Loading Applied tire-loading is moving, not stationary Loading amplitude continuously changes Dynamic tire force is excited by pavement
irregularities (& vehicle suspensions) 3D stress state at tire-pavement interface
The nature of vehicle loading is critical to pavement response!

46
Moving Load Traditional method
Triangular, trapezoidal, rectangular amplitude in constant loading area
Pavement at different depths have same loading time
Impulsive loading (hammering)
Continuous loading Loading area changes as tire moves Loading amplitudes are linearly varied with time
for the entrance and exit parts of tire imprint

47
Continuous Moving Loading
0
0.1
0.2
0.3
0.4
0.5
0.6
0.7
0.593 0.601 0.608 0.616
Time step
Con
tact
Pre
ssur
e (M
Pa)
A5A6A7A8
0
0.2
0.4
0.6
0.8
1
1.2
0 0.005 0.01 0.015 0.02Time (sec)
Load
ing
Ampl
itude
Trapezoidal
Continuous

48
Finite Element Model Mesh Configuration
Wheel path
Infinite boundary elements
Transition zone

Validation – Smart Road Dynamic FE Analysis:
Bottom of HMA layers
-40
-20
0
20
40
60
80
100
0 0.05 0.1 0.15 0.2 0.25 0.3
Time (sec)
Long
itudi
nal S
train
(µ)
MeasuredCalculated
-75
-50
-25
025
50
75
100
125
150
0 0.05 0.1 0.15 0.2 0.25
Time (sec)
Lon
gitu
dina
l Str
ain
(µ)
MeasuredCalculated
Dynamic FE Analysis: Bottom of wearing surface
49
50
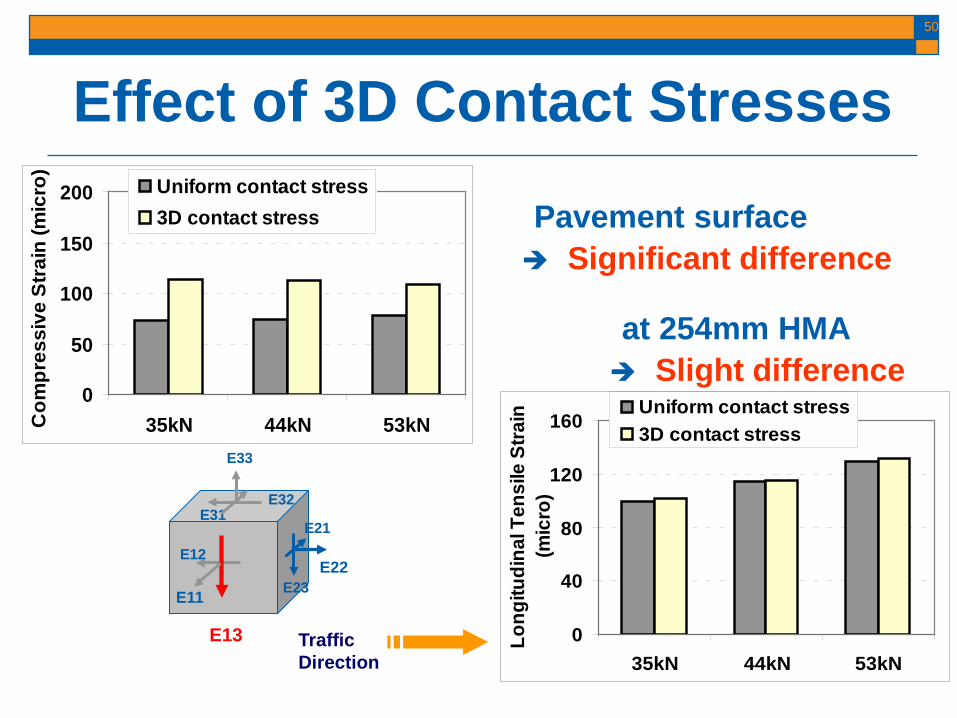
0
40
80
120
160
35kN 44kN 53kN
Long
itudi
nal T
ensi
le S
train
(m
icro
)
Uniform contact stress3D contact stress
0
50
100
150
200
35kN 44kN 53kNCom
pres
sive
Str
ain
(mic
ro)
Uniform contact stress3D contact stress
at 254mm HMA Slight difference
Pavement surface Significant difference
Effect of 3D Contact Stresses
E13
E21
E11 E23 E22
E31 E32
E33
E12
Traffic Direction

-300
-200
-100
0
100
200
300
0 3 6 9 12 15
Transverse Rib Position
Stra
in (µ
)
38mm-Shear Strain38mm-Transverse Tensile Strain38mm-Longitudinal Tensile Strain
-400
-300
-200
-100
0
100
200
300
400
0 3 6 9 12 15
Rib Position
Stra
in (µ
)
76mm-Shear Strain
76mm-Transverse Tensile Strain76mm-Longitudinal Tensile Strain
-300
-200
-100
0
100
200
300
0 3 6 9 12 15
Transverse Rib Position
Stra
in (µ
)
114mm-Shear Strain
114mm-Transverse Tensile Strain
114mm-Longitudinal Tensile Strain-150
-100
-50
0
50
100
150
200
250
0 3 6 9 12 15
Rib Position
Stra
in (µ
)
150mm-Shear Strain150mm-Transverse Tensile Strain150mm-Longitudinal Tensile Strain
-300
-200
-100
0
100
200
0 3 6 9 12 15
Transverse Rib Position
Stra
in (µ
)
Surface-Shear StrainSurface-Transverse Tensile StrainSurface-Longitudinal Tensile Strain
Strain Distribution with Depth
Outside Rib Inside Rib
Critical strain within HMA Strain from the surface to bottom of 150mm HMA
51

52
Summary Finite Element Modeling Dynamic-implicit analysis Material characterization 3D contact stresses Continuous moving loading Infinite boundary elements Layer interaction
In-plane contact stresses are crucial for accurate near-surface pavement responses calculation

Failure Prediction Considering Contact Stress
Variations
Hao Wang
3-D Contact Stresses
0100
200300
050100150200-400
-200
0
200
400
Transverse Contact Stress
(kPa
)Contact Width (mm) Contact Length (mm)
Max: 345 kPa
Vertical Contact Stress
(kPa
)
Contact Width (mm) Contact Length (mm)
0100
200300
0501001502000
500
1000
1500 Max: 1234 kPa
0100
200300
050100150200-200
-100
0
100
200
Longitudinal C
(kPa
)
Contact Width (mm) Contact Length (mm)
Max: 154 kPa
Vertical Longitudinal Transverse
(17.8kN and 724kPa)

Contact Stresses at Various Loading Conditions
Load, kN
(kip)
Pressure, kPa (psi)
Maximum contact stress Range, kPa Avg. Std.
17.8-40.2 (4-9)
414- 966
(60-140)
Vertical 854-1633 1220 264
Transverse 194-490 339 100
Longitudinal 103-306 214 50
Stress ratio 1:0.23:0.07- 1:0.31:0.30 1:0.28:0.17 /
55
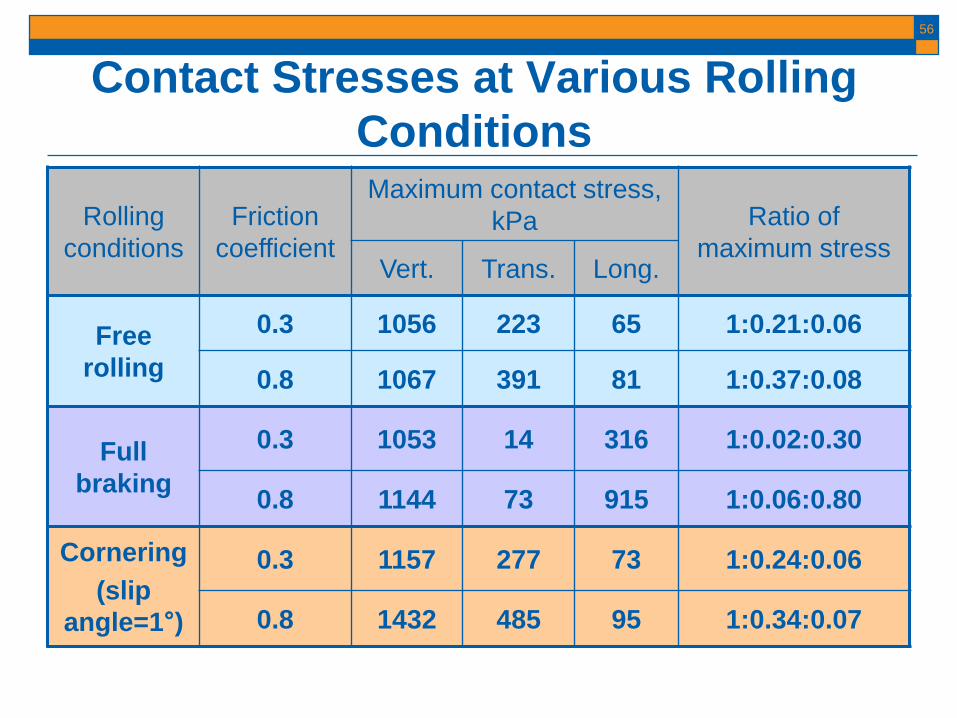
Contact Stresses at Various Rolling Conditions
56
Rolling conditions
Friction coefficient
Maximum contact stress, kPa Ratio of
maximum stress Vert. Trans. Long.
Free rolling
0.3 1056 223 65 1:0.21:0.06
0.8 1067 391 81 1:0.37:0.08
Full braking
0.3 1053 14 316 1:0.02:0.30
0.8 1144 73 915 1:0.06:0.80
Cornering (slip
angle=1°)
0.3 1157 277 73 1:0.24:0.06
0.8 1432 485 95 1:0.34:0.07

Pavement Failure Mechanism
(After Will and Timm 2007)
(After Uhlmeyer et al. 2000)
(After Al-Qadi et al. 2007)
57

Analysis of Thin Pavement Responses A low-volume road pavement section built
at ATREL: Geosynthetically stabilized pavements
Conventional failures in thin asphalt pavements: Bottom-up fatigue cracking HMA rutting (distortional deformation) Base permanent deformation (shear
failure) Subgrade rutting
Wearing surface76mm
Subgrade(CBR=4)
Granular base305mm
58

-100
0
100
200
300
0 0.1 0.2 0.3
Time (sec)
Shea
r Stra
in (m
icro
)
In the plane parellel to movingIn the plane perpendicular to moving
Moving wheel load
E12
E23E22E11
E13
76mm HMA
305mm Granular Base
Subgrade
-100
0
100
200
300
0 0.1 0.2 0.3
Time (sec)
Tens
ile S
train
(mic
ro)
TransverseLongitudinal
59
0
500
1000
1500
0 0.1 0.2 0.3Time (sec)
Ver
tical
Str
ess
(kP
a)
5mm depth33mm depth76mm depth

Effect of Contact Stresses on Pavement Responses
60
Locations Responses At 25°C At 47°C
Uniform 3-D Uniform 3-D
Bottom of asphalt layer
Long. tensile strain (micro) 374 +0% 1057 +8%
Tran. tensile strain (micro) 272 +6% 973 +19%
Shallow depth of
asphalt layer
Shear strain (micro) 299 +4% 1499 +5%
Shear stress (kPa) 401 +16% 243 +25%
Top of subgrade
Deviatoric stress (kPa) 54 -7% 81 -5%
Compressive strain (micro) 1246 -9% 1781 -9%

0
25
50
75
100
0 500 1000 1500 2000Vertical Shear Stain (micro)
Dep
th (m
m)
No BrakingBraking47ºC
0
25
50
75
100
0 100 200 300 400Vertical Shear Strain (micro)
Dep
th (m
m)
No BrakingBraking25ºC
Effect of Tire Braking on
Shear Strain
61
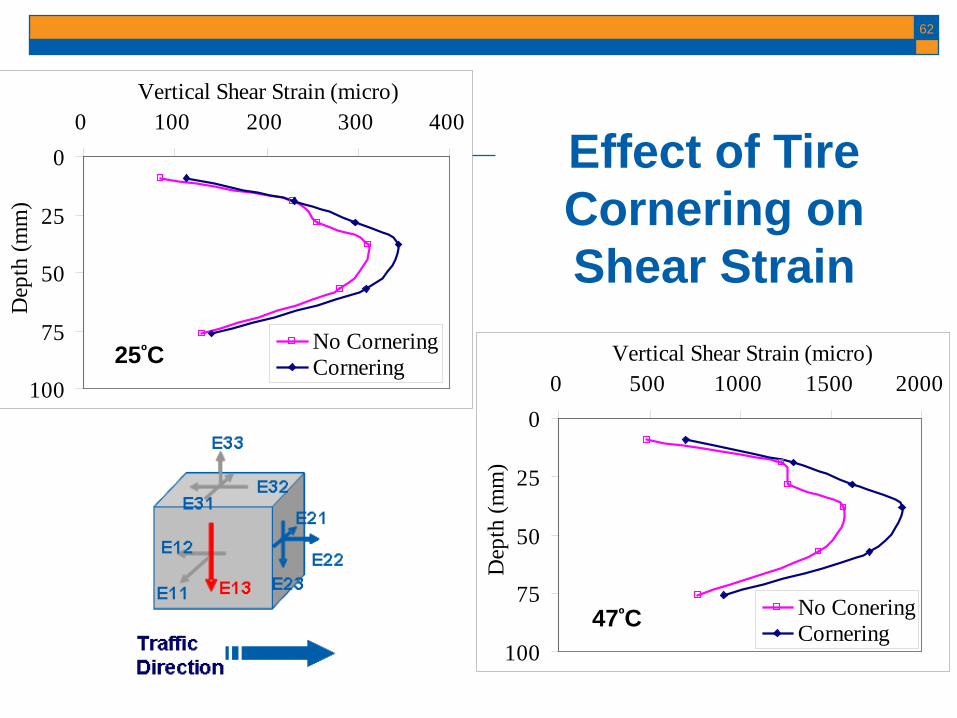
0
25
50
75
100
0 100 200 300 400Vertical Shear Strain (micro)
Dep
th (m
m)
No CorneringCornering25ºC
0
25
50
75
100
0 500 1000 1500 2000Vertical Shear Strain (micro)
Dep
th (m
m)
No ConeringCornering47ºC
Effect of Tire Cornering on Shear Strain
62

63
0
25
50
75
100
0 100 200 300 400Vertical Shear Strain (micro)
Dep
th (m
m)
Dual-tire AssemblyWide-base 455 Tire
0
25
50
75
100
0 500 1000 1500 2000Vertical Shear Stain (micro)
Dep
th (m
m)
Dual-tire AssemblyWide-base 455 Tire
25ºC
47ºC
Effect of Wide-Base Tire on Shear Strain

Wearing surface 50mm
Lime Modified Subgrade 305mm
Binder course 115mm
Base course 89mm
A thick full-depth pavement section with 254-mm asphalt layer
Near-surface (or top-down) cracking is more critical in thick asphalt pavements (Baladi et al. 2002)
Observed within 10 years after construction
Longitudinal or transverse cracking around wheel-path areas
Depth of cracking is generally contained in the wearing course
Near-Surface (Top-Down) Cracking
64

Strain Distribution at Near-Surface
-40
-20
0
20
40
60
80
-600 -400 -200 0 200 400 600
Distance to Tire Center (mm)
Nea
r-Su
rfac
e Te
nsile
Str
ain
(mic
ro)
Uniform Contact Stress3-D Contact Stress
Tire Tire
-200
-100
0
100
200
-600 -400 -200 0 200 400 600
Distance to Tire Center (mm)
Nea
r-S
urfa
ce S
hear
Str
ain
(mic
ro)
Uniform Contact Stress3-D Contact Stress
Tire Tire
65
Tension
Shear

Effect of Load and Pressure on Near-Surface Strains
66
High Load
High Tire Pressure

67
Effect of Vehicle Maneuvering on Near-Surface Strains
Tire Braking
Tire Cornering

68
-40
-20
0
20
40
60
80
-600 -400 -200 0 200 400 600
Distance to Tire Center (mm)
Nea
r-Su
rfac
e Te
nsile
Stra
in (m
icro
) Dual-tire AssemblyWide-base 455
-200
-100
0
100
200
-600 -400 -200 0 200 400 600
Distance to Tire Center (mm)
Nea
r-Su
rfac
e Sh
ear S
train
(mic
ro)
Dual-tire AssemblyWide-base 455
Tension
Shear
Effect of Wide-Base Tire on Near-Surface Strains

69
0
50
100
150
-500 -400 -300 -200 -100 0 100 200 300 400 500
Distance to Tire Center (mm)
Long
itudi
nal T
ensi
le S
trai
n (m
icro
)
Wide-base 455
Dual-tire Assembly
0
60
120
180
240
300
-300 -200 -100 0Compressive Strain (micro)
Dep
th a
t Sec
tion
D (m
m)
Dual-tire AssemblyWide-base 455
Effect of Wide-Base Tire on Tension and Compression Strains

70
Summary Effect of contact stresses on pavement
responses depends on the following: 3D contact stresses; applied load and tire
pressure; and vehicle maneuvering Pavement layer thickness
Effect of wide-base tires on pavement responses Different contact stress distributions Depends on pavement failure type, asphalt
layer thickness, and temperature
Cost Impact of Using Wide-Base Tires
Hao Wang

72
Case Study in South Dakota 2012-01 Research project sponsored by South
Dakota DOT In South Dakota, wide-base tires may be generally
substituted for standard duals; but the legally allowed weight on single axles is reduced 17.5kips for 445mm tires; 18kips for 455mm tires 20kips for dual-tire configuration
Project goal: Assess potential impact of allowing 20-kip load on single axle equipped with 445mm and 455mm wide-base tires on state and local roads in South Dakota

73
Web Survey and Interview Survey to SD state DOT on load regulation or permit
fee of wide-base tires -- 22 responses Survey to state trucking associations on use
percentage, trend, and benefits of wide-base tires -- 8 responses
Interview local truck owners and operators -- 6 Discussion with SDDOT staff to characterize road
surface designs in SD

74
Damage Ratios Damage Ratio: ratio of damage caused by one pass
of a single axle with wide-base tires with respect to damage caused by one pass of a single axle with dual tires when carrying the same load
Damage Ratio: 𝐃𝐃 = 𝟏/𝐍𝐬𝐬𝐬𝐬𝐬𝐬𝟏/𝐍𝐝𝐝𝐝𝐬
= 𝐍𝐝𝐝𝐝𝐬/𝐍𝐬𝐬𝐬𝐬𝐬𝐬1
The allowable load repetitions (N) could be calculated directly from performance measurements or critical pavement responses (through transfer functions)
Performance models in new AASHTO MEPDG are mainly used
1. Al-Qadi, Elseifi, and Yoo, 2004

75
Individual Damage Ratios Pavement Structure Distress Ratio of Critical
Response Damage
Ratio Source
References
Full-Depth Pavement
Fatigue Cracking 1.03-1.25 1.13-2.41 ICT/IDOT
Study Top-Down Cracking 0.89-0.91 0.64-0.70
Primary Rutting 0.86-0.91 0.77-0.85
Thick Asphalt
Pavement
Fatigue Cracking 0.96-1.06 0.86-1.26 Virginia Smart Road Study;
Ontario Study; FLDOT Study
Top-Down Cracking 0.63-0.90 0.16-0.67 Primary Rutting 1.06 1.05-1.27
Subgrade Rutting N/A N/A
Thin Asphalt Pavement
Fatigue Cracking 1.14-1.30 1.68-2.82 Quebec Study; ICT/IDOT
Study Primary Rutting 1.14-1.28 1.35-1.77
Subgrade Rutting 1.06-1.21 1.31-2.35
76
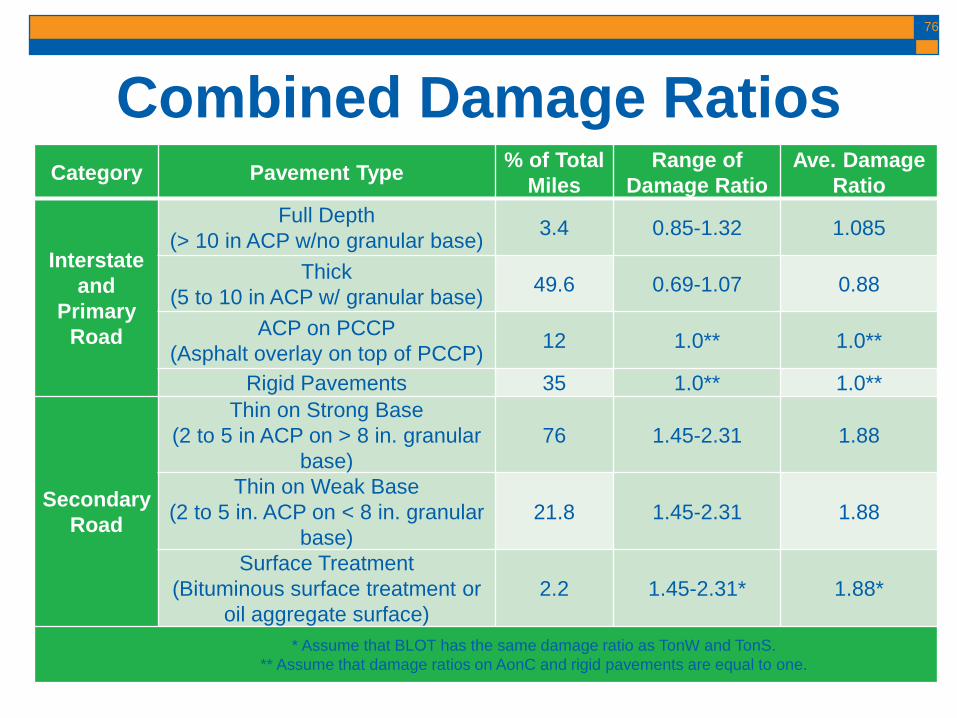
Combined Damage Ratios Category Pavement Type % of Total
Miles Range of
Damage Ratio Ave. Damage
Ratio
Interstate and
Primary Road
Full Depth (> 10 in ACP w/no granular base) 3.4 0.85-1.32 1.085
Thick (5 to 10 in ACP w/ granular base) 49.6 0.69-1.07 0.88
ACP on PCCP (Asphalt overlay on top of PCCP) 12 1.0** 1.0**
Rigid Pavements 35 1.0** 1.0**
Secondary Road
Thin on Strong Base (2 to 5 in ACP on > 8 in. granular
base) 76 1.45-2.31 1.88
Thin on Weak Base (2 to 5 in. ACP on < 8 in. granular
base) 21.8 1.45-2.31 1.88
Surface Treatment (Bituminous surface treatment or
oil aggregate surface) 2.2 1.45-2.31* 1.88*
* Assume that BLOT has the same damage ratio as TonW and TonS. ** Assume that damage ratios on AonC and rigid pavements are equal to one.

77
Impact on Pavement Damage Cost Step 1: Determine pavement cost functions
Thin Pavement on Weak Base
Thick Asphalt Pavement
78
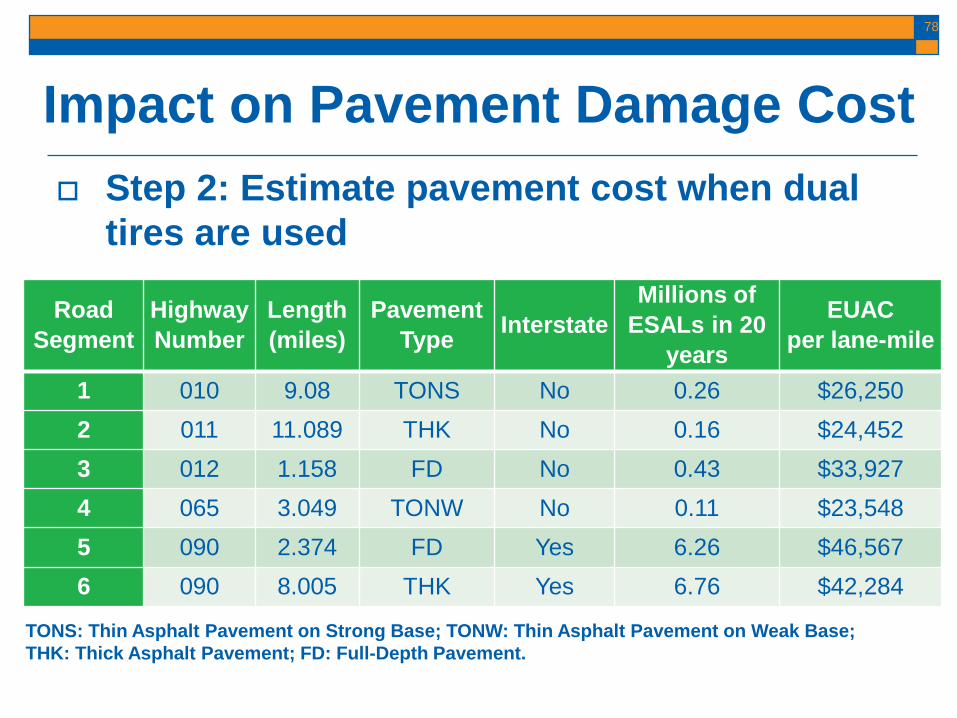
Impact on Pavement Damage Cost Step 2: Estimate pavement cost when dual
tires are used
TONS: Thin Asphalt Pavement on Strong Base; TONW: Thin Asphalt Pavement on Weak Base; THK: Thick Asphalt Pavement; FD: Full-Depth Pavement.
Road Segment
Highway Number
Length (miles)
Pavement Type Interstate
Millions of ESALs in 20
years
EUAC per lane-mile
1 010 9.08 TONS No 0.26 $26,250 2 011 11.089 THK No 0.16 $24,452 3 012 1.158 FD No 0.43 $33,927 4 065 3.049 TONW No 0.11 $23,548 5 090 2.374 FD Yes 6.26 $46,567 6 090 8.005 THK Yes 6.76 $42,284

79
Impact on Pavement Damage Cost Step 3: Estimate the number of trucks with
spread tandem axles and axle load spectrum
Category
% of Class 9
trucks in all
trucks
%of trucks with spread tandem axles in all Class 9 tucks
% of spread tandem
with full
load
% of spread tandem
with 40% full
load
8-9 ft axle spacing
(max load allowed: 19
kips)
9-10 ft axle spacing
(max load allowed: 19.5
kips)
>10 ft axle spacing
(max load allowed: 20
kips)
Interstate 51.7% 0.46% 8.12% 15.26% 78.97% 21.03%
Non-Interstate 35.2% 0.35% 8.29% 19.15% 65.12% 34.88%
80
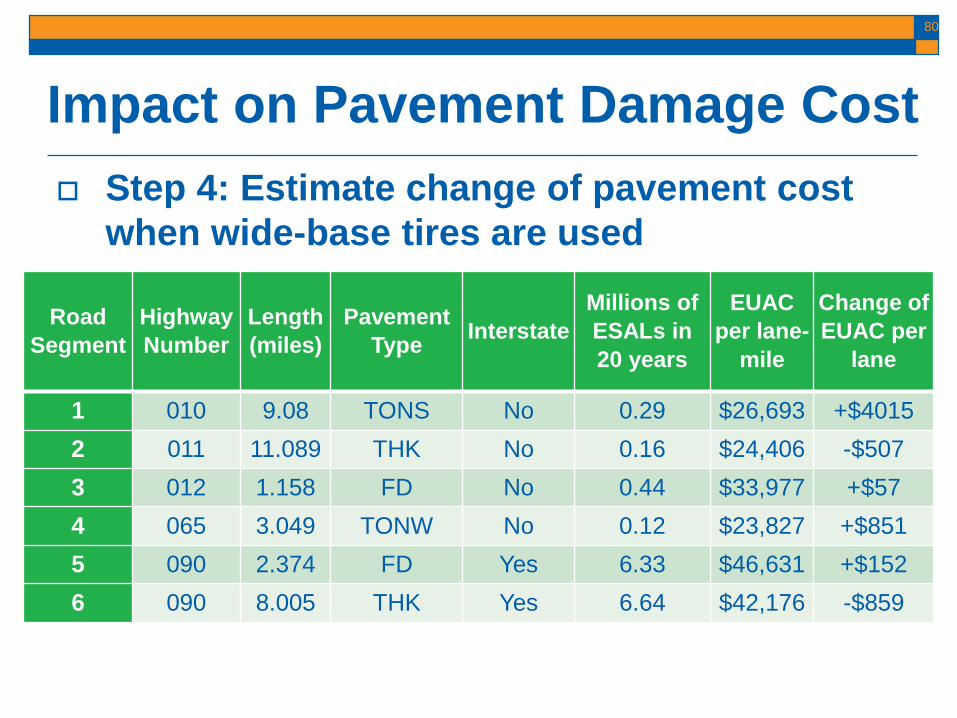
Impact on Pavement Damage Cost Step 4: Estimate change of pavement cost
when wide-base tires are used
Road Segment
Highway Number
Length (miles)
Pavement Type Interstate
Millions of ESALs in 20 years
EUAC per lane-
mile
Change of EUAC per
lane
1 010 9.08 TONS No 0.29 $26,693 +$4015 2 011 11.089 THK No 0.16 $24,406 -$507 3 012 1.158 FD No 0.44 $33,977 +$57 4 065 3.049 TONW No 0.12 $23,827 +$851 5 090 2.374 FD Yes 6.33 $46,631 +$152 6 090 8.005 THK Yes 6.64 $42,176 -$859

81
Impact on Pavement Damage Cost
Step 5: Calculate total change of pavement cost in state highway network
Change of EUAC
($ million) Category
Percentage of spread tandem axles using wide-base tires replacing dual tires after policy change
10% 20% 30% 50% 100%
Using average damage ratios
Interstate 0.00 0.00 0.00 -0.01 -0.02 Non-
Interstate 0.36 0.71 1.06 1.73 3.28
All state highways 0.36 0.71 1.06 1.72 3.26

82
Impact on Environmental Cost Recent studies proved that using wide-base tires can
reduce tire rolling resistance by 12% and reduce fuel consumption by 5-12%
Environmental damage and cost of neutralizing gas emission are estimated at $1.13/gal ($0.3/liter)
Cost Saving ($ million)
Percentage of spread tandem axles using wide-base tires replacing dual tires after policy change
10% 20% 30% 50% 100%
Fuel 0.17 0.35 0.52 0.86 1.73
Pollution 0.05 0.10 0.16 0.26 0.52
Total 0.22 0.45 0.67 1.12 2.25
83
Summary Damage ratio provides a good approach
to quantify impact of wide-base tires Pavement failure mechanism Mechanistic-empirical approach
Impact of wide-base tires on life cycle assessment Pavement damage cost Cost of fuel consumption and emmision

Ongoing Work and Final Remarks
Imad Al-Qadi

85
Quantify the impact of WBT on pavement damage utilizing advanced theoretical modeling and validate results using full-scale testing
Scope: Contact stress measurements of tires (WBT &
DTA) APT of pavement sections FEM modeling of pavement loading Calculation of pavement damage
Project Overview

86
Project Overview Literature
Review
MaterialCharacterization
Validation
AvailableData
AdditionalData
Contact Stressesand Load-Deflection
Curves
NumericalModeling
ABAQUSCAPA 3D
FEMInput
ExperimentalDatabase
ProposedPavementSections
Damage
LaboratoryTesting

87
Project Overview
DynamicAnalysis
ContinuousMovingLoad
Layer Interaction(Stick Model)
ViscoelasticAsphalt
Materials
3D ContactStresses
NonlinearGranularMaterial
FEMInput

88
Project Overview
DynamicModulus
Test
Cross-AnisotropicStress-DependentGranular Material(for Low-Volume
Roads)
Semi-CircularBeam(SCB)
MixVolumetrics
LaboratoryTesting

89
Project Overview Virginia Smart
Road
UIUC-ATRELThin Sections
UIUC-ATRELFull-Depth
UC-Davis PermanentDeformation Profiles
Florida-DOT PermanentDeformation Profiles
Ohio SPS-8
ExperimentalDatabase

90
Project Overview
Florida DOTOhio (DEL-23) UC Davis
ProposedPavementSections

91
Project Overview
ANN-BasedPrediction
Models
Life-Cycle CostAnalysis (LCCA)Guidelines Using
RealCost
Implementation
Life-CycleAssesment ofEnvironmentalImpacts (LCA)
Damage

92
Loading Matrix
Tire Type Inflation Pressure (kPa) Tire Loading (kN)
NGWB and Dual 552
26.6 35.5 44.4 62.2 79.9
NGWB and Dual 690
NGWB and Dual 758
NGWB and Dual 862
Dual Only 414/758* Dual Only 552/758*
*Differential Tire Inflation Pressure
Contact stress measurements and APT

FEM Input: AC Materials Based on more than 1000 data sets
2σ ≈ 95.4%, 2.5σ ≈ 97.5%
and 3σ ≈ 99.8%
Layers Considered: Wearing Surface (WS) 9.5 or 12.5mm Intermediate Layer (IS) 25 or 19.5mm Base Layer (BS) 25 or 37.5mm
From http://en.wikipedia.org/wiki/Normal_distribution.
93

FEM Input: AC Materials
Strong
Weak
94
95
FEM Input: Granular Materials Base materials (thin pavements) Cross-anisotropic stress-dependent Based on database of 114 materials
(Tutumluer, 2008) Materials in database tested using
pulse load in vertical and radial directions

96
Laboratory Testing Dynamic Modulus SCB
IDT

97
Database of Measurements

98
Artificial Neural Network
Artificial Neural Networks
Experimental Measurement
• Intermediate Cases
Finite Element Model
• Extreme Cases
Tool
• Inputs: -Material Properties -Tire Type -Loading -Pavement Structure
• Outputs: -Stress and Strain -Pavement Damage

99
Testing and Instrumentation Accelerated Pavement Testing
Controlled Truck Load Testing
MDD Strain Gauge
Rosette
Thermocouple
Pressure Cell
Foil Gauge

100
Life Cycle Cost Analysis (LCCA) Guidelines to assess LCCA using
RealCost: Identify RealCost inputs Calculate low-volume damage for current
traffic (Control) Calculate pavement damage caused by
expected traffic (WBT) Run RealCost for both scenarios (Control
and WBT)

101
Life Cycle Assessment (LCA) Evaluation of environmental effects Focus on energy use and greenhouse gas
emissions Sensitivity analysis including:
Range of smoothness, rolling resistance, and surface characteristics
Hauling distance Traffic levels and congestion Traffic closure during constructions Fleet composition
102
Project’s Expected Outcome Database to access measured
pavement responses Validation of pavement model
using instrumented sections Analysis tool comparing pavement
damage caused by WBT and DTA LCA and LCCA

103
Final Remarks Proper characterization of tire-pavement
interaction is crucial to accurately quantify pavement damage
Robust analysis needs to be performed in order to determine the actual damage caused by WBT and DTA
Tire-pavement load transfer mechanism depends on tire type, loading, and rolling conditions

104
Acknowledgement TPF-5(197) Pool Fund Study Technical Panel:
FHWA, RMA, IL, MN, MT, NY, OK, VA, OH, and TX.
ICT, Delft UT, FL DOT, UC Davis, Texas A&M, CSIR UIUC-NCSA, Ohio U., SD DOT B. Choubane, A. Coenen, M. De Beer, M. Elseifi, A.
Gamez, J. Green, J. Harvey, I. Khoury, S. Lew, D. Little, H. Ozer, S. Sargand, T. Scarpas, R. Wu, P. J. Yoo, and M. Ziyadi.

QUESTIONS