Embed Size (px)
Citation preview
Impacts of VMT Reduction Strategies on Selected Areas and Groups
Daniel CarlsonZachary Howard
~Washington State Transportation Center
(TRAC)University of Washington
WA-RD 751.1December 2010
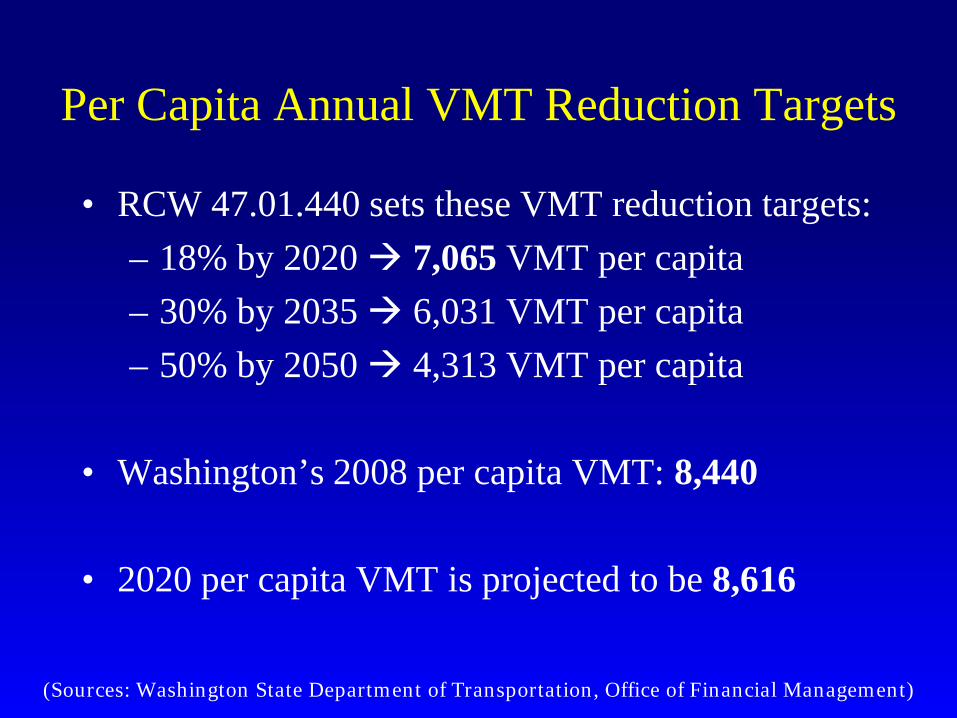
Per Capita Annual VMT Reduction Targets
• RCW 47.01.440 sets these VMT reduction targets:– 18% by 2020 7,065 VMT per capita– 30% by 2035 6,031 VMT per capita– 50% by 2050 4,313 VMT per capita
• Washington’s 2008 per capita VMT: 8,440
• 2020 per capita VMT is projected to be 8,616
(Sources: Washington State Department of Transportation, Office of Financial Management)

Other RCW 47.01.440 Requirements
• “establish and convene a collaborative process to develop a set of tools and best practices to assist state, regional, and local entities in making progress towards the benchmarks”
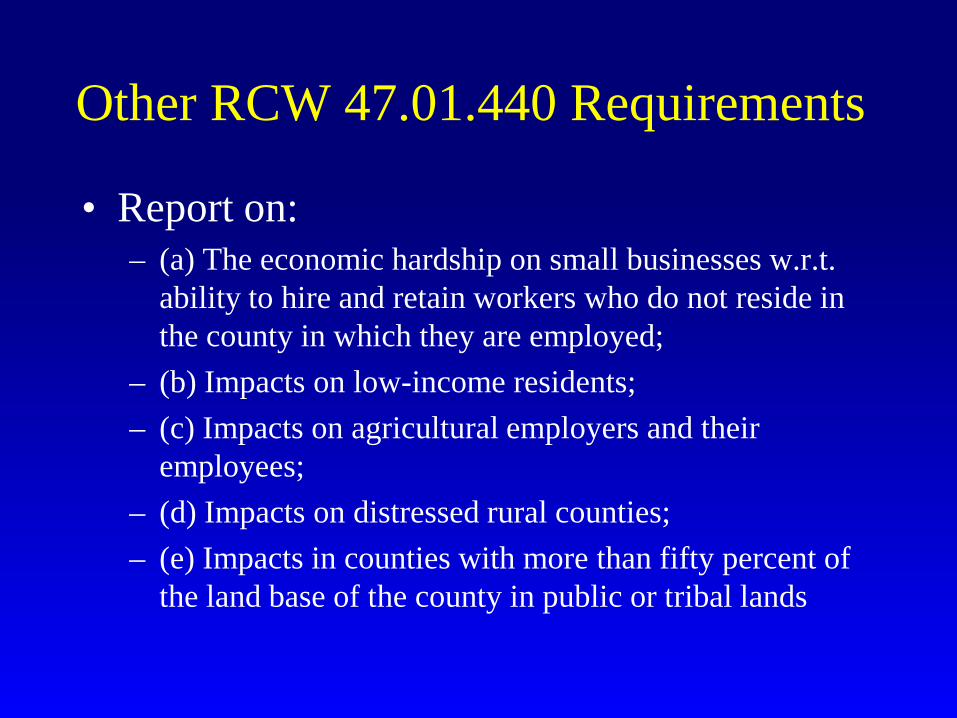
Other RCW 47.01.440 Requirements
• Report on:– (a) The economic hardship on small businesses w.r.t.
ability to hire and retain workers who do not reside in the county in which they are employed;
– (b) Impacts on low-income residents;– (c) Impacts on agricultural employers and their
employees;– (d) Impacts on distressed rural counties;– (e) Impacts in counties with more than fifty percent of
the land base of the county in public or tribal lands

Some Quick Facts
…from an extensive literature review
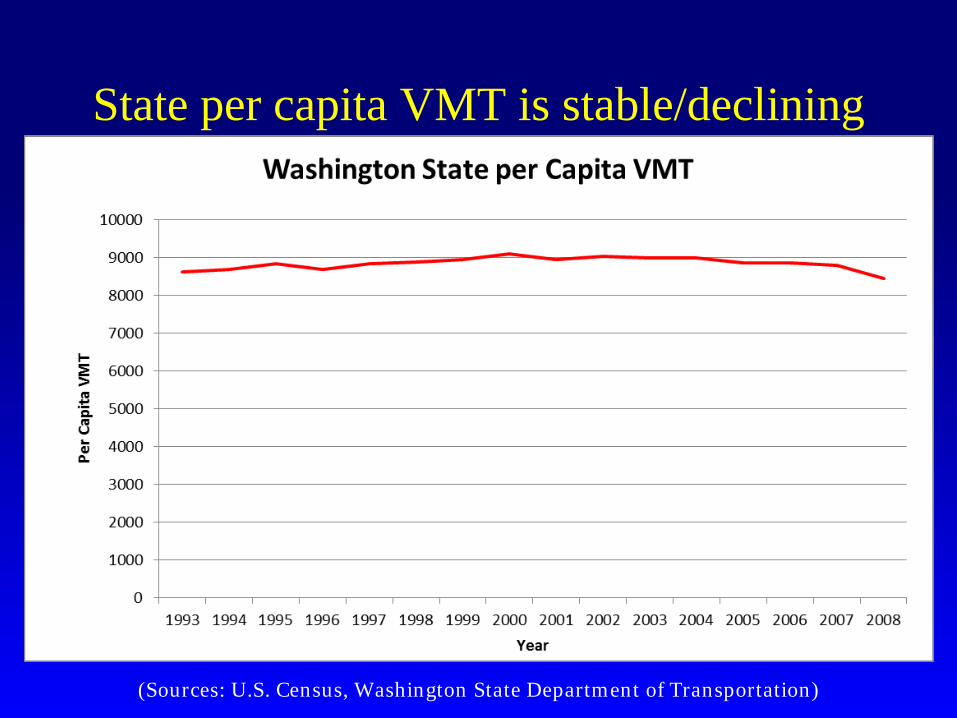
State per capita VMT is stable/declining
(Sources: U.S. Census, Washington State Department of Transportation)
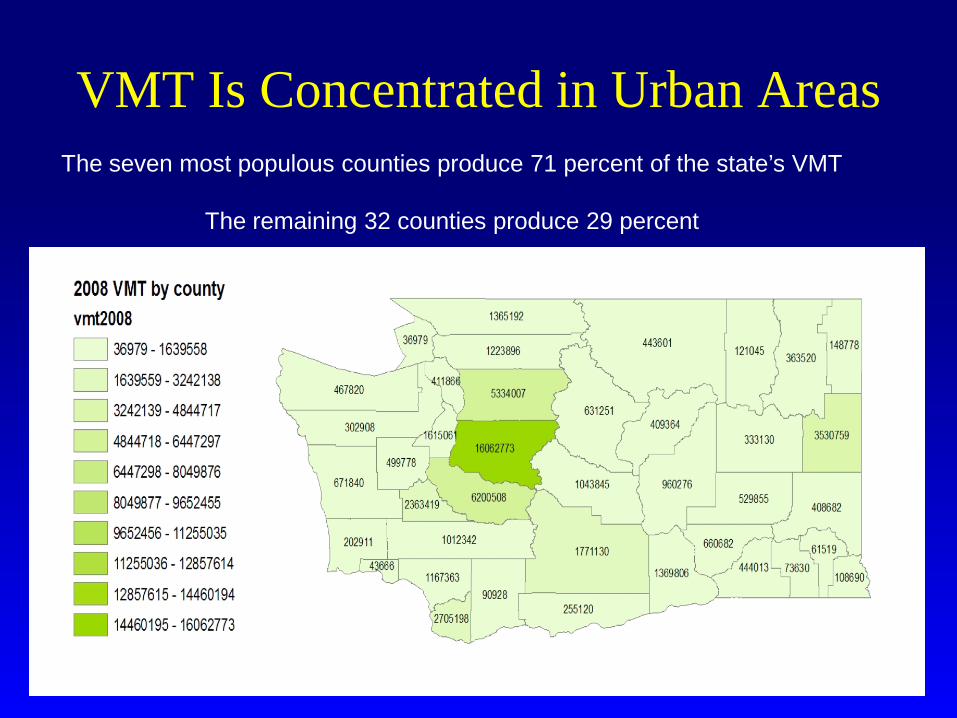
VMT Is Concentrated in Urban AreasThe seven most populous counties produce 71 percent of the state’s VMT
The remaining 32 counties produce 29 percent
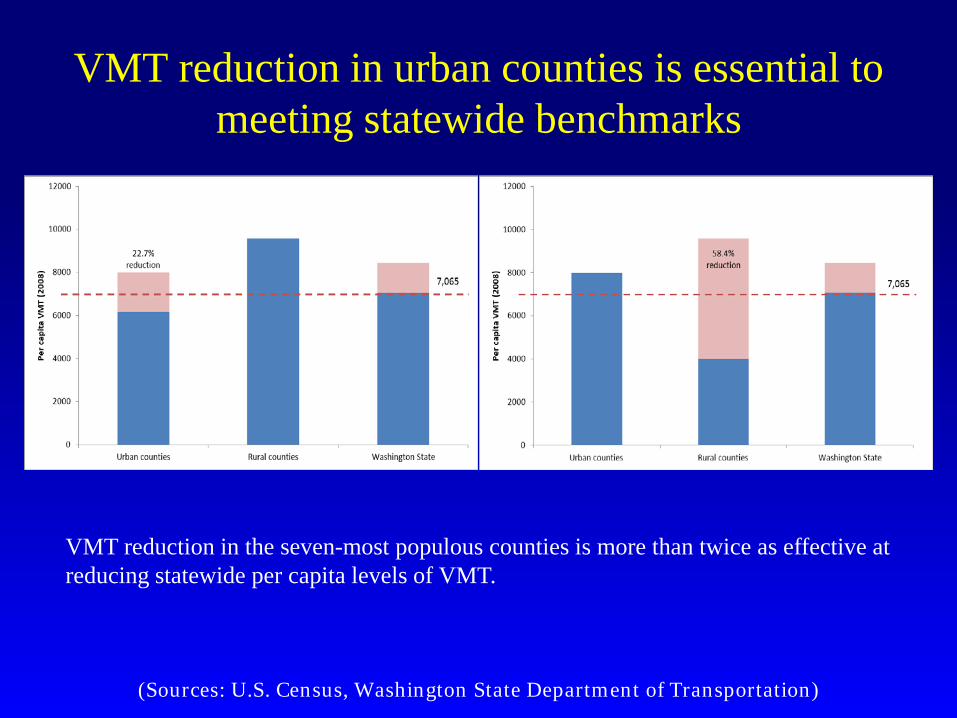
VMT reduction in urban counties is essential to meeting statewide benchmarks
(Sources: U.S. Census, Washington State Department of Transportation)
VMT reduction in the seven-most populous counties is more than twice as effective at reducing statewide per capita levels of VMT.
Three ways to reduce VMT
• Shift modes
• Increase vehicle occupancy
• Travel less
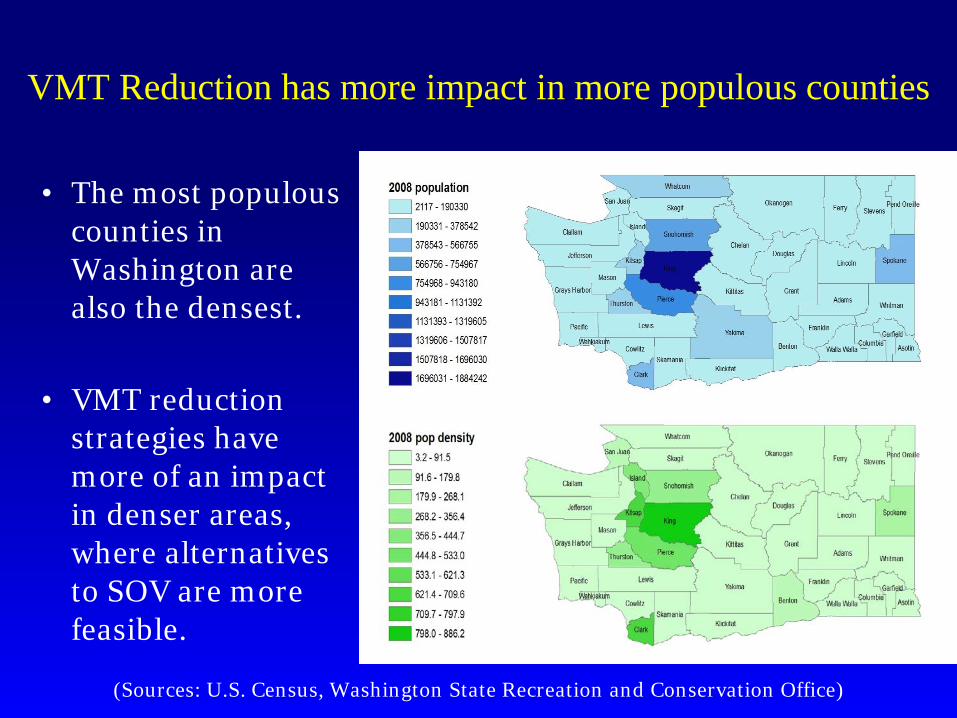
VMT Reduction has more impact in more populous counties
• The most populous counties in Washington are also the densest.
• VMT reduction strategies have more of an impact in denser areas, where alternatives to SOV are more feasible.
(Sources: U.S. Census, Washington State Recreation and Conservation Office)

Impacts on the five groups and areas of interest
The strategy of Applying VMT Charges
• Pricing – VMT charges, tolls, etc. – is proven to reduce VMT.
• We assumed a cost of .05 to .25 per mile as a surrogate for any “drive alone disincentive” programs the state might adopt.
Small business workers who commute across county lines
Approximately 228,000 workers commute across county lines to work at a small business.• Finding
– 53% of the affected workers work in King, Pierce, and Snohomish counties, and many of these workers can make use of rideshare, transit, and other VMT-reducing strategies.
• Assumption– Cross county commutes are 50% longer than national average
(14 mi * 1.5 = 21 mi)• Impacts
– VMT charges would raise SOV-dependent worker costs $2.10 to $10.50 daily.
(Source: U. S. Census data)
Low-income residentsLow-income households already produce between 40% and 50% fewer VMT than other households.
•Strategies– VMT charges (regressive to low-income)– Reward transit use and ride-sharing (benefits low-income)– Encourage affordable housing near places of work
•Assumption– Low income commuters travel the same distance as other commuters.
•Impacts– VMT charges (of $.05-.25 per mile) or tolling disproportionately affect
this group $1.40 to $14/day(Sources: Murakami and Young, 1997; Plotnick et al, 2009)
Agricultural workersIn 2007, there were 93,500 agricultural workers, most of them seasonal.
• Finding- California’s AITS vanpool program reduces VMT by 15
million annually, returning 2 - 3 % of disposable income to participants.
• Strategy– A scaled down version of California’s program would
produce proportional costs and benefits.• Impacts
– A similar program in Washington could reduce VMT by up to 5 million while saving migrant workers $30 - $45 monthly.
(Sources: Department of Commerce, Trade, and Economic Development, 2007; Caltrans, 2006)
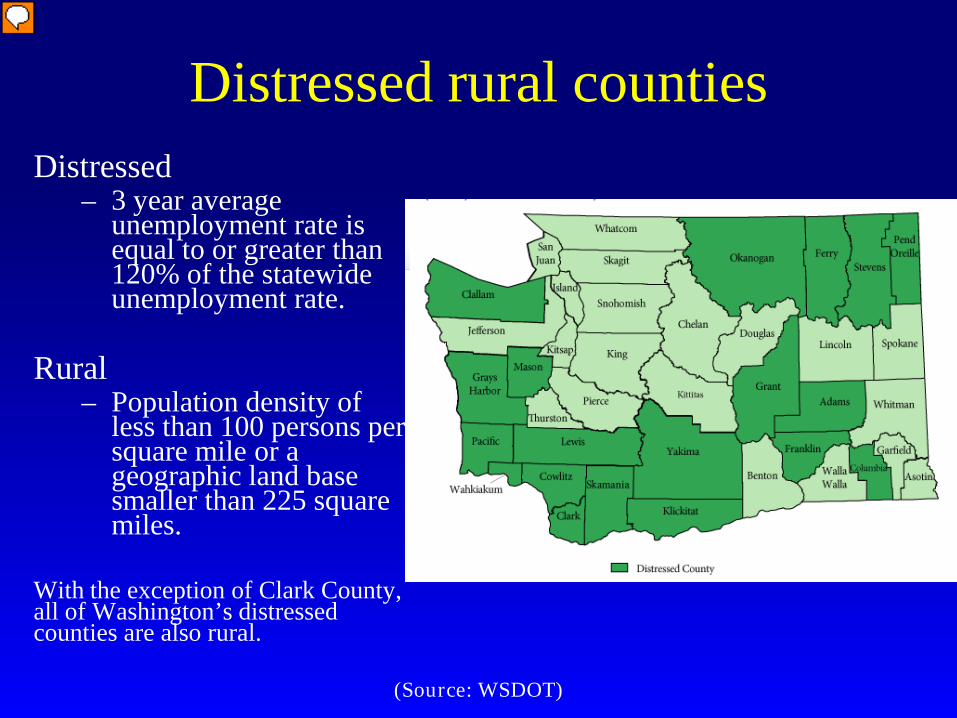
Distressed rural countiesDistressed
– 3 year average unemployment rate is equal to or greater than 120% of the statewide unemployment rate.
Rural– Population density of
less than 100 persons per square mile or a geographic land base smaller than 225 square miles.
With the exception of Clark County, all of Washington’s distressed counties are also rural.
(Source: WSDOT)
Distressed rural counties• Strategies
– Impose a VMT charge– Increase broadband connectivity for teleworking
purposes• Assumption
– Rural commutes are twice the length of the national average; (14 * 2 = 28 mi)
• Impacts– VMT charges add monthly cost from $1.40-$7
daily
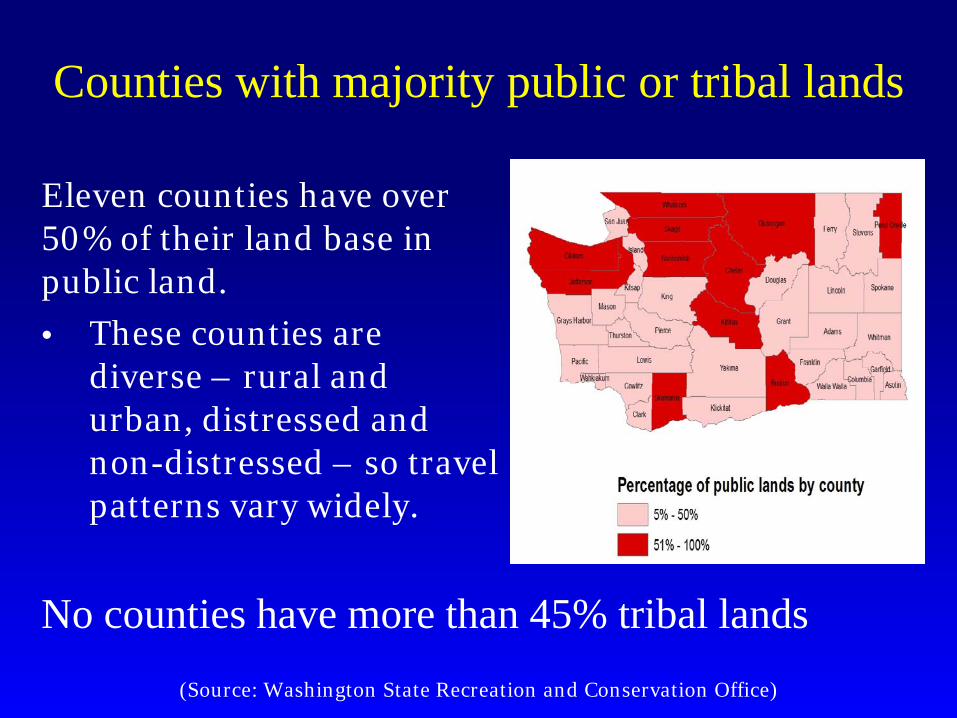
Counties with majority public or tribal lands
No counties have more than 45% tribal lands
Eleven counties have over 50% of their land base in public land.
• These counties are diverse – rural and urban, distressed and non-distressed – so travel patterns vary widely.
(Source: Washington State Recreation and Conservation Office)
Counties with majority public or tribal lands
• Strategies– Urban/Rural divide applies. Strategies for urban
areas and distressed rural counties could apply.• Assumption
– Similar to assumptions previously stated.• Impacts
– Similar to strategies previously outlined.
Conclusions
• Nothing in the law demands uniform reduction across all of these groups
• Metro areas have the alternatives and population density to more easily reduce VMT.
Conclusions
• No single strategy will reduce VMT for each area or group
• In general, pricing will disproportionately burden and affect the five areas and groups
• VMT reduction strategies will be most effective in metro areas—more people, more SOV alternatives
Recommendations• Focus VMT reduction strategies on metropolitan regions. • Mitigate impacts of strategies on low income and vulnerable
populations through subsidy or exemption • Focus near-term efforts on ridesharing and transit use in
urbanized areas.• Focus mid- and long-term efforts on land use and
infrastructure changes and pricing policies for SOV use and affordable housing.
• Collect and track VMT data in different ways, as current counts and estimates are imprecise and inaccurate.