Embed Size (px)
Citation preview

1

2
3
Impacts of the ecoParq program on Polanco Preliminary overview of the parking meter system after one year running
Andrés Sañudo, Xavier Treviño, Jimena Veloz and Salvador Medina.
April 2013

4
Acknowledgements
Cover Photo: Jimena Veloz Rosas
Institute for Transportation and Development Policy Mexico.Ave. Mexico 69, Col. Hipódromo Condesa Cuauhtémoc, D.F.,06170, Mexico CityTel. +52 (55) 3626 2963 - 64 All rights reserved. Any reproduction of this publication, either whole or in part, must be approved in writing by ITDP Mexico.
First edition, 2013.Made in Mexico. Electronic version.
This publication ended on June 282013. Editorial DesignL.D.G. Chantal Fekkes GrimbergL.D.G. Laura Guzmán Rivera
Segunda Cerrada del Deporte No. 26, Int. 29, Col. Jesús del Monte, Huixquilucan, Estado de México, C.P. 52764.
This study for the Institute for Transportation and Development Policy Mexico was realized thanks to the generous backing of the British Embassy in Mexico as part of the umbrella project “Strategies to reduce car use in Mexican cities”. This work consists of a series of investigations, analysis and reports developed for the purpose of promoting public policies in Mexico that help develop sustainable cities and increase life quality for their inhabitants.
We wish to acknowledge the support provided by both the Department of Urban Development and Housing of Mexico City and the Public Space Authority for the realization of this work.
We also wish to thank Miguel Hidalgo District and the ecoParq parking meter program for sharing information and helping to facilitate field work. A special nod goes to Julio César Hernández for preparing the maps of average on-street occupancy.
The final report was prepared by Andrés Sañudo Gavaldón, Xavier Treviño Theesz, Jimena Veloz and Salvador Medina.

5
Content
........................................................................................................................ 9
.......... 10
................ 12
................................................... 17
............................................................................................................................. 18
............................................................................................................. 18
........................................................................................... 20
............................................................................................................................ 23
........................................................................................ 24
...................................................................................................................... 26
........................................................................ 27
1. Introduction
2. The parking problem before the implementation of parking meters
3. Occupancy: Increased availability of parking spaces for residents and visitors
4. Cruising Time: Less time spent finding a parking space
5. Turnover
6. Revenue collected
6.1. Public works projects
7. Ticketing
8. Improvement recommendations
9. Bibliography
Annex: Methodology for estimating benefits

6
Charts, tables, illustrations and maps
Charts Index
Chart 1 Distribution of trips to Polanco (percentage) 10
Chart 2 Relation of a Polanco resident vs. visitors and workers, 2010 11
Chart 3 Average occupancy rate for on-street parking in Polanco, 2011 12
Chart 4 Revenue generated in 2012 by neighborhood (millions of pesos) 19
Chart 5 Funds generated in 2012 by neighborhood (millions of pesos) 19
Chart 6 Vehicles immobilized and impounded in 2012 23
Illustrations Indexillustration 1
Daily average on-street occupancy for automobiles parked in Polanco, illustration 1April 2011 (percentages)
13
illustration 2Daily average on-street occupancy for automobiles parked in Polanco, illustration 22012 (percentages)
13
illustration 3Daily average on-street occupancy for automobiles parked in Polanco before and after implementation of parking meters (percentage)
14
illustration 4 Reduction of Cruising Time 17

7
Tables IndexTable 1 Revenue collected by the ecoParq system in 2012 (pesos) 18
Maps IndexMap 1 Works realized in Polanco with ecoParq funds 20
8
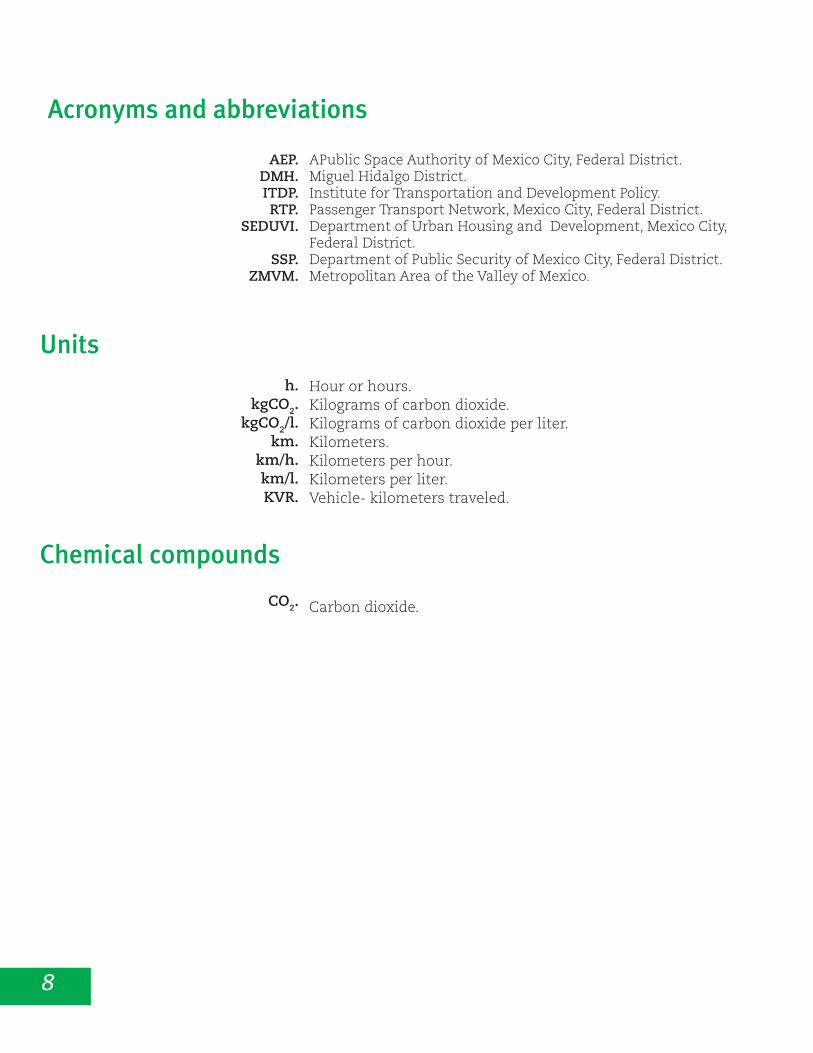
Acronyms and abbreviations
APublic Space Authority of Mexico City, Federal District.Miguel Hidalgo District.Institute for Transportation and Development Policy.Passenger Transport Network, Mexico City, Federal District.Department of Urban Housing and Development, Mexico City, Federal District.Department of Public Security of Mexico City, Federal District.Metropolitan Area of the Valley of Mexico.
Hour or hours.Kilograms of carbon dioxide.Kilograms of carbon dioxide per liter.Kilometers.Kilometers per hour.Kilometers per liter.Vehicle- kilometers traveled.
Carbon dioxide.
AEP. DMH.ITDP.RTP.
SEDUVI.
SSP.ZMVM.
Unitsh.
kgCO2.kgCO2/l.
km.km/h.km/l.KVR.
Chemical compounds
CO2.

9
A year after parking meters were implemented in Polanco (completed in January 2012), ITDP Mexico has evaluated the impact of this program on the neighborhood. It is important to note that our review is preliminary and is based on partial information with respect to several issues,. For this reason, more data is necessary before we can extensively evaluate the effects of the program.
Prior to system implementation, ITDP Mexico conducted a Baseline Study of the Implementation of parking meters in the Polanco neighborhood of Mexico City (Sañudo, 2012). Data was compiled on the pre-meter situation to build a better foundation for post-implementation assessment. The preliminary results of this report are based on this study and should be complimented by further analysis by government agencies in the coming months.
1. Introduction
Photo: Aarón Borras
10
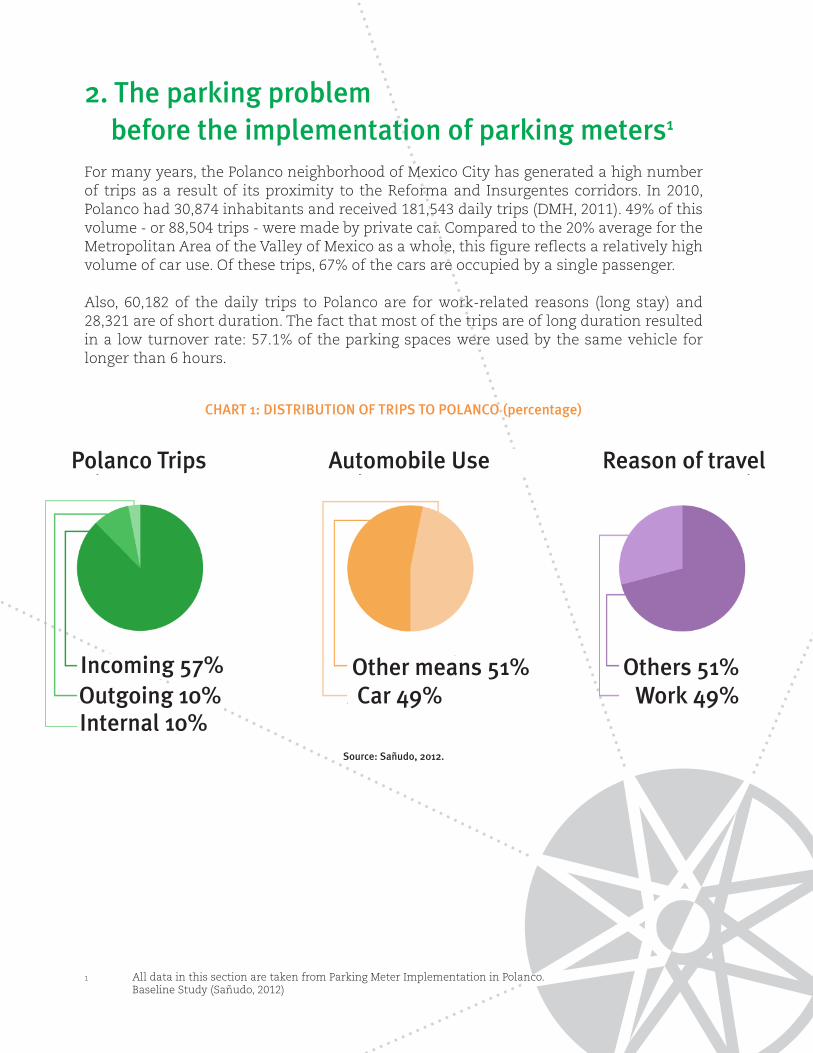
2. The parking problem before the implementation of parking meters1
For many years, the Polanco neighborhood of Mexico City has generated a high number of trips as a result of its proximity to the Reforma and Insurgentes corridors. In 2010, Polanco had 30,874 inhabitants and received 181,543 daily trips (DMH, 2011). 49% of this volume - or 88,504 trips - were made by private car. Compared to the 20% average for the Metropolitan Area of the Valley of Mexico as a whole, this figure reflects a relatively high volume of car use. Of these trips, 67% of the cars are occupied by a single passenger.
Also, 60,182 of the daily trips to Polanco are for work-related reasons (long stay) and 28,321 are of short duration. The fact that most of the trips are of long duration resulted in a low turnover rate: 57.1% of the parking spaces were used by the same vehicle for longer than 6 hours.
1 All data in this section are taken from Parking Meter Implementation in Polanco. Baseline Study (Sañudo, 2012)
CHART 1: DISTRIBUTION OF TRIPS TO POLANCO (percentage)
Source: Sañudo, 2012.
Other means 51%Car 49%
Others 51%Work 49%
Incoming 57%
Polanco Trips Automobile Use Reason of travel
Outgoing 10%Internal 10%

11
There are 9,271 on-street parking spaces in Polanco plus an additional 304 occupied by taxis and 476 spaces reserved for embassies, consulates and educational institutions. In total, there are 10,051 on-street parking spaces. Based on the Mobility Potential in Polanco Study of the Miguel Hidalgo District (DMH, 2011), an additional 10,418 parking spaces exist in 63 off-street parking facilities. That is to say, the neighborhood’s total supply of publicly accesible parking is 19,689 spaces.
Approximately 85% of Polanco households own a car; with an average of 1.34 cars per household (INEGI, 2010); resulting in slightly over 18,000 cars belonging to neighborhood residents. In total, there is a ratio of 5 visitors per resident of which 3.4 are daily commuters and 1.6 are short-term visitors.
CHART 2: RELATION OF A POLANCO RESIDENT VS. VISITORS AND WORKERS, 2010
Source: Sañudo,2012.
Residents
Visitors
Commuters

12
3. Occupancy: Greater availability of parking spaces for residents and visitorsBefore the implementation of ecoParq in Polanco, the average occupancy rate reached nearly 130% at peak hours. This was because nearly 30% of illegally parked cars were either double-parked or placed in a position that obstructed garage entrances, corners and sidewalks.
CHART 3: AVERAGE OCCUPANCY RATE FOR ON-STREET PARKING IN POLANCO, 2011
Source: Sañudo,2012.
After meter implementation, a considerable number of parking spaces were freed up. Among regular parking spaces (without counting vehicles that were parked illegally or those that blocked entrances), the average occupancy rate fell from 93% to 55%. At peak demand, the occupancy rate was an average 98 percent before the meter system was implemented; this fell to 80 percent after the first year of operation. The following maps illustrate the average occupancy on sample blocks both before and after implementation. The only high occupancy areas are Polanquito and the zone adjacent to Mariano Escobedo. The areas between Masaryk and Homero streets have the lowest occupancy.

13
ILLUSTRATION 2: DAILY AVERAGE ON-STREET OCCUPANCY FOR CARS PARKED IN POLANCO, 2012 (percentages)The following plans of sample blocks show occupancy rates that vary based on time of day, both
ILLUSTRATION 1: DAILY AVERAGE ON-STREET OCCUPANCY FOR CARS PARKED IN POLANCO, APRIL 2011 (percentages)
Source: ITDP.
*Correspond to average daily occupancy from May to October 2012.Source: Developed by ITDP with data from ecoParq.
AV. EJÉRCITO NACIONAL MEXICANO AV. EJÉRCITO NACIONAL MEXICANO AV. EJÉRCITO NACIONAL MEXICANO
AV. HOMERO AV. HOMERO AV. HOMERO
AV. PRESIDENTE MASARYK AV. PRESIDENTE MASARYK AV. PRESIDENTE MASARYK
AV. HORACIO AV. HORACIO AV. HORACIO A
V. F
ERRO
CARR
IL D
E CU
ERN
AVAC
A
AV. M
OLI
ÉRE
AV
. MO
LIÉR
NEWTON
NEWTON
BLVR. MANUEL ÁVILA
AV. PASEO DE LA REFORMA AV. PASEO DE LA REFORMA
CALZ. GRAL. M
ARIANO
ESCOB
EDO
CALZ. GRAL. M
ARIANO
ESCOB
EDO
RUBÉN DARÍO RUBÉN DARÍO
Ocupación de la vía pública en PolancoAntes de ParquímetrosPromedio diario
0 a 50%
51 a 85%
86 a 100%
Ocupación de la vía pública en PolancoDespues de ParquímetrosPromedio diario
0 a 50%
51 a 85%
86 a 100%
AV. EJÉRCITO NACIONAL MEXICANO AV. EJÉRCITO NACIONAL MEXICANO AV. EJÉRCITO NACIONAL MEXICANO
AV. HOMERO AV. HOMERO AV. HOMERO
AV. PRESIDENTE MASARYK AV. PRESIDENTE MASARYK AV. PRESIDENTE MASARYK
AV. HORACIO AV. HORACIO AV. HORACIO A
V. F
ERRO
CARR
IL D
E CU
ERN
AVAC
A
AV. M
OLI
ÉRE
AV. M
OLI
ÉR
NEWTON
NEWTON
BLVR. MANUEL ÁVILA
AV. PASEO DE LA REFORMA AV. PASEO DE LA REFORMA
CALZ. GRAL. M
ARIANO
ESCOB
EDO
CALZ. GRAL. M
ARIANO
ESCOB
EDO
RUBÉN DARÍO RUBÉN DARÍO
On-street occupancy in PolancoBefore Parking MetersDaily Average
On-street occupancy in PolancoAfter Parking MetersDaily average
0 to 50%
0 to 50%
51 to 85%
51 to 85%
86 to 100%
86 to 100%

14
before and after implementation of the parking meter system.
ILLUSTRATION 3: AVERAGE DAILY ON-STREET OCCUPANCY FOR CARS PARKED IN POLANCO BEFORE AND AFTER THE IMPLEMENTATION OF PARKING METERS* (percentages)
Ocupación de la vía pública en PolancoAntes de Parquímetros8-12 Hrs.
0 a 50%
51 a 85%
86 a 100%
AV. EJÉRCITO NACIONAL MEXICANO AV. EJÉRCITO NACIONAL MEXICANO AV. EJÉRCITO NACIONAL MEXICANO
AV. HOMERO AV. HOMERO AV. HOMERO
AV. PRESIDENTE MASARYK AV. PRESIDENTE MASARYK AV. PRESIDENTE MASARYK
AV. HORACIO AV. HORACIO AV. HORACIO A
V. F
ERRO
CARR
IL D
E CU
ERN
AVAC
A
AV. M
OLI
ÉRE
AV. M
OLI
ÉR
NEWTON
NEWTON
BLVR. MANUEL ÁVILA
AV. PASEO DE LA REFORMA AV. PASEO DE LA REFORMA
CALZ. GRAL. M
ARIANO
ESCOB
EDO
CALZ. GRAL. M
ARIANO
ESCOB
EDO
RUBÉN DARÍO RUBÉN DARÍO
8 - 12 hrs. Before Parking Meters
8 - 12 hrs. After Parking Meters
Ocupación de la vía pública en PolancoDespués de Parquímetros8-12 Hrs.
0 a 50%
51 a 85%
86 a 100%
AV. EJÉRCITO NACIONAL MEXICANO AV. EJÉRCITO NACIONAL MEXICANO AV. EJÉRCITO NACIONAL MEXICANO
AV. HOMERO AV. HOMERO AV. HOMERO
AV. PRESIDENTE MASARYK AV. PRESIDENTE MASARYK AV. PRESIDENTE MASARYK
AV. HORACIO AV. HORACIO AV. HORACIO A
V. F
ERRO
CARR
IL D
E CU
ERN
AVAC
A
AV. M
OLI
ÉRE
AV. M
OLI
ÉR
NEWTON
NEWTON
BLVR. MANUEL ÁVILA
AV. PASEO DE LA REFORMA AV. PASEO DE LA REFORMA
CALZ. GRAL. M
ARIANO
ESCOB
EDO
CALZ. GRAL. M
ARIANO
ESCOB
EDO
RUBÉN DARÍO RUBÉN DARÍO
On-street occupancy in PolancoBefore Parking Meters8- 12 Hrs.
On-street occupancy in PolancoAfter Parking Meters8- 12 Hrs.
0 to 50%
0 to 50%
51 to 85%
51 to 85%
86 to 100%
86 to 100%

15
8 - 12 hrs. Before Parking Meters
12 - 16 hrs. Before Parking Meters
8 - 12 hrs. After Parking Meters
12 - 16 hrs. After Parking Meters
Ocupación de la vía pública en PolancoAntes de Parquímetros12-16 Hrs.
0 a 50%
51 a 85%
86 a 100%
AV. EJÉRCITO NACIONAL MEXICANO AV. EJÉRCITO NACIONAL MEXICANO AV. EJÉRCITO NACIONAL MEXICANO
AV. HOMERO AV. HOMERO AV. HOMERO
AV. PRESIDENTE MASARYK AV. PRESIDENTE MASARYK AV. PRESIDENTE MASARYK
AV. HORACIO AV. HORACIO AV. HORACIO A
V. F
ERRO
CARR
IL D
E CU
ERN
AVAC
A
AV. M
OLI
ÉRE
AV. M
OLI
ÉR
NEWTON
NEWTON
BLVR. MANUEL ÁVILA
AV. PASEO DE LA REFORMA AV. PASEO DE LA REFORMA
CALZ. GRAL. M
ARIANO
ESCOB
EDO
CALZ. GRAL. M
ARIANO
ESCOB
EDO
RUBÉN DARÍO RUBÉN DARÍO
On-street occupancy in PolancoBefore Parking Meters12 - 16 Hrs.
On-street occupancy in PolancoAfter Parking Meters12 - 16 Hrs.
0 to 50%
0 to 50%
51 to 85%
51 to 85%
86 to 100%
86 to 100%

16
*Data for 2012 corresponds to the daily average between May and October of the same year. Source: Developed by ITDP with data from ecoParq.
16 - 20 hrs. Before Parking Meters
16 - 20 hrs. After Parking Meters
Ocupación de la vía pública en PolancoAntes de Parquímetros16-20 Hrs.
0 a 50%
51 a 85%
86 a 100%
AV. EJÉRCITO NACIONAL MEXICANO AV. EJÉRCITO NACIONAL MEXICANO AV. EJÉRCITO NACIONAL MEXICANO
AV. HOMERO AV. HOMERO AV. HOMERO
AV. PRESIDENTE MASARYK AV. PRESIDENTE MASARYK AV. PRESIDENTE MASARYK
AV. HORACIO AV. HORACIO AV. HORACIO A
V. F
ERRO
CARR
IL D
E CU
ERN
AVAC
A
AV. M
OLI
ÉRE
AV. M
OLI
ÉR
NEWTON
NEWTON
BLVR. MANUEL ÁVILA
AV. PASEO DE LA REFORMA AV. PASEO DE LA REFORMA
CALZ. GRAL. M
ARIANO
ESCOB
EDO
CALZ. GRAL. M
ARIANO
ESCOB
EDO
RUBÉN DARÍO RUBÉN DARÍO
Ocupación de la vía pública en PolancoAntes de Parquímetros16-18 Hrs.
0 a 50%
51 a 85%
86 a 100%
AV. EJÉRCITO NACIONAL MEXICANO AV. EJÉRCITO NACIONAL MEXICANO AV. EJÉRCITO NACIONAL MEXICANO
AV. HOMERO AV. HOMERO AV. HOMERO
AV. PRESIDENTE MASARYK AV. PRESIDENTE MASARYK AV. PRESIDENTE MASARYK
AV. HORACIO AV. HORACIO AV. HORACIO A
V. F
ERRO
CARR
IL D
E CU
ERN
AVAC
A
AV. M
OLI
ÉRE
AV. M
OLI
ÉR
NEWTON
NEWTON
BLVR. MANUEL ÁVILA
AV. PASEO DE LA REFORMA AV. PASEO DE LA REFORMA
CALZ. GRAL. M
ARIANO
ESCOB
EDO
CALZ. GRAL. M
ARIANO
ESCOB
EDO
RUBÉN DARÍO RUBÉN DARÍO
On-street occupancy in PolancoBefore Parking Meters16 - 20 Hrs.
On-street occupancy in PolancoAfter Parking Meters16 - 20 Hrs.
0 to 50%
0 to 50%
51 to 85%
51 to 85%
86 to 100%
86 to 100%

17
4. Cruising Time: Less time spent finding a parking space
The implementation of parking meters in Polanco resulted in lower on-street parking occupancy as well as reduced cruising time. Before, a motorist required 13:26 minutes to find a parking space; the average cruising time is now estimated at 3:04 minutes.
This estimated reduction of 10:22 minutes per trip has resulted in benefits such as time savings, reduced emissions and cost savings:
BEFORE PARKING METERS
AFTERPARKING METERS
SAVINGS ECONOMICBENEFIT
Man-hours used in search of parking space
8.72 million annual hours
1.99 million of annual hours
6.73 million of annual hours
202 million 150 thousand pesos
per year
Distance trips in search of parking space
104.7 million of km
23.9 million of km
80.8 million of km
Gasoline spent in search of parking space
9.9 million of liters
2.2 million of liters
7.7 million of liters2
81 million 861 thousand pesos
per year
C02 generated spent in search of parking space
23 thousand tons per year
5 thousand tons per year
18 thousand tons per year3
7 million of per year
16 - 20 hrs. Before Parking Meters
16 - 20 hrs. After Parking Meters
ILLUSTRATION 4: REDUCTION OF CRUISING TIME
Source: Sañudo,2012.
2 Considering a yield of 10.5 km/lt.
3 Considering $30 dollars per ton of C02.
Cruising TimeBEFORE
Cruising TimeAFTER

18
Based only on the reduction of cruising time, the implementation of parking meters in Polanco brought social and environmental benefits in the amount of $287,771,432 per year. The estimated savings would be higher if car use reduction is taken into account as a result of parking fees. It is estimated that the reduction is between 10% and 30% of total trips (Litman, 2006). This said, an updated travel survey must be done to accurately compare with the baseline.
5. TurnoverBefore the implementation of parking meters, 57% of parked cars occupied spaces for an average of over six hours. Most of the cars belonged to workers in the area who use public parking for extended periods, precluding their use and benefit for other visitors. For this reason, on-street parking spaces showed below-average use of only 3.5 automobiles per day. Thanks to the implementation of parking meters in Polanco, the turnover rate notably increased, as each parking space is now used between 4.5 and 5.5 times per day. This implies that each space is now being used more efficiently.
6.Revenue collectedPursuant to information published by ecoParq (2012), 57 million 698 thousand pesos were collected and 17 million 309 thousand were transferred to the AEP during 2012 as funds for the renewal of the neighborhood’s public spaces. Considering the average collected in the 4° quarter, the Polanco parking meter system raised approximately $1,800,000 pesos each month or 21.6 million pesos per year.4
1st Quarter 2nd quarter 3rd quarter 4th quarter TOTAL
Revenue $6,232,571 $15,664,528 $17,822,520 $17,978,802 $57,698,421
Share for public space renewal
$1,869,771 $4,699,358 $5,346,756 $5,393,641 $17,309,526
4 The 4° quarter was considered for reasons of system stability which commenced in January, 2012.
TABLE 1: REVENUE COLLECTED BY THE ECOPARQ SYSTEM IN 2012 (pesos)
Source: ecoParq, 2012.

19
The following charts show both the revenue and funds for public space generated during 2012 as a result of meter operations in Polanco.
CHART 4: REVENUE GENERATED DURING 2012, BY NEIGHBORHOOD (millions of pesos)
CHARTS: FUNDS GENERATED DURING 2012, BY NEIGHBORHOOD (millions of pesos)
Source: ecoParq, 2012.
Source: ecoParq, 2012.

20
6.1. Public works projects
Currently, 30% of the funds raised by ecoParq are for the AEP, which is responsible for the recovery of public space in the neighborhood. The use of these funds is determined by the Committee on Transparency and Accountability comprised of neighborhood associations, the Miguel Hidalgo District and AEP.
Public works projects in Polanco have focused on the rehabilitation of sidewalks on Torcuato Tasso, Edgar Allan Poe and Horacio streets, as shown on the following map:
MAP 1: WORKS REALIZED IN POLANCO WITH FUNDS FROM ECOPARQ
Source: Developed with information from ecoParq
Torcuato Tasso - Euler a Campos ElíseosEdgar Allan Poe - Av. Presidente Maryk a Luis G. UrbinaHomero - Av. Molière a Oliver Goldsmith
AV. EJÉRCITO NACIONAL MEXICANO AV. EJÉRCITO NACIONAL MEXICANO AV. EJÉRCITO NACIONAL MEXICANO
AV. HOMERO AV. HOMERO AV. HOMERO
AV. PRESIDENTE MASARYK AV. PRESIDENTE MASARYK AV. PRESIDENTE MASARYK
AV. HORACIO AV. HORACIO AV. HORACIO A
V. F
ERRO
CARR
IL D
E CU
ERN
AVAC
A
AV. M
OLI
ÉRE
AV. M
OLI
ÉR
NEWTON
NEWTON
BLVR. MANUEL ÁVILA
AV. PASEO DE LA REFORMA AV. PASEO DE LA REFORMA
CALZ. GRAL. M
ARIANO
ESCOB
EDO
CALZ. GRAL. M
ARIANO
ESCOB
EDO
RUBÉN DARÍO RUBÉN DARÍO
Torcuato Tasso - Euler to Elíseos FieldsEdgar Allan Poe Av. President Mazaryk to Luis G. UrbinaHomero Av. Moliere to Oliver Goldsmith

21
In addition, a comprehensive urban revitalization project included the installation of lighting and planters plus the rehabilitation of sidewalks on Torcuato Tasso street in the area between Masaryk and Homero.
In total, 1.1 km of sidewalks were rehabilitated at a cost of 7.5 million pesos, or an average of 6,695 pesos per meter.
IMAGE 1: TORCUATO TASSO STREET BEFORE REHABILITATION
IMAGE 2: TORCUATO TASSO STREET AFTER REHABILITATION
Source: Google Street View.
Source: Paul Buendía.

22
IMAGE 3: EDGAR ALLAN POE STREET AFTER REHABILITATION
IMAGE 4: HOMERO STREET AFTER REHABILITATION
Source: Paul Buendía.
Source: Paul Buendía.

23
7. Ticketing.Tickets for violating the new regulation (Article 13 of the Metropolitan Transit Regulations) have consistently increased for each month of operations. In December 2012, 5,664 cars were immobilized and 208 cars impounded.
Since the implementation of parking meters, law enforcement capacity by SSP elements has increased significantly - which is in itself a success. These figures, however, do not include fines for the immobilization of cars illegally parked on sidewalks, crosswalks or double-parked pursuant to the terms of Article 12 of the Metropolitan Transit Regulations. In order to improve and augment public space in Polanco, it is necessary to impose tickets for this type of conduct, which often affects vulnerable users: people with some form of disability and pedestrians.
CHART 6: CARS IMMOBILIZED AND IMPOUNDED IN 2012
Source: ecoParq, 2012.
Immobilizations
Impounded cars
Janu
ary
Febr
uary
Mar
ch
Apr
il
May
June July
Aug
ust
Sept
embe
r
Oct
ober
Nov
embe
r
Dec
embe
r

24
8. Improvement Recommendations.The success of parking meter implementation in Polanco has been significant. However,
areas could be improved that would make operations notably more efficient, improve service and, as a result, increase and extend benefits:
1. Hours and days of operation should respond to local area demand. Especially between Thursday and Sunday, the regulation of public space should be
extended to evening hours.
2. A zero-tolerance policy should be adopted to punish any type of illegal parking. It is important to increase and enhance the role of the Public Safety Department to improve enforcement of the Metropolitan Transit Regulations, especially with respect to Article 12. It is still common to see cars obstructing sidewalks, walkways and driveways. A parking meter system requires - especially at the beginning - the presence of a minimum number of transit officers with adequate technology and equipment in order to impose tickets and prevent infringements. Tow trucks should also be operating continuously to safeguard pedestrian areas. The use of wheel clamps to enforce parking fines is necessary to significantly reduce this common practice.
3. Adjust rates to meet local demand. Article 259 of the Tax Code, which establishes a fixed rate of 2 pesos per 15 minutes, should be amended to establish a range in which this rate is allowed to fluctuate based on the specific demand of each parking area. With greater demand, the rate will increase, and vice versa. Similarly, it is important to add rules to the On-Street Parking Control Regulations of Mexico City that serve as guidelines regarding how demand will be reviewed in order to periodically modify the rate for different areas and times as needed. The rate should be modified so that there is always a certain number of available on-street spaces (between 15% to 40% is recommended) per block at all times. A demand-based rate will serve to facilitate and strengthen both transparency and communication for citizens.
4. Establish user-information systems. The use of applications to inform users about the availability of parking spaces per block as well as public area parking should be encouraged in order to guide and influence decisions made about transportation modes. If there is no parking available, many visitors will decide to make alternative plans, and/ or choose to use public transport or bicycle.

25
5. Improve revenue re-investment. It is necessary to implement mechanisms for public-private investment to enable expeditious improvements in public space, and which are paid with potential funds from the meter system. In this way, it wouldn’t be necessary to gather “small” amounts each month (“small” relative to public works) in order to make small improvements. It would thus be possible to realize real executive-scale projects and maintain rigorous works schedules a priori for the purpose of reforming many areas in less time than is possible today. Mechanisms for coordination and efficient decision making should also be implemented based on collaboration between the AEP, the District and neighbors, so that project benefits may be maximized.
6. Augment payment options. Allow payment to be made using both credit and prepaid cards; as well as pay-by-phone and mobile applications. As a priority, the meters must be adapted to accept payment using the City Card, similar to the systems used by both the Metro and Metrobus.
7. Measure and evaluate systematically. Studies and reports should be developed to facilitate a continuous analysis of program results. These reports should be made available to the general public. Constant evaluation of the system should also consider the redesign and reformulation of rates, permits and maximum stay duration, which should always have a solid technical foundation.

26
9. BibliographyDMH. (2011). Estudio de Potencial de Movilidad en Polanco, ubicado dentro del perímetro delegacional.
México: Delegación Miguel Hidalgo.
ecoParq. (2012). Análisis de recursos generados durante 2012. Consultado el 11 de marzo de 2013, en http://www.ecoparq.com.mx/descargas/analisisPolanco.pdf
EPA y NHTSA. (2012). 2017 and Later Model Year Light-Duty Vehicle Greenhouse Gas Emissions Standards and Corporate Average Fuel Economy Standards. Final Rule. Federal Register 77 (199): 62623–3200.
INEGI. (2010). Censo Nacional de Población y Vivienda 2010. México: INEGI.
Litman, Todd. (2006). Parking Management. Chicago: American Planning Association
Sañudo, Andrés. (2012). Implementación de parquímetros en Polanco. Estudio de Línea Base. México: Instituto de Políticas para el Transporte y el Desarrollo.
Sheinbaum-Pardo, Claudia y Carlos Chávez Baeza. (2011). Fuel economy of new passenger cars in Mexico: Trend from 1988 to 2008 and prospects. Energy Policy 39 (12): 8153-62.
Stern N. (2007). Stern Review: The economics of climate change. Cambridge: Cambridge University Press.

27
Annex: Methodology for estimating benefits.Occupancy
Occupancy plans prior to the implementation of parking meters were based on the Mobility Potential in Polanco Study, conducted by Miguel Hidalgo District (2011).
The occupancy data compiled after implementation of the parking meters were based on the same sample blocks and used ecoParq information about meters that most influence parking management of those blocks.
Operation hours were divided in 15 minute intervals between 8 to 20 hours. That is, the schedule was divided into 48 equal parts. For example, the first interval starts at 08:00:00 and ends at 8:14:59 and the fourth interval starts at 8:45:00 and stops at 8:59:59. For each influential meter (p), the following operation was realized at intervals (i)
BVpiLGp
Where:
BVpi = number of tickets with effective time in interval i, issued by parking meter p.LGp = Number of parking spaces controlled by parking meter p.
The above ratio provides the estimated occupancy for interval i. This process was repeated using data from 3 months of business days and then averaged. These averages were then grouped in 3 intervals of 4 hours and averaged to obtain the average daily occupancy and the average occupancy for the following times of day:
1. Morning: from 8 to 12 hours.2. Midday: from 12 to 16 hours.3. Afternoon: from 16 to 20 hours.
Cruising Time and Benefits
The analysis of cruising times was done based on the Polanco Parking Meter Implementation Baseline Study (Sañudo, 2012). The points used to evaluate cruising for the baseline study were mapped in order to determine the average occupancy of the parking meters on those areas.

28
Based on the occupancy of the areas a conservative cruising time was assigned.
AVERAGE ASSIGNED CRUISING TIMELess than 50% 1minute
Between 50 and 80% 3 minutes
Greater than 80% 6 minutes
All cruising times after the implementation of parking meters were averaged, resulting in an estimate of the time a typical motorist now spends searching for on-street parking in Polanco. This led to an estimate of the time saved by visiting motorists as a result of the new policy.
The time savings also led to other benefits, as there was not only a savings of man-hours but also decreased car use, which resulted in decreased emissions and fuel consumption.
The estimate of benefits based on man-hours, vehicle-kilometers, trips, gasoline and CO2 was realized as follows:
• Man-hours.Considering (a) the number of on-street parking spaces; (b) the average number of times each of these spaces is used; and (c) the fact that a certain number of trips do not involve any cruising time (e.g., the first to arrive), we made a conservative estimate of 15,000 car trips that involved cruising for on-street parking. This factor is multiplied by the savings in cruising time to produce an estimated number of man-hours saved per day. Expressed in yearly terms, it is then multiplied by a factor of 260, derived from the number of days the system runs through the year (business days excluding public holidays). The result is an estimate of man-hours saved per year thanks to additional parking space availability as a result of meter implementation. The price assigned to each man-hour is 30 pesos. This amount corresponds to the average hourly wage of a worker in the ZMVM, based on the National Survey of Household Income and Expenditure of the INEGI6.
• VKT.In order to estimate vehicle-kilometers traveled as a result of the reduction in cruising time, an average speed of 12 km / h was used, based on the estimated speed at which a typical motorist “cruises” in search of on-street parking. The savings in man-hours is then multiplied by this factor to obtain an equivalence in VKT
5 A conservative estimate is assigned to cruising time, based on the premise that if the final destination of a given
trip is one block away in a place where at least half the estimated on-street parking spaces are available, the driver
will normally not need more than a minute to find a spot. Similarly, when between 49.9% to 20% of spaces are
available, the probability of finding a space continues to be high, for which reason a typical motorist should not
need more than 3 minutes. When the average occupancy of the area exceeds 50%, it is likely that drivers will spend
additional time cruising for a space. The neighborhood’s features, however, normally make it possible for this to
occur within a maximum radius of 2 blocks. For this reason, finding a space rarely requires more than 6 minutes.
su auto.
6 This estimate may be conservative, as it fails to take into account other opportunity costs in relation to time use
(e.g., leisure time) which may be deemed to have more value than a typical work hour.

29
• Gasoline.Considering an average yield of 10.5 kilometers per liter based on vehicle availability and frequency (Sheimbaum, et al., 2011), the savings in VKT was divided by this factor to obtain the savings in gasoline liters. Once the number of liters has been estimated, this figure is multiplied by the price per liter of gasoline in effect at the time to obtain the total sum of gasoline savings in monetary terms.
• Emissions. The emissions estimate follows the same methodology used in Sañudo (2012), which assumes that every consumed liter of gasoline generates 2.347697 kilograms of C02 per liter (EPA and NHTSA, 2012). Thus, the number of kilograms of C02 generated within the Polanco neighborhood by private cars is estimated to be:
kgCO2 = KVR inside Polanco * (kgCO2/Liter) /(km/Liter)
The price per ton of C02 was considered to be $30 dollars (Stern, 2007) and the FIX exchange rate used was on December 31, 2012 – 12.9658 pesos per dollar.

30
Tel. +52 (55) 3626 2963 / 64www.itdp.mx
Av. México #69, Col. Hipódromo CondesaCuauhtémoc, Mexico City, D.F., 06170
British EmbassyTel. +52 (55) 1670 3200www.ukinmexico.fco.gov.uk