Embed Size (px)
Citation preview

Georgia Southern UniversityDigital Commons@Georgia Southern
University Honors Program Theses
2016
Impacts of Prisons in Rural Communities:Economic and Social FactorsAshleigh T. RasheedGeorgia Southern University
Follow this and additional works at: https://digitalcommons.georgiasouthern.edu/honors-theses
Part of the American Politics Commons
This thesis (open access) is brought to you for free and open access by Digital Commons@Georgia Southern. It has been accepted for inclusion inUniversity Honors Program Theses by an authorized administrator of Digital Commons@Georgia Southern. For more information, please [email protected].
Recommended CitationRasheed, Ashleigh T., "Impacts of Prisons in Rural Communities: Economic and Social Factors" (2016). University Honors ProgramTheses. 168.https://digitalcommons.georgiasouthern.edu/honors-theses/168

Impacts of Prisons in Rural Communities:
Economic and Social Factors
An Honors Thesis submitted in partial fulfillment of the requirements for Honors in
Political Science.
By
Ashleigh Rasheed
Under the mentorship of Dr. Joshua Kennedy
ABSTRACT
Rural communities in the United States have been declining economically for the past
four decades. Some local government officials have seen prisons as a golden opportunity
to revitalize their economies. Why and how do local officials decide to invest in prisons?
What process do local officials go through to decide to invest in prisons? What are the
economic impacts associated with a prison siting? What effects do stigmas associated
with prisons have on the residents living in the community? I argue that prisons provide
a short term economic gain for rural communities by providing jobs for the residents,
thus boosting the economy. I also argue that over time the economy will reach a plateau
and start to decline as result of the stigmas associated with the prison siting. I will test
this argument using quantitative analysis of national prison data and I will also test this
argument using qualitative analysis of an original single case study of Millen, Georgia.
Thesis Mentor:___________________________
Dr. Joshua Kennedy
Honors Director:__________________________
Dr. Steven Engel
April 2016
Political Science
University Honors Program
Georgia Southern University

1
Acknowledgments
I would first like to thank my professors and other faculty administrators who were
supportive of me throughout the entire writing process of my thesis. Specifically, I would
like to thank Dr. Cathy Skidmore-Hess, my academic advisor, Mrs. Erin Marin, Dr.
Jamie Scalera, and Dr. Joshua Kennedy for their encouragement, patience, generosity of
time, and mentorship throughout the completion of my project. I would like to thank my
academic advisor and Dr. Skidmore-Hess for encouraging me to apply to the University
Honors Program. Without their encouragement and recommendation, I would not have
applied to the University Honors Program, and for that I thank them. I would also like to
thank Mrs. Marin who met with me several times to go over requirements needed to
successfully complete the program. I was hesitant at first when I found out that I had to
write a research paper, but Mrs. Martin assured me that with careful planning and
execution, I would complete the project. When it came time to start the actual paper, I
was still unsure of what I wanted to write about. Dr. Scalera was one of the main people
who provided me with the structure and confidence needed to complete this project.
Without her expertise, love, kindness, and endless support and encouragement, I would
not have been able to successfully complete my project. Dr. Scalera gave me the
mentorship and support that needed to overcome that challenges that I faced to complete
my thesis, and for that I will always be thankful and grateful of her. I would finally like to
thank Dr. Kennedy, my mentor for his role in helping me to complete my project. Like Dr.
Scalera, Dr. Kennedy devoted his time and energy to read over countless drafts, aided me
in getting IRB approval, and assisted me whenever I needed help. When it came down to
the final days leading up to the due date of my thesis, Dr. Kennedy allowed me to use his
office to finish my statistical analysis of my data. Without his generosity, I would not have
been able to finish my project on time and for that I thank him. All of the people
mentioned above played a major role in the successful completion of my thesis. I am
forever grateful, and I look forward to them reading and enjoying my work.

2
Introduction
In the past few decades, the United States of America (USA) has experienced a
significant increase in the construction of prisons in rural communities. An example of
this phenomenon can be seen in Jenkins County, a rural community south of Augusta,
Georgia. In 2012, the county decided to construct a private prison in the community
(Brown, 2010). After the collapse of the housing marking in 2008, the recession took a
toll on the county’s job sector. The recession resulted in the loss of nearly all of the
county’s industry, leaving many of the residents jobless. The struggling county needed
another source to stimulate the county’s withering economy.
When Corrections Corporation of America chose Jenkins County as the site to
build a private prison, officials jumped at the opportunity in hopes that the prison would
spark a growth in economic development in the community. King Rocker, mayor of
Millen, stated “the civil war prison will bring a lot of people to town and the new state
prison will be a good backbone, a good job provider and good tax payer” (Brown, 2010).
The tenacity and optimism of the officials seemed to serve them right. Prior to the
construction of the prison, the county was plagued with a high unemployment rate that
reached a high of nearly 20% (Hackle, 2014). Many of the residents in the community
were struggling to find work and were uncertain about the future of their economic state.
The construction of the prison not only created over two hundred jobs, but it also
boosted the county’s economy by reviving jobs in the local area and dropping the
unemployment rate to 14% (Hackle, 2014).
This case suggests that the construction of the private prison was actually
beneficial to the community by serving as the major source of revenue for the county. It

3
provided more jobs for the residents who were out of work, which resulted in the decline
in the unemployment rate and a boost in the county’s economy. Aside from the economic
benefits, however, the article failed to mention the public’s concerns over having a prison
in their community. Maybe in this case it may not seem as important to some because of
the benefits that are associated with having the prison in the community. Be that as it
may, it is still important to note the negative stigmas that arise in having a prison in one’s
community as well as considering that having a prison in one’s community doesn’t
necessarily guarantee economic prosperity.
Why did the local officials decide to allow the prison to be constructed in their
community? Scholars such as Rick Hatcher (1994) have argued that the construction of
prisons can positively impact the rural communities by providing jobs to residents which
in turn stimulates economic growth. Conversely, there have been scholars such as Amy
Glasmeier (2007) who have argued that the construction of prisons in rural communities
does not lead to economic prosperity for the community. If this argument holds, what do
local governments do if the prisons are not economically beneficial? I will investigate
this inquiry by examining whether or not prisons in rural communities promote economic
growth. I argue that prisons provide a short term economic gain for rural communities by
providing jobs for the residents, thus boosting the economy. I also argue that over time
the economy will reach a plateau and start to decline as result of the stigmas associated
with the prison siting.
It is important that we investigate this topic to understand why local governments
allow for prisons to be constructed in their communities as well as to inspect the
economic impacts prisons have on the rural communities. In addition, we can also

4
examine the positive and negative stigmas associated with having a prison in the
community and the effects those stigmas or the prison have on the citizens. This subject
will spark a general interest from the public as well as from scholars, because the
construction of prisons in communities directly impacts and influences the people living
in those communities. This subject will bring awareness to the citizens and local
government officials, because the decisions made by the local government to allow for
prisons to be built in their communities may positively and/or negatively affect the lives
of the citizens living in the community.
This subject will be of interest to scholars because they can attempt to explain or
interpret the economic impacts of prisons and how those impact the public in either a
positive or negative way. From their analysis, we can then evaluate whether or not the
construction of prisons will be economically beneficial or detrimental to the community.
Their findings will also be crucial for local government officials, because they would be
able to decide whether or not the construction of prisons will be economically beneficial
for their community.
Literature Review
Local Government Decisions
When searching for alternative economic stimuli to enhance the towns’ economy,
local government officials in rural areas have to make sound and well thought out
decisions to determine what market of investment would be most beneficial for the
community. With only a finite number of options to choose from, some local government
officials make the decision to invest in prisons because they see it as a way to boost the

5
town’s economy by providing jobs for local residents and other amenities. King (2013)
and Blankenship (2004) examine this topic in their articles and propose theories to
explain local prison development.
King (2013) investigates why local government officials in rural communities
make the decision to invest in prisons and the impacts the prison siting has on the
community. King (2013) proposes that the decline in the agricultural and manufacturing
sector in the late 20th century had left the rural regions in America struggling to maintain
financial integrity. The exponential growth in the prison population in the 1980’s created
the demand for prison expansion. This growing market attracted many investors
including local government officials from rural communities, who saw the prisons as a
potential tool that could revitalize their town’s economy. King (2013) argues that despite
the popularity of prison hosting, there is little empirical evidence to test the claim that
investing in and using them as a tool will enhance economic recovery. King (2013)
investigates this by examining 25 years of economic data from counties in New York. In
his results, King (2013) finds that there is no empirical evidence to support that prisons
are valuable economic tools. While the prison siting may provide some jobs, King
(2013) argues that using job growth as means to measure prison as a tool for economic
growth is inadequate. King (2013) showed that a prison was not an efficient tool in
measuring job growth because most of the people who were getting employed by the
prison were not local residents, but people outside of the community. Due to this finding,
King (2013) concludes that using a prison as a tool to measure job growth does not
adequately represent the people living in the community.

6
Blankenship (2004) examines the effectiveness of local public officials in rural
communities’ use of prison recruitment as a strategic policy tool for economic
development. Blankenship (2004) includes how local government officials in rural
communities where influenced by the popular belief that prison could enhance the town’s
economic development. In his analysis, Blankenship (2004) finds that there is not
enough empirical evidence to support that the use of prison recruitment as a strategic
policy tool furthers economic development in rural communities. Blankenship (2004)
also notes that the prison policies local officials invest in are not sufficient enough to
enhance the economic state of the community. Instead Blankenship (2004) argues that
until rural communities gain policy tools and native resources to strengthen their
economies while preserving their character, those communities will not see true
economic development.
One of the major critiques of the studies above is that both fail to explain the
process as to how and why local governments make the decision to build a prison in their
communities. I plan to examine this by investigating the process local government
officials go through to make the decision to invest in a prison and the policies that they
adopt to finalize the process.
Economics of Prisons
As mentioned earlier, there have been academics who have argued for and against
the construction of prisons in rural communities, and whether the impacts of those
prisons are positive or negative. They have written journal articles supporting or refuting
the argument that prisons bring economic benefits, providing empirical evidence to back

7
up their claims. While conducting my own research on the topic, I found articles by
authors who supported the argument and those who did not.
In the article “The Economic Impacts of the Prison Development Boom on
Persistently Poor Rural Places,” the author Amy Glasmeier (2007) finds that there is little
evidence to support that prison impacts are significant enough to foster economic growth.
In the article, Glasmeier (2007) briefly discusses the heightened growth in the
construction of prisons during the 1980s and 1990s and how many rural communities
welcomed and embraced the construction of prisons in their communities in hopes of it
providing jobs for the residents in the area. Glasmeier (2007) points out that that up until
that period, there was no empirical evidence that existed to examine the economic
impacts of prison construction in rural counties. The author employed a
quasiexperimental control group method to examine the effect of state-run prisons
constructed in rural counties between 1985 and 1995 on county earnings by employment
sector, population, poverty rate, and degree of economic health. From her results, she was
able to conclude that the construction of prisons in rural areas had a limited economic
effect on rural places in general (Glasmeier, 2007). However, prisons may have a positive
impact on poverty rates in persistently poor rural counties, as measured by diminishing
transfer payments and increasing state and local government earnings in places with
relatively good economic health (Glasmeier, 2007). In other words, prisons may have a
positive impact on poverty rates by providing jobs for the local residents, which will not
only help reduce the poverty rate but may also help boost the local economy due to the
increase in income of the residents. In summary, Glasmeier (2007) found that there was
little evidence to support that prison impacts were significant enough to foster structural

8
economic change, but there were some prisons that provided jobs for a portion of local
residents.
Glasmeier (2007) was not the only academic who did not find any empirical
evidence to support the argument that the construction of prisons in rural communities
promotes economic development. Gregory Hooks (2010) as well as Bert Useen (2014)
reached similar conclusions. In his article “Revisiting the Impact of Prison Building on
Job Growth: Education, Incarceration, and County-Level Employment,” Gregory Hooks
(2010) raises the question as to whether or not the construction of prisons offers
economic benefits to the local community. Hooks (2010) tests the claim by analyzing
data on all existing and new prisons in the United States since 1960 to examine the
impact that these prison systems have on the local communities and the employment
growth from 1976 to 2004 (Hooks, 2010). From the results, Hooks (2010) finds that the
enhanced human capital is what contributed to the economic benefits to the local
communities, not the prisons. Hooks (2010) was able to gather enough evidence to show
that the construction of prisons actually impedes economic growth in rural areas because
prisons do not offer economic benefits to the local community.
In his article “Prison Siting and Economic Development,” Bert Useem (2014)
discussed the effect prisons have on rural communities in respect to economic
development. The author mentions how rural communities compete for prison
development in their communities because of the potential economic gain that can result
from having a prison in their community. Useen (2014) then brings up an argument that
the building of new prisons in a rural community will foster economic development in
that community (Useem, 2014). To test the validity of this claim, Useen (2014) examines

9
economic data on seven economically distressed rural counties that had at least one
facility opened within their boundaries since 1982. From the data, Useen (2014) was able
to compare and contrast the economic conditions of the rural community before and after
a prison facility opened. The hypothesis that a county’s fortunes improve after the
opening of a prison in the community was not supported by the data. Prison siting had no
statistically significant impact on either dependent variables unemployment or per capita
income (Useem, 2014). Useen (2014) incorporated the reactions of other authors who
offered their own opinions as to how to go about conducting the study to get sharper
results.
In contrast to this research, Rick Hatcher (1994) argues that the construction of
prisons in rural communities promotes economic development. In his article “Some
Impacts of a Prison on a Community,” Rick Hatcher (1994) examines the impact of
prisons located in Texas. Hatcher (1994) examines the economic impact of prisons in
Texas by referencing two case studies to show how the presence of prisons in Huntsville
and Venus resulted in economic growth in those communities. Hatcher (1994) highlights
the importance of the construction of prisons and the impact the prisons have on the
communities, mainly in the form of an increase of jobs. Hatcher (1994) also mentions
how employment and payroll was also impacted by the prisons. In the article Hatcher
(1994) states “that no matter what the economic conditions may be, a certain number of
persons will be required to remain employed at prison facilities” (page 64). Hatcher
(1994) goes on to discuss the impact that the prisons had on local businesses. According
to Hatcher (1994), the prisons were very beneficial to the local businesses because they
promoted job growth in multiple sectors that resulted in economic development. The

10
prisons were also beneficial to the local businesses because they provided more
consumers for the open market to buy more goods and services from the local businesses.
Hatcher (1994) concludes the article by emphasizing how prisons have become a
common tool used to further economic development in Texas communities. He closes by
highlighting that as long as problems in society exist, the community can profit
significantly in terms of economics, by building of prisons in their comminutes (Hatcher,
1994).
One of the major critiques of the studies above is that they fail to make the
distinction between the long term and short term effects of prison economics in the
community. I plan to examine this question by investigating the long term and short term
economic benefits prisons have on the community.
Stigmas
In addition to examining the economic impacts of a prison in a rural community
and investigating why government officials make the decision to permit a prison to be
built in their communities, scholars such as Dina Rose, Todd R. Clear, and Judith A.
Ryder (2001) examine the positive and negative effects associated with having a prison in
the community and the impact they have on the citizens. In the article, "Addressing The
Unintended Consequences Of Incarceration Through Community-Oriented Services at
the Neighborhood Level," they investigate the consequences of incarceration and the
affects it has on the community.
Rose (2001) conducts a survey where she asks residents in two- high incarcerated
residents to discuss the positive and negative ways incarceration effects them and their

11
families. Rose (2001) categorizes the comments in four categories: stigma, financial
impacts, issues regarding identity, and maintaining interpersonal relationships. The
results from the study show that the effects of incarceration on communities are complex,
in that they yield both positive and negative effects amongst the community. Some of the
bad stigmas included loss of the community’s reputation as a good place to live and to do
business, and families can sometimes feel public shame as a result of the incarceration of
one of their own family members (Rose, 2001). One positive effect of incarceration is the
removal of problematic members from the community (Rose, 2001).
Cheryl Swanson (1997) also examines the impacts a prison has on a community
by analyzing the attitudes of the residents living in a rural community with a prison
siting. In her article entitled Have Attitudes Changed? Citizens' Views of Prison Effects
on Their Community over Time, Swanson (1997) investigates this phenomenon by
conducting a four-year case study of residents living in Century, Florida. Swanson (1997)
examines the attitudes of residents living in a rural community with a prison siting.
Swanson (1997) investigates this phenomenon by conducting a four-year case study of
residents living in Century, Florida, a small rural community, where she assesses the
residents’ perceptions of the social and economic effects of the prison siting in the
community. The results from the study revealed that the citizens’ attitudes showed both
stability and change with respect to the community and the prison’s effect on it
(Swanson, 1997). For example, there were major differences in the results of the two
surveys conducted in 1991 and 1995, in regards to the perception of the type of economic
development that the prison would generate. Prior to the opening of the prison, most of
the respondents from the 1991 survey had an expectation that the prison would provide

12
new jobs and that the prison would have a multiplier effect, that would stimulate
economic growth beyond prison jobs (Swanson, 1997). In the 1995 survey that was
conducted by Swanson, the respondents were less likely to endorse multiplier effects, but
focused almost exclusively on prison related employment (Swanson, 1997). Most of the
community responded positive on the outlook of the community and the lifestyle
(Swanson, 1997). Proponents of the prison siting were able to identify economic benefits
such as the creation of new jobs that were associated with the prison, while opponents
continued to express deep concern for community lifestyle issues, particularly safety
(Swanson, 1997). With respect to change, the results showed that support for the prison
had increased over time (Swanson, 1997). Much of the increased support, Swanson
(1997) asserts, was attributed to the reduced fear of prison escapes. The results from the
study also showed that from the residents’ standpoint, the prison had not created
prosperity, but that the prison had not hurt the community either (Swanson, 1997).
One major critique of the studies above is that Rose (2001) only lists stigmas
associated with the consequences of incarceration while Swanson (1997) only examines
the residents’ attitudes on the effects of the prison siting in their community over time.
Swanson’s study offers greater insight on the perspectives of the residents’ view of the
prison’s effects on the community. However, the study fails to examine how the
residents’ attitude towards the prison impact the local government in terms of how much
influence the citizens’ attitudes have on government officials’ decision to invest in
prisons. I plan to build on this study by expanding the knowledge on this phenomenon by
investigating how a community is impacted by the stigmas associated with the prison. In
doing so, I will determine whether the stigmas associated with the prison are influential

13
enough to impact the local government’s decision to invest in a prison, as well as
determine whether the stigmas impact the local economy, in terms of job growth and
availability. I will also determine whether there is a tradeoff between furthering economic
growth and pubic security.
To conclude, I fill in the gap of current literature by bringing together these
literatures to examine why local governments in rural communities make the decision to
invest in the prison industrial complex and the economic impacts this decision has on the
community. I investigated the process local government officials go through to answer
why and how government officials in rural communities make the decision to invest in
prisons. I examined the policies they adopted to examine the short and long term
economic impacts of the prison siting. I explored the socioeconomic impact the prison
had on the residents living in the community to determine whether the prison siting
resulted in a tradeoff between furthering economic growth or pubic security and safety.
Theory
Rural communities have typically relied on the manufacturing sector, as shown in
Table 1, as a basis for their economic prosperity. In the past, the manufacturing sector
provided jobs for hundreds of thousands of Americans, which assured their economic
security. As time passed, companies began looking for new ways to capitalize off of their
investments to increase and maximize their profits. In doing so, many companies in the
United States opted to move their companies abroad to less developed countries, where
the labor was cheap and the raw materials more accessible and affordable. As a
consequence, many of those same communities who depended on those manufacturing

14
jobs for a source of income and economic stability, lost those jobs to globalization which
left a huge dent in the economic infrastructure of some of those communities.
Table1: “Employment by Rural-Urban Classification.” The White House. Web. 6
Oct. 2014
*See Table in appendix A.
Local governments only have a finite number of options to choose from when
considering possible ways to enhance their economy and to ensure that their residents
have access to jobs. Some of those alternative options include raising taxes, cutting
public healthcare services, investing in small businesses, and/or investing in the
manufacturing sectors or sporting industry. The first two alternatives mentioned above
would help enhance the economy but would likely be highly unfavorable amongst the
public. Raising taxes would not be popular amongst the public because many would see it
more as a deduction from their income rather than as an addition to public revenue. A
majority of the public would not support cutting public healthcare services because they
would lose programs such as Social Security and Medicare, which are essential to many
citizens.
15
The other three alternatives may also contribute to enhancing the economy of the
local government, but investing in small businesses is unpredictable because they might
not be competitive enough to compete with other, more established businesses. The
manufacturing sector would help boost the economy tremendously but due to the
outsourcing of manufacturing jobs, the market for this line of work in America has
sharply declined. Investing in the sporting industry would also boost the economy of the
local government, but it takes a long time and a lot of money to launch big projects such
as those.
Due to the lack of manufacturing jobs, rural communities must rely on other
external stimuli, such as retail corporations like Walmart or colleges to fuel their
economies. One possible external stimulus that could revitalize the economy of those
rural communities is a prison. It has been argued by some such as Hatcher (1994) that the
construction of a prison in rural communities fosters economic developments in terms of
job growth. Rural communities make good candidates for a prison locations because of
the massive land availability in the area, as well as the need for residents in the area to
obtain jobs.
I argue that local governments in rural communities that make the decision to
invest in a prison will foster economic growth in those communities in terms of increased
job availability for their residents. The decision by local government officials construct a
prison in their community will enhance the local economy by providing jobs for the
residents that were not there before. The influx of jobs will give the residents more
spending power to buy more goods and services, which in turn will help rebuild and
revitalize the local economy.

16
As mentioned earlier, there are stigmas that are associated with having a prison in
a community. Many of those stigmas arise from the concerns of the public in regards to
their safety and wellbeing. While many of the residents may see the prison as a major
economic source for boosting the town’s economy, others may see it as a threat to their
livelihood and security. Housing convicted murderers and rapists in the same community
that you live in may not sit well with you or some of the other residents living in the area.
This uneasiness could possibly lead to resistance from those uncomfortable with the idea
of housing criminals in their community, which in turn in the future could result in a
decline in economic productivity. If local government officials approve of a prison siting
in their community, it could hurt the long term growth because of public resistance. With
that in mind, local government officials have to take into consideration the concerns of
the public when deciding whether or not to allow for the construction of a prison in their
community. It is an important decision for government officials to make as they must
carefully evaluate the tradeoff between furthering economic growth and the security of
the public.
I have four predictions. First, I predict that if local government officials in rural
communities are struggling economically then some will make the decision to invest in
prisons to boost their economies. Second, I predict that if local government officials
allow for the construction of prisons in their rural communities, greater economic
development will transpire in those communities in terms of job growth (short term).
Third, I predict that if local government officials allow for the construction of prisons in
their rural communities, the greater the negative stigmas will be associated with the
construction of the prison from the community (long term). Finally, I predict that

17
investing in a prison from the public’s perspective, will result in the tradeoff of furthering
economic development over public security.
Hypotheses:
H1: In rural communities that are struggling economically, some local government
officials will make the decision to invest in prisons to boost their economies.
H2: Investing in a prison will lead to greater economic development in the
community in terms of job growth (short term).
H3: The construction of a prison in rural communities will result in greater
stigmas associated with the prison from residents living in the community (long term).
H4: Investing in a prison from the public’s perspective, will result in the tradeoff
of furthering economic development over public security.
Research Design
I used a mixed method approach to test my hypotheses. First, I used quantitative
analysis to measure job growth over time. The data that I collected was drawn from a
national prison database of randomly selected prisons throughout the country. Then, I
used qualitative analysis to investigate the impact the prison has had on the residents
living in the community, to determine whether the stigmas associated with the prison are
influential enough to impact the local government’s decision to invest in a prison, as well
as to determine whether the stigmas impact the local economy, in terms of job growth
and availability. I also used qualitative analysis to determine whether there is a tradeoff
between furthering economic growth and pubic security.

18
The sample for my quantitative data was drawn from randomly selected prisons
located in rural and urban communities in the United States. The data from my sample
was also collected from the U.S. Bureau of Labor Statistics, United States GDP Growth
Rate, U.S. Bureau of Economic Analysis and Prison Siting and Economic Development. I
used this data from my quantitative analysis to examine job growth before and after each
prison was constructed in the rural communities to compare those findings to the results
of my qualitative analysis. The unit of analysis for my quantitative data was the urban
and rural communities that I selected randomly throughout the country.
For my quantitative analysis, I used data that I gathered from randomly selected
prisons located in rural and urban communities in the United States and from the U.S.
Bureau of Labor Statistics, United States GDP Growth Rate, U.S. Bureau of Economic
Analysis and Prison Siting and Economic Development, to examine in more detail, the
economic impacts associated with a prison siting. My primary independent variable was
the prison siting. The source of my data was collected from a national prison database
and the prison located in Millen, Georgia. I measured the prison siting by its location and
the date that it opened. My dependent variables were job growth, unemployment rate, and
GDP of various localities. I measured my dependent variables by analyzing the job
growth, unemployment rate, and GDP before each prison was built in the community and
after the prison was constructed. Job growth was measured as the percentage of jobs
available in the community. The unemployment rate was measured as the number of
unemployed individuals in the community divided by all individuals currently in the
labor force. The GDP was used to measure the economic development of the county and
other communities.

19
I used qualitative analysis to conduct a case study to examine the process that
local government officials go through to answer how and why local governments in rural
communities invest in a prison. For the case study, I studied Millen, Georgia, a small
town north east of Savannah, Georgia, that just a few years ago built and opened a private
male correctional facility in the community. Once I received approval from the
institutional review board (IRB) at Georgia Southern University, I conducted my
qualitative analysis. I used observations, interviews, and surveys as instruments to collect
my qualitative information. *See interview instrument in appendix B. *See survey
instrument in appendix C. I attended a local government council meeting in Millen,
Georgia to observe how meetings were conducted. I attended an additional city council
meeting to interview one of the five city council members. Before I conducted the
interview I handed the city council member a consent form to read over and once the
council member agreed to the terms of the interview and signed the form, I proceeded to
ask the council member a series of questions. After the interview, I typed up the
responses and stored them on a word document on my personal laptop. *See consent
form in appendix D.
I returned to Millen, Georgia to give surveys to the public to examine their
attitudes towards the prison in their community. I disseminated the surveys to the
residents of Millen, Georgia though random sampling. I did so by setting up a post at a
local Rite Aid Pharmacy in the community and randomly selected each person by
selecting every third individual that walked. I then proceeded by handing them a hard
copy of the informed consent. Once the person agreed to the terms of the study, I handed
them a hard copy of the survey for them to fill out. I brought a table and I also provided

20
the writing utensils for the participants. Each participant completed the survey at the site
where the surveys were distributed. After I collected the surveys, I transferred the data
onto an excel spreadsheet. All of the information gathered from my observations, surveys
and the interviews are stored on my personal laptop. The data I collected will stored and
secured for 3 years in my password protected computer, which will be locked and located
in my home office in Atlanta, Georgia.
The independent variable for my qualitative analysis is the stigmas associated
with the prison siting. The dependent variables for my qualitative analysis are the
residents’ attitudes towards the prison siting, the decisions made by government officials,
and the economic development (job growth & job availability) in the community. I
collected the data for my dependent variables from the observations, surveys, and
interviews. The sample for my qualitative data was comprised of the residents of Millen,
Georgia (30), a member of Millen’s City Council, and the mayor of Millen, Georgia. The
unit of analysis for my qualitative data are the residents of Millen, Georgia, the city
council member, and the mayor of Millen, Georgia.
The control variables were the type of prison (private vs. public), the location
(city vs. rural area), and the measurements of the job growth, unemployment rate and
GDP of other rural communities with prisons. I also included the national job growth,
unemployment rate and GDP of the country to use as a comparison. I created a
spreadsheet to store the data where I compared and contrasted my findings from the
national prison database to the reports of Millen, Georgia. The sample consists of the
randomly selected prisons located in rural communities and urban communities (collected

21
from a national prison database- BES, BLS). The unit of analysis were the urban and
rural communities.

22
Results
Data Tables
Table 2: Data for Jenkins County
*See Table in appendix E
Table 3: Data for Pickens County
*See Table in appendix F
FCI ALICEVILLE (Alabama) Pickens Co 0 1 1990 0 10.8 .
FCI ALICEVILLE (Alabama) Pickens Co 0 1 1991 0 11.7 .
FCI ALICEVILLE (Alabama) Pickens Co 0 1 1992 0 13.6 .
FCI ALICEVILLE (Alabama) Pickens Co 0 1 1993 0 12.1 .
FCI ALICEVILLE (Alabama) Pickens Co 0 1 1994 0 9.7 .
FCI ALICEVILLE (Alabama) Pickens Co 0 1 1995 0 9 .
FCI ALICEVILLE (Alabama) Pickens Co 0 1 1996 0 10 .
FCI ALICEVILLE (Alabama) Pickens Co 0 1 1997 0 9.7 .
FCI ALICEVILLE (Alabama) Pickens Co 0 1 1998 0 9.7 5.2
FCI ALICEVILLE (Alabama) Pickens Co 0 1 1999 0 15 5.4
FCI ALICEVILLE (Alabama) Pickens Co 0 1 2000 0 8.8 4.1
FCI ALICEVILLE (Alabama) Pickens Co 0 1 2001 0 8.6 3.7
FCI ALICEVILLE (Alabama) Pickens Co 0 1 2002 0 8.8 4.2
FCI ALICEVILLE (Alabama) Pickens Co 0 1 2003 0 9.7 4.7
FCI ALICEVILLE (Alabama) Pickens Co 0 1 2004 0 8.6 9.2
FCI ALICEVILLE (Alabama) Pickens Co 0 1 2005 0 6.4 6.1
FCI ALICEVILLE (Alabama) Pickens Co 0 1 2006 0 6.2 4.6
FCI ALICEVILLE (Alabama) Pickens Co 0 1 2007 0 5.6 3.2
FCI ALICEVILLE (Alabama) Pickens Co 0 1 2008 0 8 1.9
FCI ALICEVILLE (Alabama) Pickens Co 0 1 2009 0 16.9 -2.5
FCI ALICEVILLE (Alabama) Pickens Co 0 1 2010 0 14.9 4.1
FCI ALICEVILLE (Alabama) Pickens Co 0 1 2011 0 13.5 3.4
FCI ALICEVILLE (Alabama) Pickens Co 0 1 2012 0 11.7 2.5
FCI ALICEVILLE (Alabama) Pickens Co 0 1 2013 1 10.4 4.1
FCI ALICEVILLE (Alabama) Pickens Co 0 1 2014 1 10 2.4
FCI ALICEVILLE (Alabama) Pickens Co 0 1 2015 1 7.8 .

23
Table 4: Data for Fresno County
*See Table in appendix G
Table 5: Data for Victorville City
*See Table in appendix H
FCI MENDOTA (California) Fresno Co 0 1 1990 0 9.7 .
FCI MENDOTA (California) Fresno Co 0 1 1991 0 12.2 .
FCI MENDOTA (California) Fresno Co 0 1 1992 0 14.4 .
FCI MENDOTA (California) Fresno Co 0 1 1993 0 15.1 .
FCI MENDOTA (California) Fresno Co 0 1 1994 0 13.2 .
FCI MENDOTA (California) Fresno Co 0 1 1995 0 13.4 .
FCI MENDOTA (California) Fresno Co 0 1 1996 0 11.9 .
FCI MENDOTA (California) Fresno Co 0 1 1997 0 12.6 .
FCI MENDOTA (California) Fresno Co 0 1 1998 0 14 7.1
FCI MENDOTA (California) Fresno Co 0 1 1999 0 13.3 8.6
FCI MENDOTA (California) Fresno Co 0 1 2000 0 9.9 9.4
FCI MENDOTA (California) Fresno Co 0 1 2001 0 9.8 1.3
FCI MENDOTA (California) Fresno Co 0 1 2002 0 10.7 3.9
FCI MENDOTA (California) Fresno Co 0 1 2003 0 11.2 5.9
FCI MENDOTA (California) Fresno Co 0 1 2004 0 10 7.1
FCI MENDOTA (California) Fresno Co 0 1 2005 0 8.4 7.1
FCI MENDOTA (California) Fresno Co 0 1 2006 0 7.6 6.2
FCI MENDOTA (California) Fresno Co 0 1 2007 0 8.1 4.5
FCI MENDOTA (California) Fresno Co 0 1 2008 0 9.6 2.2
FCI MENDOTA (California) Fresno Co 0 1 2009 0 14.3 -4
FCI MENDOTA (California) Fresno Co 0 1 2010 0 16 2.7
FCI MENDOTA (California) Fresno Co 0 1 2011 1 16.4 3.4
FCI MENDOTA (California) Fresno Co 0 1 2012 1 15 4.5
FCI MENDOTA (California) Fresno Co 0 1 2013 1 12.8 4.1
FCI MENDOTA (California) Fresno Co 0 1 2014 1 10.9 4.5
FCI MENDOTA (California) Fresno Co 0 1 2015 1 9.5 .
FCI VICTORVILLE MEDIUM II (California) Victorville Ct 0 1 1990 0 5.5 .
FCI VICTORVILLE MEDIUM II (California) Victorville Ct 0 1 1991 0 8.7 .
FCI VICTORVILLE MEDIUM II (California) Victorville Ct 0 1 1992 0 10.2 .
FCI VICTORVILLE MEDIUM II (California) Victorville Ct 0 1 1993 0 10.4 .
FCI VICTORVILLE MEDIUM II (California) Victorville Ct 0 1 1994 0 9.1 .
FCI VICTORVILLE MEDIUM II (California) Victorville Ct 0 1 1995 0 8.4 .
FCI VICTORVILLE MEDIUM II (California) Victorville Ct 0 1 1996 0 7.8 .
FCI VICTORVILLE MEDIUM II (California) Victorville Ct 0 1 1997 0 7 .
FCI VICTORVILLE MEDIUM II (California) Victorville Ct 0 1 1998 0 6.3 7.1
FCI VICTORVILLE MEDIUM II (California) Victorville Ct 0 1 1999 0 5.4 8.6
FCI VICTORVILLE MEDIUM II (California) Victorville Ct 0 1 2000 0 5.2 9.4
FCI VICTORVILLE MEDIUM II (California) Victorville Ct 0 1 2001 0 5.2 1.3
FCI VICTORVILLE MEDIUM II (California) Victorville Ct 0 1 2002 0 6.2 3.9
FCI VICTORVILLE MEDIUM II (California) Victorville Ct 0 1 2003 0 6.9 5.9
FCI VICTORVILLE MEDIUM II (California) Victorville Ct 0 1 2004 1 6.2 7.1
FCI VICTORVILLE MEDIUM II (California) Victorville Ct 0 1 2005 1 5.5 7.1
FCI VICTORVILLE MEDIUM II (California) Victorville Ct 0 1 2006 1 5.1 6.2
FCI VICTORVILLE MEDIUM II (California) Victorville Ct 0 1 2007 1 5.8 4.5
FCI VICTORVILLE MEDIUM II (California) Victorville Ct 0 1 2008 1 8 2.2
FCI VICTORVILLE MEDIUM II (California) Victorville Ct 0 1 2009 1 13 -4
FCI VICTORVILLE MEDIUM II (California) Victorville Ct 0 1 2010 1 13.6 2.7
FCI VICTORVILLE MEDIUM II (California) Victorville Ct 0 1 2011 1 13.4 3.4
FCI VICTORVILLE MEDIUM II (California) Victorville Ct 0 1 2012 1 12.1 4.5
FCI VICTORVILLE MEDIUM II (California) Victorville Ct 0 1 2013 1 10.3 4.1
FCI VICTORVILLE MEDIUM II (California) Victorville Ct 0 1 2014 1 8.1 4.5
FCI VICTORVILLE MEDIUM II (California) Victorville Ct 0 1 2015 1 6.5 .

24
Table 6: Data for Fremont County
*See Table in appendix I
Table 7: Data for Charlton County
*See Table in appendix J
FCI FLORENCE (Colorado) Fremont Co 0 1 1990 0 5.5 .
FCI FLORENCE (Colorado) Fremont Co 0 1 1991 0 5.8 .
FCI FLORENCE (Colorado) Fremont Co 0 1 1992 0 8.7 .
FCI FLORENCE (Colorado) Fremont Co 0 1 1993 0 8.7 .
FCI FLORENCE (Colorado) Fremont Co 0 1 1994 1 5.9 .
FCI FLORENCE (Colorado) Fremont Co 0 1 1995 1 5.8 .
FCI FLORENCE (Colorado) Fremont Co 0 1 1996 1 5.1 .
FCI FLORENCE (Colorado) Fremont Co 0 1 1997 1 4.4 .
FCI FLORENCE (Colorado) Fremont Co 0 1 1998 1 4.5 9.4
FCI FLORENCE (Colorado) Fremont Co 0 1 1999 1 4.1 8.9
FCI FLORENCE (Colorado) Fremont Co 0 1 2000 1 4.1 9.9
FCI FLORENCE (Colorado) Fremont Co 0 1 2001 1 4.9 3.9
FCI FLORENCE (Colorado) Fremont Co 0 1 2002 1 6.5 2.3
FCI FLORENCE (Colorado) Fremont Co 0 1 2003 1 7.7 3.3
FCI FLORENCE (Colorado) Fremont Co 0 1 2004 1 6.8 4.9
FCI FLORENCE (Colorado) Fremont Co 0 1 2005 1 6.2 8.3
FCI FLORENCE (Colorado) Fremont Co 0 1 2006 1 5.9 4.8
FCI FLORENCE (Colorado) Fremont Co 0 1 2007 1 4.7 5.2
FCI FLORENCE (Colorado) Fremont Co 0 1 2008 1 6.3 4.4
FCI FLORENCE (Colorado) Fremont Co 0 1 2009 1 8.7 -2.3
FCI FLORENCE (Colorado) Fremont Co 0 1 2010 1 11.5 3.2
FCI FLORENCE (Colorado) Fremont Co 0 1 2011 1 11.4 3.2
FCI FLORENCE (Colorado) Fremont Co 0 1 2012 1 11.6 3.8
FCI FLORENCE (Colorado) Fremont Co 0 1 2013 1 10.7 4.2
FCI FLORENCE (Colorado) Fremont Co 0 1 2014 1 8 6.4
FCI FLORENCE (Colorado) Fremont Co 0 1 2015 1 7.1 .
CI D. RAY JAMES (Georgia) Charlton Co 0 1 1990 0 4.4 .
CI D. RAY JAMES (Georgia) Charlton Co 0 1 1991 0 4.2 .
CI D. RAY JAMES (Georgia) Charlton Co 0 1 1992 0 8.4 .
CI D. RAY JAMES (Georgia) Charlton Co 0 1 1993 0 6.3 .
CI D. RAY JAMES (Georgia) Charlton Co 0 1 1994 0 5.1 .
CI D. RAY JAMES (Georgia) Charlton Co 0 1 1995 0 7.8 .
CI D. RAY JAMES (Georgia) Charlton Co 0 1 1996 0 9.8 .
CI D. RAY JAMES (Georgia) Charlton Co 0 1 1997 0 4.6 .
CI D. RAY JAMES (Georgia) Charlton Co 0 1 1998 1 5.8 8.9
CI D. RAY JAMES (Georgia) Charlton Co 0 1 1999 1 5 8.9
CI D. RAY JAMES (Georgia) Charlton Co 0 1 2000 1 4.5 6.0
CI D. RAY JAMES (Georgia) Charlton Co 0 1 2001 1 4.5 3.7
CI D. RAY JAMES (Georgia) Charlton Co 0 1 2002 1 5.6 2.3
CI D. RAY JAMES (Georgia) Charlton Co 0 1 2003 1 6.8 3.6
CI D. RAY JAMES (Georgia) Charlton Co 0 1 2004 1 5.8 5.3
CI D. RAY JAMES (Georgia) Charlton Co 0 1 2005 1 6 6.7
CI D. RAY JAMES (Georgia) Charlton Co 0 1 2006 1 5.4 4.6
CI D. RAY JAMES (Georgia) Charlton Co 0 1 2007 1 4.9 4.5
CI D. RAY JAMES (Georgia) Charlton Co 0 1 2008 1 6.7 0.2
CI D. RAY JAMES (Georgia) Charlton Co 0 1 2009 1 12.2 -1.5
CI D. RAY JAMES (Georgia) Charlton Co 0 1 2010 1 11.1 1.5
CI D. RAY JAMES (Georgia) Charlton Co 0 1 2011 1 10.9 3.0
CI D. RAY JAMES (Georgia) Charlton Co 0 1 2012 1 10.1 3.4
CI D. RAY JAMES (Georgia) Charlton Co 0 1 2013 1 9.1 4.0
CI D. RAY JAMES (Georgia) Charlton Co 0 1 2014 1 8.5 4.4
CI D. RAY JAMES (Georgia) Charlton Co 0 1 2015 1 6.9 .

25
Table 8: Data for Honolulu City
*See Table in appendix K
Table 9: Data for Tazewell City
*See Table in appendix L
FDC HONOLULU (Hawaii) Honolulu Ct 1 1 1990 0 2.7 .
FDC HONOLULU (Hawaii) Honolulu Ct 1 1 1991 0 2.5 .
FDC HONOLULU (Hawaii) Honolulu Ct 1 1 1992 0 3.3 .
FDC HONOLULU (Hawaii) Honolulu Ct 1 1 1993 0 3.5 .
FDC HONOLULU (Hawaii) Honolulu Ct 1 1 1994 0 4.7 .
FDC HONOLULU (Hawaii) Honolulu Ct 1 1 1995 0 5.1 .
FDC HONOLULU (Hawaii) Honolulu Ct 1 1 1996 0 5.7 .
FDC HONOLULU (Hawaii) Honolulu Ct 1 1 1997 0 5.6 .
FDC HONOLULU (Hawaii) Honolulu Ct 1 1 1998 0 5.8 -0.8
FDC HONOLULU (Hawaii) Honolulu Ct 1 1 1999 0 5.3 4.1
FDC HONOLULU (Hawaii) Honolulu Ct 1 1 2000 0 4.6 5.3
FDC HONOLULU (Hawaii) Honolulu Ct 1 1 2001 1 4.7 3.7
FDC HONOLULU (Hawaii) Honolulu Ct 1 1 2002 1 4.6 5.6
FDC HONOLULU (Hawaii) Honolulu Ct 1 1 2003 1 4.7 7.5
FDC HONOLULU (Hawaii) Honolulu Ct 1 1 2004 1 3.7 9.8
FDC HONOLULU (Hawaii) Honolulu Ct 1 1 2005 1 3.3 9.0
FDC HONOLULU (Hawaii) Honolulu Ct 1 1 2006 1 3.3 6.1
FDC HONOLULU (Hawaii) Honolulu Ct 1 1 2007 1 3.2 5.3
FDC HONOLULU (Hawaii) Honolulu Ct 1 1 2008 1 4.4 2.7
FDC HONOLULU (Hawaii) Honolulu Ct 1 1 2009 1 6.7 -2.2
FDC HONOLULU (Hawaii) Honolulu Ct 1 1 2010 1 6.4 3.8
FDC HONOLULU (Hawaii) Honolulu Ct 1 1 2011 1 6.3 3.4
FDC HONOLULU (Hawaii) Honolulu Ct 1 1 2012 1 6.1 3.7
FDC HONOLULU (Hawaii) Honolulu Ct 1 1 2013 1 4.8 3.4
FDC HONOLULU (Hawaii) Honolulu Ct 1 1 2014 1 4.6 3.1
FDC HONOLULU (Hawaii) Honolulu Ct 1 1 2015 1 4.1 .
FCI PEKIN (Illinois) Tazewell Ct 1 1 1990 0 4.7 .
FCI PEKIN (Illinois) Tazewell Ct 1 1 1991 0 5.9 .
FCI PEKIN (Illinois) Tazewell Ct 1 1 1992 0 7 .
FCI PEKIN (Illinois) Tazewell Ct 1 1 1993 0 6 .
FCI PEKIN (Illinois) Tazewell Ct 1 1 1994 1 4.4 .
FCI PEKIN (Illinois) Tazewell Ct 1 1 1995 1 3.7 .
FCI PEKIN (Illinois) Tazewell Ct 1 1 1996 1 5.8 .
FCI PEKIN (Illinois) Tazewell Ct 1 1 1997 1 3.5 .
FCI PEKIN (Illinois) Tazewell Ct 1 1 1998 1 3 4.9
FCI PEKIN (Illinois) Tazewell Ct 1 1 1999 1 3.7 5.1
FCI PEKIN (Illinois) Tazewell Ct 1 1 2000 1 3.6 5.8
FCI PEKIN (Illinois) Tazewell Ct 1 1 2001 1 4.2 2.2
FCI PEKIN (Illinois) Tazewell Ct 1 1 2002 1 5.3 2.0
FCI PEKIN (Illinois) Tazewell Ct 1 1 2003 1 6.1 3.4
FCI PEKIN (Illinois) Tazewell Ct 1 1 2004 1 5.4 5.5
FCI PEKIN (Illinois) Tazewell Ct 1 1 2005 1 4.5 4.9
FCI PEKIN (Illinois) Tazewell Ct 1 1 2006 1 3.8 5.9
FCI PEKIN (Illinois) Tazewell Ct 1 1 2007 1 4.2 4.0
FCI PEKIN (Illinois) Tazewell Ct 1 1 2008 1 5.3 -0.1
FCI PEKIN (Illinois) Tazewell Ct 1 1 2009 1 10.7 -0.9
FCI PEKIN (Illinois) Tazewell Ct 1 1 2010 1 9.7 2.0
FCI PEKIN (Illinois) Tazewell Ct 1 1 2011 1 8.4 3.9
FCI PEKIN (Illinois) Tazewell Ct 1 1 2012 1 7.5 4.4
FCI PEKIN (Illinois) Tazewell Ct 1 1 2013 1 8.9 2.0
FCI PEKIN (Illinois) Tazewell Ct 1 1 2014 1 6.6 2.9
FCI PEKIN (Illinois) Tazewell Ct 1 1 2015 1 5.5 .

26
Table 10: Data for Martin County
*See Table in appendix M
Table 11: Data for Grant Parish
*See Table in appendix N
USP BIG SANDY (Kentucky) Martin Co 0 1 1990 0 7.6 .
USP BIG SANDY (Kentucky) Martin Co 0 1 1991 0 12.5 .
USP BIG SANDY (Kentucky) Martin Co 0 1 1992 0 12.4 .
USP BIG SANDY (Kentucky) Martin Co 0 1 1993 0 12.1 .
USP BIG SANDY (Kentucky) Martin Co 0 1 1994 0 9.3 .
USP BIG SANDY (Kentucky) Martin Co 0 1 1995 0 15.7 .
USP BIG SANDY (Kentucky) Martin Co 0 1 1996 0 16.1 .
USP BIG SANDY (Kentucky) Martin Co 0 1 1997 0 10.3 .
USP BIG SANDY (Kentucky) Martin Co 0 1 1998 0 10.9 4.5
USP BIG SANDY (Kentucky) Martin Co 0 1 1999 0 15.7 5.5
USP BIG SANDY (Kentucky) Martin Co 0 1 2000 0 7.5 -0.7
USP BIG SANDY (Kentucky) Martin Co 0 1 2001 0 6.1 3.3
USP BIG SANDY (Kentucky) Martin Co 0 1 2002 0 7.5 4.2
USP BIG SANDY (Kentucky) Martin Co 0 1 2003 1 9.3 3.9
USP BIG SANDY (Kentucky) Martin Co 0 1 2004 1 8.1 5.6
USP BIG SANDY (Kentucky) Martin Co 0 1 2005 1 8 6.0
USP BIG SANDY (Kentucky) Martin Co 0 1 2006 1 8.1 5.7
USP BIG SANDY (Kentucky) Martin Co 0 1 2007 1 8.7 2.1
USP BIG SANDY (Kentucky) Martin Co 0 1 2008 1 8.4 2.5
USP BIG SANDY (Kentucky) Martin Co 0 1 2009 1 12.4 -1.8
USP BIG SANDY (Kentucky) Martin Co 0 1 2010 1 10.2 6.2
USP BIG SANDY (Kentucky) Martin Co 0 1 2011 1 9.3 4.0
USP BIG SANDY (Kentucky) Martin Co 0 1 2012 1 9.3 3.4
USP BIG SANDY (Kentucky) Martin Co 0 1 2013 1 10.6 2.7
USP BIG SANDY (Kentucky) Martin Co 0 1 2014 1 9 2.7
USP BIG SANDY (Kentucky) Martin Co 0 1 2015 1 8 .
FCI POLLOCK (Louisiana) Grant Parish Co 1 1 1990 0 7 .
FCI POLLOCK (Louisiana) Grant Parish Co 1 1 1991 0 9.8 .
FCI POLLOCK (Louisiana) Grant Parish Co 1 1 1992 0 11.4 .
FCI POLLOCK (Louisiana) Grant Parish Co 1 1 1993 0 7.4 .
FCI POLLOCK (Louisiana) Grant Parish Co 1 1 1994 0 13 .
FCI POLLOCK (Louisiana) Grant Parish Co 1 1 1995 0 11.1 .
FCI POLLOCK (Louisiana) Grant Parish Co 1 1 1996 0 11.9 .
FCI POLLOCK (Louisiana) Grant Parish Co 1 1 1997 0 11.3 .
FCI POLLOCK (Louisiana) Grant Parish Co 1 1 1998 0 10 2.9
FCI POLLOCK (Louisiana) Grant Parish Co 1 1 1999 0 7.8 4.7
FCI POLLOCK (Louisiana) Grant Parish Co 1 1 2000 0 7.4 5.5
FCI POLLOCK (Louisiana) Grant Parish Co 1 1 2001 0 7.4 4.5
FCI POLLOCK (Louisiana) Grant Parish Co 1 1 2002 0 8 1.1
FCI POLLOCK (Louisiana) Grant Parish Co 1 1 2003 0 10.2 11.1
FCI POLLOCK (Louisiana) Grant Parish Co 1 1 2004 0 8.4 9.6
FCI POLLOCK (Louisiana) Grant Parish Co 1 1 2005 0 7.8 16.1
FCI POLLOCK (Louisiana) Grant Parish Co 1 1 2006 0 4.6 3.7
FCI POLLOCK (Louisiana) Grant Parish Co 1 1 2007 1 6.1 0.9
FCI POLLOCK (Louisiana) Grant Parish Co 1 1 2008 1 5.8 4.3
FCI POLLOCK (Louisiana) Grant Parish Co 1 1 2009 1 9 -3.7
FCI POLLOCK (Louisiana) Grant Parish Co 1 1 2010 1 9.6 10.6
FCI POLLOCK (Louisiana) Grant Parish Co 1 1 2011 1 9.6 3.7
FCI POLLOCK (Louisiana) Grant Parish Co 1 1 2012 1 9.5 3.7
FCI POLLOCK (Louisiana) Grant Parish Co 1 1 2013 1 9.1 -1.6
FCI POLLOCK (Louisiana) Grant Parish Co 1 1 2014 1 8.2 1.9
FCI POLLOCK (Louisiana) Grant Parish Co 1 1 2015 1 8.3 .

27
Table 12: Data for Allegany County
*See Table in appendix O
Table 13: Data for Waseca County
*See Table in appendix P
FCI CUMBERLAND (Maryland) Allegany Co 1 1 1990 0 11.4 .
FCI CUMBERLAND (Maryland) Allegany Co 1 1 1991 0 12.2 .
FCI CUMBERLAND (Maryland) Allegany Co 1 1 1992 0 14.8 .
FCI CUMBERLAND (Maryland) Allegany Co 1 1 1993 0 12.8 .
FCI CUMBERLAND (Maryland) Allegany Co 1 1 1994 1 9.8 .
FCI CUMBERLAND (Maryland) Allegany Co 1 1 1995 1 9.4 .
FCI CUMBERLAND (Maryland) Allegany Co 1 1 1996 1 9 .
FCI CUMBERLAND (Maryland) Allegany Co 1 1 1997 1 10.1 .
FCI CUMBERLAND (Maryland) Allegany Co 1 1 1998 1 8.3 6.5
FCI CUMBERLAND (Maryland) Allegany Co 1 1 1999 1 7 6.2
FCI CUMBERLAND (Maryland) Allegany Co 1 1 2000 1 6 6.0
FCI CUMBERLAND (Maryland) Allegany Co 1 1 2001 1 6.3 6.9
FCI CUMBERLAND (Maryland) Allegany Co 1 1 2002 1 6.6 5.9
FCI CUMBERLAND (Maryland) Allegany Co 1 1 2003 1 6.1 5.2
FCI CUMBERLAND (Maryland) Allegany Co 1 1 2004 1 6.3 7.7
FCI CUMBERLAND (Maryland) Allegany Co 1 1 2005 1 6.1 7.0
FCI CUMBERLAND (Maryland) Allegany Co 1 1 2006 1 5.9 5.1
FCI CUMBERLAND (Maryland) Allegany Co 1 1 2007 1 5 4.4
FCI CUMBERLAND (Maryland) Allegany Co 1 1 2008 1 5.6 2.8
FCI CUMBERLAND (Maryland) Allegany Co 1 1 2009 1 8.9 1.8
FCI CUMBERLAND (Maryland) Allegany Co 1 1 2010 1 9.3 3.5
FCI CUMBERLAND (Maryland) Allegany Co 1 1 2011 1 9.3 2.8
FCI CUMBERLAND (Maryland) Allegany Co 1 1 2012 1 9.2 2.3
FCI CUMBERLAND (Maryland) Allegany Co 1 1 2013 1 8.5 2.7
FCI CUMBERLAND (Maryland) Allegany Co 1 1 2014 1 7.6 2.7
FCI CUMBERLAND (Maryland) Allegany Co 1 1 2015 1 7.4 .
FCI WASECA (Minnesota) Waseca Co 0 1 1990 0 3.8 .
FCI WASECA (Minnesota) Waseca Co 0 1 1991 0 4.7 .
FCI WASECA (Minnesota) Waseca Co 0 1 1992 0 5.1 .
FCI WASECA (Minnesota) Waseca Co 0 1 1993 0 5.7 .
FCI WASECA (Minnesota) Waseca Co 0 1 1994 0 4.4 .
FCI WASECA (Minnesota) Waseca Co 0 1 1995 1 3.6 .
FCI WASECA (Minnesota) Waseca Co 0 1 1996 1 4.3 .
FCI WASECA (Minnesota) Waseca Co 0 1 1997 1 3.1 .
FCI WASECA (Minnesota) Waseca Co 0 1 1998 1 2.9 6.8
FCI WASECA (Minnesota) Waseca Co 0 1 1999 1 3.2 5.4
FCI WASECA (Minnesota) Waseca Co 0 1 2000 1 3 9.0
FCI WASECA (Minnesota) Waseca Co 0 1 2001 1 3.7 2.8
FCI WASECA (Minnesota) Waseca Co 0 1 2002 1 4.6 3.9
FCI WASECA (Minnesota) Waseca Co 0 1 2003 1 4.7 5.8
FCI WASECA (Minnesota) Waseca Co 0 1 2004 1 4.6 6.3
FCI WASECA (Minnesota) Waseca Co 0 1 2005 1 4.4 5.6
FCI WASECA (Minnesota) Waseca Co 0 1 2006 1 4.1 2.6
FCI WASECA (Minnesota) Waseca Co 0 1 2007 1 4.8 3.3
FCI WASECA (Minnesota) Waseca Co 0 1 2008 1 5.4 2.4
FCI WASECA (Minnesota) Waseca Co 0 1 2009 1 8.2 -2.1
FCI WASECA (Minnesota) Waseca Co 0 1 2010 1 7.5 5.0
FCI WASECA (Minnesota) Waseca Co 0 1 2011 1 6.3 4.6
FCI WASECA (Minnesota) Waseca Co 0 1 2012 1 5.8 3.6
FCI WASECA (Minnesota) Waseca Co 0 1 2013 1 5.5 3.9
FCI WASECA (Minnesota) Waseca Co 0 1 2014 1 4.7 2.9
FCI WASECA (Minnesota) Waseca Co 0 1 2015 1 4.4 .

28
Table 14: Data for Coos County
*See Table in appendix Q
Table 15: Data for Milan City
*See Table in appendix R
FCI BERLIN (New Hampshire) Coos Co 0 1 1990 0 6.5 .
FCI BERLIN (New Hampshire) Coos Co 0 1 1991 0 8.4 .
FCI BERLIN (New Hampshire) Coos Co 0 1 1992 0 10.4 .
FCI BERLIN (New Hampshire) Coos Co 0 1 1993 0 9.1 .
FCI BERLIN (New Hampshire) Coos Co 0 1 1994 0 7.0 .
FCI BERLIN (New Hampshire) Coos Co 0 1 1995 0 6.4 .
FCI BERLIN (New Hampshire) Coos Co 0 1 1996 0 6.6 .
FCI BERLIN (New Hampshire) Coos Co 0 1 1997 0 5.3 .
FCI BERLIN (New Hampshire) Coos Co 0 1 1998 0 3.9 5.7
FCI BERLIN (New Hampshire) Coos Co 0 1 1999 0 4.1 2.6
FCI BERLIN (New Hampshire) Coos Co 0 1 2000 0 3.6 7.0
FCI BERLIN (New Hampshire) Coos Co 0 1 2001 0 5.3 2.3
FCI BERLIN (New Hampshire) Coos Co 0 1 2002 0 6.6 5.2
FCI BERLIN (New Hampshire) Coos Co 0 1 2003 0 5.2 5.8
FCI BERLIN (New Hampshire) Coos Co 0 1 2004 0 4.5 5.7
FCI BERLIN (New Hampshire) Coos Co 0 1 2005 0 4.1 5.6
FCI BERLIN (New Hampshire) Coos Co 0 1 2006 0 4.2 4.2
FCI BERLIN (New Hampshire) Coos Co 0 1 2007 0 4.6 2.6
FCI BERLIN (New Hampshire) Coos Co 0 1 2008 0 5.2 0.0
FCI BERLIN (New Hampshire) Coos Co 0 1 2009 0 8.0 1.1
FCI BERLIN (New Hampshire) Coos Co 0 1 2010 0 7.2 3.7
FCI BERLIN (New Hampshire) Coos Co 0 1 2011 0 7.2 2.2
FCI BERLIN (New Hampshire) Coos Co 0 1 2012 1 7.5 3.5
FCI BERLIN (New Hampshire) Coos Co 0 1 2013 1 6.2 3.3
FCI BERLIN (New Hampshire) Coos Co 0 1 2014 1 5.8 4.1
FCI BERLIN (New Hampshire) Coos Co 0 1 2015 1 4.9 .
CI CIBOLA COUNTY (New Mexico) Milan Ct 0 0 1990 0 13 .
CI CIBOLA COUNTY (New Mexico) Milan Ct 0 0 1991 0 13.7 .
CI CIBOLA COUNTY (New Mexico) Milan Ct 0 0 1992 0 13.3 .
CI CIBOLA COUNTY (New Mexico) Milan Ct 0 0 1993 1 12.1 .
CI CIBOLA COUNTY (New Mexico) Milan Ct 0 0 1994 1 10.3 .
CI CIBOLA COUNTY (New Mexico) Milan Ct 0 0 1995 1 1910.3 .
CI CIBOLA COUNTY (New Mexico) Milan Ct 0 0 1996 1 13.4 .
CI CIBOLA COUNTY (New Mexico) Milan Ct 0 0 1997 1 10.7 .
CI CIBOLA COUNTY (New Mexico) Milan Ct 0 0 1998 1 8.6 -3.7
CI CIBOLA COUNTY (New Mexico) Milan Ct 0 0 1999 1 7.8 5.3
CI CIBOLA COUNTY (New Mexico) Milan Ct 0 0 2000 1 6.8 4.5
CI CIBOLA COUNTY (New Mexico) Milan Ct 0 0 2001 1 6.1 2.3
CI CIBOLA COUNTY (New Mexico) Milan Ct 0 0 2002 1 6.4 3.4
CI CIBOLA COUNTY (New Mexico) Milan Ct 0 0 2003 1 6.2 8.0
CI CIBOLA COUNTY (New Mexico) Milan Ct 0 0 2004 1 5.7 10.3
CI CIBOLA COUNTY (New Mexico) Milan Ct 0 0 2005 1 5.6 5.6
CI CIBOLA COUNTY (New Mexico) Milan Ct 0 0 2006 1 4.5 4.7
CI CIBOLA COUNTY (New Mexico) Milan Ct 0 0 2007 1 4.2 3.9
CI CIBOLA COUNTY (New Mexico) Milan Ct 0 0 2008 1 4.6 4.6
CI CIBOLA COUNTY (New Mexico) Milan Ct 0 0 2009 1 6.9 -3.6
CI CIBOLA COUNTY (New Mexico) Milan Ct 0 0 2010 1 9.5 3.5
CI CIBOLA COUNTY (New Mexico) Milan Ct 0 0 2011 1 9 3.3
CI CIBOLA COUNTY (New Mexico) Milan Ct 0 0 2012 1 8.1 1.7
CI CIBOLA COUNTY (New Mexico) Milan Ct 0 0 2013 1 8 3.0
CI CIBOLA COUNTY (New Mexico) Milan Ct 0 0 2014 1 8 2.3
CI CIBOLA COUNTY (New Mexico) Milan Ct 0 0 2015 1 7.8 .

29
Table 16: Data for Winton City
*See Table in appendix S
Table 17: Data for Lee County
*See Table in appendix T
CI RIVERS (North Carolina) Winton Ct 0 0 1990 0 5.8 .
CI RIVERS (North Carolina) Winton Ct 0 0 1991 0 8.7 .
CI RIVERS (North Carolina) Winton Ct 0 0 1992 0 9.5 .
CI RIVERS (North Carolina) Winton Ct 0 0 1993 0 9.5 .
CI RIVERS (North Carolina) Winton Ct 0 0 1994 0 6.9 .
CI RIVERS (North Carolina) Winton Ct 0 0 1995 0 5.7 .
CI RIVERS (North Carolina) Winton Ct 0 0 1996 0 5.7 .
CI RIVERS (North Carolina) Winton Ct 0 0 1997 0 5.1 .
CI RIVERS (North Carolina) Winton Ct 0 0 1998 0 4.4 4.9
CI RIVERS (North Carolina) Winton Ct 0 0 1999 0 3.9 8.0
CI RIVERS (North Carolina) Winton Ct 0 0 2000 0 5.1 5.1
CI RIVERS (North Carolina) Winton Ct 0 0 2001 1 7.1 5.3
CI RIVERS (North Carolina) Winton Ct 0 0 2002 1 7.1 3.5
CI RIVERS (North Carolina) Winton Ct 0 0 2003 1 6.1 4.0
CI RIVERS (North Carolina) Winton Ct 0 0 2004 1 5.8 6.0
CI RIVERS (North Carolina) Winton Ct 0 0 2005 1 5.9 7.6
CI RIVERS (North Carolina) Winton Ct 0 0 2006 1 5.5 8.0
CI RIVERS (North Carolina) Winton Ct 0 0 2007 1 5.2 2.4
CI RIVERS (North Carolina) Winton Ct 0 0 2008 1 6.6 2.9
CI RIVERS (North Carolina) Winton Ct 0 0 2009 1 9.6 0.8
CI RIVERS (North Carolina) Winton Ct 0 0 2010 1 10.6 2.8
CI RIVERS (North Carolina) Winton Ct 0 0 2011 1 11.3 2.7
CI RIVERS (North Carolina) Winton Ct 0 0 2012 1 10.7 2.9
CI RIVERS (North Carolina) Winton Ct 0 0 2013 1 9.3 4.8
CI RIVERS (North Carolina) Winton Ct 0 0 2014 1 7.2 3.4
CI RIVERS (North Carolina) Winton Ct 0 0 2015 1 7 .
USP LEE (Virginia) Lee Co 0 1 1990 0 9.5 .
USP LEE (Virginia) Lee Co 0 1 1991 0 10.5 .
USP LEE (Virginia) Lee Co 0 1 1992 0 14.5 .
USP LEE (Virginia) Lee Co 0 1 1993 0 11.2 .
USP LEE (Virginia) Lee Co 0 1 1994 0 10.4 .
USP LEE (Virginia) Lee Co 0 1 1995 0 11.7 .
USP LEE (Virginia) Lee Co 0 1 1996 0 11.9 .
USP LEE (Virginia) Lee Co 0 1 1997 0 9.0 .
USP LEE (Virginia) Lee Co 0 1 1998 0 8.0 6.9
USP LEE (Virginia) Lee Co 0 1 1999 0 8.8 7.6
USP LEE (Virginia) Lee Co 0 1 2000 0 4.2 7.0
USP LEE (Virginia) Lee Co 0 1 2001 0 5.0 5.7
USP LEE (Virginia) Lee Co 0 1 2002 1 5.7 2.7
USP LEE (Virginia) Lee Co 0 1 2003 1 6.0 5.9
USP LEE (Virginia) Lee Co 0 1 2004 1 5.7 6.7
USP LEE (Virginia) Lee Co 0 1 2005 1 5.1 8.6
USP LEE (Virginia) Lee Co 0 1 2006 1 4.4 5.5
USP LEE (Virginia) Lee Co 0 1 2007 1 4.2 3.8
USP LEE (Virginia) Lee Co 0 1 2008 1 5.3 1.9
USP LEE (Virginia) Lee Co 0 1 2009 1 7.2 2.6
USP LEE (Virginia) Lee Co 0 1 2010 1 7.9 3.4
USP LEE (Virginia) Lee Co 0 1 2011 1 7.6 1.9
USP LEE (Virginia) Lee Co 0 1 2012 1 8.3 2.9
USP LEE (Virginia) Lee Co 0 1 2013 1 8.8 2.3
USP LEE (Virginia) Lee Co 0 1 2014 1 8.2 1.9
USP LEE (Virginia) Lee Co 0 1 2015 1 7.3 .

30
Table 18: Survey Responses (Demographics-Part A)
*See Table in appendix U
Table 19: Survey Responses (Demographics-Part B)
*See Table in appendix V
Gender (M: 0/F: 1) Ethnicity (Asian: 0, Black: 1, Hispanic: 2, White: 3, Native American: 4, Other: 5) Age (Under 20: 0, 20-29: 1, 30-39: 2, 40-49: 3, Over 50: 4) Employed (Yes: 1/No: 0) Annual Income (Below 20,000: 0, 20,000-29,999: 1, 30,000-39,999: 2, 40,000-49,999: 3, over 50,000: 4) Education (High School: 0, College: 1, Masters: 2, PHD: 3, Other: 4) Children
1 1 4 1 4 1 1
1 1 3 1 1 1 2
1 1 0 1 0 0 0
1 1 4 1 1 0 3
0 3 3 0 3 0 2
0 3 3 1 1 0 2
0 1 3 1 1 0 1
0 3 4 1 1 0 0
0 3 3 1 3 1 4
0 1 1 1 1 0 0
1 1 0 1 0 0 0
1 1 4 1 1 1 3
0 1 4 0 0 0 0
1 1 4 1 2 2 1
1 1 3 1 0 1 0
1 3 1 1 0 0 0
1 1 1 0 0 1 0
1 1 1 1 0 0 2
1 1 3 1 3 1 1
1 1 3 0 0 0 3
1 3 4 1 0 0 2
0 1 4 1 1 0 3
0 1 0 0 0 0 0
1 1 1 0 0 1 1
0 1 1 1 0 0 2
1 3 4 1 4 1 3
0 3 2 1 1 0 3
1 3 4 0 0 0 3
0 1 4 1 4 1 3
Personal Connect to Prison (Yes: 1/No: 0) Resident of Jenkins County (Yes: 1/No: 0)
0 1
0 1
0 1
0 1
0 1
0 1
0 1
0 1
0 1
0 1
0 1
0 1
0 1
1 1
0 1
0 1
0 1
0 1
0 1
0 1
0 1
0 1
0 1
0 1
0 1
0 1
0 1
0 1
0 1

31
Table 20: Survey Responses (Part C)
*See Table in appendix W
Table 21: Survey Responses (Part D)
*See Table in appendix X
Economic Status before Prison was healthy overall attitude: positive relationship between prison & community: healthy prison effecive in boosting the economy overall prison good for town
3 3 3 3 3
4 4 6 6 4
3 3 3 3 3
5 1 4 5 5
5 3 4 3 3
1 4 3 2 2
4 3 3 4 3
6 3 6 3 4
4 5 5 5 5
3 5 6 5 5
3 5 5 5 5
5 1 6 5 1
2 3 3 1 2
1 3 4 1 3
3 4 3 3 2
3 4 2 4 4
3 4 3 3 3
2 3 4 4 3
1 3 4 4 4
1 4 4 4 4
5 5 4 5 5
3 2 4 3 2
3 3 4 3 3
1 5 3 3 1
3 2 2 2 2
1 4 4 4 4
3 5 5 4 5
6 5 3 1 6
1 5 5 5 5
stigmas associated with prison impact negative public involved in process individual personally invilved in process tradeoff btw economic growth & public security tradeoff favors economic growth
3 3 3 4 3
6 6 6 6 6
3 6 6 6 6
1 4 2 1 5
1 6 6 4 4
1 4 5 5 5
3 3 3 3 3
6 6 6 5 6
2 4 4 4 4
6 5 1 3 6
3 3 6 5 5
1 5 1 5 5
3 4 4 2 3
5 4 1 1 4
2 3 3 2 2
3 2 2 3 3
2 3 6 2 3
2 3 2 3 3
1 4 1 6 4
4 4 4 4 4
5 5 1 5 5
2 3 3 3 2
1 4 1 4 4
2 2 2 1 1
2 2 3 3 2
1 4 1 4 4
2 4 1 5 4
6 6 6 1 5
3 4 4 5 5
32
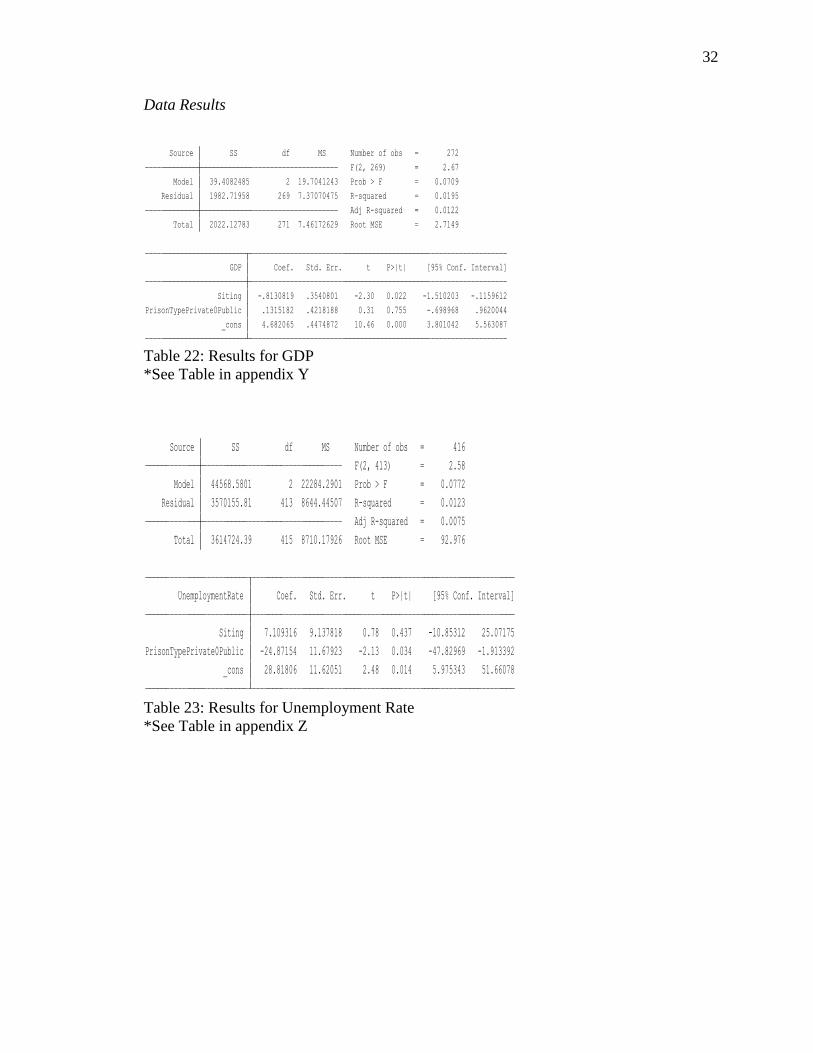
Data Results
Table 22: Results for GDP
*See Table in appendix Y
Table 23: Results for Unemployment Rate
*See Table in appendix Z
_cons 4.682065 .4474872 10.46 0.000 3.801042 5.563087
PrisonTypePrivate0Public .1315182 .4218188 0.31 0.755 -.698968 .9620044
Siting -.8130819 .3540801 -2.30 0.022 -1.510203 -.1159612
GDP Coef. Std. Err. t P>|t| [95% Conf. Interval]
Total 2022.12783 271 7.46172629 Root MSE = 2.7149
Adj R-squared = 0.0122
Residual 1982.71958 269 7.37070475 R-squared = 0.0195
Model 39.4082485 2 19.7041243 Prob > F = 0.0709
F(2, 269) = 2.67
Source SS df MS Number of obs = 272
_cons 28.81806 11.62051 2.48 0.014 5.975343 51.66078
PrisonTypePrivate0Public -24.87154 11.67923 -2.13 0.034 -47.82969 -1.913392
Siting 7.109316 9.137818 0.78 0.437 -10.85312 25.07175
UnemploymentRate Coef. Std. Err. t P>|t| [95% Conf. Interval]
Total 3614724.39 415 8710.17926 Root MSE = 92.976
Adj R-squared = 0.0075
Residual 3570155.81 413 8644.44507 R-squared = 0.0123
Model 44568.5801 2 22284.2901 Prob > F = 0.0772
F(2, 413) = 2.58
Source SS df MS Number of obs = 416

33
Table 24: Results for Stigmas
*See Table in appendix AA
Table 25: Results for Tradeoff Favors Economic Growth
*See Table in appendix AB
99% 6 6 Kurtosis 2.479178
95% 6 6 Skewness .7724062
90% 6 6 Variance 2.764368
75% 3 6
Largest Std. Dev. 1.662639
50% 2.5 Mean 2.833333
25% 2 1 Sum of Wgt. 30
10% 1 1 Obs 30
5% 1 1
1% 1 1
Percentiles Smallest
stigmas associated with prison impact negative
99% 6 6 Kurtosis 2.420771
95% 6 6 Skewness -.3326441
90% 6 6 Variance 1.757471
75% 5 6
Largest Std. Dev. 1.325697
50% 4 Mean 4.033333
25% 3 2 Sum of Wgt. 30
10% 2 2 Obs 30
5% 2 2
1% 1 1
Percentiles Smallest
tradeoff favors economic growth

34
Table 26: Results for Public Involvement
*See Table in appendix AC
Analysis
The evidence collected from the single case study where I conducted interviews
of a city council member of Millen, Georgia and the Mayor of Millen, Georgia, largely
supported my first hypothesis, which stated that during times of economic despair, local
government officials in rural communities will make the decision to invest in a prison to
boost their economies. In their interviews, both the city council member and the mayor
agreed that the prison was necessary in order to help create jobs to revitalize the
struggling economy. The city council member mentioned in the interview that how prior
to the construction of the private correctional facility, the town had experienced an
unemployment rate that reached a high of 20%. Both the city council member and the
mayor agreed that something needed to be done in the town in order to repair the
economic state of the community. Mayor Rocker mentioned in his interview how he
embraced the idea of investing in a prison because it would create jobs for that the town
that were desperately needed to revitalize the community.

35
In their interviews, the city council member and the mayor also discussed that
during the process of deciding whether or not to invest in a prison, that there were a
number of major players involved that included the City Commissioner, the city council
members as well as the mayor, representatives from the prison, representatives from the
Board of Education Development Authority, and members from the Kent family. In
addition to that, the community was also heavily involved during the process. The
council member stated that several county hearings were held before the mayor and the
city council members made the final decision to invest in the prison. Results from the
survey responses supported the claim made by the city council member and mayor about
the general public being involved in the decision making process. In Table 26, the results
show that when the residents were asked if the public was involved in the decision
making process for the prison, the average number for the response was 3.967. On the
rating scale, this number indicates that on average the people of Millen, Georgia who
were surveyed agreed that the public was involved in the decision making process.
Although the information gathered was from a single case study, the results showed that
when faced with financial struggles, some local government officials will invest in a
prison.
The results from the statistical analysis compiled from the data collected from the
prisons that I surveyed across the country, partially supported my second hypothesis
which stated that investing in a prison would lead to greater economic development in the
community in terms of job growth (short term). The results from Table 22 showed that
the presence of a prison siting decreases the total GPD in the selected communities. The
results were statically significant and had a p-value of 0.022. Although the results showed

36
that a prison siting can decrease GDP, there are a number a factors that could have
contributed to this finding. One factor that could have contributed to the decline in GDP
in the locations of the prison siting, could have been the financial crisis that occurred in
late 2007 that resulted in a global economic recession. In data Tables 2-17, in the years
ranging from 2009 to 2012, each prison siting surveyed showed a consistent pattern of
having relatively low and/or a declining GDP. This pattern could have skewed the results
in favor of decreasing the GDP, which may explain why we see a decline in GDP in the
results. A second factor that could have contributed to the decline in GDP was that there
was no data available for the GDP for each of the counties/cities where the prisons where
located. Due to that factor, I was limited to using the GDP of the states with the prisons
that were selected for the study. This could have also impacted the final results, in terms
of evaluating the effects a prison siting can have on GDP. Due to these factors, the results
gathered for the GDP and prison siting may not properly assess the effect the prisons may
have actual GDP in those states. However, even with those potential factors, I cannot
ignore the general decline in GDP from the results in the states with the prison siting.
Contrary to these findings on GDP, the results from Table 23 shows that public
prison facilities decrease the unemployment rate in the selected communities. The results
were statically significant with a p-value of 0.034. This finding supported the claim that
prisons, more specifically public correctional facilities, can help decrease the
unemployment rate. I acknowledge that there may be other factors that may contribute
the rise and decline in the change in the unemployment rate, however, one cannot ignore
the general decline in the unemployment rate from the results in the counties/cities where
the prisons were located. Once the appropriate data is available, future research can be

37
conducted to further investigate the affect prisons may or may not have on the overall
change in the unemployment rate and the GDP in the area. As for now with the data that
has been collected thus far, the results show that a prison siting can decrease GDP in the
area while public correctional facilities can decrease the overall unemployment rate in the
counties/cities and states where the prisons are located.
The evidence collected from the single case study where I conducted surveys of
the residents of Millen, Georgia, did not support my third hypothesis which stated that the
construction of a prison in rural communities will result in greater stigmas associated
with the prison from residents living in the community (long term). In Table 24, the
results show that when the residents were asked if the stigmas associated with the prison
impacted the community in a negative way, the average number from the responses was
2.833. On the rating scale, this number indicated that on average the people of Millen,
Georgia who were surveyed disagreed that the stigmas associated with the prison
impacted the community in a negative way.
The evidence collected from the single case study where I conducted surveys of
the residents of Millen, Georgia, supported my final hypothesis, which stated that
investing in a prison from the public’s perspective, will result in the tradeoff of furthering
economic development over public security. In Table 25, the results show that when the
residents were asked if when investing in a prison the tradeoff between economic
development and public security favored economic growth, the average number for the
response was 4.033. On the rating scale, this number indicated that on average the people
of Millen, Georgia who were surveyed agreed that when investing in a prison the tradeoff
favors economic growth over public security.

38
Conclusion
To conclude, the results from the data collected supported two of my hypotheses
and part of one. In my findings I was able to show that in rural communities that are
struggling economically, some local government officials will make the decision to invest
in a prison to boost their economies. I was also able to show though my qualitative
analysis of the survey responses from the residents in Millen, Georgia, that investing in a
prison from the public’s perspective, will result in the tradeoff of furthering economic
development over public security. I was partially able to show that investing in a prison
can be beneficial in furthering economic development in terms of lowering the
unemployment rate in areas that have public correctional facilities. However, I also found
that a prison siting can decrease the overall GDP. Although there may have been other
factors that could have contributed to the trends associated with the changes in the
unemployment rate and GDP, the results from the qualitative and statistical analysis
provides a general idea of the effect a prison siting and the type of prison can have on a
community, in regards to the overall decline and rise in the unemployment rate and GDP.
From my findings I was unable to show support for the claim that the construction of
prisons in rural communities will result in greater stigmas associated with the prison from
residents living in the community.
From the results provided from my investigation, I would recommend that
investing in a prison can be beneficial for a struggling community that is in need of
furthering its economic development in terms of lowering the unemployment rate and
creating jobs. Although investing in a prison from the public’s perspective, may result in
the tradeoff of furthering economic development over public security, the economic

39
development that may result from initial investment will outweigh the concerns for public
security. In addition, stigmas associated with the prison will not impact the residents in
the community in a negative way, which may lessen concerns for public security in
regards to the prison siting.

40
Bibliography
Bennett, Josephine . "Jenkins County Gets Jobs." GPB News . Georgia Public
Broadcasting, 2 Feb. 2012. Web. 18 Oct. 2014.
<http://www.gpb.org/news/2012/02/02/jenkins-county-gets-jobs>.
Blankenship, Susan E., and Ernest J. Yanarella. "Prison Recruitment As A Policy Tool
Of Local Economic Development: A Critical Evaluation." Contemporary Justice
Review 7.2 (2004): 183-198. Legal Collection. Web. 28 Jan. 2015.
Boom On Persistently Poor Rural Places." International Regional Science Review 30.3
(2007): 274-299. Web. 21 Sept. 2014.
Brown, Noel . "Struggling County Welcomes New Prison." GPB News. Georgia Public
Broadcasting, 17 Sept. 2010. Web. 18 Oct. 2014.
<http://www.gpb.org/news/2010/09/17/struggling-county-welcomes-new-prison>.
"Best Places to Live | Compare Cost of Living, Crime, Cities, Schools and More.
Sperling's BestPlaces." Best Places to Live | Compare Cost of Living, Crime,
Cities, Schools and More. Sperling's BestPlaces. Web. 10 June 2015.
"Commerce.gov." Department of Commerce. Web. 10 June 2015.
"Current State Rankings." JP Morgan Chase Outlook Center. Web. 10 June 2015.
"Federal Bureau of Prisons." BOP: Web Site. Web. 10 June 2015.
Glasmeier, Amy K., and Tracey Farrigan. "The Economic Impacts Of The Prison
Development Boom On Persistently Poor Rural Places." International Regional
41
Science Review 30.3 (2007): 274-299. Business Source Complete. Web. 21 Sept.
2014.
Hackle, Al. “Prison brings jobs, cash.” Statesboro Herald. 15 Jul. 2014: 13-14. Print.
Hatcher, Rick. "Some Impacts Of A Prison On A Community." Economic Development
Review 12.3 (1994): 64. Web. 21 Sept. 2014.
Hooks, Gregory, et al. "Revisiting The Impact Of Prison Building On Job Growth:
Education, Incarceration, And County-Level Employment, 1976–2004." Social
Science Quarterly (Wiley-Blackwell) 91.1 (2010): 228-244. Web. 24 Sept. 2014.
King, Ryan, Marc Mauer, and Tracy Huling. "Big Prisons, Small Towns: Prison
Economics in Rural America." Big Prisons, Small Towns: Prison Economics in
Rural America (2003): 1-22. Print.
"In Calif. Town, Prison May Fix One Employment Problem, But Create Another." PBS.
PBS, 5 May 2011. Web. 28 Jan. 2015.
<http://www.pbs.org/newshour/bb/social_issues-jan-june11-mendota_05-05/>.
Rose, Dina R., Todd R. Clear, and Judith A. Ryder. "Addressing The Unintended
Consequences Of Incarceration Through Community-Oriented Services At The
Neighborhood Level." Corrections Management Quarterly 5.3 (2001): 62-70.
Business Source Complete. Web. 1 Feb. 2015.
Semuels, Alana. "Can a New Prison save a Town?" Los Angeles Times. Los Angeles
Times, 3 May 2010. Web. 28 Jan. 2015.
<http://articles.latimes.com/2010/may/03/business/la-fi-0503-prisons-20100503>.

42
"Strengthening the Rural Economy - The Current State of Rural America." The White
House. The White House. Web. 6 Oct. 2014.
"USDA ERS - Home." USDA ERS - Home. Web. 11 June 2015.
Useem, Bert. "Prison Siting And Economic Development." Criminology & Public Policy
3.3 (2004): 451-452. Web. 23 Sept. 2014
"U.S. Bureau of Labor Statistics." U.S. Bureau of Labor Statistics. U.S. Bureau of Labor
Statistics. Web. 10 June 2015.
"U.S. Economic Accounts." U.S. Bureau of Economic Analysis (BEA). Web. 10 June
2015.
"United States GDP Growth Rate | 1947-2015 | Data | Chart | Calendar." United States
GDP Growth Rate | 1947-2015 | Data | Chart | Calendar. Web. 10 June 2015.

43
Appendix
Appendix A:
“Employment by Rural-Urban Classification.” The White House. Web. 6 Oct. 2014
Appendix B:
Survey Questions
Instructions: Please circle and complete the following questions to reflect your opinions
as accurately as possible and to answer factual questions to the best of your knowledge.
Your information will be kept strictly confidential.
Demographics
Gender: Male Female
Ethnicity: Asian Black Hispanic White Native American Other
(________________)
Age: Under 20 20-29 30-39 40-49 Over 50
Employed: Yes No
Annual Income: Below 20,000 20,000-29,999 30,000-39,999 40,000-49,999 Over
50,000 (specify) _____________

44
Education (highest level Completed): High School College (Associate’s Bachelor’s)
Masters PHD Other (specify) ___________________
Children: None 1 2 3 4 5 6 7 8 9 10 More than 10 (specify) ___________
Personal Connection with Prison: Yes No
Resident of Jenkins County: Yes No
Instructions: On a scale of 1 to 5, 5 meaning you strongly agree and 1 meaning you
strongly disagree, circle the number that indicates your degree of satisfaction with each of
the following items. (Check NA if the item is not applicable or if you lack personal
knowledge of it.)
Please rate the following questions:
1) Strongly Disagree 2) Disagree 3) Neither agree nor disagree 4) Agree 5) Strongly
agree NA
· The economic status of the community before
the construction of the prison was healthy. 1 2 3 4
5 NA
· Your overall attitude towards the city
investing in a prison was positive. 1 2 3 4
5 NA
· The relationship between the prison and
the community is healthy. 1 2 3 4
5 NA

45
· Overall the prison has been effective in
boosting the town’s economy. 1 2 3 4
5 NA
· Overall the prison has been good
for the town. 1 2 3 4
5 NA
· The stigmas associated with the prison have
impacted you in a negative way. 1 2 3 4
5 NA
Please rate the following questions:
1) Strongly Disagree 2) Disagree 3) Neither agree nor disagree 4) Agree 5) Strongly
agree NA
· During the process of opening the new
prison the general public was involved. 1 2 3 4
5 NA
-You were involved. 1 2 3 4
5 NA
· The prison has presented a tradeoff between
furthering economic growth and pubic security. 1 2 3 4
5 NA
- The tradeoff favors economic growth 1 2 3 4
5 NA

46
Appendix C:
Interview Questions
Instructions: Please answer the following questions to reflect your opinions as accurately
as possible and to answer factual questions to the best of your knowledge.
Your information will be kept strictly confidential.
What was the town’s main source of revenue before the prison opened?
What other options/measures were considered to help alleviate the financial state of the
town?
From your perspective, why did you/the city decide to invest in a prison?
- Was it the town’s only option?
How did the city go about making the decision to allow for the prison to be constructed in
the community? What was the process?
- Did you involve the local residents? Positive/Negative of prison coming into town
- What polices did you/the city are adopt?
During the process of opening the new prison was the general public involved?
During the process of opening the new prison how much did the community have to give
up?
- What were some of the tradeoff?
- Which ones were more beneficial?
How would you rate the relationship between the prison and the community?
Has the prison been economically beneficial? Has it fostered economic growth in the
community?
- In what ways?

47
Has there been a decline in the economic development sense the prison opened?
What other economic developments have been introduced since the prison has been
added?
What are some major positives that the community has seen since the introduction of the
prison?
What are some major negatives that the community has seen since the introduction of the
prison?
What is the current status of the community since the addition of the prison?
Appendix D:
Residents of Millen, Georgia
COLLEGE OF (College of Liberal Arts & Social Sciences)
DEPARTMENT OF (Political Science)
Georgia Southern University
Institutional Review Board
Informed Consent Form
CONSENT TO PARTICIPATE IN A Research STUDY
Title of Project: Impacts of Prisons in Rural Communities: Economic and Social Factors
Principle Investigator(s): This study will be conducted by Ashleigh Rasheed, an undergraduate
student at Georgia Southern University, under the direction of Dr. Joshua Kennedy
[email protected] and Dr. Jamie Scalera [email protected].
Purpose of Study: The purpose of this study is to examine the stigmas associated with the prison
in the community, to investigate the impact those stigmas have on the residents living in the
community. The results from this study will help determine whether or not the stigmas associated
with the prison have enough influence to affect the local economy, in terms of job growth and job
availability in a rural community.
Procedures to be followed: After participants read and understand this informed consent form,
they can begin filling out the survey. Participation in this research will include completion of
series of questions that are relevant to the study. Participants will also be asked to provide some
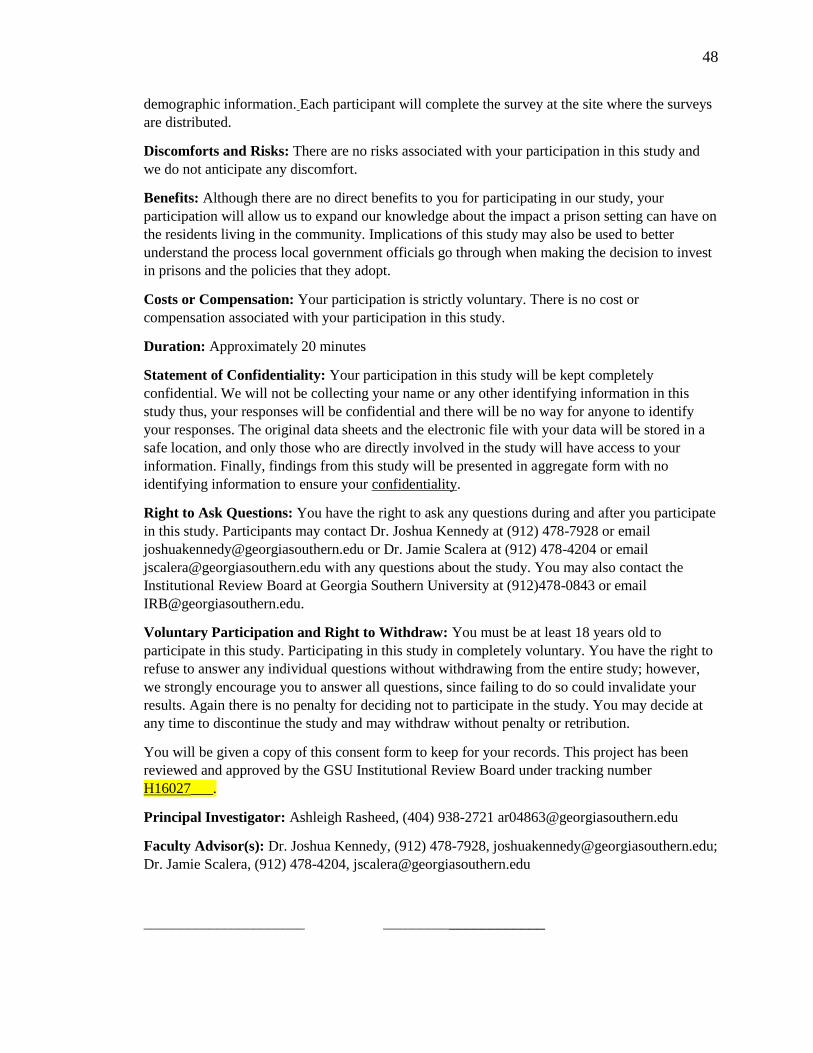
48
demographic information. Each participant will complete the survey at the site where the surveys
are distributed.
Discomforts and Risks: There are no risks associated with your participation in this study and
we do not anticipate any discomfort.
Benefits: Although there are no direct benefits to you for participating in our study, your
participation will allow us to expand our knowledge about the impact a prison setting can have on
the residents living in the community. Implications of this study may also be used to better
understand the process local government officials go through when making the decision to invest
in prisons and the policies that they adopt.
Costs or Compensation: Your participation is strictly voluntary. There is no cost or
compensation associated with your participation in this study.
Duration: Approximately 20 minutes
Statement of Confidentiality: Your participation in this study will be kept completely
confidential. We will not be collecting your name or any other identifying information in this
study thus, your responses will be confidential and there will be no way for anyone to identify
your responses. The original data sheets and the electronic file with your data will be stored in a
safe location, and only those who are directly involved in the study will have access to your
information. Finally, findings from this study will be presented in aggregate form with no
identifying information to ensure your confidentiality.
Right to Ask Questions: You have the right to ask any questions during and after you participate
in this study. Participants may contact Dr. Joshua Kennedy at (912) 478-7928 or email
[email protected] or Dr. Jamie Scalera at (912) 478-4204 or email
[email protected] with any questions about the study. You may also contact the
Institutional Review Board at Georgia Southern University at (912)478-0843 or email
Voluntary Participation and Right to Withdraw: You must be at least 18 years old to
participate in this study. Participating in this study in completely voluntary. You have the right to
refuse to answer any individual questions without withdrawing from the entire study; however,
we strongly encourage you to answer all questions, since failing to do so could invalidate your
results. Again there is no penalty for deciding not to participate in the study. You may decide at
any time to discontinue the study and may withdraw without penalty or retribution.
You will be given a copy of this consent form to keep for your records. This project has been
reviewed and approved by the GSU Institutional Review Board under tracking number
H16027___.
Principal Investigator: Ashleigh Rasheed, (404) 938-2721 [email protected]
Faculty Advisor(s): Dr. Joshua Kennedy, (912) 478-7928, [email protected];
Dr. Jamie Scalera, (912) 478-4204, [email protected]
______________________ _____________________

49
Participant Signature Date
I, the undersigned, verify that the above informed consent procedure has been followed.
______________________ ______________________
Investigator Signature Date
Millen City Council Member
COLLEGE OF (College of Liberal Arts & Social Sciences)
DEPARTMENT OF (Political Science)
Georgia Southern University
Institutional Review Board
Informed Consent Form
CONSENT TO PARTICIPATE IN A Research STUDY
Title of Project: Impacts of Prisons in Rural Communities: Economic and Social Factors
Principle Investigator(s): This study will be conducted by Ashleigh Rasheed, an undergraduate
student at Georgia Southern University, under the direction of Dr. Joshua Kennedy
[email protected] and Dr. Jamie Scalera [email protected].
Purpose of Study: The purpose of this study is to examine the stigmas associated with the prison
in the community, to investigate the impact those stigmas have on the residents living in the
community. The results from this study will help determine whether or not the stigmas associated
with the prison, have enough influence to affect the local economy, in terms of job growth and
job availability in a rural community.
Procedures to be followed: Each council member will be asked to be interviewed on their
knowledge of the influence the prison has had on the economic development in Millen, Georgia.
The council members will also be asked to be interviewed on their knowledge of the impact the
prison has had on the residents living in the community. After each council member reads and
understands this informed consent form, they can then proceed with the interviewing process.
Participation in this research will include completion of answering a series of questions that are
relevant to the study.
Discomforts and Risks: There are no risks associated with your participation in this study and
we do not anticipate any discomfort.
Benefits: Although there are no direct benefits to you for participating in our study, your
participation will allow us to expand our knowledge about the impact a prison setting can have on

50
the residents living in the community. Implications of this study may also be used to better
understand the process local government officials go through when making the decision to invest
in prisons and the policies that they adopt.
Costs or Compensation: Your participation is strictly voluntary. There is no cost or
compensation associated with your participation in this study.
Duration: Approximately 30 minutes
Statement of Confidentiality: We will not be collecting your name to ensure your
confidentiality. For the purposes of the study however, we will only refer to you as council
member followed by a variable (i.e. council member X). By doing so this will allow us to be able
to reference a government official throughout our findings without having to reveal your actual
identity. The original data sheets and the electronic file with your data will be stored in a safe
location, and only those who are directly involved in the study will have access to your
information. Finally, findings from this study will be presented in aggregate form with no
identifying information other than the name given to you, to ensure your confidentiality.
Right to Ask Questions: You have the right to ask any questions during and after you participate
in this study. Participants may contact Dr. Joshua Kennedy at (912) 478-7928 or email
[email protected] or Dr. Jamie Scalera at (912) 478-4204 or email
[email protected] with any questions about the study. You may also contact the
Institutional Review Board at Georgia Southern University at (912)478-0843 or email
Voluntary Participation and Right to Withdraw: You must be at least 18 years old to
participate in this study. Participating in this study in completely voluntary. You have the right to
refuse to answer any individual questions without withdrawing from the entire study; however,
we strongly encourage you to answer all questions, since failing to do so could invalidate your
results. Again there is no penalty for deciding not to participate in the study. You may decide at
any time to discontinue the study and may withdraw without penalty or retribution.
You will be given a copy of this consent form to keep for your records. This project has been
reviewed and approved by the GSU Institutional Review Board under tracking number
H16027___.
Principal Investigator: Ashleigh Rasheed, (404) 938-2721 [email protected]
Faculty Advisor(s): Dr. Joshua Kennedy, (912) 478-7928, [email protected];
Dr. Jamie Scalera, (912) 478-4204, [email protected]
______________________ _____________________
Participant Signature Date
I, the undersigned, verify that the above informed consent procedure has been followed.

51
______________________ ______________________
Investigator Signature Date
Mayor of Millen
COLLEGE OF (College of Liberal Arts & Social Sciences)
DEPARTMENT OF (Political Science)
Georgia Southern University
Institutional Review Board
Informed Consent Form
CONSENT TO PARTICIPATE IN A Research STUDY
Title of Project: Impacts of Prisons in Rural Communities: Economic and Social Factors
Principle Investigator(s): This study will be conducted by Ashleigh Rasheed, an undergraduate
student at Georgia Southern University, under the direction of Dr. Joshua Kennedy
[email protected] and Dr. Jamie Scalera [email protected].
Purpose of Study: The purpose of this study is to examine the stigmas associated with the prison
in the community, to investigate the impact those stigmas have on the residents living in the
community. The results from this study will help determine whether or not the stigmas associated
with the prison, have enough influence to affect the local economy, in terms of job growth and
job availability in a rural community.
Procedures to be followed: The mayor will be asked to be interviewed on his knowledge of the
influence the prison has had on the economic development in Millen, Georgia. The mayor will
also be asked to be interviewed on his knowledge of the impact the prison has had on the
residents living in the community. After the mayor reads and understands this informed consent
form, he can then proceed with the interviewing process. Participation in this research will
include completion of answering a series of questions that are relevant to the study.
Discomforts and Risks: There are no risks associated with your participation in this study and
we do not anticipate any discomfort.
Benefits: Although there are no direct benefits to you for participating in our study, your
participation will allow us to expand our knowledge about the impact a prison setting can have on
the residents living in the community. Implications of this study may also be used to better
understand the process local government officials go through when making the decision to invest
in prisons and the policies that they adopt.
Costs or Compensation: Your participation is strictly voluntary. There is no cost or
compensation associated with your participation in this study.
Duration: Approximately 30 minutes

52
Statement of Confidentiality: Due to the nature of this study, concealing your identity will be
very difficult because of your political stature. What we can ensure is that the information
gathered will be stored in a safe location, and will only be accessible to those whom are directly
involved in the study. Right to Ask Questions: You have the right to ask any questions during
and after you participate in this study. Participants may contact Dr. Joshua Kennedy at (912) 478-
7928 or email [email protected] or Dr. Jamie Scalera at (912) 478-4204 or
email [email protected] with any questions about the study. You may also contact
the Institutional Review Board at Georgia Southern University at (912)478-0843 or email
Voluntary Participation and Right to Withdraw: You must be at least 18 years old to
participate in this study. Participating in this study in completely voluntary. You have the right to
refuse to answer any individual questions without withdrawing from the entire study; however,
we strongly encourage you to answer all questions, since failing to do so could invalidate your
results. Again there is no penalty for deciding not to participate in the study. You may decide at
any time to discontinue the study and may withdraw without penalty or retribution.
You will be given a copy of this consent form to keep for your records. This project has been
reviewed and approved by the GSU Institutional Review Board under tracking number
H16027___.
Principal Investigator: Ashleigh Rasheed, (404) 938-2721 [email protected]
Faculty Advisor(s): Dr. Joshua Kennedy, (912) 478-7928, [email protected];
Dr. Jamie Scalera, (912) 478-4204, [email protected]
______________________ _____________________
Participant Signature Date
I, the undersigned, verify that the above informed consent procedure has been followed.
______________________ ______________________
Investigator Signature Date

53
Appendix E:
Appendix F:
FCI ALICEVILLE (Alabama) Pickens Co 0 1 1990 0 10.8 .
FCI ALICEVILLE (Alabama) Pickens Co 0 1 1991 0 11.7 .
FCI ALICEVILLE (Alabama) Pickens Co 0 1 1992 0 13.6 .
FCI ALICEVILLE (Alabama) Pickens Co 0 1 1993 0 12.1 .
FCI ALICEVILLE (Alabama) Pickens Co 0 1 1994 0 9.7 .
FCI ALICEVILLE (Alabama) Pickens Co 0 1 1995 0 9 .
FCI ALICEVILLE (Alabama) Pickens Co 0 1 1996 0 10 .
FCI ALICEVILLE (Alabama) Pickens Co 0 1 1997 0 9.7 .
FCI ALICEVILLE (Alabama) Pickens Co 0 1 1998 0 9.7 5.2
FCI ALICEVILLE (Alabama) Pickens Co 0 1 1999 0 15 5.4
FCI ALICEVILLE (Alabama) Pickens Co 0 1 2000 0 8.8 4.1
FCI ALICEVILLE (Alabama) Pickens Co 0 1 2001 0 8.6 3.7
FCI ALICEVILLE (Alabama) Pickens Co 0 1 2002 0 8.8 4.2
FCI ALICEVILLE (Alabama) Pickens Co 0 1 2003 0 9.7 4.7
FCI ALICEVILLE (Alabama) Pickens Co 0 1 2004 0 8.6 9.2
FCI ALICEVILLE (Alabama) Pickens Co 0 1 2005 0 6.4 6.1
FCI ALICEVILLE (Alabama) Pickens Co 0 1 2006 0 6.2 4.6
FCI ALICEVILLE (Alabama) Pickens Co 0 1 2007 0 5.6 3.2
FCI ALICEVILLE (Alabama) Pickens Co 0 1 2008 0 8 1.9
FCI ALICEVILLE (Alabama) Pickens Co 0 1 2009 0 16.9 -2.5
FCI ALICEVILLE (Alabama) Pickens Co 0 1 2010 0 14.9 4.1
FCI ALICEVILLE (Alabama) Pickens Co 0 1 2011 0 13.5 3.4
FCI ALICEVILLE (Alabama) Pickens Co 0 1 2012 0 11.7 2.5
FCI ALICEVILLE (Alabama) Pickens Co 0 1 2013 1 10.4 4.1
FCI ALICEVILLE (Alabama) Pickens Co 0 1 2014 1 10 2.4
FCI ALICEVILLE (Alabama) Pickens Co 0 1 2015 1 7.8 .

54
Appendix G:
Appendix H:
FCI MENDOTA (California) Fresno Co 0 1 1990 0 9.7 .
FCI MENDOTA (California) Fresno Co 0 1 1991 0 12.2 .
FCI MENDOTA (California) Fresno Co 0 1 1992 0 14.4 .
FCI MENDOTA (California) Fresno Co 0 1 1993 0 15.1 .
FCI MENDOTA (California) Fresno Co 0 1 1994 0 13.2 .
FCI MENDOTA (California) Fresno Co 0 1 1995 0 13.4 .
FCI MENDOTA (California) Fresno Co 0 1 1996 0 11.9 .
FCI MENDOTA (California) Fresno Co 0 1 1997 0 12.6 .
FCI MENDOTA (California) Fresno Co 0 1 1998 0 14 7.1
FCI MENDOTA (California) Fresno Co 0 1 1999 0 13.3 8.6
FCI MENDOTA (California) Fresno Co 0 1 2000 0 9.9 9.4
FCI MENDOTA (California) Fresno Co 0 1 2001 0 9.8 1.3
FCI MENDOTA (California) Fresno Co 0 1 2002 0 10.7 3.9
FCI MENDOTA (California) Fresno Co 0 1 2003 0 11.2 5.9
FCI MENDOTA (California) Fresno Co 0 1 2004 0 10 7.1
FCI MENDOTA (California) Fresno Co 0 1 2005 0 8.4 7.1
FCI MENDOTA (California) Fresno Co 0 1 2006 0 7.6 6.2
FCI MENDOTA (California) Fresno Co 0 1 2007 0 8.1 4.5
FCI MENDOTA (California) Fresno Co 0 1 2008 0 9.6 2.2
FCI MENDOTA (California) Fresno Co 0 1 2009 0 14.3 -4
FCI MENDOTA (California) Fresno Co 0 1 2010 0 16 2.7
FCI MENDOTA (California) Fresno Co 0 1 2011 1 16.4 3.4
FCI MENDOTA (California) Fresno Co 0 1 2012 1 15 4.5
FCI MENDOTA (California) Fresno Co 0 1 2013 1 12.8 4.1
FCI MENDOTA (California) Fresno Co 0 1 2014 1 10.9 4.5
FCI MENDOTA (California) Fresno Co 0 1 2015 1 9.5 .
FCI VICTORVILLE MEDIUM II (California) Victorville Ct 0 1 1990 0 5.5 .
FCI VICTORVILLE MEDIUM II (California) Victorville Ct 0 1 1991 0 8.7 .
FCI VICTORVILLE MEDIUM II (California) Victorville Ct 0 1 1992 0 10.2 .
FCI VICTORVILLE MEDIUM II (California) Victorville Ct 0 1 1993 0 10.4 .
FCI VICTORVILLE MEDIUM II (California) Victorville Ct 0 1 1994 0 9.1 .
FCI VICTORVILLE MEDIUM II (California) Victorville Ct 0 1 1995 0 8.4 .
FCI VICTORVILLE MEDIUM II (California) Victorville Ct 0 1 1996 0 7.8 .
FCI VICTORVILLE MEDIUM II (California) Victorville Ct 0 1 1997 0 7 .
FCI VICTORVILLE MEDIUM II (California) Victorville Ct 0 1 1998 0 6.3 7.1
FCI VICTORVILLE MEDIUM II (California) Victorville Ct 0 1 1999 0 5.4 8.6
FCI VICTORVILLE MEDIUM II (California) Victorville Ct 0 1 2000 0 5.2 9.4
FCI VICTORVILLE MEDIUM II (California) Victorville Ct 0 1 2001 0 5.2 1.3
FCI VICTORVILLE MEDIUM II (California) Victorville Ct 0 1 2002 0 6.2 3.9
FCI VICTORVILLE MEDIUM II (California) Victorville Ct 0 1 2003 0 6.9 5.9
FCI VICTORVILLE MEDIUM II (California) Victorville Ct 0 1 2004 1 6.2 7.1
FCI VICTORVILLE MEDIUM II (California) Victorville Ct 0 1 2005 1 5.5 7.1
FCI VICTORVILLE MEDIUM II (California) Victorville Ct 0 1 2006 1 5.1 6.2
FCI VICTORVILLE MEDIUM II (California) Victorville Ct 0 1 2007 1 5.8 4.5
FCI VICTORVILLE MEDIUM II (California) Victorville Ct 0 1 2008 1 8 2.2
FCI VICTORVILLE MEDIUM II (California) Victorville Ct 0 1 2009 1 13 -4
FCI VICTORVILLE MEDIUM II (California) Victorville Ct 0 1 2010 1 13.6 2.7
FCI VICTORVILLE MEDIUM II (California) Victorville Ct 0 1 2011 1 13.4 3.4
FCI VICTORVILLE MEDIUM II (California) Victorville Ct 0 1 2012 1 12.1 4.5
FCI VICTORVILLE MEDIUM II (California) Victorville Ct 0 1 2013 1 10.3 4.1
FCI VICTORVILLE MEDIUM II (California) Victorville Ct 0 1 2014 1 8.1 4.5
FCI VICTORVILLE MEDIUM II (California) Victorville Ct 0 1 2015 1 6.5 .

55
Appendix I:
Appendix J:
FCI FLORENCE (Colorado) Fremont Co 0 1 1990 0 5.5 .
FCI FLORENCE (Colorado) Fremont Co 0 1 1991 0 5.8 .
FCI FLORENCE (Colorado) Fremont Co 0 1 1992 0 8.7 .
FCI FLORENCE (Colorado) Fremont Co 0 1 1993 0 8.7 .
FCI FLORENCE (Colorado) Fremont Co 0 1 1994 1 5.9 .
FCI FLORENCE (Colorado) Fremont Co 0 1 1995 1 5.8 .
FCI FLORENCE (Colorado) Fremont Co 0 1 1996 1 5.1 .
FCI FLORENCE (Colorado) Fremont Co 0 1 1997 1 4.4 .
FCI FLORENCE (Colorado) Fremont Co 0 1 1998 1 4.5 9.4
FCI FLORENCE (Colorado) Fremont Co 0 1 1999 1 4.1 8.9
FCI FLORENCE (Colorado) Fremont Co 0 1 2000 1 4.1 9.9
FCI FLORENCE (Colorado) Fremont Co 0 1 2001 1 4.9 3.9
FCI FLORENCE (Colorado) Fremont Co 0 1 2002 1 6.5 2.3
FCI FLORENCE (Colorado) Fremont Co 0 1 2003 1 7.7 3.3
FCI FLORENCE (Colorado) Fremont Co 0 1 2004 1 6.8 4.9
FCI FLORENCE (Colorado) Fremont Co 0 1 2005 1 6.2 8.3
FCI FLORENCE (Colorado) Fremont Co 0 1 2006 1 5.9 4.8
FCI FLORENCE (Colorado) Fremont Co 0 1 2007 1 4.7 5.2
FCI FLORENCE (Colorado) Fremont Co 0 1 2008 1 6.3 4.4
FCI FLORENCE (Colorado) Fremont Co 0 1 2009 1 8.7 -2.3
FCI FLORENCE (Colorado) Fremont Co 0 1 2010 1 11.5 3.2
FCI FLORENCE (Colorado) Fremont Co 0 1 2011 1 11.4 3.2
FCI FLORENCE (Colorado) Fremont Co 0 1 2012 1 11.6 3.8
FCI FLORENCE (Colorado) Fremont Co 0 1 2013 1 10.7 4.2
FCI FLORENCE (Colorado) Fremont Co 0 1 2014 1 8 6.4
FCI FLORENCE (Colorado) Fremont Co 0 1 2015 1 7.1 .
CI D. RAY JAMES (Georgia) Charlton Co 0 1 1990 0 4.4 .
CI D. RAY JAMES (Georgia) Charlton Co 0 1 1991 0 4.2 .
CI D. RAY JAMES (Georgia) Charlton Co 0 1 1992 0 8.4 .
CI D. RAY JAMES (Georgia) Charlton Co 0 1 1993 0 6.3 .
CI D. RAY JAMES (Georgia) Charlton Co 0 1 1994 0 5.1 .
CI D. RAY JAMES (Georgia) Charlton Co 0 1 1995 0 7.8 .
CI D. RAY JAMES (Georgia) Charlton Co 0 1 1996 0 9.8 .
CI D. RAY JAMES (Georgia) Charlton Co 0 1 1997 0 4.6 .
CI D. RAY JAMES (Georgia) Charlton Co 0 1 1998 1 5.8 8.9
CI D. RAY JAMES (Georgia) Charlton Co 0 1 1999 1 5 8.9
CI D. RAY JAMES (Georgia) Charlton Co 0 1 2000 1 4.5 6.0
CI D. RAY JAMES (Georgia) Charlton Co 0 1 2001 1 4.5 3.7
CI D. RAY JAMES (Georgia) Charlton Co 0 1 2002 1 5.6 2.3
CI D. RAY JAMES (Georgia) Charlton Co 0 1 2003 1 6.8 3.6
CI D. RAY JAMES (Georgia) Charlton Co 0 1 2004 1 5.8 5.3
CI D. RAY JAMES (Georgia) Charlton Co 0 1 2005 1 6 6.7
CI D. RAY JAMES (Georgia) Charlton Co 0 1 2006 1 5.4 4.6
CI D. RAY JAMES (Georgia) Charlton Co 0 1 2007 1 4.9 4.5
CI D. RAY JAMES (Georgia) Charlton Co 0 1 2008 1 6.7 0.2
CI D. RAY JAMES (Georgia) Charlton Co 0 1 2009 1 12.2 -1.5
CI D. RAY JAMES (Georgia) Charlton Co 0 1 2010 1 11.1 1.5
CI D. RAY JAMES (Georgia) Charlton Co 0 1 2011 1 10.9 3.0
CI D. RAY JAMES (Georgia) Charlton Co 0 1 2012 1 10.1 3.4
CI D. RAY JAMES (Georgia) Charlton Co 0 1 2013 1 9.1 4.0
CI D. RAY JAMES (Georgia) Charlton Co 0 1 2014 1 8.5 4.4
CI D. RAY JAMES (Georgia) Charlton Co 0 1 2015 1 6.9 .

56
Appendix K:
Appendix L:
FDC HONOLULU (Hawaii) Honolulu Ct 1 1 1990 0 2.7 .
FDC HONOLULU (Hawaii) Honolulu Ct 1 1 1991 0 2.5 .
FDC HONOLULU (Hawaii) Honolulu Ct 1 1 1992 0 3.3 .
FDC HONOLULU (Hawaii) Honolulu Ct 1 1 1993 0 3.5 .
FDC HONOLULU (Hawaii) Honolulu Ct 1 1 1994 0 4.7 .
FDC HONOLULU (Hawaii) Honolulu Ct 1 1 1995 0 5.1 .
FDC HONOLULU (Hawaii) Honolulu Ct 1 1 1996 0 5.7 .
FDC HONOLULU (Hawaii) Honolulu Ct 1 1 1997 0 5.6 .
FDC HONOLULU (Hawaii) Honolulu Ct 1 1 1998 0 5.8 -0.8
FDC HONOLULU (Hawaii) Honolulu Ct 1 1 1999 0 5.3 4.1
FDC HONOLULU (Hawaii) Honolulu Ct 1 1 2000 0 4.6 5.3
FDC HONOLULU (Hawaii) Honolulu Ct 1 1 2001 1 4.7 3.7
FDC HONOLULU (Hawaii) Honolulu Ct 1 1 2002 1 4.6 5.6
FDC HONOLULU (Hawaii) Honolulu Ct 1 1 2003 1 4.7 7.5
FDC HONOLULU (Hawaii) Honolulu Ct 1 1 2004 1 3.7 9.8
FDC HONOLULU (Hawaii) Honolulu Ct 1 1 2005 1 3.3 9.0
FDC HONOLULU (Hawaii) Honolulu Ct 1 1 2006 1 3.3 6.1
FDC HONOLULU (Hawaii) Honolulu Ct 1 1 2007 1 3.2 5.3
FDC HONOLULU (Hawaii) Honolulu Ct 1 1 2008 1 4.4 2.7
FDC HONOLULU (Hawaii) Honolulu Ct 1 1 2009 1 6.7 -2.2
FDC HONOLULU (Hawaii) Honolulu Ct 1 1 2010 1 6.4 3.8
FDC HONOLULU (Hawaii) Honolulu Ct 1 1 2011 1 6.3 3.4
FDC HONOLULU (Hawaii) Honolulu Ct 1 1 2012 1 6.1 3.7
FDC HONOLULU (Hawaii) Honolulu Ct 1 1 2013 1 4.8 3.4
FDC HONOLULU (Hawaii) Honolulu Ct 1 1 2014 1 4.6 3.1
FDC HONOLULU (Hawaii) Honolulu Ct 1 1 2015 1 4.1 .
FCI PEKIN (Illinois) Tazewell Ct 1 1 1990 0 4.7 .
FCI PEKIN (Illinois) Tazewell Ct 1 1 1991 0 5.9 .
FCI PEKIN (Illinois) Tazewell Ct 1 1 1992 0 7 .
FCI PEKIN (Illinois) Tazewell Ct 1 1 1993 0 6 .
FCI PEKIN (Illinois) Tazewell Ct 1 1 1994 1 4.4 .
FCI PEKIN (Illinois) Tazewell Ct 1 1 1995 1 3.7 .
FCI PEKIN (Illinois) Tazewell Ct 1 1 1996 1 5.8 .
FCI PEKIN (Illinois) Tazewell Ct 1 1 1997 1 3.5 .
FCI PEKIN (Illinois) Tazewell Ct 1 1 1998 1 3 4.9
FCI PEKIN (Illinois) Tazewell Ct 1 1 1999 1 3.7 5.1
FCI PEKIN (Illinois) Tazewell Ct 1 1 2000 1 3.6 5.8
FCI PEKIN (Illinois) Tazewell Ct 1 1 2001 1 4.2 2.2
FCI PEKIN (Illinois) Tazewell Ct 1 1 2002 1 5.3 2.0
FCI PEKIN (Illinois) Tazewell Ct 1 1 2003 1 6.1 3.4
FCI PEKIN (Illinois) Tazewell Ct 1 1 2004 1 5.4 5.5
FCI PEKIN (Illinois) Tazewell Ct 1 1 2005 1 4.5 4.9
FCI PEKIN (Illinois) Tazewell Ct 1 1 2006 1 3.8 5.9
FCI PEKIN (Illinois) Tazewell Ct 1 1 2007 1 4.2 4.0
FCI PEKIN (Illinois) Tazewell Ct 1 1 2008 1 5.3 -0.1
FCI PEKIN (Illinois) Tazewell Ct 1 1 2009 1 10.7 -0.9
FCI PEKIN (Illinois) Tazewell Ct 1 1 2010 1 9.7 2.0
FCI PEKIN (Illinois) Tazewell Ct 1 1 2011 1 8.4 3.9
FCI PEKIN (Illinois) Tazewell Ct 1 1 2012 1 7.5 4.4
FCI PEKIN (Illinois) Tazewell Ct 1 1 2013 1 8.9 2.0
FCI PEKIN (Illinois) Tazewell Ct 1 1 2014 1 6.6 2.9
FCI PEKIN (Illinois) Tazewell Ct 1 1 2015 1 5.5 .

57
Appendix M:
Appendix N:
USP BIG SANDY (Kentucky) Martin Co 0 1 1990 0 7.6 .
USP BIG SANDY (Kentucky) Martin Co 0 1 1991 0 12.5 .
USP BIG SANDY (Kentucky) Martin Co 0 1 1992 0 12.4 .
USP BIG SANDY (Kentucky) Martin Co 0 1 1993 0 12.1 .
USP BIG SANDY (Kentucky) Martin Co 0 1 1994 0 9.3 .
USP BIG SANDY (Kentucky) Martin Co 0 1 1995 0 15.7 .
USP BIG SANDY (Kentucky) Martin Co 0 1 1996 0 16.1 .
USP BIG SANDY (Kentucky) Martin Co 0 1 1997 0 10.3 .
USP BIG SANDY (Kentucky) Martin Co 0 1 1998 0 10.9 4.5
USP BIG SANDY (Kentucky) Martin Co 0 1 1999 0 15.7 5.5
USP BIG SANDY (Kentucky) Martin Co 0 1 2000 0 7.5 -0.7
USP BIG SANDY (Kentucky) Martin Co 0 1 2001 0 6.1 3.3
USP BIG SANDY (Kentucky) Martin Co 0 1 2002 0 7.5 4.2
USP BIG SANDY (Kentucky) Martin Co 0 1 2003 1 9.3 3.9
USP BIG SANDY (Kentucky) Martin Co 0 1 2004 1 8.1 5.6
USP BIG SANDY (Kentucky) Martin Co 0 1 2005 1 8 6.0
USP BIG SANDY (Kentucky) Martin Co 0 1 2006 1 8.1 5.7
USP BIG SANDY (Kentucky) Martin Co 0 1 2007 1 8.7 2.1
USP BIG SANDY (Kentucky) Martin Co 0 1 2008 1 8.4 2.5
USP BIG SANDY (Kentucky) Martin Co 0 1 2009 1 12.4 -1.8
USP BIG SANDY (Kentucky) Martin Co 0 1 2010 1 10.2 6.2
USP BIG SANDY (Kentucky) Martin Co 0 1 2011 1 9.3 4.0
USP BIG SANDY (Kentucky) Martin Co 0 1 2012 1 9.3 3.4
USP BIG SANDY (Kentucky) Martin Co 0 1 2013 1 10.6 2.7
USP BIG SANDY (Kentucky) Martin Co 0 1 2014 1 9 2.7
USP BIG SANDY (Kentucky) Martin Co 0 1 2015 1 8 .
FCI POLLOCK (Louisiana) Grant Parish Co 1 1 1990 0 7 .
FCI POLLOCK (Louisiana) Grant Parish Co 1 1 1991 0 9.8 .
FCI POLLOCK (Louisiana) Grant Parish Co 1 1 1992 0 11.4 .
FCI POLLOCK (Louisiana) Grant Parish Co 1 1 1993 0 7.4 .
FCI POLLOCK (Louisiana) Grant Parish Co 1 1 1994 0 13 .
FCI POLLOCK (Louisiana) Grant Parish Co 1 1 1995 0 11.1 .
FCI POLLOCK (Louisiana) Grant Parish Co 1 1 1996 0 11.9 .
FCI POLLOCK (Louisiana) Grant Parish Co 1 1 1997 0 11.3 .
FCI POLLOCK (Louisiana) Grant Parish Co 1 1 1998 0 10 2.9
FCI POLLOCK (Louisiana) Grant Parish Co 1 1 1999 0 7.8 4.7
FCI POLLOCK (Louisiana) Grant Parish Co 1 1 2000 0 7.4 5.5
FCI POLLOCK (Louisiana) Grant Parish Co 1 1 2001 0 7.4 4.5
FCI POLLOCK (Louisiana) Grant Parish Co 1 1 2002 0 8 1.1
FCI POLLOCK (Louisiana) Grant Parish Co 1 1 2003 0 10.2 11.1
FCI POLLOCK (Louisiana) Grant Parish Co 1 1 2004 0 8.4 9.6
FCI POLLOCK (Louisiana) Grant Parish Co 1 1 2005 0 7.8 16.1
FCI POLLOCK (Louisiana) Grant Parish Co 1 1 2006 0 4.6 3.7
FCI POLLOCK (Louisiana) Grant Parish Co 1 1 2007 1 6.1 0.9
FCI POLLOCK (Louisiana) Grant Parish Co 1 1 2008 1 5.8 4.3
FCI POLLOCK (Louisiana) Grant Parish Co 1 1 2009 1 9 -3.7
FCI POLLOCK (Louisiana) Grant Parish Co 1 1 2010 1 9.6 10.6
FCI POLLOCK (Louisiana) Grant Parish Co 1 1 2011 1 9.6 3.7
FCI POLLOCK (Louisiana) Grant Parish Co 1 1 2012 1 9.5 3.7
FCI POLLOCK (Louisiana) Grant Parish Co 1 1 2013 1 9.1 -1.6
FCI POLLOCK (Louisiana) Grant Parish Co 1 1 2014 1 8.2 1.9
FCI POLLOCK (Louisiana) Grant Parish Co 1 1 2015 1 8.3 .

58
Appendix O:
Appendix P:
FCI CUMBERLAND (Maryland) Allegany Co 1 1 1990 0 11.4 .
FCI CUMBERLAND (Maryland) Allegany Co 1 1 1991 0 12.2 .
FCI CUMBERLAND (Maryland) Allegany Co 1 1 1992 0 14.8 .
FCI CUMBERLAND (Maryland) Allegany Co 1 1 1993 0 12.8 .
FCI CUMBERLAND (Maryland) Allegany Co 1 1 1994 1 9.8 .
FCI CUMBERLAND (Maryland) Allegany Co 1 1 1995 1 9.4 .
FCI CUMBERLAND (Maryland) Allegany Co 1 1 1996 1 9 .
FCI CUMBERLAND (Maryland) Allegany Co 1 1 1997 1 10.1 .
FCI CUMBERLAND (Maryland) Allegany Co 1 1 1998 1 8.3 6.5
FCI CUMBERLAND (Maryland) Allegany Co 1 1 1999 1 7 6.2
FCI CUMBERLAND (Maryland) Allegany Co 1 1 2000 1 6 6.0
FCI CUMBERLAND (Maryland) Allegany Co 1 1 2001 1 6.3 6.9
FCI CUMBERLAND (Maryland) Allegany Co 1 1 2002 1 6.6 5.9
FCI CUMBERLAND (Maryland) Allegany Co 1 1 2003 1 6.1 5.2
FCI CUMBERLAND (Maryland) Allegany Co 1 1 2004 1 6.3 7.7
FCI CUMBERLAND (Maryland) Allegany Co 1 1 2005 1 6.1 7.0
FCI CUMBERLAND (Maryland) Allegany Co 1 1 2006 1 5.9 5.1
FCI CUMBERLAND (Maryland) Allegany Co 1 1 2007 1 5 4.4
FCI CUMBERLAND (Maryland) Allegany Co 1 1 2008 1 5.6 2.8
FCI CUMBERLAND (Maryland) Allegany Co 1 1 2009 1 8.9 1.8
FCI CUMBERLAND (Maryland) Allegany Co 1 1 2010 1 9.3 3.5
FCI CUMBERLAND (Maryland) Allegany Co 1 1 2011 1 9.3 2.8
FCI CUMBERLAND (Maryland) Allegany Co 1 1 2012 1 9.2 2.3
FCI CUMBERLAND (Maryland) Allegany Co 1 1 2013 1 8.5 2.7
FCI CUMBERLAND (Maryland) Allegany Co 1 1 2014 1 7.6 2.7
FCI CUMBERLAND (Maryland) Allegany Co 1 1 2015 1 7.4 .
FCI WASECA (Minnesota) Waseca Co 0 1 1990 0 3.8 .
FCI WASECA (Minnesota) Waseca Co 0 1 1991 0 4.7 .
FCI WASECA (Minnesota) Waseca Co 0 1 1992 0 5.1 .
FCI WASECA (Minnesota) Waseca Co 0 1 1993 0 5.7 .
FCI WASECA (Minnesota) Waseca Co 0 1 1994 0 4.4 .
FCI WASECA (Minnesota) Waseca Co 0 1 1995 1 3.6 .
FCI WASECA (Minnesota) Waseca Co 0 1 1996 1 4.3 .
FCI WASECA (Minnesota) Waseca Co 0 1 1997 1 3.1 .
FCI WASECA (Minnesota) Waseca Co 0 1 1998 1 2.9 6.8
FCI WASECA (Minnesota) Waseca Co 0 1 1999 1 3.2 5.4
FCI WASECA (Minnesota) Waseca Co 0 1 2000 1 3 9.0
FCI WASECA (Minnesota) Waseca Co 0 1 2001 1 3.7 2.8
FCI WASECA (Minnesota) Waseca Co 0 1 2002 1 4.6 3.9
FCI WASECA (Minnesota) Waseca Co 0 1 2003 1 4.7 5.8
FCI WASECA (Minnesota) Waseca Co 0 1 2004 1 4.6 6.3
FCI WASECA (Minnesota) Waseca Co 0 1 2005 1 4.4 5.6
FCI WASECA (Minnesota) Waseca Co 0 1 2006 1 4.1 2.6
FCI WASECA (Minnesota) Waseca Co 0 1 2007 1 4.8 3.3
FCI WASECA (Minnesota) Waseca Co 0 1 2008 1 5.4 2.4
FCI WASECA (Minnesota) Waseca Co 0 1 2009 1 8.2 -2.1
FCI WASECA (Minnesota) Waseca Co 0 1 2010 1 7.5 5.0
FCI WASECA (Minnesota) Waseca Co 0 1 2011 1 6.3 4.6
FCI WASECA (Minnesota) Waseca Co 0 1 2012 1 5.8 3.6
FCI WASECA (Minnesota) Waseca Co 0 1 2013 1 5.5 3.9
FCI WASECA (Minnesota) Waseca Co 0 1 2014 1 4.7 2.9
FCI WASECA (Minnesota) Waseca Co 0 1 2015 1 4.4 .

59
Appendix Q:
Appendix R:
FCI BERLIN (New Hampshire) Coos Co 0 1 1990 0 6.5 .
FCI BERLIN (New Hampshire) Coos Co 0 1 1991 0 8.4 .
FCI BERLIN (New Hampshire) Coos Co 0 1 1992 0 10.4 .
FCI BERLIN (New Hampshire) Coos Co 0 1 1993 0 9.1 .
FCI BERLIN (New Hampshire) Coos Co 0 1 1994 0 7.0 .
FCI BERLIN (New Hampshire) Coos Co 0 1 1995 0 6.4 .
FCI BERLIN (New Hampshire) Coos Co 0 1 1996 0 6.6 .
FCI BERLIN (New Hampshire) Coos Co 0 1 1997 0 5.3 .
FCI BERLIN (New Hampshire) Coos Co 0 1 1998 0 3.9 5.7
FCI BERLIN (New Hampshire) Coos Co 0 1 1999 0 4.1 2.6
FCI BERLIN (New Hampshire) Coos Co 0 1 2000 0 3.6 7.0
FCI BERLIN (New Hampshire) Coos Co 0 1 2001 0 5.3 2.3
FCI BERLIN (New Hampshire) Coos Co 0 1 2002 0 6.6 5.2
FCI BERLIN (New Hampshire) Coos Co 0 1 2003 0 5.2 5.8
FCI BERLIN (New Hampshire) Coos Co 0 1 2004 0 4.5 5.7
FCI BERLIN (New Hampshire) Coos Co 0 1 2005 0 4.1 5.6
FCI BERLIN (New Hampshire) Coos Co 0 1 2006 0 4.2 4.2
FCI BERLIN (New Hampshire) Coos Co 0 1 2007 0 4.6 2.6
FCI BERLIN (New Hampshire) Coos Co 0 1 2008 0 5.2 0.0
FCI BERLIN (New Hampshire) Coos Co 0 1 2009 0 8.0 1.1
FCI BERLIN (New Hampshire) Coos Co 0 1 2010 0 7.2 3.7
FCI BERLIN (New Hampshire) Coos Co 0 1 2011 0 7.2 2.2
FCI BERLIN (New Hampshire) Coos Co 0 1 2012 1 7.5 3.5
FCI BERLIN (New Hampshire) Coos Co 0 1 2013 1 6.2 3.3
FCI BERLIN (New Hampshire) Coos Co 0 1 2014 1 5.8 4.1
FCI BERLIN (New Hampshire) Coos Co 0 1 2015 1 4.9 .
CI CIBOLA COUNTY (New Mexico) Milan Ct 0 0 1990 0 13 .
CI CIBOLA COUNTY (New Mexico) Milan Ct 0 0 1991 0 13.7 .
CI CIBOLA COUNTY (New Mexico) Milan Ct 0 0 1992 0 13.3 .
CI CIBOLA COUNTY (New Mexico) Milan Ct 0 0 1993 1 12.1 .
CI CIBOLA COUNTY (New Mexico) Milan Ct 0 0 1994 1 10.3 .
CI CIBOLA COUNTY (New Mexico) Milan Ct 0 0 1995 1 1910.3 .
CI CIBOLA COUNTY (New Mexico) Milan Ct 0 0 1996 1 13.4 .
CI CIBOLA COUNTY (New Mexico) Milan Ct 0 0 1997 1 10.7 .
CI CIBOLA COUNTY (New Mexico) Milan Ct 0 0 1998 1 8.6 -3.7
CI CIBOLA COUNTY (New Mexico) Milan Ct 0 0 1999 1 7.8 5.3
CI CIBOLA COUNTY (New Mexico) Milan Ct 0 0 2000 1 6.8 4.5
CI CIBOLA COUNTY (New Mexico) Milan Ct 0 0 2001 1 6.1 2.3
CI CIBOLA COUNTY (New Mexico) Milan Ct 0 0 2002 1 6.4 3.4
CI CIBOLA COUNTY (New Mexico) Milan Ct 0 0 2003 1 6.2 8.0
CI CIBOLA COUNTY (New Mexico) Milan Ct 0 0 2004 1 5.7 10.3
CI CIBOLA COUNTY (New Mexico) Milan Ct 0 0 2005 1 5.6 5.6
CI CIBOLA COUNTY (New Mexico) Milan Ct 0 0 2006 1 4.5 4.7
CI CIBOLA COUNTY (New Mexico) Milan Ct 0 0 2007 1 4.2 3.9
CI CIBOLA COUNTY (New Mexico) Milan Ct 0 0 2008 1 4.6 4.6
CI CIBOLA COUNTY (New Mexico) Milan Ct 0 0 2009 1 6.9 -3.6
CI CIBOLA COUNTY (New Mexico) Milan Ct 0 0 2010 1 9.5 3.5
CI CIBOLA COUNTY (New Mexico) Milan Ct 0 0 2011 1 9 3.3
CI CIBOLA COUNTY (New Mexico) Milan Ct 0 0 2012 1 8.1 1.7
CI CIBOLA COUNTY (New Mexico) Milan Ct 0 0 2013 1 8 3.0
CI CIBOLA COUNTY (New Mexico) Milan Ct 0 0 2014 1 8 2.3
CI CIBOLA COUNTY (New Mexico) Milan Ct 0 0 2015 1 7.8 .

60
Appendix S:
Appendix T:
CI RIVERS (North Carolina) Winton Ct 0 0 1990 0 5.8 .
CI RIVERS (North Carolina) Winton Ct 0 0 1991 0 8.7 .
CI RIVERS (North Carolina) Winton Ct 0 0 1992 0 9.5 .
CI RIVERS (North Carolina) Winton Ct 0 0 1993 0 9.5 .
CI RIVERS (North Carolina) Winton Ct 0 0 1994 0 6.9 .
CI RIVERS (North Carolina) Winton Ct 0 0 1995 0 5.7 .
CI RIVERS (North Carolina) Winton Ct 0 0 1996 0 5.7 .
CI RIVERS (North Carolina) Winton Ct 0 0 1997 0 5.1 .
CI RIVERS (North Carolina) Winton Ct 0 0 1998 0 4.4 4.9
CI RIVERS (North Carolina) Winton Ct 0 0 1999 0 3.9 8.0
CI RIVERS (North Carolina) Winton Ct 0 0 2000 0 5.1 5.1
CI RIVERS (North Carolina) Winton Ct 0 0 2001 1 7.1 5.3
CI RIVERS (North Carolina) Winton Ct 0 0 2002 1 7.1 3.5
CI RIVERS (North Carolina) Winton Ct 0 0 2003 1 6.1 4.0
CI RIVERS (North Carolina) Winton Ct 0 0 2004 1 5.8 6.0
CI RIVERS (North Carolina) Winton Ct 0 0 2005 1 5.9 7.6
CI RIVERS (North Carolina) Winton Ct 0 0 2006 1 5.5 8.0
CI RIVERS (North Carolina) Winton Ct 0 0 2007 1 5.2 2.4
CI RIVERS (North Carolina) Winton Ct 0 0 2008 1 6.6 2.9
CI RIVERS (North Carolina) Winton Ct 0 0 2009 1 9.6 0.8
CI RIVERS (North Carolina) Winton Ct 0 0 2010 1 10.6 2.8
CI RIVERS (North Carolina) Winton Ct 0 0 2011 1 11.3 2.7
CI RIVERS (North Carolina) Winton Ct 0 0 2012 1 10.7 2.9
CI RIVERS (North Carolina) Winton Ct 0 0 2013 1 9.3 4.8
CI RIVERS (North Carolina) Winton Ct 0 0 2014 1 7.2 3.4
CI RIVERS (North Carolina) Winton Ct 0 0 2015 1 7 .
USP LEE (Virginia) Lee Co 0 1 1990 0 9.5 .
USP LEE (Virginia) Lee Co 0 1 1991 0 10.5 .
USP LEE (Virginia) Lee Co 0 1 1992 0 14.5 .
USP LEE (Virginia) Lee Co 0 1 1993 0 11.2 .
USP LEE (Virginia) Lee Co 0 1 1994 0 10.4 .
USP LEE (Virginia) Lee Co 0 1 1995 0 11.7 .
USP LEE (Virginia) Lee Co 0 1 1996 0 11.9 .
USP LEE (Virginia) Lee Co 0 1 1997 0 9.0 .
USP LEE (Virginia) Lee Co 0 1 1998 0 8.0 6.9
USP LEE (Virginia) Lee Co 0 1 1999 0 8.8 7.6
USP LEE (Virginia) Lee Co 0 1 2000 0 4.2 7.0
USP LEE (Virginia) Lee Co 0 1 2001 0 5.0 5.7
USP LEE (Virginia) Lee Co 0 1 2002 1 5.7 2.7
USP LEE (Virginia) Lee Co 0 1 2003 1 6.0 5.9
USP LEE (Virginia) Lee Co 0 1 2004 1 5.7 6.7
USP LEE (Virginia) Lee Co 0 1 2005 1 5.1 8.6
USP LEE (Virginia) Lee Co 0 1 2006 1 4.4 5.5
USP LEE (Virginia) Lee Co 0 1 2007 1 4.2 3.8
USP LEE (Virginia) Lee Co 0 1 2008 1 5.3 1.9
USP LEE (Virginia) Lee Co 0 1 2009 1 7.2 2.6
USP LEE (Virginia) Lee Co 0 1 2010 1 7.9 3.4
USP LEE (Virginia) Lee Co 0 1 2011 1 7.6 1.9
USP LEE (Virginia) Lee Co 0 1 2012 1 8.3 2.9
USP LEE (Virginia) Lee Co 0 1 2013 1 8.8 2.3
USP LEE (Virginia) Lee Co 0 1 2014 1 8.2 1.9
USP LEE (Virginia) Lee Co 0 1 2015 1 7.3 .
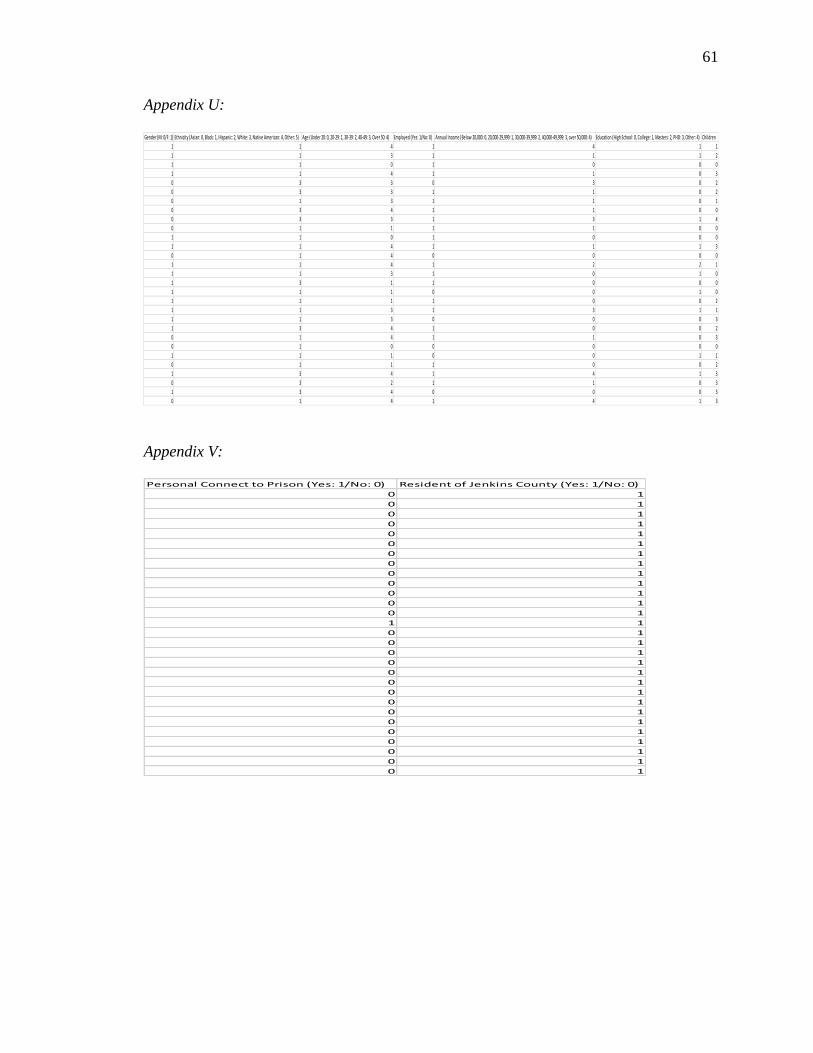
61
Appendix U:
Appendix V:
Gender (M: 0/F: 1) Ethnicity (Asian: 0, Black: 1, Hispanic: 2, White: 3, Native American: 4, Other: 5) Age (Under 20: 0, 20-29: 1, 30-39: 2, 40-49: 3, Over 50: 4) Employed (Yes: 1/No: 0) Annual Income (Below 20,000: 0, 20,000-29,999: 1, 30,000-39,999: 2, 40,000-49,999: 3, over 50,000: 4) Education (High School: 0, College: 1, Masters: 2, PHD: 3, Other: 4) Children
1 1 4 1 4 1 1
1 1 3 1 1 1 2
1 1 0 1 0 0 0
1 1 4 1 1 0 3
0 3 3 0 3 0 2
0 3 3 1 1 0 2
0 1 3 1 1 0 1
0 3 4 1 1 0 0
0 3 3 1 3 1 4
0 1 1 1 1 0 0
1 1 0 1 0 0 0
1 1 4 1 1 1 3
0 1 4 0 0 0 0
1 1 4 1 2 2 1
1 1 3 1 0 1 0
1 3 1 1 0 0 0
1 1 1 0 0 1 0
1 1 1 1 0 0 2
1 1 3 1 3 1 1
1 1 3 0 0 0 3
1 3 4 1 0 0 2
0 1 4 1 1 0 3
0 1 0 0 0 0 0
1 1 1 0 0 1 1
0 1 1 1 0 0 2
1 3 4 1 4 1 3
0 3 2 1 1 0 3
1 3 4 0 0 0 3
0 1 4 1 4 1 3
Personal Connect to Prison (Yes: 1/No: 0) Resident of Jenkins County (Yes: 1/No: 0)
0 1
0 1
0 1
0 1
0 1
0 1
0 1
0 1
0 1
0 1
0 1
0 1
0 1
1 1
0 1
0 1
0 1
0 1
0 1
0 1
0 1
0 1
0 1
0 1
0 1
0 1
0 1
0 1
0 1
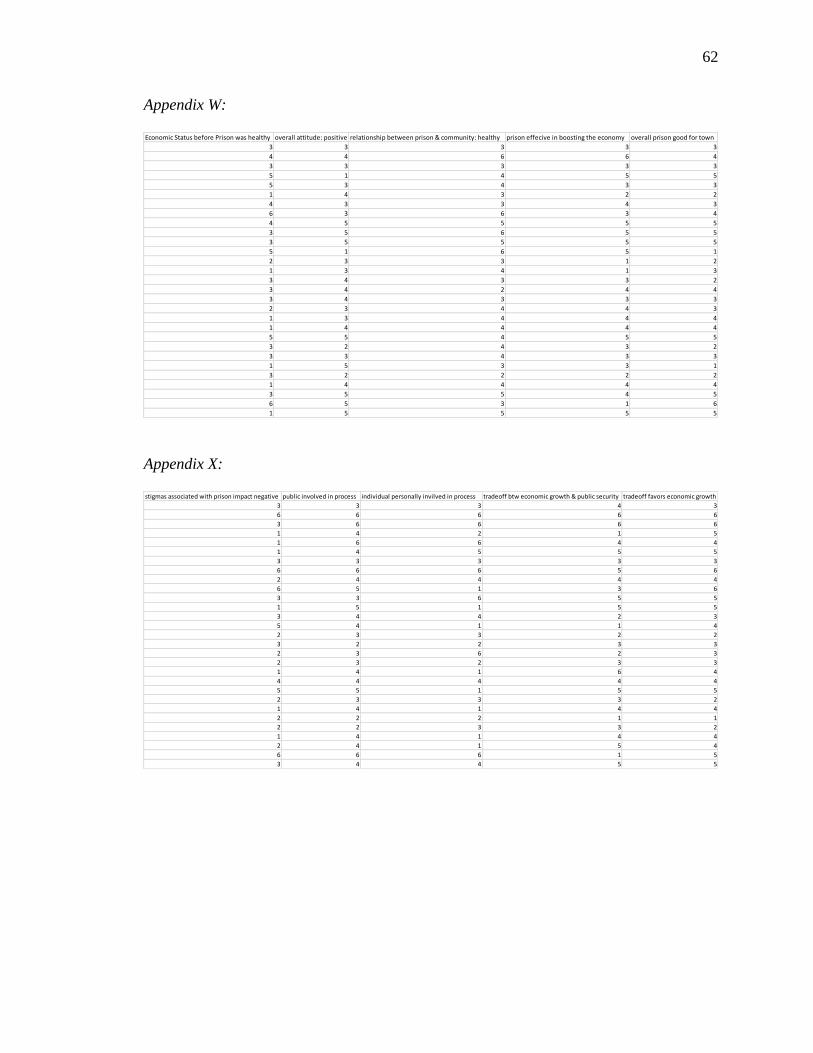
62
Appendix W:
Appendix X:
Economic Status before Prison was healthy overall attitude: positive relationship between prison & community: healthy prison effecive in boosting the economy overall prison good for town
3 3 3 3 3
4 4 6 6 4
3 3 3 3 3
5 1 4 5 5
5 3 4 3 3
1 4 3 2 2
4 3 3 4 3
6 3 6 3 4
4 5 5 5 5
3 5 6 5 5
3 5 5 5 5
5 1 6 5 1
2 3 3 1 2
1 3 4 1 3
3 4 3 3 2
3 4 2 4 4
3 4 3 3 3
2 3 4 4 3
1 3 4 4 4
1 4 4 4 4
5 5 4 5 5
3 2 4 3 2
3 3 4 3 3
1 5 3 3 1
3 2 2 2 2
1 4 4 4 4
3 5 5 4 5
6 5 3 1 6
1 5 5 5 5
stigmas associated with prison impact negative public involved in process individual personally invilved in process tradeoff btw economic growth & public security tradeoff favors economic growth
3 3 3 4 3
6 6 6 6 6
3 6 6 6 6
1 4 2 1 5
1 6 6 4 4
1 4 5 5 5
3 3 3 3 3
6 6 6 5 6
2 4 4 4 4
6 5 1 3 6
3 3 6 5 5
1 5 1 5 5
3 4 4 2 3
5 4 1 1 4
2 3 3 2 2
3 2 2 3 3
2 3 6 2 3
2 3 2 3 3
1 4 1 6 4
4 4 4 4 4
5 5 1 5 5
2 3 3 3 2
1 4 1 4 4
2 2 2 1 1
2 2 3 3 2
1 4 1 4 4
2 4 1 5 4
6 6 6 1 5
3 4 4 5 5

63
Appendix Y:
Appendix Z:
_cons 4.682065 .4474872 10.46 0.000 3.801042 5.563087
PrisonTypePrivate0Public .1315182 .4218188 0.31 0.755 -.698968 .9620044
Siting -.8130819 .3540801 -2.30 0.022 -1.510203 -.1159612
GDP Coef. Std. Err. t P>|t| [95% Conf. Interval]
Total 2022.12783 271 7.46172629 Root MSE = 2.7149
Adj R-squared = 0.0122
Residual 1982.71958 269 7.37070475 R-squared = 0.0195
Model 39.4082485 2 19.7041243 Prob > F = 0.0709
F(2, 269) = 2.67
Source SS df MS Number of obs = 272
_cons 28.81806 11.62051 2.48 0.014 5.975343 51.66078
PrisonTypePrivate0Public -24.87154 11.67923 -2.13 0.034 -47.82969 -1.913392
Siting 7.109316 9.137818 0.78 0.437 -10.85312 25.07175
UnemploymentRate Coef. Std. Err. t P>|t| [95% Conf. Interval]
Total 3614724.39 415 8710.17926 Root MSE = 92.976
Adj R-squared = 0.0075
Residual 3570155.81 413 8644.44507 R-squared = 0.0123
Model 44568.5801 2 22284.2901 Prob > F = 0.0772
F(2, 413) = 2.58
Source SS df MS Number of obs = 416

64
Appendix AA:
Appendix AB:
Appendix AC:
99% 6 6 Kurtosis 2.420771
95% 6 6 Skewness -.3326441
90% 6 6 Variance 1.757471
75% 5 6
Largest Std. Dev. 1.325697
50% 4 Mean 4.033333
25% 3 2 Sum of Wgt. 30
10% 2 2 Obs 30
5% 2 2
1% 1 1
Percentiles Smallest
tradeoff favors economic growth