Embed Size (px)
Citation preview

Impacts of urbanisation on native bird
communities
Dayna Will
Supervisors: Associate Professor Phillip Cassey and Dr Steven Delean
Submitted in partial fulfilment of the requirements for the degree of Bachelor of Science
(Honours), School of Biological Sciences, Department of Ecology and Evolutionary Biology,
The University of Adelaide November 2020

i
Table of Contents
Declaration ....................................................................................................................... iii
Acknowledgements .......................................................................................................... iv
Abstract.............................................................................................................................. v
1. Introduction ................................................................................................................... 1
1.1 Global urbanisation is one of the greatest contributors to anthropogenic
environmental change ..................................................................................................... 1
1.2 Impacts of urbanisation on the native environment .................................................. 2
1.3 Anthropogenic pressure of urbanisation in Australia ............................................... 3
1.4 Birds as an effective bioindicator for determining the impacts of urbanisation ....... 5
1.5 Urbanisation has adversely impacted Australian avifauna ....................................... 6
1.6 Study aims................................................................................................................. 8
2. Methods.......................................................................................................................... 9
2.1 Research area ............................................................................................................ 9
2.2 Collating and analysing bird surveys conducted in metropolitan Adelaide ........... 11
2.21 Synthetic data analysis of bird surveys ............................................................. 11
2.22 Bird Atlas of South Australia ............................................................................ 12
2.3 Data cleaning and quality assessments ................................................................... 13
2.31 Refining the species list ..................................................................................... 15
2.4 Spatial data .............................................................................................................. 16
2.41 SA Vegetation Land Cover ............................................................................... 16
2.42 Demographic data for LGAs ............................................................................. 18
2.5 Temporal diversity indices to measure community change.................................... 19
2.51 Temporal Turnover ............................................................................................ 19
2.52 Community Abundance turnover ...................................................................... 20
2.6 Visualising and analysing multivariate patterns in species presence-absence ....... 21
2.61 Multivariate analysis ......................................................................................... 21
2.62 Model-based analysis ........................................................................................ 21
2.7 Changes in Species Abundance .............................................................................. 22
2.71 Multivariate Analysis ........................................................................................ 22
2.72 Model-based analysis ........................................................................................ 22
3. Results .......................................................................................................................... 23
3.1 Changes in urbanisation .......................................................................................... 23

ii
3.2 Temporal turnover of bird communities ................................................................. 24
3.3 Changes in species abundance ................................................................................ 29
4. Discussion .................................................................................................................... 32
4.1 Utilising bird communities to analyse the impacts of urban growth ...................... 33
4.2 Analysing what species have undergone changes due to urban growth ................. 34
4.3 Practical methods to increase the diversity of native bird communities ................. 35
4.4 Future directions ..................................................................................................... 36
4.5 Conclusion .............................................................................................................. 37
References ........................................................................................................................ 38
Appendices .......................................................................................................................... i
A. Species List ................................................................................................................. i
B. Removed Species Names ....................................................................................... viii
C. Refined Species List & Foraging Guilds/Zones........................................................ ix
D. Species Richness ..................................................................................................... xvi
E. SA Land Cover – Urbanisation ............................................................................... xvi
F. SA Land Cover – Native vegetation ....................................................................... xvii
G. Population and Dwellings ....................................................................................... xix
H. Temporal Turnover ................................................................................................ xxii
I. Species Abundance ................................................................................................. xxiv
J. Species presence/absence: Multivariate analysis .................................................. xxvii
K. Species presence-absence: Model-based analysis ................................................ xxix
L. Species abundance – multivariate analysis ............................................................ xxx
M. Species abundance – model................................................................................. xxxii

iii
Declaration
I certify that this work contains no material which has been accepted for the award of any
other degree or diploma in my name, in any university or other tertiary institution and, to the
best of my knowledge and belief, contains no material previously published or written by
another person, except where due reference has been made in the text. In addition, I certify that
no part of this work will, in the future, be used in a submission in my name, for any other
degree or diploma in any university or other tertiary institution without the prior approval of
the University of Adelaide and where applicable, any partner institution responsible for the
joint-award of this degree.
I acknowledge that copyright of published works contained within this thesis resides with
the copyright holder(s) of those works.
I also give permission for the digital version of my thesis to be made available on the web,
via the University’s digital research repository, the Library Search and also through web search
engines, unless permission has been granted by the University to restrict access for a period of
time.
Dayna L Will
November 2020

iv
Acknowledgements
Ngadlu Kaurna miyurna tampinthi. Parna yarta mathanya puki-unangku. Ngadlu
tampinthi Kaurna miyurna puru purruna. Pangkarra Wama Kaurna, Kaurnakunti yarta.
We acknowledge the Kaurna people as the traditional owners of this land. We
acknowledge their living culture and unique role in the life of this region.
We also acknowledge the Kaurna people as the custodians of the Adelaide region and
respect their cultural heritage, beliefs, and relationship with the land.
I would like to sincerely thank my supervisors Phill Cassey and Steven Delean for all their
support and feedback through this challenging year. Phill gave me the opportunity to work on
this compelling project, providing me with skills I will utilise throughout the rest of my career.
Steven provided tremendous statistical analysis support, and overall support throughout my
project. I was extremely fortunate to be under two exceptionally knowledgeable supervisors
who have made this year exceptionally fulfilling.
I wish to thank David Paton for allowing me access to both his Bird Atlas datasets. My
research was based up these datasets, and would not have been able to be conducted without
them.
Lastly, I wish to thank the Invasion Science and Wildlife Ecology Group, my fellow
Honours students, my partner, family, and friends for their continued support this year.

v
Abstract
Urbanisation is the concentrated human presence in industrial and residential settings and
its associated effects on natural landscapes. The process of urbanisation is an extreme form of
land-use intensification causing the eradication and fragmentation of native vegetation, and
alongside climate change is considered one of the largest threats to wildlife globally.
Determining the composition of bird species as an indicator of biodiversity loss triggered by
urbanisation is crucial for understanding the impacts urbanisation has already caused. These
results will allow for urban strategies to be implemented that prevent any further destruction,
whilst also contributing to the conservation of the native environment.
Here I present the analysis of historical bird species composition in metropolitan Adelaide
to determine whether there is a relationship between changes in bird communities and urban
land use. Bird atlas data was sourced to compare bird communities between two time periods
30 years apart (labelled the 1980’s and 2010’s), within the Adelaide metropolitan region.
Spatial data of population and dwelling counts were utilised to determine the relative increase
in urbanisation for 16 Local Government Areas (LGAs) to evaluate the correlation of urban
growth changes with bird species compositions in metropolitan Adelaide. Changes in bird
species abundance significantly increased as relative dwellings increased. To measure and
understand which key species contributed to this temporal compositional change, I used a
multivariate analysis that identified 26 species that had undergone a significant change in
abundance since the 1980’s.
My study provides an insightful and reproducible analysis of historical bird survey data,
creating a format that allows monitoring of temporal abundance and changes of bird species
and their distributions. This analysis will assist in developing a detailed insight into the impacts
of urbanisation in metropolitan Adelaide. Furthermore, this knowledge can underpin urban
planning strategies that are effective and contribute to conserving not only bird species, but
entire ecosystems in metropolitan Adelaide.

1
1. Introduction
1.1 Global urbanisation is one of the greatest contributors to anthropogenic
environmental change
Biodiversity is declining at an alarming rate, and our planet is currently in the midst of the
Anthropocene; a human-induced mass extinction (Barnosky et al. 2011). This decline is
primarily a result of the rapid increase in the global population to seven billion people, causing
worldwide environmental and land cover changes through the unsustainable use of resources
to provide water, food and shelter (Foley et al. 2005). Of the impacts that land cover changes
have on the native environment, modifications for urbanisation are considered an extreme
product of anthropogenic pressure as they lead to severe environmental degradation yet are still
expanding at rapid rates (Sushinsky et al. 2013). Urbanisation is the concentrated human
presence in industrial and residential settings and their associated effects (Chace & Walsh
2006). The rapid alteration and removal of native vegetation for anthropogenic uses results in
profound effects on terrestrial fauna and flora (Sol et al. 2014). As a consequence, local
extinctions can surge in cities when species fail to adjust to modification of their biotic and
physical ecosystem (Sol, Lapiedra & González-Lagos 2013).
Around the world, the number of people living in urban environments has risen rapidly
from 750 million in 1950 to 4.2 billion or 55% of the world’s population in 2018 (United
Nations 2018, Figure 1). This percentage is expected to increase in 2050 to 68% (United
Nations 2018). Furthermore, population growth is substantially higher in biodiversity hotspots
(a biogeographic region with significant levels of biodiversity that is threated by anthropogenic
pressures), than the population growth of the world as a whole (Cincotta, Wisnewski &
Engelman 2000).The implications of this anthropogenic geographical shift on the earth is
tremendous and will greatly impact future dynamics of human development and relationships
with the environment (United Nations 2018).

2
Figure 1: Percentage of people, per country, living in urban areas in 2017. Darker blue
represents countries with greater urban percentages ranging from 80 to 100% urban. Australia
has an urban rate of 86%. The most urbanised geographic regions are North America (82%),
Latin America (81%), and Europe (74%). Africa remains the most rural geographic region
with only 43% of the population living in urban areas (United Nations 2018).
1.2 Impacts of urbanisation on the native environment
Urban development primarily impacts native biodiversity through the rapid and extensive
removal of native vegetation, which results in fragmentation, significantly altering urban
ecosystem structure and composition (Faulkner 2004). Urban landscapes are dominated by
roads and buildings that are intertwined with fragmented ‘green’ areas, which range in their
size and condition (Burgman & Lindenmayer 1998). This alteration has been deemed a
structural simplification of vegetation, as landscaping for commercial and residential areas
typically comprise the removal of native shrub and vegetation with an increased mix of native
and invasive grasses and herbs (Marzluff 2001). This can cause significant consequences for
native species, not only by reducing native diversity, but by increasing the prospect of local
extinction when species fail to adjust to urbanisation of their ecosystem (Marzluff 2001; Sol,
Lapiedra & González-Lagos 2013).
Urban areas alter many aspects of the native vegetation, allowing for a wide array of
invasive generalist species to thrive as they can exploit resources from disturbed and novel
environments (Francis & Chadwick 2015). Globally ubiquitous and human-commensal species

3
for example the rock dove (Columba livia), cat (Felis catus), and black rat (Rattus rattus) are
able to establish and thrive in urban areas as they obtain food and nesting resources from
anthropogenic features such as buildings, lawns and paved areas (Møller et al. 2015). This can
cause a multitude of impacts for both the native wildlife and humans, as generalist invasive
species can disrupt ecosystem processes by outcompeting native species, and introducing novel
threats (Banks & Smith 2015).
Native animals are more susceptible to extinction if they require solely native resources
and have specialised life histories (McKinney 2006). Some animals can thrive in urban cities,
yet these tend to be cosmopolitan generalist species that utilise human resources (McKinney
2006). With the expansion of urbanisation, biotic homogenisation can have an immense impact
on native species as different regional biotas become more similar in species composition over
time (McKinney 2006; Olden, Comte & Giam 2018). This is primarily due to the rapid removal
of a diverse native vegetation to create a uniform built environment for humans. As
urbanisation intensity increases, the rate of biotic homogenisation in species can also increase
(Blouin, Pellerin & Poulin 2019). With the addition of invasive species, local biodiversity may
be enriched, but the subsequent extinction of native species causes global diversity to decrease
(McKinney 2006).
1.3 Anthropogenic pressure of urbanisation in Australia
Compared to other regions in the developed world, Australia’s history of habitat clearance
is relatively recent. Nonetheless, clearance has been instantaneous and extensive (Attwood et
al. 2009). Since European colonisation, around 13% Australia’s vegetation has been entirely
cleared for anthropogenic uses, and an additional 62% has been subject to disturbance at
varying degrees (Metcalfe & Bui 2017, Figure 2). A recent report by Tulloch et al. (2016)
analysed 75 native vegetation communities and reported seven communities had lost at least
40% of their original range, and a further 32% of communities had lost at least 20% of their
original range.
4
Figure 2: Map of Australia showing each National Vegetation Information System (NVIS)
vegetation community colour coded by (a) total loss of extent and (b) a fragmentation
measure (change in proportion made up of patches of <5000 hectares). Red areas represent
those vegetation communities with high change, light blue represents no or very little change,
and dark blue represents a positive change (Metcalfe & Bui 2017).
European colonisation of Australia occurred in the 18th century and led to cities expanding
into fertile lands near the coast where water and food resources were abundant. This expansion
has rapidly increased and Australia now has 86% of the population living in urban areas (The
World Bank 2019). As a result, Australian cities have undergone substantial changes in their
native environments (Bradshaw 2012; Lunt 1998). In 1996, 2001, and 2006, State of the
Environment reports were conducted, and all concluded that environments around the
Australian coast are suffering increasing environmental degradation (Australian State of
Environment 2006).
Urbanisation is predicted to continue to increase, hence it is crucial that sustainable
management must better address biodiversity conservation to prevent continued extinction of
Australia’s native species (Burgin 2016). If clear policies to regenerate and protect degraded
native vegetation are not enforced, Australia faces the reality that a large proportion of the
already damaged remaining endemic biodiversity will be lost (Bradshaw 2012).
Australian cities often coincide with a high biological diversity (Matz-Lück 2007), and
locations that are suitable for urbanisation often overlap with high levels of species diversity

5
and endemism (Garden et al. 2006). This is reflected in Australia’s threatened species with
46% of Environment Protection and Biodiversity Conservation EPBC Act (1999) listed
animals having distributions that overlap with cities (Ives et al. 2016, Figure 3). However, due
to extensive clearance of native vegetation, Australia has seen a large decline in native
vertebrate species, which has resulted in 49 species becoming extinct since colonisation (EPBC
Act 1999).
Figure 3: Threatened species richness across Australia, with darker colours/shades
representing greater richness. Urban areas are outlined in black. Cities shown in greater detail
in boxes are (a) Perth, (b) Brisbane and (c) Melbourne. 1643 threatened species were
included in the analysis, with 503 (30%) having distributions that intersected with cities.
Threatened species richness was also higher in coastal areas and around the edges of cities
(Ives et al. 2016).
1.4 Birds as an effective bioindicator for determining the impacts of urbanisation
With the intense impact that urbanisation is having on Australia’s biodiversity, it is crucial
that further research is conducted to assess the condition of the remnant vegetation in urban

6
areas. To manage and conserve remaining biodiversity in urban areas successfully, an
understanding of the full effect of urbanisation is essential (Reis, López-Iborra & Pinheiro
2012). To ensure results are reliable, research requires that all properties within an ecosystem
are examined, yet this is a lengthy task, and research time, capacity and funding are limited.
Due to these constraints, only a small fraction of an ecosystem’s properties is usually examined
(Chambers 2008).
Bioindicators are species that are utilised to evaluate the condition of an ecosystem and
how it has changed over time (Egwumah, Egwumah & Edet 2017). A bioindicator species can
provide a reliable and cost-effective way to determine the health of an ecosystem, and can assist
in establishing its environmental integrity (Egwumah, Egwumah & Edet 2017). To provide
reliable and accurate outcomes, the chosen bioindicator species should possess qualities that
include relevancy for management purposes, high data output, and user benefit (Padoa-
Schioppa et al. 2006).
Birds are considered useful bioindicators as the ecology of many bird species is well-
understood. Furthermore, birds are easily detected within the environment, and cover different
trophic levels, allowing for researchers to collect a large quantity of data on diversity and
abundance within that community (Wardell-Johnson & Williams 2000). Therefore, these
species can assist in developing an understanding of the effects of urbanisation (Chace & Walsh
2006; MacGregor-Fors 2010), because if the habitat is not suitable birds have the ability to fly
and leave the unsustainable environment (Egwumah, Egwumah & Edet 2017). Utilising bird
communities as a bioindicator to determine the health of an urban ecosystem can contribute to
proposing urban planning strategies in cities that focus on conserving native species (Fuller,
Tratalos & Gaston 2009).
1.5 Urbanisation has adversely impacted Australian avifauna
Australia has a diverse and unique birdlife of over 800 species (Dolby 2014); and of these
species, 45% are endemic to Australia (Chapman 2009). Unfortunately, along with mammals,
bird species have seen major declines and extinctions since European settlement (Garnett,
Szabo & Dutson 2011). Every 10 years, The Action Plan for Australian Birds conducts an
analysis on the status of bird species in Australia (Garnett, Szabo & Dutson 2011). This analysis
concluded that since colonisation in 1788, 27 species have gone extinct, 20 are critically
endangered, 60 endangered, and 68 species are vulnerable (Garnett, Szabo & Dutson 2011),
7
distinguishing the significant decline in the proportion of native species present across
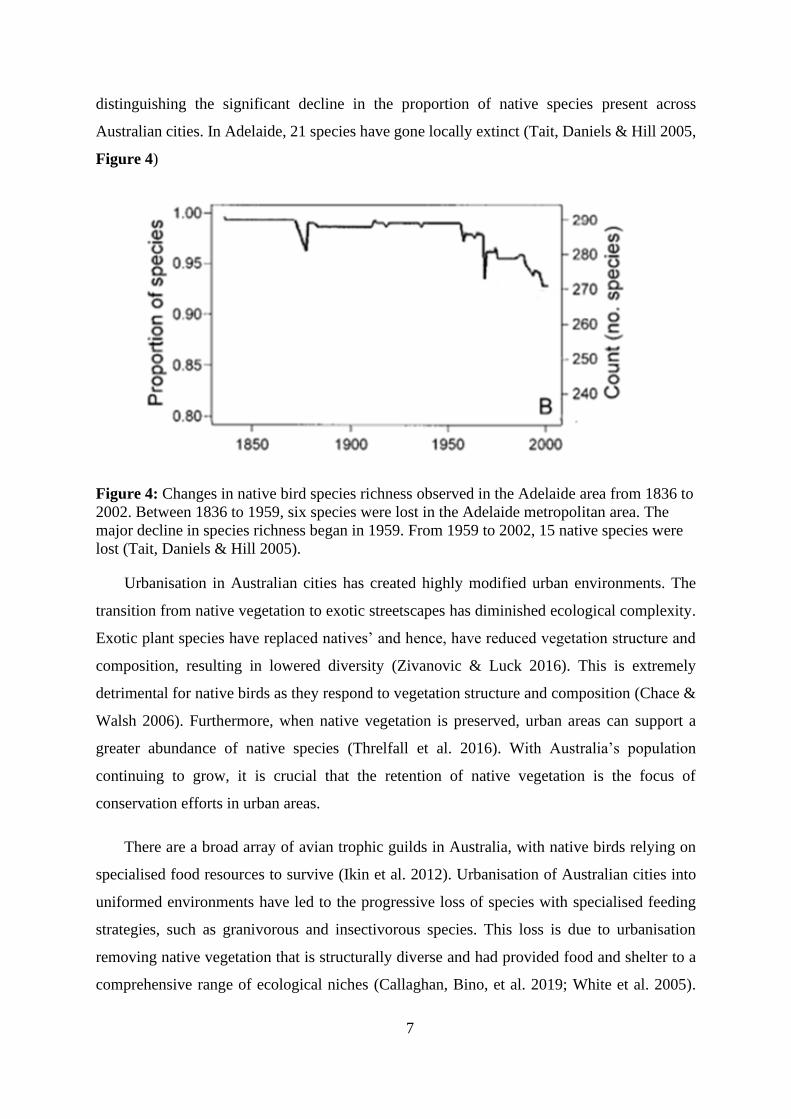
Australian cities. In Adelaide, 21 species have gone locally extinct (Tait, Daniels & Hill 2005,
Figure 4)
Figure 4: Changes in native bird species richness observed in the Adelaide area from 1836 to
2002. Between 1836 to 1959, six species were lost in the Adelaide metropolitan area. The
major decline in species richness began in 1959. From 1959 to 2002, 15 native species were
lost (Tait, Daniels & Hill 2005).
Urbanisation in Australian cities has created highly modified urban environments. The
transition from native vegetation to exotic streetscapes has diminished ecological complexity.
Exotic plant species have replaced natives’ and hence, have reduced vegetation structure and
composition, resulting in lowered diversity (Zivanovic & Luck 2016). This is extremely
detrimental for native birds as they respond to vegetation structure and composition (Chace &
Walsh 2006). Furthermore, when native vegetation is preserved, urban areas can support a
greater abundance of native species (Threlfall et al. 2016). With Australia’s population
continuing to grow, it is crucial that the retention of native vegetation is the focus of
conservation efforts in urban areas.
There are a broad array of avian trophic guilds in Australia, with native birds relying on
specialised food resources to survive (Ikin et al. 2012). Urbanisation of Australian cities into
uniformed environments have led to the progressive loss of species with specialised feeding
strategies, such as granivorous and insectivorous species. This loss is due to urbanisation
removing native vegetation that is structurally diverse and had provided food and shelter to a
comprehensive range of ecological niches (Callaghan, Bino, et al. 2019; White et al. 2005).

8
Specialist species are not able to adapt to the limited resources in urban environments, resulting
in local extinctions (Sol et al. 2014).
Although there has been a significant decline in Australian native birds, a few species have
adapted to urbanisation and responded positively, becoming a dominant component of the
community in urban habitats (Ashley, Major & Taylor 2009). This has resulted in a major shift
in the body sizes of birds, with a greater proportion of the bird community now compromising
of larger species (Major & Parsons 2010). This trend is due to larger-bodied birds often being
dominant species with generalist, nectivorous, or omnivorous diets, allowing for adaption in
urban environments (Major & Parsons 2010); e.g., the red wattlebird (Anthochaera
carunculate), noisy miner (Manorina melanocephala), and Australian white ibis (Threskiornis
moluccus). All of these native species are medium to large in size, with their populations in
several Australian cities increasing since European colonisation (Cleary et al. 2016; Smith,
Munro & Figueira 2013), identifying these species as successful avian urban adaptors (Davis,
Taylor & Major 2012; Major & Parsons 2010).
1.6 Study aims
Developing a detailed insight into bird species composition and diversity in urban areas
can provide a vital understanding of the environmental impacts created by urbanisation. This
knowledge can furthermore allow for urban planning strategies to be developed that are
effective and can contribute to conserving bird species and their diversity in Australian cities
(Sushinsky et al. 2013). The aim of my research is to determine the composition of bird species
as an indicator of biodiversity loss triggered by urbanisation in the Adelaide metropolitan area,
utilising Bird Atlas Data (Paton, Carpenter & Sinclair 1994; DP Paton unpublished data) to:
• Determine temporal changes of bird species composition in metropolitan Adelaide
• Determine past and present spatial patterns of urban growth through land use in
metropolitan Adelaide
• Evaluate the correlation of urban growth changes on bird species composition in
metropolitan Adelaide

9
2. Methods
2.1 Research area
Adelaide is a metropolitan region located in the southeast of South Australia and on the
Eastern side of Gulf St. Vincent. Adelaide has a Mediterranean climate with an average of
16.1mm-78.1mm of rainfall every year; the driest major city in Australia (Bureau of
Meteorology 2020). Adelaide experiences relatively mild winters (average of 14.5 degrees),
and hot dry summers (average of 29.6 degrees) (Bureau of Meteorology 2020). My study
region is the area of Green Adelaide, the South Australian Government’s landscape
management region that includes 17 local government areas (LGA), and encompasses
approximately 1.3 million people (Government of South Australia 2019, Figure 5).
Kaurna people are the custodians of Adelaide and the Adelaide Plains. The city of Adelaide
was the heart of Kaurna country and known as Tarntanya (red kangaroo place). Historically,
Adelaide was an open grassy plain with patches of shrubs and trees and had a rich biodiversity
(Clarke 1991). Prior to European settlement the Adelaide Plains was considered to have the
richest diversity of flora and fauna in South Australia (Bradshaw 2012; Tait, Daniels & Hill
2005).This was the result of the Kaurna people skilfully managing the land for thousands of
years. This diverse range of natural habitat supported 285 native bird, and 40 mammal species
(Turner 2001). However, since European colonisation in 1836 most of Adelaide’s native
vegetation have been cleared, with less than 4% of remnant vegetation remaining in the
Adelaide plains (Oke 1997; Szabo et al. 2011).

10
Figure 5: Map of the Green Adelaide boundary – a landscape management region wherein
the South Australian Government has an objective to enhance biodiversity and increase
efforts to green metropolitan Adelaide. The area includes 17 metropolitan Local Government
Areas, and encompass approximately 1.3 million people (Government of South Australia
2019).

11
2.2 Collating and analysing bird surveys conducted in metropolitan Adelaide
2.21 Synthetic data analysis of bird surveys
To understand the rate of species change in metropolitan Adelaide and ensure this research
produced reliable results, a large amount of bird surveying data was required from previous
research papers. Extensive communications took place with data custodians who have
previously conducted research on bird communities in metropolitan Adelaide. A synthetic
review of data was conducted, with data selected for analysis including methods and surveying
efforts that would allow for future reproducibility, creating a format that allows monitoring of
temporal abundance changes of bird distributions.
Between 1984 and 1985, the South Australian Ornithological Association (SAOA)
collected information on the distribution of birds in the Adelaide region to produce a Bird Atlas
of the Adelaide region (Paton, Carpenter & Sinclair 1994). These efforts have been recently
followed up, with surveys being conducted between the years 2012 and 2014 (DC Paton
unpublished data). Methods between the two time periods were conducted under the same
format to allow for monitoring the temporal abundance changes of bird distributions. All
observations were recorded on cards, and sent to regional organisers for data entry. This
allowed for any unusual sightings to be verified by adequate descriptions of the bird. To ensure
that the entire region was surveyed, latitude and longitude points were recorded to the nearest
minute (Paton, Carpenter & Sinclair 1994). Due to this reliability and validity of data, these
two datasets were chosen for temporal analysis in this paper.
Tait, Daniels and Hill (2005) analysed the changes in species assemblages within the
Adelaide metropolitan area between the years 1836 and 2002. Raw data was obtained from the
lead author (Catherine Tait), yet when I analysed the data, only the absence or presence of each
species was recorded for each year and no location data was recorded. Additionally, the
information recorded was not consistant for each species. I deemed these data unreliable and
unsuitable for an analysis of temporal patterns in species assemblages, and they were therefore
not utilised further in this study.
Ormond et al. (2014) analysed the species assemblages of the Adelaide parklands between
the years 1976 and 2007. This is a detailed and informed report based on 32 years of surveys

12
by Naturalist Dr Robert Whatmough. On further analysis, data collated by Dr Whatmough
found to be submitted into the Atlas of Living Australia (ALA). This paper was excluded from
individual analysis as it was already part of the ALA.
The Atlas of Living Australia (ALA) is Australia’s national biodiversity database, and is
an open compilation of Australian biodiversity data. There are more than 85 million occurrence
records in the ALA, based on data collated from universities, government departments,
museums, and other organisations. In Australia, national databases such as the ALA are vital
as they can provide information from a broad range of sources, permitting research on long-
term data sets. Field observations and surveys within the ALA have been conducted by a broad
range of participants who have a wide variety of experience and identification skills. This can
have a substantial impact on the results as sampling efforts are varied and diverse. Certain bird
surveys uploaded to the ALA may be lacking because of variable identification skills of
participants, resulting in species either being overrepresented, or going undetected at sites even
when present. This will further influence data analysis, as quantifying temporal abundance
levels from this dataset may result in underestimated and unreliable statistics (MacKenzie et
al. 2002).
To analyse the ALA data, historical bird surveys conducted in the Adelaide metropolitan
region have been filtered and retrieved from the ALA repositories. On visual analysis, survey
data was not evenly distributed across LGAs, consequently analysis across and between LGAs
would be severely limited. Due to these results, it was decided that the ALA data would not be
used further for temporal analysis of bird communities in the metropolitan Adelaide region.
2.22 Bird Atlas of South Australia
The Bird Atlas of 1984 to 1985 produced observations of 318 bird species, and 117,766
individual bird sightings across 1973 locations in South Australia (Paton, Carpenter & Sinclair
1994; DP Paton unpublished data)
These surveys have recently been repeated, with sampling being conducted between 2012
and 2014, and the updated bird atlas is still in preparation (DC Paton unpublished
data). Observations over this period recorded a total of 307 species, and 137,551 individual
bird sightings from 3638 locations in South Australia (Figure 6).

13
Figure 6: Map showing 17 Local Government Area’s of metropolitan Adelaide with
locations of bird surveys conducted in 1984-1985 (yellow points) and 2012-2014 (red points).
Points have been overlayed on the SA Land Cover dataset for 2010-2015. Grey indicates
urban areas, dark green indicates native vegetation, and light green indicates exotic
vegetation
2.3 Data cleaning and quality assessments
A subset of the full dataset from both periods that included birds sighted only in the 17
Green Adelaide LGAs was compiled, containing 76,964 individual bird sightings of 273
species (Appendix A). A unique code was used for each LGA (Table 1). Any sightings that
occurred in the City of Prospect (PRO) were removed from subsequent data analysis, as birds’
surveys were only conducted in the 2012-14 dataset, and as a result temporal turnover analysis
could not be conducted. Within each time period, data was pooled among years, and given the
label either 1980 or 2010.

14
Table 1: The 17 Local Government Areas (LGA) located within metropolitan Adelaide, and
the associated code.
LGA Code
Adelaide ADL
Burnside BUR
Campbelltown CAM
Charles Sturt CHA
Holdfast Bay HOL
Marion MAR
Mitcham MIT
Norwood Payneham And St Peters NOR
Onkaparinga ONK
Playford PLA
Port Adelaide Enfield POR
Prospect PRO
Salisbury SAL
Tea Tree Gully TEA
Unley UNL
Walkerville WAL
West Torrens WES
To ensure the two time periods resembled one another for comparison, the differences
between the datasets of the two time periods were determined. Location variables were
consistent for both time periods, with the date, Easting and Northing locations, Map zone, and
observer details recorded. Only the 1980 data set included latitude and longitude for sightings.
Inconsistencies of surveying efforts between the two time period datasets occurred within
the bird species variables. The 1980s raw data had only the common names listed for each
sighting, with the raw data for 2010 surveys only containing an abbreviated code for each
species scientific name, and a separate key of the scientific and common names for each code.
To ensure each dataset had the scientific name, common name, and abbreviated code,
information from the species key onto each of the datasets were merged (Appendix A). Due
to nomenclature changes over this time, not just time itself, there was a lot of variability and
duplication in common names.
To prevent duplication (multiple counts for single species), a single species list was created
from both datasets and a unique species name was resolved for every species (BirdLife SA
2020). The unique species name was based upon the scientific name. Duplications due to

15
spelling errors in common names, or a change in common names for the same species were
identified through any NAs in the scientific name column. Duplicates were matched to their
correct scientific name and given the same Unique Species Name, and any sightings that could
not be identified to species level were removed from the dataset (Appendix B).
To ensure the data was ready for analysis, a significant amount of time and effort was
required to develop an in-depth understanding of all the data. The extended time allocated to
data cleaning and familiarising was crucial to the process. The two datasets were heterogenous
and required a large amount of time to analyse the metadata, determine the consistencies, and
carefully identify and diagnose the specific differences.
Throughout the process of data cleaning and preparation, the aim was to prepare a rigorous
comparison of the two time periods, to ensure robust and reliable conclusions. Consequently,
a clean set of data and metadata with transparent sources and changes were created through
collating all data sets and utilising the R scripting language for data management. This will
also allow for future use of this data. All data was visualised and analysed using the program
R for statistical and graphical computing (R Core Team 2019).
2.31 Refining the species list
With all the data consolidated, a total of 273 species were recorded in the metropolitan
Adelaide region (Appendix A). Species were determined as native or exotic through utilising
previous species lists from Paton, Carpenter and Sinclair (1994), and through expert elicitation
(RL Boulton pers comm, Appendix C). Native species were defined as species that were
present in metropolitan Adelaide prior to 1836 (Paton, Carpenter & Sinclair 1994).
There were 99 species excluded from the original species to ensure that the temporal
analysis of urban communities was conducted for species that occurred throughout the entire
region (R. Boulton as per comm). Species that are associated to a specified habitat including,
waterbirds, coastal and seabirds, were removed as these habitats are only found in a narrow
area of the entire 16 LGAs, and may contribute to inaccurate assumptions of urbanisation,
rather than natural distribution of species. Further, birds uncommon (vagrant) to the
metropolitan Adelaide region were removed as this study focuses on birds potentially occurring
throughout the entire region, as their natural home range may also contribute to inaccurate

16
assumptions, rather than the natural distribution of species. The final 174 species list included
native and exotic species that were found (or should occur) across the entire study area (R.
Boulton as per comm, Appendix C).
For the refined 174 species, they were categorised based on their foraging guilds and
foraging zones. Categories were identified based on primary food sources, and foraging zone
for each species (Boulton as per comm; Burgess & Maron 2016). These included 5 foraging
guilds: carnivore, frugivore, granivore, insectivore, and nectarivore; and 5 foraging zones:
aerial, bark, canopy, ground, and shrub. If a species was not mutually exclusive to a foraging
guild (for example Honeyeaters that are both nectarivores and insectivores), the species was
assigned to both relevant categories (Burgess & Maron 2016; Boulton as per comm, Appendix
C).
Species abundances were summarised for each LGA by time period. The summarised
abundance data was converted to a wide matrix format for each LGA by year to create a species
x LGA abundance matrix. This table was then converted into a presence/absence table. From
the presence/absence matrix table, species richness per LGA by year was calculated (Appendix
D).
2.4 Spatial data
2.41 SA Vegetation Land Cover
In 2015, the South Australian Government began to model estimated land cover classes
across South Australia from 1987-2015. The aim was to improve the knowledge of South
Australia’s native vegetation extent, and understand largescale trends over time, with six
epochs being analysed (three to five years per epoch, Table 2).
Table 2: Definition of each epoch and the years it represents for the SA Land Cover dataset
Epoch Years
1 1987-1990
2 1990-1995
3 1995-2000
4 2000-2005
5 2005-2010
6 2010-2015

17
To create this dataset, Landsat satellite imagery and local calibration (or training) data
were used to produce the most likely layers (one for each epoch) to classify each pixel in to
one of 17 land cover classes (Willoughby et al. 2018, Table 3).
Table 3: Description of the land cover classes in the most likely layers for the SA Land
Cover (Willoughby et al. 2018).
Land Cover Class Description Category
Woody Native
Vegetation
Woody native vegetation generally > 1 m tall (e.g.
eucalypt forests and woodlands, wattle shrublands,
hop-bush shrublands)
Native Land Cover
Mangrove
Vegetation Mangrove dominated forest Native Land Cover
Non-Woody Native
Vegetation
Non-woody native vegetation generally < 1 m tall
(e.g. grasslands including herbs and low shrubs
such as chenopods)
Native Land Cover
Saltmarsh
Vegetation
Low native vegetation in areas with saline soils
dominated by samphire species Native Land Cover
Wetland Vegetation
Non-woody native vegetation occurring in
association with wetlands (e.g. emergent vegetation,
lignum)
Native Land Cover
Natural Low Cover
Very sparse native vegetation (e.g. gibber plains,
post-fire heath, coastal dunes, beaches. Large
fluctuations can occur - usually with low native
vegetation)
Native Land Cover
Salt Lake/ Saltpan Salt lakes and salt pans Other
Dryland Agriculture Non-native vegetation that is used for dryland
cropping and/or grazing Exotic Land Cover
Exotic Vegetation
Any form of vegetation dominated by non-native
species and not classified to the other non-native
vegetation classes
Exotic Land Cover
Irrigated Non-
Woody
Irrigated pasture or crops (e.g. irrigated cropping/
pasture, grassed reserves, golf courses) Exotic Land Cover
Orchards/ Vineyards Irrigated woody crops (e.g. grapes, citrus, stone
fruit) Exotic Land Cover
Plantation
(Softwood) Pine plantations
Non- Native
Vegetation
Plantation
(Hardwood)
Plantations other than pine (often Tasmanian blue
gum) Exotic Land Cover
Urban Area A mix of vegetation and built surfaces (e.g. roads,
gardens, houses, street trees) Urban Land Cover
Built-up Area Dominated by built surfaces (e.g. roads, buildings) Urban Land Cover
Disturbed Ground /
Outcrop Disturbed ground or outcrop (e.g. open-cut mines) Other
Water Unspecified Open water bodies Other

18
To measure the changes in urbanisation in the Adelaide metropolitan area from 1987 to
2015, urban cover for each LGA was calculated using the “urban / built-up” categories from
the South Australian land Cover spatial datasets (Willoughby et al. 2018, Table 3 & Figure
7). The 16 LGAs were overlayed onto the urban/built-up coverage, and the km2 and percent
coverage was extracted for each of the LGAs (Appendix E). to further understand the changes
in urbanisation, native vegetation for each LGA was calculated for land cover classes that fell
under the category of Native Land Cover. The LGAs were overlayed onto the native land
coverage, and the km2 and percent coverage was extracted for each of the bLGAs (Appendix
E). These calculations were performed through the program QGIS (QGIS 2020).
Figure 7: A comparison of SA Land Cover estimations from 1987 (left) to 2015 (right) for
metropolitan Adelaide. Grey indicates urban areas, Dark green indicates native vegetation,
and light green indicates exotic vegetation
2.42 Demographic data for LGAs
Every 5 years the Australian Bureau of Statistics (ABS) conducts the national Census of
Population and Housing. This census collates key demographic, social, and economic data from
all people in Australia. Every person residing in Australia must complete the census, yet not
all questions are compulsory (Australian Bureau of Statistics 2020). Total Population and
dwellings data were obtained for each local government area from the census years closest to

19
the surveying time periods - 1986 and 2016 (Appendix G). Proportional numbers were
calculated by dividing the counts for each LGA by the LGA area (km2). The relative increase
in the proportional population and dwelling counts from 1986 to 2016 for each LGA were
calculated using the following equations (Appendix G):
Relative population density = ((population size in 2016 / LGA km2) - (population size in
1986 / LGA km2)) / (population size in 1986 / LGA km2)
(1)
Relative dwelling density = ((total number of dwellings in 2016 / LGA km2) - (total number
of dwellings in 1986 / LGA km2)) / (total number of dwellings in 1986 / LGA km2)
(2)
2.5 Temporal diversity indices to measure community change
2.51 Temporal Turnover
Conventional measurements of ecological communities capture community dynamics
poorly. This is due to common indices such as species richness only representing a ‘snapshot
in time’, rather than analysing turnover, which is the change in richness (Collins et al. 2008).
If there is no change in number of species present, these indices fail to highlight community
change due to turnover in species identity (Collins et al. 2008). To avoid this problem, species
turnover is calculated as the proportion of species that differ between time points so that:
(3)
Temporal turnover was calculated in the R software package codyn (Hallett, Jones, et al.
2016). Total turnover not only shows the species richness changes over time, but also
fluctuations in the species present. This metric assists in contextualising temporal patterns of
richness, and understanding the turnover patterns in species over time (Hallett, Jones, et al.
2016). To visualise the species gained and lost for each LGA, turnover was plotted as the
relative sizes of species additions and deletions by LGA (Appendix H).
Separate linear models were fitted to assess the relationships between temporal turnover
and the explanatory variable relative dwelling increase. Both the relative dwelling increase and

20
temporal turnover was log transformed (log10) to reduce the skewness, making the transformed
data appear more normal (Figure 10). Residual plots and Q-Q plots were produced to visually
analyse that the data meets the normality assumptions of linear regression (Appendix H)
2.52 Community Abundance turnover
To further understand the levels of species reordering overtime, the relative changes in
species rank abundances, known as the mean rank shift, was quantified (Appendix I). This can
assist in understanding the level of species reordering overtime. Calculating this temporal index
can highlight the stability or instability of communities, with stable communities having fewer
rank shifts between species. To calculate mean rank shift, N is the number of species in
common in both time points, t is the time point, Ri, t is the relative rank of species i in time t
(Hallett, Jones, et al. 2016), so that:
(4)
The rate of directional change in community composition was conducted as it analyses an
ecological community’s pattern and rate of variability over time (Appendix I). Specifically,
the difference in species composition at different time intervals, was calculated, allowing for
comparison of temporal community dynamics (Hallett, Jones, et al. 2016). Furthermore, this
function can indicate whether directional change is the cause of species reordering over time,
illustrating whether a community was increasingly dissimilar, or not (Hallett, Avolio, et al.
2016).
Separate linear models were fitted to assess the relationships between the mean rank shift,
and rate of change, and the explanatory variables relative dwelling increase. The relative
dwelling increase, rate of change, and mean rank shift were all log transformed (log10) to
reduce the skewness of the plots, making the transformed data appear more normal. Residual
plots and Q-Q plots were produced to visually analyse that the data meets the normality
assumptions of linear regression (Appendix I).

21
2.6 Visualising and analysing multivariate patterns in species presence-absence
2.61 Multivariate analysis
Temporal turnover is only a composite measure of the total assemblage of birds sighted.
To measure and understand what species are the key drivers of temporal turnover, a set of
multivariate analyses were conducted on the species presence-absence matrix of data.
An ordination plot was first utilised to visualise multivariate patterns. A Non-metric
Multidimensional Scaling (NMDS) was conducted utilising the Bray-Curtis dissimilarity to
quantify the compositional dissimilarity between all the sites. This analysis is commonly
regarded as the most robust unconstrained ordination method in community ecology (Minchin
1987). A Shepard plot was used to assess goodness of fit or the nMDS ordination result. The
ordination result was plotted in two dimensions to visualise differences between LGAs and the
changes between time periods (Appendix J).
2.62 Model-based analysis
A model-based approach was then utilised to infer multivariate differences in the bird
assemblages between LGAs and between time periods. The mvabund approach (Warton,
Wright & Wang 2012) was used to fit a set of generalised linear models to the multivariate
species presence/absence data with LGA and time period as explanatory variables. The second
stage of this approach is to use resampling to provide tests for differences due to the explanatory
variables. Model assumptions, particularly assessing the appropriate variance model for the
multivariate responses, were assessed visually using residual plots (Warton, Wright & Wang
2012) (Appendix K). Where there was evidence for differences from the global test,
resampling methods were used iteratively across species (with appropriate controls for multiple
testing) to identify the species that showed clear differences associated with the explanatory
variable (e.g., a main effect of time period indicated consistent differences between time
periods across all LGAs for the species). For species where time period differences were
observed (p<0.1), a confusion matrix was produced to show the proportion of LGAs where the
species was either present in both time periods, absent in both time periods, or some
combination thereof.

22
2.7 Changes in Species Abundance
2.71 Multivariate Analysis
As with temporal turnover, mean rank shift and rate of change are only a composite
measure of the total assemblage of birds sighted. To measure and understand what species are
the key drivers of changes in species abundance, a set of multivariate analyses were conducted
on the species abundance matrix of data (Appendix L).
An ordination plot was firstly utilised to visualise multivariate patterns. A Non-metric
Multidimensional Scaling (NMDS) was conducted utilising the Bray-Curtis dissimilarity to
quantify the compositional dissimilarity between all the sites. A Shepard plot was used to assess
goodness of fit or the nMDS ordination result. The ordination result was plotted in two
dimensions to visualise differences between LGAs and the changes between time periods
(Appendix L).
2.72 Model-based analysis
As with the bird presence-absence analysis, a model-based approach was conducted to
understand the multivariate differences in the bird abundances between LGAs and between
time periods. The mvabund approach (Warton, Wright & Wang 2012) was utilised to fit a set
of generalised linear models to the multivariate species abundance data with LGA and time
period as explanatory variables. The second stage of this approach is to use resampling to
provide tests for differences due to the explanatory variables. Model assumptions, particularly
assessing the appropriate variance model for the multivariate responses, were assessed visually
using residual plots (Warton, Wright & Wang 2012, Appendix M). Where there was evidence
for differences from the global test, resampling methods were utilised iteratively across species
(with appropriate controls for multiple testing) to identify the species that showed clear
differences associated with the explanatory variable (e.g., a main effect of time period indicated
consistent differences between time periods across all LGAs for the species). For species where
time period differences were observed (p<0.1), a scatter plot was produced to show the
proportion of LGAs where the species either experienced an increase or decrease in abundance
from 1980 to 2010

23
3. Results
3.1 Changes in urbanisation
In 2015, Playford Council consisted of 16.2% urban land, undergoing the highest relative
(%) (17.6%) increase in urbanisation. Both Onkaparinga (15.3%) and Tea Tree Gully (9.0%)
also experienced high relative (%) increases in urbanisation. Norwood, an already urbanised
council with 93.5% urban land experienced a decrease in relative urbanisation (-2.3%). This
was followed by Prospect with 97.4% urban land in 2015, experiencing the lowest relative
increase in urbanisation (0.16%), and Unley with 95.9% urban land and a slight relative
increase (0.08%) (Appendix E).
Adelaide City Council encompasses the capital city of South Australia and has a
population of 22,063 (as of 2016), it also underwent the highest increase in relative human
population size (55.9%) across metropolitan Adelaide, closely followed by Onkaparinga
(54.8%), and Playford (53.3%). Mitcham council had a population of 64,805 in 2016, and
encountered the lowest increase in relative human population density (5.8%), closely followed
by Unley (4.2%), and Charles Sturt (9%) (Appendix G).
In 2016, Adelaide City Council had a total of 11,539 dwellings, undergoing the highest
relative increase in dwellings (109%) across metropolitan Adelaide. This was closely followed
by Onkaparinga with 71,692 dwellings, a relative increase of (92%), and Playford (84%).
Prospect Council has a total of 8,919 dwellings, undergoing the lowest increase in relative (%)
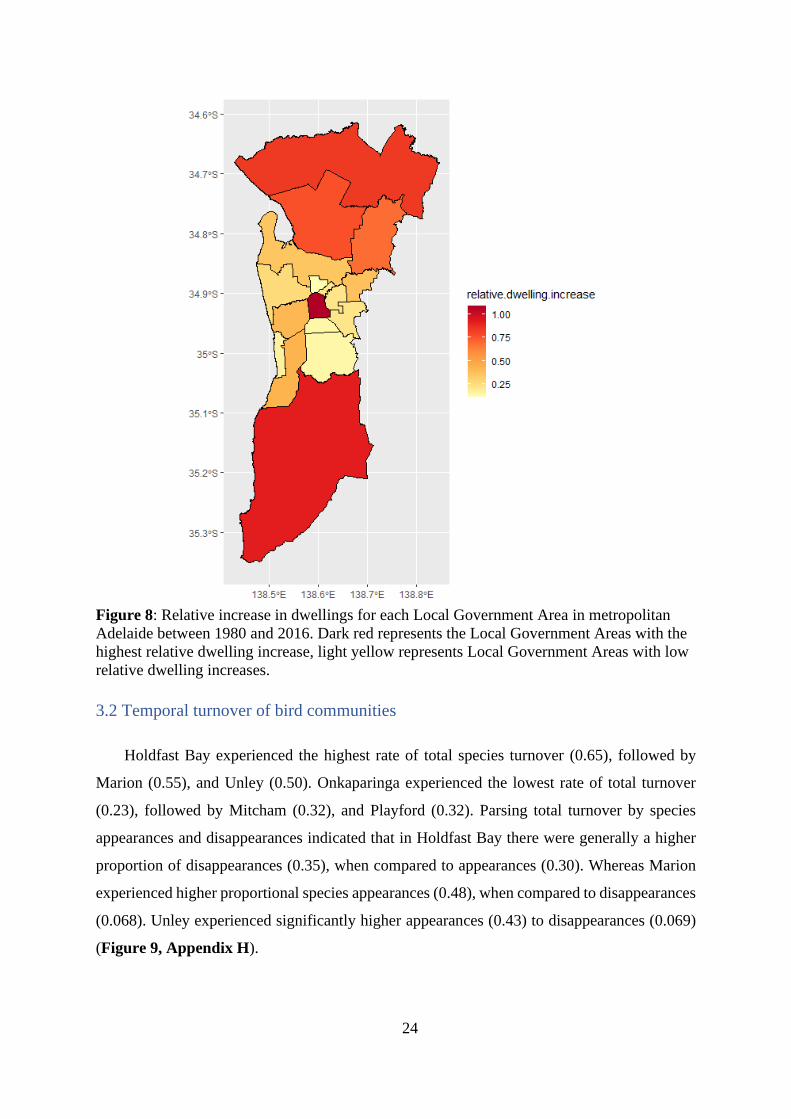
dwellings (11%), closely followed by Unley (14%), and Mitcham (14%) (Figure 8 &
Appendix G).
24
Figure 8: Relative increase in dwellings for each Local Government Area in metropolitan
Adelaide between 1980 and 2016. Dark red represents the Local Government Areas with the
highest relative dwelling increase, light yellow represents Local Government Areas with low
relative dwelling increases.
3.2 Temporal turnover of bird communities
Holdfast Bay experienced the highest rate of total species turnover (0.65), followed by
Marion (0.55), and Unley (0.50). Onkaparinga experienced the lowest rate of total turnover
(0.23), followed by Mitcham (0.32), and Playford (0.32). Parsing total turnover by species
appearances and disappearances indicated that in Holdfast Bay there were generally a higher
proportion of disappearances (0.35), when compared to appearances (0.30). Whereas Marion
experienced higher proportional species appearances (0.48), when compared to disappearances
(0.068). Unley experienced significantly higher appearances (0.43) to disappearances (0.069)
(Figure 9, Appendix H).

25
Figure 9: Proportional turnover of bird communities in each Local Government Area. Pink
indicates species additions, and blue indicates species deletions from that Local Government
Area. Holdfast Bay (HOL) experienced the highest proportional turnover (0.65), and
Onkaparinga experienced the lowest rate of total turnover (0.23). council.
A linear regression established that the total bird species turnover and relative dwelling
increase for metropolitan Adelaide was not statistically significant (Figure 10). Again,
Holdfast Bay, Salisbury, and West Torrens appear to be strong outliers. Holdfast Bay, Marion,
and Onkaparinga appear to be strong outliers.

26
Figure 10: Regression plot showing the relationship between temporal turnover of bird
communities and relative dwelling increase in metropolitan Adelaide. Each point represents a
Local Government Area in the metropolitan Adelaide and their associated code to visually
identify them (Table 1).
A multivariate analysis was conducted on the species presence-absence matrix of data to
determine the patterns between the two time periods (Appendix J). An analysis of the deviance
established that species presence-absence was significantly different between the two time
periods (LRT = 906.5, p < 0.001). In Addition, univariate tests were run for each species, and
determined that 17 species had experienced a significant change in presence-absence between
time periods (Table 4).
Table 4: Species that have undergone a significant change in presence-absence in
metropolitan Adelaide between 1980 and 2010 (LRT = 906.5, p < 0.001).
Unique Species Name Common Name P-value
Coturnix pectoralis Stubble quail 0.094
Myiagra inquieta Restless flycatcher 0.041
Anas platyrhynchos domesticus Domestic duck 0.035
Cincloramphus cruralis Brown songlark 0.028
Petrochelidon ariel Fairy martin 0.019
Slope = -0.09 SE = 0.10

27
Barnardius zonarius Australian ringneck 0.008
Platycercus eximius Eastern rosella 0.005
Phaps chalcoptera Common bronzewing 0.004
Acanthorhynchus tenuirostris Eastern spinebill 0.004
Accipiter cirrhocephalus Collared sparrowhawk 0.004
Rhipidura fuliginosa Grey fantail 0.002
Apus pacificus Pacific swift 0.002
Cacatua tenuirostris Long-billed corella 0.001
Calyptorhynchus funereus Yellow-tailed black cockatoo 0.001
Todiramphus sancta Sacred kingfisher 0.001
Melopsittacus undulatus Budgerigar 0.001
Carduelis chloris European greenfinch 0.001
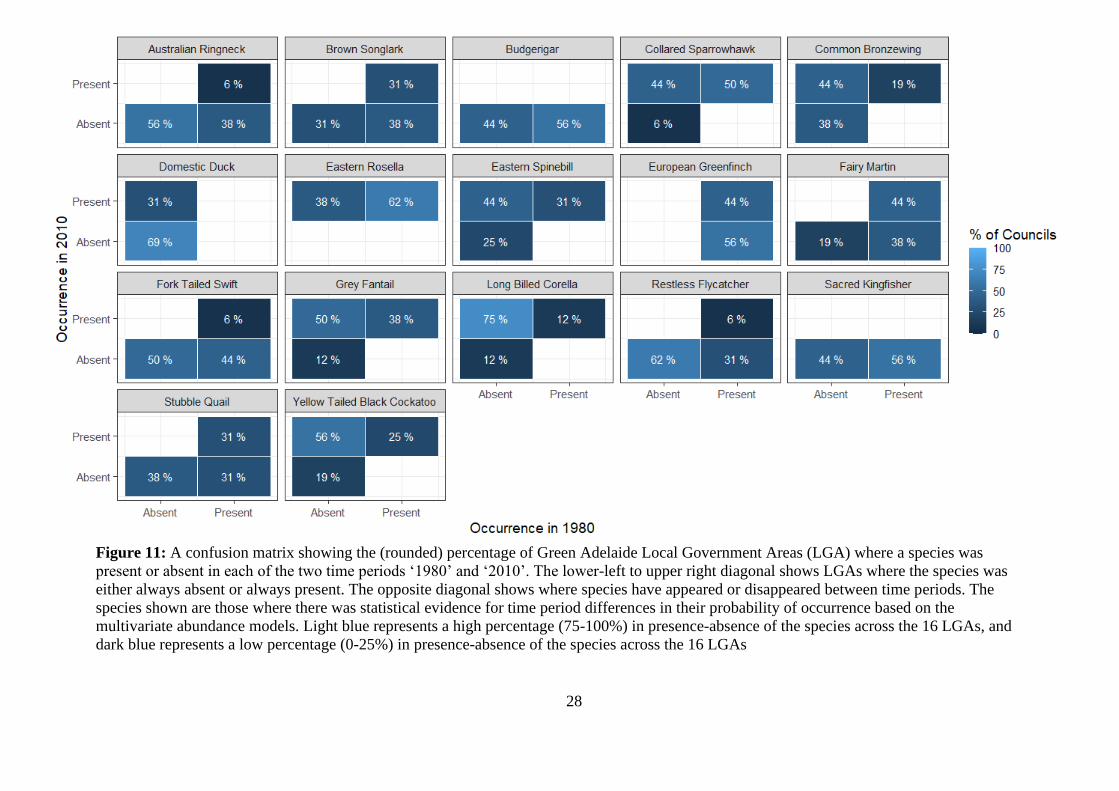
It was established that the following species were present in 1980, and later absent in the
2010 surveying efforts: Australian ringneck (38% - the (rounded) percentage of LGA’s where
species disappeared), brown songlark (38%), budgerigar (56%), European greenfinch (56%),
fairy martin (38%), fork tailed swift (44%), restless flycatcher (31%), sacred kingfisher (56%),
and the stubble quail (31%) (Figure 11).
Species that were absent in the 1980s, and later present in the 2010s dataset were the
collared sparrowhawk (44%), common bronzewing (44%), domestic duck (31%), eastern
rosella (38%), eastern spinebill (44%), grey fantail (50%), long billed corella (75%), and the
yellow tailed black cockatoo (58%) (Figure 11).
28
Figure 11: A confusion matrix showing the (rounded) percentage of Green Adelaide Local Government Areas (LGA) where a species was
present or absent in each of the two time periods ‘1980’ and ‘2010’. The lower-left to upper right diagonal shows LGAs where the species was
either always absent or always present. The opposite diagonal shows where species have appeared or disappeared between time periods. The
species shown are those where there was statistical evidence for time period differences in their probability of occurrence based on the
multivariate abundance models. Light blue represents a high percentage (75-100%) in presence-absence of the species across the 16 LGAs, and
dark blue represents a low percentage (0-25%) in presence-absence of the species across the 16 LGAs

29
3.3 Changes in species abundance
Figure 12A conveys a linear regression plot assessing the relationship between the relative
changes in species rank abundances, and the explanatory variable relative dwelling increase in
metropolitan Adelaide. It highlights a strong, positive, linear association (F1,14 = 6.7, df = 14,
p = 0.021). Holdfast Bay, Onkaparinga, and Playford appear to be moderate outliers
(Appendix I).
A linear regression established that rate of directional change in community composition
and relative dwelling increase for metropolitan Adelaide was not statistically significant
(Figure 12B). Again, Holdfast Bay, Salisbury, and West Torrens appear to be strong outliers
(Appendix I).
Figure 12: Regression plot assessing the relationship between mean rank shift (A) and rate of
change (B) of bird communities, and the explanatory variable relative dwelling increase in
metropolitan Adelaide. Each point represents a Local Government Area in the metropolitan
Adelaide and their associated code to visually identify them (Table 1).
Slope = 9.36
SE = 4.61
Slope = 309.8
SE = 294.2

30
A multivariate analysis was conducted to determine the patterns of species abundance between
the two time periods (Appendix L). An analysis of the deviance was computed and established
that species abundance was significantly different between the two time periods (LRT = 1408,
p < 0.001). In Addition, univariate tests were run for each species, and determined that 26
species had experienced a significant change in abundance between time periods (Table 5).
Table 5: Species that have undergone a significant change in abundance in metropolitan
Adelaide between 1980 and 2010 (LRT = 1408, p < 0.001).
Unique Species Name Common Name P-value
Accipiter cirrhocephalus Collared sparrowhawk 0.001
Anthochaera chrysoptera Little wattlebird 0.011
Cacatua galerita Sulphur-crested cockatoo 0.002
Cacatua sanguinea Little corella 0.006
Carduelis chloris European greenfinch 0.086
Chenonetta jubata Australian wood duck 0.019
Glossopsitta concinna Musk lorikeet 0.063
Gymnorhina tibicen Australian magpie 0.045
Manorina melanocephala Noisy miner 0.008
Melopsittacus undulatus Budgerigar 0.047
Pardalotus striatus Striated pardalote 0.035
Phylidonyris novaehollandiae New Holland honeyeater 0.040
Platycercus elegans Crimson rosella 0.088
Platycercus eximius Eastern rosella 0.005
Smicrornis brevirostris Weebill 0.006
Threskiornis molucca Australian white ibis 0.006
Todiramphus sancta Sacred kingfisher 0.002
Trichoglossus haematodus Rainbow lorikeet 0.006
Acanthorhynchus tenuirostris Eastern spinebill 0.006
Calyptorhynchus funereus Yellow-tailed black cockatoo 0.008
Strepera versicolor Grey currawong 0.049
Taeniopygia guttata Zebra finch 0.040
Cacatua tenuirostris Long-billed corella 0.001
Phaps chalcoptera Common bronzewing 0.006
Streptopelia risoria Barbary dove 0.048
Anas platyrhynchos domesticus Domestic duck 0.080
Significant abundance increases for most LGAs from 1980 to 2010 occurred for the Australian
magpie, Australian white ibis, Australian wood duck, collared sparrowhawk, common
bronzewing, crimson rosella, domestic duck, eastern rosella, eastern spinebill, grey currawong,
little corella, little wattlebird, long billed corella, musk lorikeet, new holland honey eater, noisy
miner, rainbow lorikeet, striated pardalote, sulphur crested cockatoo, weebill, and the yellow
tailed black cockatoo. Significant abundance decreases for most LGAs from 1980 to 2010
occurred for the budgerigar, European greenfinch, sacred kingfisher, and the zebra finch (Table
5, Figure 13).

31
Figure 13: A scatterplot presentation of the proportion of Local Government Areas where the species either experienced an increase or decrease
in abundance from 1980 to 2010. Each point indicates the abundance of the species within the Local Government Area, with a diagonal
reference line to assist in interpreting abundance changes. Points to the left of the reference line indicate Local Government Areas that
experienced an increase in abundance of the particular species from 1980 to 2010, and points to the right of the reference line indicate Local
Government Areas that experienced a loss in abundance from 1980 to 2010.

4. Discussion
In metropolitan Adelaide, European colonisation has drastically impacted native species, with
21 bird species having become locally extinct since 1836 (Paton et al. 2000; Tait, Daniels & Hill
2005). The aim of my research was to determine the composition of bird species as an indicator of
biodiversity loss triggered by urban growth in the Adelaide metropolitan area, utilising Bird Atlas
Data (Paton, Carpenter & Sinclair 1994; DC Paton unpublished data).
To understand the impacts of urban growth on bird communities, and identify the level of
stability of the urban bird community, I quantified the relative changes in species rank abundances
(Figure 12). There was a statistically significant increase in the relative changes in species rank
abundance as there was an increase in relative dwellings within an LGA. Consequently, bird
communities have been adversely impacted and altered due to urban growth in metropolitan
Adelaide.
To develop a more comprehensive understanding of urban growth, I identified the species that
had encountered significant changes in abundance or presence-absence associated with the
explanatory variable (relative dwelling increase). There were significant differences in both
species’ presence-absence, and species abundances between the two periods. Eight species
experienced a significant increase in presences in the LGAs from 1980 to 2010, and 9 species
experienced significant absences in the LGAs from 1980 to 2010 (Table 4, Figure 11). Species
abundance changes highlighted that 26 species have undergone a significant change in abundance
since 1980 (Table 5, Figure 13). Urban growth in metropolitan Adelaide has significantly altered
bird species populations. Identifying these species can assist restoration strategies to target specific
species or functional groups that are experiencing the heightened levels of change due
If Green Adelaide and the LGAs take these results into consideration, urban planning
strategies can be developed across metropolitan Adelaide that minimise the impacts of
urbanisation and contributes to the conservation of the entire ecosystem. It is recommended that a
focus on practical methods to increase the diversity of native bird communities is implemented.
Vegetation restoration, and invasive vegetation control are two methods that are proven to
contribute to the conservation and recovery of Australian urban environments (Archibald et al.
2017).

33
4.1 Utilising bird communities to analyse the impacts of urban growth
Bird communities have been negative impacted and altered due to urban growth in
metropolitan Adelaide. There was a statistically significant increase in the relative changes in
species rank abundance as there was an increase in relative dwellings within a LGA (Figure 12).
When inspecting the LGAs individually, reordering of species abundance was most prominent in
Salisbury, Onkaparinga, and Playford Council (Appendix I). This is a great area of concern as
these three councils are the largest LGAs within Green Adelaide, with high proportions of native
vegetation still present (Appendix E & F).
If rapid urbanisation continues to increase in these LGAs, there is an elevated risk of future
changes in species abundance and local extinction through the removal of large areas of native
land to account for urban growth demands. It is crucial that these LGAs direct efforts towards the
conservation and restoration of native vegetation to protect a broad range of species, prevent
species turnover, and avoid local extinction (Chace and Walsh 2006). I have predicted that
specialised feeding guilds such as insectivores, and small bodied species will experience
heightened threats and species loss if unsustainable urban growth continues to occur.
Once an area is urbanised, the species-level response to urbanisation is exceedingly diverse.
Species compositions can completely shift, with some species flourishing and others entirely
disappearing (Isaksson 2018). Bird species that can adapt and flourish are able to exploit the human
resources. Many of these exploiters are invasive species, such as domestic pigeons are now
becoming increasingly common in urban areas (Chace & Walsh 2006; Suri et al. 2017).
Unfortunately, for a majority of the native Australian birds, urbanisation is extremely detrimental
as they respond to native vegetation structure and composition (Chace & Walsh 2006). However,
cities that maintain native vegetation composition and structures are likely to retain more native
bird species than those that do not (Chace and Walsh 2006).
Holdfast Bay, Marion, and Unley experienced the highest turnover of bird communities, led
by the highest level of species disappearances. This may imply that these LGAs are extremely
unsuitable for contemporary bird communities (Figure 9), and have become increasingly
uninhabitable since the 1980s (Egwumah, Egwumah & Edet 2017). When analysing the relative
increase in dwellings and turnover of bird communities, there was no significant increase (Figure
10). Yet when inspecting the LGAs individually, some had more than 50% turnover of bird species

34
(Holdfast Bay, Marion, and Unley, Figure 9). These LGAs all have high levels of urbanisation
(Appendix E), and high levels of dwelling density (Appendix G) both in the 1980s and 2010s,
yet due to the already high levels of urbanisation in the 1980s, relative dwelling increase was low
(Appendix G). Implying that although there may have been low levels of relative dwelling
increase, bird communities within these LGAs may have already been impacted by the already
high levels of dwelling density in the 1980s.
4.2 Analysing what species have undergone changes due to urban growth
There is a broad array of avian foraging guilds in Australia, with many native birds relying on
specialised food resources to survive (Ikin et al. 2012). An in-depth knowledge on the impacts of
urbanisation on bird species, is required to obtain an understanding on the level of urban tolerance
a species can handle (Callaghan, Major, et al. 2019). Small-bodied insectivores and ground-
foraging granivores were most strongly impacted by urban growth in metropolitan Adelaide
(Figure 11 & 13).
Ground-foraging granivores have undergone a decline in assemblages and abundances across
metropolitan Adelaide. Grasslands throughout Australia are a primary food source for granivores,
and metropolitan Adelaide was historically an open grassy plain (Clark 1991). Colonisation of
metropolitan Adelaide saw native grasslands greatly removed due to urban growth (Bagust &
Tout-Smyth 2010). Furthermore, remnant grasslands have been invaded by exotic and highly
invasive species (Lenz, MOYLE‐CROFT & Facelli 2003). Small to medium bodied insectivores
in metropolitan Adelaide have also been negatively impacted by urban growth. This is supported
by previous research highlighting the loss of insectivores as understorey grasslands are removed
for urban growth (Bowler et al. 2019).
Urbanisation of Australian cities into uniformed environments have led to the progressive loss
of species with specialised feeding strategies, such as granivorous and insectivorous species
(Callaghan, Major, et al. 2019). Urbanisation has removed vegetation that is structurally diverse
and had provided food and shelter to a comprehensive range of foraging guilds and zomes.
Insectivores and granivores are specialist species that are not able to adapt to the limited resources
in urban environments, resulting in population declines and local extinctions (Sol et al. 2014).
The alien European greenfinch has undergone a decline in abundance across metropolitan
Adelaide, which is a positive outcome as it is an invasive species and a declared animal under the

35
Natural Resources Management Act 2004. Under this act, a permit is required to release, and there
is requirement to control the European greenfinch (Government of South Australia 2004).
Species that underwent an increase in assemblages and abundances, were primarily medium
to large bodied species with a history of being behaviourally aggressive (Figure 11 & 13). This
finding is consistent with previous research that identified the Australian magpies (Gymnorhina
tibican), Australian white ibis (Threskiornis moluccus), sparrowhawks (Accipiter spp.),
currawongs (Strepera spp.), noisy miners (Manorina melanocephala), and lorikeets
(Trichoglossus spp.) as having increased their populations in several Australian cities since
European colonisation (Cleary et al. 2016; Fitzsimons et al. 2003; Jones 2003; Jones & Wieneke
2000; Major & Parsons 2010; Smith, Munro & Figueira 2013; Suri et al. 2017; Wood & Recher
2004). These species are successful avian adaptors to anthropogenically modified ecosystems
(Davis, Taylor & Major 2012; Major & Parsons 2010).
Globally, urbanisation has led to a major homogenisation of urban biodiversity, and reduction
of native species richness (Aronson et al. 2014). Urban tolerant species have become progressively
widespread and locally abundant in urban cities, increasing biological homogenisation, and
reducing local genetic diversity (Lemoine-Rodríguez, Inostroza & Zepp 2020; McKinney 2006).
Identifying species that have undergone population changes due to urban growth in metropolitan
Adelaide can assist restoration strategies to target key foraging zones and areas where specific
species or functional groups are experiencing the heightened levels of change.
4.3 Practical methods to increase the diversity of native bird communities
The process of urbanisation is an extreme form of land-use intensification causing a reduction
and fragmentation of natural habitats (Isaksson 2018). The new urban conditions have replaced
native landscape with buildings and roads, and the simplified landscape areas tend to consist of
invasive plants, managed lawns, and removal of the mid-story canopy (Aronson et al. 2015; Luck
& Smallbone 2010). With urbanisation predicted to continue to rapidly expand, dwellings will
continue to replace native vegetation to keep up with the growing urban demand. Hence, it is
crucial that sustainable management must better address biodiversity conservation to prevent the
continued alteration and local extinction of Australia’s bird communities (Burgin 2016).
All 16 LGAs in the metropolitan Adelaide region need to focus on practical methods to
increase the diversity of native bird communities. Vegetation restoration, and invasive vegetation

36
control are two methods that are vital in Australian urban environments (Archibald et al. 2017).
LGA’s that still have higher levels of native vegetation and are less urbanised (Onkaparinga,
Playford, and Salisbury) should focus on improving the quality of native understorey and grasses
within urban green areas and remnant vegetation. Previous literature identified changes in the
composition of bird species in South Australia had occurred due to the loss of understorey plant
species, which had mainly impacted smaller bird species that utilise this foraging zone for food
and shelter (Paton et al. 2000). This will help provide habitat and food sources for specialised
species such as small-bodied insectivores and ground-dwelling granivores that have undergone
population declines.
Unfortunately, there are LGA’s in metropolitan Adelaide that are highly urbanised and have
experienced extreme levels of vegetation clearance for urban land (Prospect, Unley, and
Walkerville). These LGAs have undergone a structural simplification of their landscape, with the
transition from native vegetation to urban environments with a reduced and often exotic vegetation
structure (Zivanovic & Luck 2016). However, there are still mitigation strategies that these LGA’s
can implement to promote vegetation and urban greening. Previous research analysing public
green spaces in an urban city (Melbourne, Australia) identified that verge strips made up 36.7% of
public green spaces (Marshall, Grose & Williams 2019). Verge strips are currently managed in
LGA’s by planting a mixture of native and exotic tree species, and an understorey layer of exotic
grass that is frequently mowed (City of Marion 2020; City of Port Adelaide Enfield 2020). If
LGA’s focus on replacing this with indigenous tree species and establishing a more complex
understorey layer of indigenous plants, verge strips can act as an urban greenspace that will
contribute to increasing native bird species diversity (Gillner et al. 2015; Marshall, Grose &
Williams 2019). This will not only help LGA’s to improve native bird communities, with research
highlighting the importance of verge gardens in regulating temperature (Gillner et al. 2015),
reducing storm water runoff and air pollution (Armson, Stringer & Ennos 2013; Vailshery,
Jaganmohan & Nagendra 2013), and even improving human health through a reduction in stress
and increasing social cohesion (De Vries et al. 2013).
4.4 Future directions
Urbanisation has substantially impacted bird communities in metropolitan Adelaide, with a
significant change in community rank abundance, and abundance changes for 26 species (Figure
12 & 13). To understand the impacts of urbanisation on bird species in metropolitan Adelaide,

37
relative dwelling increase was utilised as an indicator of urbanisation. This is an important
beginning to understand how urbanisation and land use change has directly impacted species
declines but future research is still required. Urbanisation is so detrimental to native ecosystems,
as not only is native vegetation entirely cleared for anthropogenic uses, but urbanisation alters
water availability, provides an entry point for invasive species, and increases pollution and nutrient
levels (Ormond et al. 2014). Due to these impacts, the United Nations (2013) have identified
urbanisation as a major global threat, that is only going to continue to rapidly increase. Future
research should focus on better understanding how ecological processes respond to the impacts of
urbanisation to assist in reducing these impacts and implementing effective conservation strategies
(Lepczyk et al. 2017).
Bird communities were measured as they are a reliable and cost-effective bioindicator species
to determine the health of an ecosystem, and can assist in establishing the environmental integrity
(Egwumah, Egwumah & Edet 2017). It is crucial that monitoring of bird species, and restoration
of vegetation is implemented not only in these large LGAs, but the entire metropolitan Adelaide,
as Australian birds are considered to be relatively long lived. Populations may persist in unsuitable
urban areas for a longer period before they disappear (Ford et al. 2001; Sol et al. 2020).
4.5 Conclusion
Since colonisation, anthropogenic impacts within Australia have resulted in the extinction of
27 bird species (Garnett, Szabo & Dutson 2011). Within metropolitan Adelaide alone, 21 species
have gone locally extinct (Tait, Daniels & Hill 2005). Temporal studies are a valuable resource to
evaluate the underlying patterns of community change (Ryo et al. 2019). To understand the
impacts of urbanisation, the aim of my research was to determine the composition of bird species
as an indicator of biodiversity loss in the Adelaide metropolitan area. There was a statistically
significant increase in the relative changes in species rank abundance as there was an increase in
relative dwellings within a LGA (Figure 12). Furthermore, 26 species have undergone significant
changes in abundance (Figure 13). This highlights the impacts that urbanisation is having on bird
communities in the Adelaide region.
With the population of Australia expected to surge up to 49.2 million people by 2066
(Australian Bureau of Statistics 2017), it is crucial that efforts are made to reduce the destruction
urbanisation causes, to not only prevent bird species loss, but prevent the loss and extinction of
entire ecosystems. Preventing the impacts of urbanisation through understanding the relationship

38
between urban ecosystems and avian functional diversity is extremely complex, and understanding
the changes within an ecological community is merely a preliminary step in conservation (Oliveira
Hagen et al. 2017). All 16 LGAs within metropolitan Adelaide immediately need to implement
practical methods that aim to increase native bird communities. Vegetation restoration, and
invasive vegetation control are two methods that are required in Australian urban environments
(Archibald et al. 2017). For highly urbanised LGAs, public green spaces such as verge strips need
to focus on planting indigenous tree species and establishing a more complex understorey layer of
indigenous plants. For LGAs that are experiencing high urban growth, and are still fortunate
enough to contain large areas of native vegetation, it is crucial that they focus on improving the
quality of native understorey and grasses within urban green areas and remnant vegetation.
Recent research has proposed that maintaining bird species diversity and therefore vital
ecosystem services and functions is still achievable in areas experiencing urban growth (Sol et al.
2020). For this to occur in metropolitan Adelaide, practical conservation methods and forward-
looking policies need to be implemented. Therefore, it is crucial that Green Adelaide and the
Government of South Australia implement the recommendations stated in this paper into future
urban planning strategies that can contribute to conserving bird species and their diversity in
metropolitan Adelaide (Sushinsky et al. 2013).
References Archibald, CL, McKinney, M, Mustin, K, Shanahan, DF & Possingham, HP 2017, 'Assessing the
impact of revegetation and weed control on urban sensitive bird species', Ecology and
evolution, vol. 7, no. 12, pp. 4200-4208.
Armson, D, Stringer, P & Ennos, A 2013, 'The effect of street trees and amenity grass on urban
surface water runoff in Manchester, UK', Urban Forestry & Urban Greening, vol. 12, no.
3, pp. 282-286.
Aronson, MF, Handel, SN, La Puma, IP & Clemants, SE 2015, 'Urbanization promotes non-native
woody species and diverse plant assemblages in the New York metropolitan region', Urban
Ecosystems, vol. 18, no. 1, pp. 31-45.
Aronson, MF, La Sorte, FA, Nilon, CH, Katti, M, Goddard, MA, Lepczyk, CA, Warren, PS,
Williams, NS, Cilliers, S & Clarkson, B 2014, 'A global analysis of the impacts of
urbanization on bird and plant diversity reveals key anthropogenic drivers', Proceedings of
the Royal Society B: Biological Sciences, vol. 281, no. 1780, p. 20133330.
Ashley, LC, Major, RE & Taylor, CE 2009, 'Does the presence of grevilleas and eucalypts in urban
gardens influence the distribution and foraging ecology of Noisy Miners?', Emu-Austral
Ornithology, vol. 109, no. 2, pp. 135-142.
Attwood, SJ, Park, SE, Maron, M, Collard, SJ, Robinson, D, Reardon-Smith, KM & Cockfield, G
2009, 'Declining birds in Australian agricultural landscapes may benefit from aspects of

39
the European agri-environment model', Biological Conservation, vol. 142, no. 10, pp.
1981-1991.
Australian Bureau of Statistics 2017, Population Projections, Australia, Population projections
(based on assumptions of fertility, mortality and migration) for Australia, states and
territories and capital cities, Australian Government, Canberra.
Australian Bureau of Statistics 2020, Historical Census Data, Canberra.
Australian State of Environment 2006, Australian State of Environment Report – coast and oceans.
Banks, PB & Smith, HM 2015, 'The ecological impacts of commensal species: black rats, , at the
urban–bushland interface', Wildlife Research, vol. 42, no. 2, pp. 86-97.
Bagust, P. and Tout-Smith, L., 2010. The Native Plants of Adelaide: Returning the Vanishing
Natural Heritage of the Adelaide Plains to Your Garden. Wakefield Press.
Barnosky, AD, Matzke, N, Tomiya, S, Wogan, GO, Swartz, B, Quental, TB, Marshall, C,
McGuire, JL, Lindsey, EL & Maguire, KC 2011, 'Has the Earth’s sixth mass extinction
already arrived?', Nature, vol. 471, no. 7336, pp. 51-57.
BirdLife SA 2020, 'Australia's Birds', South Australia, <https://birdlife.org.au/>.
Blouin, D, Pellerin, S & Poulin, M 2019, 'Increase in non-native species richness leads to biotic
homogenization in vacant lots of a highly urbanized landscape', Urban Ecosystems, vol.
22, no. 5, pp. 879-892.
Bowler, DE, Heldbjerg, H, Fox, AD, de Jong, M & Böhning‐Gaese, K 2019, 'Long‐term declines
of European insectivorous bird populations and potential causes', Conservation biology,
vol. 33, no. 5, pp. 1120-1130.
Bradshaw, CJ 2012, 'Little left to lose: deforestation and forest degradation in Australia since
European colonization', Journal of Plant Ecology, vol. 5, no. 1, pp. 109-120.
Bureau of Meteorology 2020, 'Climate Statistics for Australian Locations', in Australian
Government (ed.)Canberra.
Burgess, EE & Maron, M 2016, 'Does the response of bird assemblages to fire mosaic properties
vary among spatial scales and foraging guilds?', Landscape Ecology, vol. 31, no. 3, pp.
687-699.
Burgin, S 2016, 'What about biodiversity? Redefining urban sustainable management to
incorporate endemic fauna with particular reference to Australia', Urban Ecosystems, vol.
19, no. 2, pp. 669-678.
Burgman, MA & Lindenmayer, D 1998, Conservation biology for the Australian environment,
Surrey Beatty & Sons.
Callaghan, CT, Bino, G, Major, RE, Martin, JM, Lyons, MB & Kingsford, RT 2019,
'Heterogeneous urban green areas are bird diversity hotspots: insights using continental-
scale citizen science data', Landscape Ecology, vol. 34, no. 6, pp. 1231-1246.
Callaghan, CT, Major, RE, Wilshire, JH, Martin, JM, Kingsford, RT & Cornwell, WK 2019,
'Generalists are the most urban‐tolerant of birds: a phylogenetically controlled analysis of
ecological and life history traits using a novel continuous measure of bird responses to
urbanization', Oikos, vol. 128, no. 6, pp. 845-858.
Chace, JF & Walsh, JJ 2006, 'Urban effects on native avifauna: a review', Landscape and Urban
Planning, vol. 74, no. 1, pp. 46-69.
Chambers, SA 2008, Birds as environmental indicators: review of literature, Parks Victoria
Melbourne.
Chapman, AD 2009, Numbers of living species in Australia and the world, Australian Government,
Toowoomba.
Cincotta, RP, Wisnewski, J & Engelman, R 2000, 'Human population in the biodiversity hotspots',
Nature, vol. 404, no. 6781, pp. 990-992.
40
City of Marion 2020, Verges, <https://www.marion.sa.gov.au/services-we-offer/nature-strips-and-
street-trees/verge>.
City of Port Adelaide Enfield 2020, Urban Landscaping.
Clarke, PA 1991, 'Adelaide as an Aboriginal landscape', Aboriginal History, pp. 54-72.
Cleary, GP, Parsons, H, Davis, A, Coleman, BR, Jones, DN, Miller, KK & Weston, MA 2016,
'Avian assemblages at bird baths: a comparison of urban and rural bird baths in Australia',
PLoS ONE, vol. 11, no. 3.
Collins, SL, Suding, KN, Cleland, EE, Batty, M, Pennings, SC, Gross, KL, Grace, JB, Gough, L,
Fargione, JE & Clark, CM 2008, 'Rank clocks and plant community dynamics', Ecology,
vol. 89, no. 12, pp. 3534-3541.
Davis, A, Taylor, CE & Major, RE 2012, 'Seasonal abundance and habitat use of Australian parrots
in an urbanised landscape', Landscape and Urban Planning, vol. 106, no. 2, pp. 191-198.
De Vries, S, Van Dillen, SM, Groenewegen, PP & Spreeuwenberg, P 2013, 'Streetscape greenery
and health: stress, social cohesion and physical activity as mediators', Social science &
medicine, vol. 94, pp. 26-33.
Dolby, T 2014, Finding Australian birds a field guide to birding locations, Bird finding in
Australia, ed. R Clarke, CSIRO Publishing, Collingwood, Vic.
Egwumah, F, Egwumah, P & Edet, D 2017, 'Paramount roles of wild birds as bioindicators of
contamination', Int J Avian & Wildlife Biol, vol. 2, no. 6, p. 00041.
EPBC Act 1999, 'Environment protection and biodiversity conservation act', Commonwealth of
Australia.
Faulkner, S 2004, 'Urbanization impacts on the structure and function of forested wetlands', Urban
Ecosystems, vol. 7, no. 2, pp. 89-106.
Fitzsimons, J, Palmer, GC, Antos, MJ & White, J 2003, 'Refugees and residents: densities and
habitat preferences of lorikeets in urban Melbourne', Australian Field Ornithology, vol. 20,
pp. 2-7.
Foley, JA, Defries, R, Asner, GP, Barford, C, Bonan, G, Carpenter, SR, Chapin, FS, Coe, MT,
Daily, GC, Gibbs, HK, Helkowski, JH, Holloway, T, Howard, EA, Kucharik, CJ,
Monfreda, C, Patz, JA, Prentice, IC, Ramankutty, N & Snyder, PK 2005, 'Global
consequences of land use', Science (New York, N.Y.), vol. 309, no. 5734, p. 570.
Ford, HA, Barrett, GW, Saunders, DA & Recher, HF 2001, 'Why have birds in the woodlands of
southern Australia declined?', Biological Conservation, vol. 97, no. 1, pp. 71-88.
Francis, RA & Chadwick, MA 2015, 'Urban invasions: non-native and invasive species in cities',
Geography, vol. 100, p. 144.
Fuller, RA, Tratalos, J & Gaston, KJ 2009, 'How many birds are there in a city of half a million
people?', Diversity and Distributions, vol. 15, no. 2, pp. 328-337.
Garden, J, McAlpine, C, Peterson, A, Jones, D & Possingham, H 2006, 'Review of the ecology of
Australian urban fauna: A focus on spatially explicit processes', Austral Ecology, vol. 31,
no. 2, pp. 126-148.
Garnett, S, Szabo, J & Dutson, G 2011, The action plan for Australian birds 2010, CSIRO
publishing.
Gillner, S, Vogt, J, Tharang, A, Dettmann, S & Roloff, A 2015, 'Role of street trees in mitigating
effects of heat and drought at highly sealed urban sites', Landscape and Urban Planning,
vol. 143, pp. 33-42.
Government of South Australia 2004, Natural Resources Management Act 2004, Government of
South Australia, Adelaide.
Government of South Australia 2019, Green Adelaide, Adelaide,
<environment.sa.gov.au/topics/green-adelaide>.

41
Hallett, LM, Avolio, M, Carroll, I, Jones, S, MacDonald, A, Flynn, D & Jones, M 2016, 'codyn:
Community dynamics metrics', R Package.
Hallett, LM, Jones, SK, MacDonald, AAM, Jones, MB, Flynn, DF, Ripplinger, J, Slaughter, P,
Gries, C & Collins, SL 2016, 'codyn: an R package of community dynamics metrics',
Methods in ecology and evolution, vol. 7, no. 10, pp. 1146-1151.
Ikin, K, Knight, E, Lindenmayer, DB, Fischer, J & Manning, AD 2012, 'Linking bird species traits
to vegetation characteristics in a future urban development zone: implications for urban
planning', Urban Ecosystems, vol. 15, no. 4, pp. 961-977.
Isaksson, C 2018, 'Impact of urbanization on birds', Bird Species, p. 235.
Ives, CD, Lentini, PE, Threlfall, CG, Ikin, K, Shanahan, DF, Garrard, GE, Bekessy, SA, Fuller,
RA, Mumaw, L, Rayner, L, Rowe, R, Valentine, LE & Kendal, D 2016, 'Cities are hotspots
for threatened species', Global Ecology and Biogeography, vol. 25, no. 1, pp. 117-126.
Jones, D 2003, 'Contemporary urban ecology: the view from the Antipodes', WIT Transactions on
Ecology and the Environment, vol. 64.
Jones, D & Wieneke, J 2000, 'The suburban bird community of Townsville revisited: changes over
16 years.', Corerlla, vol. 24, pp. 53-60.
Lemoine-Rodríguez, R, Inostroza, L & Zepp, H 2020, 'The global homogenization of urban form.
An assessment of 194 cities across time', Landscape and Urban Planning, vol. 204, p.
103949.
Lenz, TI, MOYLE‐CROFT, JL & Facelli, JM 2003, 'Direct and indirect effects of exotic annual
grasses on species composition of a South Australian grassland', Austral Ecology, vol. 28,
no. 1, pp. 23-32.
Lepczyk, CA, La Sorte, FA, Aronson, MF, Goddard, MA, MacGregor-Fors, I, Nilon, CH &
Warren, PS 2017, 'Global patterns and drivers of urban bird diversity', in Ecology and
conservation of birds in urban environments, Springer, pp. 13-33.
Luck, GW & Smallbone, LT 2010, 'Species diversity and urbanisation: patterns, drivers and
implications', Urban ecology, pp. 88-119.
Lunt, ID 1998, 'Two hundred years of land use and vegetation change in a remnant coastal
woodland in southern Australia', Australian journal of botany, vol. 46, no. 5-6, pp. 629-
647.
MacGregor-Fors, I 2010, 'How to measure the urban-wildland ecotone: redefining ‘peri-urban’
areas', Ecological Research, vol. 25, no. 4, pp. 883-887.
MacKenzie, DI, Nichols, JD, Lachman, GB, Droege, S, Andrew Royle, J & Langtimm, CA 2002,
'Estimating site occupancy rates when detection probabilities are less than one', Ecology,
vol. 83, no. 8, pp. 2248-2255.
Major, RE & Parsons, H 2010, 'What do museum specimens tell us about the impact of
urbanisation? A comparison of the recent and historical bird communities of Sydney', Emu-
Austral Ornithology, vol. 110, no. 1, pp. 92-103.
Marshall, AJ, Grose, MJ & Williams, NS 2019, 'From little things: More than a third of public
green space is road verge', Urban Forestry & Urban Greening, vol. 44, p. 126423.
Marzluff, JM 2001, 'Worldwide urbanization and its effects on birds', in Avian ecology and
conservation in an urbanizing world, Springer, pp. 19-47.
Matz-Lück, N 2007, 'The Eighth Conference of the Parties to the Convention on Biological
Diversity: Summary and Analysis', Max Planck Yearbook of United Nations Law Online,
vol. 11, no. 1, pp. 265-277.
McKinney, M 2006, 'Urbanization as a major cause of biotic homogenization', Biological
Conservation, vol. 127, no. 3, pp. 247-260.
Metcalfe, D & Bui, E 2017, Australia state of the environment 2016: land, vol. 10, Canberra.

42
Minchin, PR 1987, 'An evaluation of the relative robustness of techniques for ecological
ordination', in Theory and models in vegetation science, Springer, pp. 89-107.
Møller, AP, Díaz, M, Flensted-Jensen, E, Grim, T, Ibáñez-Álamo, JD, Jokimäki, J, Mänd, R,
Markó, G & Tryjanowski, P 2015, 'Urbanized birds have superior establishment success in
novel environments', Oecologia, vol. 178, no. 3, pp. 943-950.
Oke, R 1997, Conserving Adelaide’s biodiversity: a planned approach., Adelaide, Australia.
Olden, JD, Comte, L & Giam, X 2018, 'The Homogocene: a research prospectus for the study of
biotic homogenisation', NeoBiota, vol. 37, p. 23.
Ormond, SE, Whatmough, R, Hudson, IL & Daniels, CB 2014, 'Environmental and Anthropogenic
Impacts on Avifaunal Assemblages in an Urban Parkland, 1976 to 2007', Animals, vol. 4,
no. 1, pp. 119-130.
Padoa-Schioppa, E, Baietto, M, Massa, R & Bottoni, L 2006, 'Bird communities as bioindicators:
The focal species concept in agricultural landscapes', Ecological Indicators, vol. 6, no. 1,
pp. 83-93.
Paton, D, Carpenter, G & Sinclair, R 1994, 'A SECOND BIRD ATLAS OF THE ADELAIDE
REGION. PART 1: CHANGES IN THE DISTRIBUTION OF JEIRDS; 1974-75 vg 1984-
85'.
Paton, D, Prescott, A, Davies, R & Heard, L 2000, 'The distribution, status and threats to temperate
woodlands in South Australia', Temperate eucalypt woodlands in Australia: biology,
conservation, management and restoration, pp. 57-85.
QGIS 2020, 'QGIS Geographic Information System. Open Source Geospatial Foundation Project'.
R Core Team 2019, 'R: A Language and Environment for Statistical Computing (Version 3.5. 2,
R Foundation for Statistical Computing, Vienna, Austria, 2018)', There is no
corresponding record for this reference.[Google Scholar].
Reis, E, López-Iborra, GM & Pinheiro, RT 2012, 'Changes in bird species richness through
different levels of urbanization: Implications for biodiversity conservation and garden
design in Central Brazil', Landscape and Urban Planning, vol. 107, no. 1, pp. 31-42.
Ryo, M, Aguilar-Trigueros, CA, Pinek, L, Muller, LA & Rillig, MC 2019, 'Basic principles of
temporal dynamics', Trends in ecology & evolution, vol. 34, no. 8, pp. 723-733.
Smith, ACM, Munro, U & Figueira, WF 2013, 'Modelling urban populations of the Australian
White Ibis (Threskiornis molucca) to inform management', Population ecology, vol. 55,
no. 4, pp. 567-574.
Sol, D, González‐Lagos, C, Moreira, D, Maspons, J & Lapiedra, O 2014, 'Urbanisation tolerance
and the loss of avian diversity', Ecology Letters, vol. 17, no. 8, pp. 942-950.
Sol, D, Lapiedra, O & González-Lagos, C 2013, 'Behavioural adjustments for a life in the city',
Animal Behaviour, vol. 85, no. 5, pp. 1101-1112.
Sol, D, Trisos, C, Múrria, C, Jeliazkov, A, González‐Lagos, C, Pigot, AL, Ricotta, C, Swan, CM,
Tobias, JA, Pavoine, S & Storch, D 2020, 'The worldwide impact of urbanisation on avian
functional diversity', Ecology Letters, vol. 23, no. 6, pp. 962-972.
Suri, J, Sumasgutner, P, Hellard, É, Koeslag, A & Amar, A 2017, 'Stability in prey abundance may
buffer Black Sparrowhawks Accipiter melanoleucus from health impacts of urbanization',
Ibis, vol. 159, no. 1, pp. 38-54.
Sushinsky, JR, Rhodes, JR, Possingham, HP, Gill, TK & Fuller, RA 2013, 'How should we grow
cities to minimize their biodiversity impacts?', Global change biology, vol. 19, no. 2, pp.
401-410.
Szabo, JK, Vesk, PA, Baxter, PWJ & Possingham, HP 2011, 'Paying the extinction debt: woodland
birds in the Mount Lofty Ranges, South Australia', Emu - Austral Ornithology, vol. 111,
no. 1, pp. 59-70.

43
Tait, CJ, Daniels, CB & Hill, RS 2005, 'Changes in species assemblages within the Adelaide
metropolitan area, Australia, 1836–2002', Ecological Applications, vol. 15, no. 1, pp. 346-
359.
The World Bank 2019, 'Urban population (% of total population)', in UNP Division (ed.).
Threlfall, CG, Nicholas, SGW, Amy, KH & Stephen, JL 2016, 'Approaches to urban vegetation
management and the impacts on urban bird and bat assemblages', Landscape and Urban
Planning, vol. 153, pp. 28-39.
Turner, MS 2001, 'Conserving Adelaide's biodiversity: resources'.
United Nations 2018, '2018 revision of world urbanization prospects', United Nations New York.
Vailshery, LS, Jaganmohan, M & Nagendra, H 2013, 'Effect of street trees on microclimate and
air pollution in a tropical city', Urban Forestry & Urban Greening, vol. 12, no. 3, pp. 408-
415.
Wardell-Johnson, G & Williams, M 2000, 'Edges and gaps in mature karri forest, south-western
Australia: logging effects on bird species abundance and diversity', Forest Ecology and
Management, vol. 131, no. 1-3, pp. 1-21.
Warton, DI, Wright, ST & Wang, Y 2012, 'Distance‐based multivariate analyses confound location
and dispersion effects', Methods in ecology and evolution, vol. 3, no. 1, pp. 89-101.
White, JG, Antos, MJ, Fitzsimons, JA & Palmer, GC 2005, 'Non-uniform bird assemblages in
urban environments: the influence of streetscape vegetation', Landscape and Urban
Planning, vol. 71, no. 2, pp. 123-135.
Williams, NS, McDonnell, MJ & Seager, EJ 2005, 'Factors influencing the loss of an endangered
ecosystem in an urbanising landscape: a case study of native grasslands from Melbourne,
Australia', Landscape and Urban Planning, vol. 71, no. 1, pp. 35-49.
Willoughby, N, Thompson, D, Royal, M & Miles, M 2018, 'South Australian Land Cover Layers:
an introduction and summary statistics', South Australian Department of Environment and
Water, Adelaide, South Australia.
Wood, P & Recher, HF 2004, 'Long-term persistence of the Australian Magpie, Gymnorhina
tibicen, in Kings Park, Perth', Emu, vol. 104, no. 3, pp. 251-259.
Zivanovic, AJ & Luck, GW 2016, 'Social and environmental factors drive variation in plant and
bird communities across urban greenspace in Sydney, Australia', Journal of Environmental
Management, vol. 169, pp. 210-222.

i
Appendices
A. Species List
A list of the species sighted in both time periods with the unique species name, scientific name,
and common name.
Unique Species Name Scientific Name Common Name
Acanthagenys rufogularis Acanthagenys rufogularis Spiny Cheeked Honeyeater
Acanthiza apicalis Acanthiza apicalis Inland Thornbill
Acanthiza chrysorrhoa Acanthiza chrysorrhoa Yellow Rumped Thornbill
Acanthiza iredalei Acanthiza iredalei Slender Billed Thornbill
Acanthiza lineata Acanthiza lineata Striated Thornbill
Acanthiza nana Acanthiza nana Yellow Thornbill
Acanthiza pusilla Acanthiza pusilla Brown Thornbill
Acanthiza reguloides Acanthiza reguloides Buff Rumped Thornbill
Acanthiza uropygialis Acanthiza uropygialis Chestnut Rumped Thornbill
Acanthorhynchus tenuirostris Acanthorhynchus tenuirostris Eastern Spinebill
Accipiter cirrhocephalus Accipiter cirrhocephalus Collared Sparrowhawk
Accipiter fasciatus Accipiter fasciatus Brown Goshawk
Acridotheres tristis Acridotheres tristis Comon Mynah
Acrocephalus australis Acrocephalus australis Clamorous Reed Warbler
Actitis hypoleucos Actitis hypoleucos Common Sandpiper
Aegotheles cristatus Aegotheles cristatus Australian Owlet Nightjar
Agapornis roseicollis Agapornis roseicollis Peach Faced Lovebird
Alauda arvensis Alauda arvensis Skylark
Anas castanea Anas castanea Chestnut Teal
Anas gracilis Anas gracilis Grey Teal
Anas platyrhynchos Anas platyrhynchos Mallard
Anas platyrhynchos
domesticus
Anas platyrhynchos
domesticus
Domestic Duck
Anas rhynchotis Anas rhynchotis Australasian Shoveler
Anas superciliosa Anas superciliosa Pacific Black Duck
Anhinga melanogaster Anhinga melanogaster Darter
Anser anser domesticus Anser anser domesticus Domestic Goose
Anthochaera carunculata Anthochaera carunculata Red Wattlebird
Anthochaera chrysoptera Anthochaera chrysoptera Little Wattlebird
Anthus novaeseelandiae Anthus novaeseelandiae Richard'S Pipit
Apus pacificus Apus pacificus Fork Tailed Swift
Aquila audax Aquila audax Wedge Tailed Eagle
Ardea alba Ardea alba Great Egret
Ardea ibis Ardea ibis Cattle Egret
Ardea intermedia Ardea intermedia Intermediate Egret

ii
Ardea novaehollandiae Ardea novaehollandiae White Faced Heron
Ardea pacifica Ardea pacifica White Necked Heron
Arenaria interpres Arenaria interpres Ruddy Turnstone
Artamus cinereus Artamus cinereus Black Faced Woodswallow
Artamus cyanopterus Artamus cyanopterus Dusky Woodswallow
Artamus minor Artamus minor Little Woodswallow
Artamus personatus Artamus personatus Masked Woodswallow
Artamus superciliosus Artamus superciliosus White Browed
Woodswallow
Aythya australis Aythya australis Hardhead
Barnardius zonarius Barnardius zonarius Australian Ringneck
Biziura lobata Biziura lobata Musk Duck
Cacatua galerita Cacatua galerita Sulphur Crested Cockatoo
Cacatua leadbeateri Cacatua leadbeateri Major Mitchell'S Cockatoo
Cacatua leadbeateri Cacatua leadbeateri Pink Cockatoo
Cacatua roseicapilla Cacatua roseicapilla Galah
Cacatua sanguinea Cacatua sanguinea Little Corella
Cacatua tenuirostris Cacatua tenuirostris Long Billed Corella
Cacomantis flabelliformis Cacomantis flabelliformis Fan Tailed Cuckoo
Cairina moschata Cairina moschata Muscovy Duck
Calamanthus pyrrhopygius Calamanthus pyrrhopygius Chestnut Rumped Hylacola
Calamanthus pyrrhopygius Calamanthus pyrrhopygius Chestnut Rumped Heathwren
Calidris acuminata Calidris acuminata Sharp Tailed Sandpiper
Calidris bairdii Calidris bairdii Baird'S Sandpiper
Calidris canutus Calidris canutus Red Knot
Calidris ferruginea Calidris ferruginea Curlew Sandpiper
Calidris melanotos Calidris melanotos Pectoral Sandpiper
Calidris minuta Calidris minuta Little Stint
Calidris ruficollis Calidris ruficollis Red Necked Stint
Calidris subminuta Calidris subminuta Long Toed Stint
Calidris tenuirostris Calidris tenuirostris Great Knot
Calyptorhynchus funereus Calyptorhynchus funereus Yellow Tailed Black
Cockatoo
Carduelis carduelis Carduelis carduelis European Goldfinch
Carduelis chloris Carduelis chloris European Greenfinch
Catharacta skua Catharacta skua Great Skua
Cereopsis novaehollandiae Cereopsis novaehollandiae Cape Barren Goose
Certhionyx niger Certhionyx niger Black Honeyeater
Charadrius bicinctus Charadrius bicinctus Double Banded Plover
Charadrius ruficapillus Charadrius ruficapillus Red Capped Plover
Chenonetta jubata Chenonetta jubata Australian Wood Duck
Cheramoeca leucosternus Cheramoeca leucosternus White Backed Swallow
Chlidonias hybridus Chlidonias hybridus Whiskered Tern
Chlidonias leucopterus Chlidonias leucopterus White Winged Black Tern

iii
Chrysococcyx basalis Chrysococcyx basalis Horsfield'S Bronze Cuckoo
Chrysococcyx lucidus Chrysococcyx lucidus Shining Bronze Cuckoo
Chrysococcyx osculans Chrysococcyx osculans Black Eared Cuckoo
Cincloramphus cruralis Cincloramphus cruralis Brown Songlark
Cincloramphus mathewsi Cincloramphus mathewsi Rufous Songlark
Circus approximans Circus approximans Swamp Harrier
Circus assimilis Circus assimilis Spotted Harrier
Cisticola exilis Cisticola exilis Golden Headed Cisticola
Cladorhynchus
leucocephalus
Cladorhynchus
leucocephalus
Banded Stilt
Climacteris picumnus Climacteris picumnus Brown Treecreeper
Colluricincla harmonica Colluricincla harmonica Grey Shrike Thrush
Columba livia Columba livia Rock Dove
Coracina novaehollandiae Coracina novaehollandiae Black Faced Cuckoo Shrike
Corcorax melanorhamphos Corcorax melanorhamphos White Winged Chough
Cormobates leucophaeus Cormobates leucophaeus White Throated Teecreeper
Corvus mellori Corvus mellori Little Raven
Coturnix pectoralis Coturnix pectoralis Stubble Quail
Coturnix ypsilophora Coturnix ypsilophora Brown Quail
Cracticus nigrogularis Cracticus nigrogularis Pied Butcherbird
Cracticus torquatus Cracticus torquatus Grey Butcherbird
Cuculus pallidus Cuculus pallidus Pallid Cuckoo
Cygnus atratus Cygnus atratus Black Swan
Dacelo novaeguineae Dacelo novaeguineae Laughing Kookaburra
Daphoenositta chrysoptera Daphoenositta chrysoptera Varied Sittella
Dicaeum hirundinaceum Dicaeum hirundinaceum Mistletoebird
Diomedea chlororhynchos Diomedea chlororhynchos Yellow Nosed Albatross
Dromaius novaehollandiae Dromaius novaehollandiae Emu
Egretta garzetta Egretta garzetta Little Egret
Egretta sacra Egretta sacra Eastern Reef Egret
Elanus axillaris Elanus axillaris Black Shouldered Kite
Elseyornis melanops Elseyornis melanops Black Fronted Dotterel
Eopsaltria griseogularis Eopsaltria griseogularis Western Yellow Robin
Epthianura albifrons Epthianura albifrons White Fronted Chat
Erythogonys cinctus Erythogonys cinctus Red Kneed Dotterel
Eudyptula minor Eudyptula minor Little Penguin
Eurostopodus argus Eurostopodus argus Spotted Nightjar
Falco berigora Falco berigora Brown Falcon
Falco cenchroides Falco cenchroides Nankeen Kestrel
Falco hypoleucos Falco hypoleucos Grey Falcon
Falco longipennis Falco longipennis Australian Hobby
Falco peregrinus Falco peregrinus Peregrine Falcon
Falco subniger Falco subniger Black Falcon
Falcunculus frontatus Falcunculus frontatus Crested Shrike Tit

iv
Fulica atra Fulica atra Eurasian Coot
Gallinago hardwickii Gallinago hardwickii Latham'S Snipe
Gallinula tenebrosa Gallinula tenebrosa Dusky Moorhen
Gallinula ventralis Gallinula ventralis Black Tailed Native Hen
Gallirallus philippensis Gallirallus philippensis Buff Banded Rail
Gelochelidon nilotica Gelochelidon nilotica Gull Billed Tern
Geopelia cuneata Geopelia cuneata Diamond Dove
Geopelia placida Geopelia placida Peaceful Dove
Gerygone olivacea Gerygone olivacea White Throated Gerygone
Gliciphila melanops Gliciphila melanops Tawny Crowned Honeyeater
Glossopsitta concinna Glossopsitta concinna Musk Loikeet
Glossopsitta
porphyrocephala
Glossopsitta
porphyrocephala
Purple Crowned Lorikeet
Grallina cyanoleuca Grallina cyanoleuca Australian Magpie Lark
Gymnorhina tibicen Gymnorhina tibicen Australian Magpie
Haematopus fuliginosus Haematopus fuliginosus Sooty Oystercatcher
Haematopus longirostris Haematopus longirostris Pied Oystercatcher
Haliaeetus leucogaster Haliaeetus leucogaster White Bellied Sea Eagle
Haliastur sphenurus Haliastur sphenurus Whistling Kite
Hieraaetus morphnoides Hieraaetus morphnoides Little Eagle
Himantopus himantopus Himantopus himantopus Black Winged Stilt
Hirundapus caudacutus Hirundapus caudacutus White Throated Needletail
Hirundo neoxena Hirundo neoxena Welcome Swallow
Lalage tricolor Lalage tricolor White Winged Triller
Larus dominicanus Larus dominicanus Kelp Gull
Larus novaehollandiae Larus novaehollandiae Silver Gull
Larus pacificus Larus pacificus Pacific Gull
Lichenostomus chrysops Lichenostomus chrysops Yellow Faced Honeyeater
Lichenostomus ornatus Lichenostomus ornatus Yellow Plumed Honeyeater
Lichenostomus penicillataus Lichenostomus penicillataus White Plumed Honeyeater
Lichenostomus virescens Lichenostomus virescens Singing Honeyeater
Limosa lapponica Limosa lapponica Bar Tailed Godwit
Limosa limosa Limosa limosa Black Tailed Godwit
Lonchura punctulata Lonchura punctulata Nutmeg Mannikin
Lophoictinia isura Lophoictinia isura Square Tailed Kite
Malacorhynchus
membranaceus
Malacorhynchus
membranaceus
Pink Eared Duck
Malurus cyaneus Malurus cyaneus Superb Fairy Wren
Malurus lamberti Malurus lamberti Variegated Fairy Wren
Malurus leucopterus Malurus leucopterus White Winged Fairy Wren
Manorina flavigula Manorina flavigula Yellow Thoated Miner
Manorina melanocephala Manorina melanocephala Noisy Miner
Megalurus gramineus Megalurus gramineus Little Grassbird
Melanodryas cucullata Melanodryas cucullata Hooded Robin

v
Melithreptus brevirostris Melithreptus brevirostris Brown Headed Honeyeater
Melithreptus gularis Melithreptus gularis Black Chinned Honeyeater
Melithreptus lunatus Melithreptus lunatus White Naped Honeyeater
Melopsittacus undulatus Melopsittacus undulatus Budgerigar
Merops ornatus Merops ornatus Rainbow Bee Eater
Microeca fascinans Microeca fascinans Jacky Winter
Milvus migrans Milvus migrans Black Kite
Mirafra javanica Mirafra javanica Singing Bushlark
Morus serrator Morus serrator Australasian Gannet
Myiagra inquieta Myiagra inquieta Restless Flycatcher
Neochima temporalis Neochima temporalis Red Browed Finch
Neophema chrysostoma Neophema chrysostoma Blue Winged Parrot
Neophema elegans Neophema elegans Elegant Parrot
Neophema petrophila Neophema petrophila Rock Parrot
Ninox novaeseelandiae Ninox novaeseelandiae Southern Boobook
Numenius madagascariensis Numenius madagascariensis Far Eastern Curlew
Numenius phaeopus Numenius phaeopus Whimbrel
Nycticorax caledonicus Nycticorax caledonicus Nankeen Night Heron
Nymphicus hollandicus Nymphicus hollandicus Cockatiel
Oceanites oceanicus Oceanites oceanicus Wilson'S Storm Petrel
Ocyphaps lophotes Ocyphaps lophotes Crested Pigeon
Oriolus sagittatus Oriolus sagittatus Olive Backed Oriole
Oxyura australis Oxyura australis Blue Billed Duck
Pachycephala inornata Pachycephala inornata Gilbert'S Whistler
Pachycephala pectoralis Pachycephala pectoralis Golden Whistler
Pachycephala rufiventris Pachycephala rufiventris Rufous Whistler
Pardalotus punctatus Pardalotus punctatus Spotted Pardalote
Pardalotus striatus Pardalotus striatus Striated Pardalote
Passer domesticus Passer domesticus House Sparrow
Pavo cristatus Pavo cristatus Indian Peafowl
Pelecanus conspicillatus Pelecanus conspicillatus Australian Pelican
Petrochelidon ariel Petrochelidon ariel Fairy Martin
Petrochelidon nigricans Petrochelidon nigricans Tree Martin
Petroica goodenovii Petroica goodenovii Red Capped Robin
Petroica multicolor Petroica multicolor Scarlet Robin
Petroica rosea Petroica rosea Rose Robin
Phalacrocorax carbo Phalacrocorax carbo Great Cormorant
Phalacrocorax fuscescens Phalacrocorax fuscescens Black Faced Cormorant
Phalacrocorax melanoleucos Phalacrocorax melanoleucos Little Pied Cormorant
Phalacrocorax sulcirostris Phalacrocorax sulcirostris Little Black Cormorant
Phalacrocorax varius Phalacrocorax varius Pied Cormorant
Phalaropus lobatus Phalaropus lobatus Red Necked Phalarope
Phaps chalcoptera Phaps chalcoptera Common Bronzewing
Phaps elegans Phaps elegans Brush Bronzewing

vi
Philomachus pugnax Philomachus pugnax Ruff
Phylidonyris albifrons Phylidonyris albifrons White Fronted Honeyeater
Phylidonyris
novaehollandiae
Phylidonyris
novaehollandiae
New Holland Honeyeater
Phylidonyris pyrrhoptera Phylidonyris pyrrhoptera Crescent Honeyeater
Platalea flavipes Platalea flavipes Yellow Billed Spoonbill
Platalea regia Platalea regia Royal Spoonbill
Platycercus elegans Platycercus elegans Crimson Rosella
Platycercus eximius Platycercus eximius Eastern Rosella
Plegadis falcinellus Plegadis falcinellus Glossy Ibis
Pluvialis fulva Pluvialis fulva Pacific Golden Plover
Pluvialis squatarola Pluvialis squatarola Grey Plover
Podargus strigoides Podargus strigoides Tawny Frogmouth
Podiceps cristatus Podiceps cristatus Great Crested Grebe
Poephila acuticauda Poephila acuticauda Long Tailed Finch
Poliocephalus poliocephalus Poliocephalus poliocephalus Hoary Headed Grebe
Polytelis anthopeplus Polytelis anthopeplus Regent Parrot
Pomatostomus superciliosus Pomatostomus superciliosus White Browed Babbler
Porphyrio porphyrio Porphyrio porphyrio Purple Swamphen
Porzana fluminea Porzana fluminea Australian Spotted Crake
Porzana pusilla Porzana pusilla Baillon'S Crake
Porzana tabuensis Porzana tabuensis Spotless Crake
Psephotus haematonotus Psephotus haematonotus Red Rumped Parrot
Psittacula krameria Psittacula krameri Indian Ringneck
Puffinus gavia Puffinus gavia Fluttering Shearwater
Puffinus tenuirostris Puffinus tenuirostris Short Tailed Shearwater
Pycnonotus jocosus Pycnonotus jocosus Red Whiskered Bulbul
Recurvirostra
novaehollandiae
Recurvirostra
novaehollandiae
Red Necked Avocet
Rhipidura fuliginosa Rhipidura fuliginosa Grey Fantail
Rhipidura leucophrys Rhipidura leucophrys Willie Wagtail
Rostratula benghalensis Rostratula benghalensis Painted Snipe
Sericornis frontalis Sericornis frontalis White Browed Scrubwren
Smicrornis brevirostris Smicrornis brevirostris Weebill
Stagonopleura bella Stagonopleura bella Beautiful Firetail
Stagonopleura guttata Stagonopleura guttata Diamond Firetail
Stercorarius parasiticus Stercorarius parasiticus Artic Jaeger
Sterna albifrons Sterna albifrons Little Tern
Sterna bergii Sterna bergii Crested Tern
Sterna caspia Sterna caspia Caspian Tern
Sterna hirundo Sterna hirundo Common Tern
Sterna nereis Sterna nereis Fairy Tern
Stictonetta naevosa Stictonetta naevosa Freckled Duck
Stiltia Isabella Stiltia isabella Australian Prantincole

vii
Strepera versicolor Strepera versicolor Grey Currawong
Streptopelia chinensis Streptopelia chinensis Spotted Dove
Streptopelia risoria Streptopelia risoria Barbary Dove
Sturnus vulgaris Sturnus vulgaris Common Starling
Tachybaptus
novaehollandiae
Tachybaptus
novaehollandiae
Australasian Grebe
Tadorna tadornoides Tadorna tadornoides Australian Shelduck
Taeniopygia guttata Taeniopygia guttata Zebra Finch
Thinornis rubricollis Thinornis rubricollis Hooded Plover
Threskiornis molucca Threskiornis molucca Australian White Ibis
Threskiornis spinicollis Threskiornis spinicollis Straw Necked Ibis
Todiramphus sancta Todiramphus sancta Sacred Kingfisher
Trichoglossus haematodus Trichoglossus haematodus Rainbow Lorikeet
Tringa glareola Tringa glareola Wood Sandpiper
Tringa nebularia Tringa nebularia Common Greenshank
Tringa stagnatilis Tringa stagnatilis Marsh Sandpiper
Tringa tetanus Tringa totanus Redshank
Turdus merula Turdus merula Common Blackbird
Turnix varia Turnix varia Painted Button Quail
Turnix velox Turnix velox Little Button Quail
Tyto alba Tyto alba Barn Owl
Vanellus miles Vanellus miles Masked Lapwing
Vanellus tricolor Vanellus tricolor Banded Lapwing
Xenus cinereus Xenus cinereus Terek Sanpiper
Zoothera lunulate Zoothera lunulata Bassian Thrush
Zosterops lateralis Zosterops lateralis Silvereye

viii
B. Removed Species Names
List of the names of sightings that could not be identified to species level and consequently
removed from the dataset for analysis.
Scientific Name Common Name Code
Unknown Accipter Accipiter Spp ACC
Hybrid bird 2
Eastern Rosella X Crimson
Rosella Hybrid ECR
Unknown Giant Pretrel Giant Petrel Sp XGP
Anas superciliosa x anas
platyrhynchos
Mallard X Pacific Black Duck
Hybrid BDM
Not Recorded Not Recorded NR
Anas superciliosa x anas
platyrhynchos
Pacific Black Duck/Mallard
Hybrid BDM
Unknown 1 Unknown 1 UU
Unknown 2 Unknown 2 UR
Unknown 3 Unknown 3 UW
Aves spp. Unknown Bird UB
Bird of Prey Unknown Bird Of Prey BOP
Cacatua sp. Unknown Corella CORE
Unknown Cormorant Unknown Cormorant Sp COR
Meliphagid spp. Unknown Honeyeater UH
Lorikeet sp. Unknown Lorikeet LOR
Petrochelidon sp. Unknown Martin MAR
Neophema sp. Unknown Neophema NEO
Pardalotus spp. Unknown Pardalote UP
Unknown Raven Unknown Raven RAV
Unknown Small Wader Unknown Small Wader USW
Acanthiza spp. Unknown Thornbill UT
Artamus spp. Unknown Woodswallow UWS
Malurus spp. Unknown Wren UFW
Hybrid bird 3
Yellow Throated X Black Eared
Miner YTM*BEM
Hybrid bird Cox Sandpiper FXM
Hybrid bird Cox'S Sandpiper FXM

ix
C. Refined Species List & Foraging Guilds/Zones
A list of the refined species list that were found across the entire study area (both native and
exotic. They were further categorised based on their foraging guilds (food sources) and primary
foraging zone.
Unique Species
Name Species Name Common Name Native Foraging Guild Foraging zone
Acanthagenys
rufogularis
Acanthagenys
rufogularis
Spiny Cheeked
Honeyeater Yes Frugivore/insectivore Shrub/canopy
Acanthiza
apicalis
Acanthiza
apicalis Inland Thornbill Yes Insectivore Shrub
Acanthiza
chrysorrhoa
Acanthiza
chrysorrhoa
Yellow Rumped
Thornbill Yes Insectivore Ground
Acanthiza
iredalei
Acanthiza
iredalei
Slender Billed
Thornbill Yes Insectivore Shrub
Acanthiza lineata Acanthiza lineata Striated Thornbill Yes Insectivore Shrub/canopy
Acanthiza nana Acanthiza nana Yellow Thornbill Yes Insectivore Canopy
Acanthiza pusilla Acanthiza pusilla Brown Thornbill Yes Insectivore Shrub
Acanthiza
reguloides
Acanthiza
reguloides
Buff Rumped
Thornbill Yes Insectivore Shrub/canopy/bark
Acanthiza
uropygialis
Acanthiza
uropygialis
Chestnut Rumped
Thornbill Yes Insectivore Ground/bark
Acanthorhynchus
tenuirostris
Acanthorhynchus
tenuirostris Eastern Spinebill Yes Nectarivore/insectivore Shrub/canopy
Accipiter
cirrhocephalus
Accipiter
cirrhocephalus
Collared
Sparrowhawk Yes Carnivore/raptor Shrub/canopy
Accipiter
fasciatus
Accipiter
fasciatus Brown Goshawk Yes Carnivore/raptor Canopy
Acridotheres
tristis
Acridotheres
tristis Comon Mynah exotic Insectivore
Acrocephalus
australis
Acrocephalus
australis
Clamorous Reed
Warbler Yes Insectivore Shrub
Aegotheles
cristatus
Aegotheles
cristatus
Australian Owlet
Nightjar Yes Insectivore Aerial
Agapornis
roseicollis
Agapornis
roseicollis
Peach Faced
Lovebird exotic Alauda arvensis Alauda arvensis Skylark Yes Insectivore Ground
Anas
platyrhynchos
domesticus
Anas
platyrhynchos
domesticus Domestic Duck exotic Anas
superciliosa
Anas
superciliosa
Pacific Black
Duck Yes Omnivore Ground
Anser anser
domesticus
Anser anser
domesticus Domestic Goose exotic

x
Anthochaera
carunculata
Anthochaera
carunculata Red Wattlebird Yes Nectarivore/insectivore Shrub/canopy
Anthochaera
chrysoptera
Anthochaera
chrysoptera Little Wattlebird Yes Nectarivore/insectivore Shrub/canopy
Anthus
novaeseelandiae
Anthus
novaeseelandiae Richard'S Pipit Yes Insectivore Ground
Apus pacificus Apus pacificus Fork Tailed Swift Yes Insectivore Aerial
Aquila audax Aquila audax
Wedge Tailed
Eagle Yes Carnivore/raptor Ground
Artamus cinereus Artamus cinereus
Black Faced
Woodswallow Yes Insectivore Aerial
Artamus
cyanopterus
Artamus
cyanopterus
Dusky
Woodswallow Yes Insectivore Aerial
Artamus
personatus
Artamus
personatus
Masked
Woodswallow Yes Insectivore Aerial
Artamus
superciliosus
Artamus
superciliosus
White Browed
Woodswallow Yes Insectivore Aerial
Barnardius
zonarius
Barnardius
zonarius
Australian
Ringneck Yes Granivore Ground/shrub
Cacatua galerita Cacatua galerita
Sulphur Crested
Cockatoo Yes Granivore Ground
Cacatua
roseicapilla
Cacatua
roseicapilla Galah Yes Granivore Ground
Cacatua
sanguinea
Cacatua
sanguinea Little Corella Yes Granivore Ground
Cacatua
tenuirostris
Cacatua
tenuirostris
Long Billed
Corella Yes Granivore Ground
Cacomantis
flabelliformis
Cacomantis
flabelliformis
Fan Tailed
Cuckoo Yes Insectivore Shrub/canopy
Cairina moschata Cairina moschata Muscovy Duck exotic Calyptorhynchus
funereus
Calyptorhynchus
funereus
Yellow Tailed
Black Cockatoo Yes Granivore/insectivore Ground/canopy
Carduelis
carduelis
Carduelis
carduelis
European
Goldfinch exotic
Carduelis chloris Carduelis chloris
European
Greenfinch exotic
Certhionyx niger Certhionyx niger Black Honeyeater Yes Insectivore/Nectivore Canopy
Charadrius
ruficapillus
Charadrius
ruficapillus
Red Capped
Plover Yes Insectivore Ground
Chenonetta
jubata
Chenonetta
jubata
Australian Wood
Duck Yes Herbivore Ground
Cheramoeca
leucosternus
Cheramoeca
leucosternus
White Backed
Swallow Yes Insectivore Aerial
Chrysococcyx
basalis
Chrysococcyx
basalis
Horsfield'S
Bronze Cuckoo Yes Insectivore Shrub/canopy
Chrysococcyx
lucidus
Chrysococcyx
lucidus
Shining Bronze
Cuckoo Yes Insectivore Shrub/canopy

xi
Cincloramphus
cruralis
Cincloramphus
cruralis Brown Songlark Yes Insectivore Ground
Cincloramphus
mathewsi
Cincloramphus
mathewsi Rufous Songlark Yes Insectivore Ground
Circus
approximans
Circus
approximans Swamp Harrier Yes Carivore/raptor Ground
Circus assimilis Circus assimilis Spotted Harrier Yes Carivore/raptor Ground
Cisticola exilis Cisticola exilis
Golden Headed
Cisticola Yes Insectivore Shrub
Climacteris
picumnus
Climacteris
picumnus
Brown
Treecreeper Yes Insectivore Bark
Colluricincla
harmonica
Colluricincla
harmonica
Grey Shrike
Thrush Yes Insectivore Canopy/bark
Columba livia Columba livia Rock Dove exotic Coracina
novaehollandiae
Coracina
novaehollandiae
Black Faced
Cuckoo Shrike Yes Insectivore Canopy
Corcorax
melanorhamphos
Corcorax
melanorhamphos
White Winged
Chough Yes Insectivore Ground
Cormobates
leucophaeus
Cormobates
leucophaeus
White Throated
Teecreeper Yes Insetivore Bark
Corvus mellori Corvus mellori Little Raven Yes Carnivore/raptor Ground
Coturnix
pectoralis
Coturnix
pectoralis Stubble Quail Yes Granivore Ground
Coturnix
ypsilophora
Coturnix
ypsilophora Brown Quail Yes Granivore Ground
Cracticus
nigrogularis
Cracticus
nigrogularis Pied Butcherbird Yes Carnivore/raptor Shrub/ground
Cracticus
torquatus
Cracticus
torquatus Grey Butcherbird Yes Carnivore/raptor Shrub/ground
Cuculus pallidus Cuculus pallidus Pallid Cuckoo Yes Insectivore Canopy
Dacelo
novaeguineae
Dacelo
novaeguineae
Laughing
Kookaburra Yes Carnivore/raptor Ground
Daphoenositta
chrysoptera
Daphoenositta
chrysoptera Varied Sittella Yes Insectivore Bark
Dicaeum
hirundinaceum
Dicaeum
hirundinaceum Mistletoebird Yes Frugivore Canopy
Dromaius
novaehollandiae
Dromaius
novaehollandiae Emu Yes Insectivore / herbivore Ground
Elanus axillaris Elanus axillaris
Black Shouldered
Kite Yes Carnivore/raptor Ground
Elseyornis
melanops
Elseyornis
melanops
Black Fronted
Dotterel Yes Insectivore Ground
Epthianura
albifrons
Epthianura
albifrons
White Fronted
Chat Yes Insectivore Ground
Eurostopodus
argus
Eurostopodus
argus Spotted Nightjar Yes Insectivore Aerial
Falco berigora Falco berigora Brown Falcon Yes Carnivore/raptor Ground

xii
Falco
cenchroides
Falco
cenchroides Nankeen Kestrel Yes Carnivore/raptor Ground
Falco
longipennis
Falco
longipennis Australian Hobby Yes Carnivore/raptor Aerial
Falco peregrinus Falco peregrinus Peregrine Falcon Yes Carnivore/raptor Aerial
Falco subniger Falco subniger Black Falcon Yes Carnivore/raptor Aerial
Falcunculus
frontatus
Falcunculus
frontatus Crested Shrike Tit Yes Insectivore Canopy
Gallinago
hardwickii
Gallinago
hardwickii Latham'S Snipe Yes Insectivore Ground
Gallirallus
philippensis
Gallirallus
philippensis Buff Banded Rail Yes Insectivore Ground
Geopelia cuneata Geopelia cuneata Diamond Dove Yes Granivore Ground
Geopelia placida Geopelia placida Peaceful Dove Yes Granivore Ground
Gerygone
olivacea
Gerygone
olivacea
White Throated
Gerygone Yes Insectivore Canopy
Gliciphila
melanops
Gliciphila
melanops
Tawny Crowned
Honeyeater Yes Nectarivore/insectivore Shrub/canopy
Glossopsitta
concinna
Glossopsitta
concinna Musk Loikeet Yes Nectarivore Canopy
Glossopsitta
porphyrocephala
Glossopsitta
porphyrocephala
Purple Crowned
Lorikeet Yes Nectarivore Canopy
Grallina
cyanoleuca
Grallina
cyanoleuca
Australian
Magpie Lark Yes Insectivore Ground
Gymnorhina
tibicen
Gymnorhina
tibicen
Australian
Magpie Yes Carnivore Ground
Haliaeetus
leucogaster
Haliaeetus
leucogaster
White Bellied Sea
Eagle Yes Carnivore/raptor Aerial
Haliastur
sphenurus
Haliastur
sphenurus Whistling Kite Yes Carnivore/raptor Aerial
Hieraaetus
morphnoides
Hieraaetus
morphnoides Little Eagle Yes Carnivore/raptor Ground
Hirundapus
caudacutus
Hirundapus
caudacutus
White Throated
Needletail Yes Insectivore Aerial
Hirundo neoxena Hirundo neoxena
Welcome
Swallow Yes Insectivore Aerial
Lalage tricolor Lalage tricolor
White Winged
Triller Yes Insectivore Aerial
Larus
novaehollandiae
Larus
novaehollandiae Silver Gull Yes Insectivore Ground
Lichenostomus
chrysops
Lichenostomus
chrysops
Yellow Faced
Honeyeater Yes Nectarivore/insectivore Shrub/canopy
Lichenostomus
ornatus
Lichenostomus
ornatus
Yellow Plumed
Honeyeater Yes Nectarivore/insectivore Shrub/canopy
Lichenostomus
penicillataus
Lichenostomus
penicillataus
White Plumed
Honeyeater Yes Nectarivore/insectivore Shrub/canopy
Lichenostomus
virescens
Lichenostomus
virescens
Singing
Honeyeater Yes Nectarivore/insectivore Shrub/canopy
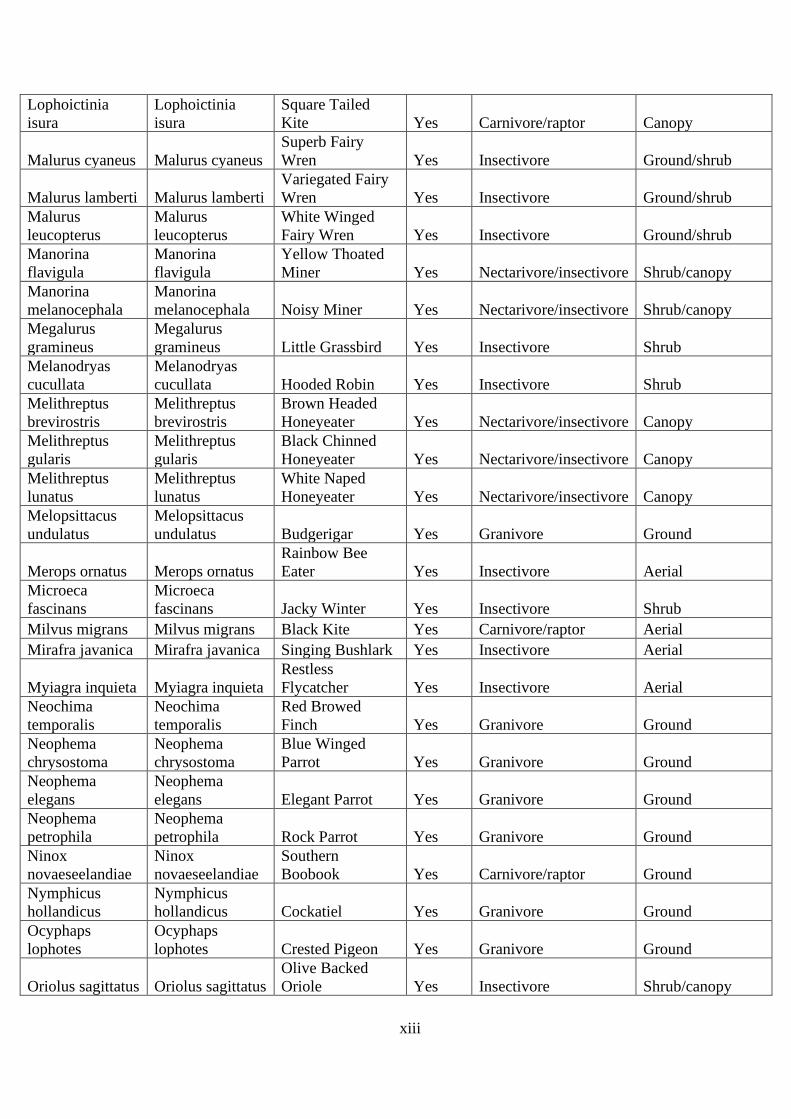
xiii
Lophoictinia
isura
Lophoictinia
isura
Square Tailed
Kite Yes Carnivore/raptor Canopy
Malurus cyaneus Malurus cyaneus
Superb Fairy
Wren Yes Insectivore Ground/shrub
Malurus lamberti Malurus lamberti
Variegated Fairy
Wren Yes Insectivore Ground/shrub
Malurus
leucopterus
Malurus
leucopterus
White Winged
Fairy Wren Yes Insectivore Ground/shrub
Manorina
flavigula
Manorina
flavigula
Yellow Thoated
Miner Yes Nectarivore/insectivore Shrub/canopy
Manorina
melanocephala
Manorina
melanocephala Noisy Miner Yes Nectarivore/insectivore Shrub/canopy
Megalurus
gramineus
Megalurus
gramineus Little Grassbird Yes Insectivore Shrub
Melanodryas
cucullata
Melanodryas
cucullata Hooded Robin Yes Insectivore Shrub
Melithreptus
brevirostris
Melithreptus
brevirostris
Brown Headed
Honeyeater Yes Nectarivore/insectivore Canopy
Melithreptus
gularis
Melithreptus
gularis
Black Chinned
Honeyeater Yes Nectarivore/insectivore Canopy
Melithreptus
lunatus
Melithreptus
lunatus
White Naped
Honeyeater Yes Nectarivore/insectivore Canopy
Melopsittacus
undulatus
Melopsittacus
undulatus Budgerigar Yes Granivore Ground
Merops ornatus Merops ornatus
Rainbow Bee
Eater Yes Insectivore Aerial
Microeca
fascinans
Microeca
fascinans Jacky Winter Yes Insectivore Shrub
Milvus migrans Milvus migrans Black Kite Yes Carnivore/raptor Aerial
Mirafra javanica Mirafra javanica Singing Bushlark Yes Insectivore Aerial
Myiagra inquieta Myiagra inquieta
Restless
Flycatcher Yes Insectivore Aerial
Neochima
temporalis
Neochima
temporalis
Red Browed
Finch Yes Granivore Ground
Neophema
chrysostoma
Neophema
chrysostoma
Blue Winged
Parrot Yes Granivore Ground
Neophema
elegans
Neophema
elegans Elegant Parrot Yes Granivore Ground
Neophema
petrophila
Neophema
petrophila Rock Parrot Yes Granivore Ground
Ninox
novaeseelandiae
Ninox
novaeseelandiae
Southern
Boobook Yes Carnivore/raptor Ground
Nymphicus
hollandicus
Nymphicus
hollandicus Cockatiel Yes Granivore Ground
Ocyphaps
lophotes
Ocyphaps
lophotes Crested Pigeon Yes Granivore Ground
Oriolus sagittatus Oriolus sagittatus
Olive Backed
Oriole Yes Insectivore Shrub/canopy

xiv
Pachycephala
pectoralis
Pachycephala
pectoralis Golden Whistler Yes Insectivore Shrub/canopy
Pachycephala
rufiventris
Pachycephala
rufiventris Rufous Whistler Yes Insectivore Shrub/canopy
Pardalotus
punctatus
Pardalotus
punctatus Spotted Pardalote Yes Insectivore Canopy
Pardalotus
striatus
Pardalotus
striatus Striated Pardalote Yes Insectivore Canopy
Passer
domesticus
Passer
domesticus House Sparrow Exotic Pavo cristatus Pavo cristatus Indian Peafowl Exotic Petrochelidon
ariel
Petrochelidon
ariel Fairy Martin Yes Insectivore Aerial
Petrochelidon
nigricans
Petrochelidon
nigricans Tree Martin Yes Insectivore Aerial
Petroica
goodenovii
Petroica
goodenovii
Red Capped
Robin Yes Insectivore Ground/shrub
Petroica
multicolor
Petroica
multicolor Scarlet Robin Yes Insectivore Ground/shrub
Petroica rosea Petroica rosea Rose Robin Yes Insectivore Shrub/Canopy
Phaps
chalcoptera
Phaps
chalcoptera
Common
Bronzewing Yes Granivore Ground
Phaps elegans Phaps elegans
Brush
Bronzewing Yes Granivore Ground
Phylidonyris
albifrons
Phylidonyris
albifrons
White Fronted
Honeyeater Yes Nectarivore/insectivore Shrub
Phylidonyris
novaehollandiae
Phylidonyris
novaehollandiae
New Holland
Honeyeater Yes Nectarivore/insectivore Shrub/canopy
Phylidonyris
pyrrhoptera
Phylidonyris
pyrrhoptera
Crescent
Honeyeater Yes Nectarivore/insectivore Shrub/canopy
Platycercus
elegans
Platycercus
elegans Crimson Rosella Yes Granivore Ground
Platycercus
eximius
Platycercus
eximius Eastern Rosella Yes Granivore Ground
Podargus
strigoides
Podargus
strigoides
Tawny
Frogmouth Yes Carnivore/raptor Aerial
Pomatostomus
superciliosus
Pomatostomus
superciliosus
White Browed
Babbler Yes Insectivore Ground/bark
Psephotus
haematonotus
Psephotus
haematonotus
Red Rumped
Parrot Yes Granivore Ground
Psittacula
krameri
Psittacula
krameri Indian Ringneck Exotic Pycnonotus
jocosus
Pycnonotus
jocosus
Red Whiskered
Bulbul Exotic Rhipidura
fuliginosa
Rhipidura
fuliginosa Grey Fantail Yes Insectivore Aerial
Rhipidura
leucophrys
Rhipidura
leucophrys Willie Wagtail Yes Insectivore Ground

xv
Sericornis
frontalis
Sericornis
frontalis
White Browed
Scrubwren Yes Insectivore Ground
Smicrornis
brevirostris
Smicrornis
brevirostris Weebill Yes Insectivore Canopy
Stagonopleura
bella
Stagonopleura
bella Beautiful Firetail Yes Granivore Ground
Stagonopleura
guttata
Stagonopleura
guttata Diamond Firetail Yes Granivore Ground
Stiltia isabella Stiltia isabella
Australian
Pratincole Yes Insectivore Strepera
versicolor
Strepera
versicolor Grey Currawong Yes Carnivore/raptor
Streptopelia
chinensis
Streptopelia
chinensis Spotted Dove Exotic Streptopelia
risoria
Streptopelia
risoria Barbary Dove Exotic Sturnus vulgaris Sturnus vulgaris Common Starling Exotic Taeniopygia
guttata
Taeniopygia
guttata Zebra Finch Yes Granivore Ground
Thinornis
rubricollis
Thinornis
rubricollis Hooded Plover Yes Insectivore Ground
Threskiornis
molucca
Threskiornis
molucca
Australian White
Ibis Yes Insectivore/carnivore Ground
Threskiornis
spinicollis
Threskiornis
spinicollis Straw Necked Ibis Yes Insectivore/carnivore Ground
Todiramphus
sancta
Todiramphus
sancta Sacred Kingfisher Yes Carnivore Ground
Trichoglossus
haematodus
Trichoglossus
haematodus Rainbow Lorikeet Yes Nectarivore Canopy
Turdus merula Turdus merula
Common
Blackbird Exotic
Turnix varia Turnix varia
Painted Button
Quail Yes Granivore Ground
Turnix velox Turnix velox
Little Button
Quail Rare Granivore Ground
Tyto alba Tyto alba Barn Owl Yes Carnivore/raptor Ground
Vanellus miles Vanellus miles Masked Lapwing Yes Insectivore Ground
Vanellus tricolor Vanellus tricolor Banded Lapwing Yes Insectivore Ground
Zoothera
lunulata
Zoothera
lunulata Bassian Thrush Yes Insectivore Ground
Zosterops
lateralis
Zosterops
lateralis Silvereye Yes Frugivore Shrub/canopy

xvi
D. Species Richness
A summary table of the species richness for each Local Government Area (LGA) for both
time periods
LGA 1980 2010
ADELAIDE 71 54
BURNSIDE 97 66
CAMPBELLTOWN 77 61
CHARLES STURT 56 55
HOLDFAST BAY 26 24
MARION 38 68
MITCHAM 112 93
NORWOOD 41 45
ONKAPARINGA 138 120
PLAYFORD 132 108
PORT ADELAIDE ENFIELD 65 82
SALISBURY 96 106
TEA TREE GULLY 68 86
UNLEY 33 54
WALKERVILLE 63 53
WEST TORRENS 62 87
E. SA Land Cover – Urbanisation
Summary table of the proportional cover of urban land in metropolitan Adelaide for 17 Local
Government Areas (LGAs)
LGA 1990 2015
Relative
Increase
ADELAIDE 0.5779 0.5938 0.0275
BURNSIDE 0.6299 0.6581 0.0447
CAMPBELLTOWN 0.7839 0.8122 0.0362
CHARLES STURT 0.8298 0.8426 0.0154
HOLDFAST BAY 0.8704 0.8813 0.0126
MARION 0.6325 0.6657 0.0526
MITCHAM 0.3379 0.3639 0.0770
NORWOOD 0.9580 0.9352 -0.0238
ONKAPARINGA 0.1512 0.1743 0.1526
PLAYFORD 0.1374 0.1616 0.1762
PORT ADELAIDE ENFIELD 0.6810 0.6928 0.0172
PROSPECT 0.9737 0.9752 0.0016
SALISBURY 0.3787 0.4121 0.0882
TEA TREE GULLY 0.4316 0.4703 0.0897
UNLEY 0.9592 0.9670 0.0082
WALKERVILLE 0.9315 0.9418 0.0110
WEST TORRENS 0.7042 0.7236 0.0276

xvii
Summary table of the km2 for each Local Government Area (LGA) of urban land in
metropolitan Adelaide.
LGA 1990 2015
Relative
Increase
ADELAIDE 8.997 9.245 0.0275
BURNSIDE 17.342 18.117 0.0447
CAMPBELLTOWN 19.087 19.778 0.0362
CHARLES STURT 43.267 43.932 0.0154
HOLDFAST BAY 11.942 12.092 0.0126
MARION 34.786 36.616 0.0526
NORWOOD 14.458 14.121 -0.0233
MITCHAM 25.579 27.549 0.0770
ONKAPARINGA 78.400 90.366 0.1526
PLAYFORD 47.410 55.764 0.1762
PORT ADELAIDE ENFIELD 64.018 65.119 0.0172
PROSPECT 7.604 7.616 0.0016
SALISBURY 59.877 65.157 0.0882
TEA TREE GULLY 41.091 44.778 0.0897
UNLEY 13.706 13.818 0.0082
WALKERVILLE 3.260 3.296 0.0110
WEST TORRENS 26.105 26.825 0.0276
F. SA Land Cover – Native vegetation
Native Vegetation (km2)
LGA 1985 2010
Onkaparinga 210.660 202.821
Playford 137.499 131.840
Salisbury 49.110 45.814
Norwood 43.764 42.694
Tea Tree Gully 35.844 35.596
Port Adelaide Enfield 15.759 16.010
Marion 10.051 10.076
Burnside 8.404 7.919
West Torrens 3.816 3.560
Campbelltown 3.467 3.264
Charles Sturt 2.801 2.803
Adelaide 2.090 2.170
Holdfast Bay 0.866 0.825
Mitcham 0.406 0.408
Unley 0.326 0.259
Walkerville 0.135 0.130

xviii
A map of the estimated native vegetation cover from the 2010-2015 SA Land Cover dataset

xix
G. Population and Dwellings
Summary table of total dwellings for each LGA were obtained from the census years of 1986
and 2016. Proportional numbers were calculated by dividing the counts for each LGA by the
LGA area (km2). The relative increase in the proportional dwelling and population counts from
1986 to 2016 for each LGA were calculated.
Dwellings Dwelling Density
LGA Km2 1981 2016 1981 2016
Relative
Dwelling
Increase
Adelaide 15.6 5,517 11,539 354.34 741.1 1.0915
Burnside 27.5 15,794 19,311 573.7 701.45 0.2227
Campbelltown 24.4 15,751 21,603 646.86 887.19 0.3715
Charles Sturt 52.1 40,691 51,163 780.42 981.26 0.2573
Holdfast bay 13.7 15,497 18,036 1129.52 1314.58 0.1638
Marion 55.5 27,861 39,764 502 716.47 0.4272
Mitcham 75.7 23,323 26,658 308.1 352.15 0.143
Norwood 15.1 14,394 17,493 953.25 1158.48 0.2153
Onkaparinga 518.4 37,346 71,692 72.04 138.29 0.9196
Playford 345.0 19,675 36,294 57.03 105.2 0.8446
Port Adelaide
Enfield 94.0 39,796 53,557 423.36 569.76 0.3458
Prospect 7.8 8,069 8,919 1033.16 1142 0.1053
Salisbury 158.1 31,421 55,210 198.74 349.21 0.7571
Tea Tree Gully 95.2 23,757 40,071 249.52 420.87 0.6867
Unley 14.3 15,025 17,097 1051.43 1196.43 0.1379
Walkerville 3.6 2,894 3,509 810.64 982.91 0.2125
West Torrens 37.1 19,088 26,840 514.92 724.04 0.4061

xx
Summary table of the total populations for each LGA were obtained from the census years of
1986 and 2016. Proportional numbers were calculated by dividing the counts for each LGA by
the LGA area (km2). The relative increase in the proportional dwelling and population counts
from 1986 to 2016 for each LGA were calculated.
Population
Population
Density
LGA Km2 1981 2016 1981 2016
Relative
Population
Increase
Adelaide 15.6 14,157 22,063 909 1,417 0.559
Burnside 27.5 37,198 43,911 1,351 1,595 0.181
Campbelltown 24.4 43,352 50,164 1,780 2,060 0.157
Charles Sturt 52.1 102,485
111,75
9 1,966 2,143 0.09
Holdfast bay 13.7 32,147 35,360 2,343 2,577 0.1
Marion 55.5 69,695 88,618 1,256 1,597 0.271
Mitcham 75.7 61,213 64,805 809 856 0.058
Norwood 15.1 32,413 35,362 2,147 2,342 0.091
Onkaparinga 518.4 107,818
166,76
6 208 322 0.548
Playford 345.0 58,343 89,372 169 259 0.533
Port Adelaide
Enfield 94.0 100,824
121,23
0 1,073 1,290 0.202
Prospect 7.8 18,299 20,527 2,343 2,628 0.122
Salisbury 158.1 96,618
137,97
9 611 873 0.429
Tea Tree Gully 95.2 73,838 97,734 776 1,027 0.323
Unley 14.3 36,195 37,721 2,533 2,640 0.042
Walkerville 3.6 6,813 7,550 1,908 2,115 0.108
West Torrens 37.1 43,639 57,901 1,177 1,562 0.327

xxi
A map of the relative population increase (A) and relative urban increase (B) from 1986 – 2016.

xxii
H. Temporal Turnover
A summary table of the proportional turnover of bird communities in each Local Government
Area (LGA).
Turnover Metric
LGA
Total
Turnover Additions Deletions
Adelaide 0.454 0.12 0.333
Burnside 0.377 0.038 0.34
Campbelltown 0.444 0.157 0.287
Charles Sturt 0.317 0.178 0.139
Holdfast Bay 0.764 0.2 0.564
Marion 0.592 0.49 0.102
Mitcham 0.359 0.115 0.244
Norwood 0.419 0.27 0.149
Onkaparinga 0.284 0.091 0.192
Playford 0.359 0.065 0.295
Port Adelaide 0.39 0.329 0.062
Salisbury 0.349 0.228 0.122
Tea Tree Gully 0.463 0.273 0.19
Unley 0.586 0.529 0.057
Walkerville 0.385 0.125 0.26
West Torrens 0.385 0.289 0.096

xxiii
Residual plots and Q-Q plots were produced to visually analyse the separate linear models that
were fitted to assess the relationships between temporal turnover and the explanatory variables
relative dwelling increase meets the normality assumptions of linear regression

xxiv
I. Species Abundance
A summary table of the mean rank shift and rate of change between the two time periods for
each LGA
LGA
Mean Rank
Shift
Rate of
Change
Adelaide 10.254 140.054
Burnside 9.924 193.564
Campbelltown 12 66.895
Charles Sturt 11.913 110.955
Holdfast Bay 2.462 15.232
Marion 10.225 277.218
Mitcham 17.31 466.203
Norwood 9.535 218.628
Onkaparinga 25.638 709.427
Playford 37.827 403.243
Port Adelaide Enfield 13.067 251.8
Salisbury 20.894 1091.709
Tea Tree Gully 16.338 149.395
Unley 8 155.689
Walkerville 13.508 139.331
West Torrens 14.157 1006.786

xxv
Residual plots and Q-Q plots were produced to visually analyse the separate linear models that
were fitted to assess the relationships between mean rank shift and the explanatory variables
relative dwelling increase meets the normality assumptions of linear regression

xxvi
Residual plots and Q-Q plots were produced to visually analyse the separate linear models that
were fitted to assess the relationships between rate of change and the explanatory variables
relative dwelling increase meets the normality assumptions of linear regression

xxvii
J. Species presence/absence: Multivariate analysis
An ordination plot utilised to visualise multivariate patterns. A Non-metric Multidimensional
Scaling (NMDS) was conducted utilising the Bray-Curtis dissimilarity to quantify the
compositional dissimilarity between all the sites

xxviii
A Shepard plot of the observed dissimilarity of the nMDS ordination result utilised to assess
the goodness of fit.

xxix
K. Species presence-absence: Model-based analysis
A residual plot of the generalised linear model fitted to the multivariate species
presence/absence data with LGA and time as explanatory variables. Model assumptions,
particularly assessing the appropriate variance model for the multivariate responses, were
assessed visually using residual plots

xxx
L. Species abundance – multivariate analysis
An ordination plot utilised to visualise multivariate patterns of species abundance. A Non-
metric Multidimensional Scaling (NMDS) was conducted utilising the Bray-Curtis
dissimilarity to quantify the compositional dissimilarity between all the sites

xxxi
A Shepard plot of the observed dissimilarity of the nMDS ordination result utilised to assess
the goodness of fit for species abundance.

xxxii
M. Species abundance – model
A mean variance plot to assess the relationship between species abundance and relative
dwelling increase.

xxxiii
A residual plot of the generalised linear model fitted to the multivariate species abundance data
with LGA and time as explanatory variables. Model assumptions, particularly assessing the
appropriate variance model for the multivariate responses, were assessed visually using
residual plots