Embed Size (px)
Citation preview

Norton, N. © Journal of Music, Health, and Wellbeing (Autumn 2020)
Impact of Participating in a Choir on Health and Wellbeing of Adults with Intellectual Disabilities
© Journal of Music, Health, and Wellbeing (Winter, 2020)
Journal Homepage: www.musichealthandwellbeing.co.uk
Impacts of Participating in a Choir on Health and
Wellbeing of Adults with Intellectual Disabilities
Julia Moore, Jes Phillips, Jacqueline Tallent, Esther Coren
Sidney De Haan Research Centre for Arts & Health, Canterbury Christ Church University
Article Info.
Abstract
Background: An estimated 1.4 million people in the United Kingdom
(UK) have an intellectual disability. Research in these populations has advanced
over the last 40 years, and there is now evidence for the beneficial use of music
interventions (for example Hall, 2010). However, there is still insufficient good
quality evidence on the most effective interventions to support health and
wellbeing.
Method: This paper presents the results of a study looking at the impact
of participatory singing for people with intellectual disabilities, assessing the
impact of a choir, and collecting quantitative and qualitative data at three time-
points.
Results: This paper shows that the choir had a positive impact. The
qualitative results were particularly strong, with quantitative results (Rosenberg
Self-Esteem Scale (RS-ES) and Personal Wellbeing Index (Intellectual
Difficulties) (PWI-ID) more ambiguous.
Conclusion: The results of the study suggest that choir singing has a
positive impact on wellbeing.
Date Submitted:
July 2020
Date Accepted:
November 2020
Date Published:
December 2020
1. Introduction
In the UK, there are an estimated 1,400,000 people with an intellectual disability (Mencap,
2020). Life for this group can have challenges, for example discrimination and stigma, social exclusion,
health inequalities and financial burdens (Mencap, 2020; Ali, Hasiotis, Strydom & King, 2012:2122-
2140; Bates & Davis, 2004:195-207; Coleman, Sykes & Groom, 2013; Emerson & Hatton, 2008; NHS
Digital, 2019; Sense, 2017; Taheri, Perry & Minnes, 2016:435-443). There is a need for more research to

Moore, J. © Journal of Music, Health, and Wellbeing (Autumn 2020)
2
gather evidence, support impactful interventions and help build connections with the wider community
(Department of Health, 2010).
Definitions and key concepts
In the UK the term ‘learning disability’ has been defined as ‘a significantly reduced ability to
understand new or complex information, to learn new skills, with a reduced ability to cope independently
which started before adulthood’ (Department of Health, 2001:14). More recently the term ‘intellectual
disability’ is gaining usage (Cluley, 2017:24-32), particularly in the international context. The definition
of intellectual disability provided by the World Health Organisation (WHO) (2019) is similar to the
Department of Health definition but with a focus on social and environmental dimensions. In the
questionnaire used for this study, the term ‘learning disability’ was used, as participants were most
familiar with that term, but this paper uses ‘intellectual disabilities’.
Notions of self
Self is a complex notion. The role that the perspectives of other people play in one’s sense of
self has been widely discussed. Prescott (2006:7) states ‘self-perception is possible because the individual
is able to compare his Self with others and is also able to interpret the feedback from others on his Self’.
There has been disagreement regarding the strength of self-concept amongst individuals with intellectual
disability. Harter (1982:87-97) found that children with intellectual disability had a less developed sense
of self than children with typical development, however others (for example Lewandowski & Arcangelo,
1994:598-605; Reschly & Christenson, 2006:103-113; Pestana, 2014:16-23) failed to find any differences
between people with intellectual disabilities and others in terms of global self-concept.
The rating scales used in this study presuppose that people with intellectual disabilities have a
sufficient sense of self to assess themselves.
Research with people with an intellectual disability
Historically, intellectual disability research has been informed by the biomedical model, and
carried out primarily in psychology and biomedicine. More recently, however, research has drawn upon
a socially-based model which aligns with the position of the UK Government strategy document, Valuing
People (Department of Health, 2001) and with the WHO’s definitions (2019). Recent studies have taken
a qualitative stance, with participants sharing their own perspectives (Walmsley, 2001:187-205).
However, while such smaller-scale studies offer depth and texture, they may not provide the evidence
required for widespread change. More, and larger, research studies are needed from a social perspective.
However, there can be challenges, such as issues with mental capacity and informed consent (Beauchamp
& Childress, 2009:77-81). For example, the requirement for consent can lead to the exclusion of people
with intellectual disabilities (McClimens & Allmark, 2011:633-639).
The impact of participative arts on health for people with an intellectual disability
Despite challenges, the evidence base is growing, and research has shown that participating in
meaningful social and leisure activities yields benefits (Hall, 2010:24-40) including a sense of belonging,
connectivity, and improved wellbeing (Wilson, Jacques, Johnson & Brotherton, 2017:847-858). This is
particularly true for music activities (Nordoff Robbins, 2020; British Association for Music Therapy,
2017). This synergises with research amongst the general population on the positive impacts of arts and
music on health and wellbeing. For example, Clift and Hancox (2010:79-96) found improvements in
physical, psychological, social and environmental wellbeing amongst choir singers in Europe and
Australia; Clift, Skingley, Page, Stephens and Hurley (2017) found that participation in Singing for
Breathing groups were beneficial for people with COPD; while Clift, Gilbert, R. and Vella-Burrows, T.
(2016) discuss the value of singing for older people in terms of health and wellbeing.
Moore, J. © Journal of Music, Health, and Wellbeing (Autumn 2020)
3
Impact of Participating in a Choir on Health and Wellbeing of Adults with Intellectual Disabilities
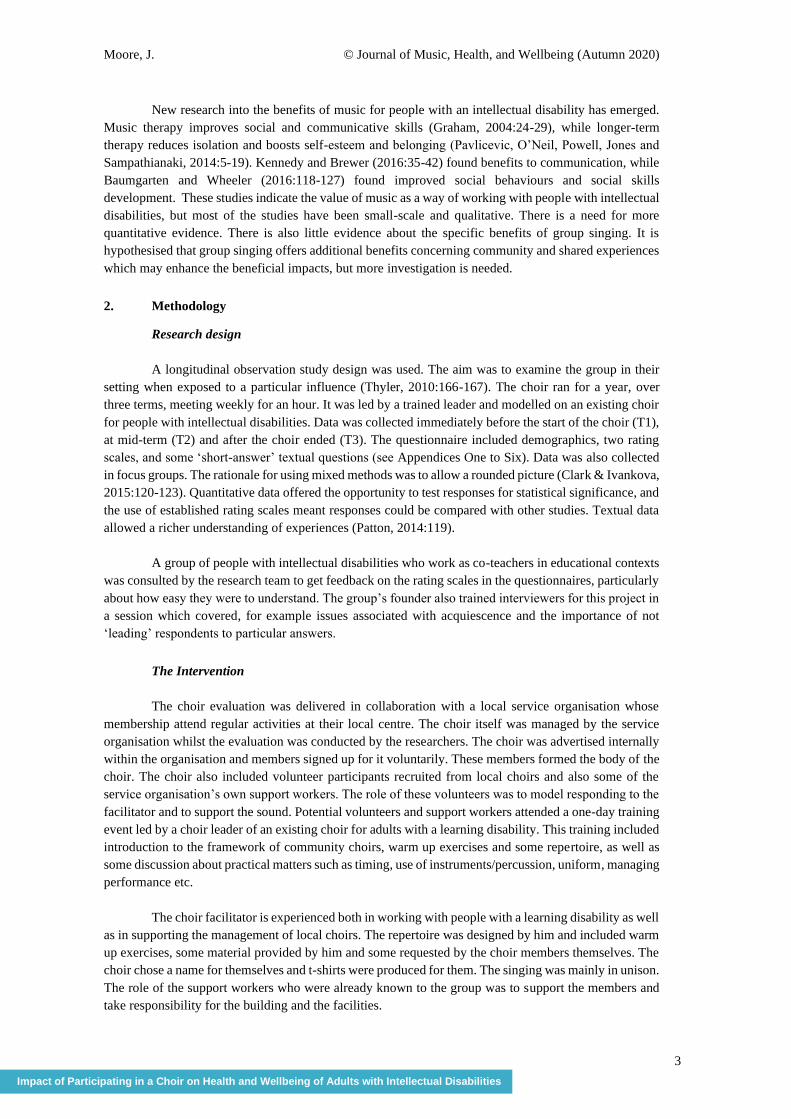
New research into the benefits of music for people with an intellectual disability has emerged.
Music therapy improves social and communicative skills (Graham, 2004:24-29), while longer-term
therapy reduces isolation and boosts self-esteem and belonging (Pavlicevic, O’Neil, Powell, Jones and
Sampathianaki, 2014:5-19). Kennedy and Brewer (2016:35-42) found benefits to communication, while
Baumgarten and Wheeler (2016:118-127) found improved social behaviours and social skills
development. These studies indicate the value of music as a way of working with people with intellectual
disabilities, but most of the studies have been small-scale and qualitative. There is a need for more
quantitative evidence. There is also little evidence about the specific benefits of group singing. It is
hypothesised that group singing offers additional benefits concerning community and shared experiences
which may enhance the beneficial impacts, but more investigation is needed.
2. Methodology
Research design
A longitudinal observation study design was used. The aim was to examine the group in their
setting when exposed to a particular influence (Thyler, 2010:166-167). The choir ran for a year, over
three terms, meeting weekly for an hour. It was led by a trained leader and modelled on an existing choir
for people with intellectual disabilities. Data was collected immediately before the start of the choir (T1),
at mid-term (T2) and after the choir ended (T3). The questionnaire included demographics, two rating
scales, and some ‘short-answer’ textual questions (see Appendices One to Six). Data was also collected
in focus groups. The rationale for using mixed methods was to allow a rounded picture (Clark & Ivankova,
2015:120-123). Quantitative data offered the opportunity to test responses for statistical significance, and
the use of established rating scales meant responses could be compared with other studies. Textual data
allowed a richer understanding of experiences (Patton, 2014:119).
A group of people with intellectual disabilities who work as co-teachers in educational contexts
was consulted by the research team to get feedback on the rating scales in the questionnaires, particularly
about how easy they were to understand. The group’s founder also trained interviewers for this project in
a session which covered, for example issues associated with acquiescence and the importance of not
‘leading’ respondents to particular answers.
The Intervention
The choir evaluation was delivered in collaboration with a local service organisation whose
membership attend regular activities at their local centre. The choir itself was managed by the service
organisation whilst the evaluation was conducted by the researchers. The choir was advertised internally
within the organisation and members signed up for it voluntarily. These members formed the body of the
choir. The choir also included volunteer participants recruited from local choirs and also some of the
service organisation’s own support workers. The role of these volunteers was to model responding to the
facilitator and to support the sound. Potential volunteers and support workers attended a one-day training
event led by a choir leader of an existing choir for adults with a learning disability. This training included
introduction to the framework of community choirs, warm up exercises and some repertoire, as well as
some discussion about practical matters such as timing, use of instruments/percussion, uniform, managing
performance etc.
The choir facilitator is experienced both in working with people with a learning disability as well
as in supporting the management of local choirs. The repertoire was designed by him and included warm
up exercises, some material provided by him and some requested by the choir members themselves. The
choir chose a name for themselves and t-shirts were produced for them. The singing was mainly in unison.
The role of the support workers who were already known to the group was to support the members and
take responsibility for the building and the facilities.

Moore, J. © Journal of Music, Health, and Wellbeing (Autumn 2020)
4
Study participants were drawn from current users of the choir. All users of the service were
invited to join the choir, but only those assessed as having capacity to give consent were asked if they
wanted to join the study. In total, 35 people joined the choir: over the year it ran, new participants were
recruited, while others left. Twenty-two participants agreed to take part in the evaluation at T1, of which
data was collected for 19. At T2, 16 interviews were carried out, and 14 at T3.
Data collection
Choir participants were interviewed face-to-face, by trained interviewers. Interviews took place
in private rooms within the service centre, and responses were recorded on paper. Support workers were
present in some cases, to help respondents understand the questions, but not to answer for respondents.
One focus group took place during on the day of the final data collection, interviewing three
support workers and volunteers. A further focus group with two carers was held two months later. Both
groups were semi-structured with open questions about various themes relating to the choir. The
interviews were audio-recorded and transcribed. A researcher present in the room, also made
observational notes.
Questionnaire Design
The questionnaire was made up of two rating scales, demographic questions and short answer
(qualitative) questions (see Appendices One to Five). The two validated rating scales used to collect
quantitative data are summarised in Table 1.
Table 1. Validated rating scales
Tool Outcome
Rosenberg Self-Esteem Scale (adapted)
(Rosenberg, 1982) • Global self-worth
• Self-esteem
Personal Wellbeing Index- Intellectual Disability
(Cummins & Lau, 2005) • Quality of life
• Wellbeing
The Rosenberg Self-Esteem Scale (RSES) has been found valid and reliable (for example Park
& Park (2019), however there has been dissent, including Davis, Kellett, Beail and Turk (2009:172-178)
who argue that validity and reliability have not been established for groups of people with intellectual
disabilities. Indeed, in this study, testing the data from T1 returned a Cronbach Alpha score of 0.579
(negative items four and six recoded). By contrast, the PWI-ID returned a score of 0.824 at T1. Despite
this, the scarcity of quantitative tools meant an adapted version of RSES was used. Each item was
presented in large print on a single, A4 page with blocks of increasing size to act as visual cues alongside
the written answers.
The Personal Wellbeing Index-Intellectual Disability (PWI-ID) (see Appendix Two) (Cummins
& Lau, 2005, passim) was found to show good reliability (Cronbach alpha coefficient of 0.76) and validity
by McGillivray, Lau, Cummins and Davey (2009:276-286). These results were supported by Yousefi,
Mozaffari, Sharif and Sepasi (2013:68-72). The answer options form a 5-item Likert scale, which was
presented to respondents in this study as smiley faces in different colours (see Appendix Two). The PWI-
ID was originally designed with two pre-test stages to determine acquiescent responding, but this study
did not use the pre-test, due to its length. Instead, the research team asked support staff at the service
centre to assess capacity. Qualitative data was gathered through four ‘short answer’ questions about
intellectual disabilities at T1, T2 and T3, with additional questions about experiences of the choir asked

Moore, J. © Journal of Music, Health, and Wellbeing (Autumn 2020)
5
Impact of Participating in a Choir on Health and Wellbeing of Adults with Intellectual Disabilities
at T2 and T3. The short answer questions elicited information about feelings of social inclusion and
stigma, and about life experiences.
Sampling and consent
Consent was requested in two stages. First, participants were invited to an information session
and given an Easy-Read information sheet to take home and discuss with family and carers. A week later,
participants were asked to sign a consent form (in Easy-Read English) after further explanation from
interviewers.
Ethics
Ethical approval was requested from the London HRA Social Care Research Ethics Committee.
Consent was granted on 16th October 2018 (Reference 18/IEC08/0027).
Confidentiality, voluntary nature of participation and data protection
Participation in the study was voluntary and did not affect participants’ involvement with the
service or choir. The study was carried out within the terms of the General Data Protection Regulations
(2018). Consent was obtained for data collection. No identifying details of participants, only a unique ID
number were attached to the electronic data. One paper copy of name and unique ID number was created,
this was held securely, and kept in a locked cabinet in a locked room when not in use. Participants were
informed what data would be held, what it would be used for, and their rights.
Data analysis
The focus groups were audio-recorded and transcribed. The data from face-to-face interviews
was entered into IBM SPSS 24, and analysed, primarily descriptively. Due to small participant numbers
and lack of respondent continuity, statistical significance tests were not used. Qualitative data from short
answer questions, individual interviews and focus groups was coded. Simpler questions were coded into
categories, more complex information was analysed thematically (Clark & Braun, 2013:120-123).
3. Results
Quantitative results
In total, 22 participants consented to the evaluation (PID001 to PID022). Table 2 (Appendix Six)
summarises participation at each time point. Only 11 respondents were present for all three time-points,
which explains some discrepancies between demographic variables.
Demographics
Roughly equivalent numbers of men and women took part in the study. Ages ranged from 18 to
64. The full demographic data can be found in Tables 3 to 8 and 15 to 17 (see Appendix Five).
Rosenberg Self-Esteem Scale
The results are summarised in Table 9 (mean score calculated from Likert scale in which ‘Never
True’ is ‘1’ and ‘Always True’ is ‘5’):

Moore, J. © Journal of Music, Health, and Wellbeing (Autumn 2020)
6
Table 9. Mean, standard deviation and number of respondents on each of the Rosenberg items by
time point
Rosenberg item T1 (start of choir)
M (SD)
T2 (midpoint)
M (SD)
T3 (end of choir)
M (SD)
1. I feel that I am a good person,
as good as others
4.4 (1.042)
n=18
4.4 (1.031)
n=16
4.38 (0.870)
n=13
2. I feel that I have a lot of good
qualities
4.28 (1.074)
n=18
4.56 (0.629)
n=16
4.00 (0.953)
n=12
3. I am able to do things as well
as most other people
4.39 (0.778)
n=18
4.12 (0.957)
n=16
3.77 (1.013)
n=13
4. I feel I haven’t done anything
worthwhile
2.63 (1.408)
n=16
1.87 (1.204)
n=16
2.54 (1.506)
n=13
5. I like myself 4.65 (0.786)
n=17
4.25 (1.000)
n=16
4.69 (0.630)
n=13
6. At times I think I am no good
at all
2.18 (1.380)
n=17
2.14 (1.512)
n=14
1.62 (0.870)
n=13
Figure 1, below, shows that all items score relatively highly, with relatively little difference
between the scores overall:
Figure 1. Rosenberg items (x axis) by time period (mean scores) (y axis).
As illustrated in Figure 1, respondents seemed consistent in their answers to the Rosenberg:
mean scores for the ‘negative’ items (four and six) were notably lower than those for the ‘positive’ items
(items one, two, three and five). However, statistical tests do not support this. Table 10 summarises the

Moore, J. © Journal of Music, Health, and Wellbeing (Autumn 2020)
7
Impact of Participating in a Choir on Health and Wellbeing of Adults with Intellectual Disabilities
Cronbach Alpha scores for T1, T2 and T3 (with the negatively expressed items (four and six), being
recoded onto the scale for items one, two, three, and five).
Table 10. Cronbach Alpha for Rosenberg at various time points (recoded for negative items)
T1 T2 T3
0.579 0.614 0.617
If the negative items are entirely removed from the scales and Cronbach Alpha calculated, the
results demonstrate greater internal consistency for T1 and T2, but only T2 scores over 0.7 (an indication
of internal consistency) (see Table 11).
Table 11. Cronbach Alpha for Rosenberg at various time points (negative items removed)
T1 T2 T3
0.586 0.788 0.362
A total score for all elements of the Rosenberg was calculated. Answers for the ‘negative’ items
(four and six) were recoded (‘1’ became ‘5’, ‘2’ became ‘4’, ‘3’ remained ‘3’, ‘4’ became ‘2’ and ‘5’
became ‘1’). The results of this also failed to show a clear pattern (Table 12):
Table 12. Total mean scores for Rosenberg at T1, T2, T3.
T1 T2 T3
24.1333 25.4286 24.5833
It might be predicted, given the literature on the positive impact of participative arts activities
on wellbeing, that mean scores for Rosenberg items one, two, three and five would increase from T1 to
T3, and that mean scores for items four and six would decrease. However, this is not the case: there is no
clear pattern. R1 stayed relatively constant, R2 increased then decreased, R3 decreased. Any changes
were small. More data is needed to clarify this.
Personal Wellbeing Index (Intellectual Difficulties)
The PWI-LD scale is described above and is included in Appendix Two. The results are
presented in Table 13 (means calculated from a 5-item Likert scale in which ‘Happy nearly always’ is ‘1’
and ‘Hardly ever happy’ is ‘5’):
Table 13. PWI-LD items by time point (mean score, SD)
PWI-LD item: Happiness felt about… T1
M (SD)
T2
M (SD)
T3
M (SD)
1. … your life as a whole? 1.56 (0.81)
n=16
1.36 (0.50)
n=14
1.86 (1.10)
n=14

Moore, J. © Journal of Music, Health, and Wellbeing (Autumn 2020)
8
2. … the things you have (Like the money
you have and the things you own)?
1.78 (0.88)
n=18
1.88 (1.09)
n=16
1.79 (0.89)
n=14
3. … how healthy you are? 1.59 (0.71)
n=17
1.89 (1.01)
n=16
1.64 (0.84)
n=14
4. … the things you make or things you
learn?
1.39 (0.61)
n=18
1.63 (1.15)
n=16
1.71 (0.61)
n=14
5 … getting on with the people you
know?
1.61 (0.85)
n=18
1.25 (0.44)
n=16
1.64 (0.84)
n=14
6. … how safe you feel? 2.28 (1.18)
n=18
1.75 (1.24)
n=16
2.08 (1.19)
n=13
7. … doing things outside your home? 1.78 (0.94)
n=18
1.62 (0.96)
n=16
1.85 (0.90)
n=13
The results in chart form are shown in Figure 2. Here, some items scored less highly at T2 than
T1, then increase again at T3. Others increase from T1 to T2, then fall. Overall, no clear picture emerges.
As with the Rosenberg, there is relatively little difference between the mean scores at each time point.
Figure 2. PWI-ILD items (x axis) by time period (mean scores) (y axis)

Moore, J. © Journal of Music, Health, and Wellbeing (Autumn 2020)
9
Impact of Participating in a Choir on Health and Wellbeing of Adults with Intellectual Disabilities
The total scores for PWI-ID were also calculated for T1-3. No clear pattern is revealed (Table 14):
Table 14. Total mean scores for PWI-ID at T1, T2, T3 (lower score – happier response).
T1 T2 T3
14.67 12.15 14.54
Qualitative results
Short answer questions about intellectual disabilities
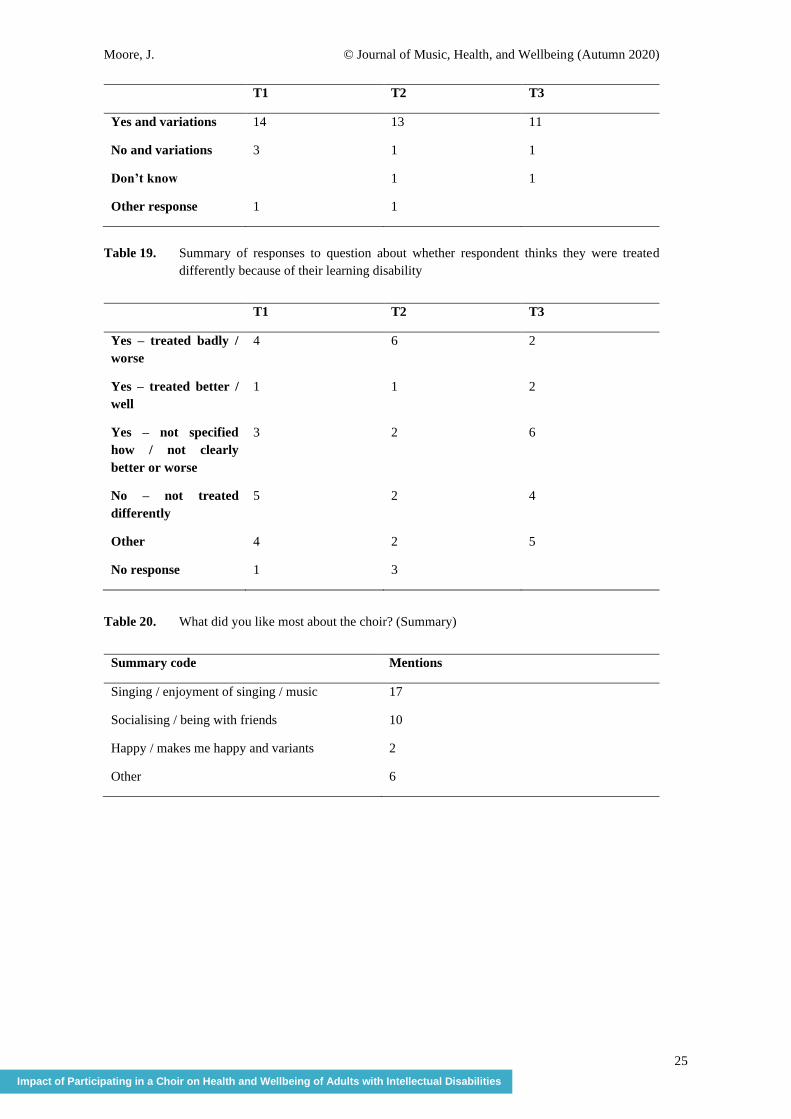
Respondents were asked three questions about perceptions of intellectual disabilities. The first
asked the respondent if they thought they had a learning disability (see Table 18, Appendix Five). Most
respondents said they thought they did, but frequently qualified this. Some respondents described their
medical diagnoses (‘Yes I have, Down Syndrome. IBS. Epilepsy – stress’) (PID001), while others
explained how they experienced their intellectual disability: (‘Yes. Sometimes it takes me a while to
process the question of things’) (PID002). Others simply said, ‘I have’ or ‘Yes’. Each respondent’s
answers were broadly consistent across time-points, although responses differed in detail.
The second question asked, ‘Do people treat you differently because you have a learning disability’ (see
Table 19). Some answers describe being bullied or mistreated.
‘Yes. People like to talk to other people and ask what I like to eat - that really annoyed me
because I can speak’ (PID002).
‘Yes - at school someone wasn't very friendly to me and the children called me names because I
was in a group for disabled children, but I'm just the same as everyone else - I just have a
disability’ (PID006).
The third question asked, ‘What do you think people think about people with a learning
disability?’. Interviewers commentated that some respondents found this difficult to understand. Of the
47 total answers across T1 to T3, only 21 answered the question. Some of the answers which did answer
the question include: ‘I think some people avoid them like the plague - get treated different’ (PID002), ‘I
think people think in good terms about people with disabilities and they try to help them’ (PID004).
Examples of answers which do not answer the question include: ‘I don't talk to strangers. Stay safe’
(PID001), and ‘I like old people. They are sweet’ (PID018). Some of the answers partially answered the
question, but also included non-relevant information. Respondents also sometimes changed their answers
to this question between time-points. One respondent, for example, stated at T1 ‘cruel to people with a
learning disability’, at T2 ‘in the middle’ and at T3 ‘don’t know’ (PID005). These mixed responses may
indicate limited understanding of this question.
Short answer questions about singing and the choir (T2 and T3 only).
Respondents were asked ‘how does singing make you feel?’. Here, the responses were
overwhelmingly positive: 23 people over T2 and T3 mentioned ‘happy’. Other responses included ‘proud’
(2) ‘confident’ (1) and ‘makes me feel better’ (1). One respondent said that singing made them ‘sad’, but
the wider context of the remark indicated a nuanced emotional reaction to music: ‘sometimes happy and
sometimes sad - happy songs make me happy and sad songs make me sad’ (PID006). Some other
examples include: ‘I am happy to sing my heart out’ (PID002) and ‘really bad mood because my disability

Moore, J. © Journal of Music, Health, and Wellbeing (Autumn 2020)
10
holds me back sometimes - and all I did was sing and it made me feel better. I sing a lot now. I sing
around the house and drive my mum crazy’. There were no negative responses to this question.
Next, respondents were asked ‘what did you like most about the choir?’. The answers here were
also entirely positive (see Table 20, Appendix Five). Verbatims from this question include: ‘Confidence.
Happy. Really helped me with depression’ (PID005) and ‘It's good, like being part of a group, like that
everybody smiles’ (PID002).
The group performed at Christmas 2018. Q3 asked ‘How did you feel about performing in
front of people? (Table 21, Appendix Five). Verbatim quotes include: ‘My nieces and nephew came to
watch - they were like, that's my auntie - Auntie did good!’ (PID002) and ‘It's great. I'm not scared of
nothing’ (PID008).
Most participants were positive about practical arrangements for the choir, although a couple of
people had minor reservations, for example noise. The final question in this section asked, ‘What do you
think could be made better about the choir’. Responses are summarised in Table 22 (see Appendix Five).
Focus groups
The results from the focus groups were coded by two researchers, using thematic analysis
(Given, 2008) and the results compared. Clear themes emerged:
• Enjoyment of choir
• Community and belonging
• Progressions and growth
• Group cohesion and equality
These themes are discussed below.
Enjoyment of choir
People enjoyed the choir: (SW = ‘support worker’, V = ‘volunteer’): SW3 ‘I think the choir
has a lot of energy, which is a good thing, people come with a lot of energy and they put a lot of their
heart and soul into it. The people that come here, they’ve got, they enjoy it’ and, from V2, ‘[NAME] was
always quiet but he’ll come in now and he’ll do that [action] to everyone, he’ll touch you and he might
not always want to take part but he is there and he enjoys it in his own way’. In the latter example, the
volunteer links enjoyment of the choir to greater participation and increased social interaction, thus
underlining a connection between attending choir regularly and social engagement and inclusion.
Commuity and Belonging
People who regularly attended the choir were also actively involved with the choir,
participating, engaging with the music and each other, as this response indicates: ‘I think people like
having instruments like the shakers and the tambourines for people who can’t take part in the singing so
much they have slowly got involved with music and got really like more involved with that’ (SW1).
The following comment, from a volunteer (V1), expresses the increased sense of community
and belonging observed for some participants:
‘It’s also a great leveller actually you know…we’re all there to sing and we’re all there to sing
together and everybody contributes sometimes in very different ways but it doesn’t really
matter…because we’re all there with a common purpose and that’s a great leveller’.

Moore, J. © Journal of Music, Health, and Wellbeing (Autumn 2020)
11
Impact of Participating in a Choir on Health and Wellbeing of Adults with Intellectual Disabilities
One participant, during the course of the choir, ‘really opened up his connection with people and
that’s really lovely to see’ (SW2), whereas V1 reports that another participant ‘smiles, she joins in, and
she’s actually started talking to people’.
Progression and Growth
Another theme concerned participants’ progression and growth in confidence. The stories of
individuals who had made changes during the choir were interesting: ‘[NAME] has helped lead it on
occasions when [FACILITATOR] has not been here…his timing is absolutely impeccable and we all
know the words and we know the melody but he’ll know when to start singing and it is absolutely
fantastic…it is lovely to see his confidence within the choir has grown’ (SW2). ‘She has been kind of
observing on the side-lines and she’s gradually been getting more involved, last week she volunteered to
hand out the tambourines to everybody’ (V1).
Group Cohesion and Equality
Those interviewed also mentioned being part of something bigger than the personal. SW2 stated
that the choir is a ‘very good levelling ground’ in which no one person is dominant: ‘they recognise that
it is a group activity and more so those people that during the day probably have quite dominant
personalities and take over a lot are allowing other people to come and be on the same level as them’.
Others reported how considerate choir members were of each other. The choir also seemed to empower
quieter members: SW2 reported that the choir gave opportunities for members to stand up in front of the
group and lead, and that this opportunity, with the support of others, helped more introvert participants to
take a more active, leadership role. A sense of ownership also grew: ‘it is their choir, they choose a lot of
the things and they decide a lot of the things’ (SW3).
Singing, particularly, was felt to be key in the levelling of differences: ‘It’s also a great leveller
actually you know people whether they’re members of the choir or volunteers or support workers... we’re
all there to sing together and everybody contributes sometimes in very different ways’ (V1).
4. Discussion
In terms of the quantitative results, no clear picture emerges. Both Rosenberg and PWI
demonstrated no obvious impact of the choir on health or wellbeing of participants, although mean scores
from T1 were already relatively high (for example, typically 4.2 or more for the positive items of the
Rosenberg scale). Of course, this could also have been because the choir had no impact on the participants,
however this seems unlikely because the qualitative results do show a very positive impact (on
participant’s feelings, sense of community and of belonging) on the choir’s participants, as reported by
choir members and by family, carers and support workers. The choir also seemed to aid progressions and
growth amongst participants, as well as promoting equality and respect. A number of specific benefits
were discussed above. The qualitative results also offered insights into the experiences of people with
intellectual disabilities, for example how they felt they were perceived by others, instances of bullying
and social exclusion. Not all feedback was entirely positive. Several volunteers mentioned a need to
improve communication, and to reduce confusion. This feedback will be used to better manage future
projects.
As mentioned above, the quantitative data did not show a clear picture about the impact of the
intervention, with no clear progression between T1 and T3. There are a number of possible reasons for
this. As indicated above, it could be that the choir had no impact on the variables measured, although this
seems unlikely given the qualitative data. Other reasons will be examined in more detail in a separate
paper (in preparation). Possible causes include that the scales were difficult to understand, or that other
variables influenced respondent answers (for example acquiescence). Additionally, questions were raised
about the sense of self assumed by the rating scales. Although the rating scales were selected because of

Moore, J. © Journal of Music, Health, and Wellbeing (Autumn 2020)
12
their established use and seeming effectiveness with people with intellectual disabilities, the results
suggest that respondents had some difficulties understanding questions about how people with intellectual
disabilities are perceived by others, which might be interpreted to support Harter (1982:87-97, 1985,
passim), who argued that learning disabilities can be associated with a less developed sense of self.
Due to respondent numbers, no statistical testing was done. It is anticipated that the next phase
of the study will gather further data, possibly from a larger cohort, as this may clarify whether the issues
found in this study regarding the rating scales are indicative of a more general situation. As far as the
quantitative results suggest anything, they indicate a relatively high average score for questions relating
to self-worth and self-awareness and relatively low score for negative measures. While the scores
fluctuate between time-points, there is no clear pattern. Despite some reduction in mean scores for the
‘negative’ items, statistical testing revealed a lack of internal consistency, although the change in average
score between the ‘positive’ and ‘negative’ items seems to indicate that the scale was generally
understood by participants (however, see discussion above of Cronbach Alpha scores). Similarly, for the
PWI, the scores indicate a generally high level of satisfaction, both with participants’ lives and with
specific elements of their lives (possessions, health, creativity and so on). In the qualitative data, a clear
picture emerged of the perceived positive impact of the choir (for example, participants became more
sociable and confident), and also into the prejudice faced by people with an intellectual disability, and the
way participants see themselves.
Turning to the wider implications of our results, there seems to be a need to address inequalities
in health and wellbeing for the substantial group of people with intellectual disabilities in the UK and
beyond. A report by researchers at University College London finds that people with intellectual
disabilities are more likely to live in poverty, less likely to be in work, and more likely to suffer bullying
and discrimination (Rikard & Donkin, 2018). There is also a need to expand research to include more
people with intellectual disabilities as participants. Indeed, a consensus statement has recently been
published on approaches to conducting inclusive health research (Frankena, Naaldenberg, Cardol, Iriarte,
Buchner, Brooker, Embregts, Joosa, Crother, Schormans, Schippers, Walmsley, O’Brien, Linehan,
Northway, de Valk & Leusink, 2019:1-11). This contains useful pointers around four key themes
(attributes of inclusive research; potential outcomes; reporting and publishing, and future research
directions).
The background literature also highlighted benefits of participation in music amongst the general
population: a sense of belonging, feeling more connected, better health and wellbeing, and engagement
(Wilson et al., 2017: 847-858; Hall, 2010:24-40; Nordof Robbins, 2019; Clift & Hancox, 2010:79-96;
Clift et al., 2017; Coulton et al., 2015:250-255). These benefits were also found amongst our participants,
particularly in regards to a sense of belonging, feeling more connected and engagement, as discussed in
the results section above. For example, Wilson et al. (2017:847-858) report that a study of the impact of
a supported social group for adults with intellectual disabilities boosts engagement, and through this
wellbeing, and develops social belonging and connectedness. This chimes with our results, but it should
be noted that Wilson et al.’s study had only 10 participants. Similarly, studies looking at music
interventions amongst people with an intellectual disability (for example Graham, 2004:24-29; Pavlicevic
et al., 2014:5-19; Baumgarten & Wheeler, 2016:118-127) find numerous benefits, which broadly concur
with our findings.
5. Conclusion
In summary, while the quantitative results fail to show a clear picture, the qualitative results
clearly indicate the positive impact of group singing as delivered by this project for people with an
intellectual disability. The possible reasons for the unclear quantitative results have been discussed above,
and further studies including a larger number of participants might throw further light on the matter.
Arguably it may be important not to see lack of proven statistical significance as a ‘failure’, but rather as
a call for future consideration of what health and wellbeing mean for people with intellectual disabilities,
Moore, J. © Journal of Music, Health, and Wellbeing (Autumn 2020)
13
Impact of Participating in a Choir on Health and Wellbeing of Adults with Intellectual Disabilities
and of how this group of people can be best researched in order that their positions be most adequately
represented. Indeed, our long-term aim is to influence practice in the field. Further reflections on issues
which arose in data collection and analysis form the subject of another paper (in preparation), and in this
we will share further thoughts about improving research practice. Aside from issues with the quantitative
data, the qualitative results give a vivid picture of the widespread impacts of the choir on its participants.
As empirical research, which involves people with an intellectual disability as participants is in
its relative infancy, it is hoped that this study will contribute to the body of knowledge around health and
wellbeing in this group. The methodological issues which arose during data collection have prompted
further reflection amongst researchers, and it is hoped that wider dissemination will be of interest to other
researchers and improve research methods. We had planned a dissemination event; due to the impact of
the Coronavirus this has been postponed.
References
Ali, A., Hassiotis, A., Strydom, A., & King, M. 2012. ‘Self-stigma in people with intellectual disabilities
and courtesy stigma in family carers: A systematic review’. Research in Developmental
Disabilities, 33, 2122 – 2140. doi: 10.1016/j.ridd.2012.06.013.
Bates, P., & Davis, F. A. 2004. ‘Social capital, social inclusion and services for people with learning
disabilities’. Disability and Society, 19, 195–207. doi.org/10.1080/0968759042000204202
Baumgarten, H. R. & Wheeler, B. L. 2016. ‘The effects of music therapy on the prosocial behaviours of
adults with disabilities’. Music and Medicine, 8, 118-127.
Beauchamp, T. L. & Childress, J.F. 2009. Principles of Biomedical Ethics. New York: Oxford University
Press.
British Association for Music Therapy 2017. BAMT Information leaflets. [Available online:
https://www.bamt.org/british-association-for-music-therapy-resources/bamt-information-
leaflets.html] Last Accessed: 08/07/2020.
Clark, V. & Braun, V. 2013. ‘Teaching thematic Analysis: Overcoming challenges and developing
strategies for effective learning’. The Psychologist, 26, 120-123.
Clark, V. L. P. & Ivankova, N. V. 2015. Mixed Methods Research: A guide to the field. Thousand Oaks,
CA: SAGE.
Clift, S. & Hancox, G. 2010. ‘The Significance of Choral Singing for Sustaining Psychological
Wellbeing: Findings from a survey of choristers in England, Australia and Germany’. Music
Performance Research, 3, pp. 79–96
Clift, S., Gilbert, R. & Vella-Burrows, T. 2016. A Choir in Every Care Home: A review of research on
the value of singing for older people. London: The Baring Foundation. [Available online:
https://achoirineverycarehome.files.wordpress.com/2016/04/wp6-research-review-v2-1.pdf]
Last Accessed: 17/06/2020.
Clift, S., Skingley, A., Page, S., Stephens, L. & Hurley, S. 2017. Singing for Better Breathing: Findings
from the Lambeth and Southwark Singing and COPD Project. Canterbury: Sidney De Haan
Research Centre for Arts and Health. [Available online: http://create.canterbury.ac.uk/17081/]
Last Accessed 29/05/2020.
Cluley, V. 2018. ‘From “Learning disability to intellectual disability”— Perceptions of the increasing use
of the term “intellectual disability” in learning disability policy, research and practice’. British
Journal of Learning Disabilities, 46, 24–32. doi.org/10.1111/bld.12209
Coleman, N., Sykes, W. & Groom, C. 2013. Barriers to employment and unfair treatment at work: a
quantitative analysis of disabled people’s experiences. [Available online:
https://www.equalityhumanrights.com/sites/default/files/research-report-88-barriers-to-

Moore, J. © Journal of Music, Health, and Wellbeing (Autumn 2020)
14
employment-and-unfair-treatment-at-work-disabled-peoples-experiences.pdf] Last Accessed
21/06/2020.
Coulton, S., Clift, S., Skingley, A. & Rodriguez, J. 2015. ‘Effectiveness and Cost-effectiveness of
Community Singing on Mental Health-related Quality of Life of Older People: Randomised
controlled trial’. The British Journal of Psychiatry, 207, 250–55. doi:
10.1192/bjp.bp.113.129908.
Cummins, R. A. & Lau, A. D. L. 2005. Personal wellbeing index-intellectual disability. 3rd edn, Deakin
University, Australia: Deakin University Press.
Davis, C., Kellett, S. & Beail, N. 2009. ‘Utility of the Rosenberg self-esteem scale’. American Journal of
Intellectual Developmental Disabilities, 114, 172-178. doi: 10.1352/1944-7558-114.3.172.
Department of Health. 2001, March. Valuing People: A new Strategy for Learning Disability for the 21st
Century. [Available online:
https://assets.publishing.service.gov.uk/government/uploads/system/uploads/attachment_data/f
ile/250877/5086.pdf]. Last Accessed: 23/06/2020.
Department of Health. 2010, March. Inclusion Health: Improving the way we meet the primary health
care needs of the socially excluded. [Available online:
https://webarchive.nationalarchives.gov.uk/+/http:/www.cabinetoffice.gov.uk/media/346571/in
clusion-health.pdf]. Last Accessed: 23/06/2020.
Emerson, E., & Hatton, C. 2008, May 1. People with Learning Disabilities in England. [Available online:
https://www.lancaster.ac.uk/staff/emersone/FASSWeb/Emerson_08_PWLDinEngland.pdf].
Last Accessed: 25/06/2020.
Finlay, W. & Lyons, E. 2002. ‘Acquiescence in Interviews With People Who Have Mental Retardation’.
Mental Retardation, 40, 14–29. doi:10.1352/0047-6765(2002040<0014:AIIWPW>2.0.CO;2.
Frankena, T. K., Naaldenberg, J., Cardol, m., Garcia Iriarte, E., Buchner, T., Brooker, K., Embregts, P.,
Joosa, E., Crother, F., Fudge Schormans, A., Schippers, A., Walmsley, J., O’Brien, P., Linehan,
C., Northway, R., van Schrojenstein Lantman-de Valk, H. & Leusink, G. 2019. ‘A consensus
statement on how to conduct inclusive health research’. Journal of Intellectual Disability
Research, 63, 1–11. doi: 10.1111/jir.12486
Given, L. M. 2008 The Sage Encyclopedia of Qualitative Research Methods, Thousand Oaks, CA: SAGE.
Graham, J. 2004. ‘Communicating with the uncommunicative: Music therapy with pre-verbal adults’.
British Journal of Learning Disabilities, 32, 24–29. https://doi.org/10.1111/j.1468-
3156.2004.00247.x
Hall, S. A. 2010. ‘The Social Inclusion of Young Adults with Intellectual Disabilities: A Phenomenology
of their Experiences’. Journal of Ethnographic and Qualitative Research, 4:1, 24–40.
Harter, S. 1982. ‘The Perceived Competence Scale for Children’. Child Development. 53:1, 87–97.
Harter, S. 1985 Manual: Self-Perception Profile for Children. Denver, CO: University of Denver.
Kennedy, L. and Brewer, G. 2016. ‘Creative methodologies to enhance communication’. British Journal
of Learning Disabilities, 44, 35–42.
Lewandowski, L. and Aracngelo, K. 1994. ‘The social adjustment and self-concept of adults with learning
disabilities’. Journal of Learning Disabilities, 27, 598–605.
McClimens, A., & Allmark, P. 2011. ‘A problem with inclusion in learning disability research’. Nursing
Ethics, 18(5), 633–639. https://doi.org/10.1177/0969733011404588
McGillivray, J. A., Lau, A. L. D., Cummins, R. A. and Davey, G. 2009. ‘The Utility of the Personal
Wellbeing Index Intellectual Disability Scale in an Australian Sample’. Journal of Applied
Research in Intellectual Disabilities, 22, 276–286. https://doi.org/10.1111/j.1468-
3148.2008.00460.x
Mencap. 2020. How common is a learning disability? [Available online:
https://www.mencap.org.uk/learning-disability-explained/research-and-statistics/how-
common-learning-disability]. Last Accessed: 23/06/2020.
NHS Digital (2019, January 24). Health and Care of People with Learning Disabilities, Experimental
Statistics: 2017 to 2018 [PAS]. [Available online: https://digital.nhs.uk/data-and-
information/publications/statistical/health-and-care-of-people-with-learning-

Moore, J. © Journal of Music, Health, and Wellbeing (Autumn 2020)
15
Impact of Participating in a Choir on Health and Wellbeing of Adults with Intellectual Disabilities
disabilities/experimental-statistics-2017-to-2018]. Last accessed 24/06/2020. Last Accessed:
23/06/2020.
Nordoff, R. 2020. How can Nordoff Robbins Music Therapy Help? [Available online:
https://www.nordoff-robbins.org.uk/music-therapy-and-learning-difficulties/]. Last Accessed:
22/06/2020.
Park, J-Y. & Park, E-Y. 2019. ‘The Rasch Analysis of Rosenberg Self-Esteem Scale in Individuals with
Intellectual Disabilities’. Frontiers in Psychology, 16th September 2019.
doi.org/10.3389/fpsyg.2019.01992
Patton, M. Q. 2014. Qualitative Research & Evaluation Methods: Integrating Theory and Practice.
Thousand Oaks, CA: SAGE.
Pavlicevic, M., O’Neil, N., Powell, H., Jones, O., & Sampathianaki, E. 2014. ‘Making music, making
friends: Long-term music therapy with young adults with severe learning disabilities’. Journal
of Intellectual Disabilities, 18, 5–19. https://doi.org/10.1177/1744629513511354
Pestana, C. 2014. ‘Exploring the self-concept of adults with mild learning disabilities’. British Journal of
Learning Disabilities, 43, 16–23. Doi.org/10.1111/bld.12081
Prescott, A. P. 2006. The Concept of Self in Psychology. New York: Nova Science Publishers.
Reschly, A. & Christenson, S. 2006. ‘School completion’ in Children’s needs: development, prevention,
and intervention III. Edited by Bear, G.G. and Minke, K.M, 103–113. Bethesda, MD: National
Association of School Psychologists.
Rikard, W. & Donkin, A. 2018. ‘A Fair, Supportive Society. Institute of Health Equality’. [Available
online: http://www.instituteofhealthequity.org/resources-reports/a-fair-supportive-society-
summary-report/a-fair-supportive-society-summary-report.pdf]. Last Accessed: 25/06/2020.
Rosenberg, M. 1965. Society and the Adolescent Self-Image. Princeton, NJ: Princeton University Press.
Sense, A. 2017. Someone cares if I’m not there. [Available online: https://www.sense.org.uk/support-
us/campaigns/loneliness/]. Last Accessed: 21/06/2020.
Taheri, A., Perry, A. & Minnes, P. 2016. ‘Examining the social participation of children and adolescents
with intellectual disabilities and autism spectrum disorder in relation to peers’. Journal of
Intellectual Disability Research, 60, 435–443. https://doi.org/10.1111/jir.12289
Thyer, B. 2010. The Handbook of Social Work Research Methods. Thousand Oaks, CA: SAGE.
Walmsley, J. 2001. ‘Normalisation, Emancipatory Research and Inclusive Research in Learning
Disability’. Disability & Society, 16, 187–205. doi.org/10.1080/09687590120035807
Wilson, N. J., Jaques, H., Johnson, A., & Brotherton, M. L. 2017. ‘From Social Exclusion to Supported
Inclusion: Adults with Intellectual Disability Discuss Their Lived Experiences of a Structured
Social Group’. Journal of Applied Research in Intellectual Disabilities, 30, 847–858. doi:
10.1111/jar.12275.
World Health Organisation 2019. Definition: intellectual disability. [Available online:
http://www.euro.who.int/en/health-topics/noncommunicable-diseases/mental-
health/news/news/2010/15/childrens-right-to-family-life/definition-intellectual-disability]. Last
Accessed: 21/06/2020.
Yousefi, A. A., Mozaffari, K. Sharif, N. & Sepasi, M. 2013. Reliability and Validity of the “Personal
Well-Being index – Cognitive Disability” on Mentally Retarded Students. Iranian Journal of
Psychiatry, 8, 68–72.

Moore, J. © Journal of Music, Health, and Wellbeing (Autumn 2020)
16
Appendices
Appendix One: Adapted Rosenberg Scale
Rosenberg Self-Esteem Scale
Please read each statement. Then circle the number indicating how much you believe the statement to be
true.
Never true Hardly ever
true
Sometimes
true Often true Always true
1. I feel that I am a good
person, as good as
others
1 2 3 4 5
2. I feel that I have a lot of
good qualities 1 2 3 4 5
3. I am able to do things as
well as most other
people
1 2 3 4 5
4. I feel I haven’t done
anything worthwhile 1 2 3 4 5
5. I like myself 1 2 3 4 5
6. At times, I think I am no
good at all 1 2 3 4 5
Appendix Two: Adapted PWI Scale

Moore, J. © Journal of Music, Health, and Wellbeing (Autumn 2020)
17
Impact of Participating in a Choir on Health and Wellbeing of Adults with Intellectual Disabilities
Appendix Three: Personal Wellbeing Index (PWI-ID)
Test Question: Using the scale, how do you feel about eating ice cream?
Part I: Happy with Life as a Whole
1. “How happy do you feel about your life as a whole?” _____________________________
Part II: Personal Wellbeing Index – Intellectual Disability
“How happy do you feel about…?”
2. the things you have? Like the money you have and the things you own? _______________
3. how healthy you are? _______________________
4. the things you make or the things you learn? _______________________
5. getting on with the people you know? _______________________
6. how safe you feel? _______________________
7. doing things outside your home? _______________________
8. how things will be later on in your life? _______________________
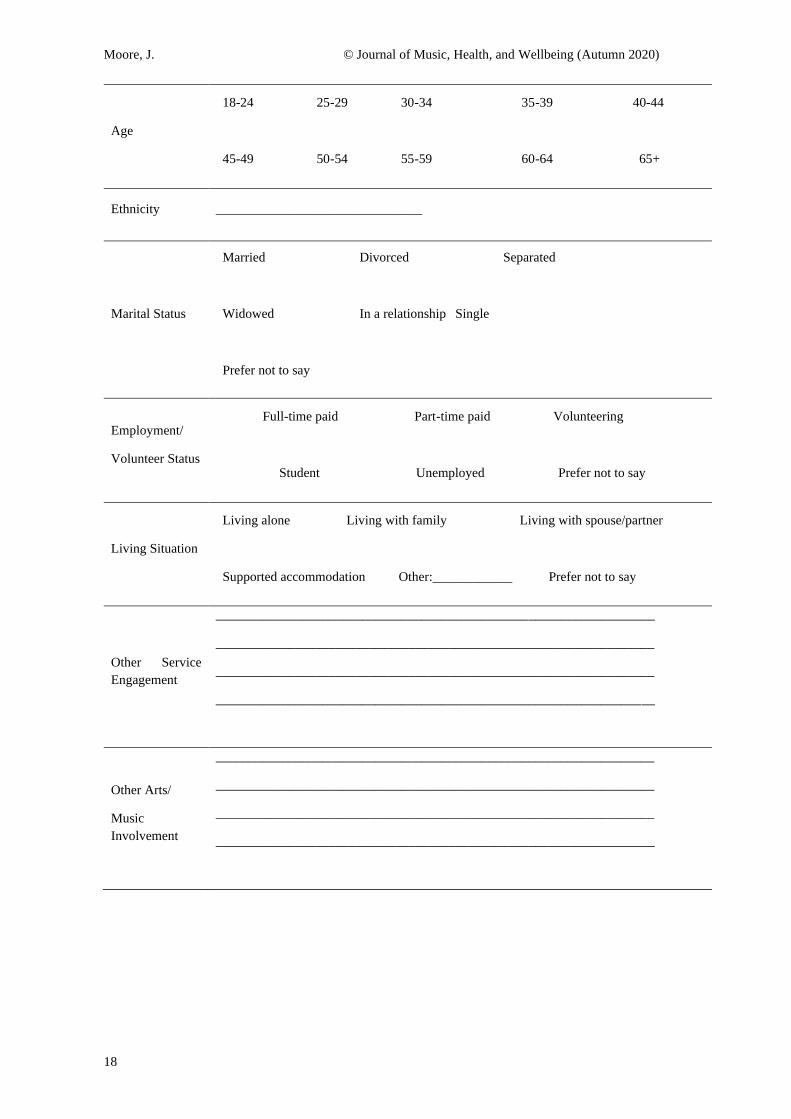
Appendix Four: Demographics
Demographics and Initial Information
Gender Male Female Prefer not to say
Happy nearly always
Happy most of the time
Happy about
sometimes
Not often very
happy
Hardly ever
happy
Happy nearly always
Happy most of the time
Not often very
happy
Hardly ever
happy
Happy about
sometimes
Moore, J. © Journal of Music, Health, and Wellbeing (Autumn 2020)
18
Age
18-24 25-29 30-34 35-39 40-44
45-49 50-54 55-59 60-64 65+
Ethnicity _______________________________
Marital Status
Married Divorced Separated
Widowed In a relationship Single
Prefer not to say
Employment/
Volunteer Status
Full-time paid Part-time paid Volunteering
Student Unemployed Prefer not to say
Living Situation
Living alone Living with family Living with spouse/partner
Supported accommodation Other:____________ Prefer not to say
Other Service
Engagement
__________________________________________________________________
__________________________________________________________________
__________________________________________________________________
__________________________________________________________________
Other Arts/
Music
Involvement
__________________________________________________________________
__________________________________________________________________
__________________________________________________________________
__________________________________________________________________

Moore, J. © Journal of Music, Health, and Wellbeing (Autumn 2020)
19
Impact of Participating in a Choir on Health and Wellbeing of Adults with Intellectual Disabilities
Appendix Five: Short Answer Questions
How does singing make you feel?
___________________________________________________________________________________
___________________________________________________________________________________
___________________________________________________________________________________
_______________________________________________________________________
What did you like most about the choir?
___________________________________________________________________________________
___________________________________________________________________________________
___________________________________________________________________________________
_______________________________________________________________________
How did you feel about performing in front of people?
___________________________________________________________________________________
___________________________________________________________________________________
___________________________________________________________________________________
_______________________________________________________________________
Is the time of the choir convenient to you?
___________________________________________________________________________________
___________________________________________________________________
Do you feel comfortable coming to the room and the building for the choir?
___________________________________________________________________________________
___________________________________________________________________
What did you not like about the choir?
___________________________________________________________________________________
___________________________________________________________________________________
___________________________________________________________________________________
_______________________________________________________________________
What do you think could be made better about the choir?
___________________________________________________________________________________
___________________________________________________________________________________
___________________________________________________________________________________
______________________________________________________________________
Researcher Only – Reflection on data collection

Moore, J. © Journal of Music, Health, and Wellbeing (Autumn 2020)
20
___________________________________________________________________________________
___________________________________________________________________________________
___________________________________________________________________________________
___________________________________________________________________________________
___________________________________________________________________________________
_________________________________________________________________
Appendix Six: Supplementary Tables
Table 2. Respondent consistency over time points
Respondent T1 (n=19) T2 (n=16) T3 (n=14) Respondent included in
all 3 data collections?
PID001 X X X Y
PID002 X X
PID003 X X X Y
PID004 X X X Y
PID005 X X X Y
PID006 X X X Y
PID007 X
PID008 X X X Y
PID009 X X
PID010 X X X Y
PID011 X X
PID012 X X X Y
PID013 X X X Y
PID014 X X X Y
PID015 X X X Y
PID016 X
PID017 X X X
PID018 X X X
PID019 X X
PID020
PID021
PID022

Moore, J. © Journal of Music, Health, and Wellbeing (Autumn 2020)
21
Impact of Participating in a Choir on Health and Wellbeing of Adults with Intellectual Disabilities
Table 3. Gender at all time points
T1 T2 T3
Male 8 7 6
Female 9 9 8
Prefer not to say 1 0 0
Missing 4 6 8
Total 22 22 22
Table 4. Age groups by time points
T1 T2 T3
18-24 0 0 0
25-29 6 7 4
30-34 4 2 3
35-39 1 1 0
40-44 0 0 0
45-49 4 3 3
50-54 1 1 2
55-59 2 2 1
60-64 0 0 1
65+ 0 0 0
Prefer not to say 0 0 0
Missing 4 6 8
Total 22 22 22
Table 5. Ethnicity by time points
T1 T2 T3
Born in UK, Jamaica
heritage
1
White British (and
variants)
16 9 9
White British / half
Egyptian
1 1

Moore, J. © Journal of Music, Health, and Wellbeing (Autumn 2020)
22
Black African 0 1
British (and variants) 0 4 1
White 0 0 2
Black 0 0 1
Missing 4 7 9
Table 6. Marital status by time points
T1 T2 T3
Married 1 1 1
In a relationship 4 7 6
Single 11 7 6
Prefer not to say 2 1 1
Missing 4 6 8
Total 22 22 22
Missing 4 7 9
Table 7. Work status by time points
T1 T2 T3
Full-time paid 1 0 2
Part-time paid 1 3 6
Volunteering 8 5 1
Unemployed 7 5 4
Prefer not to say 1 2 0
Missing 4 7 9
Total 22 22 22
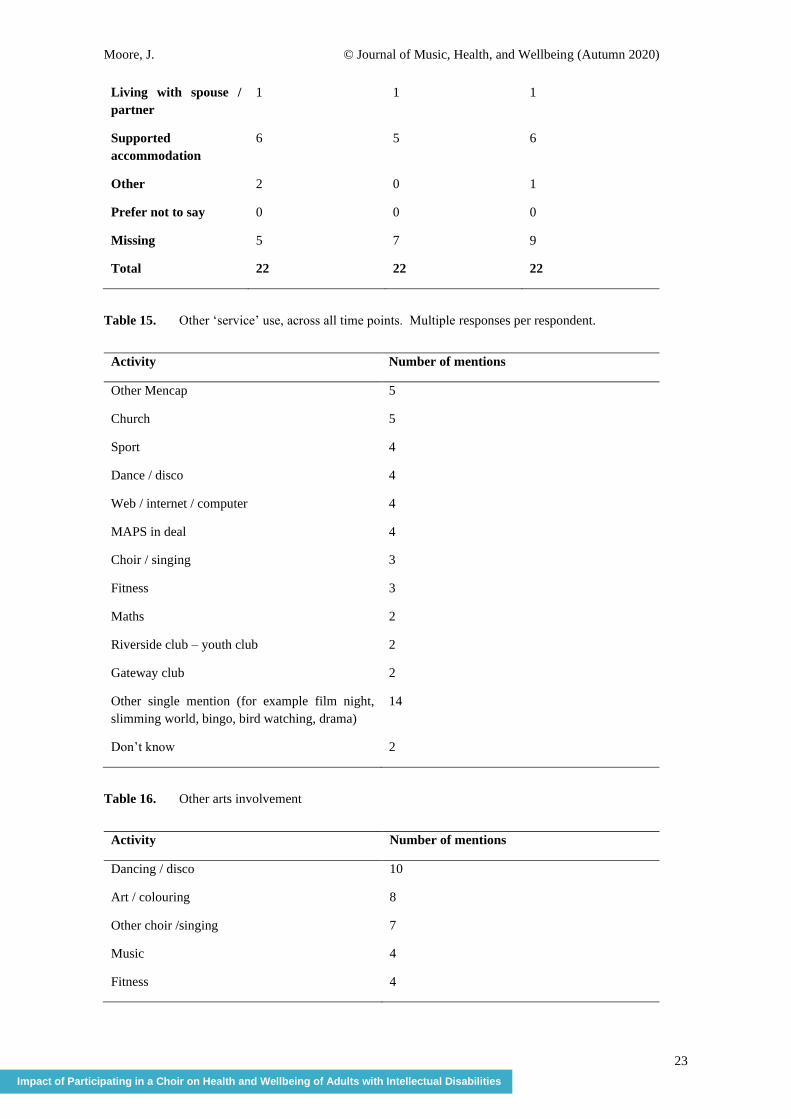
Table 8. Living situation by time points
T1 T2 T3
Living alone 0 1 1
Living with family 8 8 4
Moore, J. © Journal of Music, Health, and Wellbeing (Autumn 2020)
23
Impact of Participating in a Choir on Health and Wellbeing of Adults with Intellectual Disabilities
Living with spouse /
partner
1 1 1
Supported
accommodation
6 5 6
Other 2 0 1
Prefer not to say 0 0 0
Missing 5 7 9
Total 22 22 22
Table 15. Other ‘service’ use, across all time points. Multiple responses per respondent.
Activity Number of mentions
Other Mencap 5
Church 5
Sport 4
Dance / disco 4
Web / internet / computer 4
MAPS in deal 4
Choir / singing 3
Fitness 3
Maths 2
Riverside club – youth club 2
Gateway club 2
Other single mention (for example film night,
slimming world, bingo, bird watching, drama)
14
Don’t know 2
Table 16. Other arts involvement
Activity Number of mentions
Dancing / disco 10
Art / colouring 8
Other choir /singing 7
Music 4
Fitness 4

Moore, J. © Journal of Music, Health, and Wellbeing (Autumn 2020)
24
Karaoke 3
Painting 2
Bingo 2
Tambourine 1
Drums 1
DJing 1
Listen to Elvis 1
Swimming 1
Bocca 1
Outdoors 1
Drama 1
Writing 1
Photography 1
Cooking 1
Folkestone Hall events 1
Shopping 1
Quiz 1
Bowling 1
Monday club 1
Tuesday MAPS 1
Everything 1
No / none 4
Table 17. Other arts involvement (summary codes)
Activity Number of mentions
Music 18
Fitness / movement 17
Arts 13
Other 10
No/none 4
Table 18. Summary of responses to question about whether respondent thinks they have a learning
disability
Moore, J. © Journal of Music, Health, and Wellbeing (Autumn 2020)
25
Impact of Participating in a Choir on Health and Wellbeing of Adults with Intellectual Disabilities
T1 T2 T3
Yes and variations 14 13 11
No and variations 3 1 1
Don’t know 1 1
Other response 1 1
Table 19. Summary of responses to question about whether respondent thinks they were treated
differently because of their learning disability
T1 T2 T3
Yes – treated badly /
worse
4 6 2
Yes – treated better /
well
1 1 2
Yes – not specified
how / not clearly
better or worse
3 2 6
No – not treated
differently
5 2 4
Other 4 2 5
No response 1 3
Table 20. What did you like most about the choir? (Summary)
Summary code Mentions
Singing / enjoyment of singing / music 17
Socialising / being with friends 10
Happy / makes me happy and variants 2
Other 6

Moore, J. © Journal of Music, Health, and Wellbeing (Autumn 2020)
26
Table 21. How did you feel about performing in front of people? (Summary)
Summary code Mentions
Enjoyed it / happy / other positive 22
Nervous 5
Not nervous 3
Mentions of family 2
Confident 1
Table 22. Improvements to the choir
Code Responses
Different / more songs 5
Performing with other choirs 2
Dancing / disco 2
Warmups / drama games 2
Performing at other venues 1
More people in choir 1
Toilet break 1
Singing workshops 1