Embed Size (px)
Citation preview
Impact Evaluation Report 8
Linxiu Zhang, Scott Rozelle and Yaojing Shi
October 2013
Paying for performance in China’s battle against anaemia
International Initiative for Impact Evaluation
ii
About 3ie
The International Initiative for Impact Evaluation (3ie) was set up in 2007 to meet
growing demand for more and better evidence of what development interventions in
low- and middle-income countries work and why. By funding rigorous impact evaluations
and systematic reviews and by making evidence accessible and useful to policymakers
and practitioners, 3ie is helping to improve the lives of people living in poverty.
3ie Impact Evaluations
3ie-supported impact evaluations assess the difference a development intervention has
made to social and economic outcomes. 3ie is committed to funding rigorous evaluations
that include a theory-based design and that use the most appropriate mix of methods to
capture outcomes and impact usefully in complex development contexts.
About this report
3ie accepted the final version of this report, Paying for performance in China's battle
against anaemia, in March 2012 as fulfilment of requirements under grant OW1.66. The
content has been copyedited and formatted for publication by 3ie. Due to unavoidable
constraints at the time of publication, a few of the tables or figures may be less than
optimal. All content is the sole responsibility of the authors and does not represent the
opinions of 3ie, its donors or its Board of Commissioners. Any errors and omissions are
the sole responsibility of the authors. All affiliations of the authors listed in the title page
are those that were in effect at the time the report was accepted. Any comments or
queries should be directed to the corresponding author, Linxiu Zhang at
Funding for this impact evaluation was provided by 3ie’s donors, which include UKaid,
the Bill and Melinda Gates Foundation, Hewlett Foundation and 12 other 3ie members
that provide institutional support. A complete listing is provided on the 3ie website at
http://www.3ieimpact.org/en/about/3ie-affiliates/3ie-members/.
Suggested citation: Zhang, L., Rozelle, S. and Shi, Y., 2013. Paying for performance in
China's battle against anaemia, 3ie Impact Evaluation Report 8. New Delhi: International
Initiative for Impact Evaluation (3ie)
3ie Impact Evaluation Report Series executive editors: Jyotsna Puri and Beryl Leach
Managing editors: Paromita Mukhopadhyay and Annette Brown
Assistant managing editor: Kanika Jha
Production manager: Lorna Fray
Assistant production manager: Rajesh Sharma
Copy editors: Lucy Southwood and Olwyn Hocking
Cover design: Via Interactive
Cover photo: Joe Whittingham
© International Initiative for Impact Evaluation (3ie), 2013
iii
Paying for performance in China's battle against anaemia
October 2013 3ie Impact Evaluation Report 8
Linxiu Zhang
Centre for Chinese Agricultural Policy Rural Education Action Project (REAP) China
Scott Rozelle
Helen F. Farnsworth Freeman Spogli Institute for International Studies, Stanford University
REAP China
Yaojing Shi Northwest Socioeconomic Development Research Center
REAP China
iv
Abstract
Objectives: To study how misaligned supply-side incentives impede health programmes
in developing countries, we tested the impact of performance pay for anaemia reduction
in rural China.
Design: A cluster randomised trial of information, subsidies, and incentives for school
principals to reduce anaemia among students.
Setting: 72 randomly selected rural primary schools across northwest China.
Participants: 3,553 fourth- and fifth-grade students aged 9 to 11.
Interventions: Sample schools were randomly assigned to a control group with no
intervention, or one of three treatment arms: (1) an information arm in which principals
received information about anaemia; (2) a subsidy arm in which principals received
information and unconditional subsidies; and (3) an incentive arm in which principals
received information, subsidies, and financial incentives for reducing anaemia among
students. Twenty-seven schools were assigned to the control arm, 15 schools were
assigned to the information arm, 15 schools were assigned to the subsidy arm, and 15
schools were assigned to the incentive arm.
Main outcome measures: Student haemoglobin (Hb) concentrations.
Results: Mean student Hb concentration rose by 0.15 g/dL in information schools, 0.08
g/dL in subsidy schools, and 0.24 g/dL in incentive schools relative to the control group.
This increase in Hb corresponded to a reduction in anaemia prevalence (Hb < 11.5 g/dL)
of 24 per cent in incentive schools. Interactions with pre-existing principal incentives for
good test scores may have led to substantially larger gains in the information and
incentive arms. In the presence of test score incentives, effects on student Hb
concentration were 0.98 g/dL larger in information schools and 0.86 g/dL larger in
incentive schools.
Conclusions: Financial incentives for health improvement were modestly effective.
Understanding interactions with other motives and pre-existing incentives is critical.
v
Contents
Abstract ............................................................................................................... iv
List of figures and tables ........................................................................................ vi
Abbreviations and acronyms ................................................................................... vi
1. Introduction ....................................................................................................... 1
2. Methods ............................................................................................................ 2
2.1 Setting and participants ..................................................................................... 2
2.2 Randomisation and interventions ........................................................................ 2
2.3 Outcomes and follow-up .................................................................................... 5
2.4 Statistical analysis ............................................................................................ 6
2.5 Baseline findings .............................................................................................. 6
2.6 Endline findings ................................................................................................ 7
2.7 Theory of change .............................................................................................. 7
3. Baseline results .................................................................................................. 8
3.1 Anaemia prevalence in Qinghai and Ningxia ......................................................... 8
3.2 Individual-, household- and school-based correlates of anaemia ............................. 9
3.3 Correlations between anaemia and tests of physical, psychological and cognitive outcomes ............................................................................................................ 11
4. Endline results ................................................................................................. 15
4.1 Changes in haemoglobin concentrations and complementarity with test score incentives............................................................................................................ 15
4.2 Behavioural responses to interventions .............................................................. 20
4.3 Principals' strategies to reduce anaemia ............................................................ 20
4.4 Unintended behavioural responses by parents and principals ................................ 20
5. Policy recommendations .................................................................................... 21
References .......................................................................................................... 22
vi
List of figures and tables
Figures Figure 1 Trial profile ............................................................................................... 3
Figure 2 Distribution of student haemoglobin concentrations at baseline and follow-up by
experiment arm ................................................................................................... 16
Figure 3 Difference in the distributions of haemoglobin concentrations between baseline
and follow-up by experiment arm relative to control ................................................. 17
Figure 4 Distribution of changes in haemoglobin concentrations among schools with and
without test score incentives by experiment arm ...................................................... 17
Tables Table 1 Baseline student characteristics by experiment arm ........................................ 4
Table 2 Individual-, household- and school-based characteristics that may correlate with
anaemia .............................................................................................................. 10
Table 3 Individual-, household- and school-based correlates of Hb levels .................... 12
Table 4 Physical, psychological and cognitive test scores, by anaemia status ............... 13
Table 5 Correlations between anaemia and physical, psychological and cognitive
outcomes ............................................................................................................ 14
Table 6 Changes in haemoglobin concentration and anaemia prevalence by experiment
arm .................................................................................................................... 18
Table 7 Changes in haemoglobin concentration and anaemia prevalence by experiment
arm and pre-existing test score incentives ............................................................... 19
Abbreviations and acronyms
BMI body mass index
g/dL grams per decilitre
HAZ Height-for-age z-score
Hb haemoglobin
OLS ordinary least squares
P4P pay-for-performance
QOF Quality and Outcomes Framework
CNY Chinese yuan
1
1. Introduction
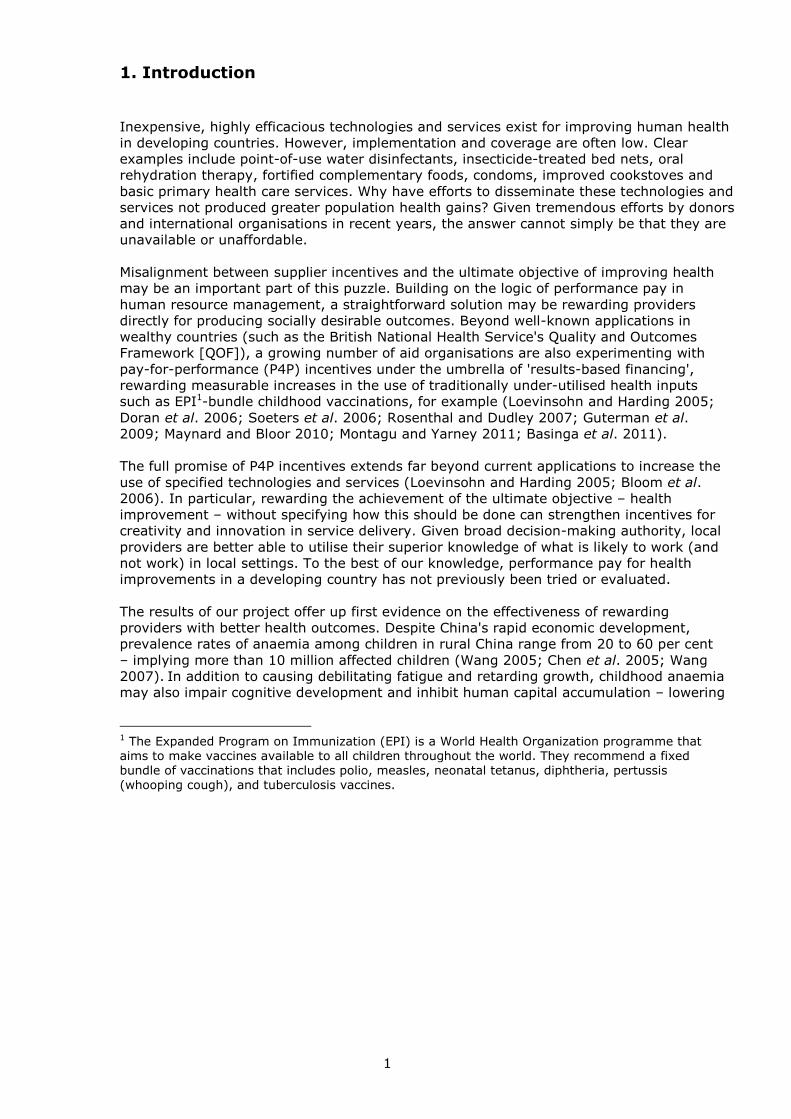
Inexpensive, highly efficacious technologies and services exist for improving human health
in developing countries. However, implementation and coverage are often low. Clear
examples include point-of-use water disinfectants, insecticide-treated bed nets, oral
rehydration therapy, fortified complementary foods, condoms, improved cookstoves and
basic primary health care services. Why have efforts to disseminate these technologies and
services not produced greater population health gains? Given tremendous efforts by donors
and international organisations in recent years, the answer cannot simply be that they are
unavailable or unaffordable.
Misalignment between supplier incentives and the ultimate objective of improving health
may be an important part of this puzzle. Building on the logic of performance pay in
human resource management, a straightforward solution may be rewarding providers
directly for producing socially desirable outcomes. Beyond well-known applications in
wealthy countries (such as the British National Health Service's Quality and Outcomes
Framework [QOF]), a growing number of aid organisations are also experimenting with
pay-for-performance (P4P) incentives under the umbrella of 'results-based financing',
rewarding measurable increases in the use of traditionally under-utilised health inputs
such as EPI1-bundle childhood vaccinations, for example (Loevinsohn and Harding 2005;
Doran et al. 2006; Soeters et al. 2006; Rosenthal and Dudley 2007; Guterman et al.
2009; Maynard and Bloor 2010; Montagu and Yarney 2011; Basinga et al. 2011).
The full promise of P4P incentives extends far beyond current applications to increase the
use of specified technologies and services (Loevinsohn and Harding 2005; Bloom et al.
2006). In particular, rewarding the achievement of the ultimate objective – health
improvement – without specifying how this should be done can strengthen incentives for
creativity and innovation in service delivery. Given broad decision-making authority, local
providers are better able to utilise their superior knowledge of what is likely to work (and
not work) in local settings. To the best of our knowledge, performance pay for health
improvements in a developing country has not previously been tried or evaluated.
The results of our project offer up first evidence on the effectiveness of rewarding
providers with better health outcomes. Despite China's rapid economic development,
prevalence rates of anaemia among children in rural China range from 20 to 60 per cent
– implying more than 10 million affected children (Wang 2005; Chen et al. 2005; Wang
2007). In addition to causing debilitating fatigue and retarding growth, childhood anaemia
may also impair cognitive development and inhibit human capital accumulation – lowering
1 The Expanded Program on Immunization (EPI) is a World Health Organization programme that aims to make vaccines available to all children throughout the world. They recommend a fixed bundle of vaccinations that includes polio, measles, neonatal tetanus, diphtheria, pertussis (whooping cough), and tuberculosis vaccines.
2
socioeconomic status throughout the life course (Halterman et al. 2001; Stoltzfus 2001;
Yip 2001; Bobonis et al. 2006). The high prevalence of childhood anaemia in China and
many other developing countries is remarkable, given that it can (in principle) be
confronted through simple, low-cost nutrition interventions. We therefore conducted a
cluster-randomised field experiment in rural Chinese primary schools, a natural contact
point with children (Desai and Alva 1998) to study the impact of information, subsidies
and financial incentives for principals to reduce anaemia among students.
2. Methods
2.1 Setting and participants
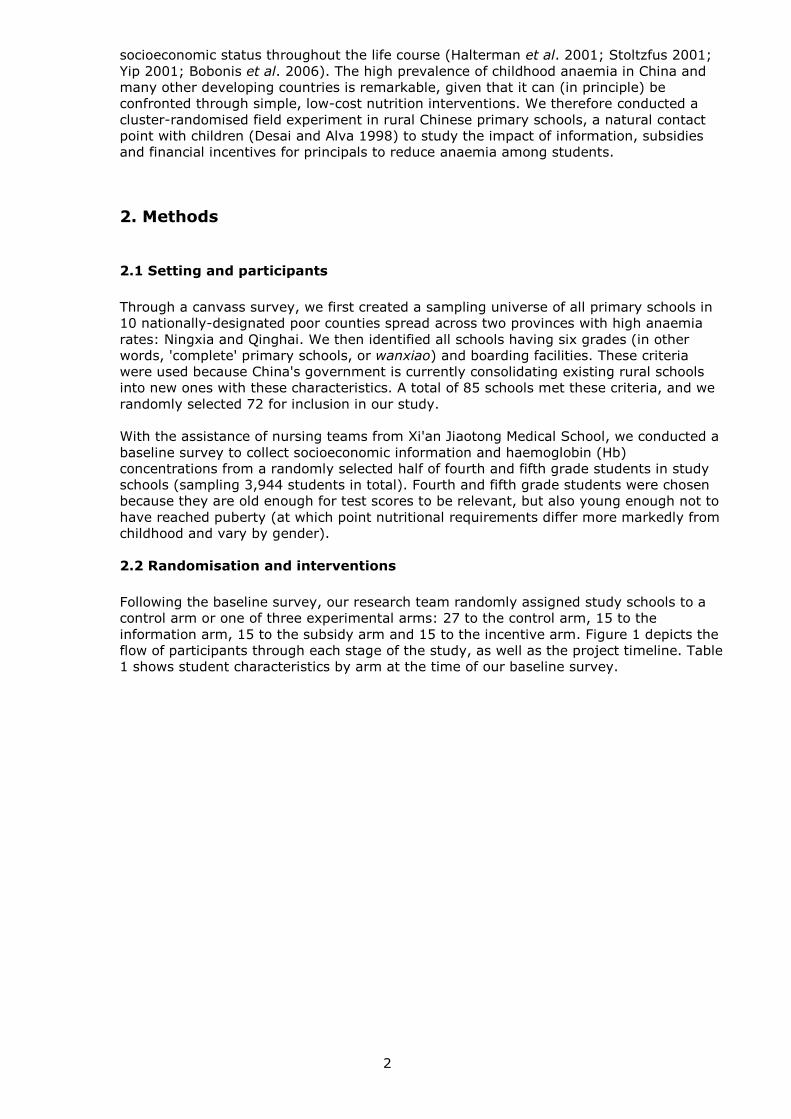
Through a canvass survey, we first created a sampling universe of all primary schools in
10 nationally-designated poor counties spread across two provinces with high anaemia
rates: Ningxia and Qinghai. We then identified all schools having six grades (in other
words, 'complete' primary schools, or wanxiao) and boarding facilities. These criteria
were used because China's government is currently consolidating existing rural schools
into new ones with these characteristics. A total of 85 schools met these criteria, and we
randomly selected 72 for inclusion in our study.
With the assistance of nursing teams from Xi'an Jiaotong Medical School, we conducted a
baseline survey to collect socioeconomic information and haemoglobin (Hb)
concentrations from a randomly selected half of fourth and fifth grade students in study
schools (sampling 3,944 students in total). Fourth and fifth grade students were chosen
because they are old enough for test scores to be relevant, but also young enough not to
have reached puberty (at which point nutritional requirements differ more markedly from
childhood and vary by gender).
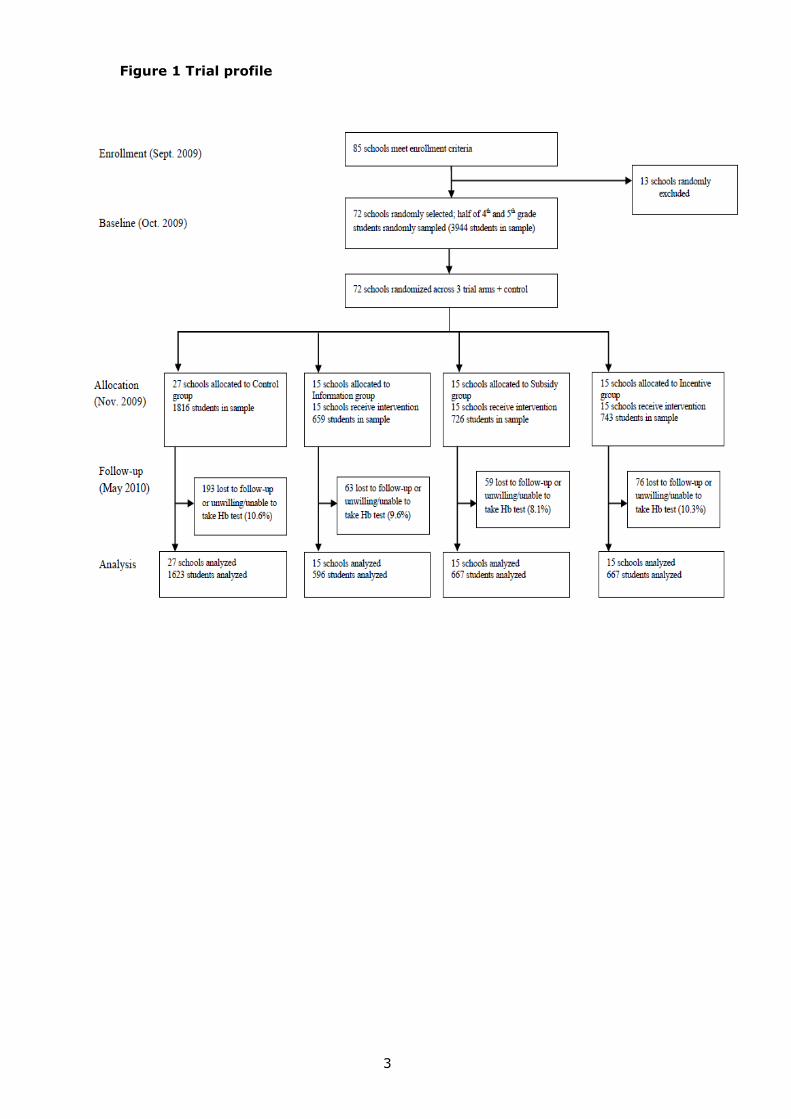
2.2 Randomisation and interventions
Following the baseline survey, our research team randomly assigned study schools to a
control arm or one of three experimental arms: 27 to the control arm, 15 to the
information arm, 15 to the subsidy arm and 15 to the incentive arm. Figure 1 depicts the
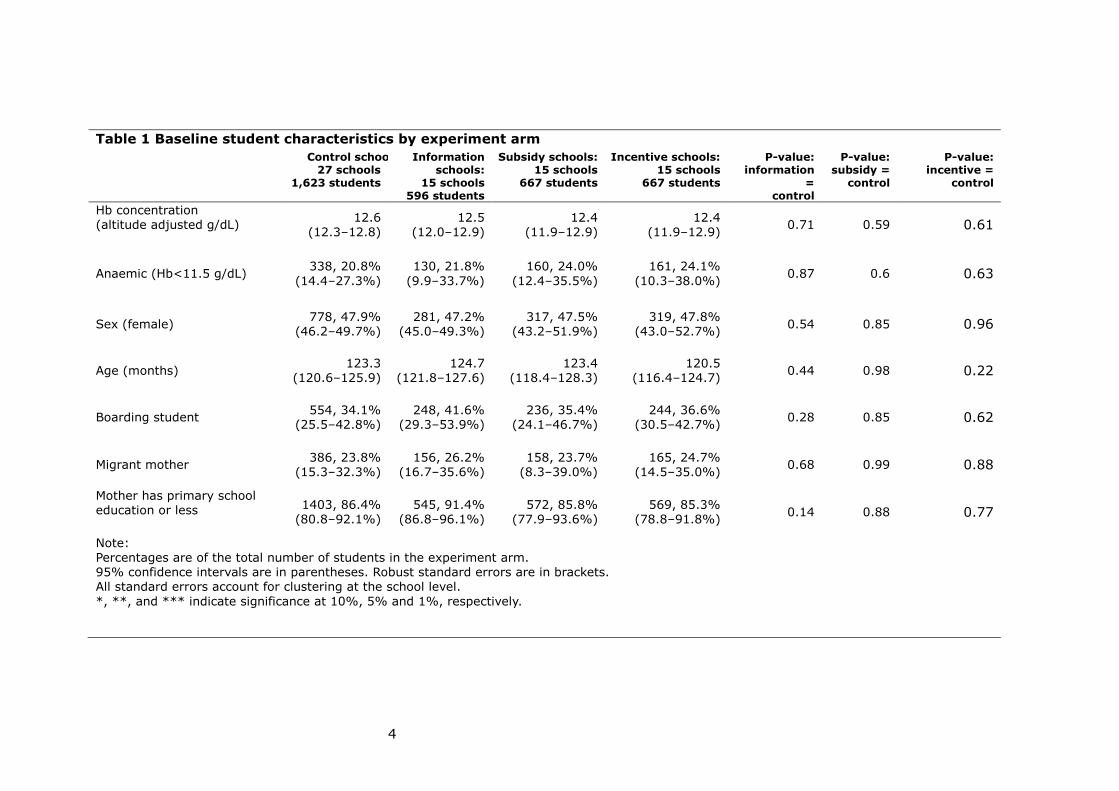
flow of participants through each stage of the study, as well as the project timeline. Table
1 shows student characteristics by arm at the time of our baseline survey.
3
Figure 1 Trial profile
4
Table 1 Baseline student characteristics by experiment arm Control schools:
27 schools 1,623 students
Information schools:
15 schools 596 students
Subsidy schools: 15 schools
667 students
Incentive schools: 15 schools
667 students
P-value: information
= control
P-value: subsidy =
control
P-value: incentive =
control
Hb concentration (altitude adjusted g/dL)
12.6
(12.3–12.8)
12.5
(12.0–12.9)
12.4
(11.9–12.9)
12.4
(11.9–12.9) 0.71 0.59 0.61
Anaemic (Hb<11.5 g/dL) 338, 20.8%
(14.4–27.3%)
130, 21.8%
(9.9–33.7%)
160, 24.0%
(12.4–35.5%)
161, 24.1%
(10.3–38.0%) 0.87 0.6 0.63
Sex (female) 778, 47.9%
(46.2–49.7%) 281, 47.2%
(45.0–49.3%) 317, 47.5%
(43.2–51.9%) 319, 47.8%
(43.0–52.7%) 0.54 0.85 0.96
Age (months) 123.3
(120.6–125.9) 124.7
(121.8–127.6) 123.4
(118.4–128.3) 120.5
(116.4–124.7) 0.44 0.98 0.22
Boarding student 554, 34.1%
(25.5–42.8%) 248, 41.6%
(29.3–53.9%) 236, 35.4%
(24.1–46.7%) 244, 36.6%
(30.5–42.7%) 0.28 0.85 0.62
Migrant mother 386, 23.8%
(15.3–32.3%) 156, 26.2%
(16.7–35.6%) 158, 23.7%
(8.3–39.0%) 165, 24.7%
(14.5–35.0%) 0.68 0.99 0.88
Mother has primary school education or less 1403, 86.4%
(80.8–92.1%) 545, 91.4%
(86.8–96.1%) 572, 85.8%
(77.9–93.6%) 569, 85.3%
(78.8–91.8%) 0.14 0.88 0.77
Note:
Percentages are of the total number of students in the experiment arm. 95% confidence intervals are in parentheses. Robust standard errors are in brackets. All standard errors account for clustering at the school level.
*, **, and *** indicate significance at 10%, 5% and 1%, respectively.

5
All students, nursing teams and enumerators were blind to which schools
belonged to which arms of the study.
Our study included a total of four arms: one control group and three intervention
groups. Schools in all four groups were located an average of 30 kilometres
apart, and because there was only one study school per township, there was no
communication among study schools through local school districts. It is therefore
unlikely that principals or study participants would have had an opportunity to
communicate about the study across study clusters. The experimental groups
are:
(0) Control. The control group did not receive any intervention. Principals were
told that they would be participating in a study on how better nutrition might
affect iron deficiency.
(1) Information ('information' arm). We provided three types of information to
principals: (a) the share of enrolled students who are anaemic; (b) descriptions of
efficacious methods for reducing iron-deficiency anaemia (including vitamin
supplementation, adding more meat at lunch and other dietary changes, as well
as the potential importance of educating parents about anaemia); and (c) details
about anaemia's relationship with school attendance, educational performance
and cognitive development, as reported in peer-reviewed academic studies
(Stoltzfus 2001; Yip 2001; Bobonis et al. 2006; Desai and Alva 1998). Principals
did not receive financial resources of any kind.
(2) Information + earmarked operating budget subsidy ('subsidy' arm). Because
purchasing inputs to reduce anaemia may be difficult given current school
operating budgets (which are small and allow for little discretion), schools in this
arm received earmarked operating budget subsidies. The subsidy schools were
given 1.5 Chinese yuan (CNY, approximately USD0.22) per student per day at the
time of research, an amount sufficient to buy two to three ounces of red meat.
These subsidies were only allowed to be used for nutrition-related expenses (we
studied reallocation of school funds as well). In addition, we provided principals
with the same information as in 'information' schools. Principals did not receive
financial incentives of any kind.
(3) Information + earmarked operating budget subsidy + anaemia reduction
incentive ('incentive' arm). To test the effectiveness of direct rewards for health
improvement, a third group of school principals received performance payments
for anaemia reductions among their student bodies. Given the governance
structure of Chinese primary schools, school principals make executive decisions
about school operations (Basu and Stephenson 2005). Incremental incentive
payments were made as salary supplements to principals on a per student basis
(CNY150, or approximately USD23, per student who changed from anaemic to
non-anaemic over the course of the intervention). This amount was chosen to
equal roughly two months of salary (CNY3,000, or about USD438) for
successfully reducing the total number of students with anaemia by 50 per cent –
a feasible reduction according to our early pilot experience. Principals in
'incentive' schools also received the same information and subsidies as those in
'subsidy' schools.
2.3 Outcomes and follow-up
Primary school surveys. We first conducted baseline surveys of principals in all
study schools. These surveys collected detailed information about (a) nutritional
characteristics of school meals (meat, soybean, fruit and vegetable composition
of school meals); (b) use of anaemia-related nutritional supplements (such as
6
iron or multivitamin/mineral supplements); and (c) school characteristics (class
size, infrastructure, school budgets and school expenditure records). Because the
effectiveness of any incentive scheme depends critically on local context, we also
collected administrative information about explicit financial incentives that local
education bureaus offer for good test scores.
Performance in response to any set of incentives must be verifiable, so we
measured Hb concentrations directly using finger prick blood samples (with
HemoCue 201+ point-of-care diagnostic technologies) drawn from a randomly
selected half of all fourth and fifth grade students in all study schools. We
randomly retested 10 per cent of all sampled students as well; if the second
measure differed from the original one by more than 0.3 g/dL among three or
more students, we retested all sample students in that school. Short surveys
were also administered to students to collect basic information about their ages,
socioeconomic characteristics and eating patterns. Specifically, students were
asked about their consumption of a variety of different foods over the past week.
During our follow-up school surveys, we also gathered additional information
from principals about strategies they pursued to reduce anaemia among
students. Total attrition from the baseline survey to the follow-up survey was 9.9
per cent, balanced across the control group and experimental arms. Although the
Hb levels of the dropouts were about 0.3 g/dL less than the students that did not
drop out, the Hb levels were the same in each arm of the experiment and the
control group.
Household surveys. We conducted baseline and follow-up household surveys for
each child in our school-based sample. Specifically, we visited each child's home
and interviewed his or her parents, collecting information about household
socioeconomic characteristics, individual health behaviours and nutritional
characteristics of household meals (consumption of meat, beans, fruits and
vegetables).
2.4 Statistical analysis
We used altitude-adjusted Hb concentration measured in grams per decilitre
(g/dL) as the primary outcome variable. Using estimates from pilot studies, we
calculated that we required 55 fourth and fifth grade students per school and 15
schools per arm to detect a standardised effect size for Hb concentration of 0.4
with 80% power at the 5% significance level. We assumed an intra-cluster
correlation of 0.25, a pre- and post-intervention correlation of 0.5, and a 10 per
cent loss to follow-up.
2.5 Baseline findings
To make sense of our baseline prevalence data, we adopted two distinct
statistical methodologies. First, we broke down the altitude-adjusted Hb levels
and anaemia rates (using age-specific anaemia cut-offs) by region. Next, we used
multivariate probit models with county dummy variables and school dummy
variables to more rigorously assess regional variability in anaemia prevalence.
In order to identify individual, household and school-based factors associated
with anaemia status at baseline, we first conducted a descriptive analysis of
anaemia rates for each potential correlate. Next, we conducted a multivariate
linear regression to identify the relationship between each potential correlate and
Hb levels.
7
To show the relationship between anaemia status and measurable outcomes at
baseline, we first compared anaemic and non-anaemic students in terms of their
physical measurements and their scores on a series of psychological and
cognitive tests. We then ran a series of multivariate regressions, using as the
dependent variable height for age z-score, a dummy variable equal to one if the
student is stunted, body mass index (BMI) z-score, score on a standardised
maths exam and score on a psychological exam, respectively, and controlling for
a number of individual and household-based characteristics.
2.6 Endline findings
We used unadjusted and adjusted ordinary least squares (OLS) regression
analysis to estimate how student Hb concentrations changed in the intervention
arms relative to the control arm. Our unadjusted analysis regresses changes in
altitude-adjusted Hb concentrations on dummy variables for 'information',
'subsidy' and 'incentive' study arms. We used adjusted analyses as well to
improve precision and to test for heterogeneous treatment effects. Specifically,
we included county dummy variables, baseline student characteristics (including
gender, age in months, baseline Hb concentration and student boarding status),
and baseline parent characteristics (including maternal education and whether or
not a child's mother is a migrant worker). In all regressions, we accounted for the
clustered nature of our sample by constructing Huber-White standard errors
corrected for school-level clustering (relaxing the assumption that disturbance
terms are independent and identically distributed within schools).
Additionally, we investigated how the impact of treatment arms varied by pre-
existing principal incentives for good test scores. Roughly 20 per cent of schools
in our sample had explicit test score incentives through the cadre evaluation
system (ganbu kaohe zhidu). These were balanced across experiment arms and
gave principals up to one month of additional salary for mean test scores ranking
in their district or county's top decile. In some adjusted regressions, we also
included a dummy variable coding whether or not principals had pre-existing
financial incentives for good average test scores (henceforth 'test score incentive
dummy') and interactions between experiment arms and the test score incentive
dummy.
Finally, we analysed behavioural responses to each intervention arm, testing for
differences (and differential changes) in (a) principals' strategies to reduce
anaemia, (b) principals' efforts to educate parents about good nutrition and
anaemia, (c) the composition of students' diets (at home and at school), and (d)
types of school expenditures.
The results of all these analyses are shown in the sections on Baseline results and
Endline results (sections 3 and 4).
2.7 Theory of change
In addition to our statistical analyses of primary project outcomes, we paid
particular attention to identifying why each of the interventions succeeded or
failed. We have mapped out the theories of change for the three different
interventions:
Target participants principals nutritional training (Do they receive the
information? Do they understand it?) change behaviour (Can they afford to
change their behaviour? Is the person receiving the information the person who
makes decisions about student consumption? Does the person receiving the
8
information have a way of reaching others who can directly affect student nutrition?) better student health
Target participants principals financial Subsidy (Do they receive the subsidy?
Is the subsidy large enough to enact meaningful changes? Is the subsidy used for
its intended purpose? Do they understand how it can best be used to improve
student nutrition? Are there other needs that they perceive as being more important than student nutrition?) better student health
Target participants principals financial incentive (Do they understand how
the incentive works? Does the future payoff of the incentive outweigh the
potential current payoff of the subsidy payment? Is the incentive large enough to
encourage behavioural change?) better student health
Our survey instruments were designed to capture any gaps in the chain (in other
words, whether the interventions were reaching the targeted population and/or
having their intended benefits). For example, our endline survey of principals
collects detailed records of how they spent their subsidy payment, as well as
information on other incentives offered to them by local officials. This will capture
any lapses in steps along the theory of change, as well as any substitution away
from the intended beneficiary of the implementation.
Our survey instruments will also measure the change in principals' knowledge
between the baseline and endline surveys as a way of observing whether they
understood the information that was presented to them.
We also took care to sharpen our survey and implementation tools before the
project began, so as to minimise any leakages along the causal chain. For
example, we conducted extensive pretesting of the survey instruments –
especially the test of principal knowledge – to make sure that it asked the
questions in a clear straightforward way, and included both easy and difficult
questions. This would help ensure that the survey captured an accurate
distribution of understanding, rather than underestimating understanding by
asking confusing or misleading questions, or overestimating it by asking easy
questions.
3. Baseline results
3.1 Anaemia prevalence in Qinghai and Ningxia
Despite the growing wealth in China, our results indicate that anaemia is still
prevalent among sample students in Qinghai and Ningxia. Across all of the
schools surveyed, we found the average Hb level to be 125.2 grams per litre
(g/L), after adjusting for altitude. Hb levels were normally distributed with a
standard deviation of 14.5. Using age-specific anaemia cut-offs, we calculated
that 24.9 per cent of the students we surveyed were anaemic.
The overall anaemia prevalence disguises geographical variation across counties.
To gain a clearer picture of this variation, we conducted a multivariate probit
regression of county dummies on anaemia rates, using the following
specification:
(1) Yij = a0 + a1*Countydummyj + eij
9
where Yij is a dummy variable equal to one if student i in county j is anaemic;
Countydummyj represents a set of nine dummy variables that are equal to one if
student i is in county j; and eij is an error term that is correlated within counties.
Although for brevity the full results of this model are not presented here, the p-
value of the test (an F-test of the joint significance of the dummies) shows a
significant county effect (p < 0.001). Haiyuan county in Ningxia had the lowest
average anaemia rate at 8.2%; Xunhua county in Qinghai the highest at 75.4%.
Beyond the variation observed among counties, we also conducted a multivariate
regression of school dummies on anaemia rates, to determine whether school-
level variation was a significant factor. The model specification was identical to
that used in equation (1), but substituting a set of 75 school dummy variables for
the county dummies. The p-value of the test shows a significant school effect (p
< 0.001), indicating significant variation across schools. The anaemia rate ranged
from 5.9% to 100%.
3.2 Individual-, household- and school-based correlates of anaemia
In considering which factors may be correlated with anaemia status, we identified
three general categories: individual-based factors (such as age and gender);
household-based factors (such as parental education and occupation); and
school-based factors (such as whether a student boards or eats at school). In this
section, we first consider each factor separately. In the second part of the
section, we conduct a multivariate analysis to determine which factors are
significantly associated with anaemia status.
In the first category, males and females did not appear to differ in their anaemia
rate – as shown in Table 2. Pre-pubescent children are unlikely to show the large
gender differences common during adolescence and adulthood, when females are
more likely to be iron deficient due to blood loss during menstruation. Younger
children seem to have lower rates of anaemia, and these rates appear to increase
as children age (Table 2).
Household characteristics we identified as being potentially correlated with
anaemia include parental education and parental employment. In terms of
employment, rural parents may work full-time on the farm ('full-time farmer'),
part-time on the farm and part-time in an off-farm job ('part-time farmer'), or
full-time off the farm ('off-farm worker'). China's large migrant labour force also
means that some rural parents may be working in a different town, county or
province; we attempt to assess parental migrant status by asking whether the
parent lives at home for most of the year, or away from home for most of the
year.
Some household characteristics also appear to be correlated with anaemia (Table
2). For example, higher levels of parental education seem to be associated with
lower anaemia rates. A number of demographic studies support this result (Desai
and Alva 1998); however, the causal relationship has yet to be defined (Desai
and Alva 1998; Basu and Stephenson 2005; Hobcraft 1993).
Parental employment – especially that of the father – also appears to be
correlated with anaemia rates among children (Table 2). Children whose fathers
were involved in off-farm labour had lower anaemia rates than those whose
fathers were full-time farmers. While the causality of this relationship and the
mechanisms behind it cannot be determined from this analysis, one possible
explanation is that parental employment is acting as a proxy for socioeconomic
status, which is known to be inversely associated with anaemia and general
10
nutritional status of children (Yip et al. 1987; World Bank 2007). In China,
farming income is lower than off-farm income (de Janvry et al. 2005), so full-time
farmers are likely to have lower household incomes than part-time farmers or off-
farm workers.
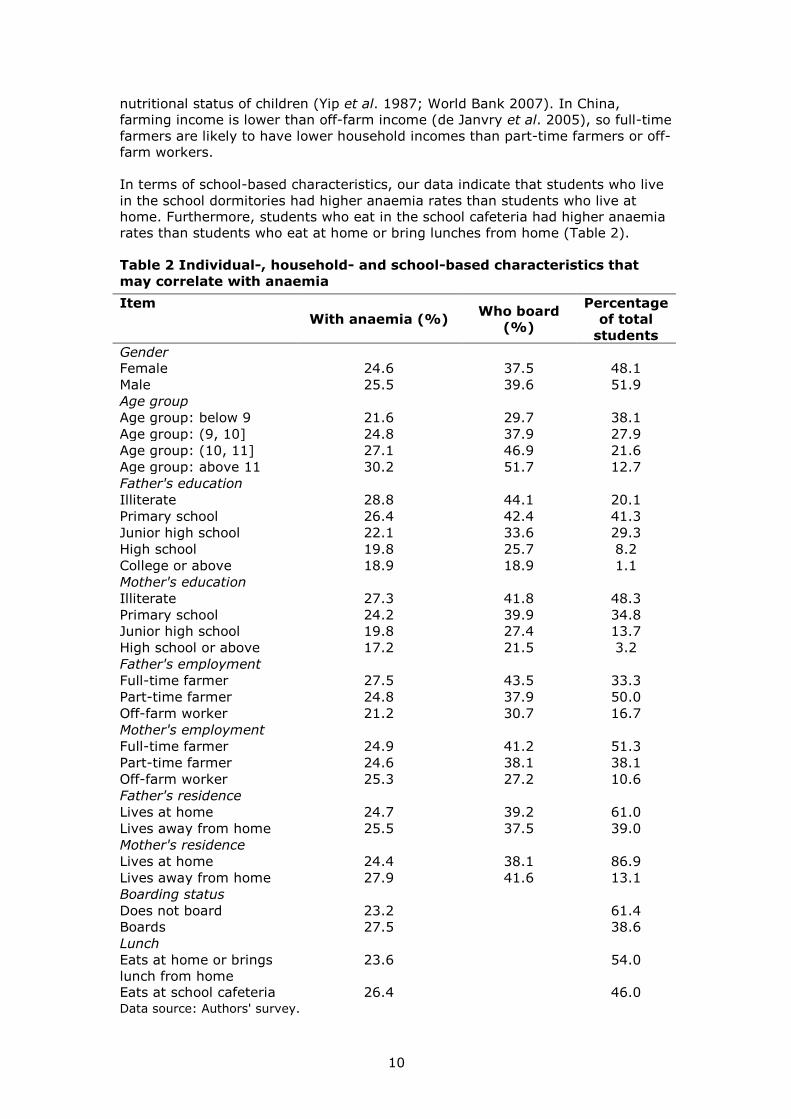
In terms of school-based characteristics, our data indicate that students who live
in the school dormitories had higher anaemia rates than students who live at
home. Furthermore, students who eat in the school cafeteria had higher anaemia
rates than students who eat at home or bring lunches from home (Table 2).
Table 2 Individual-, household- and school-based characteristics that
may correlate with anaemia
Data source: Authors' survey.
Item
With anaemia (%) Who board
(%)
Percentage
of total
students
Gender
Female 24.6 37.5 48.1
Male 25.5 39.6 51.9
Age group
Age group: below 9 21.6 29.7 38.1
Age group: (9, 10] 24.8 37.9 27.9
Age group: (10, 11] 27.1 46.9 21.6
Age group: above 11 30.2 51.7 12.7
Father's education
Illiterate 28.8 44.1 20.1
Primary school 26.4 42.4 41.3
Junior high school 22.1 33.6 29.3
High school 19.8 25.7 8.2
College or above 18.9 18.9 1.1
Mother's education
Illiterate 27.3 41.8 48.3
Primary school 24.2 39.9 34.8
Junior high school 19.8 27.4 13.7
High school or above 17.2 21.5 3.2
Father's employment
Full-time farmer 27.5 43.5 33.3
Part-time farmer 24.8 37.9 50.0
Off-farm worker 21.2 30.7 16.7
Mother's employment
Full-time farmer 24.9 41.2 51.3
Part-time farmer 24.6 38.1 38.1
Off-farm worker 25.3 27.2 10.6
Father's residence
Lives at home 24.7 39.2 61.0
Lives away from home 25.5 37.5 39.0
Mother's residence
Lives at home 24.4 38.1 86.9
Lives away from home 27.9 41.6 13.1
Boarding status
Does not board 23.2 61.4
Boards 27.5 38.6
Lunch
Eats at home or brings
lunch from home
23.6 54.0
Eats at school cafeteria 26.4 46.0
11
To more rigorously examine the relationship between anaemia status and the
individual-, household- and school-based factors described above, we conducted
a multivariate linear regression Table 3, using the following specification:
(2) Yij = a0 + a1*Boardingij + eij
where Yij is the Hb level for student i in school j and Boardingij is a dummy
variable that is equal to one if student i is boarding in school j.
As many non-boarding students still eat lunch at school, in equation (3) we
control for the heterogeneous effects of students who eat lunch at school.
The model is:
(3) Yij = a0 + a1*Boardingij + a2*Lunchij + eij
where Lunchij is a dummy variable that is equal to one if student i eats lunch at
school j. Motivated by the descriptive statistics and the differences that seem to
exist between different gender and age groups, in equation (4) we control for
individual-based characteristics:
(4) Yij = a0 + a1*Boardingij + a2*Lunchij + a3*Z_studentij + eij
where Z_studentij represents a set of controls for age and gender. In our final
model, we also control for parental characteristics:
(5) Yij = a0 + a1*Boardingij + a2*Lunchij + a3*Z_studentij +
a4*Z_parentij + eij
where Z_parentij represents a series of controls for parental education,
employment and residency.
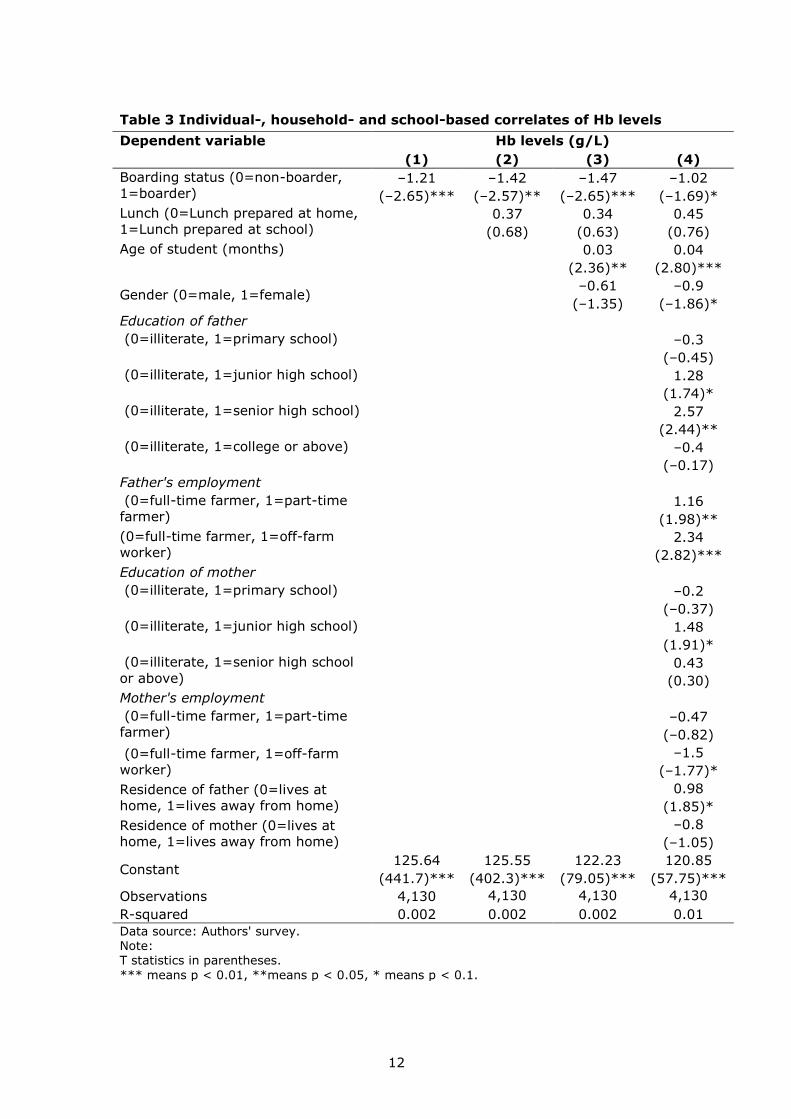
Consistent with the descriptive analysis, the results of the multivariate analyses
show a significant correlation between students' boarding status and Hb levels in
Table 3. A number of other results from our descriptive analysis were also
confirmed, including a significant positive correlation between age and Hb levels.
The data also show that children of fathers with a junior or senior high school
education have significantly higher Hb levels than other children. Moreover,
paternal employment also matters: children of fathers who worked either part-
time or full-time off the farm had significantly higher Hb levels than children of
fathers who were full-time farmers.
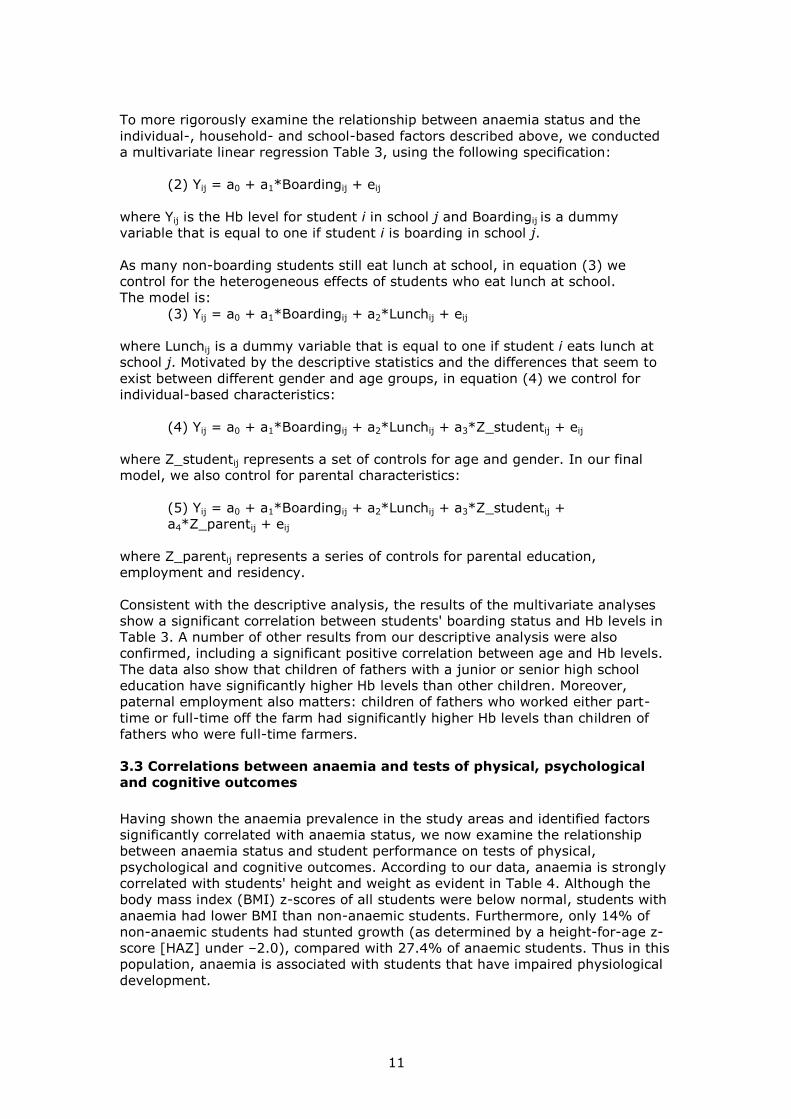
3.3 Correlations between anaemia and tests of physical, psychological
and cognitive outcomes
Having shown the anaemia prevalence in the study areas and identified factors
significantly correlated with anaemia status, we now examine the relationship
between anaemia status and student performance on tests of physical,
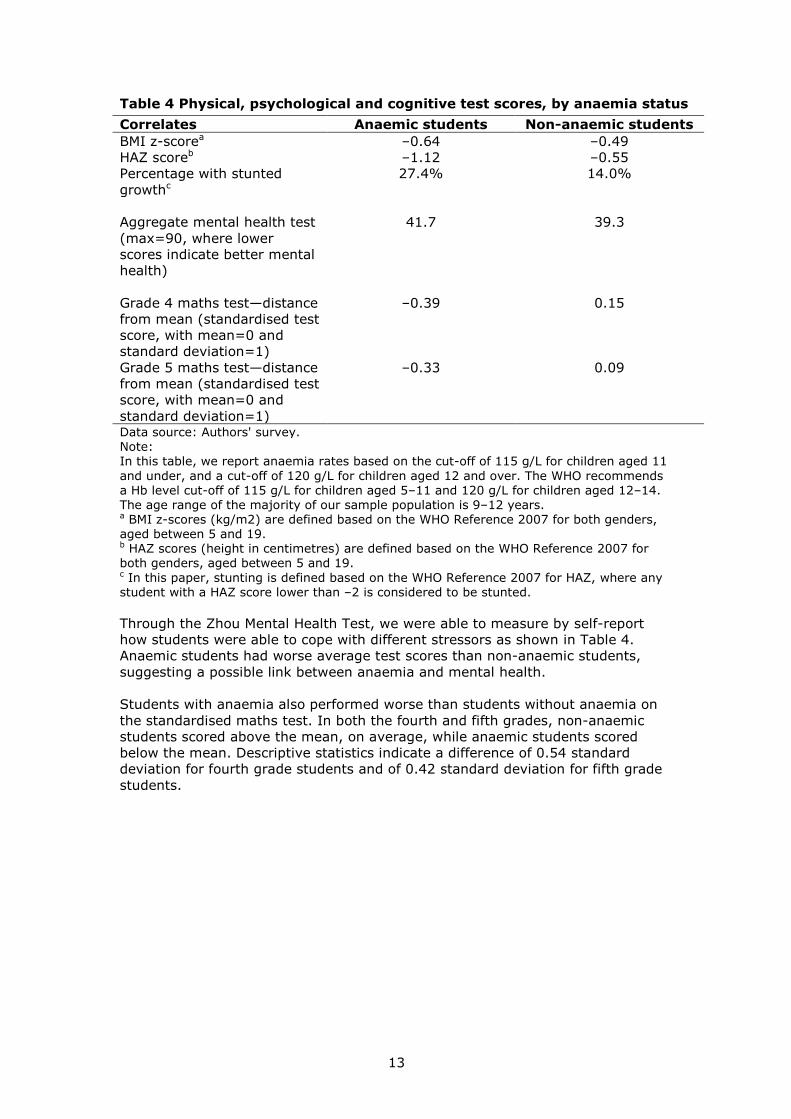
psychological and cognitive outcomes. According to our data, anaemia is strongly
correlated with students' height and weight as evident in Table 4. Although the
body mass index (BMI) z-scores of all students were below normal, students with
anaemia had lower BMI than non-anaemic students. Furthermore, only 14% of
non-anaemic students had stunted growth (as determined by a height-for-age z-
score [HAZ] under –2.0), compared with 27.4% of anaemic students. Thus in this
population, anaemia is associated with students that have impaired physiological
development.
12
Table 3 Individual-, household- and school-based correlates of Hb levels
Dependent variable Hb levels (g/L)
(1) (2) (3) (4)
Boarding status (0=non-boarder,
1=boarder) –1.21 –1.42 –1.47 –1.02
(–2.65)*** (–2.57)** (–2.65)*** (–1.69)*
Lunch (0=Lunch prepared at home,
1=Lunch prepared at school) 0.37 0.34 0.45
(0.68) (0.63) (0.76)
Age of student (months) 0.03 0.04
(2.36)** (2.80)***
Gender (0=male, 1=female) –0.61 –0.9
(–1.35) (–1.86)*
Education of father
(0=illiterate, 1=primary school) –0.3
(–0.45)
(0=illiterate, 1=junior high school) 1.28
(1.74)*
(0=illiterate, 1=senior high school) 2.57
(2.44)**
(0=illiterate, 1=college or above) –0.4
(–0.17)
Father's employment
(0=full-time farmer, 1=part-time
farmer) 1.16
(1.98)**
(0=full-time farmer, 1=off-farm
worker) 2.34
(2.82)***
Education of mother
(0=illiterate, 1=primary school) –0.2
(–0.37)
(0=illiterate, 1=junior high school) 1.48
(1.91)*
(0=illiterate, 1=senior high school
or above) 0.43
(0.30)
Mother's employment
(0=full-time farmer, 1=part-time
farmer) –0.47
(–0.82)
(0=full-time farmer, 1=off-farm
worker)
–1.5
(–1.77)*
Residence of father (0=lives at
home, 1=lives away from home)
0.98
(1.85)*
Residence of mother (0=lives at
home, 1=lives away from home)
–0.8
(–1.05)
Constant 125.64 125.55 122.23 120.85
(441.7)*** (402.3)*** (79.05)*** (57.75)***
Observations 4,130 4,130 4,130 4,130
R-squared 0.002 0.002 0.002 0.01
Data source: Authors' survey. Note: T statistics in parentheses.
*** means p < 0.01, **means p < 0.05, * means p < 0.1.
13
Table 4 Physical, psychological and cognitive test scores, by anaemia status
Correlates Anaemic students Non-anaemic students
BMI z-scorea –0.64 –0.49
HAZ scoreb –1.12 –0.55
Percentage with stunted
growthc 27.4% 14.0%
Aggregate mental health test
(max=90, where lower
scores indicate better mental
health)
41.7 39.3
Grade 4 maths test—distance
from mean (standardised test
score, with mean=0 and
standard deviation=1)
–0.39 0.15
Grade 5 maths test—distance
from mean (standardised test
score, with mean=0 and
standard deviation=1)
–0.33 0.09
Data source: Authors' survey. Note: In this table, we report anaemia rates based on the cut-off of 115 g/L for children aged 11
and under, and a cut-off of 120 g/L for children aged 12 and over. The WHO recommends a Hb level cut-off of 115 g/L for children aged 5–11 and 120 g/L for children aged 12–14. The age range of the majority of our sample population is 9–12 years. a BMI z-scores (kg/m2) are defined based on the WHO Reference 2007 for both genders, aged between 5 and 19. b HAZ scores (height in centimetres) are defined based on the WHO Reference 2007 for both genders, aged between 5 and 19. c In this paper, stunting is defined based on the WHO Reference 2007 for HAZ, where any student with a HAZ score lower than –2 is considered to be stunted.
Through the Zhou Mental Health Test, we were able to measure by self-report
how students were able to cope with different stressors as shown in Table 4.
Anaemic students had worse average test scores than non-anaemic students,
suggesting a possible link between anaemia and mental health.
Students with anaemia also performed worse than students without anaemia on
the standardised maths test. In both the fourth and fifth grades, non-anaemic
students scored above the mean, on average, while anaemic students scored
below the mean. Descriptive statistics indicate a difference of 0.54 standard
deviation for fourth grade students and of 0.42 standard deviation for fifth grade
students.
14
Data source: Authors’ survey. T statistics in parentheses. *** means p < 0.01, ** means p < 0.05, * means p < 0.1. SD: standard deviation.
Note: In this table, we calculate anaemia rates based on the cut-off of 115 g/L for children aged 11 and under, and 120 g/L for children aged 12 and over. WHO recommends a Hb level cut-off of 115 g/L for children aged 5–11 and 120 g/L for children aged 12–14. The age range of the majority of our sample population is 9–12.
Table 5 Correlations between anaemia and physical, psychological and cognitive outcomes
Dependent variable
Standardised maths test score (mean=0,
sd=1)
Psycholog-ical test score (max=90)
Height for age z-Score
Student is stunted (0=no, 1=yes)
BMI z-score
Anaemia status (0=not anaemic, 1=anaemic)
–0.39 1.75 –0.40 0.11 –0.09
(–10.54)*** (3.52)*** (–8.52)*** (7.81)*** (–2.43)**
Boarding status (0=non-boarder, 1=boarder)
–0.14 1.38 0.055 0.0034 0.14
(–3.50)*** (2.62)*** (1.11) (0.23) (3.40)***
School lunch (0=eats lunch prepared at home, 1= school lunch)
0.01 –0.37 0.02 –0.01 0.07
(0.19) (–0.71) (0.51) (–0.52) (1.89)*
Age of student (months) –0.002 0.01 –0.05 0.01 –0.02
(–2.33)** –1.06 (–46.1)*** (23.4)*** (–17.3)***
Gender (0=male, 1=female) –0.07 1.54 0.03 –0.002 –0.06
(–2.20)** (3.63)*** (0.83) (–0.21) (–1.81)*
Education of father (0=Illiterate, 1=Primary school)
–0.05 0.16 –0.07 0.03 –0.05
(–1.03) (0.27) (–1.33) (2.04)** (–1.05)
Education of father (0=Illiterate, 1=Junior high school)
0.09 –0.52 –0.19 0.02 –0.13
(1.94)* (–0.80) (–3.19)*** (1.34) (–2.56)**
Education of father (0=Illiterate, 1=Senior high school)
0.23 –0.32 –0.18 0.004 –0.03
(3.32)*** (–0.35) (–2.05)** (0.15) (–0.48)
Education of father (0=Illiterate, 1=College or above)
–0.16 2.19 –0.38 0.02 –0.06
(–1.01) (1.06) (–1.98)** (0.29) (–0.35)
Father's employment (0=Full-time farmer, 1=Part-time farmer)
0.11 –0.15 –0.02 –0.01 0.01
(2.74)*** (–0.29) (–0.46) (–0.54) (0.16)
Father's employment (0=Full-time farmer, 1=Off-farm worker)
0.08 0.24 0.19 –0.05 0.1
(1.43) (0.32) (2.81)*** (–2.49)** (1.80)*
Education of mother (0=Illiterate, 1=Primary school)
0.08 –0.79 –0.002 0.01 0.06
(2.18)** (–1.64) (–0.04) (–0.48) (1.53)
Education of mother (0=Illiterate, 1=Junior high school)
0.26 –2.41 –0.02 –0.02 0.07
(5.15)*** (–3.55)*** (–0.27) (–1.01) (1.33)
Education of mother (0=Illiterate, 1=Senior high school or above)
0.2 –2.98 0.02 –0.02 0.17
(2.10)** (–2.36)** (0.13) (–0.50) (1.73)*
Mother's employment (0=Full-time
farmer, 1=Part-time farmer) –0.06 –0.03 0.09 –0.003 0.01
(–1.61) (–0.06) (1.93)* (–0.19) (0.20)
Mother's employment (0=Full-time farmer, 1=Off–farm worker)
–0.07 0.54 –0.07 0.03 –0.05
(–1.19) (0.73) (–1.05) (1.67)* (–0.95)
Residence of father (0=Lives at home, 1=Lives away from home)
0.19 –0.73 0.07 –0.01 –0.01
(5.50)*** (–1.57) (1.58) (–0.76) (–0.40)
Residence of mother (0=Lives at home, 1=Lives away from home)
–0.07 0.6 –0.03 0.02 –0.09
(–1.41) (0.89) (–0.44) (1.10) (–1.70)*
Constant 0.31 38.52 5.65 –0.82 1.48
(2.19)** (19.96)*** (31.15)*** (–15.20)*** (9.85)***
Observations 4130 4130 4130 4130 4130
R-squared 0.08 0.02 0.41 0.17 0.09
15
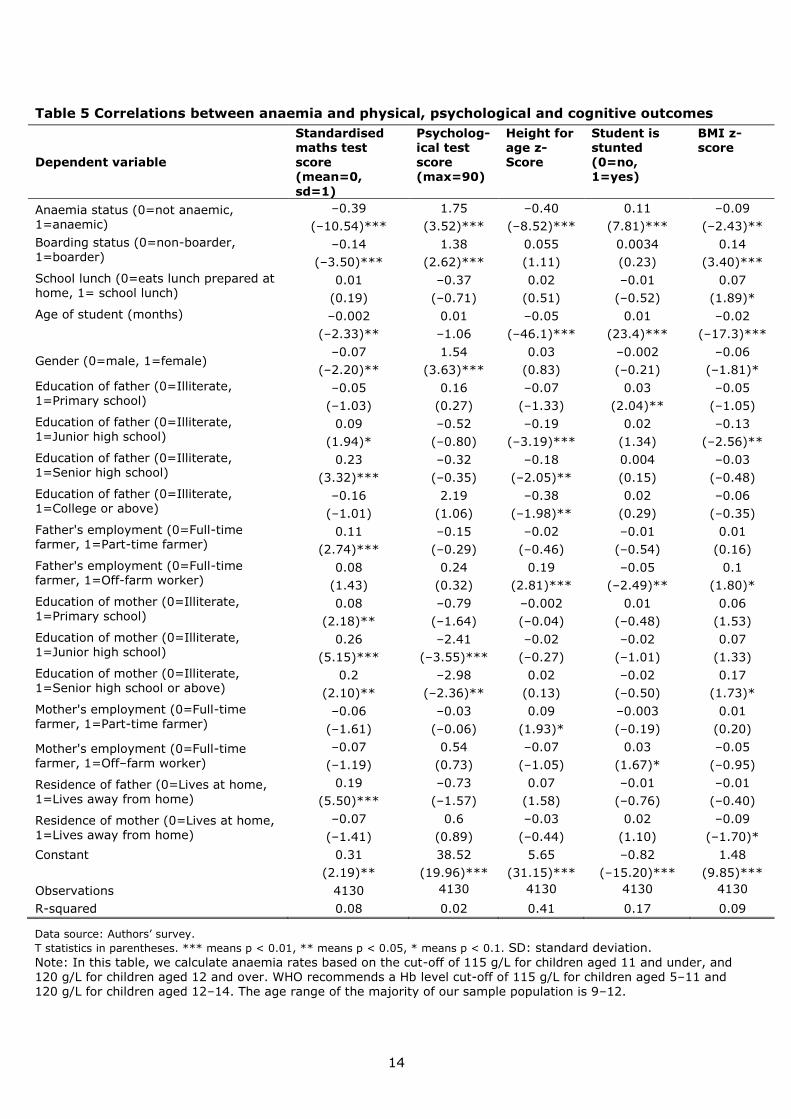
However, as shown in the previous section, there are many correlates of
anaemia, and thus multiple regression is required to assess the causal effect of
anaemia on academic and cognitive performance. To examine the correlation
between anaemia status and these performance measures we conducted a set of
multivariate regressions as shown in Table 5), based on the following model:
(6) Yij = a0 + a1*Anaemiaij + a2 *Boardingij + a3*Lunchij + a4*Z_studentij +
a5*Z_parentij + eij
where Yij can be the standardised math test score, the psychological health test
score or physical outcome measures (HAZ score, stunting status and BMI index);
Anaemiaij is a dummy variable equal to one if the child is anaemic according to
age-specific and altitude-adjusted Hb levels; Boardingij is a dummy variable equal
to one if the student boards at school; Lunchij is a dummy variable equal to one if
the student eats lunch at school; Z_studentij represents a set of controls for age
and gender; and Z_parentij represents a series of controls for parental education,
employment and residency.
We found that anaemia was significantly correlated with reduced scores on all
measures of physical, psychological and cognitive performance. This finding
supports the work of another study of more than 40,000 school-aged children in
Gansu Province, which found academic achievement (measured by normalised
test scores in Chinese, maths and science) to be negatively affected by iron
deficiency (20). Our findings are consistent with a hypothesis that the rash of
anaemia in rural Qinghai and Ningxia schools may (in part) underlie the reduced
academic achievement of students from rural areas.
4. Endline results
4.1 Changes in haemoglobin concentrations and complementarity with
test score incentives
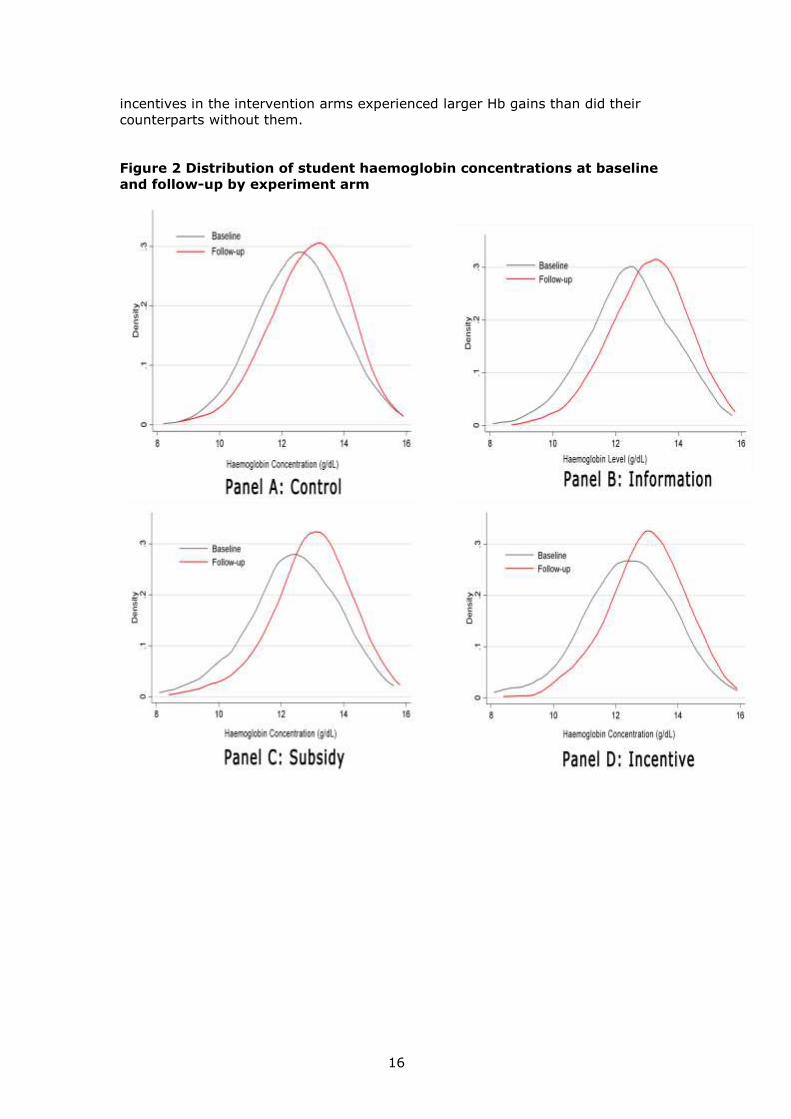
Figure 2 shows the distribution of student Hb concentration (g/dL) both at
baseline and follow-up in each study arm (in separate panels). Each distribution,
including the control group, shifted right over time between the baseline and
follow-up survey. Larger shifts occurred in intervention schools relative to control
schools. The small increase in Hb in the control group presumably reflects a well-
documented seasonal effect (Luo et al. 2010).
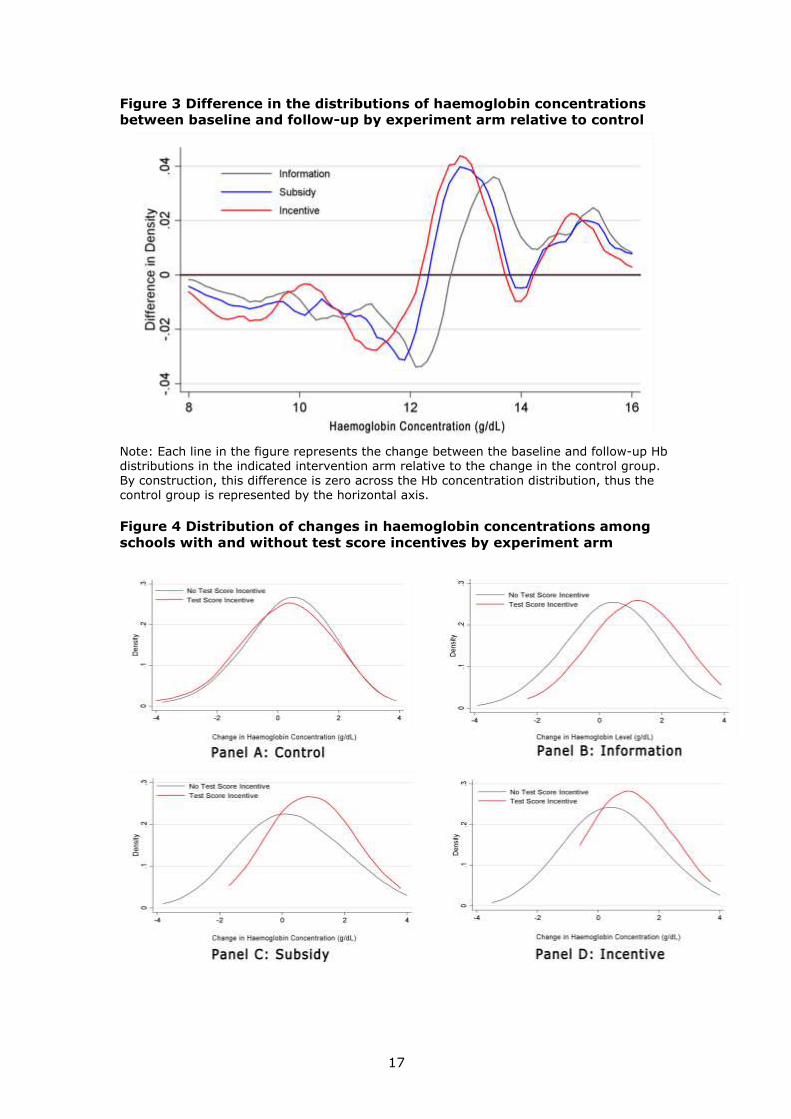
To make the relative magnitude of these shifts more apparent, Figure 3 graphs
the difference (vertical distance) between follow-up and baseline distributions
relative to the control group by intervention arm. In general, the effect of the
interventions was to shift the mass in the distribution of Hb concentration from
below 12 g/dL to higher ranges (relative to the control arm).
Figure 4 considers how changes within each arm vary according to pre-existing
principal incentives (bonus pay) for good average test scores. Specifically, Figure
4 presents separate panels for each arm, showing changes from baseline to
follow-up between schools with and without test score incentives. The variance of
these distributions suggests the presence of some random measurement error as
commonly reported by others (Alderman et al. 2001; Babu and Hallam 1989), but
this idiosyncratic variation is uncorrelated with experiment arm or other
covariates. Although there is little differential change between schools with and
without test score incentives in the control group, schools with test score
16
incentives in the intervention arms experienced larger Hb gains than did their
counterparts without them.
Figure 2 Distribution of student haemoglobin concentrations at baseline
and follow-up by experiment arm
17
Figure 3 Difference in the distributions of haemoglobin concentrations
between baseline and follow-up by experiment arm relative to control
Note: Each line in the figure represents the change between the baseline and follow-up Hb distributions in the indicated intervention arm relative to the change in the control group. By construction, this difference is zero across the Hb concentration distribution, thus the control group is represented by the horizontal axis.
Figure 4 Distribution of changes in haemoglobin concentrations among
schools with and without test score incentives by experiment arm
18
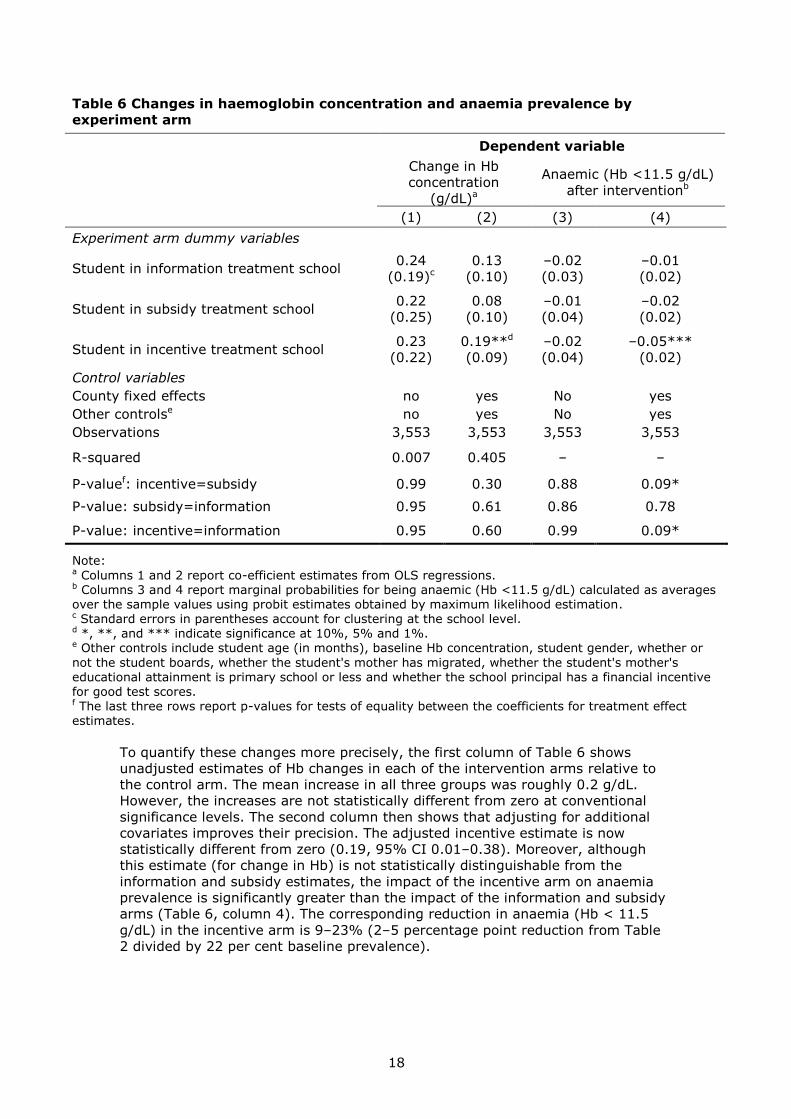
Table 6 Changes in haemoglobin concentration and anaemia prevalence by
experiment arm
Dependent variable
Change in Hb
concentration
(g/dL)a
Anaemic (Hb <11.5 g/dL)
after interventionb
(1) (2) (3) (4)
Experiment arm dummy variables
Student in information treatment school 0.24 0.13 –0.02 –0.01
(0.19)c (0.10) (0.03) (0.02)
Student in subsidy treatment school 0.22 0.08 –0.01 –0.02
(0.25) (0.10) (0.04) (0.02)
Student in incentive treatment school 0.23 0.19**d –0.02 –0.05***
(0.22) (0.09) (0.04) (0.02)
Control variables
County fixed effects no yes No yes
Other controlse no yes No yes
Observations 3,553 3,553 3,553 3,553
R-squared 0.007 0.405 – –
P-valuef: incentive=subsidy 0.99 0.30 0.88 0.09*
P-value: subsidy=information 0.95 0.61 0.86 0.78
P-value: incentive=information 0.95 0.60 0.99 0.09*
Note: a Columns 1 and 2 report co-efficient estimates from OLS regressions. b Columns 3 and 4 report marginal probabilities for being anaemic (Hb <11.5 g/dL) calculated as averages over the sample values using probit estimates obtained by maximum likelihood estimation. c Standard errors in parentheses account for clustering at the school level. d *, **, and *** indicate significance at 10%, 5% and 1%. e Other controls include student age (in months), baseline Hb concentration, student gender, whether or
not the student boards, whether the student's mother has migrated, whether the student's mother's educational attainment is primary school or less and whether the school principal has a financial incentive for good test scores. f The last three rows report p-values for tests of equality between the coefficients for treatment effect
estimates.
To quantify these changes more precisely, the first column of Table 6 shows
unadjusted estimates of Hb changes in each of the intervention arms relative to
the control arm. The mean increase in all three groups was roughly 0.2 g/dL.
However, the increases are not statistically different from zero at conventional
significance levels. The second column then shows that adjusting for additional
covariates improves their precision. The adjusted incentive estimate is now
statistically different from zero (0.19, 95% CI 0.01–0.38). Moreover, although
this estimate (for change in Hb) is not statistically distinguishable from the
information and subsidy estimates, the impact of the incentive arm on anaemia
prevalence is significantly greater than the impact of the information and subsidy
arms (Table 6, column 4). The corresponding reduction in anaemia (Hb < 11.5
g/dL) in the incentive arm is 9–23% (2–5 percentage point reduction from Table
2 divided by 22 per cent baseline prevalence).
19
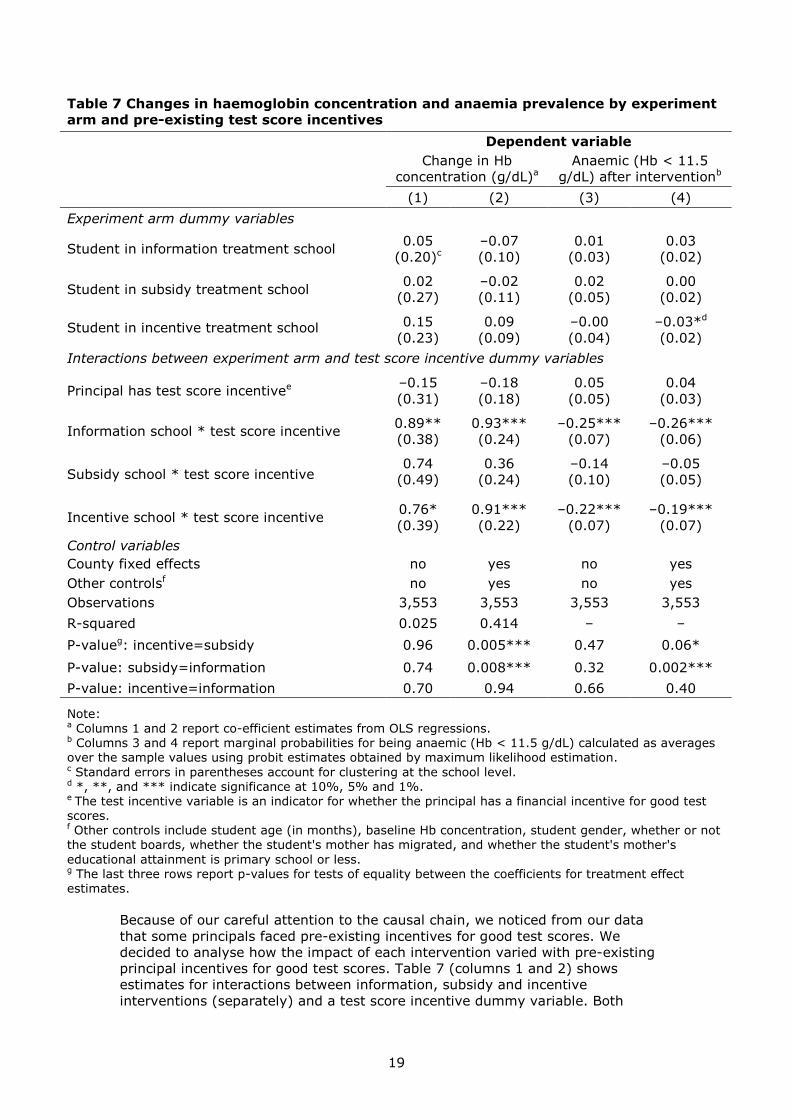
Table 7 Changes in haemoglobin concentration and anaemia prevalence by experiment
arm and pre-existing test score incentives
Dependent variable
Change in Hb
concentration (g/dL)a Anaemic (Hb < 11.5
g/dL) after interventionb
(1) (2) (3) (4)
Experiment arm dummy variables
Student in information treatment school 0.05 –0.07 0.01 0.03
(0.20)c (0.10) (0.03) (0.02)
Student in subsidy treatment school 0.02 –0.02 0.02 0.00
(0.27) (0.11) (0.05) (0.02)
Student in incentive treatment school 0.15 0.09 –0.00 –0.03*d
(0.23) (0.09) (0.04) (0.02)
Interactions between experiment arm and test score incentive dummy variables
Principal has test score incentivee –0.15 –0.18 0.05 0.04
(0.31) (0.18) (0.05) (0.03)
Information school * test score incentive 0.89** 0.93*** –0.25*** –0.26***
(0.38) (0.24) (0.07) (0.06)
Subsidy school * test score incentive 0.74 0.36 –0.14 –0.05
(0.49) (0.24) (0.10) (0.05)
Incentive school * test score incentive 0.76* 0.91*** –0.22*** –0.19***
(0.39) (0.22) (0.07) (0.07)
Control variables
County fixed effects no yes no yes
Other controlsf no yes no yes
Observations 3,553 3,553 3,553 3,553
R-squared 0.025 0.414 – –
P-valueg: incentive=subsidy 0.96 0.005*** 0.47 0.06*
P-value: subsidy=information 0.74 0.008*** 0.32 0.002***
P-value: incentive=information 0.70 0.94 0.66 0.40
Note: a Columns 1 and 2 report co-efficient estimates from OLS regressions. b Columns 3 and 4 report marginal probabilities for being anaemic (Hb < 11.5 g/dL) calculated as averages over the sample values using probit estimates obtained by maximum likelihood estimation. c Standard errors in parentheses account for clustering at the school level. d *, **, and *** indicate significance at 10%, 5% and 1%. e The test incentive variable is an indicator for whether the principal has a financial incentive for good test scores. f Other controls include student age (in months), baseline Hb concentration, student gender, whether or not the student boards, whether the student's mother has migrated, and whether the student's mother's
educational attainment is primary school or less. g The last three rows report p-values for tests of equality between the coefficients for treatment effect estimates.
Because of our careful attention to the causal chain, we noticed from our data
that some principals faced pre-existing incentives for good test scores. We
decided to analyse how the impact of each intervention varied with pre-existing
principal incentives for good test scores. Table 7 (columns 1 and 2) shows
estimates for interactions between information, subsidy and incentive
interventions (separately) and a test score incentive dummy variable. Both
20
columns suggest that all three interventions were complementary with incentives
for good test scores, though this synergy is less pronounced in the subsidy arm.
Relative to the control group, test score incentives were associated with mean Hb
gains of 0.89–0.93 g/dL in information schools Table 7 (columns 3 and 4) also
reports analogous marginal probabilities for being anaemic obtained by maximum
likelihood estimation using probit models. Relative to baseline anaemia
prevalence rates, these estimates imply an 85–86% reduction in information
schools, a 5–32% reduction in subsidy schools, and a 77–81% reduction in
incentive schools with pre-existing principal test score incentives.
4.2 Behavioural responses to interventions
In order to capture any lapses in the causal chain, we next present analyses of
how principals and parents responded to the study's interventions – both to
reduce anaemia and in potentially unintended ways.
4.3 Principals' strategies to reduce anaemia
Three stylised facts characterise principals' major strategies to reduce anaemia in
response to study interventions (Loevinsohn and Harding 2005). Relative to
subsidy schools, incentive school principals were more likely to use their subsidies
to pursue iron supplementation strategies that increased only students' multi-
micronutrient intake and not their caloric intake (for example, with
vitamins/minerals and iron-fortified wheat) – and less likely to pursue broad
feeding strategies that increased both multi-micronutrient intake and caloric
intake (for example, with meat and other food added to school lunches) – to
reduce anaemia. This response is in line with their more focused incentive to raise
iron levels (as opposed to overall nutritional status) (Doran et al. 2006).
Consistent with research linking broader nutritional gains to school performance
(Alderman et al. 2001), principals with test score incentives focused relatively
more on feeding (Soeters et al. 2006). Relative to control schools, principals in all
intervention schools provided nutritional information to parents to reduce
anaemia. However, information arm principals with test score incentives appear
to have done so most vigorously. This is presumably because these principals
understood the link between anaemia and school performance (an explicit part of
the information they received) and also had incentives to improve test scores;
however, they lacked the resources to intervene in ways other than through
parents. Because the parents of boarding students are responsible for sending
food to school for their children, they can directly influence dietary quality, as can
parents of students who do not board.
4.4 Unintended behavioural responses by parents and principals
We also investigated the possibility of unintended (perverse) behavioural
responses to the study's interventions. First, we examined if there were offsetting
reductions in dietary quality at home in response to improvements in school
meals (Babu and Hallam 1989; Jacoby 2002). Second, we estimated if school
spending on functions other than nutrition (on administration or teaching, for
example) was diverted to reduce anaemia. We found little evidence of either type
of behavioural response.
21
5. Policy recommendations
On balance, our findings suggest that incentives were moderately effective in
reducing anaemia rates among school children in rural China. Importantly, we
also find that analyses failing to recognise their interactions with other incentives
may miss important population health gains attributable to them. Primary school
principals with incentives for good test scores made more effective use of
subsidies to reduce anaemia – and performance pay for anaemia reduction nearly
doubled their impact. Moreover, although the provision of information about
anaemia to school principals was ineffective on its own, it was as effective as the
entire bundle of information, subsidies and anaemia reduction incentives when
combined with test score incentives. Information arm principals with test score
incentives had strong incentives to reduce anaemia, but because they lacked
resources to do so through schools, they pursued innovative strategies to educate
parents in ways that ultimately proved highly effective. Considerably more
research is needed, but our findings broadly suggest that policymakers may be
able to exploit synergies between financial incentives and other motives/pre-
existing incentives (often embedded in local institutions and cultural context) to
produce substantial population health gains.
Further research is needed to understand several important dimensions of
performance pay for health improvement. These include: (1) understanding how
to structure performance pay in multi-tasking environments – in particular for
providers with broader clinical responsibility (Holmstrom and Milgrom 1991); (2)
identifying optimal combinations of fixed (unconditional) and variable
(performance-based) compensation (research on executive compensation
suggests that smaller unconditional components may be appropriate but this
varies with the degree to which agents can influence the rewarded outcome)
(Jensen and Murphy 1990; Hall and Liebman 1998; Raith 2008); (3) examining
the relative merits of performance pay at different staff levels within
organisations; and (4) documenting the comparative effectiveness and cost-
effectiveness of financial and non-financial incentives (given that financial
incentives can be costly).
Overall, our paper suggests that performance incentives – and direct rewards for
health improvement in particular – may hold promise for promoting a broad class
of puzzlingly underutilised health technologies more effectively. However, it offers
a cautionary tale against introducing incentives naively without understanding the
local institutions within which they are applied. Failing to do so may seriously
hamper their effectiveness, while harmonising them with other motives and
incentives can amplify their impact.
22
References
Alderman, H., Behrman, J., Lavy, V. and Menon, R., 2001. Child health and
school enrollment: A longitudinal analysis. Journal of Human Resources 36(1),
pp.185–205.
Babu, S. and Hallam, A., 1989. Socioeconomic impacts of school feeding
programmes: Empirical evidence from a south Indian village. Food Policy 14(1),
pp.58–66.
Basinga, P., Gertler, P.J., Binagwaho, A., Soucat, A.L.B., Sturdy, J. and
Vermeersch, C.M.J., 2011. Effect on maternal and child health services in Rwanda
of payment to primary health-care providers for performance: an impact
evaluation. Lancet 377(9775), pp.1421–28.
Basu, A.M. and Stephenson, R., 2005. Low levels of maternal education and the
proximate determinants of childhood mortality: A little learning is not a
dangerous thing. Social Science and Medicine 60(9), pp.2,011–2,023.
Bloom, E., King, E., Bhushan, I., Kremer, M., Glingingsmith, D., Loevinsohn, B. et
al., 2006. Contracting for health: Evidence from Cambodia. Brookings Institution.
Bobonis, G.J., Miguel, E. and Puri-Sharma, C., 2006. Anemia and school
participation. Journal of Human Resources 41(4), pp.692–721.
Chen, J., Zhao, X., Zhang, X., Yin, S., Piao, J., Huo, J., Yu, B., Qu, N., Lu, Q.,
Wang, S. and Chen, C., 2005. Studies on the effectiveness of NaFeEDTA-fortified
soy sauce in controlling iron deficiency: A population-based intervention trial.
Food and Nutrition Bulletin 26(2), pp.177–208.
de Janvry, A., Sadoulet, E. and Zhu, N., 2005. The role of non-farm incomes in
reducing rural poverty and inequality in China. Department of Agricultural and
Resource Economics, UC Berkeley working paper series 1001.
Desai, S. and Alva, S., 1998. Maternal education and child health: Is there a
strong causal relationship? Demography 35(1), pp.71–81.
Doran, T., Foolwood, C., Gravelle, H., Reeves, D., Kontopantelis, E., Hiroeh, U.
and Roland, M., 2006. Pay-for-performance programs in family practices in the
United Kingdom. New England Journal of Medicine 355(4), pp.375–384.
Guterman, S., Davis, K., Schoenbaum, S. and Shih, A., 2009. Using Medicare
payment policy to transform the health system: A framework for improving
performance. Health Affairs 28(2), pp.W238–W250.
Hall B. and Liebman, J., 1998. Are CEOs really paid like bureaucrats? Quarterly
Journal of Economics 113(3), pp.653–691.
Halterman, J.S., Kaczorowski, J.M., Aligne, C.A., Auinger, P. and Szilagyi, G.,
2001. Iron deficiency and cognitive achievement among school-aged children and
adolescents in the United States. Pediatrics 107(6), pp.1,381–1,386.
Hobcraft, J. (1993) Women's education, child welfare and child survival: A review
of the evidence. Health Transition Review 3(2), pp.159–173.
23
Holmstrom, B. and Milgrom, P., 1991. Multitask principal-agent analyses:
Incentive contracts, asset ownership, and job design. Journal of Law, Economics
and Organization 7, pp.24–52.
Jacoby, H., 2002. Is there an intrahousehold 'flypaper effect'? Evidence from a
school feeding programme. Journal of Economics 112(476), pp.196–221.
Jensen, M. and Murphy, K., 1990. CEO incentives – it's not how much you pay,
but how. Harvard Business Review 68(3), pp.138–153.
Loevinsohn, B. and Harding, A., 2005. Buying results? Contracting for health
service delivery in developing countries. Lancet 366(9486), pp.676–681.
Luo, R., Kleiman-Weiner, M., Rozelle, S., Zhang, L., Liu, C., Sharbono, B., Shi, Y.,
Yue, A., Martorell, R. and Lee, M., 2010. Anemia in rural China's elementary
schools: Prevalence and correlations in Shaanxi Province's poor counties. Ecology
of Food and Nutrition 49(5), pp.357–372.
Maynard, A. and Bloor, K., 2010. Will financial incentives and penalties improve
hospital care? British Medical Journal 340, pp.C88–C88.
Montagu, D. and Yamey, G., 2011. Pay-for-performance and the millennium
development goals. Lancet 377(9775), pp.1,383–1,385.
Raith, M., 2008. Specific knowledge and performance measurement. The RAND
Journal of Economics 39(4), pp.1,059–1,079.
Rosenthal, M. and Dudley, R.A., 2007. Pay-for-performance: Will the latest
payment trend improve care? Journal of the American Medical Association 297(7),
pp.740–744.
Soeters, R., Habineza, C. and Peerenboom, P.B., 2006. Performance-based
financing and changing the district health system: experience from Rwanda.
Bulletin of the World Health Organization 84(11), pp.884–889.
Stoltzfus, R.J., 2001. Iron-deficiency anemia: Reexamining the nature and
magnitude of the public health problem. Journal of Nutrition 131, pp.697S–700S.
Wang, L., 2005. The general survey report of nutrition and health in China in
2002. Beijing: People's Medical Publishing House.
Wang, W., 2007. Nutrition status quo of school-aged children in rural Shaanxi.
School of Public Health, Xi'an Jiaotong University manuscript.
World Bank, 2007. Socio-Economic differences in health, nutrition, and population
within developing countries: An overview. In Gwatkin, D.R., Rutstein, S.,
Johnson, K., Suliman, E., Wagstaff, A. and Amouzou, A. (eds.) Country report on
HNP and poverty, World Bank. Washington DC.
Yip, R., 2001. Iron. In: Bowman, B.A. and Russell, R.M. (eds.) Present knowledge
in nutrition (8th ed) Washington DC: International Life Sciences Institute Press,
pp.311–328.
Yip, R., Binkin, N.J., Fleshood, L. and Trowbridge, F.L., 1987. Declining
prevalence of anemia among low-income children in the United States. Journal of
the American Medical Association 258(12), pp.1,619–1,623.
24
Publications in the 3ie Impact Evaluation Report Series
The following reports and other 3ie publications are all available from
www.3ieimpact.org/publications/3ie-impact-evaluations/.
The promise of preschool in Africa: A randomised impact evaluation of early
childhood development in rural Mozambique, 3ie Impact Evaluation Report 1.
Martinez, S., Naudeau, S. and Pereira, V. (2012)
A rapid assessment randomised-controlled trial of improved cookstoves in rural
Ghana, 3ie Impact Evaluation Report 2. Burwen, J. and Levine, D.I. (2012)
The GoBifo project evaluation report: Assessing the impacts of community-driven
development in Sierra Leone, 3ie Impact Evaluation Report 3. Casey, K.,
Glennerster, R. and Miguel, E. (2013)
Does marginal cost pricing of electricity affect groundwater pumping behaviour of
farmers? Evidence from India, 3ie Impact Evaluation Report 4. Meenakshi, J.V.,
Banerji, A., Mukherji, A. and Gupta, A. (2013)
Impact evaluation of the non-contributory social pension programme 70 y más in
Mexico, 3ie Impact Evaluation Report 5. Rodríguez, A., Espinoza, B., Tamayo, K.,
Pereda, P., Góngora, V., Tagliaferro, G., Solís, M. (2013)
The impact of daycare on maternal labour supply and child development in
Mexico, 3ie Impact Evaluation Report 6. Angeles, G., Gadsden, P., Galiani, S.,
Gertler, P., Herrera, A., Kariger, P. and Seira, E. (2013)
Social and economic impacts of Tuungane: final report on the effects of a
community-driven reconstruction programme in eastern Democratic Republic of
Congo, 3ie Impact Evaluation Report 7. Humphreys, M., Sanchez de la Sierra, R.,
van der Windt, P. (2013)
Paying for performance in China’s battle against anaemia, 3ie Impact Evaluation
Report 8. Zhang, L., Rozelle, S. and Shi, Y. (2013)
No margin, no mission? Evaluating the role of incentives in the distribution of
public goods in Zambia, 3ie Impact Evaluation Report 9. Ashraf, N., Bandiera, O.
and Jack, K. (2013)
Truth-telling by third-party audits and the response of polluting firms:
Experimental evidence from India, 3ie Impact Evaluation Report 10. Duflo, E.,
Greenstone, M., Pande, R. and Ryan, N. (2013)
www.3ieimpact.org
Impact Evaluation Report Series
International Initiative for Impact Evaluation c/o Global Development Network 2nd Floor, West Wing, ISID Complex Plot No. 4, Vasant Kunj Institutional Area New Delhi – 110070 India
[email protected] Tel: +91 11 4323 9494