Embed Size (px)
Citation preview

AGRI-FOOD & BIOSCIENCES INSTITUTE
Impact on UK Agriculture of Changes to Direct Payments Following Brexit
Myles Patton, Siyi Feng, John Davis, Paul Caskie, Erin Sherry and Julian Binfield
30 September 2020

ii
Contents
List of Tables...................................................................................................................... iii
Impacts on UK Agriculture of Changes to Direct Payments Following Brexit - Policy Brief .... v
Impacts on UK Agriculture of Changes to Direct Payments Following Brexit - Main Report. 14
Introduction................................................................................................................... 14
Scenario Definitions ...................................................................................................... 15
Changes in Pillar I Direct Payments ........................................................................... 15
Provision of Coupled Payments ................................................................................. 19
Results ......................................................................................................................... 21
Changes in Pillar I Direct Payments ........................................................................... 21
Provision of Coupled Payments ................................................................................. 47
Discussion .................................................................................................................... 62
References ................................................................................................................... 65
Appendix 1: Impact of Changes in Trade Arrangements .................................................... 66
Free Trade Agreement with the EU ............................................................................... 66
WTO Default ................................................................................................................. 66
2019 No Deal Tariff Schedule........................................................................................ 67
Appendix 2: Combined impact of changes in trade arrangements and Pillar1 support
payments ......................................................................................................................... 77
Appendix 3: Sensitivity analysis using alternative rest of the world beef price..................... 92
Appendix 4: Import/Export Supply Curves ......................................................................... 97

iii
List of Tables Table 1 Pillar I payments made to UK agriculture 2014 - 2018 (million euros) .................... 16 Table 2 New tariffs and tariff rate quotas applied to UK imports under the 2019 No Deal
Tariff Schedule scenario ................................................................................................... 18 Table 3 Pillar I direct payments matrix............................................................................... 19 Table 4 Allocation of the coupled payments across sectors (Percentage of coupled budget
allocated to sectors) ......................................................................................................... 20 Table 5 Coupled payments matrix..................................................................................... 20 Table 6 Projected changes in beef sector due to changes in Pillar I direct payments: 30%
decoupling assumption ..................................................................................................... 29 Table 7 Projected changes in beef sector due to changes in Pillar I direct payments: 60%
decoupling assumption ..................................................................................................... 30 Table 8 Projected changes in beef sector due to changes in Pillar I direct payments: 100%
decoupling assumption ..................................................................................................... 31 Table 9 Projected changes in sheep sector due to changes in Pillar I direct payments: 30%
decoupling assumption ..................................................................................................... 32 Table 10 Projected changes in sheep sector due to changes in Pillar I direct payments: 60%
decoupling assumption ..................................................................................................... 33 Table 11 Projected changes in sheep sector due to changes in Pillar I direct payments:
100% decoupling assumption ........................................................................................... 34 Table 12 Projected changes in pig and poultry sectors due to changes in Pillar I direct
payments (UK-level): 30% decoupling assumption ............................................................ 35 Table 13 Projected changes in pig and poultry sectors due to changes in Pillar I direct
payments (UK-level): 60% decoupling assumption ............................................................ 35 Table 14 Projected changes in pig and poultry sectors due to changes in Pillar I direct
payments (UK-level): 100% decoupling assumption .......................................................... 36 Table 15 Projected changes in dairy sector due to changes in Pillar I direct payments: 30%
decoupling assumption ..................................................................................................... 37 Table 16 Projected changes in dairy sector due to changes in Pillar I direct payments: 60%
decoupling assumption ..................................................................................................... 38 Table 17 Projected changes in dairy sector due to changes in Pillar I direct payments: 100%
decoupling assumption ..................................................................................................... 39 Table 18 Projected changes in crop sector due to changes in Pillar I direct payments: 30%
decoupling assumption ..................................................................................................... 40 Table 19 Projected changes in crop sector due to changes in Pillar I direct payments: 60%
decoupling assumption ..................................................................................................... 41 Table 20 Projected changes in crop sector due to changes in Pillar I direct payments: 100%
decoupling assumption ..................................................................................................... 42 Table 21 Projected changes in value of output due to changes in Pillar I direct payments:
30% decoupling assumption ............................................................................................. 44 Table 22 Projected changes in value of output due to changes in Pillar I direct payments:
60% decoupling assumption ............................................................................................. 45 Table 23 Projected changes in value of output due to changes in Pillar I direct payments:
100% decoupling assumption ........................................................................................... 46 Table 24 Projected changes in beef sector due to provision of coupled payments: 20%
coupled payments ............................................................................................................ 50 Table 25 Projected changes in beef sector due to provision of coupled payments: 100%
coupled payments ............................................................................................................ 51 Table 26 Projected changes in sheep sector due to provision of coupled payments: 20%
coupled payments ............................................................................................................ 52

iv
Table 27 Projected changes in sheep sector due to provision of coupled payments: 100%
coupled payments ............................................................................................................ 53 Table 28 Projected changes in pig and poultry sectors due to provision of coupled payments:
20% coupled payments (UK-level results) ......................................................................... 54 Table 29 Projected changes in pig and poultry sectors due to provision of coupled payments:
100% coupled payments (UK-level results) ....................................................................... 54 Table 30 Projected changes in dairy sector due to provision of coupled payments: 20%
coupled payments ............................................................................................................ 55
Table 31 Projected changes in dairy sector due to provision of coupled payments: 100%
coupled payments ............................................................................................................ 56 Table 32 Projected changes in crop sector due to provision of coupled payments: 20%
coupled payments ............................................................................................................ 57 Table 33 Projected changes in crop sector due to provision of coupled payments: 100%
coupled payments ............................................................................................................ 58 Table 34 Projected changes in value of output due to provision of coupled payments: 20%
coupled payments ............................................................................................................ 60 Table 35 Projected changes in value of output due to provision of coupled payments: 100%
coupled payments ............................................................................................................ 61

v
Impacts on UK Agriculture of Changes to Direct Payments
Following Brexit - Policy Brief
R es earch A ims a nd Key F indings
The primary aim of this research is to investigate the impacts of reducing or eliminating
direct payments, as currently delivered to farmers, on UK and Devolved Administration
agriculture. To do this the FAPRI-UK modelling system is used to project changes in
production, producer prices, imports, exports and domestic use for the major UK agricultural
commodities.
The main findings are:
Reducing or eliminating decoupled direct payments to farmers has uneven impacts
on production and farm-gate prices for the main UK agricultural commodities;
Agricultural commodities produced by farm sectors that are most dependent on
subsidies for farm income, experience the biggest projected changes in farm-gate
prices and production volumes, most notably beef and sheep meat;
The UK-EU trading framework in place when decoupled direct payments are reduced
or eliminated, has a significant effect on production and other market parameters for
different agricultural commodities;
The scenarios modelled in this research are a considerable departure from current policy. As
the modelling system is calibrated using historical data, the more radical the scenario and
the greater the departure from the status quo and past experience, the more uncertain the
results. The model generates results at the sector-level. Therefore interpretation of the farm-
level or economy-wide impacts require considering the results in the context of
complementary analyses1.
I n troduction
This policy report contains FAPRI-UK modelling results for a number of post-Brexit domestic
farm policy scenarios, applied in combination with results for a range of future trading
relationships between the UK and EU.
The modelling system provides a range of projections for numerous variables: livestock
numbers and cropping areas, production volumes, imports and exports, producer prices and
consumption volumes.
To provide a point of comparison for the scenarios to be modelled, baseline projections are
initially generated under the assumption that current EU policies remain in place - essentially
that the UK remains in the EU subject to pre-2020 policies. For the baseline, global
macroeconomic projections determined outside the model are used, and average weather
conditions apply. Baseline projections are made for each country in the UK, extending
forward over a ten year period to 2027.
The research investigates the likely impacts on UK agriculture sectors of changes in farm
payment levels and payment mechanisms (decoupled or coupled), but assuming the CAP
1 One aspect of this, and other work that looks at how subsidy changes might impact viability at a farm-level, is discussed further on page 60 of the full report.

vi
Pillar I framework is retained. Specifically, the FAPRI-UK partial equilibrium modelling
system is used to quantify the market impacts of two scenarios:
1. Reduction or elimination of direct payments: Direct decoupled (Pillar I) payments - (including in the case of Scotland coupled payments for beef and sheep production) – are (a) reduced by 50%; and (b) eliminated completely.
2. Expansion and increase of coupled payments: These payments are introduced -
increased in the case of Scotland - for specific sectors with a corresponding decrease
in the budget for decoupled payments2.
Although decoupled payments are not linked to production, they can influence farmers’
behaviour, resulting in higher levels of output than would otherwise be the case. There is
considerable uncertainty concerning the extent to which decoupled payments influence
production, and therefore three alternative scenarios are considered for the purposes of
policy analysis. In line with the decoupling assumption made within the rest of the FAPRI EU
modelling system, it is first assumed that the production impact of the decoupled Pillar I
payments is relatively ‘weak’, i.e. the physical production impact of a £1 increase in direct
payment is 30% of that of a £1 increase in price. A 60% ‘moderate’ assumption and 100%
‘strong’ assumption are also included. The latter induces the same production response as
fully coupled support.
The impacts of these domestic support scenarios on agricultural commodity markets are in
addition to those resulting from post-Brexit trade arrangements. Thus analysis of the above
scenarios was undertaken in the context of three alternative post-Brexit trade arrangements
with the EU:
A Free Trade Agreement with zero tariffs between the UK and the EU (abbreviated as
UK-EU FTA);
The implementation by the UK of WTO default tariffs (abbreviated as WTO)3;
The implementation by the UK of the 2019 No Deal Tariff schedule (abbreviated as No
Deal).
For each scenario the impacts of changes in direct payments (with the UK-EU FTA, WTO
and 2019 No Deal Tariff frameworks in place) were determined and considered alongside
those changes arising from trade arrangements alone. In this way it was possible to isolate
the impact of changes in direct payments within each alternative trade arrangement.
R eduction or E l imination of C AP Pil lar I D i rect P ayments
The results (set out in detail in the main body of the report and annexes) show that the
impact of reductions in direct payments (for the most part decoupled across the UK
administrations but with an element of coupled support in Scotland) vary by commodity and
according to the trade arrangements in place between the UK and EU. Given the number
and complexity of the scenarios modelled, only some of the extensive results available from
the analysis can be described here. Fuller results can be found in the tables in the main
body of the report and annex.
Changes in commodity production volumes are a key indicator when assessing the impact of
changes in trade and domestic policy. It encapsulates how the sector responds to the totality
2 Coupled payments scenarios are not applied directly in the case of Wales, so only the indirect effects of hypothetical use elsewhere in the UK is estimated for the agricultural sector in Wales. 3 In May 2020 the UK announced the MFN tariff regime, the UK Global Tariff (UKGT) that will replace the EU’s Common External Tariff on 1 January 2021. It largely adopts the WTO default tariffs with some simplifications rounding down tariff rates.

vii
of available government subsidies and market returns. For each of the major farm
commodities included in the analysis, production impacts are reported below. The scenario
reported shows the change in production when all subsidies are removed, under three
possible trading relationships between the UK and EU, and with a range of assumptions
about the influence of subsidies on farmers’ decision to produce (strong, moderate and
weak). The main document also reports the impacts of a smaller, 50 per cent reduction in
direct (CAP Pillar I) payments.
Each chart below shows the change in overall production against the baseline at the end of
the projection period (2027), with the trade and domestic subsidy effects shown separately.
These are then combined to show the overall impact on production.
Beef
The complete elimination of direct (CAP Pillar I) payments impacts beef production by similar
amounts under all future UK-EU trade scenarios. Considered separately from the underlying
impacts of future trading regimes, it sees reductions of between 2 to 7 per cent in production,
depending on whether direct payments are assumed to have a ‘weak’ or ‘strong’ influence
on supply. Beef cow numbers fall by between 5 and 15 per cent under all trade scenarios.
The former applies when a ‘weak’ link is assumed between direct payments and product ion,
and the latter when a ‘strong’ link is assumed. However, as removing all subsidies has a
limited impact on the size of the dairy herd, the volume of beef from this source is little
changed. This mitigates the fall in overall beef production. Farm gate cattle prices are little
changed from the baseline projection, as is domestic use. Any reduced domestic supply is
replaced by imports, precluding significant UK market price increases.
Adding the impacts of alternative trading arrangements to the effects of eliminating all direct
payments, reveals a wide range of possible production levels. Under the WTO tariff schedule
and assuming a ‘weak’ link between subsidies and domestic supply, production is 3 per cent
higher than the baseline projection. In contrast, assuming a ‘strong’ link between subsidies
and domestic supply, under the 2019 No Deal Tariff schedule production is approximately 13
per cent lower than the baseline projection.

viii
Impacts of eliminating Pillar I direct payments on beef production assuming weak, moderate, and strong subsidy effects
Sheep
The complete elimination of direct (CAP Pillar I) payments impacts sheep production
differently, depending on the UK-EU trading framework modelled in conjunction with the
change in domestic policy. Considered separately from the pure trade effects, it sees
reductions of between 2 and 16 per cent in production, depending on whether direct
payments are assumed to have a ‘weak’ or ‘strong’ influence on supply. Falls in production
are reflected in a national flock that is smaller by between 1.5 and 15 per cent compared
with the baseline projection. Only small reductions in sheep numbers are found with both the
WTO and 2019 No Deal Tariff scenarios (but see below on the significant concurrent
reduction in production associated with trade-only impacts). The greatest impact from the
elimination of direct payments on production is under the UK-EU Free Trade Agreement
scenario. This trading arrangement largely maintains the status quo before subsidies are
removed and the shock of the domestic policy change therefore results in a relatively big
decline in ewe numbers.
Farm gate prices for sheep increase in all scenarios but only by a modest 1 per cent under a
UK-EU Free Trade Agreement. Under this scenario, UK sheepmeat exports decline sharply,
by between 15 and 42 per cent, again depending on whether ‘weak’ and ‘strong’
assumptions are made about the link between direct payments and production. However,
lower production that manifests itself in reduced exports has little impact on farm gate prices.
In contrast, prices rise sharply, (by 18 and 19 per cent respectively), under the 2019 No Deal
Tariff and WTO trade frameworks, when direct payments are assumed to have a ‘strong’
influence on supply. This is because exports are already minimal under these trade
frameworks, with little scope to fall further. As a result, farm gate prices increase in response
to lower production (notwithstanding higher imports), mitigating the fall in sheep numbers.
-1.7%
-3.7%
-6.5%
3.3%
1.2%
-1.5%
-8.0%
-10.1%
-12.8%-15%
-12%
-9%
-6%
-3%
0%
3%
6%
9%
12%
15%
Trade Only Impacts Net Change Weak Influence on Production
Moderate Influence on Production Strong Influence on Production
FTA WTO ND Tariffs

ix
Domestic use changes little, against the baseline projection, when direct payments are
removed under a UK-EU Free Trade Agreement, but falls by 7 per cent when the WTO
scenario is combined with a ‘strong’ assumption about the impact of subsidies on supply.
Imports change little following the removal of domestic support when a UK-EU Free Trade
Agreement is in place. However, under the 2019 No Deal Tariff and the WTO scenarios,
imports increase by 3 per cent and 10 per cent respectively, when subsidies are assumed to
have a ‘strong’ impact of domestic supply.
Adding the impacts of alternative trading arrangements to the effects of eliminating all direct
payments, reveals uniformly negative impacts on sheep production levels. Under a Free
Trade Agreement and assuming a ‘weak’ link between subsidies and domestic supply,
production is 7 per cent lower than the baseline projection. In contrast, assuming a ‘strong’
link between subsidies and domestic supply under a WTO framework, production is
approximately 29 per cent lower than the baseline projection.
Impacts of eliminating Pillar I direct payments on sheep production assuming weak, moderate, and strong subsidy effects
Pigs
The complete elimination of direct (CAP Pillar I) payments impacts pig production very little
under all UK-EU trade scenarios. Considered separately from the pure trade effects, it sees
reductions of no more than 1 per cent in production, even when direct payments are
assumed to have a ‘strong’ influence on supply. Likewise p ig numbers, domestic use,
imports, exports and farm gate price are effected by no more than +/- 1 per cent under any
scenario. The pig sector has not benefitted from direct (Pillar I) payments to a significant
extent and is therefore little impacted by its removal.
Adding the trade only impacts to the analysis brought about little change under the UK-EU
Free Trade Agreement scenario, as it preserves the status quo. However, under the WTO
framework scenario pig production increases by 10 per cent, while the 2019 No Deal Tariff
framework sees production reduce by about 9 per cent. Both WTO and 2019 No Dea l Tariff
-7.0%
-11.5%
-17.4%
-21.0%
-24.8%-29.2%
-18.0%-20.7%
-24.8%-30%
-25%
-20%
-15%
-10%
-5%
0%
5%
10%
15%
20%
25%
30%
Trade Only Impacts Net Change Weak Inlfuence on Production Moderate Influence on Production Strong Influence on Production
FTA WTO ND Tariffs

x
scenarios see new levels of imports and exports, with the former WTO trade regime
increasing farm gate prices by 10 per cent and the 2019 No Deal Tariff arrangement
reducing prices by 9 per cent, compared with baseline projections.
Impacts of eliminating Pillar I direct payments on pig production assuming weak, moderate, and strong subsidy effects
Poultry
The complete elimination of direct (CAP Pillar I) payments impacts poultry production very
little under all future UK-EU trade scenarios. Considered separately from the pure trade
effects, it sees no significant change in production, even when direct payments are assumed
to have a ‘strong’ influence on supply. Likewise poultry domestic use, imports and exports
are not effected and farm gate prices increase by 1.5 per cent but only under the WTO trade
scenario. As with pigs, the poultry sector does not benefit from direct (Pillar I) payments and
is therefore little impacted by their removal.
Again, as with pigs, adding the impacts of alternative trading arrangements brought about
little change under a UK-EU Free Trade Agreement framework. In contrast with pigs only
modest increases of up to 2 per cent in production are projected under the WTO and 2019
No Deal Tariff scenarios, when compared to baseline projections.
0.5% 0.4% 0.3%
10.2% 10.0% 9.7%
-8.8% -8.6% -8.4%
-15%
-12%
-9%
-6%
-3%
0%
3%
6%
9%
12%
15%
Trade Only Impacts Net Change Weak Influence on Production Moderate Influence on Production Strong Influence on Production
FTA WTO ND Tariffs

xi
Impacts of eliminating Pillar I direct payments on poultry production assuming weak, moderate, and strong subsidy effects
Milk
The complete elimination of direct (CAP Pillar I) payments has modest impacts on farm milk
production under all UK-EU trade scenarios. Separate to trade only impacts, it sees
reductions of up to 2 per cent in production, when direct payments are assumed to have a
‘strong’ influence on supply. This reflects the relatively small proportion of farm income
provided by Pillar I direct payments compared with suckled beef and sheep.
Manufacturing use falls, under all trading scenarios, by about 2 per cent when direct
payments are assumed to have a ‘weak’ influence on supply. When direct payments are
assumed to have a ‘strong’ influence on supply, their removal reduces manufacturing use by
4 per cent. The reduction in manufacturing use is more pronounced than farm production
because sales of higher value pasteurised milk are maintained at the expense of other
processing uses. Producer milk prices are marginally higher under all the future trade
scenarios, compared with the baseline projection.
Adding the impacts of alternative trading arrangements to the effects of eliminating all direct
payments, reveals mixed impacts on overall production. Under a WTO framework and
assuming a ‘weak’ link between subsidies and domestic supply, production is 5 per cent
higher than the baseline projection. In contrast, assuming a ‘strong’ link between subsidies
and domestic supply under a 2019 No Deal Tariff framework, production is approximately 6
per cent lower than the baseline projection.
0.1% 0.1%0.0%
1.8% 1.8% 1.7% 1.7% 1.7% 1.7%
-5%
-4%
-3%
-2%
-1%
0%
1%
2%
3%
4%
5%
Trade Only Impacts Net Change Weak Influence on Production
Moderate Influence on Production Strong Influence on Production
FTA WTO ND Tariffs

xii
Impacts of eliminating Pillar I direct payments on milk production assuming weak, moderate, and strong subsidy effects
Wheat
The complete elimination of direct (CAP Pillar I) payments impacts wheat production by
uniformly negative, but relatively modest, amounts under all future UK-EU trade scenarios.
Wheat production reduces between 1 and 4 per cent, depending on whether direct payments
are assumed to have a ‘weak’ or ‘strong’ influence on supply.
Domestic use is little impacted under all scenarios, but exports fall by up to 16 per cent ,
compared to the baseline projection, under a UK-EU Free Trade Agreement scenario when
direct payments are assumed to ‘strongly’ influence supply. Exports fall by 10 per cent under
the 2019 No Deal Tariff scenario, when direct payments are assumed to ‘strongly’ influence
supply but the removal of direct payments has no additional impacts on production when a
WTO tariff framework is already in place. Imports increase only modestly under either a UK-
EU Free Trade Agreement or WTO framework, but rise by 24 per cent under the 2019 No
Deal Tariff scenario.
Adding the impacts of alternative trading arrangements to the removal of direct payments,
counterbalanced the negative impacts under a WTO framework, and reinforced the negative
impacts on production under both the UK-EU Free Trade Agreement and the 2019 No Deal
Tariff framework. This was most pronounced for the 2019 No Deal Tariff framework, when
the combined effects of the trade and domestic policy regimes, assuming direct payments
have a ‘strong’ influence on supply, reduced production by 6 per cent, compared to the
baseline projection.
-0.2%-0.8%
-1.6%
4.7%4.1%
3.4%
-4.2%-4.9%
-5.8%
-15%
-12%
-9%
-6%
-3%
0%
3%
6%
9%
12%
15%
Trade Only Impacts Net Change Weak Influence on Production Moderate Influence on Production Strong Influence on Production
FTA WTO ND Tariffs

xiii
Impacts of eliminating Pillar I direct payments on wheat production assuming weak, moderate, and strong subsidy effects
It should be noted that the removal of direct payments entail significant departures from
existing policies. The modelling system is robust for relatively modest changes in direct
payments. However, there is uncertainty whether the final £1 cut from farmers’ subsidies
has the same impact as the first, when a scenario such as the removal of all subsidies is
modelled. This means it is not possible to validate the results against previous real world
experience. In addition, the modelling system does not capture changes in factor markets,
particularly possible reductions in land rents following the removal of subsidies. Likewise, if
alternative environmental subsidies are introduced these may indirectly support production if
this is required to deliver public goods, such as the maintenance of traditional farming
landscapes.
Ex p ansion a nd increase o f coupled p ayments
Modelling the reallocation of payments from decoupled to coupled support for the individual
nations of the UK (excluding Wales) leads to relatively modest changes in activity levels, for
the UK as a whole. The results are set out in full in the main body of the report and annexes.
Differences in the size of the production base in each of the UK administrations, means
there are asymmetric impacts at UK level following a policy change to fully coupled farm
support for any of the UK administrations.
The UK-EU trade regime in place has a significant impact on the projected UK production,
and farm-gate price changes when direct payments are assumed to be 100 per cent
coupled. Changes in imports and exports play an important role in reaching new price levels.
Beef markets are most impacted if all Pillar I support is coupled to production. While modest
increases in production and decreases in farm-gate prices are projected for the UK as a
whole, the impact on the production base (cow numbers) is more significant for individual UK
nations following the adoption of coupled support measures.
-0.9%-1.7%
-2.8%
0.7% 0.1%-0.8%
-3.0%-4.1%
-5.6%
-15%
-12%
-9%
-6%
-3%
0%
3%
6%
9%
12%
15%
Trade Only Impacts Net Change Weak Influence on Production Moderate Influence on Production Strong Influence on Production
FTA WTO ND Tariffs

14
Impacts on UK Agriculture of Changes to Direct Payments
Following Brexit - Main Report
Introduction The future of direct payments is likely to change considerably following the UK’s exit from
the EU and the resulting move away from the Common Agricultural Policy (CAP) to new
agricultural policies in the UK. These policies are likely to differ across the administrations in
the UK. In England, Defra has indicated its intention to phase-out current direct payments by
2027 and instead provide payments based on the delivery of public goods, such as
biodiversity, water quality and flood alleviation (Defra, 2018). In Wales, the Welsh
Government has proposed replacing direct payments with a new Sustainable Farming
Scheme providing support to deliver sustainable land management outcomes. (Welsh
Government, 2019). The administrations in Scotland and Northern Ireland also intend to
implement new agricultural policies with a variety of objectives, including enhanced
environmental outcomes, but to date there has been no declaration of policy decisions
(Scottish Government (2018) and DAERA, 2018). Given that direct payments under the
Common Agricultural Policy represent the largest pre-COVID industrial subsidy in the UK, it
is important to assess the economic impact of potential changes to this form of support.
Within this study, the FAPRI-UK modelling system is used to capture the market impacts of
changes in domestic support policy in the context of changing trade arrangements. In
particular, two scenarios are considered:
i) Reduction or elimination of direct payments: Direct decoupled (Pillar I) payments
- (including in the case of Scotland coupled payments for beef and sheep
production) – are (a) reduced by 50%; and (b) eliminated completely.
ii) Expansion and increase of coupled payments: These payments are introduced -
increased in the case of Scotland - for specific sectors with a corresponding
decrease in the budget for decoupled payments4.
Details concerning the scenarios are provided in the next section.
The modelling system provides a wide range of projections for numerous variables, including
agricultural activity levels, production, trade, producer prices and consumption. The model is
firstly simulated to generate Baseline projections based on the assumptions that current
policies remain in place, specific macroeconomic projections hold and average weather
conditions apply. It is assumed under the Baseline that the UK remains within the EU.
Baseline projections for each country in the UK are generated for a ten year period, which
extends out to 2027. Within this study, the modelling system is further simulated under
various policy scenarios to incorporate changes in trade arrangements and Pillar I support to
provide a variety of comparisons.
4 Coupled payments scenarios are not applied directly in the case of Wales, so that only the indirect effects of hypothetical use elsewhere in the UK are estimated for the agricultural sector in Wales.

15
Scenario Definitions
Changes in Pillar I Direct Payments The first policy scenario investigates the impacts of altering the level of direct payments
(CAP Pillar I). The value of Pillar I support paid out in the UK, and in each Devolved
Administration, in the five years 2014 to 2018 is provided in Table 1. In the policy scenario,
two different magnitudes of change to Pillar I payments (both decoupled payments and in
the case of Scotland coupled payments) are explored: (a) a 50% reduction; and (b) elimination5. Although the decoupled payments are not linked to production in an
administrative sense, within the modelling system it is assumed that such payments continue
to exert an influence on production. This assumption is in keeping with the li terature which
indicates that decoupled direct payments influence production decisions due to a variety of
mechanisms, including influence on risk preferences, credit constraints, allocation of labour,
expectations about future preferences and cross compliance obligations (Hennessy (1998),
Goodwin and Mishra (2006), Ahearn et al. (2006) and Coble et al. (2008)).
Within the UK modelling system decoupled payments are included within revenue per unit of
production terms incorporated within supply equations (beef cows, ewes, milk production,
and crop area). The revenue term contains a market revenue component and a direct
payment component. The magnitude of the direct payment term relative to the market
revenue term is calibrated using Farm Business Survey data for different farm types and
therefore reflects variations in the importance of direct payment across administrations and ,
in the case of the beef cow and ewe equations, across land types (Lowland, Disadvantaged
Area and Severely Disadvantaged Area). Furthermore the direct payment term is multiplied
by a coefficient to capture the production stimulating impact of decoupled payments. A
coefficient equal to one signifies that the direct payment is fully coupled and exerts the same
production stimulating impact as market revenue, while a coefficient less than one
diminishes the production stimulating impact of the payment.
There is considerable uncertainty concerning the extent to which these payments exert a
production stimulating impact and therefore three alternative scenarios are considered for
the purposes of policy analysis. In line with the decoupling assumption made within the rest
of the EU modelling system, it is firstly assumed that the production stimulating impact of the
decoupled Pillar I payments is relatively weak, i.e. the physical production impact of a £1
increase in direct payment is 30% of that of a £1 increase in price. This assumption is in
keeping with the treatment of decoupled payments within the FAPRI US model, where there
has been a longer history of decoupled payments and hence, more empirical evidence is
available. However, this empirical evidence is primarily based on the crop sector. Given the
uncertainty sensitivity analysis is undertaken using two alternative assumptions concerning
the production impact, assuming there is a moderate influence on the level of production i.e.
60% of the direct payment is acted on as a price increase by producers, and a relatively
strong influence, whereby 100% of the ‘decoupled’ payment is assumed to trigger a
production response due to being interpreted as a price increase by the sector. The latter is
equivalent to assuming that the payments are fully coupled.
5 Under the Baseline Pillar I (Basic Payment Scheme) decoupled payments in 2017 equate to £1,768 million in
England, £235 million in Wales, £425 million in Scotland and £292 million in Northern Ireland. This encompasses
the Basic Payment Scheme, Greening and the Young Farmer Payment. A further £47 million is paid via coupled
payment schemes in Scotland. Note Less-Favoured Area Support Scheme remains unchanged w ithin this
scenario analysis.

16
Table 1 Pillar I payments made to UK agriculture 2014 - 2018 (million euros)
Euros million
2014 2015 2016 2017 2018
UK CAP payments
Pillar 1 3234 3150 3121 3171 3174
of which: Direct Aids 3195 3112 3035 3080 3126
Market price support (b) 39 38 86 91 48
England CAP payments
Pillar 1 2048 2026 2018 2069 2084
of which: Direct Aids 2009 1988 1932 1988 2036
Market price support (b) 39 38 86 81 48
Wales CAP payments
Pillar 1 Direct Aids 301 269 260 268 263
of which: Direct Aids 301 269 260 264 263
Market price support - - - 4 -
Scotland CAP payments
Pillar 1 Direct Aids 566 534 522 507 503
of which: Direct Aids 566 534 522 504 503
Market price support - - - 3 -
Northern Ireland CAP payments
Pillar 1 Direct Aids 319 321 321 327 324
of which: Direct Aids 319 321 321 324 324
Market price support - - - 3 -
(a) Information based on EU financial year 16th October – 15th October. Figures exclude financial corrections/penalties.
(b) Market price support covers interventions in agricultural markets, e.g. public intervention and private storage aid. Most of these schemes are administered by the Rural Payments Agency on behalf of the UK.
Source: Adapted from Defra, Agriculture in the UK datasets: Chapter ten - public payments, Table 10.7, 23 September 2019.

17
Modelling this shadow-coupling effect of ‘decoupled’ support involves a complex set of
interactions to determine the ultimate supply response because the commodity markets are
all interlinked. However, if considering a simplified example, for a single commodity market,
the greater the proportion of the payment assumed to influence production, the more the
supply curve will move, and the larger the quantity supplied.
Note that the analysis does not consider the potential production impact of the new schemes
that will replace the decoupled Pillar I payments.
The market impact of this policy change will depend on the underlying trade arrangements
and hence the scenario analysis is undertaken using three alternative post-Brexit trade
arrangements, namely:
UK Free Trade Agreement with the EU (FTA): As in the Baseline, this scenario
entails tariff and quota free access for UK exports to the EU and vice-versa tariff
and quota free access for imports into the UK from the EU (EU-27). However,
trade facilitation costs (equal to 5% of the commodity price) are applied to
exports/imports to and from the EU to reflect additional trade costs associated
with exporting and importing.
WTO Default (WTO): Under this scenario, default MFN tariffs are applied to
imports from the EU, as well as the rest of the world. In addition, it is assumed
that the EU applies MFN tariffs to imports from the UK. In terms of exports from
the UK to the rest of the world, it is assumed that the UK inherits the EU’s tariff
structure to 3rd countries; i.e. tariffs applied to exports from the UK to the rest of
the world remain unchanged under this scenario compared to the Baseline.
Trade facilitation costs equal to 8% are applied to exports/imports to/from the EU
in this scenario to capture additional costs associated with less integrated trade
arrangements.
2019 No Deal Tariff Schedule (No Deal): Under this scenario, the UK
government’s planned tariff schedule in the event of the UK leaving the EU
without a deal is applied to imports from the EU and the rest of the world
(Department for International Trade, 2019). Tariff rate quotas are applied where
appropriate. Default MFN tariffs are applied to UK exports. In addition, trade
facilitation costs equal to 8% are applied to exports/imports to/from the EU.
Further details regarding the assumptions underlying this scenario are provided
in Table 2 and Figure 1. While the No Deal Tariff Schedule provides temporary
arrangements prior to the agreement of a long-term relationship with the EU,
under this scenario, it is implemented for the entire projection period so as to
isolate the market impact of these specific changes. Note that in terms of
imports/exports, the model treats the UK as a single entity and consequently, the
analysis does not account for the potential non-application of tariffs for Irish
produce entering the Northern Ireland market.
The full combination of Pillar I direct payment scenarios is provided in Table 3.

18
Table 2 New tariffs and tariff rate quotas applied to UK imports under the 2019 No Deal Tariff Schedule scenario
Sector Tariffs applied to Imports to the UK
Tariffs applied to UK Exports to the EU1
Dairy Cheese (Cheddar, not grated or for processing)
€22.1/100 kg €167.1/100 kg
Butter (Natural butter, fat content <=85%) €60.5/100 kg €189.6/100 kg
Crops Wheat (low and medium quality) 0 €9.5 /100 kg Barley (low and medium quality) 0 €9.3 /100 kg Livestock
Pig meat (Fresh/chilled pig carcass) €7.1/100 kg €53.6/100 kg Sheep meat (Fresh/chilled lamb carcass) 12.8%+€171.3/100 kg 12.8%+€171.3/100 kg Poultry (Not cut in pieces, fresh or chilled (65% chickens))
€19.5/100 kg €32.5/100 kg
Beef (Fresh/chilled cattle carcass) 6.8%+€93.3/100 kg 12.8%+€176.8/100 kg 1) Assumed that tar iffs applied to UK exports to the rest of the world remains the same as the
baseline, i.e. the UK inherits the EU’s tar iff structure to 3rd countr ies.
Figure 1 Tariff Rate Quotas under 2019 No Deal Tariff Schedule
Figure refers to total TRQ under different quota regimes, including country and non-country specific. Part A and
Part C categories set out in The Customs (Tariff Quotas) (EU Exit) Regulations 2019 United Kingdom Tariff Quotas,
version 1.0, 7 March 2019)

19
Table 3 Pillar I direct payments matrix
Trade Agreement Type Production Impact of Decoupled
Payment
Reduction in PI Payment
FTA with EU 30% 50% FTA with EU 30% 100%
WTO 30% 50% WTO 30% 100%
No Deal Tariff Schedule 30% 50%
No Deal Tariff Schedule 30% 100% FTA with EU 60% 50%
FTA with EU 60% 100% WTO 60% 50%
WTO 60% 100%
No Deal Tariff Schedule 60% 50% No Deal Tariff Schedule 60% 100%
FTA with EU 100% 50% FTA with EU 100% 100%
WTO 100% 50% WTO 100% 100%
No Deal Tariff Schedule 100% 50%
No Deal Tariff Schedule 100% 100%
Provision of Coupled Payments
Under this scenario, coupled payments are introduced for specific sectors (increased in the
case of Scotland), with a corresponding decrease in the budget for decoupled payments.
The policy change is implemented in England, Scotland and Northern Ireland (but not in
Wales) on an individual country basis. Specifically, two coupling scenarios are analysed:
20% Coupled payments: 20% of the Pillar I budget within individual countries is
transferred to coupled payments. Within the Baseline, coupled payments make up
10% of relevant Pillar 1 payments (i.e. Coupled Payments/(Coupled Payments +
Basic Payment Scheme + Greening Payment) in Scotland6.
100% coupled payments: 100% of the Pillar I budget within individual countries is
transferred to coupled payments.
The allocation of the coupled payments across sectors is provided in Table 4. This allocation
is based on consultation with the agricultural administrations but is purely hypothetical. The
payments solely target the beef and sheep sectors under the 20% coupled payment
scenario, with the allocation in Scotland reflecting the current sub-division across these
sectors. Under the 100% coupled payment scenario, the coupled budget is distributed in the
same manner in Scotland, i.e. coupled payments are just provided to the beef and sheep
sectors. In contrast, coupled payments are distributed across the beef, sheep, dairy and
crop sectors under the 100% coupled payment scenario in England and Northern Ireland.
6 Within the revenue term the coupled payment component is multiplied by a coefficient of one.

20
Table 4 Allocation of the coupled payments across sectors (Percentage of coupled budget allocated to sectors)
Sector Beef Sheep Dairy Crops 20% Coupled Payments England 74 26
Scotland 85 15 Northern Ireland 75 25 100% Coupled Payments England 21 7 31 41 Scotland 85 15 Northern Ireland 51 9 35 5
This analysis is undertaken using the 30% assumption regarding the production stimulating
impact of the decoupled payments. As before, the scenarios are undertaken using
alternative assumptions for underlying trade arrangements. The full combination of coupled
payment scenarios is provided in Table 5.
Table 5 Coupled payments matrix
Trade Agreement Type Country Extent of Coupling
FTA with EU England 20% FTA with EU Scotland 20%
FTA with EU Northern Ireland 20% WTO England 20%
WTO Scotland 20%
WTO Northern Ireland 20% No Deal Tariff Schedule England 20%
No Deal Tariff Schedule Scotland 20% No Deal Tariff Schedule Northern Ireland 20%
FTA with EU England 100%
FTA with EU Scotland 100% FTA with EU Northern Ireland 100%
WTO England 100% WTO Scotland 100%
WTO Northern Ireland 100%
No Deal Tariff Schedule England 100% No Deal Tariff Schedule Scotland 100%
No Deal Tariff Schedule Northern Ireland 100%

21
Results Note that the following tables of results and associated text are based on the difference
between combined changes in direct payments and trade arrangements against changes in
trade arrangements alone i.e. just the patterned bars in the executive summary. This
comparison is used to isolate the impact of changes in direct payments in the context of
alternative trade arrangements. The impact of changes in trade arrangements on a stand-
alone basis compared to the Baseline is provided in Appendix1, while the impact of
combined changes in direct payments against the Baseline is shown in Appendix 2 . The
percentage changes in the tables and text refer to the end of the projection period (2027).
Changes in Pillar I Direct Payments
Beef Sector
The impact on the beef sector of reducing/eliminating Pillar I direct payments using the 30%
decoupling assumption is shown in Table 6. Reducing Pillar I direct payments by 50% has a
downward impact on beef cow numbers. However, the impact is fairly modest , with the
decline in UK beef cow numbers due to the change in direct payments ranging from -2.6% to -2.9% across the alternative trade arrangements.7 The downward impact is greater in
Scotland (-4.2% to -4.7%) and Northern Ireland (-3.9% to -4.1%) compared to elsewhere in
the UK. The former reflects the reduction of both decoupled and coupled payments in
Scotland. The impact in the latter is attributable to the substantial dependence on Basic
Payment direct payments by beef farmers in Northern Ireland.
The projected impact of reducing/eliminating direct payments is similar across all the trade
arrangements. The downward impact on beef cows is more marked when direct payments
are fully eliminated (100% reduction in Table 6), but still fairly modest (UK beef cows are -
4.7% to -5.0% lower). Again, Scotland and Northern Ireland experience the largest declines.
The downward impact of the reduction/elimination of Pillar I support is less on dairy cows
compared to beef cows (see dairy section below). As a result, progeny from the dairy herd
continue to support beef production and the decline in beef production is less pronounced
than the decline in beef cows.
As shown in Figure 2, it is projected that the decline in suckler cow numbers is variable
across land categories (Severely Disadvantaged Area (SDA), Disadvantaged Area (DA) and
Lowland). In particular, the decline is most marked in the SDA land category, where
decoupled Pillar I payments comprise a substantial component of farm income.
It is important to stress that the reductions in direct payments examined under these
scenarios go beyond the boundaries upon which the models have been calibrated. The
substantial nature of the changes in direct payments considered in this analysis could lead to
structural changes not captured by the modelling system. In addition, the assumption that
the progeny from the dairy herd are finished for beef under the 2019 No Deal Tariff Schedule
version of this scenario is perhaps questionable due to the significant decline in the beef
price (and hence the profitability of finishing animals from the beef herd) that occurs due to
the change in trade arrangements.
The response of the beef price is mainly determined by the underlying trade arrangements.
Across all the scenarios imports increase to make-up for the modest decline in production
and hence there is little change in available supplies (production plus imports). Specifically,
under the FTA version of this scenario, imports from the EU increase and thereby limit the
7 Note that these percentage changes are in addition to the reduction in numbers due to the change in trade
arrangements that are reported in the Appendix. As shown in Appendix 2, combining the 50% reduction in Pillar
I payment and trade arrangement impacts, the projected declines in UK beef cow numbers under the FTA, WTO
and No Deal Tariff Schedule compared to the Baseline are -2.0%, +3.9% and -15.5% respectively.

22
price increase. Under the WTO version of this scenario, when the trade arrangements are
applied on a stand-alone basis the UK price reaches the ‘World Price + MFN Tariff level’,
which acts to curb further price rises following the reduction/elimination of direct payments.
Under the 2019 No Deal tariff schedule, there is a large inflow of imports from the rest of the
world when the trade arrangements are changed on a stand-alone basis, which leads to a
decline in the domestic beef price. The competitiveness of imports from the Rest of the
World following the change in tariffs limits further price changes. As a result, it is projected
that the reduction in direct payments leads to negligible beef price responses and hence,
there is limited variability in the price impact across all the scenarios. See Box 1 for more
details on how the WTO and No Deal tariff trade arrangements limit the extent of domestic
beef price increases following changes in direct payments.
The implications of using alternative decoupled payment production stimulating assumptions
are shown in Table 7 and Table 8. The negative impacts on beef cow numbers and
production are inevitably more marked when ‘medium’ and ‘strong’ (60% and 100%
decoupling assumptions) are employed about the impact of subsidies on production. For
example, when it is assumed that the production stimulating impact of decoupled payments
Box 1: Trade Threshold Effects under the WTO and 2019 No Deal Tariff
Schedule Scenarios
When WTO default tariffs are applied on a stand-alone basis, the UK beef price rises due to reduced imports from the EU. The price rises until it reaches the ‘World
Price + MFN Tariff level’. As explained in more detail in Appendix 4, the PUK/(PRoW
+ Tariff) price ratio increases following the change in trade arrangements and triggers the threshold point in which imports from the Rest of the World increase
sharply (Region 1 in the diagram below). This trigger point effectively curbs the
extent to which the UK beef price can rise further. Consequently, following the reduction/elimination of direct payments, the resulting fall in UK production does
not lead to significantly higher domestic prices.
When the 2019 No Deal tariff schedule trade arrangements are changed on a stand-alone basis, the cut in tariffs to imports from the Rest of the World leads to
the large inflow of imports since the PUK/(PRoW + Tariff) price ratio increases and
triggers an elastic inflow of imports (Region 1). The UK equilibrium price falls until equilibrium is reached at this threshold level. Following the further
reduction/elimination of direct payments, imports from the RoW adjust and hence
there is little change in price.
Threshold Effects within Import Supply Curve

23
is ‘strong’ UK beef cow numbers fall by approximately 15% when the direct payments are
fully eliminated. Under these conditions Northern Ireland experiences the largest decline (-
27%) due to importance of existing direct payments in the beef sector. The differential
results across land categories are more marked under the ‘moderate’ and ‘strong’
assumptions, compared to the ‘weak’ 30% assumption (Figure 2).
The above analysis is based on a particularly competit ive reference world beef price. The
implications of using a higher beef price is provided in Appendix 3.

24
Figure 2 Projected changes in suckler cow numbers under 100% reduction of Pillar I direct
payments scenario
a) 30% decoupling assumption
b) 60% decoupling assumption
c) 100% decoupling assumption

25
Sheep Sector
The impact on the sheep sector of reducing/eliminating Pillar I direct payments using the
‘weak’ 30% decoupling assumption is shown in Table 9. The projected declines in ewe
numbers and production are variable depending on the underlying trade arrangements. The
decline in ewe numbers is most marked under the FTA trade arrangements. The price
response is small under these trade arrangements. For example, following the reduction of
Pillar I payments by 50% the sheepmeat price increases by 0.4% under FTA trade
arrangements, compared to 4.3% and 2.3% under WTO and No Deal trade arrangements.
Under the FTA version of this scenario, UK sheepmeat exports decline, thereby offsetting
the decline in production, which limits the price increase. Under WTO and No Deal trade
arrangements, UK exports are already minimal and hence have little room to fall further. As
a result, price increases in response to the decline in production under the WTO and No Deal trade arrangements.8
Similar to the beef sector the reduction/elimination of Pillar I payments on ewe numbers and
production is most pronounced in Scotland and Northern Ireland. This again reflects the fact
that coupled as well as decoupled payments are reduced in Scotland and the large
contribution of decoupled payments to farm income in Northern Irish sheep farmers.
Disaggregating the changes in ewe numbers according to land category, demonstrates
different results in lowland areas (Figure 3). In particular, it is projected that the price
increases under the WTO and No Deal versions of these scenarios offset the decline in
decoupled payments within lowland areas in England, Wales and Scotland under the ‘strong’
100% reduction scenario in direct payments, which results in a slight increase in numbers.
However, the price increase is not sufficient to have an offsetting impact in disadvantaged
areas.
As shown in Table 10 and Table 11, a similar pattern regarding the impact of trade
arrangements emerges under the different production stimulating assumptions. The
projected declines in ewes and production at the UK-level are more marked when larger
decoupling assumptions are employed. For example, when it is assumed that the
decoupling effect is 100% (strong) UK ewe numbers fall by 15% following the elimination of
Pillar I direct payments under FTA trade arrangements. In this case the sheepmeat price
rises by 4%. The price response is more favourable under WTO and No Deal trade
arrangements (+19% and 18% respectively following the full elimination of direct payments).
However, it should be noted that compared to the Baseline it is st ill projected that sheepmeat
prices fall due to the large negative impact on price of the changes in the terms of trade
under the WTO and No Deal scenarios (see fall in sheepmeat prices under different trade
arrangements in Appendix 2).
8 See Appendix 4 for further discussion of sheepmeat price response under WTO and No Deal trade arrangements.

26
Figure 3 Projected changes in ewes under 100% reduction of Pillar I direct payments
scenario
a) 30% decoupling assumption
b) 60% decoupling assumption
c) 100% decoupling assumption

27
Pigs and Poultry Sectors
The pig and poultry sectors are less dependent upon Pillar I support. As a result, the
reduction/removal of these payments within the modelling system has little impact on
production and prices in these sectors, regardless of the decoupled payment production
stimulating assumption (Table 12 to Table 14).
Dairy Sector
The projected decline in milk production following the reduction and elimination of Pillar I
direct payments under the ’weak’ 30% production stimulating assumption is limited (Table
15). For example, when Pillar I payments are fully eliminated UK milk production falls by
0.6%. This reflects the relatively small proportion of farm income represented by Pillar I
direct payments compared to other pasture based farm types. The knock-on impacts of this
decline on dairy cows, manufacturing use, prices, etc. are small.
The projected declines in dairy cow numbers are slightly greater under the alternative
production stimulating impact of direct payments assumptions, but still modest (Table 16and
Table 17). For example, the fall in dairy cow numbers ranges from -1.9% to 2.2% under the
different trade arrangements following the elimination of direct payments under the 100%
decoupling assumption.
Crop Sector
It is projected that the change in crop areas and consequently production within the UK due
to the change in Pillar I payments are small (Table 18 to Table 20). This partly reflects the
observed inelastic relationship between income and area planted. Again, the applicability of
these elasticities is perhaps questionable following such extreme changes in direct
payments.
In addition, the limited production impact is also attributable to the fact that the reduction in
direct payments is partially offset by projected increases in crop prices. Note that the
production/price response is variable across the different trade arrangements. In particular,
the decline in wheat production is smallest under the WTO scenario, which is consistent with
the UK wheat price displaying the greatest increase compared to other trade arrangements.
This partly reflects the fact that exports fall to zero following the change in trade
arrangements since under WTO animal numbers increase significantly and hence the self-
sufficiency of wheat is particularly lowest. Since exports are already zero following the
change in trade arrangements, they cannot fall further when production declines in response
to the change in direct payments. As a result, the adjustment in imports following the
reduction/elimination of direct payments is fairly small. In contrast, wheat imports exhibit a
substantial increase in response to the change of direct payments under the No Deal version
of this scenario as zero tariffs are applied to imports to the UK. Consequently, this version of
the scenario experiences the smallest price increase and largest production decrease.
Value of Output
The projected changes in value of output (price multiplied by production) due to changes in
Pillar I payments are show in Table 21 to Table 23. The beef sector exhibits similar declines
in the value of output across the different trade arrangements. In contrast, the change in the
value of output for the sheep sector following the reduction in direct payments is negative
under the FTA version of the scenario, but positive under the other trade arrangements.
Under the WTO and No Deal Tariff versions of these scenarios the positive price response
offsets the decline in production.
The overall impact on the UK value of output – defined as the summation of the quantity
produced of each commodity multiplied by its respective price- is fairly modest (decline
following full elimination ranges from -0.2% to -0.8% under three alternative trade
28
arrangements and ‘weak’ 30% decoupling assumption). The overall decline in the value of
output is diluted by the limited decline in crop and dairy sectors. The negative impact is
greater in Scotland and Northern Ireland due to the larger negative production impact in the
beef and sheep sectors in these countries. When decoupled support is assumed to have a
‘strong’ impact on production (100% decoupling assumption), the value of total agricultural
output (with a UK-EU FTA in place) falls by only 1 per cent in England, but by 4 per cent in
Wales, and 6 per cent in both Scotland and Northern Ireland. The reduction in value of
output is smaller under the WTO and 2019 No Deal Tariff frameworks. Note that the
changes in the value of output noted above are additional to the changes in trade
arrangements. As shown in Appendix 1, the projected change in value of output differs
markedly according to the specific trade arrangements.
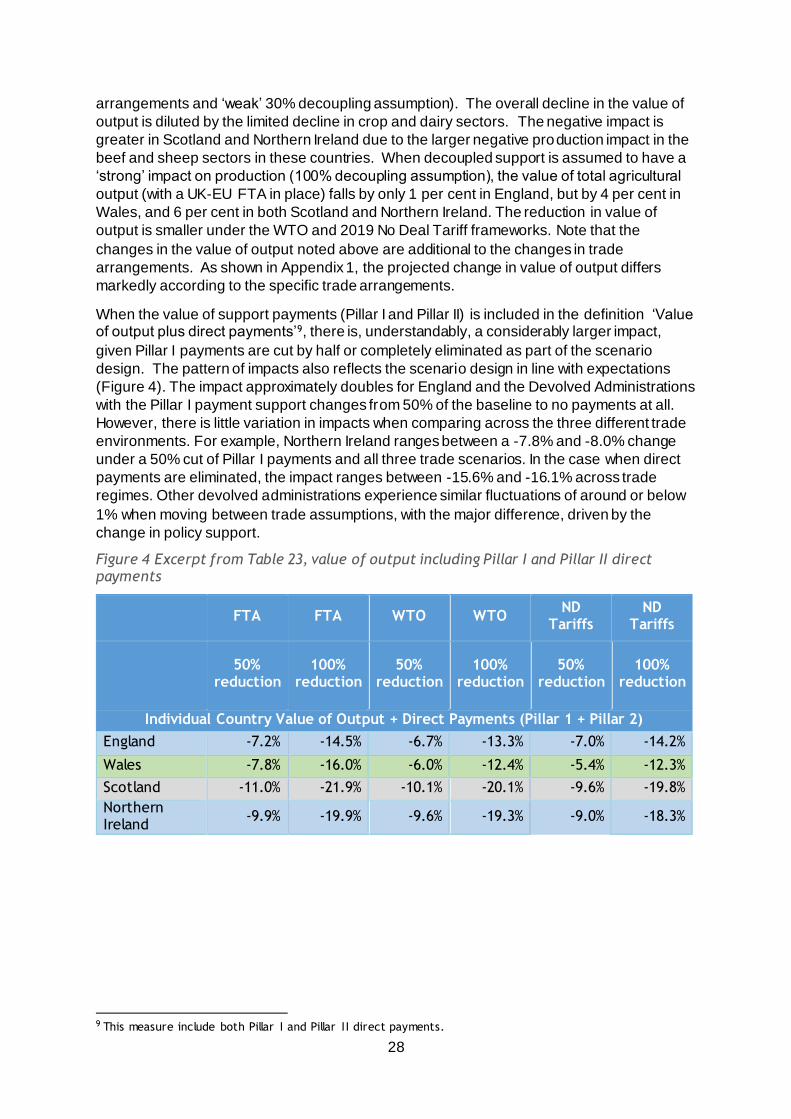
When the value of support payments (Pillar I and Pillar II) is included in the definition ‘Value of output plus direct payments’9, there is, understandably, a considerably larger impact,
given Pillar I payments are cut by half or completely eliminated as part of the scenario
design. The pattern of impacts also reflects the scenario design in line with expectations
(Figure 4). The impact approximately doubles for England and the Devolved Administrations
with the Pillar I payment support changes from 50% of the baseline to no payments at all.
However, there is little variation in impacts when comparing across the three different trade
environments. For example, Northern Ireland ranges between a -7.8% and -8.0% change
under a 50% cut of Pillar I payments and all three trade scenarios. In the case when direct
payments are eliminated, the impact ranges between -15.6% and -16.1% across trade
regimes. Other devolved administrations experience similar fluctuations of around or below
1% when moving between trade assumptions, with the major difference, driven by the
change in policy support.
Figure 4 Excerpt from Table 23, value of output including Pillar I and Pillar II direct payments
FTA FTA WTO WTO ND
Tariffs ND
Tariffs
50%
reduction 100%
reduction 50%
reduction 100%
reduction 50%
reduction 100%
reduction
Individual Country Value of Output + Direct Payments (Pillar 1 + Pillar 2)
England -7.2% -14.5% -6.7% -13.3% -7.0% -14.2%
Wales -7.8% -16.0% -6.0% -12.4% -5.4% -12.3%
Scotland -11.0% -21.9% -10.1% -20.1% -9.6% -19.8%
Northern Ireland
-9.9% -19.9% -9.6% -19.3% -9.0% -18.3%
9 This measure include both Pillar I and Pillar II direct payments.

29
Table 6 Projected changes in beef sector due to changes in Pillar I direct payments: 30% decoupling assumption
FTA FTA WTO WTO ND Tariffs ND Tariffs
50% red. 100% red. 50% red. 100% red. 50% red. 100% red.
UK Beef cows -2.6% -4.7% -2.7% -4.9% -2.9% -5.0%
Dairy cows -0.3% -0.6% -0.3% -0.6% -0.3% -0.6%
Total Cattle -1.4% -2.5% -1.4% -2.6% -1.5% -2.6%
Production -1.2% -2.3% -1.3% -2.3% -1.3% -2.4%
Domestic use 0.0% -0.1% -0.2% -0.3% -0.1% -0.2%
Exports -0.6% -0.4% 0.0% 0.0% 0.0% 0.0%
Imports 2.2% 4.3% 2.0% 3.8% 2.3% 4.3%
Cattle price 0.1% 0.2% 0.2% 0.3% 0.1% 0.2%
England Beef cows -1.4% -2.9% -1.6% -3.1% -1.6% -3.2%
Dairy cows -0.3% -0.6% -0.3% -0.6% -0.3% -0.6%
Total Cattle -0.7% -1.5% -0.8% -1.6% -0.8% -1.6%
Production -0.6% -1.2% -0.7% -1.3% -0.7% -1.3%
Wales Beef cows -1.8% -3.8% -2.0% -3.9% -2.0% -4.0%
Dairy cows -0.2% -0.5% -0.2% -0.5% -0.3% -0.5%
Total Cattle -1.0% -1.9% -1.0% -2.0% -1.0% -2.0%
Production -0.8% -1.6% -0.8% -1.6% -0.8% -1.6%
Scotland Beef cows -4.2% -6.1% -4.2% -6.2% -4.7% -6.7%
Dairy cows -0.2% -0.5% -0.2% -0.5% -0.3% -0.5%
Total Cattle -3.0% -4.5% -3.0% -4.5% -3.3% -4.8%
Production -2.8% -4.4% -2.8% -4.4% -3.0% -4.6%
Northern Ireland Beef cows -3.9% -7.9% -4.0% -8.1% -4.1% -8.1%
Dairy cows -0.4% -0.8% -0.4% -0.8% -0.4% -0.8%
Total Cattle -2.1% -4.2% -2.2% -4.3% -2.2% -4.3%
Production -2.1% -4.1% -2.1% -4.2% -2.1% -4.2%

30
Table 7 Projected changes in beef sector due to changes in Pillar I direct payments: 60% decoupling assumption
FTA FTA WTO WTO ND Tariffs ND Tariffs
50% red. 100% red. 50% red. 100% red. 50% red. 100% red.
UK Beef cows -4.7% -9.0% -4.8% -9.0% -5.0% -9.2%
Dairy cows -0.6% -1.2% -0.6% -1.2% -0.6% -1.3%
Total Cattle -2.5% -4.8% -2.5% -4.8% -2.6% -4.9%
Production -2.2% -4.3% -2.3% -4.4% -2.3% -4.5%
Domestic use -0.1% -0.1% -0.5% -0.7% -0.4% -0.5%
Exports -0.2% 0.2% 0.0% 0.0% 0.0% 0.0%
Imports 4.3% 8.5% 3.4% 7.0% 3.7% 7.6%
Cattle price 0.2% 0.3% 0.3% 0.6% 0.2% 0.5%
England Beef cows -3.0% -6.2% -3.1% -6.3% -3.2% -6.3%
Dairy cows -0.6% -1.2% -0.6% -1.1% -0.6% -1.3%
Total Cattle -1.5% -3.1% -1.6% -3.1% -1.6% -3.2%
Production -1.2% -2.6% -1.3% -2.6% -1.3% -2.7%
Wales Beef cows -3.8% -7.8% -4.0% -7.9% -4.0% -7.9%
Dairy cows -0.5% -1.0% -0.5% -0.9% -0.5% -1.1%
Total Cattle -2.0% -4.0% -2.0% -4.0% -2.1% -4.1%
Production -1.6% -3.2% -1.6% -3.3% -1.7% -3.3%
Scotland Beef cows -6.0% -9.8% -6.0% -9.7% -6.5% -10.3%
Dairy cows -0.5% -1.0% -0.5% -1.0% -0.6% -1.1%
Total Cattle -4.3% -7.2% -4.3% -7.2% -4.6% -7.5%
Production -4.1% -7.1% -4.1% -7.1% -4.3% -7.4%
Northern Ireland Beef cows -8.0% -16.1% -8.1% -16.2% -8.1% -16.3%
Dairy cows -0.8% -1.7% -0.8% -1.6% -0.9% -1.7%
Total Cattle -4.3% -8.6% -4.3% -8.6% -4.4% -8.7%
Production -4.2% -8.4% -4.2% -8.5% -4.3% -8.5%

31
Table 8 Projected changes in beef sector due to changes in Pillar I direct payments: 100% decoupling assumption
FTA FTA WTO WTO ND Tariffs ND Tariffs
50% red. 100% red. 50% red. 100% red. 50% red. 100% red.
UK Beef cows -7.6% -14.7% -7.6% -14.7% -7.8% -14.8%
Dairy cows -1.0% -2.0% -1.0% -1.9% -1.1% -2.2%
Total Cattle -4.0% -7.9% -4.0% -7.8% -4.1% -8.0%
Production -3.6% -7.1% -3.6% -7.1% -3.7% -7.2%
Domestic use -0.2% -0.3% -0.6% -0.9% -0.7% -0.9%
Exports 0.6% 1.1% 0.0% 0.0% 0.0% 0.0%
Imports 7.1% 14.0% 5.7% 11.8% 5.5% 11.9%
Cattle price 0.2% 0.4% 0.5% 1.0% 0.3% 0.7%
England Beef cows -5.2% -10.5% -5.2% -10.5% -5.3% -10.6%
Dairy cows -1.0% -2.0% -0.9% -1.9% -1.0% -2.1%
Total Cattle -2.6% -5.3% -2.6% -5.2% -2.7% -5.3%
Production -2.2% -4.4% -2.2% -4.4% -2.2% -4.4%
Wales Beef cows -6.6% -13.3% -6.6% -13.2% -6.6% -13.3%
Dairy cows -0.8% -1.7% -0.8% -1.5% -0.9% -1.8%
Total Cattle -3.4% -6.8% -3.4% -6.7% -3.4% -6.9%
Production -2.7% -5.5% -2.7% -5.5% -2.8% -5.6%
Scotland Beef cows -8.5% -14.7% -8.4% -14.5% -8.9% -15.0%
Dairy cows -0.9% -1.8% -0.8% -1.6% -1.0% -1.9%
Total Cattle -6.2% -10.9% -6.1% -10.7% -6.4% -11.1%
Production -5.9% -10.8% -5.9% -10.6% -6.1% -10.9%
Northern Ireland Beef cows -13.5% -27.1% -13.6% -27.1% -13.6% -27.2%
Dairy cows -1.4% -2.8% -1.3% -2.7% -1.4% -2.9%
Total Cattle -7.2% -14.5% -7.2% -14.4% -7.3% -14.5%
Production -7.0% -14.2% -7.0% -14.1% -7.1% -14.2%

32
Table 9 Projected changes in sheep sector due to changes in Pillar I direct payments: 30% decoupling assumption
FTA FTA WTO WTO ND Tariffs ND Tariffs
50% red. 100% red. 50% red. 100% red. 50% red. 100% red.
UK Ewes -2.7% -5.1% -0.8% -1.4% -0.9% -1.6%
Total Sheep -2.6% -5.0% -0.9% -1.5% -0.8% -1.5%
Production -2.8% -5.5% -2.3% -3.5% -1.2% -1.8%
Domestic use -0.1% -0.2% -1.6% -2.5% -0.9% -1.3%
Exports -7.8% -15.0% -0.5% -0.8% -0.3% -0.4%
Imports 0.1% 0.2% 0.8% 1.3% 0.4% 0.7%
Sheepmeat price 0.4% 0.8% 4.3% 6.8% 2.3% 3.4%
England Ewes -1.9% -3.9% 0.3% 0.6% 0.3% 0.3%
Total Sheep -1.9% -3.8% 0.1% 0.3% 0.3% 0.4%
Production -2.1% -4.4% -1.5% -2.1% -0.1% 0.2%
Wales Ewes -1.9% -3.8% -0.3% -0.6% -0.3% -0.8%
Total Sheep -2.0% -4.1% -0.4% -0.8% -0.4% -0.9%
Production -2.0% -4.1% -1.1% -2.0% -0.6% -1.1%
Scotland Ewes -5.1% -8.8% -3.7% -5.9% -3.8% -6.1%
Total Sheep -4.6% -8.0% -3.5% -5.5% -3.4% -5.5%
Production -4.9% -8.6% -4.8% -7.7% -3.9% -6.1%
Northern Ireland Ewes -3.9% -7.9% -2.0% -4.1% -2.1% -4.4%
Total Sheep -3.9% -7.8% -2.1% -4.3% -2.1% -4.3%
Production -4.2% -8.5% -3.7% -6.7% -2.6% -4.7%

33
Table 10 Projected changes in sheep sector due to changes in Pillar I direct payments: 60% decoupling assumption
FTA FTA WTO WTO ND Tariffs ND Tariffs
50% red. 100% red. 50% red. 100% red. 50% red. 100% red.
UK Ewes -4.9% -9.6% -2.1% -3.3% -1.4% -2.7%
Total Sheep -4.8% -9.4% -2.4% -3.6% -1.5% -2.7%
Production -5.0% -10.0% -5.2% -7.3% -3.6% -4.5%
Domestic use -0.2% -0.4% -3.8% -5.3% -2.6% -3.3%
Exports -13.8% -27.6% -1.1% -1.6% -0.8% -1.0%
Imports 0.1% 0.3% 1.9% 2.8% 1.4% 1.7%
Sheepmeat price 0.7% 1.5% 10.1% 14.6% 7.1% 9.1%
England Ewes -3.8% -7.7% -0.4% 0.0% 0.5% 0.6%
Total Sheep -3.7% -7.4% -0.9% -0.6% 0.2% 0.5%
Production -3.9% -8.2% -4.4% -5.2% -2.3% -1.6%
Wales Ewes -3.7% -7.4% -1.3% -2.1% -0.7% -1.6%
Total Sheep -4.0% -8.0% -1.6% -2.5% -0.9% -1.9%
Production -3.9% -8.0% -3.2% -4.6% -2.0% -2.9%
Scotland Ewes -8.1% -14.9% -6.0% -10.1% -5.5% -9.7%
Total Sheep -7.4% -13.6% -5.8% -9.5% -5.2% -8.9%
Production -7.7% -14.4% -8.4% -13.2% -7.1% -11.0%
Northern Ireland Ewes -7.9% -15.9% -5.0% -9.4% -4.3% -8.8%
Total Sheep -7.8% -15.7% -5.3% -9.6% -4.4% -8.8%
Production -8.2% -16.6% -8.8% -14.4% -7.0% -11.2%

34
Table 11 Projected changes in sheep sector due to changes in Pillar I direct payments: 100% decoupling assumption
FTA FTA WTO WTO ND Tariffs ND Tariffs
50% red. 100% red. 50% red. 100% red. 50% red. 100% red.
UK Ewes -7.5% -15.2% -5.1% -6.9% -3.1% -5.2%
Total Sheep -7.4% -14.9% -5.4% -7.2% -3.5% -5.3%
Production -7.8% -15.9% -8.9% -11.7% -7.5% -8.6%
Domestic use -0.9% -1.2% -4.6% -6.6% -5.5% -6.3%
Exports -19.5% -42.1% -1.7% -2.3% -1.6% -1.8%
Imports 0.6% 0.9% 8.6% 9.8% 2.8% 3.3%
Sheepmeat price 3.2% 4.4% 12.8% 19.2% 15.2% 17.6%
England Ewes -5.9% -12.4% -3.0% -2.3% -0.5% -0.3%
Total Sheep -5.7% -12.0% -3.5% -2.9% -1.2% -0.6%
Production -6.3% -13.3% -8.0% -8.5% -6.3% -4.5%
Wales Ewes -5.8% -11.9% -3.8% -4.9% -2.0% -3.5%
Total Sheep -6.3% -12.9% -4.3% -5.7% -2.5% -4.1%
Production -6.2% -12.8% -6.1% -8.1% -4.7% -5.9%
Scotland Ewes -11.5% -22.1% -9.8% -16.0% -8.3% -14.8%
Total Sheep -10.5% -20.2% -9.3% -15.0% -8.0% -13.7%
Production -11.1% -21.4% -12.4% -19.3% -11.6% -17.1%
Northern Ireland Ewes -13.1% -26.6% -10.5% -17.8% -8.4% -16.0%
Total Sheep -12.9% -26.2% -10.8% -18.0% -8.8% -16.1%
Production -13.7% -28.0% -15.3% -24.1% -14.0% -20.7%

35
Table 12 Projected changes in pig and poultry sectors due to changes in Pillar I direct payments (UK-level): 30% decoupling assumption
FTA FTA WTO WTO ND Tariffs ND Tariffs
50% red. 100% red. 50% red. 100% red. 50% red. 100% red.
Pigs Sows 0.0% -0.1% -0.1% -0.2% 0.0% 0.0%
Total pigs 0.0% -0.1% -0.1% -0.2% 0.1% 0.1%
Production -0.1% -0.1% -0.1% -0.2% 0.1% 0.1%
Domestic use 0.0% 0.0% 0.1% 0.1% 0.0% 0.1%
Exports 0.0% 0.0% 0.0% 0.0% 0.0% 0.0%
Imports 0.0% 0.1% 0.3% 0.4% 0.0% 0.0%
Pigmeat price 0.1% 0.2% 0.1% 0.1% 0.0% 0.0%
Poultry Production 0.0% -0.1% 0.0% -0.1% 0.0% 0.0%
Domestic use 0.0% 0.0% 0.0% -0.1% 0.0% 0.0%
Exports 0.0% -0.1% 0.0% 0.0% 0.0% 0.0%
Imports 0.0% 0.0% 0.0% 0.0% 0.0% 0.0%
Poultry price 0.2% 0.3% 0.4% 0.6% 0.1% 0.1%
Table 13 Projected changes in pig and poultry sectors due to changes in Pillar I direct payments (UK-level): 60% decoupling assumption
FTA FTA WTO WTO ND Tariffs ND Tariffs
50% red. 100% red. 50% red. 100% red. 50% red. 100% red.
Pigs Sows -0.1% -0.2% -0.2% -0.4% 0.1% 0.1%
Total pigs -0.1% -0.2% -0.2% -0.4% 0.2% 0.3%
Production -0.1% -0.2% -0.2% -0.4% 0.2% 0.3%
Domestic use 0.0% -0.1% 0.2% 0.3% 0.1% 0.2%
Exports 0.0% 0.0% 0.0% 0.0% 0.0% 0.0%
Imports 0.1% 0.1% 0.6% 0.9% 0.0% 0.0%
Pigmeat price 0.2% 0.3% 0.1% 0.2% 0.1% 0.0%
Poultry Production -0.1% -0.1% -0.1% -0.1% 0.0% 0.0%
Domestic use 0.0% -0.1% 0.0% -0.1% 0.0% 0.0%
Exports -0.1% -0.2% 0.0% 0.0% 0.0% 0.0%
Imports 0.0% 0.0% 0.0% 0.0% 0.0% 0.0%
Poultry price 0.3% 0.6% 0.5% 1.0% 0.1% 0.2%

36
Table 14 Projected changes in pig and poultry sectors due to changes in Pillar I direct payments (UK-level): 100% decoupling assumption
FTA FTA WTO WTO ND Tariffs ND Tariffs
50% red. 100% red. 50% red. 100% red. 50% red. 100% red.
Pigs Sows -0.1% -0.3% -0.3% -0.6% 0.3% 0.2%
Total pigs -0.1% -0.3% -0.3% -0.7% 0.3% 0.4%
Production -0.2% -0.3% -0.4% -0.7% 0.3% 0.5%
Domestic use 0.0% -0.1% 0.2% 0.3% 0.2% 0.3%
Exports 0.0% 0.0% 0.0% 0.0% 0.0% 0.0%
Imports 0.1% 0.2% 0.8% 1.3% 0.1% 0.1%
Pigmeat price 0.3% 0.6% 0.2% 0.4% 0.3% 0.2%
Poultry Production -0.1% -0.2% -0.1% -0.2% 0.0% 0.0%
Domestic use -0.1% -0.1% -0.1% -0.2% 0.0% 0.0%
Exports -0.2% -0.3% 0.0% 0.0% 0.0% 0.0%
Imports 0.0% 0.0% 0.0% 0.0% 0.0% 0.0%
Poultry price 0.5% 1.0% 0.7% 1.5% 0.2% 0.4%

37
Table 15 Projected changes in dairy sector due to changes in Pillar I direct payments: 30% decoupling assumption
FTA FTA WTO WTO ND Tariffs ND Tariffs
50% red. 100% red. 50% red. 100% red. 50% red. 100% red.
UK Cow's milk
Production -0.3% -0.6% -0.3% -0.6% -0.3% -0.6%
Manufacturing use -0.5% -1.1% -0.5% -1.1% -0.6% -1.2%
Prices Producer milk price 0.1% 0.2% 0.1% 0.2% 0.0% 0.0%
Cheese price 0.1% 0.1% 0.0% 0.1% 0.0% 0.0%
Butter price 0.0% 0.1% 0.5% 1.0% 0.0% 0.1%
WMP price 0.0% 0.0% 0.0% 0.0% 0.0% 0.0%
SMP price 0.0% 0.0% 0.0% 0.0% 0.0% 0.0%
Cheese Production -0.5% -1.0% -0.6% -1.1% -0.6% -1.2%
Domestic use 0.0% 0.0% 0.0% 0.0% 0.0% 0.0%
Exports -0.3% -0.5% 0.0% 0.0% -0.4% -0.8%
Imports 0.3% 0.6% 0.4% 0.9% 0.3% 0.7%
Butter Production -0.3% -0.6% -0.2% -0.3% -0.4% -0.7%
Domestic use 0.0% 0.0% -0.1% -0.3% 0.0% 0.0%
Exports -0.7% -1.5% 0.0% 0.0% 0.0% 0.0%
Imports 0.0% 0.1% 0.0% 0.0% 0.6% 1.1%
England Milk production -0.3% -0.6% -0.3% -0.6% -0.3% -0.6%
Dairy cows -0.3% -0.6% -0.3% -0.6% -0.3% -0.6%
Milk price 0.1% 0.2% 0.1% 0.2% 0.0% 0.0%
Wales Milk production -0.2% -0.5% -0.2% -0.5% -0.3% -0.5%
Dairy cows -0.2% -0.5% -0.2% -0.5% -0.3% -0.5%
Milk price 0.1% 0.2% 0.1% 0.2% 0.0% 0.0%
Scotland Milk production -0.2% -0.5% -0.2% -0.5% -0.3% -0.6%
Dairy cows -0.2% -0.5% -0.2% -0.5% -0.3% -0.6%
Milk price 0.1% 0.2% 0.1% 0.2% 0.0% 0.0%
Northern Ireland Milk production -0.4% -0.8% -0.4% -0.8% -0.4% -0.9%
Dairy cows -0.4% -0.8% -0.4% -0.8% -0.4% -0.9%
Milk price 0.0% 0.1% 0.1% 0.1% 0.0% 0.0%

38
Table 16 Projected changes in dairy sector due to changes in Pillar I direct payments: 60% decoupling assumption
FTA FTA WTO WTO ND Tariffs ND Tariffs
50% red. 100% red. 50% red. 100% red. 50% red. 100% red.
UK Cow's milk
Production -0.6% -1.2% -0.6% -1.2% -0.6% -1.3%
Manufacturing use -1.1% -2.3% -1.1% -2.2% -1.2% -2.5%
Prices Producer milk price 0.2% 0.4% 0.2% 0.4% 0.0% 0.1%
Cheese price 0.1% 0.3% 0.1% 0.2% 0.0% 0.1%
Butter price 0.1% 0.2% 0.9% 1.9% 0.0% 0.1%
WMP price 0.0% 0.0% 0.0% 0.0% 0.0% 0.0%
SMP price 0.0% 0.0% 0.0% 0.0% 0.0% 0.0%
Cheese Production -1.0% -2.1% -1.1% -2.3% -1.2% -2.4%
Domestic use 0.0% 0.0% 0.0% 0.0% 0.0% 0.0%
Exports -0.5% -1.1% 0.0% 0.0% -0.8% -1.7%
Imports 0.6% 1.3% 0.9% 1.8% 0.7% 1.4%
Butter Production -0.6% -1.2% -0.3% -0.6% -0.7% -1.4%
Domestic use 0.0% -0.1% -0.2% -0.5% 0.0% 0.0%
Exports -1.5% -3.0% 0.0% 0.0% 0.0% 0.0%
Imports 0.1% 0.2% 0.0% 0.0% 1.1% 2.3%
England Milk production -0.6% -1.2% -0.6% -1.1% -0.6% -1.3%
Dairy cows -0.6% -1.2% -0.6% -1.1% -0.6% -1.3%
Milk price 0.2% 0.4% 0.2% 0.4% 0.0% 0.1%
Wales Milk production -0.5% -1.0% -0.5% -0.9% -0.5% -1.1%
Dairy cows -0.5% -1.0% -0.5% -0.9% -0.5% -1.1%
Milk price 0.2% 0.3% 0.2% 0.4% 0.0% 0.1%
Scotland Milk production -0.5% -1.0% -0.5% -1.0% -0.6% -1.1%
Dairy cows -0.5% -1.0% -0.5% -1.0% -0.6% -1.1%
Milk price 0.2% 0.3% 0.2% 0.4% 0.0% 0.1%
Northern Ireland Milk production -0.8% -1.7% -0.8% -1.6% -0.9% -1.7%
Dairy cows -0.8% -1.7% -0.8% -1.6% -0.9% -1.7%
Milk price 0.1% 0.2% 0.1% 0.3% 0.0% 0.1%

39
Table 17 Projected changes in dairy sector due to changes in Pillar I direct payments: 100% decoupling assumption
FTA FTA WTO WTO ND Tariffs ND Tariffs
50% red. 100% red. 50% red. 100% red. 50% red. 100% red.
UK Cow's milk
Production -1.0% -2.0% -1.0% -1.9% -1.1% -2.2%
Manufacturing use -1.9% -3.8% -1.8% -3.7% -2.0% -4.1%
Prices Producer milk price 0.3% 0.6% 0.3% 0.6% 0.1% 0.1%
Cheese price 0.2% 0.5% 0.1% 0.3% 0.1% 0.1%
Butter price 0.1% 0.3% 1.6% 3.3% 0.1% 0.2%
WMP price 0.0% 0.0% 0.0% 0.0% 0.0% 0.0%
SMP price 0.0% 0.0% 0.0% 0.0% 0.0% 0.0%
Cheese Production -1.8% -3.6% -1.9% -3.8% -2.0% -4.0%
Domestic use 0.0% -0.1% 0.0% 0.0% 0.0% 0.0%
Exports -0.9% -1.9% 0.0% 0.0% -1.4% -2.8%
Imports 1.0% 2.1% 1.5% 3.0% 1.1% 2.3%
Butter Production -1.0% -2.0% -0.5% -1.1% -1.2% -2.4%
Domestic use 0.0% -0.1% -0.4% -0.8% 0.0% -0.1%
Exports -2.5% -5.1% 0.0% 0.0% 0.0% 0.0%
Imports 0.2% 0.3% 0.0% 0.0% 1.9% 3.8%
England Milk production -1.0% -2.0% -0.9% -1.9% -1.0% -2.1%
Dairy cows -1.0% -2.0% -0.9% -1.9% -1.0% -2.1%
Milk price 0.3% 0.6% 0.3% 0.6% 0.1% 0.1%
Wales Milk production -0.8% -1.6% -0.8% -1.5% -0.9% -1.8%
Dairy cows -0.8% -1.7% -0.8% -1.5% -0.9% -1.8%
Milk price 0.3% 0.5% 0.4% 0.7% 0.1% 0.1%
Scotland Milk production -0.9% -1.7% -0.8% -1.6% -0.9% -1.9%
Dairy cows -0.9% -1.8% -0.8% -1.6% -1.0% -1.9%
Milk price 0.3% 0.5% 0.4% 0.7% 0.1% 0.1%
Northern Ireland Milk production -1.4% -2.8% -1.3% -2.7% -1.4% -2.9%
Dairy cows -1.4% -2.8% -1.3% -2.7% -1.4% -2.9%
Milk price 0.2% 0.3% 0.2% 0.4% 0.0% 0.1%

40
Table 18 Projected changes in crop sector due to changes in Pillar I direct payments: 30% decoupling assumption
FTA FTA WTO WTO ND Tariffs ND Tariffs
50% red. 100% red. 50% red. 100% red. 50% red. 100% red.
UK
Wheat
Production -0.4% -0.8% -0.3% -0.7% -0.5% -1.1%
Domestic use -0.2% -0.5% -0.3% -0.6% -0.2% -0.3%
Exports -2.3% -4.6% 0.0% 0.0% -1.4% -2.9%
Imports 0.4% 0.8% 0.1% 0.2% 3.6% 7.3%
Barley
Production -0.5% -0.9% -0.5% -1.1% -0.6% -1.2%
Domestic use -0.2% -0.4% -0.1% -0.1% -0.2% -0.3%
Exports -1.8% -3.7% -3.4% -6.8% -3.3% -6.6%
Imports 1.5% 3.0% 0.0% 0.0% 0.0% 0.0%
Area
Wheat -0.5% -0.9% -0.4% -0.8% -0.6% -1.2%
Barley -0.5% -1.1% -0.6% -1.2% -0.6% -1.3%
Prices
Wheat 0.8% 1.6% 1.2% 2.6% 0.3% 0.5%
Barley 0.8% 1.5% 0.2% 0.4% 0.2% 0.4%
England
Area
Wheat -0.5% -1.0% -0.4% -0.8% -0.6% -1.2%
Barley -0.5% -1.0% -0.5% -1.0% -0.6% -1.2%
Production
Wheat -0.4% -0.9% -0.4% -0.7% -0.6% -1.1%
Barley -0.4% -0.9% -0.5% -1.0% -0.6% -1.2%
Rapeseed -0.6% -1.2% -0.6% -1.2% -0.5% -1.0%
Wales
Area
Wheat -0.3% -0.7% -0.2% -0.5% -0.4% -0.8%
Barley -0.3% -0.7% -0.4% -0.8% -0.4% -0.8%
Production
Wheat -0.3% -0.5% -0.2% -0.3% -0.3% -0.7%
Barley -0.3% -0.6% -0.4% -0.7% -0.4% -0.7%
Scotland
Area
Wheat -0.1% -0.3% 0.0% 0.0% -0.2% -0.4%
Barley -0.6% -1.2% -0.7% -1.5% -0.7% -1.4%
Production
Wheat -0.1% -0.2% 0.1% 0.1% -0.2% -0.4%
Barley -0.5% -1.1% -0.7% -1.4% -0.7% -1.3%
Northern Ireland
Area

41
Wheat -1.0% -2.0% -1.0% -1.9% -1.1% -2.3%
Barley -1.0% -2.0% -1.1% -2.2% -1.1% -2.3%
Production
Wheat -0.9% -1.8% -0.9% -1.7% -1.1% -2.1%
Barley -0.9% -1.9% -1.0% -2.1% -1.1% -2.2%
Table 19 Projected changes in crop sector due to changes in Pillar I direct payments: 60% decoupling assumption
FTA FTA WTO WTO ND Tariffs ND Tariffs
50% red. 100% red. 50% red. 100% red. 50% red. 100% red.
UK
Wheat
Production -0.8% -1.6% -0.7% -1.3% -1.1% -2.2%
Domestic use -0.5% -0.9% -0.6% -1.2% -0.3% -0.6%
Exports -4.7% -9.5% 0.0% 0.0% -2.9% -5.8%
Imports 0.8% 1.7% 0.2% 0.4% 7.2% 14.6%
Barley
Production -0.9% -1.9% -1.1% -2.2% -1.2% -2.4%
Domestic use -0.4% -0.8% -0.1% -0.2% -0.3% -0.6%
Exports -3.8% -7.5% -6.7% -13.8% -6.6% -13.4%
Imports 3.0% 6.0% 0.0% 0.0% 0.0% 0.0%
Area
Wheat -0.9% -1.9% -0.8% -1.6% -1.2% -2.4%
Barley -1.1% -2.1% -1.2% -2.3% -1.3% -2.6%
Prices
Wheat 1.6% 3.2% 2.5% 5.1% 0.5% 1.0%
Barley 1.5% 3.1% 0.4% 0.8% 0.4% 0.8%
England
Area
Wheat -1.0% -2.0% -0.9% -1.7% -1.2% -2.5%
Barley -1.0% -2.0% -1.1% -2.1% -1.3% -2.5%
Production
Wheat -0.9% -1.7% -0.7% -1.4% -1.1% -2.3%
Barley -0.9% -1.8% -1.0% -1.9% -1.2% -2.3%
Rapeseed -1.2% -2.3% -1.2% -2.4% -1.0% -2.0%
Wales
Area
Wheat -0.7% -1.3% -0.5% -1.0% -0.8% -1.5%
Barley -0.7% -1.4% -0.8% -1.6% -0.8% -1.6%
Production
Wheat -0.5% -1.1% -0.4% -0.7% -0.7% -1.4%

42
Barley -0.6% -1.2% -0.7% -1.5% -0.7% -1.5%
Scotland
Area
Wheat -0.3% -0.5% 0.0% 0.0% -0.4% -0.8%
Barley -1.2% -2.4% -1.5% -3.0% -1.4% -2.8%
Production
Wheat -0.2% -0.3% 0.1% 0.3% -0.4% -0.7%
Barley -1.1% -2.1% -1.4% -2.8% -1.3% -2.6%
Northern Ireland
Area
Wheat -2.0% -4.1% -2.0% -3.9% -2.3% -4.6%
Barley -2.0% -4.1% -2.2% -4.4% -2.3% -4.6%
Production
Wheat -1.9% -3.7% -1.8% -3.5% -2.1% -4.3%
Barley -1.9% -3.8% -2.1% -4.2% -2.2% -4.4%
Table 20 Projected changes in crop sector due to changes in Pillar I direct payments: 100% decoupling assumption
FTA FTA WTO WTO ND Tariffs ND Tariffs
50% red. 100% red. 50% red. 100% red. 50% red. 100% red.
UK
Wheat
Production -1.4% -2.7% -1.1% -2.2% -1.8% -3.7%
Domestic use -0.8% -1.5% -1.0% -2.0% -0.5% -1.0%
Exports -8.1% -16.2% 0.0% 0.0% -4.8% -9.9%
Imports 1.4% 2.8% 0.3% 1.2% 11.8% 24.3%
Barley
Production -1.6% -3.1% -1.8% -3.6% -2.0% -4.1%
Domestic use -0.7% -1.4% -0.2% -0.4% -0.5% -1.0%
Exports -6.4% -12.7% -11.3% -23.2% -11.1% -22.6%
Imports 5.0% 10.0% 0.0% 0.0% 0.0% 0.0%
Area
Wheat -1.6% -3.1% -1.3% -2.7% -2.0% -4.0%
Barley -1.8% -3.5% -2.0% -3.9% -2.2% -4.3%
Prices
Wheat 2.6% 5.3% 4.1% 8.4% 0.8% 1.7%
Barley 2.5% 5.1% 0.6% 1.3% 0.6% 1.3%
England
Area
Wheat -1.6% -3.3% -1.4% -2.8% -2.1% -4.1%

43
Barley -1.7% -3.3% -1.7% -3.4% -2.1% -4.2%
Production
Wheat -1.4% -2.9% -1.2% -2.3% -1.9% -3.8%
Barley -1.5% -2.9% -1.6% -3.2% -1.9% -3.9%
Rapeseed -1.9% -3.9% -2.0% -3.9% -1.7% -3.3%
Wales
Area
Wheat -1.1% -2.2% -0.8% -1.6% -1.3% -2.6%
Barley -1.1% -2.2% -1.3% -2.6% -1.3% -2.6%
Production
Wheat -0.9% -1.8% -0.6% -1.2% -1.1% -2.3%
Barley -1.0% -1.9% -1.2% -2.5% -1.2% -2.5%
Scotland
Area
Wheat -0.4% -0.8% 0.0% 0.1% -0.7% -1.4%
Barley -2.0% -3.9% -2.5% -5.0% -2.3% -4.7%
Production
Wheat -0.3% -0.6% 0.2% 0.4% -0.6% -1.2%
Barley -1.8% -3.6% -2.4% -4.7% -2.2% -4.4%
Northern Ireland
Area
Wheat -3.4% -6.8% -3.3% -6.6% -3.8% -7.7%
Barley -3.4% -6.8% -3.7% -7.3% -3.9% -7.7%
Production
Wheat -3.1% -6.2% -3.0% -5.9% -3.6% -7.2%
Barley -3.2% -6.4% -3.5% -7.0% -3.7% -7.4%

44
Table 21 Projected changes in value of output due to changes in Pillar I direct payments: 30% decoupling assumption
FTA FTA WTO WTO ND Tariffs ND Tariffs
50% red.
100%
red. 50% red.
100%
red. 50% red.
100%
red.
UK
Wheat 0.4% 0.7% 0.9% 1.9% -0.3% -0.5%
Barley 0.3% 0.6% -0.3% -0.6% -0.4% -0.7%
Oats 0.2% 0.3% -0.3% -0.6% -0.3% -0.7%
Rapeseed -0.6% -1.2% -0.6% -1.2% -0.5% -1.0%
Total Crops 0.2% 0.4% 0.3% 0.7% -0.3% -0.7%
Cattle -1.1% -2.1% -1.2% -2.2% -0.9% -1.7%
Pig 0.0% 0.1% 0.0% -0.1% 0.1% 0.1%
Sheep -2.4% -4.6% 1.7% 2.6% 0.9% 1.3%
Poultry 0.1% 0.2% 0.4% 0.6% 0.1% 0.1%
Total Livestock -0.8% -1.5% -0.1% -0.4% -0.2% -0.4%
Milk -0.2% -0.4% -0.2% -0.5% -0.3% -0.5%
Total UK Agric. Value of
Output -0.4% -0.8% -0.1% -0.2% -0.2% -0.5%
Individual Country Total Agric . Value of Output
England -0.2% -0.3% 0.1% 0.2% -0.1% -0.2%
Wales -0.6% -1.3% 0.4% 0.5% 0.1% 0.0%
Scotland -1.5% -2.5% -0.9% -1.5% -1.0% -1.6%
Northern Ireland -0.9% -1.9% -0.7% -1.6% -0.6% -1.3%
Individual Country Value of Output + Direct Payments (Pillar 1 + Pillar 2)
England -6.9% -13.8% -6.6% -13.3% -6.8% -13.7%
Wales -6.8% -13.7% -6.0% -12.3% -6.3% -12.7%
Scotland -9.8% -19.2% -9.4% -18.5% -9.4% -18.6%
Northern Ireland -8.0% -16.1% -7.9% -15.8% -7.8% -15.6%

45
Table 22 Projected changes in value of output due to changes in Pillar I direct payments: 60% decoupling assumption
FTA FTA WTO WTO ND Tariffs ND Tariffs
50% red.
100%
red. 50% red.
100%
red. 50% red.
100%
red.
UK
Wheat 0.7% 1.5% 1.8% 3.7% -0.5% -1.0%
Barley 0.6% 1.1% -0.7% -1.3% -0.7% -1.4%
Oats 0.3% 0.7% -0.6% -1.3% -0.7% -1.4%
Rapeseed -1.2% -2.4% -1.2% -2.4% -1.0% -2.1%
Total Crops 0.4% 0.7% 0.7% 1.4% -0.7% -1.3%
Cattle -2.1% -4.1% -2.2% -4.1% -1.6% -3.1%
Pig 0.1% 0.1% -0.1% -0.2% 0.3% 0.3%
Sheep -4.3% -8.7% 4.1% 5.7% 2.8% 3.6%
Poultry 0.2% 0.5% 0.4% 0.9% 0.1% 0.2%
Total Livestock -1.5% -2.9% -0.2% -0.6% -0.1% -0.6%
Milk -0.4% -0.9% -0.5% -1.0% -0.5% -1.1%
Total UK Agric. Value of
Output -0.8% -1.6% -0.1% -0.3% -0.4% -0.9%
Individual Country Total Agric . Value of Output
England -0.3% -0.7% 0.2% 0.3% -0.2% -0.5%
Wales -1.3% -2.6% 0.9% 1.0% 0.5% 0.3%
Scotland -2.3% -4.1% -1.1% -2.2% -1.2% -2.4%
Northern Ireland -1.9% -3.8% -1.5% -3.2% -1.3% -2.7%
Individual Country Value of Output + Direct Payments (Pillar 1 + Pillar 2)
England -7.0% -14.1% -6.6% -13.2% -6.9% -13.9%
Wales -7.4% -14.8% -5.6% -11.9% -5.9% -12.5%
Scotland -10.4% -20.5% -9.5% -19.0% -9.6% -19.2%
Northern Ireland -8.8% -17.7% -8.6% -17.2% -8.3% -16.8%

46
Table 23 Projected changes in value of output due to changes in Pillar I direct payments: 100% decoupling assumption
FTA FTA WTO WTO ND Tariffs ND Tariffs
50% red.
100%
red. 50% red.
100%
red. 50% red.
100%
red.
UK
Wheat 1.2% 2.4% 2.9% 6.1% -0.9% -1.8%
Barley 0.9% 1.8% -1.1% -2.2% -1.2% -2.4%
Oats 0.6% 1.1% -1.1% -2.1% -1.2% -2.3%
Rapeseed -2.0% -4.0% -2.0% -4.1% -1.7% -3.5%
Total Crops 0.6% 1.2% 1.1% 2.3% -1.1% -2.2%
Cattle -3.4% -6.8% -3.4% -6.7% -2.6% -5.0%
Pig 0.2% 0.3% -0.2% -0.4% 0.6% 0.6%
Sheep -5.0% -12.4% 3.1% 5.3% 6.2% 7.1%
Poultry 0.4% 0.8% 0.6% 1.4% 0.2% 0.4%
Total Livestock -2.1% -4.5% -0.8% -1.7% 0.0% -0.8%
Milk -0.7% -1.5% -0.8% -1.6% -0.9% -1.8%
Total UK Agric. Value of
Output -1.1% -2.5% -0.4% -0.8% -0.4% -1.3%
Individual Country Total Agric . Value of Output
England -0.5% -1.1% 0.1% 0.3% -0.3% -0.8%
Wales -1.7% -4.0% 0.5% 0.4% 1.3% 0.6%
Scotland -3.0% -6.0% -1.9% -3.6% -1.3% -3.2%
Northern Ireland -3.1% -6.3% -2.8% -5.7% -2.1% -4.5%
Individual Country Value of Output + Direct Payments (Pillar 1 + Pillar 2)
England -7.2% -14.5% -6.7% -13.3% -7.0% -14.2%
Wales -7.8% -16.0% -6.0% -12.4% -5.4% -12.3%
Scotland -11.0% -21.9% -10.1% -20.1% -9.6% -19.8%
Northern Ireland -9.9% -19.9% -9.6% -19.3% -9.0% -18.3%

47
Provision of Coupled Payments
Beef Sector
The impact on the beef sector of allocating 20% of the Pillar I budget to coupled payments is
shown in Table 24. This set of scenarios is implemented on a country-by-country basis
(except for Wales). In England, beef cow numbers increase by 6% to 7.3% under the
different trade arrangements following the provision of 20% coupled payments. This
compares with 2.2% to 2.6% in Scotland and 3.5% in Northern Ireland. The impact is
greatest in England as the coupled beef payment is particularly high in this area as more
money is transferred to the beef sector from other sectors following the reallocation of
payments. The limited increase in Scotland is due to the existing coupled payments (10% of
the Pillar I budget), which results in a smaller increase in the coupled beef payment under
this scenario.
The projected impact of the provision of 20% coupled payments on UK beef production is
greatest under the England specific scenario. However, the positive impact is still small
(plus 1%). This partly reflects the negligible change in dairy cow numbers. Across all
scenarios the impact on the UK beef price is insignificant and hence, the provision of
coupled payments in individual countries has little knock-on impact on other countries in the
UK.
In contrast to the 20% coupled scenario, Scotland experiences the largest increase in beef
cow numbers under the 100% coupled scenario (Table 25). In contrast to England and
Northern Ireland, the proportion of coupled payments that is allocated to the beef sector
remains the same as the 20% scenario ( i.e. remains at 85%). The range of increase in beef
cow numbers in Scotland under the alternative trade arrangements is 16.9% to 19.5% under
this 100% coupled scenario. The WTO based scenario results in the largest number of
Scottish cows in absolute terms, which reach just below peak 1998 levels.
The more modest increases in beef cow numbers in England and Northern Ireland are
attributable to the spreading of the coupled budget across a wider range of sectors. Despite
this, the increase in UK-level beef production is comparable under the 100% England
scenario to the 100% Scotland coupled scenario. This not only reflects the fact that a
significant proportion of the beef herd is English (approximately 45%), but also the increase
in dairy cow numbers in England. As described below, the latter increase under this
scenario is due to the provision of a coupled milk payment. Note that under the 100%
coupled payments scenarios the Pillar I decoupled payments are simultaneously eliminated.
This has a significant offsetting impact, particularly in the beef and sheep sectors, which are
particularly dependent on these decoupled payments.
It is projected that the beef price falls slightly under the 100% England and 100% Scotland
FTA coupled scenarios (-1.8% and -1.9% respectively). The relatively modest price impact
reflects the fact that imports and exports are able to readjust easily due to the non-
application of tariffs on trade between the UK and EU under FTA trade arrangements. The
price impact is even lower under the WTO and No Deal trade arrangements as beef imports
from the rest of the world are competitive due to the change in trade arrangements under
these versions of the scenarios and hence imports readjust quickly following the changes in
the level of production which occurs in response to the provision of coupled payments.
Sheep Sector
Increasing the coupled budget to 20% leads to variable increases in ewe numbers in
England, Wales (indirect effects only as analysis of the introduction of coupled support
excluded Wales) and Scotland (Table 26). The impact on ewe numbers in individual
countries is again least in Scotland due to the existing provision of coupled payments. At the

48
UK-level, production increases the most under the English coupling scenario as just under
half of the UK herd is based in England. The impact on the sheepmeat price is negligible
under the FTA trade arrangements as UK exports to the EU are able to readjust. In contrast,
it is not possible for UK exports to the EU to increase under the WTO and No Deal trade
arrangements due to the presence of high tariffs and hence sheepmeat prices fall in
response to the higher levels of production.
Similar to the beef sector, the increase in ewe numbers is greatest in Scotland under the
100% coupling scenario (Table 27). This reflects the non-allocation of coupled payments to
the dairy and cereal sectors in Scotland. The provision of 100% coupled payments in
Northern Ireland has little impact on ewe numbers. Decoupled payments represent a
substantial proportion of sheep farmers’ income in Northern Ireland. As a result, the
provision of sheep coupled payments, comprising 9% of the coupled budget, is offset by the
full elimination of decoupled direct payments. The negative price impact is again greatest
under the WTO and No Deal trade arrangements as exports to the EU are prohibitive and
consequently available supplies on the domestic market increase due to the expansion in
production.
Pigs and Poultry Sectors
There is no provision of coupled payments for the pig and poultry sectors in both 20% and
100% coupled scenarios and hence the projected changes are negligible (Table 28 and
Table 29).
Dairy Sector
No coupled payments are provided for the dairy sector under the 20% coupled scenario ;
coupled payments for the dairy sector are only implemented in England and Northern Ireland
under the 100% coupled scenario. Under the latter scenario, milk production in England and
Northern Ireland increases by 4% to 5% (Table 32). The increase in milk production at the
UK-level is evident for the England 100% coupled scenarios. Under the WTO and No Deal
trade arrangements, imports adjust quickly to price changes and hence the commodity and
producer prices exhibit little change under these conditions.
Crop Sector
Similar to the dairy sector, coupled crop payments are only provided under the 100%
coupled scenarios and specifically, just in England and Northern Ireland. The provision of
coupled payments has a positive impact on crop areas in England and Northern Ireland
(Table 33). The impact is most marked in the latter but it should be borne in mind that the
base level is much lower in Northern Ireland. At the UK-level, the production impacts are
only notable under the 100% England scenarios. The projected impact on wheat and barley
prices under the 100% England scenarios vary depending on the underlying trade
arrangements. The wheat price declines are notable under the FTA and WTO scenarios,
but less so under the No Deal scenario. Under the No Deal scenario wheat imports decline
sharply as there are no tariffs applied to imports and consequently imports are sensitive to
changes in price. The barley price, on the other hand, exhibits a notable decline under the
FTA scenario, but not the WTO and No Deal scenarios. The lack of a price response under
WTO and No Deal is attributable to exports increasing under these trade arrangements.
Value of Output
The projected impact of the provision of coupled payments on value of output is shown in
Table 34 and Table 35. The simulated impacts of the 20% coupled scenarios on individual
country total agricultural value of output are insubstantial (all below 1%). The impacts are
more noticeable under the 100% coupled scenarios. Specifically, it is apparent that there
are knock-on impacts on value of output exceeding 1% on other territories in the UK when

49
England introduces 100% coupled payments, but not when this policy change is applied
elsewhere. This reflects the relative size of England within the UK context.
The projected changes in ‘Value of output plus direct payments’ are comparable to ‘Value of
output’ on a stand-alone basis as the total value of direct payments remains the same under
these scenarios; i.e. direct payments are reallocated between decoupled and coupled
payments, but there are no changes in the overall budget.

50
Table 24 Projected changes in beef sector due to provision of coupled payments: 20% coupled payments
FTA FTA FTA WTO WTO WTO ND ND ND
20%
Eng
20%
Scot 20% NI
20%
Eng
20%
Scot 20% NI
20%
Eng
20%
Scot 20% NI
UK
Beef cows 2.5% 0.5% 0.5% 2.7% 0.6% 0.6% 3.3% 0.7% 0.7%
Dairy cows -0.1% 0.0% 0.0% -0.1% 0.0% 0.0% -0.1% 0.0% 0.0%
Total Cattle 1.2% 0.2% 0.3% 1.3% 0.3% 0.3% 1.5% 0.3% 0.3%
Production 1.1% 0.3% 0.2% 1.0% 0.3% 0.2% 1.2% 0.3% 0.3%
Domestic use 0.1% 0.0% 0.0% 0.2% 0.0% 0.0% 0.2% 0.0% 0.0%
Exports 3.3% 0.9% 0.8% 0.0% 0.0% 0.0% 0.0% 0.0% 0.0%
Imports -1.0% -0.2% -0.2% -1.5% -0.5% -0.4% -1.9% -0.6% -0.5%
Cattle pr ice -0.2% 0.0% 0.0% -0.1% 0.0% 0.0% -0.1% 0.0% 0.0%
England
Beef cows 6.0% -0.1% -0.1% 6.0% 0.0% 0.0% 7.3% 0.0% 0.0%
Dairy cows -0.1% 0.0% 0.0% -0.1% 0.0% 0.0% -0.1% 0.0% 0.0%
Total Cattle 2.4% 0.0% 0.0% 2.3% 0.0% 0.0% 2.7% 0.0% 0.0%
Production 2.0% 0.0% 0.0% 1.9% 0.0% 0.0% 2.2% 0.0% 0.0%
Wales
Beef cows -0.4% -0.1% -0.1% -0.1% 0.0% 0.0% 0.0% 0.0% 0.0%
Dairy cows 0.0% 0.0% 0.0% 0.0% 0.0% 0.0% 0.0% 0.0% 0.0%
Total Cattle -0.1% 0.0% 0.0% 0.0% 0.0% 0.0% 0.0% 0.0% 0.0%
Production 0.0% 0.0% 0.0% 0.0% 0.0% 0.0% 0.0% 0.0% 0.0%
Scotland
Beef cows -0.4% 2.2% -0.1% 0.0% 2.2% 0.0% 0.0% 2.6% 0.0%
Dairy cows 0.0% -0.1% 0.0% 0.0% -0.1% 0.0% 0.0% -0.1% 0.0%
Total Cattle -0.2% 1.6% 0.0% 0.0% 1.5% 0.0% 0.0% 1.8% 0.0%
Production 0.0% 1.6% 0.0% 0.0% 1.5% 0.0% 0.0% 1.7% 0.0%
Northern Ireland
Beef cows -0.4% -0.1% 3.6% 0.0% 0.0% 3.5% 0.0% 0.0% 4.2%
Dairy cows 0.0% 0.0% -0.2% 0.0% 0.0% -0.2% 0.0% 0.0% -0.2%
Total Cattle -0.1% 0.0% 1.7% 0.0% 0.0% 1.7% 0.0% 0.0% 1.9%
Production 0.0% 0.0% 1.7% 0.0% 0.0% 1.6% 0.0% 0.0% 1.8%

51
Table 25 Projected changes in beef sector due to provision of coupled payments: 100% coupled payments
FTA FTA FTA WTO WTO WTO ND ND ND
100%
Eng
100%
Scot 100% NI
100%
Eng
100%
Scot 100% NI
100%
Eng
100%
Scot 100% NI
UK
Beef cows 1.9% 3.6% 0.9% 2.8% 4.4% 1.3% 3.6% 5.1% 1.6%
Dairy cows 2.4% 0.0% 0.7% 2.6% -0.1% 0.7% 2.9% -0.1% 0.8%
Total Cattle 2.3% 1.9% 0.8% 2.7% 2.1% 0.9% 3.2% 2.3% 1.1%
Production 2.2% 2.3% 0.9% 2.3% 2.2% 0.9% 2.7% 2.4% 1.1%
Domestic use 0.4% 0.5% 0.0% 0.2% 0.2% 0.0% 0.2% 0.1% 0.0%
Exports 3.8% 3.8% 3.0% 0.0% 0.0% 0.0% 0.0% 0.0% 0.0%
Imports -2.0% -2.1% -0.8% -4.1% -3.9% -1.8% -4.9% -4.5% -2.1%
Cattle pr ice -1.8% -1.9% -0.1% -0.3% -0.3% -0.1% -0.2% -0.2% -0.1%
England
Beef cows 5.4% -1.2% -0.5% 6.2% -0.1% -0.1% 7.8% -0.1% 0.0%
Dairy cows 4.3% 0.0% 0.0% 4.3% 0.0% -0.1% 4.8% 0.0% 0.0%
Total Cattle 4.8% -0.3% -0.2% 5.0% 0.0% 0.0% 5.8% 0.0% 0.0%
Production 4.3% 0.0% -0.1% 4.3% 0.0% 0.0% 4.9% 0.0% 0.0%
Wales
Beef cows -1.1% -1.0% -0.4% -0.1% -0.1% -0.1% -0.1% -0.1% 0.0%
Dairy cows -0.6% 0.0% 0.0% -0.2% 0.0% -0.1% -0.1% 0.0% 0.0%
Total Cattle -0.6% -0.3% -0.2% -0.1% 0.0% -0.1% 0.0% 0.0% 0.0%
Production -0.4% 0.0% -0.1% -0.1% 0.0% 0.0% 0.0% 0.0% 0.0%
Scotland
Beef cows -1.2% 16.9% -0.4% -0.1% 17.0% -0.1% -0.1% 19.5% 0.0%
Dairy cows -0.6% -0.5% 0.0% -0.2% -0.5% -0.1% -0.1% -0.6% 0.0%
Total Cattle -0.8% 12.2% -0.3% -0.1% 12.1% -0.1% 0.0% 13.7% 0.0%
Production -0.4% 12.7% -0.2% -0.1% 12.3% 0.0% 0.0% 13.5% 0.0%
Northern Ireland
Beef cows -1.2% -1.0% 7.9% -0.1% -0.1% 7.8% -0.1% -0.1% 9.8%
Dairy cows -0.3% 0.0% 4.7% -0.1% 0.0% 4.5% 0.0% 0.0% 4.8%
Total Cattle -0.6% -0.3% 6.3% -0.1% 0.0% 6.1% 0.0% 0.0% 7.1%
Production -0.3% 0.0% 6.6% -0.1% 0.0% 6.4% 0.0% 0.0% 7.3%
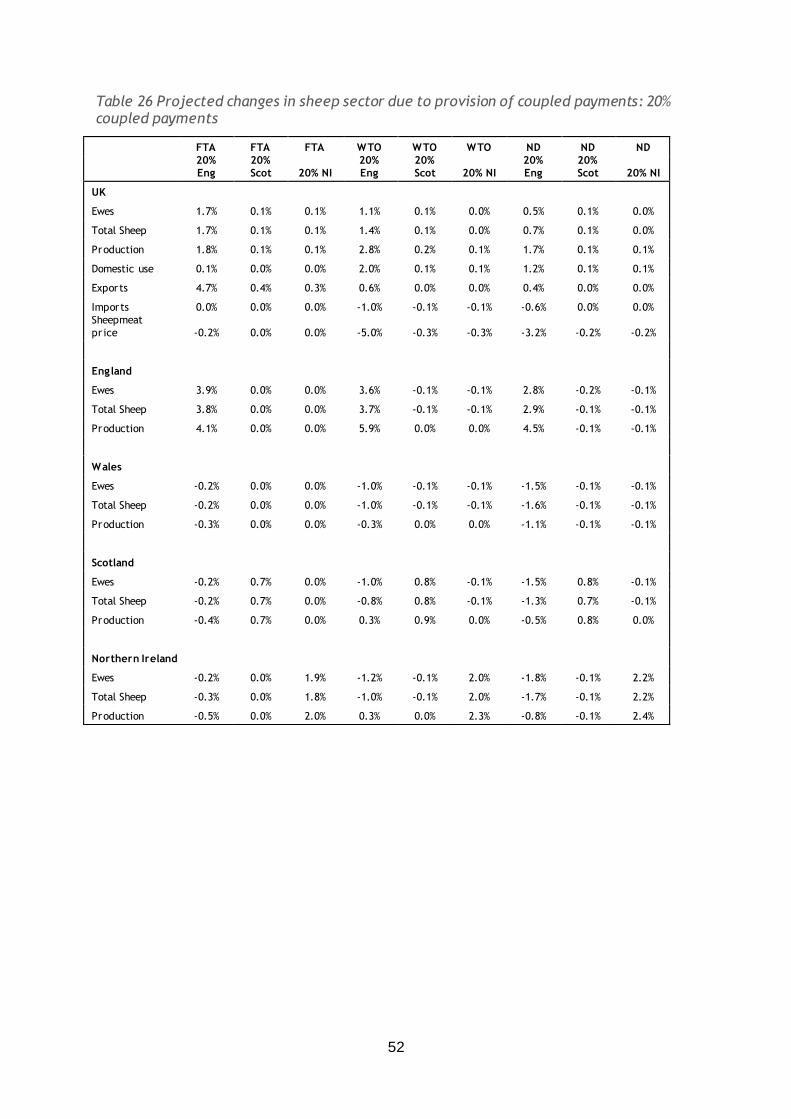
52
Table 26 Projected changes in sheep sector due to provision of coupled payments: 20% coupled payments
FTA FTA FTA WTO WTO WTO ND ND ND
20%
Eng
20%
Scot 20% NI
20%
Eng
20%
Scot 20% NI
20%
Eng
20%
Scot 20% NI
UK
Ewes 1.7% 0.1% 0.1% 1.1% 0.1% 0.0% 0.5% 0.1% 0.0%
Total Sheep 1.7% 0.1% 0.1% 1.4% 0.1% 0.0% 0.7% 0.1% 0.0%
Production 1.8% 0.1% 0.1% 2.8% 0.2% 0.1% 1.7% 0.1% 0.1%
Domestic use 0.1% 0.0% 0.0% 2.0% 0.1% 0.1% 1.2% 0.1% 0.1%
Exports 4.7% 0.4% 0.3% 0.6% 0.0% 0.0% 0.4% 0.0% 0.0%
Imports 0.0% 0.0% 0.0% -1.0% -0.1% -0.1% -0.6% 0.0% 0.0%
Sheepmeat
pr ice -0.2% 0.0% 0.0% -5.0% -0.3% -0.3% -3.2% -0.2% -0.2%
England Ewes 3.9% 0.0% 0.0% 3.6% -0.1% -0.1% 2.8% -0.2% -0.1%
Total Sheep 3.8% 0.0% 0.0% 3.7% -0.1% -0.1% 2.9% -0.1% -0.1%
Production 4.1% 0.0% 0.0% 5.9% 0.0% 0.0% 4.5% -0.1% -0.1%
Wales Ewes -0.2% 0.0% 0.0% -1.0% -0.1% -0.1% -1.5% -0.1% -0.1%
Total Sheep -0.2% 0.0% 0.0% -1.0% -0.1% -0.1% -1.6% -0.1% -0.1%
Production -0.3% 0.0% 0.0% -0.3% 0.0% 0.0% -1.1% -0.1% -0.1%
Scotland Ewes -0.2% 0.7% 0.0% -1.0% 0.8% -0.1% -1.5% 0.8% -0.1%
Total Sheep -0.2% 0.7% 0.0% -0.8% 0.8% -0.1% -1.3% 0.7% -0.1%
Production -0.4% 0.7% 0.0% 0.3% 0.9% 0.0% -0.5% 0.8% 0.0%
Northern Ireland Ewes -0.2% 0.0% 1.9% -1.2% -0.1% 2.0% -1.8% -0.1% 2.2%
Total Sheep -0.3% 0.0% 1.8% -1.0% -0.1% 2.0% -1.7% -0.1% 2.2%
Production -0.5% 0.0% 2.0% 0.3% 0.0% 2.3% -0.8% -0.1% 2.4%

53
Table 27 Projected changes in sheep sector due to provision of coupled payments: 100% coupled payments
FTA FTA FTA WTO WTO WTO ND ND ND
100%
Eng
100%
Scot 100% NI
100%
Eng
100%
Scot 100% NI
100%
Eng
100%
Scot 100% NI
UK
Ewes 1.2% 1.1% 0.0% 0.8% 0.7% 0.0% 0.4% 0.4% 0.0%
Total Sheep 1.2% 1.1% 0.0% 1.0% 0.8% 0.0% 0.6% 0.5% 0.0%
Production 1.4% 1.0% 0.0% 2.2% 1.4% 0.0% 1.4% 0.9% 0.0%
Domestic use 0.2% 0.2% 0.0% 1.6% 1.1% 0.0% 1.0% 0.7% 0.0%
Exports 3.2% 2.2% 0.0% 0.4% 0.3% 0.0% 0.3% 0.2% 0.0%
Imports 0.0% 0.0% 0.0% -0.8% -0.5% 0.0% -0.5% -0.3% 0.0%
Sheepmeat
pr ice -0.2% -0.1% 0.0% -3.9% -2.6% 0.0% -2.5% -1.7% -0.1%
England Ewes 2.7% -0.1% 0.0% 2.8% -0.9% 0.0% 2.3% -1.2% 0.0%
Total Sheep 2.6% -0.1% 0.0% 2.9% -0.8% 0.0% 2.3% -1.1% 0.0%
Production 3.0% -0.3% 0.0% 4.6% 0.0% 0.0% 3.6% -0.6% 0.0%
Wales Ewes -0.1% -0.1% 0.0% -0.9% -0.7% 0.0% -1.2% -0.9% 0.0%
Total Sheep -0.1% -0.1% 0.0% -0.9% -0.7% 0.0% -1.2% -0.9% 0.0%
Production -0.1% -0.2% 0.0% -0.3% -0.2% 0.0% -0.8% -0.6% 0.0%
Scotland Ewes -0.1% 5.9% 0.0% -0.9% 6.5% 0.0% -1.1% 6.3% 0.0%
Total Sheep -0.1% 5.3% 0.0% -0.7% 5.9% 0.0% -1.0% 5.8% 0.0%
Production -0.1% 5.8% 0.0% 0.2% 7.0% 0.0% -0.4% 6.7% 0.0%
Northern Ireland Ewes -0.1% -0.1% 0.0% -1.1% -0.8% 0.4% -1.4% -1.0% 0.9%
Total Sheep -0.1% -0.1% 0.1% -0.9% -0.7% 0.4% -1.3% -1.0% 0.9%
Production -0.2% -0.2% 0.1% 0.2% 0.1% 0.4% -0.6% -0.5% 1.0%

54
Table 28 Projected changes in pig and poultry sectors due to provision of coupled payments: 20% coupled payments (UK-level results)
FTA FTA FTA WTO WTO WTO ND ND ND
20% Eng
20% Scot 20% NI
20% Eng
20% Scot 20% NI
20% Eng
20% Scot 20% NI
Pigs
Sows 0.0% 0.0% 0.0% -0.1% 0.0% 0.0% -0.1% 0.0% 0.0%
Total pigs 0.0% 0.0% 0.0% -0.1% 0.0% 0.0% -0.1% 0.0% 0.0%
Production 0.0% 0.0% 0.0% -0.1% 0.0% 0.0% -0.1% 0.0% 0.0%
Domestic use 0.0% 0.0% 0.0% -0.1% 0.0% 0.0% -0.1% 0.0% 0.0%
Exports 0.0% 0.0% 0.0% 0.0% 0.0% 0.0% 0.0% 0.0% 0.0%
Imports 0.0% 0.0% 0.0% -0.1% 0.0% 0.0% 0.0% 0.0% 0.0% Pigmeat
pr ice 0.0% 0.0% 0.0% 0.0% 0.0% 0.0% 0.0% 0.0% 0.0%
Poultry
Production 0.0% 0.0% 0.0% 0.0% 0.0% 0.0% 0.0% 0.0% 0.0%
Domestic use 0.0% 0.0% 0.0% 0.0% 0.0% 0.0% 0.0% 0.0% 0.0%
Exports 0.0% 0.0% 0.0% 0.0% 0.0% 0.0% 0.0% 0.0% 0.0%
Imports 0.0% 0.0% 0.0% 0.0% 0.0% 0.0% 0.0% 0.0% 0.0%
Poultry pr ice 0.1% 0.0% 0.0% 0.2% 0.0% 0.0% 0.0% 0.0% 0.0%
Table 29 Projected changes in pig and poultry sectors due to provision of coupled payments: 100% coupled payments (UK-level results)
FTA FTA FTA WTO WTO WTO ND ND ND
100%
Eng
100%
Scot 100% NI
100%
Eng
100%
Scot 100% NI
100%
Eng
100%
Scot 100% NI
Pigs
Sows 0.2% 0.0% 0.0% 0.4% -0.1% 0.0% 0.0% 0.0% 0.0%
Total pigs 0.3% 0.0% 0.0% 0.5% -0.1% 0.0% 0.0% -0.1% 0.0%
Production 0.3% 0.1% 0.0% 0.4% -0.1% 0.0% 0.0% -0.1% 0.0%
Domestic use 0.1% 0.1% 0.0% -0.1% 0.0% 0.0% 0.0% 0.0% 0.0%
Exports 0.0% 0.0% 0.0% 0.0% 0.0% 0.0% 0.0% 0.0% 0.0%
Imports -0.1% 0.0% 0.0% -0.6% 0.0% 0.1% 0.0% 0.0% 0.0%
Pigmeat pr ice -0.2% 0.0% 0.0% -0.1% 0.0% 0.0% -0.1% 0.0% 0.0%
Poultry
Production 0.1% 0.0% 0.0% 0.4% 0.0% 0.0% 0.0% 0.0% 0.0%
Domestic use 0.1% 0.0% 0.0% 0.0% 0.0% 0.0% 0.0% 0.0% 0.0%
Exports 0.2% 0.0% 0.0% 0.0% 0.0% 0.0% 0.0% 0.0% 0.0%
Imports 0.0% 0.0% 0.0% -1.3% 0.0% 0.0% 0.0% 0.0% 0.0%
Poultry pr ice -0.5% 0.1% 0.0% -0.4% 0.1% 0.1% -0.2% 0.0% 0.0%

55
Table 30 Projected changes in dairy sector due to provision of coupled payments: 20% coupled payments
FTA FTA FTA WTO WTO WTO ND ND ND
20%
Eng
20%
Scot 20% NI
20%
Eng
20%
Scot 20% NI
20%
Eng
20%
Scot 20% NI
UK
Cow's milk Production -0.1% 0.0% 0.0% -0.1% 0.0% 0.0% -0.1% 0.0% 0.0%
Manufactur ing use -0.1% 0.0% 0.0% -0.1% 0.0% 0.0% -0.2% 0.0% -0.1%
Prices
Producer milk pr ice 0.0% 0.0% 0.0% 0.0% 0.0% 0.0% 0.0% 0.0% 0.0%
Cheese pr ice 0.0% 0.0% 0.0% 0.0% 0.0% 0.0% 0.0% 0.0% 0.0%
Butter pr ice 0.0% 0.0% 0.0% 0.1% 0.0% 0.1% 0.0% 0.0% 0.0%
WMP price 0.0% 0.0% 0.0% 0.0% 0.0% 0.0% 0.0% 0.0% 0.0%
SMP pr ice 0.0% 0.0% 0.0% 0.0% 0.0% 0.0% 0.0% 0.0% 0.0%
Cheese
Production -0.1% 0.0% 0.0% -0.2% 0.0% 0.0% -0.2% 0.0% 0.0%
Domestic use 0.0% 0.0% 0.0% 0.0% 0.0% 0.0% 0.0% 0.0% 0.0%
Exports -0.1% 0.0% 0.0% 0.0% 0.0% 0.0% -0.1% 0.0% 0.0%
Imports 0.1% 0.0% 0.0% 0.1% 0.0% 0.0% 0.1% 0.0% 0.0%
Butter
Production -0.1% 0.0% 0.0% 0.0% 0.0% 0.0% -0.1% 0.0% 0.0%
Domestic use 0.0% 0.0% 0.0% 0.0% 0.0% 0.0% 0.0% 0.0% 0.0%
Exports -0.2% 0.0% -0.1% 0.0% 0.0% 0.0% 0.0% 0.0% 0.0%
Imports 0.0% 0.0% 0.0% 0.0% 0.0% 0.0% 0.1% 0.0% 0.1%
England
Milk production -0.1% 0.0% 0.0% -0.1% 0.0% 0.0% -0.1% 0.0% 0.0%
Dairy cows -0.1% 0.0% 0.0% -0.1% 0.0% 0.0% -0.1% 0.0% 0.0%
Milk pr ice 0.0% 0.0% 0.0% 0.0% 0.0% 0.0% 0.0% 0.0% 0.0%
Wales
Milk production 0.0% 0.0% 0.0% 0.0% 0.0% 0.0% 0.0% 0.0% 0.0%
Dairy cows 0.0% 0.0% 0.0% 0.0% 0.0% 0.0% 0.0% 0.0% 0.0%
Milk pr ice 0.0% 0.0% 0.0% 0.0% 0.0% 0.0% 0.0% 0.0% 0.0%
Scotland
Milk production 0.0% -0.1% 0.0% 0.0% -0.1% 0.0% 0.0% -0.1% 0.0%
Dairy cows 0.0% -0.1% 0.0% 0.0% -0.1% 0.0% 0.0% -0.1% 0.0%
Milk pr ice 0.0% 0.0% 0.0% 0.0% 0.0% 0.0% 0.0% 0.0% 0.0%
Northern Ireland
Milk production 0.0% 0.0% -0.2% 0.0% 0.0% -0.2% 0.0% 0.0% -0.2%
Dairy cows 0.0% 0.0% -0.2% 0.0% 0.0% -0.2% 0.0% 0.0% -0.2%
Milk pr ice 0.0% 0.0% 0.0% 0.0% 0.0% 0.0% 0.0% 0.0% 0.0%

56
Table 31 Projected changes in dairy sector due to provision of coupled payments: 100% coupled payments
FTA FTA FTA WTO WTO WTO ND ND ND
100%
Eng
100%
Scot 100% NI
100%
Eng
100%
Scot 100% NI
100%
Eng
100%
Scot 100% NI
UK
Cow's milk Production 2.4% -0.1% 0.7% 2.6% -0.1% 0.6% 2.9% -0.1% 0.7%
Manufactur ing use 4.3% -0.1% 1.3% 4.9% -0.1% 1.2% 5.6% -0.1% 1.4%
Prices
Producer milk pr ice -2.0% 0.0% -0.1% -0.8% 0.0% -0.3% -0.2% 0.0% 0.0%
Cheese pr ice -1.7% 0.0% 0.0% -0.4% 0.0% 0.0% -0.2% 0.0% 0.0%
Butter pr ice -1.0% 0.0% -0.2% -3.4% 0.0% -1.9% -0.2% 0.0% -0.1%
WMP price 0.0% 0.0% 0.0% 0.0% 0.0% 0.0% 0.0% 0.0% 0.0%
SMP pr ice 0.0% 0.0% 0.0% 0.0% 0.0% 0.0% 0.0% 0.0% 0.0%
Cheese
Production 4.7% -0.1% 0.3% 5.6% -0.1% 0.6% 6.1% -0.1% 0.7%
Domestic use 0.3% 0.0% 0.0% 0.1% 0.0% 0.0% 0.0% 0.0% 0.0%
Exports 0.7% -0.1% 0.2% 0.0% 0.0% 0.0% 4.2% -0.1% 0.5%
Imports -3.1% 0.1% -0.2% -4.4% 0.1% -0.5% -3.5% 0.1% -0.4%
Butter
Production 2.1% 0.0% 0.8% 1.2% 0.0% 0.6% 2.8% 0.0% 1.4%
Domestic use 0.3% 0.0% 0.1% 0.9% 0.0% 0.5% 0.1% 0.0% 0.0%
Exports 2.4% -0.1% 1.7% 0.0% 0.0% 0.0% 0.0% 0.0% 0.0%
Imports -1.4% 0.0% -0.3% 0.0% 0.0% 0.0% -4.5% 0.1% -2.2%
England
Milk production 4.2% 0.0% 0.0% 4.3% 0.0% -0.1% 4.8% 0.0% 0.0%
Dairy cows 4.3% 0.0% 0.0% 4.3% 0.0% -0.1% 4.8% 0.0% 0.0%
Milk pr ice -2.0% 0.0% -0.1% -0.8% 0.0% -0.3% -0.2% 0.0% 0.0%
Wales
Milk production -0.7% 0.0% 0.0% -0.2% 0.0% -0.1% -0.1% 0.0% 0.0%
Dairy cows -0.6% 0.0% 0.0% -0.2% 0.0% -0.1% -0.1% 0.0% 0.0%
Milk pr ice -1.9% 0.0% -0.1% -0.9% 0.0% -0.3% -0.2% 0.0% 0.0%
Scotland
Milk production -0.7% -0.5% 0.0% -0.2% -0.5% -0.1% -0.1% -0.6% 0.0%
Dairy cows -0.6% -0.5% 0.0% -0.2% -0.5% -0.1% -0.1% -0.6% 0.0%
Milk pr ice -1.9% 0.0% -0.1% -0.9% 0.0% -0.3% -0.2% 0.0% 0.0%
Northern Ireland
Milk production -0.3% 0.0% 4.7% -0.1% 0.0% 4.5% 0.0% 0.0% 4.8%
Dairy cows -0.3% 0.0% 4.7% -0.1% 0.0% 4.5% 0.0% 0.0% 4.8%
Milk pr ice -1.2% 0.0% 0.0% -0.5% 0.0% -0.2% -0.1% 0.0% 0.0%

57
Table 32 Projected changes in crop sector due to provision of coupled payments: 20% coupled payments
FTA FTA FTA WTO WTO WTO ND ND ND
20%
Eng
20%
Scot 20% NI
20%
Eng
20%
Scot 20% NI
20%
Eng
20%
Scot 20% NI
UK
Wheat
Production -0.1% 0.0% 0.0% -0.1% 0.0% 0.0% -0.2% 0.0% 0.0%
Domestic use 0.0% 0.0% 0.0% 0.0% 0.0% 0.0% 0.0% 0.0% 0.0%
Exports -1.5% -0.1% 0.0% 0.0% 0.0% 0.0% -0.8% -0.1% 0.0%
Imports 0.3% 0.0% 0.0% 0.1% 0.0% 0.0% 2.1% 0.1% 0.1%
Barley Production -0.1% 0.0% 0.0% -0.1% 0.0% 0.0% -0.2% 0.0% 0.0%
Domestic use 0.1% 0.0% 0.0% 0.1% 0.0% 0.0% 0.1% 0.0% 0.0%
Exports -0.9% -0.2% 0.0% -1.7% -0.3% -0.1% -1.5% -0.3% -0.1%
Imports 0.8% 0.2% 0.0% 0.0% 0.0% 0.0% 0.0% 0.0% 0.0%
Area
Wheat -0.1% 0.0% 0.0% -0.1% 0.0% 0.0% -0.2% 0.0% 0.0%
Barley -0.1% 0.0% 0.0% -0.1% 0.0% 0.0% -0.2% 0.0% 0.0%
Prices Wheat 0.5% 0.0% 0.0% 0.8% 0.0% 0.0% 0.2% 0.0% 0.0%
Barley 0.4% 0.1% 0.0% 0.1% 0.0% 0.0% 0.1% 0.0% 0.0%
England
Area
Wheat -0.2% 0.0% 0.0% -0.1% 0.0% 0.0% -0.2% 0.0% 0.0%
Barley -0.2% 0.0% 0.0% -0.2% 0.0% 0.0% -0.2% 0.0% 0.0%
Production Wheat -0.1% 0.0% 0.0% -0.1% 0.0% 0.0% -0.2% 0.0% 0.0%
Barley -0.2% 0.0% 0.0% -0.2% 0.0% 0.0% -0.2% 0.0% 0.0%
Rapeseed -0.3% 0.0% 0.0% -0.3% 0.0% 0.0% -0.2% 0.0% 0.0%
Wales
Area
Wheat 0.1% 0.0% 0.0% 0.1% 0.0% 0.0% 0.0% 0.0% 0.0%
Barley 0.0% 0.0% 0.0% 0.0% 0.0% 0.0% 0.0% 0.0% 0.0%
Production Wheat 0.1% 0.0% 0.0% 0.1% 0.0% 0.0% 0.0% 0.0% 0.0%
Barley 0.0% 0.0% 0.0% 0.0% 0.0% 0.0% 0.0% 0.0% 0.0%
Scotland
Area
Wheat 0.1% -0.1% 0.0% 0.2% 0.0% 0.0% 0.0% -0.1% 0.0%
Barley 0.1% -0.1% 0.0% 0.0% -0.2% 0.0% 0.0% -0.2% 0.0%
Production Wheat 0.1% 0.0% 0.0% 0.2% 0.0% 0.0% 0.0% -0.1% 0.0%
Barley 0.1% -0.1% 0.0% 0.0% -0.2% 0.0% 0.0% -0.1% 0.0%

58
Northern Ireland
Area
Wheat 0.1% -0.2% -0.1% 0.1% -0.2% -0.1% 0.0% -0.2% -0.1%
Barley 0.1% -0.2% -0.1% 0.0% -0.2% -0.1% 0.0% -0.2% -0.1%
Production Wheat 0.1% -0.2% -0.1% 0.2% -0.2% -0.1% 0.0% -0.2% -0.1%
Barley 0.1% -0.2% -0.1% 0.0% -0.2% -0.1% 0.0% -0.2% -0.1%
Table 33 Projected changes in crop sector due to provision of coupled payments: 100% coupled payments
FTA FTA FTA WTO WTO WTO ND ND ND
100%
Eng
100%
Scot 100% NI
100%
Eng
100%
Scot 100% NI
100%
Eng
100%
Scot 100% NI
UK Wheat Production 1.8% 0.0% 0.1% 1.4% 0.1% 0.1% 2.3% 0.0% 0.1%
Domestic use 1.0% 0.1% 0.1% 1.3% 0.1% 0.1% 0.8% 0.1% 0.2%
Exports 9.7% -0.8% -0.7% 0.0% 0.0% 0.0% 5.5% -0.4% -0.5%
Imports -1.8% 0.1% 0.1% -0.4% 0.0% 0.0% -14.0% 1.1% 1.2%
Barley
Production 1.5% -0.2% 0.2% 1.6% -0.3% 0.2% 1.9% -0.3% 0.2%
Domestic use 0.7% 0.1% 0.2% 0.4% 0.1% 0.2% 0.8% 0.1% 0.2%
Exports 5.2% -1.7% 0.0% 8.6% -2.9% 0.1% 8.1% -2.9% 0.0%
Imports -9.8% 1.4% 0.0% 0.0% 0.0% 0.0% 0.0% 0.0% 0.0%
Area Wheat 2.0% 0.0% 0.1% 1.7% 0.0% 0.1% 2.5% 0.0% 0.1%
Barley 1.6% -0.3% 0.2% 1.7% -0.3% 0.2% 2.0% -0.4% 0.2%
Prices
Wheat -3.3% 0.3% 0.2% -4.7% 0.4% 0.3% -1.0% 0.1% 0.1%
Barley -2.0% 0.7% 0.0% -0.5% 0.2% 0.0% -0.5% 0.2% 0.0%
England Area Wheat 2.2% 0.1% 0.0% 1.9% 0.1% 0.1% 2.8% 0.0% 0.0%
Barley 2.4% 0.1% 0.0% 2.4% 0.1% 0.0% 2.8% 0.0% 0.0%
Production
Wheat 1.9% 0.1% 0.1% 1.6% 0.1% 0.1% 2.5% 0.0% 0.0%
Barley 2.2% 0.1% 0.0% 2.2% 0.1% 0.0% 2.6% 0.0% 0.0%
Rapeseed 2.7% -0.1% 0.0% 2.8% 0.0% 0.0% 2.5% 0.0% 0.0%
Wales Area Wheat -0.4% 0.0% 0.0% -0.7% 0.0% 0.0% -0.1% 0.0% 0.0%
Barley -0.2% 0.1% 0.0% 0.0% 0.0% 0.0% 0.0% 0.0% 0.0%
Production

59
Wheat -0.5% 0.0% 0.0% -0.8% 0.1% 0.1% -0.2% 0.0% 0.0%
Barley -0.2% 0.1% 0.0% 0.0% 0.0% 0.0% -0.1% 0.0% 0.0%
Scotland Area Wheat -0.6% -0.5% 0.0% -1.0% -0.4% 0.1% -0.2% -0.5% 0.0%
Barley -0.2% -1.3% 0.0% 0.1% -1.4% 0.0% -0.1% -1.4% 0.0%
Production
Wheat -0.7% -0.4% 0.1% -1.1% -0.4% 0.1% -0.2% -0.5% 0.0%
Barley -0.3% -1.2% 0.0% 0.1% -1.4% 0.0% -0.1% -1.3% 0.0%
Northern
Ireland Area Wheat -0.6% -1.7% 11.8% -0.9% -1.8% 11.9% -0.2% -1.8% 12.1%
Barley -0.5% -1.7% 11.8% -0.3% -1.8% 11.8% -0.1% -1.8% 12.1%
Production
Wheat -0.7% -1.6% 11.1% -1.0% -1.6% 11.2% -0.2% -1.7% 11.3%
Barley -0.5% -1.6% 11.3% -0.3% -1.7% 11.3% -0.1% -1.7% 11.5%

60
Table 34 Projected changes in value of output due to provision of coupled payments: 20% coupled payments
FTA FTA FTA WTO WTO WTO ND ND ND
20% Eng
20% Scot 20% NI
20% Eng
20% Scot 20% NI
20% Eng
20% Scot 20% NI
UK
Wheat
Barley 0.3% 0.1% 0.0% 0.0% 0.0% 0.0% -0.1% 0.0% 0.0%
Oats 0.2% 0.1% 0.0% -0.1% 0.0% 0.0% -0.1% 0.0% 0.0%
Rapeseed -0.2% 0.0% 0.0% -0.2% 0.0% 0.0% -0.2% 0.0% 0.0%
Total Crops 0.3% 0.0% 0.0% 0.4% 0.0% 0.0% -0.1% 0.0% 0.0%
Cattle 0.8% 0.3% 0.2% 1.0% 0.2% 0.2% 0.8% 0.2% 0.2%
Pig 0.0% 0.0% 0.0% -0.1% 0.0% 0.0% -0.1% 0.0% 0.0%
Sheep 1.5% 0.1% 0.1% -2.0% -0.1% -0.1% -1.3% -0.1% -0.1%
Poultry 0.1% 0.0% 0.0% 0.2% 0.0% 0.0% 0.0% 0.0% 0.0%
Total Livestock 0.6% 0.1% 0.1% 0.1% 0.1% 0.1% 0.1% 0.1% 0.1%
Milk 0.0% 0.0% 0.0% -0.1% 0.0% 0.0% -0.1% 0.0% 0.0%
Total UK Agric. Value of
Output 0.4% 0.1% 0.1% 0.1% 0.0% 0.0% 0.0% 0.0% 0.0%
Individual Country Total Agric. Value of Output
England 0.6% 0.0% 0.0% 0.5% 0.0% 0.0% 0.3% 0.0% 0.0%
Wales -0.2% 0.0% 0.0% -1.1% -0.1% -0.1% -0.9% -0.1% -0.1%
Scotland -0.1% 0.6% 0.0% -0.6% 0.5% 0.0% -0.5% 0.5% 0.0%
Northern Ireland -0.1% 0.0% 0.6% -0.2% 0.0% 0.6% -0.2% 0.0% 0.5%
Individual Country Value of Output + Direct Payments (Pillar 1 + Pillar 2)
England 0.5% 0.0% 0.0% 0.4% 0.0% 0.0% 0.2% 0.0% 0.0%
Wales -0.1% 0.0% 0.0% -0.9% -0.1% -0.1% -0.7% -0.1% 0.0%
Scotland -0.1% 0.4% 0.0% -0.4% 0.4% 0.0% -0.4% 0.3% 0.0%
Northern Ireland -0.1% 0.0% 0.5% -0.2% 0.0% 0.5% -0.2% 0.0% 0.4%

61
Table 35 Projected changes in value of output due to provision of coupled payments: 100% coupled payments
FTA FTA FTA WTO WTO WTO ND ND ND
100% Eng
100% Scot
100% NI
100% Eng
100% Scot
100% NI
100% Eng
100% Scot
100% NI
UK
Wheat
Barley -0.5% 0.5% 0.2% 1.0% -0.1% 0.2% 1.2% -0.1% 0.2%
Oats 0.1% 0.5% 0.2% 1.3% 0.0% 0.2% 1.5% 0.0% 0.2%
Rapeseed 2.6% -0.2% 0.0% 2.6% -0.2% 0.0% 2.3% -0.1% 0.0%
Total Crops -0.6% 0.3% 0.2% -1.2% 0.2% 0.3% 1.4% 0.0% 0.1%
Cattle 0.4% 0.3% 0.8% 2.2% 2.0% 0.8% 1.9% 1.6% 0.7%
Pig 0.0% 0.1% 0.0% 0.3% -0.1% 0.0% -0.1% -0.1% 0.0%
Sheep 1.1% 0.9% 0.0% -1.6% -1.0% 0.0% -1.0% -0.7% 0.0%
Poultry -0.4% 0.1% 0.0% 0.1% 0.1% 0.1% -0.2% 0.0% 0.0%
Total Livestock 0.2% 0.3% 0.4% 0.7% 0.7% 0.4% 0.5% 0.6% 0.3%
Milk 0.6% 0.0% 0.5% 2.4% 0.0% 0.3% 2.4% 0.0% 0.6%
Total UK Agric. Value of
Output 0.2% 0.2% 0.4% 0.7% 0.4% 0.3% 1.2% 0.3% 0.3%
Individual Country Total Agric. Value of Output
England 1.0% -0.2% 0.0% 1.5% -0.1% 0.0% 2.1% -0.1% 0.0%
Wales -1.7% -0.6% -0.1% -1.5% -0.6% -0.2% -0.9% -0.5% -0.1%
Scotland -1.8% 4.0% -0.1% -1.2% 4.3% -0.1% -0.6% 3.6% 0.0%
Northern Ireland -1.3% -0.6% 3.9% -0.5% -0.2% 4.1% -0.3% -0.2% 3.5%
Individual Country Value of Output + Direct
Payments (Pillar 1 + Pillar 2)
England 0.8% -0.2% 0.0% 1.3% -0.1% 0.0% 1.7% -0.1% 0.0%
Wales -1.4% -0.5% -0.1% -1.2% -0.5% -0.2% -0.7% -0.4% 0.0%
Scotland -1.3% 3.0% -0.1% -0.9% 3.3% -0.1% -0.5% 2.7% 0.0%
Northern Ireland -1.1% -0.5% 3.3% -0.5% -0.2% 3.4% -0.3% -0.1% 2.9%

62
Discussion This study analyses the market impacts of changes in Pillar I supports as part of potential
major reforms to agricultural policy following UK exit from the EU. The analysis captures
different potential post-Brexit trade arrangements to determine the extent to which these
arrangements impact the market response of changes in Pillar I support. Three different
trade arrangements are considered, namely FTA trade arrangements with zero tariffs
between the UK & the EU and two hard Brexit scenarios, covering WTO default tariffs and
2019 No Deal Tariff schedule trade arrangements.
The results highlight that the market impact of changes in Pillar I support varies across
individual sectors. In particular, following the reduction of Pillar I payments the price
response is variable across different trade arrangements in the sheep sector but less so in
the beef sector. In the sheep sector, the projected increase in the sheepmeat price is
substantially lower under the FTA version of the scenario compared to the WTO and No
Deal Tariff versions. This reflects differences in the potential of sheepmeat exports to adjust
under the different trade arrangements. Under the FTA version of this scenario, UK
sheepmeat exports decline, thereby offsetting the decline in production, which limits the
price increase. Under WTO and No Deal trade arrangements, UK exports are already
minimal and hence have little room to fall further. As a result, price increases in response to
the decline in production under the WTO and No Deal trade arrangements.
In contrast, the beef price responses to reductions in Pillar I payments are small regardless
of trade arrangements. Under the FTA version of this scenario, imports from the EU
increase and thereby limit the price increase. Under the WTO version of this scenario, when
the trade arrangements are applied on a stand-alone basis the UK price reaches the ‘World
Price + MFN Tariff level’, which acts to curb further price rises following the
reduction/elimination of direct payments. Similarly, under the 2019 No Deal tariff schedule,
there is a large inflow of imports from the RoW when the trade arrangements are changed
on a stand-alone basis. Following the further reduction/elimination of direct payments
imports from the RoW adjust and hence there is little change in price. It is important to bear
in mind that the above price responses are in addition to the changes that occur due to the
changes in trade arrangements. Following the implementation of No Deal Tariff trade
arrangements on a stand-alone basis it is projected that the beef price falls significantly
(although this price impact is dependent upon assumptions regarding the underlying world
price).
Overall, the analysis shows that the beef and sheep sectors are the most likely sectors to
experience declines in activity levels and production in response to reductions and removal
of Pillar I direct payments. As demonstrated by the sensitivity analysis, the projected impact
depends on the assumptions regarding the extent to which the decoupled payments have a
production stimulating impact. This is an area of considerable uncertainty.
Recent empirical analysis by Olagunju et al. (2019) in Northern Ireland suggests that the
production stimulating impact of decoupled payments in the livestock sectors may be greater
than the ‘weak’ 30% assumption traditionally employed within the FAPRI-UK model and
other modelling systems. In particular, using Farm Business Survey data in Northern Ireland
the authors found that the impact of decoupled payments on the number of beef cows is
about 66% compared to the impact of market revenue. This implies that the results
pertaining to the ‘medium’ 60% decoupling assumption are the most relevant for the beef
sector. With regards to the dairy sector, Olagunju et al. (2019) found that the impact of
decoupled payments on milk output is 24% compared to market revenue. This implies that
the ‘weak’ 30% production stimulating assumption is a reasonable approximation for the
dairy sector. However, in contrast to the beef and dairy sectors, the empirical evidence for

63
the sheep sector is questionable. The authors estimated that the impact of decoupled
payments on the number of ewes is greater compared to market revenue. This is partly
attributed to the limited profitability in the sheep sector, which affects the magnitude of the
revenue term. Nonetheless, given the observed fall in UK ewe numbers following the
replacement of the coupled ewe premium with the decoupled Single Farm Payment in 2005
it is apparent that sheep farmers have responded to some extent to decoupling. Due to
concerns of the empirical evidence for the sheep sector, it is judged most appropriate to
assume that decoupled payments in this sector have the same impact as in the beef sector.
The analysis by Olagunju et al. (2019) did not cover the crop sector. However, the empirical
evidence elsewhere suggests that production stimulating impact of decoupled payments in
this sector is modest.
It is important to stress that the removal of direct payments (and even the 50% reduction
scenarios) entail significant departures from existing policies upon which the models have
been calibrated. The coefficients within the supply functions capture the production
responses of changes in returns (market receipts and direct payments) observed during the
historic period. This includes changes in Pillar I direct payments that occurred due to
modulation and exchange rate fluctuations. The coefficients for supply responses are
reasonably robust for changes in direct payments within these bounds. However, there is
uncertainty regarding the linearity of production responses following substantial changes in
direct payments, such as those considered within the above scenario analysis.
Farm-level analysis undertaken by Shrestha and Moxey as part of the study by Hubbard et
al. (2019) indicate that the viability of many livestock farms is questionable if Pillar I support
is abolished and that they may cease to exist. If farms exit the livestock sector at a
magnitude well beyond the historic pattern, this could have a ‘tipping-point’ impact, when
farms cease production, rather than reduce supply, that would not be captured within the
modelling work carried out in this report. However, over time, the shocks to agricultural
factor markets will be re-distributed across agriculture and the wider economy. For example,
sector productivity could improve over time if the least productive land (in respect to
generating a market return) is moved into public good provision, or if the change leads to an
increase in the average farm scale of those farms relatively more competitive in terms of
marketed goods. This would be reflected within the FAPRI-UK modelling system as an
increase in the aggregate productivity of the agricultural production systems modelled – or a
weighted average of all the individual farms producing that commodity.
In addition, the FAPRI-UK modelling system does not capture changes in factor markets. In
particular, due to the capitalisation of direct payments within land rental prices it is
anticipated that the reduction of direct payments would have a depressing impact on land
rents. In terms of farm income, a decline in land rental costs would partially offset the impact
of a reduction in direct payments. Factor markets are taken into account within the
Computable General Equilibrium (CGE) modelling framework employed by Philippidis in
Hubbard et al. (2019). In a CGE modelling system, factor prices and quantities can change
in response to a policy scenario. Comparing the impact of eliminating all Pillar I payments
using the CGE model, there are no marked differences. This indicates that the results
presented in this report are not limited by fixed factor markets, given comparable results
have been obtained using a more flexible modelling system in this respect .
The FAPRI sectoral modelling framework used in the analysis in this study provides
estimates of the sector-wide implications of changes in direct payments. The distributional
impacts of such policy changes at the farm-level are potentially significant as large
proportions of farms are dependent on direct payments to make a profit, particularly in the
beef and sheep sectors. It is also important to acknowledge that lower farm incomes due to

64
reductions in Pillar I type payments will be offset to some extent by new outcome-based
schemes involving the delivery of public goods. The extent to which different farm types will
be able to access these schemes remains to be ascertained.
Our analysis on the provision of coupled payments indicates that this reallocation of
payments may lead to changes within the administrations in which they are implemented. In
particular, it is projected that the provision of 100% coupled payments in Scotland leads to a
significant increase in Scottish beef cow numbers (16.9% to 19.5%). This reflects the
assumption that coupled payments are just provided to the beef and sheep sectors in this
territory. Moreover, the results demonstrate that the impact of coupled payments partly
depends on the underlying trade arrangements and the extent to which imports/exports can
readjust. The price impact is even lower under the WTO and No Deal trade arrangements
as following the change in trade arrangements beef imports from the rest of the world
readjust quickly in response to the changes in the level of production which occurs due to
the provision of coupled payments.

65
References Ahearn, M.C., El-Osta, H., Dew bre, J., 2006. The impact of coupled and decoupled government subsidies on off-
farm labor participation of US farm operators. American journal of agricultural economics 88, 393-408
Hubbard, C., Davis, J., Feng, S., Harvey, D., Liddon, A., Moxey, A., Ojo, M., Patton, M., Philippidis, G., Scott, C.
and Shrestha, S., 2019. Brexit: How might UK Agriculture Thrive or Survive? Final report for Economic and
Social Research Council (ESRC) project as part of UK in a Changing Europe.
Coble, K.H., Miller, J.C., Darren Hudson, M., 2008. Decoupled farm payments and expectations for base updating.
Review of Agricultural Economics 30, 27-42
DAERA (2018). Northern Ireland Future Agriculture Policy Framew ork. Consultation document, published August
2018.
Davis, J., Feng, S., Patton, M. and Binfield, J., 2017. Impacts of alternative post-Brexit trade agreements on UK
agriculture: Sector analyses using the FAPRI-UK Model. FAPRI-UK Project Report, Agri-Food and
Biosciences Institute and University of Missouri.
Defra, September 2018. Health and Harmony: the future for food, farming and the environment in a Green Brexit.
Policy document, published 2018.
Department for International Trade, 2019. Non-preferential tariff rates and quotas on imports if the UK leaves the
EU w ith no deal, updated 8 October 2019.
Goodw in, B.K., Mishra, A.K., 2006. Are “Decoupled” Farm Program Payments Really Decoupled? An Empirical
Evaluation. American Journal of Agricultural Economics 88, 73-89.
Hennessy, D.A., 1998. The production effects of agricultural income support policies under uncertainty. American
Journal of Agricultural Economics 80, 46-57.
Olagunju, K.O., Patton, M., Feng, S., 2019. Modelling the Impact of Decoupled Payments on Farm Production.
Contributed Paper prepared for presentation at the 93rd Annual Conference of the Agricultural Economics
Society, University of Warw ick, United Kingdom, April, 2019.
Scottish Government, 2018. Stability and simplicity: proposals for a rural funding transition period. Consultation
document, published June 2018.
Welsh Government, 2018. Brexit and our land: Securing the future of Welsh farming. Policy document, published
July 2018.
Welsh Government, 2019, Sustainable Farming and our Land, Consultation document, published July 2019.

66
Appendix 1: Impact of Changes in Trade Arrangements
The following tables contain the results for changes in trade arrangements on a stand -alone
basis, i.e. they refer to change under trade arrangement compared to the Baseline, with no
changes to direct payments. The changes presented in the main section of the report are
additional to these stand-alone results.
With regards to the FTA and WTO trade arrangements similar analyses were undertaken
using the FAPRI models in 2017 (Davis et al., 2017). The results for the FTA and WTO
analyses undertaken in this study are broadly similar to before, although there are some
differences reflecting different baseline prices. In contrast, the FAPRI 2017 analysis
considered a more extreme version of trade liberalisation in which import tariffs for all
commodities were reduced to zero, whereas the results in this report are based on the
application of the UK Government’s No Deal tariff schedule. As a result, the discussion
below mostly focuses on the latter.
Free Trade Agreement with the EU Similar to the 2017 analysis, additional trade facilitation cost due to the UK’s exit from the
single market causes some disruption to trade flows but the estimated market impacts are
relatively small.
WTO Default The default WTO MFN tariffs are in the main very high and hence the imposition of these
tariffs leads to significant adjustments in trade between the UK and EU. In general, the
projected changes in trade have significant impacts on domestic markets, with the direction
of the impact on price varying according to whether the UK is a net importer or a net exporter
of the relevant commodity. For example, in the case of beef, in which the UK is a net
importer, the imposition of tariffs reduces the competitiveness of the imported product ,
resulting in a higher UK beef producer price. As indicated in Appendix 2, the rise in beef
price is sufficient for non-EU countries to export beef to the UK paying the full high tariff and
consequently, the ‘World Price +WTO Tariff’ limits the extent to which the UK producer price rises.10 In contrast, in the sheep sector, wherein the UK is a net exporter to the EU, the
imposition of tariffs substantially diminishes the volumes of UK exports to the EU. The
resulting increased supplies within the domestic market exerts a downward impact on the
producer sheepmeat price.
The projected changes in producer prices have a knock-on impact on consumer prices
(Table A1.8). The FAPRI-UK model does not explicitly capture consumer price changes.
However, the information generated from the model on producer prices has been combined
with some assumptions to consider the potential impact on consumer prices under each
scenario. The direction of impact on consumer prices follows the change in producer prices
but the magnitude of the impact is smaller. In the most extreme case, it is projected that
beef (+4%), pigmeat (+4%), cheese (+8%)) and butter (+9%) consumer prices rise under the
WTO Default scenario, while the projected aggregate retail price of sheepmeat decreases ( -
10%). Underlying these consumer price projections it is assumed that existing producer-
retail price spreads remain the same as the recent historical period. Brexit is likely to have
far reaching impacts on the food supply chain that are not captured in this analysis ( e.g.
availability of migrant labour) which may impact this price spread and hence, consumer price
10 Note that the projected impact is partly determined by the baseline reference price. In particular, the
Brazilian beef producer price is used as a reference price and the highly competitive nature of this price curbs
the extent to which the UK price can rise in the scenario.

67
impacts. Therefore, these consumer price estimates should be treated as indicative only, as
a more robust estimate requires explicit modelling of key relationships along the entire
supply chain.
2019 No Deal Tariff Schedule Within the beef sector it is projected that there is a large inf low of beef imports from the Rest
of the World. These displace to some extent imports from the EU. The total level of imports
exceeds the tariff rate quota as overseas’ suppliers such as Brazil are very competitive and it
is projected that they are able to pay the No Deal out-of-quota tariff, which is considerably
lower than the MFN tariffs currently applied by the EU. As a result, the UK producer beef
price falls close to ‘World Price + Tariff’ levels (-22% compared to the baseline at the end of the projection period (2027)).11
The UK sheep sector also experiences a large decline in the producer price under the No
Deal Tariff schedule scenario (-18%). This reflects the application of the large MFN tariffs on
UK sheepmeat exports to the EU, which leads to increased available supplies in the UK
market. Imports from the Rest of the World continue as before via the tariff rate quota.
In the pig sector, the rechannelling to the domestic market of produce that would have
previously been exported to the EU market also exerts a negative impact on price (-9%).
The relatively low tariffs imposed on pigmeat imports to the UK under the No Deal tariff
arrangements results in modest disruption to trade from the EU.
The No Deal tariffs for poultry imports are also fairly modest and hence it is projected
imports are still competitive after paying the full tariff. As a result, produce is imported
beyond the new No Deal tariff rate quota and the overall fall in poultry meat imports is small.
Within this analysis it is assumed that it is feasible to find alternative markets for the lower
value cuts that would have previously been exported to the EU and hence there is no
change in the total level of UK exports. These exports help to support the domestic poultry
price, which exhibits little change under this scenario. It is important to highlight that the
data within the FAPRI-UK model excludes processed produce. Processed produce is
considerable in the poultry sector and thus the model results do not capture of market impacts of disruption to this trade.12
In the dairy sector it is projected that cheese exports to the EU fall sharply due to the
application of high MFN tariffs. In contrast, the disruption to UK cheese imports from the EU
is modest due to the relatively low No Deal tariffs. As a result, increased available supplies
exerts a downward impact on the domestic cheese price (-13%). While the No Deal butter
tariff is a third lower than the default MFN tariff, it is still quite large and reduces the
competitiveness of imports from the EU. As a result, the volume of imports fall significantly
but do not collapse completely. In contrast, the application of the full MFN tariff on UK
exports to the EU, results in UK butter exports falling to zero. As a result of these changes
the domestic butter price falls by 5%. Underlying this analysis it is assumed that there is
sufficient processing capacity in Northern Ireland to absorb the substantial volumes of raw
milk that were previously exported to Ireland.
Within the crops sector, it is projected that wheat and barley prices both decline. The price
decline for wheat reflects the collapse of exports to the EU. Barley exports to the EU also
fall sharply but not completely as it is assumed that there is still a demand for barley for
11 Within the baseline the UK beef price rises relative to the EU and world prices during the projection period
due to an underlying growth in UK population that has an upward impact on beef consumption. As a result, the
UK beef price has further to fall in the scenario analysis than would otherwise be the case. 12 This issue will be addressed in future updates of the FAPRI -UK model providing a robust market demand and
supply balance dataset is available.

68
brewing purposes. Some of the produce that was previously exported to the EU is
rechannelled to the rest of the world.
In terms of consumer prices, under the No Deal tariff schedule scenario, all consumer prices
are projected to decline, with aggregate sheepmeat and beef retail prices experiencing the
largest price impacts (Table A1.8).

69
Table A1-1 Projected changes in beef sector due to changes in trade arrangements only (Percentage changes in 2027)
FTA WTO ND Tariffs
UK Beef cows 0.6% 6.6% -12.6%
Dairy cows 0.4% 4.4% -3.0%
Total Cattle 0.5% 5.7% -7.0%
Production 0.6% 5.6% -5.6%
Domestic use 0.1% -1.2% 7.2%
Exports -3.3% -100.0% -100.0%
Imports -2.0% -46.3% -0.5%
Cattle price 0.0% 8.0% -22.5%
England Beef cows 0.6% 7.3% -13.8%
Dairy cows 0.3% 4.1% -2.8%
Total Cattle 0.5% 5.5% -6.6%
Production 0.5% 5.1% -4.9%
Wales Beef cows 0.5% 5.9% -11.0%
Dairy cows 0.5% 6.1% -4.1%
Total Cattle 0.6% 6.2% -6.7%
Production 0.6% 5.6% -5.0%
Scotland Beef cows 0.5% 6.2% -11.8%
Dairy cows 0.5% 6.1% -4.1%
Total Cattle 0.6% 6.6% -9.1%
Production 0.8% 7.5% -8.1%
Northern Ireland Beef cows 0.5% 6.1% -11.6%
Dairy cows 0.3% 3.4% -2.3%
Total Cattle 0.5% 5.0% -6.4%
Production 0.6% 5.6% -5.8%

70
Table A1-2 Projected changes in sheep sector due to changes in trade arrangements only (Percentage changes in 2027)
FTA WTO ND Tariffs
UK Ewes -1.7% -15.0% -12.6%
Total Sheep -1.7% -15.0% -12.7%
Production -1.5% -17.5% -16.2%
Domestic use 0.9% 6.8% 8.5%
Exports -8.2% -98.8% -99.3%
Imports -0.8% -21.9% -21.2%
Sheepmeat price -3.2% -22.1% -18.2%
England Ewes -2.1% -17.9% -15.0%
Total Sheep -1.9% -17.5% -15.0%
Production -1.8% -21.6% -20.2%
Wales Ewes -1.4% -12.5% -10.5%
Total Sheep -1.5% -13.3% -11.2%
Production -1.3% -13.6% -12.2%
Scotland Ewes -1.4% -12.0% -10.0%
Total Sheep -1.2% -11.1% -9.4%
Production -1.0% -12.9% -12.1%
Northern Ireland Ewes -1.7% -14.9% -12.6%
Total Sheep -1.7% -15.0% -12.7%
Production -1.4% -17.3% -16.2%

71
Table A1-3 Projected changes in pig sector due to changes in trade arrangements only (Percentage changes in 2027)
FTA WTO ND Tariffs
UK Sows 0.6% 9.8% -8.3%
Total pigs 0.6% 10.3% -8.8%
Production 0.6% 10.4% -8.9%
Domestic use -0.2% -3.5% 3.6%
Exports -0.4% -68.7% -68.1%
Imports -1.1% -37.1% -3.3%
Pigmeat price 0.5% 10.2% -9.4%
England Sows 0.6% 10.1% -8.6%
Total pigs 0.6% 10.6% -9.0%
Production 0.6% 10.9% -9.4%
Wales Sows 0.4% 7.6% -6.4%
Total pigs 0.5% 9.2% -7.9%
Production 0.6% 11.2% -9.6%
Scotland Sows 0.6% 9.9% -8.4%
Total pigs 0.7% 12.5% -10.6%
Production 0.6% 10.5% -8.9%
Northern Ireland Sows 0.4% 7.2% -6.1%
Total pigs 0.4% 7.5% -6.4%
Production 0.4% 6.6% -5.6%

72
Table A1-4 Projected changes in poultry sector due to changes in trade arrangements only (Percentage changes in 2027)
FTA WTO ND Tariffs
UK Production 0.2% 1.9% 1.7%
Domestic use 0.0% -0.6% 0.0%
Exports -1.3% 0.0% 0.0%
Imports -1.3% -8.3% -5.5%
Poultry price 0.1% 4.2% 0.7%
England and Wales Production 0.2% 1.9% 1.7%
Scotland Production 0.2% 2.8% 2.5%
Northern Ireland Production 0.1% 1.3% 1.1%

73
Table A1-5 Projected changes in dairy sector due to changes in trade arrangements only (Percentage changes in 2027)
FTA WTO ND Tariffs
UK Cow's milk
Production 0.4% 5.3% -3.6%
Manufacturing use 1.0% 12.6% -8.8%
Prices Producer milk price 1.4% 19.3% -13.4%
Cheese price 1.2% 17.5% -12.9%
Butter price 0.7% 12.8% -4.8%
WMP price 0.0% 0.0% 0.0%
SMP price 0.0% -0.1% -0.1%
Cheese Production 1.0% 17.3% -4.3%
Domestic use -0.2% -2.7% 2.4%
Exports -1.5% -81.4% -36.8%
Imports -1.6% -43.4% -4.6%
Butter Production 0.6% 22.3% 4.5%
Domestic use -0.2% -3.7% 1.5%
Exports -5.8% -100.0% -95.3%
Imports -4.7% -98.4% -56.0%
England Milk production 0.4% 5.1% -3.4%
Dairy cows 0.3% 4.1% -2.8%
Milk price 1.4% 19.3% -13.4%
Wales Milk production 0.5% 7.0% -4.6%
Dairy cows 0.5% 6.1% -4.1%
Milk price 1.3% 18.5% -12.8%
Scotland Milk production 0.5% 6.9% -4.6%
Dairy cows 0.5% 6.1% -4.1%
Milk price 1.3% 18.7% -13.0%
Northern Ireland Milk production 0.3% 3.8% -2.6%
Dairy cows 0.3% 3.4% -2.3%
Milk price 0.8% 11.9% -8.4%

74
Table A1- 6 Projected changes in crop sector due to changes in trade arrangements only (Percentage changes in 2027)
FTA WTO ND Tariffs
UK
Wheat Production -0.1% 1.4% -1.9%
Domestic use 0.2% 1.4% -1.0%
Exports -6.7% -100.0% -87.9%
Imports -1.0% -69.6% -49.8%
Barley Production -0.3% -0.4% -2.4%
Domestic use 0.4% 4.2% -1.3%
Exports -4.1% -37.6% -18.9%
Imports -2.6% -100.0% -100.0%
Area Wheat -0.1% 1.2% -1.7%
Barley -0.2% -0.3% -2.1%
Prices Wheat -0.5% 5.6% -8.0%
Barley -1.3% -4.4% -11.1%
England
Area
Wheat -0.1% 1.2% -1.8%
Barley -0.2% 0.1% -2.2%
Production Wheat -0.1% 1.4% -2.0%
Barley -0.2% -0.1% -2.5%
Rapeseed 0.1% -0.4% 1.3%
Wales
Area
Wheat 0.0% 1.1% -0.6%
Barley -0.1% -0.5% -1.2%
Production Wheat 0.0% 1.3% -0.9%
Barley -0.2% -0.7% -1.5%
Scotland
Area
Wheat 0.0% 1.7% -0.9%
Barley -0.3% -1.3% -2.0%
Production Wheat 0.0% 1.9% -1.2%

75
Barley -0.3% -1.4% -2.4%
Northern Ireland
Area
Wheat -0.1% 0.9% -1.8%
Barley -0.2% -0.5% -2.3%
Production Wheat -0.1% 1.2% -2.0%
Barley -0.3% -0.7% -2.6%
Table A1-7 Projected changes in value of output due to changes in trade arrangements only (Percentage changes in 2027)
FTA WTO ND Tariffs
UK Wheat -0.6% 7.1% -9.8%
Barley -1.5% -4.7% -13.2%
Oats -1.2% -3.7% -10.4%
Rapeseed 0.1% -0.3% 1.3%
Total Crops -0.7% 2.8% -8.7%
Cattle 0.6% 14.1% -26.8%
Pig 1.1% 21.6% -17.5%
Sheep -4.6% -35.7% -31.4%
Poultry 0.3% 6.2% 2.4%
Total Livestock -0.3% 5.1% -18.4%
Milk 1.7% 24.4% -15.7%
Total UK Agric. Value of
Output 0.2% 9.6% -15.6%
Individual Country Total Agric . Value of Output
England 0.2% 10.1% -14.2%
Wales -0.2% 7.0% -21.0%
Scotland -0.1% 7.7% -19.8%
Northern Ireland 0.5% 11.2% -15.4%

76
Table A1-8 Projected changes in consumer prices due to changes in trade arrangements only (Percentage changes in 2027)
FTA WTO ND Tariffs
Beef Price 0.0% 3.8% -10.8%
Sheepmeat Price -1.5% -10.4% -8.5%
Pigmeat Price 0.2% 3.9% -3.6%
Cheese Price 0.6% 8.5% -6.3%
Butter Price 0.5% 8.7% -3.2%
Wheat Price -0.1% 0.8% -1.1%

77
Appendix 2: Combined impact of changes in trade
arrangements and Pillar1 support payments
The following tables provide projections of the combined impacts of changes in trade
arrangements and Pillar I support. This contrasts with the previous appendix, which
presented estimates of changes in trade arrangements on a stand-alone basis, and the
analysis presented in the main report, which isolated the impact of changes in direct support
in the context of different trade arrangements. Tables A2.1 to A2.7 provide estimates of the
combined impact of changes in trade arrangements and reductions in Pillar I support
payments, while Tables A2.8 to A2.14 provide estimates of the combined impact of changes
in trade arrangements and provision of coupled payments. The combined impacts depends
on the extent to which the changes in terms of trade and agricultural support complement or
offset each other.

78
Table A2- 1 Projected changes in beef sector due to changes in trade arrangements and reduction in Pillar I direct payments (Percentage changes in 2027)
FTA FTA WTO WTO ND Tariffs ND Tariffs FTA FTA WTO WTO ND Tariffs ND Tariffs FTA FTA WTO WTO ND Tariffs ND Tariffs
50% red. 100% red. 50% red. 100% red. 50% red. 100% red. 50% red. 100% red. 50% red. 100% red. 50% red. 100% red. 50% red. 100% red. 50% red. 100% red. 50% red. 100% red.
UK
Beef cows -2.0% -4.1% 3.9% 1.8% -15.5% -17.6% -4.1% -8.4% 1.8% -2.5% -17.4% -21.6% -7.1% -14.2% -1.1% -8.1% -19.9% -27.0%
Dairy cows 0.1% -0.2% 4.2% 3.9% -3.3% -3.6% -0.2% -0.9% 3.8% 3.2% -3.6% -4.3% -0.7% -1.7% 3.4% 2.4% -4.0% -5.1%
Total Cattle -0.8% -2.0% 4.3% 3.1% -8.5% -9.6% -2.0% -4.3% 3.1% 0.8% -9.9% -12.2% -3.5% -7.4% 1.5% -2.3% -10.9% -14.8%
Production -0.6% -1.7% 4.4% 3.3% -6.9% -8.0% -1.6% -3.7% 3.3% 1.2% -8.7% -10.8% -3.0% -6.5% 1.8% -1.6% -9.2% -12.7%
Domestic use 0.0% 0.0% -1.4% -1.6% 7.1% 7.0% -0.1% -0.1% -1.6% -1.8% 6.5% 6.3% -0.2% -0.3% -1.8% -2.1% 6.3% 6.1%
Exports -3.9% -3.7% -100.0% -100.0% -100.0% -100.0% -3.0% -2.7% -100.0% -100.0% -100.0% -100.0% -2.0% -1.5% -100.0% -100.0% -100.0% -100.0%
Imports 0.2% 2.3% -44.3% -42.4% 1.8% 3.7% 2.1% 6.4% -42.2% -38.6% 4.0% 7.8% 4.9% 11.9% -39.4% -33.4% 4.7% 11.2%
Cattle price 0.1% 0.2% 8.1% 8.3% -22.4% -22.3% 0.2% 0.3% 8.3% 8.6% -21.1% -20.9% 0.3% 0.5% 8.5% 9.0% -21.0% -20.7%
England
Beef cows -0.8% -2.3% 5.7% 4.1% -15.4% -16.9% -2.3% -5.6% 4.1% 0.9% -16.7% -19.9% -4.6% -10.0% 1.9% -3.4% -18.5% -23.8%
Dairy cows 0.1% -0.2% 3.8% 3.6% -3.1% -3.4% -0.2% -0.8% 3.5% 2.9% -3.4% -4.0% -0.7% -1.6% 3.1% 2.1% -3.8% -4.8%
Total Cattle -0.2% -1.0% 4.7% 3.9% -7.4% -8.1% -1.0% -2.6% 3.9% 2.3% -8.4% -10.0% -2.1% -4.8% 2.7% 0.1% -9.0% -11.7%
Production -0.1% -0.7% 4.4% 3.8% -5.5% -6.2% -0.7% -2.0% 3.7% 2.4% -6.8% -8.2% -1.6% -3.9% 2.7% 0.5% -7.0% -9.2%
Wales
Beef cows -1.3% -3.2% 4.0% 2.0% -13.0% -15.0% -3.3% -7.3% 1.9% -2.0% -14.8% -18.7% -6.1% -12.8% -0.8% -7.4% -17.2% -23.8%
Dairy cows 0.2% 0.0% 5.8% 5.6% -4.4% -4.6% 0.0% -0.5% 5.6% 5.1% -4.6% -5.2% -0.4% -1.2% 5.2% 4.4% -4.9% -5.9%
Total Cattle -0.4% -1.4% 5.2% 4.2% -7.7% -8.7% -1.4% -3.5% 4.1% 2.1% -9.0% -11.1% -2.8% -6.3% 2.7% -0.7% -9.9% -13.4%
Production -0.2% -1.0% 4.8% 3.9% -5.8% -6.6% -1.0% -2.7% 3.9% 2.2% -7.2% -8.9% -2.1% -4.9% 2.7% 0.0% -7.6% -10.4%
Scotland
Beef cows -3.7% -5.6% 2.0% 0.1% -16.5% -18.4% -5.5% -9.2% 0.1% -3.6% -18.1% -21.9% -8.0% -14.2% -2.3% -8.4% -20.3% -26.5%
Dairy cows 0.2% 0.0% 5.9% 5.6% -4.4% -4.6% 0.0% -0.6% 5.6% 5.1% -4.7% -5.2% -0.4% -1.3% 5.2% 4.4% -5.0% -6.0%
Total Cattle -2.4% -3.8% 3.6% 2.1% -12.3% -13.8% -3.7% -6.6% 2.2% -0.6% -14.0% -16.9% -5.6% -10.3% 0.3% -4.3% -15.2% -19.9%
Production -2.0% -3.6% 4.7% 3.1% -11.1% -12.8% -3.3% -6.3% 3.3% 0.3% -13.5% -16.6% -5.1% -10.0% 1.4% -3.3% -14.1% -18.9%
Northern Ireland
Beef cows -3.4% -7.4% 2.1% -2.0% -15.7% -19.8% -7.4% -15.6% -2.1% -10.2% -19.6% -27.7% -13.0% -26.7% -7.6% -21.2% -24.8% -38.4%
Dairy cows -0.1% -0.6% 3.0% 2.6% -2.7% -3.1% -0.6% -1.4% 2.6% 1.8% -3.1% -4.0% -1.1% -2.5% 2.0% 0.6% -3.7% -5.1%
Total Cattle -1.6% -3.8% 2.8% 0.6% -8.6% -10.8% -3.8% -8.2% 0.6% -3.7% -11.0% -15.4% -6.8% -14.0% -2.4% -9.6% -13.5% -20.8%
Production -1.5% -3.6% 3.5% 1.3% -8.0% -10.1% -3.6% -7.9% 1.3% -3.0% -10.8% -15.1% -6.5% -13.6% -1.7% -8.7% -12.8% -19.9%
30% Decoupling Assumption 60% Decoupling Assumption 100% Decoupling Assumption

79
Table A2- 2 Projected changes in sheep sector due to changes in trade arrangements and reduction in Pillar I direct payments (Percentage changes in 2027)
FTA FTA WTO WTO ND Tariffs ND Tariffs FTA FTA WTO WTO ND Tariffs ND Tariffs FTA FTA WTO WTO ND Tariffs ND Tariffs
50% red. 100% red. 50% red. 100% red. 50% red. 100% red. 50% red. 100% red. 50% red. 100% red. 50% red. 100% red. 50% red. 100% red. 50% red. 100% red. 50% red. 100% red.
UK
Ewes -4.4% -6.9% -15.8% -16.4% -13.5% -14.2% -5.9% -10.6% -17.0% -18.2% -14.7% -16.1% -7.7% -15.3% -18.5% -20.3% -16.2% -18.3%
Total Sheep -4.3% -6.7% -15.9% -16.5% -13.6% -14.2% -5.8% -10.4% -17.1% -18.3% -15.0% -16.2% -7.6% -15.1% -18.7% -20.4% -16.5% -18.2%
Production -4.3% -6.9% -19.7% -21.0% -17.4% -18.0% -6.4% -11.5% -21.3% -23.4% -19.6% -20.6% -8.7% -16.8% -23.0% -25.8% -21.4% -22.5%
Domestic use 0.8% 0.7% 5.2% 4.3% 7.6% 7.2% -0.2% -0.4% 4.0% 2.5% 5.9% 5.2% -1.3% -1.7% 2.7% 0.7% 4.5% 3.7%
Exports -15.9% -23.2% -99.3% -99.6% -99.5% -99.7% -18.1% -32.0% -99.4% -99.9% -99.7% -99.9% -20.6% -43.2% -99.4% -100.0% -99.8% -100.0%
Imports -0.7% -0.7% -21.1% -20.6% -20.7% -20.5% 0.0% 0.2% -20.4% -19.6% -19.9% -19.5% 0.8% 1.1% -19.7% -18.5% -19.1% -18.7%
Sheepmeat price -2.8% -2.4% -17.8% -15.2% -15.9% -14.8% 0.8% 1.5% -14.4% -10.0% -11.6% -9.6% 4.8% 6.1% -10.5% -4.1% -7.4% -5.0%
England
Ewes -4.0% -6.0% -17.5% -17.3% -14.7% -14.7% -4.9% -8.8% -18.3% -17.9% -15.6% -15.4% -6.1% -12.6% -19.3% -18.6% -16.5% -16.2%
Total Sheep -3.8% -5.7% -17.4% -17.3% -14.7% -14.6% -4.8% -8.6% -18.3% -18.0% -15.7% -15.4% -6.1% -12.3% -19.3% -18.6% -16.7% -16.0%
Production -3.9% -6.2% -23.1% -23.7% -20.3% -20.0% -5.7% -10.0% -24.4% -25.1% -22.3% -21.6% -7.6% -14.6% -25.6% -26.0% -23.7% -21.9%
Wales
Ewes -3.3% -5.2% -12.8% -13.1% -10.8% -11.3% -4.4% -8.2% -13.7% -14.5% -11.8% -12.7% -5.9% -12.0% -15.0% -16.2% -13.0% -14.5%
Total Sheep -3.5% -5.6% -13.7% -14.1% -11.6% -12.1% -4.8% -8.8% -14.8% -15.7% -13.0% -14.0% -6.5% -13.1% -16.3% -17.7% -14.2% -15.8%
Production -3.3% -5.4% -14.7% -15.5% -12.8% -13.3% -4.9% -9.0% -16.0% -17.4% -14.4% -15.3% -6.8% -13.4% -17.5% -19.4% -15.9% -17.1%
Scotland
Ewes -6.5% -10.1% -15.7% -17.8% -13.8% -16.1% -8.8% -15.6% -17.5% -21.6% -15.7% -19.9% -11.6% -22.2% -19.7% -25.9% -18.0% -24.4%
Total Sheep -5.9% -9.2% -14.5% -16.5% -12.8% -14.9% -8.1% -14.3% -16.3% -20.0% -14.7% -18.5% -10.7% -20.4% -18.3% -24.0% -16.8% -22.6%
Production -5.9% -9.6% -17.7% -20.5% -16.1% -18.2% -8.8% -15.5% -19.7% -24.5% -18.6% -22.4% -11.8% -22.2% -21.8% -28.7% -20.8% -26.4%
Northern Ireland
Ewes -5.7% -9.6% -17.0% -19.1% -14.6% -16.9% -8.9% -16.8% -20.2% -24.6% -17.9% -22.5% -13.2% -26.7% -24.7% -32.0% -22.2% -29.9%
Total Sheep -5.6% -9.5% -17.1% -19.2% -14.8% -17.0% -8.8% -16.7% -20.4% -24.8% -18.2% -22.6% -13.2% -26.5% -24.9% -32.1% -22.5% -29.8%
Production -5.6% -9.8% -21.1% -24.1% -18.8% -20.9% -9.7% -18.2% -25.0% -30.6% -23.3% -27.6% -14.8% -29.1% -30.0% -38.7% -28.4% -35.1%
30% Decoupling Assumption 60% Decoupling Assumption 100% Decoupling Assumption

80
Table A2-3 Projected changes in pig and poultry sectors due to changes in trade arrangements and reduction in Pillar I direct payments (Percentage changes in 2027)
FTA FTA WTO WTO ND Tariffs ND Tariffs FTA FTA WTO WTO ND Tariffs ND Tariffs FTA FTA WTO WTO ND Tariffs ND Tariffs
50% red. 100% red. 50% red. 100% red. 50% red. 100% red. 50% red. 100% red. 50% red. 100% red. 50% red. 100% red. 50% red. 100% red. 50% red. 100% red. 50% red. 100% red.
Pigs (UK)
Sows 0.5% 0.5% 9.7% 9.6% -8.3% -8.3% 0.5% 0.5% 9.6% 9.4% -8.2% -8.2% 0.5% 0.4% 9.4% 9.1% -8.1% -8.2%
Total pigs 0.5% 0.5% 10.3% 10.2% -8.7% -8.7% 0.5% 0.4% 10.1% 9.9% -8.7% -8.7% 0.5% 0.4% 9.9% 9.6% -8.7% -8.6%
Production 0.5% 0.5% 10.3% 10.2% -8.8% -8.7% 0.5% 0.4% 10.1% 9.9% -8.8% -8.7% 0.5% 0.3% 9.9% 9.6% -8.7% -8.5%
Domestic use -0.2% -0.2% -3.4% -3.4% 3.6% 3.6% -0.2% -0.2% -3.4% -3.3% 3.6% 3.7% -0.2% -0.2% -3.3% -3.3% 3.7% 3.8%
Exports -0.4% -0.4% -68.7% -68.7% -68.1% -68.1% -0.5% -0.5% -68.7% -68.7% -68.1% -68.1% -0.5% -0.5% -68.7% -68.7% -68.1% -68.1%
Imports -1.1% -1.1% -36.8% -36.7% -3.3% -3.4% -1.0% -1.0% -36.6% -36.2% -3.3% -3.3% -1.0% -0.9% -36.3% -35.8% -3.3% -3.3%
Pigmeat price 0.6% 0.7% 10.2% 10.3% -9.4% -9.4% 0.7% 0.9% 10.3% 10.4% -9.4% -9.4% 0.9% 1.2% 10.5% 10.6% -9.3% -9.4%
Poultry (UK)
Production 0.1% 0.1% 1.9% 1.9% 1.7% 1.7% 0.1% 0.0% 1.9% 1.8% 1.7% 1.7% 0.1% -0.1% 1.8% 1.7% 1.7% 1.7%
Domestic use 0.0% -0.1% -0.6% -0.6% 0.0% 0.0% -0.1% -0.1% -0.6% -0.7% 0.0% 0.0% -0.1% -0.1% -0.7% -0.8% 0.0% -0.1%
Exports -1.4% -1.4% 0.0% 0.0% 0.0% 0.0% -1.4% -1.5% 0.0% 0.0% 0.0% 0.0% -1.5% -1.7% 0.0% 0.0% 0.0% 0.0%
Imports -1.3% -1.3% -8.3% -8.3% -5.6% -5.6% -1.3% -1.3% -8.3% -8.3% -5.6% -5.6% -1.3% -1.3% -8.3% -8.3% -5.6% -5.6%
Poultry price 0.3% 0.4% 4.6% 4.8% 0.8% 0.8% 0.4% 0.7% 4.8% 5.3% 0.8% 0.9% 0.6% 1.2% 5.2% 6.0% 0.8% 1.0%
30% Decoupling Assumption 60% Decoupling Assumption 100% Decoupling Assumption

81
Table A2-4 Projected changes in dairy sector due to changes in trade arrangements and reduction in Pillar I direct payments (Percentage changes in 2027)
FTA FTA WTO WTO ND Tariffs ND Tariffs FTA FTA WTO WTO ND Tariffs ND Tariffs FTA FTA WTO WTO ND Tariffs ND Tariffs
50% red. 100% red. 50% red. 100% red. 50% red. 100% red. 50% red. 100% red. 50% red. 100% red. 50% red. 100% red. 50% red. 100% red. 50% red. 100% red. 50% red. 100% red.
UK
Cow's milk Production 0.1% -0.2% 5.1% 4.8% -3.9% -4.2% -0.2% -0.8% 4.7% 4.1% -4.2% -4.8% -0.6% -1.6% 4.3% 3.3% -4.6% -5.7%
Manufacturing use 0.4% -0.1% 12.0% 11.5% -9.4% -10.0% -0.1% -1.3% 11.4% 10.3% -10.0% -11.2% -0.9% -2.9% 10.6% 8.7% -10.7% -12.8%
Prices
Producer milk price 1.5% 1.6% 19.4% 19.5% -13.4% -13.3% 1.6% 1.7% 19.4% 19.6% -13.4% -13.3% 1.7% 1.9% 19.5% 19.9% -13.4% -13.3%
Cheese price 1.3% 1.4% 17.5% 17.6% -12.8% -12.8% 1.3% 1.5% 17.5% 17.6% -12.9% -12.8% 1.4% 1.6% 17.6% 17.7% -12.9% -12.8%
Butter price 0.7% 0.8% 13.3% 13.8% -4.7% -4.7% 0.8% 0.8% 13.9% 14.9% -4.7% -4.7% 0.8% 0.9% 14.7% 16.3% -4.7% -4.6%
WMP price 0.0% 0.0% 0.0% 0.0% 0.0% 0.0% 0.0% 0.0% 0.0% 0.0% 0.0% 0.0% 0.0% 0.0% 0.0% 0.0% 0.0% 0.0%
SMP price 0.0% 0.0% -0.1% -0.1% -0.1% -0.1% 0.0% 0.0% -0.1% -0.1% -0.1% -0.1% 0.0% 0.0% -0.1% -0.1% -0.1% 0.0%
Cheese
Production 0.5% 0.0% 16.7% 16.1% -4.9% -5.5% 0.0% -1.1% 16.0% 14.9% -5.5% -6.7% -0.8% -2.6% 15.2% 13.2% -6.2% -8.3%
Domestic use -0.2% -0.2% -2.7% -2.7% 2.4% 2.4% -0.2% -0.2% -2.7% -2.7% 2.4% 2.4% -0.2% -0.3% -2.7% -2.7% 2.4% 2.4%
Exports -1.7% -2.0% -81.4% -81.4% -37.3% -37.7% -2.1% -2.6% -81.4% -81.4% -37.7% -38.5% -2.5% -3.4% -81.4% -81.4% -38.3% -39.7%
Imports -1.3% -0.9% -43.0% -42.5% -4.3% -4.0% -0.9% -0.3% -42.4% -41.5% -4.0% -3.3% -0.5% 0.6% -41.7% -40.2% -3.6% -2.4%
Butter
Production 0.4% 0.1% 22.2% 22.0% 4.2% 3.8% 0.0% -0.6% 22.0% 21.7% 3.8% 3.1% -0.4% -1.4% 21.8% 21.2% 3.4% 2.2%
Domestic use -0.2% -0.2% -3.8% -3.9% 1.5% 1.5% -0.2% -0.3% -3.9% -4.2% 1.5% 1.5% -0.2% -0.3% -4.1% -4.6% 1.5% 1.5%
Exports -6.6% -7.3% -100.0% -100.0% -95.3% -95.3% -7.4% -9.0% -100.0% -100.0% -95.3% -95.3% -8.6% -11.1% -100.0% -100.0% -95.3% -95.3%
Imports -4.6% -4.6% -98.4% -98.4% -55.4% -54.9% -4.6% -4.5% -98.4% -98.4% -54.8% -53.7% -4.6% -4.4% -98.4% -98.4% -54.1% -52.2%
England
Milk production 0.1% -0.2% 4.8% 4.6% -3.7% -4.0% -0.2% -0.8% 4.5% 3.9% -4.0% -4.6% -0.6% -1.6% 4.1% 3.1% -4.4% -5.4%
Dairy cows 0.1% -0.2% 3.8% 3.6% -3.1% -3.4% -0.2% -0.8% 3.5% 2.9% -3.4% -4.0% -0.7% -1.6% 3.1% 2.1% -3.8% -4.8%
Milk price 1.5% 1.6% 19.4% 19.5% -13.4% -13.3% 1.6% 1.7% 19.4% 19.6% -13.4% -13.3% 1.7% 1.9% 19.5% 19.9% -13.4% -13.3%
Wales
Milk production 0.3% 0.1% 6.7% 6.5% -4.9% -5.2% 0.1% -0.4% 6.5% 6.0% -5.2% -5.7% -0.3% -1.1% 6.1% 5.3% -5.5% -6.4%
Dairy cows 0.2% 0.0% 5.8% 5.6% -4.4% -4.6% 0.0% -0.5% 5.6% 5.1% -4.6% -5.2% -0.4% -1.2% 5.2% 4.4% -4.9% -5.9%
Milk price 1.4% 1.5% 18.6% 18.7% -12.8% -12.7% 1.5% 1.6% 18.7% 18.9% -12.8% -12.7% 1.5% 1.8% 18.8% 19.2% -12.8% -12.7%
Scotland
Milk production 0.3% 0.0% 6.7% 6.5% -4.9% -5.2% 0.0% -0.5% 6.4% 5.9% -5.2% -5.7% -0.3% -1.2% 6.0% 5.2% -5.5% -6.5%
Dairy cows 0.2% 0.0% 5.9% 5.6% -4.4% -4.7% 0.0% -0.6% 5.6% 5.1% -4.7% -5.2% -0.4% -1.3% 5.2% 4.4% -5.0% -6.0%
Milk price 1.4% 1.5% 18.8% 18.9% -12.9% -12.9% 1.5% 1.6% 18.9% 19.2% -13.0% -12.9% 1.6% 1.8% 19.1% 19.4% -13.0% -12.9%
Northern Ireland
Milk production -0.1% -0.5% 3.4% 3.0% -3.0% -3.4% -0.5% -1.4% 3.0% 2.2% -3.4% -4.3% -1.1% -2.5% 2.4% 1.1% -3.9% -5.4%
Dairy cows -0.1% -0.6% 3.0% 2.6% -2.7% -3.1% -0.6% -1.4% 2.6% 1.8% -3.1% -4.0% -1.1% -2.5% 2.0% 0.6% -3.7% -5.1%
Milk price 0.9% 0.9% 12.0% 12.1% -8.4% -8.4% 0.9% 1.0% 12.1% 12.2% -8.4% -8.4% 0.9% 1.1% 12.1% 12.4% -8.4% -8.4%
30% Decoupling Assumption 60% Decoupling Assumption 100% Decoupling Assumption

82
Table A2-5 Projected changes in crop sector due to changes in trade arrangements and reduction in Pillar I direct payments (Percentage changes in 2027)
FTA FTA WTO WTO ND Tariffs ND Tariffs FTA FTA WTO WTO ND Tariffs ND Tariffs FTA FTA WTO WTO ND Tariffs ND Tariffs
50% red. 100% red. 50% red. 100% red. 50% red. 100% red. 50% red. 100% red. 50% red. 100% red. 50% red. 100% red. 50% red. 100% red. 50% red. 100% red. 50% red. 100% red.
UK
Wheat
Production -0.5% -0.9% 1.1% 0.8% -2.5% -3.0% -0.9% -1.8% 0.8% 0.2% -3.1% -4.2% -1.5% -2.9% 0.4% -0.6% -3.9% -5.8%
Domestic use -0.1% -0.3% 1.0% 0.7% -1.1% -1.3% -0.3% -0.7% 0.7% 0.1% -1.3% -1.6% -0.6% -1.4% 0.2% -0.8% -1.4% -1.9%
Exports -9.0% -11.3% -100.0% -100.0% -89.4% -90.8% -11.5% -16.3% -100.0% -100.0% -91.3% -94.3% -15.1% -23.2% -100.0% -100.0% -94.2% -99.3%
Imports -0.6% -0.1% -69.5% -69.4% -46.2% -42.5% -0.1% 0.7% -69.4% -69.2% -41.0% -33.5% 0.4% 1.9% -69.3% -68.4% -33.7% -21.2%
Barley
Production -0.7% -1.2% -1.0% -1.5% -3.0% -3.6% -1.2% -2.1% -1.4% -2.4% -3.7% -4.9% -1.8% -3.4% -2.2% -4.0% -4.6% -6.6%
Domestic use 0.1% -0.1% 4.1% 4.1% -1.4% -1.6% -0.1% -0.5% 4.0% 3.9% -1.6% -1.9% -0.3% -1.0% 4.0% 3.9% -1.7% -2.2%
Exports -6.0% -7.8% -40.9% -44.4% -22.1% -25.5% -8.0% -11.7% -43.3% -50.3% -26.1% -32.9% -10.7% -17.0% -49.9% -61.8% -31.9% -43.5%
Imports -1.1% 0.4% -100.0% -100.0% -100.0% -100.0% 0.4% 3.5% -100.0% -100.0% -100.0% -100.0% 2.5% 7.4% -100.0% -100.0% -100.0% -100.0%
Area
Wheat -0.6% -1.1% 0.8% 0.4% -2.3% -2.9% -1.1% -2.0% 0.5% -0.3% -3.0% -4.2% -1.7% -3.3% 0.0% -1.3% -3.9% -5.9%
Barley -0.7% -1.3% -0.9% -1.4% -2.8% -3.4% -1.3% -2.3% -1.3% -2.5% -3.5% -4.8% -2.0% -3.7% -2.2% -4.1% -4.4% -6.6%
Prices
Wheat 0.3% 1.1% 6.8% 8.1% -7.7% -7.5% 1.1% 2.7% 8.3% 11.0% -7.8% -7.3% 2.2% 4.8% 10.5% 14.9% -7.8% -7.0%
Barley -0.5% 0.2% -4.2% -4.0% -10.9% -10.7% 0.2% 1.8% -3.3% -2.9% -11.0% -10.6% 1.3% 3.8% -3.4% -2.7% -11.1% -10.4%
England
Area
Wheat -0.6% -1.1% 0.8% 0.4% -2.4% -3.1% -1.1% -2.1% 0.4% -0.4% -3.1% -4.4% -1.8% -3.4% -0.1% -1.5% -4.0% -6.1%
Barley -0.7% -1.2% -0.4% -1.0% -2.8% -3.4% -1.2% -2.2% -0.8% -1.9% -3.5% -4.8% -1.9% -3.5% -1.6% -3.3% -4.4% -6.5%
Production
Wheat -0.6% -1.0% 1.1% 0.7% -2.6% -3.1% -1.0% -1.9% 0.8% 0.1% -3.2% -4.4% -1.6% -3.0% 0.3% -0.8% -4.1% -6.0%
Barley -0.7% -1.1% -0.6% -1.0% -3.0% -3.6% -1.1% -2.0% -0.9% -1.9% -3.7% -4.9% -1.7% -3.2% -1.6% -3.2% -4.6% -6.5%
Rapeseed -0.5% -1.0% -1.0% -1.5% 0.8% 0.3% -1.0% -2.2% -1.6% -2.8% 0.4% -0.6% -1.8% -3.8% -2.4% -4.3% -0.2% -1.9%
Wales
Area
Wheat -0.3% -0.7% 0.9% 0.6% -1.0% -1.4% -0.7% -1.3% 0.6% 0.1% -1.5% -2.2% -1.1% -2.2% 0.4% -0.5% -2.0% -3.3%
Barley -0.5% -0.8% -0.9% -1.3% -1.6% -1.9% -0.8% -1.5% -1.3% -2.0% -2.0% -2.8% -1.3% -2.4% -1.9% -3.2% -2.5% -3.9%
Production
Wheat -0.3% -0.6% 1.1% 0.9% -1.2% -1.6% -0.6% -1.1% 0.9% 0.6% -1.6% -2.3% -0.9% -1.8% 0.8% 0.2% -2.1% -3.2%
Barley -0.5% -0.8% -1.0% -1.4% -1.9% -2.3% -0.8% -1.3% -1.3% -2.1% -2.3% -3.1% -1.2% -2.1% -1.9% -3.1% -2.9% -4.1%
Scotland
Area
Wheat -0.1% -0.3% 1.7% 1.7% -1.1% -1.3% -0.3% -0.5% 1.7% 1.7% -1.4% -1.8% -0.4% -0.9% 1.8% 1.8% -1.7% -2.4%
Barley -0.8% -1.4% -2.0% -2.8% -2.7% -3.4% -1.4% -2.6% -2.6% -4.1% -3.5% -4.9% -2.2% -4.2% -3.7% -6.2% -4.4% -6.8%
Production
Wheat -0.1% -0.2% 1.9% 2.0% -1.4% -1.6% -0.2% -0.4% 2.0% 2.1% -1.6% -2.0% -0.3% -0.6% 2.1% 2.4% -1.9% -2.5%
Barley -0.8% -1.4% -2.1% -2.8% -3.0% -3.7% -1.4% -2.4% -2.7% -4.1% -3.8% -5.1% -2.1% -3.9% -3.7% -6.1% -4.7% -6.9%
Northern Ireland
Area
Wheat -1.1% -2.1% 0.0% -1.0% -2.9% -4.0% -2.2% -4.2% -1.0% -2.9% -4.1% -6.4% -3.5% -6.9% -2.2% -5.5% -5.7% -9.6%
Barley -1.3% -2.3% -1.6% -2.7% -3.5% -4.6% -2.3% -4.3% -2.6% -4.8% -4.7% -7.0% -3.6% -7.0% -4.1% -7.8% -6.3% -10.1%
Production
Wheat -1.1% -2.0% 0.3% -0.6% -3.1% -4.1% -2.0% -3.8% -0.5% -2.3% -4.2% -6.4% -3.2% -6.4% -1.7% -4.6% -5.7% -9.3%
Barley -1.2% -2.2% -1.7% -2.7% -3.7% -4.8% -2.2% -4.1% -2.6% -4.7% -4.9% -7.1% -3.5% -6.6% -4.1% -7.6% -6.5% -10.2%
30% Decoupling Assumption 60% Decoupling Assumption 100% Decoupling Assumption

83
Table A2- 6 Projected changes in value of output due to changes in trade arrangements and reduction in Pillar I direct payments (Percentage changes in 2027)
FTA FTA WTO WTO ND Tariffs ND Tariffs FTA FTA WTO WTO ND Tariffs ND Tariffs FTA FTA WTO WTO ND Tariffs ND Tariffs
50% red. 100% red. 50% red. 100% red. 50% red. 100% red. 50% red. 100% red. 50% red. 100% red. 50% red. 100% red. 50% red. 100% red. 50% red. 100% red. 50% red. 100% red.
UK
Wheat -0.2% 0.2% 8.0% 9.0% -10.0% -10.3% 0.2% 0.9% 9.2% 11.2% -10.7% -11.2% 0.7% 1.8% 11.0% 14.2% -11.5% -12.3%
Barley -1.3% -1.0% -5.1% -5.4% -13.6% -13.9% -1.0% -0.4% -4.6% -5.2% -14.3% -15.0% -0.6% 0.3% -5.5% -6.6% -15.2% -16.4%
Oats -1.0% -0.9% -4.1% -4.4% -10.7% -11.1% -0.9% -0.5% -3.7% -4.4% -11.4% -12.1% -0.6% -0.1% -4.5% -5.6% -12.2% -13.3%
Rapeseed -0.5% -1.1% -0.9% -1.5% 0.8% 0.3% -1.1% -2.3% -1.6% -2.8% 0.3% -0.7% -1.9% -3.9% -2.4% -4.4% -0.3% -2.1%
Total Crops -0.5% -0.3% 3.2% 3.6% -9.0% -9.4% -0.3% 0.0% 3.9% 4.7% -9.7% -10.3% -0.1% 0.5% 4.6% 5.8% -10.5% -11.6%
Cattle -0.5% -1.5% 12.9% 11.9% -27.8% -28.5% -1.4% -3.4% 11.9% 9.9% -28.0% -29.4% -2.8% -6.1% 10.5% 7.3% -28.3% -30.7%
Pig 1.1% 1.1% 21.5% 21.5% -17.4% -17.3% 1.2% 1.3% 21.5% 21.4% -17.3% -17.3% 1.4% 1.5% 21.4% 21.2% -17.2% -17.1%
Sheep -7.0% -9.2% -34.0% -33.0% -30.5% -30.1% -5.7% -10.1% -32.6% -31.0% -28.9% -28.2% -4.3% -11.7% -31.0% -28.7% -27.2% -26.3%
Poultry 0.4% 0.5% 6.6% 6.8% 2.5% 2.5% 0.5% 0.8% 6.8% 7.2% 2.5% 2.6% 0.7% 1.1% 7.2% 7.9% 2.5% 2.7%
Total Livestock -1.1% -1.8% 5.0% 4.7% -18.7% -18.9% -1.2% -2.6% 4.9% 4.4% -18.4% -18.9% -1.4% -3.9% 4.8% 4.0% -18.2% -19.0%
Milk 1.5% 1.3% 24.2% 24.0% -16.0% -16.2% 1.3% 0.8% 23.9% 23.4% -16.2% -16.8% 0.9% 0.1% 23.5% 22.7% -16.6% -17.5%
Total UK Agric. Value of Output -0.3% -0.7% 9.6% 9.5% -15.8% -16.1% -0.4% -1.2% 9.6% 9.4% -15.9% -16.5% -0.5% -1.9% 9.6% 9.2% -16.1% -17.0%
Individual Country Total Agric. Value of Output
England 0.0% -0.1% 10.2% 10.3% -14.3% -14.4% 0.1% -0.3% 10.4% 10.6% -14.4% -14.7% 0.1% -0.6% 10.6% 10.8% -14.5% -15.0%
Wales -0.8% -1.5% 7.4% 7.5% -20.9% -21.1% -0.6% -2.0% 7.7% 7.7% -20.4% -20.7% -0.6% -2.8% 7.9% 7.8% -20.1% -20.7%
Scotland -1.6% -2.5% 6.8% 6.2% -20.8% -21.4% -1.9% -3.7% 6.6% 5.5% -21.0% -22.1% -2.3% -5.3% 6.1% 4.3% -21.1% -23.0%
Northern Ireland -0.4% -1.4% 10.4% 9.6% -16.0% -16.7% -1.2% -3.2% 9.7% 8.0% -16.5% -17.9% -2.3% -5.6% 8.6% 5.7% -17.2% -19.6%
Individual Country Value of Output + Direct Payments (Pillar 1 + Pillar 2)
England -6.7% -13.6% 1.8% -4.9% -18.7% -25.6% -6.7% -13.8% 2.0% -4.7% -18.8% -25.8% -6.7% -14.0% 2.1% -4.5% -18.9% -26.2%
Wales -7.0% -13.9% -0.4% -6.6% -23.3% -29.7% -6.9% -14.3% -0.2% -6.5% -22.9% -29.5% -6.8% -15.1% 0.0% -6.5% -22.6% -29.5%
Scotland -9.9% -19.3% -3.5% -12.7% -24.4% -33.6% -10.1% -20.1% -3.7% -13.2% -24.6% -34.2% -10.4% -21.3% -4.1% -14.1% -24.7% -34.8%
Northern Ireland -7.6% -15.7% 1.5% -6.5% -20.7% -28.5% -8.3% -17.2% 0.8% -7.9% -21.1% -29.5% -9.2% -19.2% -0.1% -9.8% -21.7% -31.0%
30% Decoupling Assumption 60% Decoupling Assumption 100% Decoupling Assumption

84
Table A2-7 Projected changes in consumer prices due to changes in trade arrangements and reduction in Pillar I direct payments (Percentage changes in 2027)
FTA FTA WTO WTO ND Tariffs ND Tariffs FTA FTA WTO WTO ND Tariffs ND Tariffs FTA FTA WTO WTO ND Tariffs ND Tariffs
50% red. 100% red. 50% red. 100% red. 50% red. 100% red. 50% red. 100% red. 50% red. 100% red. 50% red. 100% red. 50% red. 100% red. 50% red. 100% red. 50% red. 100% red.
Beef Price 0.1% 0.1% 3.9% 4.0% -10.7% -10.7% 0.1% 0.2% 4.0% 4.1% -10.2% -10.0% 0.1% 0.2% 4.1% 4.3% -10.1% -9.9%
Sheepmeat Price -1.3% -1.2% -8.4% -7.2% -7.5% -6.9% 0.4% 0.7% -6.8% -4.7% -5.5% -4.5% 2.3% 2.9% -5.0% -1.9% -3.5% -2.4%
Pigmeat Price 0.2% 0.2% 3.9% 3.9% -3.6% -3.6% 0.3% 0.3% 3.9% 4.0% -3.6% -3.6% 0.4% 0.5% 4.0% 4.0% -3.5% -3.6%
Cheese Price 0.6% 0.7% 8.5% 8.6% -6.3% -6.3% 0.7% 0.7% 8.6% 8.6% -6.3% -6.3% 0.7% 0.8% 8.6% 8.6% -6.3% -6.3%
Butter Price 0.5% 0.5% 9.0% 9.3% -3.2% -3.2% 0.5% 0.6% 9.4% 10.0% -3.2% -3.2% 0.5% 0.6% 9.9% 11.0% -3.2% -3.1%
Wheat Price 0.0% 0.2% 1.0% 1.1% -1.1% -1.1% 0.2% 0.4% 1.2% 1.5% -1.1% -1.0% 0.3% 0.7% 1.5% 2.1% -1.1% -1.0%
30% Decoupling Assumption 60% Decoupling Assumption 100% Decoupling Assumption

85
Table A2-8 Projected changes in beef sector due to changes in trade arrangements and provision of coupled payments (Percentage changes in 2027)
FTA FTA FTA WTO WTO WTO ND ND ND FTA FTA FTA WTO WTO WTO ND ND ND
20% Eng 20% Scot 20% NI 20% Eng 20% Scot 20% NI 20% Eng 20% Scot 20% NI 100% Eng 100% Scot 100% NI 100% Eng 100% Scot 100% NI 100% Eng 100% Scot 100% NI
UK
Beef cows 3.1% 1.1% 1.1% 9.4% 7.2% 7.2% -9.3% -11.9% -11.9% 2.4% 4.2% 1.5% 9.4% 11.0% 7.9% -9.0% -7.5% -11.0%
Dairy cows 0.3% 0.3% 0.3% 4.4% 4.4% 4.4% -3.1% -3.0% -3.0% 2.8% 0.3% 1.1% 7.0% 4.4% 5.1% -0.1% -3.0% -2.2%
Total Cattle 1.7% 0.8% 0.8% 6.9% 5.9% 5.9% -5.5% -6.7% -6.7% 2.8% 2.4% 1.4% 8.3% 7.7% 6.6% -3.8% -4.6% -5.8%
Production 1.7% 0.9% 0.8% 6.7% 5.9% 5.9% -4.4% -5.3% -5.3% 2.8% 2.8% 1.5% 8.0% 7.8% 6.6% -2.9% -3.2% -4.5%
Domestic use 0.2% 0.1% 0.1% -1.0% -1.2% -1.2% 7.4% 7.2% 7.2% 0.5% 0.6% 0.1% -1.0% -1.1% -1.2% 7.4% 7.4% 7.3%
Exports 0.0% -2.4% -2.5% -100.0% -100.0% -100.0% -100.0% -100.0% -100.0% 0.4% 0.5% -0.3% -100.0% -100.0% -100.0% -100.0% -100.0% -100.0%
Imports -3.0% -2.3% -2.2% -47.8% -46.7% -46.7% -2.4% -1.1% -1.0% -4.0% -4.1% -2.8% -50.4% -50.2% -48.1% -5.4% -5.0% -2.6%
Cattle price -0.2% 0.0% 0.0% 7.9% 7.9% 7.9% -22.6% -22.5% -22.5% -1.7% -1.9% 0.0% 7.7% 7.7% 7.8% -22.7% -22.7% -22.6%
England
Beef cows 6.6% 0.5% 0.5% 13.3% 7.3% 7.3% -6.5% -13.8% -13.8% 6.1% -0.6% 0.1% 13.4% 7.1% 7.2% -5.9% -13.8% -13.8%
Dairy cows 0.2% 0.3% 0.3% 4.0% 4.1% 4.1% -2.9% -2.8% -2.8% 4.6% 0.3% 0.3% 8.4% 4.1% 4.1% 2.1% -2.8% -2.8%
Total Cattle 2.9% 0.5% 0.5% 7.8% 5.5% 5.5% -3.8% -6.6% -6.6% 5.3% 0.2% 0.3% 10.4% 5.5% 5.4% -0.7% -6.6% -6.6%
Production 2.5% 0.5% 0.5% 7.0% 5.1% 5.1% -2.7% -4.9% -4.9% 4.8% 0.5% 0.4% 9.4% 5.1% 5.0% 0.1% -4.9% -4.9%
Wales
Beef cows 0.2% 0.5% 0.5% 5.9% 5.9% 5.9% -11.0% -11.0% -11.0% -0.5% -0.5% 0.1% 5.9% 5.8% 5.9% -11.1% -11.1% -11.0%
Dairy cows 0.5% 0.5% 0.5% 6.1% 6.1% 6.1% -4.1% -4.1% -4.1% -0.1% 0.5% 0.4% 5.9% 6.1% 6.0% -4.1% -4.1% -4.1%
Total Cattle 0.5% 0.5% 0.5% 6.2% 6.2% 6.2% -6.7% -6.7% -6.7% -0.1% 0.3% 0.4% 6.1% 6.2% 6.1% -6.7% -6.7% -6.7%
Production 0.6% 0.6% 0.6% 5.6% 5.6% 5.6% -5.0% -5.0% -5.0% 0.2% 0.6% 0.5% 5.5% 5.6% 5.5% -5.0% -5.0% -5.0%
Scotland
Beef cows 0.1% 2.7% 0.5% 6.2% 8.4% 6.2% -11.8% -9.2% -11.8% -0.7% 17.4% 0.1% 6.1% 23.2% 6.2% -11.9% 7.7% -11.8%
Dairy cows 0.5% 0.4% 0.5% 6.1% 6.1% 6.1% -4.1% -4.2% -4.1% -0.1% -0.1% 0.4% 5.9% 5.6% 6.0% -4.2% -4.7% -4.1%
Total Cattle 0.4% 2.2% 0.6% 6.6% 8.1% 6.6% -9.1% -7.3% -9.1% -0.2% 12.8% 0.3% 6.5% 18.6% 6.5% -9.1% 4.6% -9.1%
Production 0.8% 2.4% 0.8% 7.5% 9.0% 7.5% -8.1% -6.5% -8.1% 0.4% 13.5% 0.6% 7.5% 19.8% 7.5% -8.2% 5.4% -8.2%
Northern Ireland
Beef cows 0.1% 0.4% 4.1% 6.1% 6.1% 9.6% -11.6% -11.6% -7.4% -0.7% -0.5% 8.5% 6.0% 6.0% 13.9% -11.7% -11.7% -1.8%
Dairy cows 0.3% 0.3% 0.1% 3.4% 3.4% 3.2% -2.3% -2.3% -2.5% 0.0% 0.3% 4.9% 3.3% 3.4% 7.8% -2.3% -2.3% 2.6%
Total Cattle 0.3% 0.4% 2.1% 4.9% 5.0% 6.6% -6.4% -6.4% -4.5% -0.1% 0.1% 6.7% 4.9% 4.9% 11.1% -6.5% -6.4% 0.7%
Production 0.6% 0.6% 2.2% 5.6% 5.6% 7.2% -5.8% -5.8% -4.0% 0.2% 0.6% 7.2% 5.5% 5.6% 12.0% -5.8% -5.8% 1.4%
20% Coupled Payments 100% Coupled Payments

86
Table A2-9 Projected changes in sheep sector due to changes in trade arrangements and provision of coupled payments (Percentage changes in 2027)
FTA FTA FTA WTO WTO WTO ND ND ND FTA FTA FTA WTO WTO WTO ND ND ND
20% Eng 20% Scot 20% NI 20% Eng 20% Scot 20% NI 20% Eng 20% Scot 20% NI 100% Eng 100% Scot 100% NI 100% Eng 100% Scot 100% NI 100% Eng 100% Scot 100% NI
UK
Ewes 0.0% -1.6% -1.6% -13.9% -14.9% -15.0% -12.2% -12.6% -12.6% -0.5% -0.6% -1.7% -14.2% -14.3% -15.0% -12.2% -12.2% -12.6%
Total Sheep 0.1% -1.5% -1.6% -13.6% -14.9% -14.9% -12.1% -12.7% -12.7% -0.4% -0.6% -1.7% -14.0% -14.2% -15.0% -12.2% -12.3% -12.7%
Production 0.3% -1.3% -1.3% -14.7% -17.3% -17.3% -14.5% -16.1% -16.1% -0.1% -0.4% -1.4% -15.3% -16.0% -17.5% -14.8% -15.3% -16.2%
Domestic use 1.0% 0.9% 0.9% 8.9% 7.0% 6.9% 9.7% 8.5% 8.5% 1.1% 1.2% 1.0% 8.4% 7.9% 6.9% 9.5% 9.1% 8.5%
Exports -3.5% -7.8% -7.8% -98.3% -98.8% -98.8% -98.9% -99.3% -99.3% -4.9% -6.0% -8.2% -98.4% -98.6% -98.8% -99.0% -99.1% -99.3%
Imports -0.9% -0.8% -0.8% -22.9% -22.0% -22.0% -21.8% -21.2% -21.2% -0.9% -0.9% -0.8% -22.7% -22.4% -21.9% -21.7% -21.5% -21.2%
Sheepmeat price -3.5% -3.2% -3.2% -27.0% -22.4% -22.3% -21.3% -18.4% -18.3% -3.4% -3.3% -3.2% -25.9% -24.6% -22.1% -20.7% -19.8% -18.2%
England
Ewes 1.9% -2.1% -2.1% -14.3% -18.0% -18.0% -12.2% -15.2% -15.2% 0.7% -2.2% -2.1% -15.1% -18.8% -17.9% -12.8% -16.2% -15.1%
Total Sheep 1.8% -2.0% -1.9% -13.8% -17.6% -17.6% -12.1% -15.1% -15.1% 0.7% -2.1% -1.9% -14.7% -18.3% -17.5% -12.7% -16.1% -15.0%
Production 2.4% -1.8% -1.8% -15.8% -21.6% -21.6% -15.6% -20.2% -20.2% 1.2% -2.1% -1.7% -17.0% -21.6% -21.6% -16.6% -20.8% -20.2%
Wales
Ewes -1.6% -1.4% -1.4% -13.5% -12.6% -12.6% -12.0% -10.6% -10.6% -1.5% -1.5% -1.4% -13.4% -13.2% -12.5% -11.7% -11.3% -10.5%
Total Sheep -1.7% -1.5% -1.5% -14.3% -13.4% -13.4% -12.8% -11.4% -11.3% -1.6% -1.6% -1.5% -14.2% -14.0% -13.3% -12.5% -12.1% -11.3%
Production -1.6% -1.3% -1.3% -13.9% -13.6% -13.6% -13.2% -12.2% -12.2% -1.4% -1.4% -1.3% -13.9% -13.8% -13.6% -13.0% -12.8% -12.2%
Scotland
Ewes -1.6% -0.7% -1.4% -13.0% -11.2% -12.1% -11.5% -9.2% -10.1% -1.5% 4.5% -1.4% -12.8% -5.5% -12.0% -11.2% -3.7% -10.1%
Total Sheep -1.4% -0.6% -1.2% -11.8% -10.3% -11.1% -10.7% -8.7% -9.5% -1.3% 4.1% -1.2% -11.7% -5.1% -11.1% -10.4% -3.6% -9.4%
Production -1.4% -0.3% -1.0% -12.6% -12.0% -12.9% -12.7% -11.3% -12.2% -1.1% 4.8% -1.0% -12.6% -5.8% -12.9% -12.5% -5.4% -12.1%
Northern Ireland
Ewes -2.0% -1.7% 0.1% -16.2% -15.0% -12.9% -14.4% -12.7% -10.4% -1.8% -1.8% -1.7% -16.0% -15.7% -14.6% -14.0% -13.6% -11.7%
Total Sheep -1.9% -1.7% 0.2% -16.0% -15.0% -12.9% -14.4% -12.8% -10.6% -1.8% -1.8% -1.6% -15.9% -15.6% -14.6% -14.0% -13.7% -11.8%
Production -1.9% -1.4% 0.6% -17.0% -17.3% -15.1% -17.0% -16.3% -13.8% -1.6% -1.6% -1.3% -17.1% -17.2% -16.9% -16.8% -16.7% -15.2%
20% Coupled Payments 100% Coupled Payments

87
Table A2-10 Projected changes in pig and poultry sectors due to changes in trade arrangements and provision of coupled payments (Percentage changes in 2027)
FTA FTA FTA WTO WTO WTO ND ND ND FTA FTA FTA WTO WTO WTO ND ND ND
20% Eng 20% Scot 20% NI 20% Eng 20% Scot 20% NI 20% Eng 20% Scot 20% NI 100% Eng 100% Scot 100% NI 100% Eng 100% Scot 100% NI 100% Eng 100% Scot 100% NI
Pigs (UK)
Sows 0.5% 0.6% 0.6% 9.7% 9.8% 9.8% -8.4% -8.3% -8.3% 0.8% 0.6% 0.6% 10.2% 9.7% 9.8% -8.3% -8.3% -8.3%
Total pigs 0.6% 0.6% 0.6% 10.2% 10.3% 10.3% -8.9% -8.8% -8.8% 0.9% 0.6% 0.6% 10.8% 10.3% 10.3% -8.8% -8.9% -8.8%
Production 0.6% 0.6% 0.6% 10.3% 10.3% 10.4% -9.0% -8.9% -8.9% 0.9% 0.6% 0.6% 10.8% 10.3% 10.3% -8.9% -8.9% -8.9%
Domestic use -0.2% -0.2% -0.2% -3.6% -3.5% -3.5% 3.5% 3.6% 3.6% -0.1% -0.2% -0.2% -3.6% -3.6% -3.5% 3.5% 3.5% 3.6%
Exports -0.4% -0.4% -0.4% -68.7% -68.7% -68.7% -68.1% -68.1% -68.1% -0.4% -0.5% -0.4% -68.7% -68.7% -68.7% -68.1% -68.1% -68.1%
Imports -1.1% -1.1% -1.1% -37.2% -37.1% -37.1% -3.3% -3.3% -3.3% -1.2% -1.1% -1.1% -37.7% -37.1% -37.0% -3.4% -3.3% -3.3%
Pigmeat price 0.5% 0.5% 0.5% 10.1% 10.1% 10.1% -9.5% -9.4% -9.4% 0.2% 0.5% 0.5% 10.0% 10.1% 10.2% -9.5% -9.4% -9.4%
Poultry (UK)
Production 0.1% 0.1% 0.1% 1.9% 1.9% 1.9% 1.7% 1.7% 1.7% 0.3% 0.1% 0.1% 2.4% 1.9% 1.9% 1.7% 1.7% 1.7%
Domestic use 0.0% 0.0% 0.0% -0.6% -0.6% -0.6% 0.0% 0.0% 0.0% 0.1% 0.0% 0.0% -0.5% -0.6% -0.6% 0.0% 0.0% 0.0%
Exports -1.4% -1.3% -1.3% 0.0% 0.0% 0.0% 0.0% 0.0% 0.0% -1.1% -1.4% -1.3% 0.0% 0.0% 0.0% 0.0% 0.0% 0.0%
Imports -1.3% -1.3% -1.3% -8.3% -8.3% -8.3% -5.5% -5.5% -5.5% -1.4% -1.3% -1.3% -9.6% -8.3% -8.3% -5.5% -5.5% -5.5%
Poultry price 0.2% 0.1% 0.1% 4.4% 4.2% 4.2% 0.7% 0.7% 0.7% -0.4% 0.2% 0.1% 3.8% 4.3% 4.3% 0.5% 0.7% 0.7%
20% Coupled Payments 100% Coupled Payments

88
Table A2- 11 Projected changes in dairy sector due to changes in trade arrangements and provision of coupled payments (Percentage changes in 2027)
FTA FTA FTA WTO WTO WTO ND ND ND FTA FTA FTA WTO WTO WTO ND ND ND
20% Eng 20% Scot 20% NI 20% Eng 20% Scot 20% NI 20% Eng 20% Scot 20% NI 100% Eng 100% Scot 100% NI 100% Eng 100% Scot 100% NI 100% Eng 100% Scot 100% NI
UK
Cow's milk Production 0.3% 0.4% 0.4% 5.3% 5.3% 5.3% -3.6% -3.6% -3.6% 2.8% 0.4% 1.1% 8.0% 5.3% 6.0% -0.6% -3.6% -2.8%
Manufacturing use 0.9% 1.0% 0.9% 12.4% 12.6% 12.6% -8.9% -8.8% -8.8% 5.3% 0.9% 2.3% 17.5% 12.5% 13.8% -3.1% -8.9% -7.3%
Prices
Producer milk price 1.4% 1.4% 1.4% 19.3% 19.3% 19.3% -13.4% -13.4% -13.4% -0.6% 1.4% 1.3% 18.5% 19.3% 19.0% -13.6% -13.4% -13.4%
Cheese price 1.2% 1.2% 1.2% 17.5% 17.5% 17.5% -12.9% -12.9% -12.9% -0.5% 1.2% 1.2% 17.1% 17.5% 17.4% -13.0% -12.9% -12.9%
Butter price 0.7% 0.7% 0.7% 12.9% 12.8% 12.9% -4.8% -4.8% -4.8% -0.3% 0.7% 0.5% 9.5% 12.9% 10.9% -5.0% -4.8% -4.9%
WMP price 0.0% 0.0% 0.0% 0.0% 0.0% 0.0% 0.0% 0.0% 0.0% 0.0% 0.0% 0.0% -0.1% 0.0% -0.1% 0.0% 0.0% 0.0%
SMP price 0.0% 0.0% 0.0% -0.1% -0.1% -0.1% -0.1% -0.1% -0.1% 0.0% 0.0% 0.0% -0.1% -0.1% -0.1% -0.1% -0.1% -0.1%
Cheese
Production 0.9% 1.0% 1.0% 17.1% 17.2% 17.2% -4.5% -4.3% -4.3% 5.7% 0.9% 1.3% 22.9% 17.1% 17.9% 1.8% -4.4% -3.6%
Domestic use -0.2% -0.2% -0.2% -2.7% -2.7% -2.7% 2.4% 2.4% 2.4% 0.1% -0.2% -0.2% -2.6% -2.7% -2.7% 2.4% 2.4% 2.4%
Exports -1.5% -1.5% -1.5% -81.4% -81.4% -81.4% -37.0% -36.9% -36.9% -0.7% -1.5% -1.3% -81.4% -81.4% -81.4% -32.7% -36.9% -36.4%
Imports -1.5% -1.6% -1.6% -43.3% -43.4% -43.4% -4.6% -4.6% -4.6% -4.7% -1.5% -1.8% -47.8% -43.3% -43.9% -8.1% -4.6% -5.0%
Butter
Production 0.6% 0.6% 0.6% 22.3% 22.3% 22.3% 4.4% 4.5% 4.5% 2.7% 0.6% 1.5% 23.5% 22.3% 23.0% 7.4% 4.5% 5.9%
Domestic use -0.2% -0.2% -0.2% -3.7% -3.7% -3.7% 1.5% 1.5% 1.5% 0.1% -0.2% -0.1% -2.8% -3.7% -3.2% 1.6% 1.5% 1.5%
Exports -6.0% -5.8% -5.9% -100.0% -100.0% -100.0% -95.3% -95.3% -95.3% -3.5% -5.9% -4.2% -100.0% -100.0% -100.0% -95.2% -95.3% -95.2%
Imports -4.7% -4.7% -4.7% -98.4% -98.4% -98.4% -55.9% -56.0% -55.9% -6.1% -4.7% -5.0% -98.4% -98.4% -98.4% -60.5% -55.9% -58.2%
England
Milk production 0.3% 0.4% 0.4% 5.0% 5.1% 5.1% -3.5% -3.4% -3.4% 4.6% 0.4% 0.4% 9.5% 5.1% 5.1% 1.4% -3.4% -3.4%
Dairy cows 0.2% 0.3% 0.3% 4.0% 4.1% 4.1% -2.9% -2.8% -2.8% 4.6% 0.3% 0.3% 8.4% 4.1% 4.1% 2.1% -2.8% -2.8%
Milk price 1.4% 1.4% 1.4% 19.3% 19.3% 19.3% -13.4% -13.4% -13.4% -0.6% 1.4% 1.3% 18.5% 19.3% 19.0% -13.6% -13.4% -13.4%
Wales
Milk production 0.5% 0.5% 0.5% 7.0% 7.0% 7.0% -4.6% -4.6% -4.6% -0.1% 0.5% 0.5% 6.7% 7.0% 6.8% -4.7% -4.6% -4.7%
Dairy cows 0.5% 0.5% 0.5% 6.1% 6.1% 6.1% -4.1% -4.1% -4.1% -0.1% 0.5% 0.4% 5.9% 6.1% 6.0% -4.1% -4.1% -4.1%
Milk price 1.4% 1.3% 1.3% 18.5% 18.5% 18.5% -12.8% -12.8% -12.8% -0.5% 1.3% 1.2% 17.6% 18.5% 18.2% -13.0% -12.8% -12.8%
Scotland
Milk production 0.5% 0.5% 0.5% 6.9% 6.9% 6.9% -4.6% -4.7% -4.6% -0.1% 0.0% 0.5% 6.7% 6.4% 6.8% -4.7% -5.2% -4.6%
Dairy cows 0.5% 0.4% 0.5% 6.1% 6.1% 6.1% -4.1% -4.2% -4.1% -0.1% -0.1% 0.4% 5.9% 5.6% 6.0% -4.2% -4.7% -4.1%
Milk price 1.4% 1.3% 1.3% 18.8% 18.7% 18.7% -13.0% -13.0% -13.0% -0.5% 1.4% 1.2% 17.9% 18.7% 18.4% -13.2% -13.0% -13.0%
Northern Ireland
Milk production 0.3% 0.3% 0.1% 3.8% 3.8% 3.7% -2.6% -2.6% -2.8% 0.0% 0.3% 5.0% 3.7% 3.8% 8.3% -2.6% -2.6% 2.2%
Dairy cows 0.3% 0.3% 0.1% 3.4% 3.4% 3.2% -2.3% -2.3% -2.5% 0.0% 0.3% 4.9% 3.3% 3.4% 7.8% -2.3% -2.3% 2.6%
Milk price 0.8% 0.8% 0.8% 11.9% 11.9% 11.9% -8.4% -8.4% -8.4% -0.3% 0.8% 0.8% 11.4% 11.9% 11.7% -8.6% -8.4% -8.5%
20% Coupled Payments 100% Coupled Payments
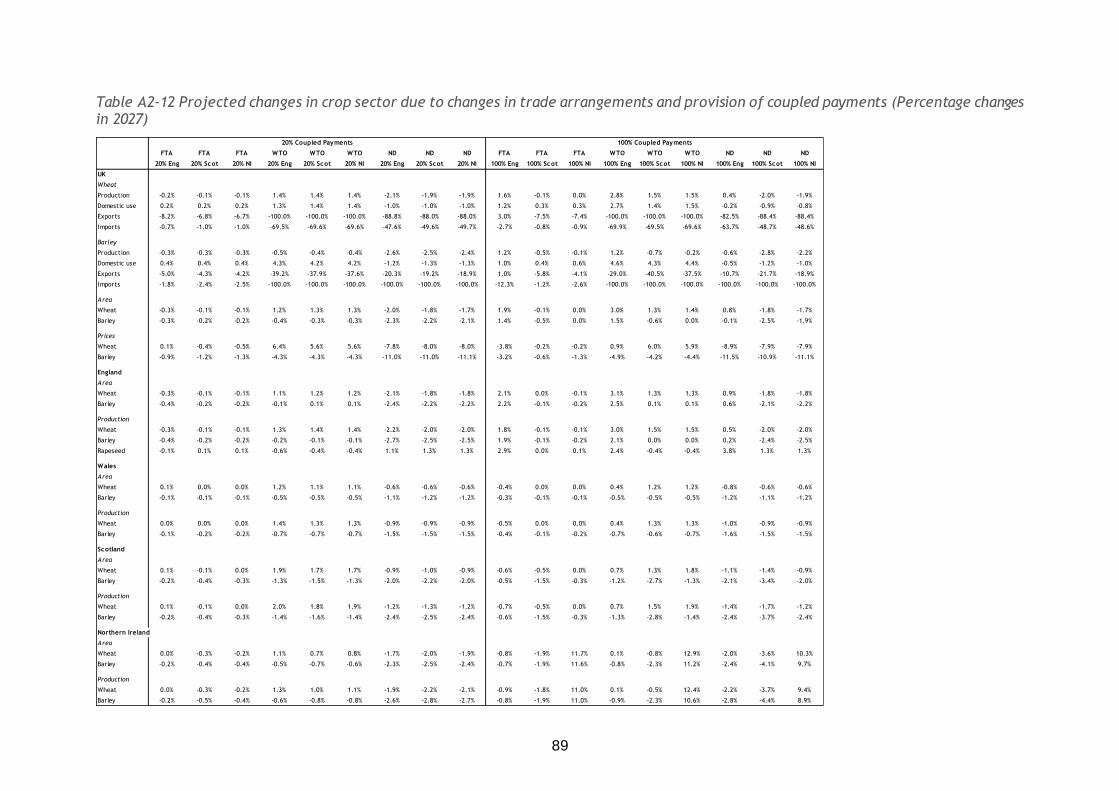
89
Table A2-12 Projected changes in crop sector due to changes in trade arrangements and provision of coupled payments (Percentage changes in 2027)
FTA FTA FTA WTO WTO WTO ND ND ND FTA FTA FTA WTO WTO WTO ND ND ND
20% Eng 20% Scot 20% NI 20% Eng 20% Scot 20% NI 20% Eng 20% Scot 20% NI 100% Eng 100% Scot 100% NI 100% Eng 100% Scot 100% NI 100% Eng 100% Scot 100% NI
UK
Wheat
Production -0.2% -0.1% -0.1% 1.4% 1.4% 1.4% -2.1% -1.9% -1.9% 1.6% -0.1% 0.0% 2.8% 1.5% 1.5% 0.4% -2.0% -1.9%
Domestic use 0.2% 0.2% 0.2% 1.3% 1.4% 1.4% -1.0% -1.0% -1.0% 1.2% 0.3% 0.3% 2.7% 1.4% 1.5% -0.2% -0.9% -0.8%
Exports -8.2% -6.8% -6.7% -100.0% -100.0% -100.0% -88.8% -88.0% -88.0% 3.0% -7.5% -7.4% -100.0% -100.0% -100.0% -82.5% -88.4% -88.4%
Imports -0.7% -1.0% -1.0% -69.5% -69.6% -69.6% -47.6% -49.6% -49.7% -2.7% -0.8% -0.9% -69.9% -69.5% -69.6% -63.7% -48.7% -48.6%
Barley
Production -0.3% -0.3% -0.3% -0.5% -0.4% -0.4% -2.6% -2.5% -2.4% 1.2% -0.5% -0.1% 1.2% -0.7% -0.2% -0.6% -2.8% -2.2%
Domestic use 0.4% 0.4% 0.4% 4.3% 4.2% 4.2% -1.2% -1.3% -1.3% 1.0% 0.4% 0.6% 4.6% 4.3% 4.4% -0.5% -1.2% -1.0%
Exports -5.0% -4.3% -4.2% -39.2% -37.9% -37.6% -20.3% -19.2% -18.9% 1.0% -5.8% -4.1% -29.0% -40.5% -37.5% -10.7% -21.7% -18.9%
Imports -1.8% -2.4% -2.5% -100.0% -100.0% -100.0% -100.0% -100.0% -100.0% -12.3% -1.2% -2.6% -100.0% -100.0% -100.0% -100.0% -100.0% -100.0%
Area
Wheat -0.3% -0.1% -0.1% 1.2% 1.3% 1.3% -2.0% -1.8% -1.7% 1.9% -0.1% 0.0% 3.0% 1.3% 1.4% 0.8% -1.8% -1.7%
Barley -0.3% -0.2% -0.2% -0.4% -0.3% -0.3% -2.3% -2.2% -2.1% 1.4% -0.5% 0.0% 1.5% -0.6% 0.0% -0.1% -2.5% -1.9%
Prices
Wheat 0.1% -0.4% -0.5% 6.4% 5.6% 5.6% -7.8% -8.0% -8.0% -3.8% -0.2% -0.2% 0.9% 6.0% 5.9% -8.9% -7.9% -7.9%
Barley -0.9% -1.2% -1.3% -4.3% -4.3% -4.3% -11.0% -11.0% -11.1% -3.2% -0.6% -1.3% -4.9% -4.2% -4.4% -11.5% -10.9% -11.1%
England
Area
Wheat -0.3% -0.1% -0.1% 1.1% 1.2% 1.2% -2.1% -1.8% -1.8% 2.1% 0.0% -0.1% 3.1% 1.3% 1.3% 0.9% -1.8% -1.8%
Barley -0.4% -0.2% -0.2% -0.1% 0.1% 0.1% -2.4% -2.2% -2.2% 2.2% -0.1% -0.2% 2.5% 0.1% 0.1% 0.6% -2.1% -2.2%
Production
Wheat -0.3% -0.1% -0.1% 1.3% 1.4% 1.4% -2.2% -2.0% -2.0% 1.8% -0.1% -0.1% 3.0% 1.5% 1.5% 0.5% -2.0% -2.0%
Barley -0.4% -0.2% -0.2% -0.2% -0.1% -0.1% -2.7% -2.5% -2.5% 1.9% -0.1% -0.2% 2.1% 0.0% 0.0% 0.2% -2.4% -2.5%
Rapeseed -0.1% 0.1% 0.1% -0.6% -0.4% -0.4% 1.1% 1.3% 1.3% 2.9% 0.0% 0.1% 2.4% -0.4% -0.4% 3.8% 1.3% 1.3%
Wales
Area
Wheat 0.1% 0.0% 0.0% 1.2% 1.1% 1.1% -0.6% -0.6% -0.6% -0.4% 0.0% 0.0% 0.4% 1.2% 1.2% -0.8% -0.6% -0.6%
Barley -0.1% -0.1% -0.1% -0.5% -0.5% -0.5% -1.1% -1.2% -1.2% -0.3% -0.1% -0.1% -0.5% -0.5% -0.5% -1.2% -1.1% -1.2%
Production
Wheat 0.0% 0.0% 0.0% 1.4% 1.3% 1.3% -0.9% -0.9% -0.9% -0.5% 0.0% 0.0% 0.4% 1.3% 1.3% -1.0% -0.9% -0.9%
Barley -0.1% -0.2% -0.2% -0.7% -0.7% -0.7% -1.5% -1.5% -1.5% -0.4% -0.1% -0.2% -0.7% -0.6% -0.7% -1.6% -1.5% -1.5%
Scotland
Area
Wheat 0.1% -0.1% 0.0% 1.9% 1.7% 1.7% -0.9% -1.0% -0.9% -0.6% -0.5% 0.0% 0.7% 1.3% 1.8% -1.1% -1.4% -0.9%
Barley -0.2% -0.4% -0.3% -1.3% -1.5% -1.3% -2.0% -2.2% -2.0% -0.5% -1.5% -0.3% -1.2% -2.7% -1.3% -2.1% -3.4% -2.0%
Production
Wheat 0.1% -0.1% 0.0% 2.0% 1.8% 1.9% -1.2% -1.3% -1.2% -0.7% -0.5% 0.0% 0.7% 1.5% 1.9% -1.4% -1.7% -1.2%
Barley -0.2% -0.4% -0.3% -1.4% -1.6% -1.4% -2.4% -2.5% -2.4% -0.6% -1.5% -0.3% -1.3% -2.8% -1.4% -2.4% -3.7% -2.4%
Northern Ireland
Area
Wheat 0.0% -0.3% -0.2% 1.1% 0.7% 0.8% -1.7% -2.0% -1.9% -0.8% -1.9% 11.7% 0.1% -0.8% 12.9% -2.0% -3.6% 10.3%
Barley -0.2% -0.4% -0.4% -0.5% -0.7% -0.6% -2.3% -2.5% -2.4% -0.7% -1.9% 11.6% -0.8% -2.3% 11.2% -2.4% -4.1% 9.7%
Production
Wheat 0.0% -0.3% -0.2% 1.3% 1.0% 1.1% -1.9% -2.2% -2.1% -0.9% -1.8% 11.0% 0.1% -0.5% 12.4% -2.2% -3.7% 9.4%
Barley -0.2% -0.5% -0.4% -0.6% -0.8% -0.8% -2.6% -2.8% -2.7% -0.8% -1.9% 11.0% -0.9% -2.3% 10.6% -2.8% -4.4% 8.9%
20% Coupled Payments 100% Coupled Payments

90
Table A2-13 Projected changes in value of output due to changes in trade arrangements and provision of coupled payments (Percentage changes in 2027)
FTA FTA FTA WTO WTO WTO ND ND ND FTA FTA FTA WTO WTO WTO ND ND ND
20% Eng 20% Scot 20% NI 20% Eng 20% Scot 20% NI 20% Eng 20% Scot 20% NI 100% Eng 100% Scot 100% NI 100% Eng 100% Scot 100% NI 100% Eng 100% Scot 100% NI
UK
Wheat -0.2% -0.5% -0.6% 7.9% 7.1% 7.1% -9.8% -9.8% -9.8% -2.2% -0.3% -0.3% 3.7% 7.5% 7.5% -8.6% -9.7% -9.6%
Barley -1.2% -1.5% -1.5% -4.8% -4.8% -4.7% -13.3% -13.2% -13.2% -2.1% -1.1% -1.3% -3.7% -4.9% -4.6% -12.0% -13.4% -13.0%
Oats -1.0% -1.2% -1.2% -3.8% -3.7% -3.7% -10.5% -10.4% -10.4% -1.1% -0.7% -1.0% -2.4% -3.7% -3.6% -9.0% -10.4% -10.3%
Rapeseed -0.1% 0.1% 0.1% -0.6% -0.3% -0.3% 1.1% 1.3% 1.3% 2.7% -0.1% 0.1% 2.3% -0.5% -0.3% 3.6% 1.2% 1.3%
Total Crops -0.4% -0.7% -0.7% 3.2% 2.9% 2.9% -8.8% -8.7% -8.7% -1.3% -0.4% -0.5% 1.6% 3.0% 3.2% -7.3% -8.7% -8.6%
Cattle 1.5% 0.9% 0.9% 15.1% 14.3% 14.3% -26.0% -26.6% -26.7% 1.0% 0.9% 1.5% 16.2% 16.1% 14.9% -25.0% -25.2% -26.1%
Pig 1.1% 1.1% 1.1% 21.4% 21.5% 21.6% -17.6% -17.5% -17.5% 1.1% 1.2% 1.1% 21.9% 21.4% 21.5% -17.6% -17.5% -17.5%
Sheep -3.2% -4.5% -4.5% -37.7% -35.8% -35.8% -32.7% -31.5% -31.5% -3.5% -3.8% -4.6% -37.3% -36.7% -35.7% -32.4% -32.1% -31.4%
Poultry 0.3% 0.3% 0.3% 6.4% 6.2% 6.2% 2.4% 2.4% 2.4% -0.2% 0.3% 0.3% 6.3% 6.3% 6.3% 2.2% 2.4% 2.4%
Total Livestock 0.4% -0.1% -0.1% 5.2% 5.2% 5.2% -18.3% -18.4% -18.4% 0.0% 0.0% 0.1% 5.8% 5.8% 5.5% -17.9% -17.9% -18.1%
Milk 1.7% 1.7% 1.7% 24.4% 24.4% 24.4% -15.8% -15.7% -15.7% 2.3% 1.7% 2.3% 26.8% 24.4% 24.8% -13.3% -15.7% -15.1%
Total UK Agric. Value of Output 0.5% 0.2% 0.2% 9.8% 9.7% 9.7% -15.6% -15.6% -15.6% 0.3% 0.4% 0.5% 10.4% 10.0% 10.0% -14.4% -15.3% -15.3%
Individual Country Total Agric . Value of Output
England 0.8% 0.2% 0.2% 10.5% 10.1% 10.1% -13.9% -14.2% -14.2% 1.2% 0.0% 0.2% 11.6% 10.0% 10.1% -12.1% -14.3% -14.2%
Wales -0.4% -0.2% -0.2% 5.9% 6.9% 6.9% -21.9% -21.1% -21.1% -1.9% -0.8% -0.3% 5.5% 6.3% 6.8% -21.9% -21.6% -21.1%
Scotland -0.1% 0.5% -0.1% 7.1% 8.2% 7.7% -20.3% -19.3% -19.8% -1.8% 3.9% -0.2% 6.5% 12.0% 7.6% -20.4% -16.2% -19.8%
Northern Ireland 0.4% 0.5% 1.0% 11.0% 11.1% 11.7% -15.6% -15.4% -14.9% -0.9% -0.2% 4.4% 10.6% 10.9% 15.2% -15.7% -15.6% -11.9%
Individual Country Value of Output + Direct Payments (Pillar 1 + Pillar 2)
England 0.7% 0.2% 0.2% 8.8% 8.5% 8.5% -11.7% -11.9% -11.9% 1.0% 0.0% 0.2% 9.8% 8.4% 8.4% -10.2% -12.0% -11.9%
Wales -0.3% -0.2% -0.2% 4.8% 5.6% 5.6% -17.7% -17.1% -17.1% -1.6% -0.6% -0.2% 4.4% 5.1% 5.5% -17.7% -17.4% -17.1%
Scotland -0.1% 0.4% -0.1% 5.4% 6.3% 5.8% -15.4% -14.7% -15.0% -1.4% 3.0% -0.1% 4.9% 9.1% 5.7% -15.5% -12.3% -15.0%
Northern Ireland 0.3% 0.4% 0.9% 9.2% 9.3% 9.8% -13.0% -12.9% -12.5% -0.7% -0.1% 3.7% 8.9% 9.2% 12.7% -13.1% -13.0% -9.9%
20% Coupled Payments 100% Coupled Payments

91
Table A2-14 Projected changes in consumer prices due to changes in trade arrangements and provision of coupled payments (Percentage changes in 2027)
FTA FTA FTA WTO WTO WTO ND ND ND FTA FTA FTA WTO WTO WTO ND ND ND
20% Eng 20% Scot 20% NI 20% Eng 20% Scot 20% NI 20% Eng 20% Scot 20% NI 100% Eng 100% Scot 100% NI 100% Eng 100% Scot 100% NI 100% Eng 100% Scot 100% NI
Beef Price -0.1% 0.0% 0.0% 3.8% 3.8% 3.8% -10.8% -10.8% -10.8% -0.8% -0.9% 0.0% 3.7% 3.7% 3.8% -10.9% -10.9% -10.8%
Sheepmeat Price -1.6% -1.5% -1.5% -12.7% -10.5% -10.5% -10.0% -8.6% -8.6% -1.6% -1.6% -1.5% -12.2% -11.6% -10.4% -9.7% -9.3% -8.6%
Pigmeat Price 0.2% 0.2% 0.2% 3.8% 3.9% 3.9% -3.6% -3.6% -3.6% 0.1% 0.2% 0.2% 3.8% 3.8% 3.9% -3.6% -3.6% -3.6%
Cheese Price 0.6% 0.6% 0.6% 8.5% 8.5% 8.5% -6.3% -6.3% -6.3% -0.2% 0.6% 0.6% 8.3% 8.5% 8.5% -6.4% -6.3% -6.3%
Butter Price 0.5% 0.5% 0.5% 8.7% 8.7% 8.7% -3.2% -3.2% -3.2% -0.2% 0.5% 0.3% 6.4% 8.7% 7.4% -3.4% -3.2% -3.3%
Wheat Price 0.0% -0.1% -0.1% 0.9% 0.8% 0.8% -1.1% -1.1% -1.1% -0.5% 0.0% 0.0% 0.1% 0.8% 0.8% -1.3% -1.1% -1.1%
20% Coupled Payments 100% Coupled Payments

92
Appendix 3: Sensitivity analysis using alternative rest of the
world beef price
The precise level of the world beef price is an important area of uncertainty in the post -Brexit
era. Within the preceding analyses (both the main report and Appendices 1 & 2), the
Brazilian producer beef price is used as the reference world price. Currently, this reference
price is substantially lower than the existing Brazilian beef export price. This partly reflects
transport costs from farm-to-port, tariff quota rent extraction and the existing emphasis by
Brazil on exporting higher value cuts. The future differential between the Brazilian producer
and export price is unclear. The hard Brexit scenarios considered in this study (WTO and
ND Tariffs) are non-discriminatory in nature, i.e. the same tariffs are applied to all trading
partners. Hence, depending on the competitiveness of other exporters, Brazil may not be
able to extract the same level of rents. Moreover, following the change in trade
arrangements these scenarios entail imports from the rest of the world displacing to some
extent existing imports from the EU. Given this displacement, the higher level of imports to
the UK from the rest of the world are likely to include a greater variety of cuts, including
lower value cuts. In addition, internal Brazilian transport costs may diminish overtime with
improved infrastructure.
Within the sensitivity analysis in this appendix, the Brazilian export price for beef is used as a
reference price for the rest of the world. Given the uncertainty noted above, this may be
interpreted as an upper bound for the rest of the world price, whereas the Brazilian producer
price used in the main analysis (and appendices 1 & 2) provides a lower bound. In order to
approximate the export price, the Brazilian producer price within the modelling system is
multiplied by 1.6 (differential between the Brazilian producer and export prices), while the UK
producer price is multiplied by 1.11 (adjustment for differences in types of cuts). The model
is simulated for specific scenarios in order to demonstrate the implications of this alternative
world beef price.
Table A3.1 shows the results for changes in trade arrangements and full elimination of direct
payments using the 30% decoupling assumption (right hand-side). The original results are
presented on the left hand-side for comparison purposes. Unsurprisingly, employing the
alternative beef price for the rest of the world lifts the domestic price impact for the WTO
scenarios (Figure A3.1, left-hand side). The UK beef price is 24.9% higher compared to the
Baseline based on changes in trade arrangements on a stand-alone basis (WTO - No
Change in direct payments). This compares with plus 8.0% under the main analysis.
However, the differential between the combined scenario (WTO – 100% reduction in direct
payments) and the change in trade arrangements (WTO No Change) is similar to before
(+0.7%, compared to +0.3%). As before, the ‘World Beef Price + Tariff level’ curbs further
price increases. With regards to the No deal Tariff Arrangements scenario, the price
reduction due to the change in trade arrangements is much less substantial than before, -
1.0% (compared to -22.5% under the main analysis - see illustration in Figure A3.1, right-
hand side). However, the differential between the combined trade/full elimination in direct
payment scenario and the trade scenario is minimal as before. A similar story applies when
the 100% decoupling assumption is employed (Table A3.2), with different projected price
impacts for the combined scenario compared to the baseline, but limited price differences
between the combined hard Brexit trade scenarios and the change in trade arrangements.
Likewise, the price differential between the combined scenario and the corresponding trade
scenario is similar regardless of the world price (see 100% coupled payment scenario in
Table A3.3).

93
Figure A3-1 Illustration of different price impacts under alterative trade arrangements and world beef prices

94
Table A3-1 Projected changes in beef sector due to changes in Pillar I Payments using alternative world beef prices (30% decoupling assumption)
Original World Beef Price Sensitivity Analysis World Beef Price
Trade Arrangements FTA FTA WTO WTO
ND
Tariffs
ND
Tariffs FTA FTA WTO WTO
ND
Tariffs
ND
Tariffs
Direct Payments
No
change
100%
red.
No
change
100%
red.
No
change
100%
red.
No
change
100%
red.
No
change
100%
red.
No
change
100%
red.
UK Beef cows 0.6% -4.1% 6.6% 1.8% -12.6% -17.6% 0.5% -3.2% 17.8% 13.1% 1.0% -4.1%
Dairy cows 0.4% -0.2% 4.4% 3.9% -3.0% -3.6% 0.4% -0.2% 5.0% 4.4% -2.3% -2.9%
Production 0.6% -1.7% 5.6% 3.3% -5.6% -8.0% 0.5% -1.9% 10.4% 8.1% -0.2% -2.6%
Cattle price 0.0% 0.2% 8.0% 8.3% -22.5% -22.3% 0.4% 4.3% 24.9% 25.6% -1.0% -0.7%
England
Beef cows 0.6% -2.3% 7.3% 4.1% -13.8% -16.9% 0.6% -1.2% 19.5% 16.5% 1.0% -2.2%
Dairy cows 0.3% -0.2% 4.1% 3.6% -2.8% -3.4% 0.4% -0.2% 4.7% 4.1% -2.1% -2.8%
Production 0.5% -0.7% 5.1% 3.8% -4.9% -6.2% 0.5% -0.9% 9.1% 7.8% -0.3% -1.6%
Wales
Beef cows 0.5% -3.2% 5.9% 2.0% -11.0% -15.0% 0.5% -2.4% 15.8% 11.9% 1.0% -3.0%
Dairy cows 0.5% 0.0% 6.1% 5.6% -4.1% -4.6% 0.5% 0.1% 6.8% 6.4% -3.1% -3.7%
Production 0.6% -1.0% 5.6% 3.9% -5.0% -6.6% 0.5% -1.2% 9.4% 7.7% -0.7% -2.3%
Scotland
Beef cows 0.5% -5.6% 6.2% 0.1% -11.8% -18.4% 0.5% -4.8% 16.7% 10.7% 0.9% -5.7%
Dairy cows 0.5% 0.0% 6.1% 5.6% -4.1% -4.6% 0.5% 0.1% 6.9% 6.4% -3.1% -3.7%
Production 0.8% -3.6% 7.5% 3.1% -8.1% -12.8% 0.7% -4.0% 15.1% 10.7% 0.4% -4.3%
Northern Ireland
Beef cows 0.5% -7.4% 6.1% -2.0% -11.6% -19.8% 0.5% -6.7% 16.4% 8.2% 0.8% -7.5%
Dairy cows 0.3% -0.6% 3.4% 2.6% -2.3% -3.1% 0.3% -0.5% 3.8% 3.0% -1.7% -2.6%
Production 0.6% -3.6% 5.6% 1.3% -5.8% -10.1% 0.5% -3.8% 10.6% 6.3% -0.1% -4.4%

95
Table A3-2 Projected changes in beef sector due to changes in Pillar I Payments using alternative world beef prices (100% decoupling assumption)
Original World Beef Price Sensitivity Analysis World Beef Price
Trade
Arrangements FTA FTA WTO WTO
ND
Tariffs
ND
Tariffs FTA FTA WTO WTO
ND
Tariffs
ND
Tariffs
Direct Payments
No
change
100%
red.
No
change
100%
red.
No
change
100%
red.
No
change
100%
red.
No
change
100%
red.
No
change
100%
red.
UK Beef cows 0.5% -14.2% 6.5% -8.1% -12.1% -27.0% 0.5% -12.7% 17.7% 3.1% 1.3% -13.8%
Dairy cows 0.3% -1.7% 4.4% 2.4% -2.9% -5.1% 0.4% -1.5% 4.9% 3.0% -2.2% -4.4%
Production 0.6% -6.5% 5.5% -1.6% -5.5% -12.7% 0.5% -6.5% 10.3% 3.1% -0.1% -7.4%
Cattle price 0.1% 0.5% 8.1% 9.0% -21.4% -20.7% 0.5% 4.1% 24.1% 26.4% -0.7% 0.3%
England
Beef cows 0.6% -10.0% 7.1% -3.4% -13.3% -23.8% 0.6% -8.1% 19.3% 9.0% 1.4% -9.4%
Dairy cows 0.3% -1.6% 4.0% 2.1% -2.7% -4.8% 0.4% -1.5% 4.6% 2.7% -2.1% -4.2%
Production 0.5% -3.9% 4.9% 0.5% -4.8% -9.2% 0.5% -3.8% 9.0% 4.5% -0.2% -4.7%
Wales
Beef cows 0.5% -12.8% 5.8% -7.4% -10.5% -23.8% 0.5% -11.4% 15.6% 2.5% 1.3% -12.2%
Dairy cows 0.5% -1.2% 6.0% 4.4% -4.0% -5.9% 0.5% -0.9% 6.7% 5.2% -3.1% -4.9%
Production 0.6% -4.9% 5.4% 0.0% -4.9% -10.4% 0.5% -4.9% 9.2% 3.7% -0.6% -6.2%
Scotland
Beef cows 0.5% -14.2% 6.1% -8.4% -11.4% -26.5% 0.5% -12.8% 16.6% 2.3% 1.1% -13.9%
Dairy cows 0.5% -1.3% 6.0% 4.4% -4.1% -6.0% 0.5% -1.0% 6.8% 5.2% -3.1% -5.0%
Production 0.8% -10.0% 7.3% -3.3% -8.0% -18.9% 0.7% -10.0% 15.0% 4.2% 0.5% -10.5%
Northern Ireland
Beef cows 0.5% -26.7% 6.0% -21.2% -11.2% -38.4% 0.5% -25.6% 16.2% -11.2% 1.1% -26.7%
Dairy cows 0.3% -2.5% 3.3% 0.6% -2.2% -5.1% 0.3% -2.3% 3.7% 1.1% -1.7% -4.6%
Production 0.6% -13.6% 5.4% -8.7% -5.7% -19.9% 0.5% -13.6% 10.4% -3.9% 0.0% -14.4%

96
Table A3-3 Projected changes in beef sector due to provision of 100% coupled payments using alternative world beef prices (30% decoupling assumption)
Trade Arrangements FTA FTA FTA FTA WTO WTO WTO WTO ND Tariffs ND Tariffs ND Tariffs ND Tariffs FTA FTA FTA FTA WTO WTO WTO WTO ND Tariffs ND Tariffs ND Tariffs ND Tariffs
Direct Payments Same 100%_EN 100%_SC 100%_NI No Move 100%_EN 100%_SC 100%_NI No move 100%_EN 100%_SC 100%_NI Same 100%_EN 100%_SC 100%_NI No Move 100%_EN 100%_SC 100%_NI No move 100%_EN 100%_SC 100%_NI
UK
Beef cows 0.6% 2.4% 4.2% 1.5% 6.6% 9.4% 11.0% 7.9% -12.6% -9.0% -7.5% -11.0% 0.5% 2.4% 4.1% 1.3% 17.8% 20.2% 21.9% 18.9% 1.0% 4.1% 5.8% 2.4%
Dairy cows 0.4% 2.8% 0.3% 1.1% 4.4% 7.0% 4.4% 5.1% -3.0% -0.1% -3.0% -2.2% 0.4% 2.8% 0.3% 1.1% 5.0% 7.6% 5.0% 5.7% -2.3% 0.7% -2.3% -1.5%
Production 0.6% 2.8% 2.8% 1.5% 5.6% 8.0% 7.8% 6.6% -5.6% -2.9% -3.2% -4.5% 0.5% 2.9% 2.9% 1.5% 10.4% 12.7% 12.5% 11.3% -0.2% 2.4% 2.1% 0.8%
Cattle price 0.0% -1.7% -1.9% 0.0% 8.0% 7.7% 7.7% 7.8% -22.5% -22.7% -22.7% -22.6% 0.4% -3.2% -3.3% -1.1% 24.9% 24.0% 24.1% 24.5% -1.0% -1.2% -1.2% -1.1%
England
Beef cows 0.6% 6.1% -0.6% 0.1% 7.3% 13.4% 7.1% 7.2% -13.8% -5.9% -13.8% -13.8% 0.6% 6.2% -0.9% -0.2% 19.5% 25.1% 19.2% 19.4% 1.0% 8.1% 1.0% 1.0%
Dairy cows 0.3% 4.6% 0.3% 0.3% 4.1% 8.4% 4.1% 4.1% -2.8% 2.1% -2.8% -2.8% 0.4% 4.7% 0.4% 0.3% 4.7% 9.0% 4.7% 4.6% -2.1% 2.8% -2.1% -2.1%
Production 0.5% 4.8% 0.5% 0.4% 5.1% 9.4% 5.1% 5.0% -4.9% 0.1% -4.9% -4.9% 0.5% 5.0% 0.6% 0.4% 9.1% 13.4% 9.1% 9.1% -0.3% 4.5% -0.3% -0.3%
Wales
Beef cows 0.5% -0.5% -0.5% 0.1% 5.9% 5.9% 5.8% 5.9% -11.0% -11.1% -11.1% -11.0% 0.5% -0.8% -0.7% -0.1% 15.8% 15.6% 15.5% 15.7% 1.0% 1.0% 0.9% 1.0%
Dairy cows 0.5% -0.1% 0.5% 0.4% 6.1% 5.9% 6.1% 6.0% -4.1% -4.1% -4.1% -4.1% 0.5% -0.1% 0.5% 0.5% 6.8% 6.6% 6.8% 6.7% -3.1% -3.2% -3.1% -3.1%
Production 0.6% 0.2% 0.6% 0.5% 5.6% 5.5% 5.6% 5.5% -5.0% -5.0% -5.0% -5.0% 0.5% 0.2% 0.6% 0.5% 9.4% 9.3% 9.4% 9.3% -0.7% -0.7% -0.7% -0.7%
Scotland
Beef cows 0.5% -0.7% 17.4% 0.1% 6.2% 6.1% 23.2% 6.2% -11.8% -11.9% 7.7% -11.8% 0.5% -0.9% 18.0% -0.1% 16.7% 16.4% 33.0% 16.6% 0.9% 0.8% 19.4% 0.8%
Dairy cows 0.5% -0.1% -0.1% 0.4% 6.1% 5.9% 5.6% 6.0% -4.1% -4.2% -4.7% -4.1% 0.5% -0.1% 0.0% 0.5% 6.9% 6.7% 6.4% 6.8% -3.1% -3.2% -3.7% -3.1%
Production 0.8% 0.4% 13.5% 0.6% 7.5% 7.5% 19.8% 7.5% -8.1% -8.2% 5.4% -8.2% 0.7% 0.5% 14.0% 0.7% 15.1% 15.1% 27.2% 15.1% 0.4% 0.3% 13.4% 0.4%
Northern Ireland
Beef cows 0.5% -0.7% -0.5% 8.5% 6.1% 6.0% 6.0% 13.9% -11.6% -11.7% -11.7% -1.8% 0.5% -0.9% -0.8% 8.7% 16.4% 16.1% 16.1% 23.5% 0.8% 0.7% 0.8% 9.7%
Dairy cows 0.3% 0.0% 0.3% 4.9% 3.4% 3.3% 3.4% 7.8% -2.3% -2.3% -2.3% 2.6% 0.3% -0.1% 0.3% 5.0% 3.8% 3.7% 3.8% 8.3% -1.7% -1.7% -1.7% 3.2%
Production 0.6% 0.2% 0.6% 7.2% 5.6% 5.5% 5.6% 12.0% -5.8% -5.8% -5.8% 1.4% 0.5% 0.3% 0.6% 7.4% 10.6% 10.5% 10.6% 16.8% -0.1% -0.1% -0.1% 6.9%
Original Beef Price Alternative World Beef Price

97
Appendix 4: Import/Export Supply Curves
The EU-27 and rest of the world import/export supply equations are specified as a function
of relative price changes (PUK/(PExternal + Tariff) in the case of imports; and (PUK +
Tariff)/(PExternal) in the case of exports). Relevant tariffs and transaction costs associated with
cross-border trade are incorporated within the relative price terms. This procedure captures
the impact of trade policy arrangements on the domestic market. Changes in trade policy
arrangements are implemented using specified relative price thresholds, wherein the
elasticity of imports/exports with respect to the relative price term is amplified if the value of
this term goes beyond these thresholds. For example, take the hypothetical example in
import diagram in Figure A4.1 below. Prior to changes in the tariff regime, the equilibrium
position is A, which lies within Region 2. The supply curve within this region is relatively
inelastic (relatively low response to price changes). However, a significant reduction in the
tariff moves the equilibrium position to B, which triggers the threshold point in which the
demand for imports becomes relatively elastic (relatively high response to price changes –
Region 1) and prevents the UK price from diverging too far from the external price. The
thresholds are specified using historical relative price ratios.
Figure A4-1 Threshold regions within import/export supply curves
(a) Imports (b) Exports
Using beef as a specific example, following the application of WTO default tariffs the UK
beef price rises due to reduced imports from the EU. As a result, the PUK/(PRoW + Tariff) ratio
increases and triggers the threshold point in which imports from the Rest of the World are
competitive after paying the tariff (Region 1 in diagram (a)). This leads to a sharp increase
in imports from the Rest of the World, which curbs the extent to which beef price can rise.
Thus, when direct payments are reduced/abolished when WTO trade arrangements apply,
the fall in UK production does not lead to significantly higher domestic prices.
In the case of No Deal trade arrangements, the cut in tariffs to imports from the Rest of the
World also increases the PUK/(PRoW + Tariff) ratio and hence the trigger point within Region 1
Q
Region
1
Region
2
Region
3
Region
1
Region
2
Region
3
A
B

98
is again triggered. As a result, UK price increases are also curbed under these trade
arrangements.
In contrast to the beef sector, within the sheep sector the equilibrium position lies within
Region 2 of the import supply curve for the Rest of the World following changes in trade
arrangements under both the WTO and NO Deal scenarios. As a result, there is some
flexibility for prices to adjust in response to changes in direct payments when these trade
conditions apply. This analysis is sensitive to the level of world prices in the Baseline.
Lower world sheepmeat prices could result in a shift to Region 1 and thereby limit the price
responsiveness.