Embed Size (px)
Citation preview

1
Impact of Very Light Jet (VLJ) Flightson Airport Terminal Area
National Airsapce System Performance WorkshopMarch 14-17, 2006
Sam DollyhighJohn Callery
Jeremy SmithSwales Aerospace
Jeff VikenStuart Cooke
NASA Langley Research Center
Antonio TraniHojong Baik
Virginia Tech University

2
Outline• Future Flights (Demand)
– Airline Flights – VLJ Flights– Legacy GA Flights
• Airside Facilities (Supply)– Runway– Terminal Area– En-route
• Impact on the Terminal Area– Any Congestion/Delays?– Any Environmental Issues?
• Suggestions

3
What is Very Light Jet (VLJ)?

4
Very Lights Jets (VLJ)
• General purpose category of jet-powered aircraft weighting less than 10,000 lbs
• Aircraft in flight testing phase– Eclipse Aviation 500 (April 2006)– Cessna Mustang (April 2006)– Adam 700 (End of 2006)– Grob SP (Unknown)
• Aircraft in the design stage– Embraer Phenom 100 (2008)– Spectrum 33 (2008)– Diamond Jet (unknown)
Eclipse 500Eclipse 500
Cessna MustangCessna Mustang

5
VLJ Engine Manufacturers
• Pratt and Whitney Canada– PW 610 (Eclipse 500)– PW 615 (Cessna Mustang)– PW 617 (Embraer Phenom 100)
• Williams International– FJ44 (Adam 700)– FJ33 (Spectrum 33)
Williams FJ44 Williams FJ44 (A.A. Trani 2005)(A.A. Trani 2005)

6
Typical Very Light Jet Vehicle
• Pressurized aircraft• All weather vehicle• Four revenue seats• 365 mph cruise speed• Certified to fly into known icing conditions• 1,100 nm range (maximum). 700 nm practical with 2
passengers• Cost per passenger-mile ($1.75 nominal based on life-cycle
cost analysis)• 1.2 million dollars (cost)• 3,415 public airports (> 3,000 ft. paved runways)• Low Landing Minima capability provided to all airports using
SATS LLM hardware (WAAS-aided)• Airport Design Group = A-I• Wake Vortex Classification = Small

7
Future Flights* Estimation
*Flights =Airline Flights
+ VLJ flights + Legacy GA Flights
8
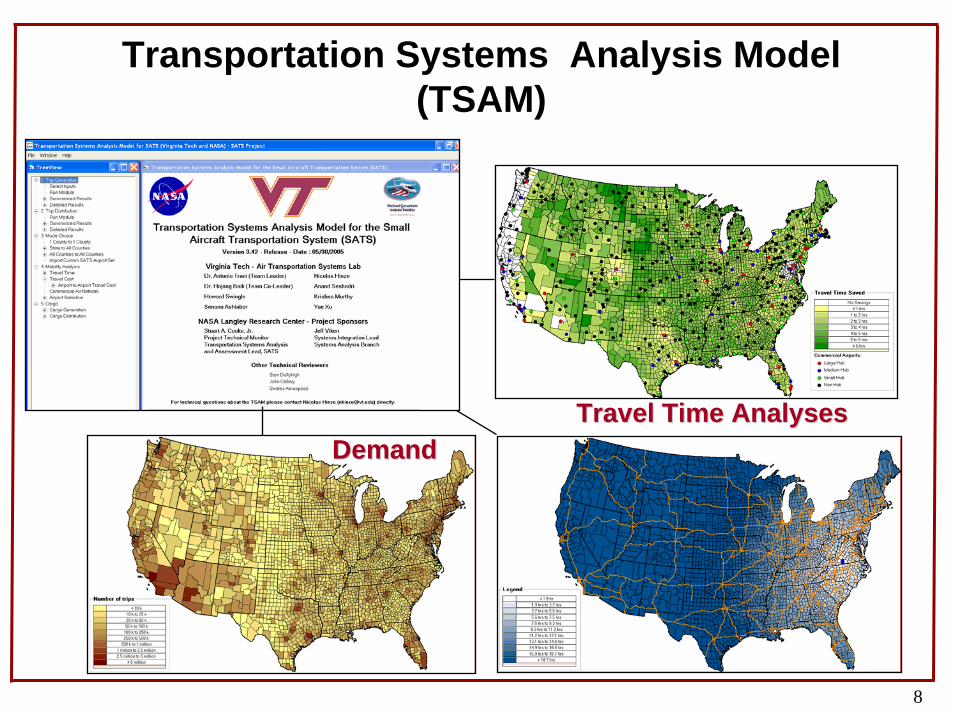
Transportation Systems Analysis Model (TSAM)
DemandDemandTravel Time AnalysesTravel Time Analyses
9
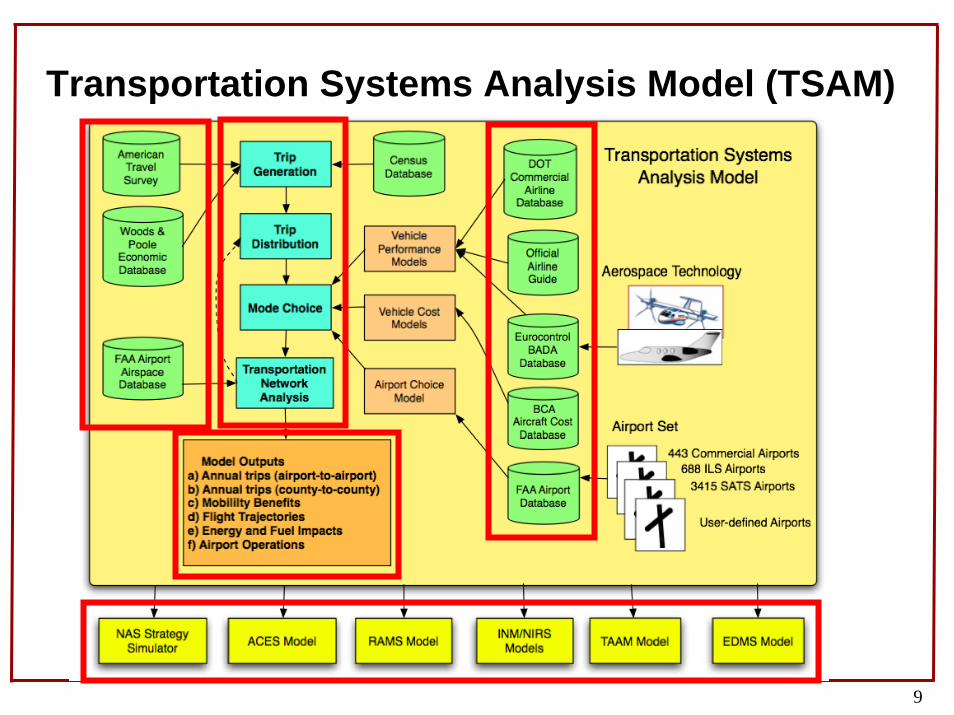
Transportation Systems Analysis Model (TSAM)
10
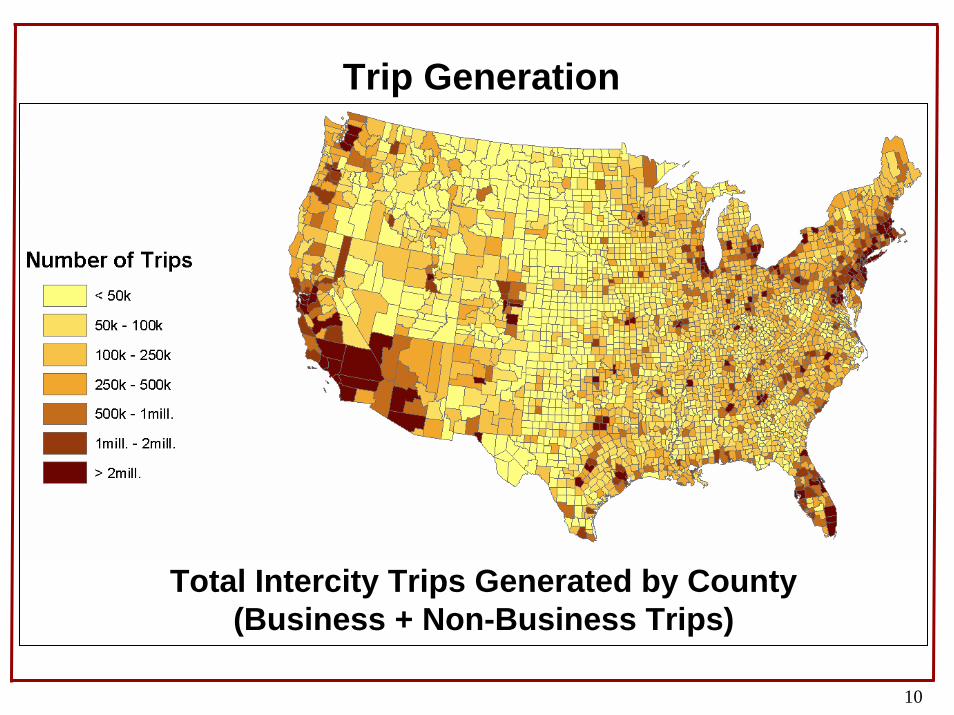
Trip Generation
Total Intercity Trips Generated by County(Business + Non-Business Trips)

11
Changes in the U.S. Population (Years 2000 to 2025)
Woods and Poole Demographic Data Woods and Poole Demographic Data Implemented in Implemented in the Transportation Systems Analysis Model (TSAM)the Transportation Systems Analysis Model (TSAM)

12
Distribution of Trips (LA County to all)
Annual TripsAnnual Trips
Tij =PiA jFijKij
A jFijKijj∑
Gravity Model

13
Mode Choice Analysis
Commercial Aviation
Route1
Auto VLJ
Route2... Route nIncludes Airport ChoiceIncludes Airport Choice
Factors considered in mode choice:Factors considered in mode choice:•• Travel timeTravel time•• Travel costTravel cost•• Value of timeValue of time•• Trip purposeTrip purpose•• Travel party sizeTravel party size•• Route convenienceRoute convenience•• Mode reliabilityMode reliability
TSAM employs a TSAM employs a Nested Multinomial Nested Multinomial LogitLogit ModelModel

14
Consider a Business Trip from Blacksburg, VA to Cleveland,OH
• Suppose three possible travel alternatives are:– Auto– Commercial Air– On-demand service using VLJ aircraft (future NAS)
• To make a mode selection a user might consider:– Travel time– Travel cost (including lodging and rentals)– Duration of stay– Value of time– Party size

15
Multi-route Mode Choice Model
TSAM Uses the TSAM Uses the Official Airline Guide (OAG)Official Airline Guide (OAG)to estimate airportto estimate airport--toto--airport airport
travel timestravel times

16
Multi-mode Choice Model (Door-to-Door Commercial Air Travel Time)
TSAM considers TSAM considers airport processing airport processing times and airport times and airport egress and access egress and access timestimes

17
TSAM uses TSAM uses MappointMappoint to to estimate auto estimate auto travel timestravel times
Multi-mode Choice Model (Auto)

18
Multi-mode Choice Model (VLJ)

19
Summary Trip Information
<$30K <$60K <$100K <$150K >$150K
Auto 82% 76% 65% 52% 51%
Airline 18% 24% 30% 32% 31%
VLJ 0% 0% 5% 16% 18%

20
Intercity Travelers by Mode(from LA County)
(Captured from Virginia Tech (Captured from Virginia Tech TTransportation ransportation SSystem ystem AAnalysis nalysis MModel (TSAM))odel (TSAM))
AutoAuto AirlinesAirlines VLJVLJ
AutoAuto AirlinesAirlines VLJVLJ
Business TripBusiness Trip
NonNon--Business TripBusiness Trip3.4 mil (53.7%)3.4 mil (53.7%) 2.8 mil (44.2%)2.8 mil (44.2%) 0.13 mil (2.1%)0.13 mil (2.1%)
16.6 mil (65.0%)16.6 mil (65.0%) 8.9 mil (34.9%)8.9 mil (34.9%) 0.02 mil (0.1%)0.02 mil (0.1%)
2015Case 2aNo NGATS
Existing commercial airport set (443 nationwide)Airline Fare Scale Factor = 0.720VLJ Auto cost = $0.37 vehicle-mileProcessing times at airports remain the same
2015Case 4NGATS
Existing commercial airport set (443 nationwide)Airline Fare Scale Factor = 0.720VLJAuto cost = $0.37 vehicle-mileProcessing Times Scaling Factor = 0.75

21
Mode Choice Window in TSAM

22
Travel Time Saving (Case 2a minus Case 4)
137 mil. hr Time Saving137 mil. hr Time Saving(Business Trip) (Business Trip)

23
Convert Air Demand to Flights

24
Create Flight Trajectories
Performance Metrics: Flight Time, Fuel Consumption

25
Spatial Distribution of VLJ Flights(year 2015)
26
TSAM is …
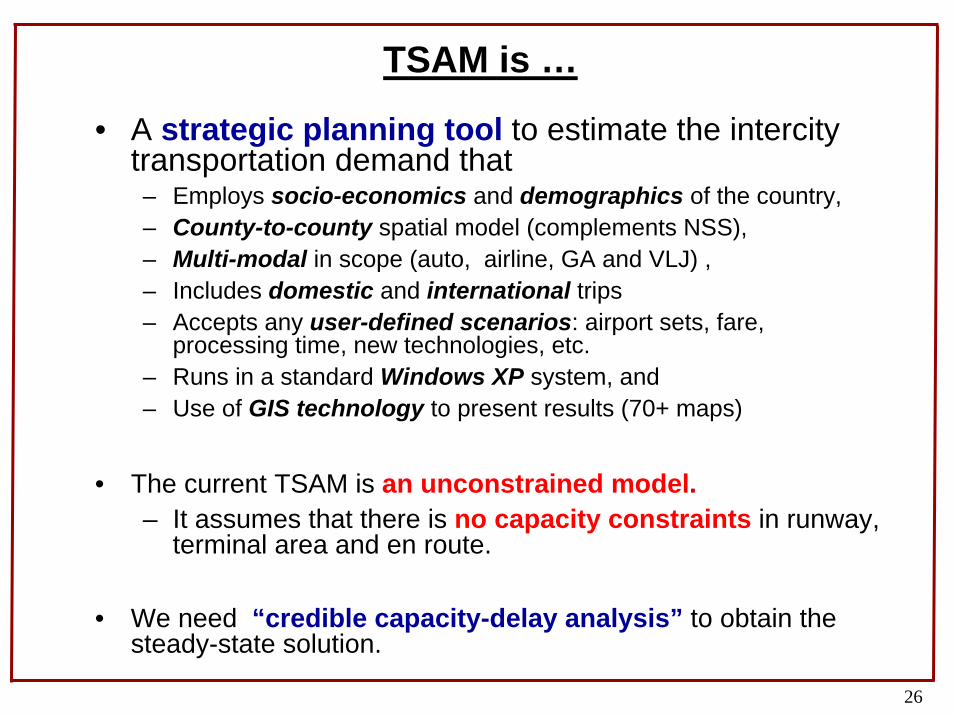
• A strategic planning tool to estimate the intercity transportation demand that– Employs socio-economics and demographics of the country,– County-to-county spatial model (complements NSS),– Multi-modal in scope (auto, airline, GA and VLJ) ,– Includes domestic and international trips– Accepts any user-defined scenarios: airport sets, fare,
processing time, new technologies, etc.– Runs in a standard Windows XP system, and– Use of GIS technology to present results (70+ maps)
• The current TSAM is an unconstrained model. – It assumes that there is no capacity constraints in runway,
terminal area and en route.
• We need “credible capacity-delay analysis” to obtain the steady-state solution.

27
Impact of VLJ Flights in the Airport Terminal Area

28
Airports in the New York Area
JFKJFK
EWREWR
LGALGA
TEBTEB
FRGFRG
HPNHPN
Question 1:Question 1:
Can VLJ/GA operations atCan VLJ/GA operations at TEBTEB, , FRGFRG,, and and HPNHPN grow at the predicted growth rate with grow at the predicted growth rate with interactinginteracting LGALGA, , JFK JFK andand EWREWR??
TEBTEB, , FRGFRG,, HPN,HPN, LGALGA, , JFK JFK andand EWREWRshare substantial flights through the same departure/arrival fixes.

29
Interactions….
EliotEliot
LannaLanna
WhiteWhite
EWREWR
TEBTEBLGALGA
JFKJFK
20 nm20 nm
50 nm50 nm
Long IslandLong Island
0.00
0.05
0.10
0.15
0.20
0.25
LGA TEB EWR HPN MMU
EliotLannaWhite
Frac
tion
of D
epar
ture
s C
ross
ing
Dep
artu
re F
ix
Airport
-- TEB Departures-- TEB Arrivals-. EWR Departures-. EWR Arrivals-- LGA Departures-- LGA Arrivals TEBTEB
EWREWRLGALGA
Long IslandLong Island

30
New York Area Terminal Operations
• In 2004, there are 2.3 million operations at 10 New York terminal area airports
• In 2015, there could be 2.8 million operations at the same airports (21% increase)– With VLJ operations, the total number of operations could
go as high as 3.1 million in 2015 (34% increase)
0
100,000
200,000
300,000
400,000
500,000
600,000
FRG HPN TEB LGA JFK EWR CDW LDJ MMU ISP
TAF 2004 OperationsTAF 2015 Operations
TAF + VLJ 2015 Operations
Yea
rly O
pera
tions
Airport
Q: What will be terminal area delays Q: What will be terminal area delays for TEB, FRG, HPN flights? for TEB, FRG, HPN flights?

31
Terminal Areas of Interest
San FranciscoSan Francisco
Los AngelesLos Angeles
DallasDallas--Forth WorthForth Worth
ChicagoChicago
New YorkNew York
MiamiMiami
AtlantaAtlanta
DenverDenver
DC/PhiladelphiaDC/Philadelphia
Central FloridaCentral Florida
Las VegasLas Vegas
PittsburghPittsburgh
SeattleSeattle
PhoenixPhoenix
HoustonHouston
BostonBoston

32
TEB Airport Runway Capacity Envelopes
(Analysis with Airport Capacity Model)(Analysis with Airport Capacity Model)

33
Teterboro Future Hourly Demands<Without NGATS><Without NGATS>
Optimum VMC Hourly CapacityOptimum VMC Hourly Capacity
Optimum IMC Hourly CapacityOptimum IMC Hourly Capacity
Optimum IMC Hourly CapacityOptimum IMC Hourly CapacityOptimum VMC Hourly CapacityOptimum VMC Hourly Capacity
<With NGATS><With NGATS>
Time of Day (GMT)
Time of Day (GMT)

34
Teterboro Capacity Analysis
New CapacityNew Capacity(with NGATS)(with NGATS)
Q2: What will be runway delays Q2: What will be runway delays for TEB flights? for TEB flights?

35
Impact of VLJ Flights in the Airport Terminal Area
(Environmental)

36
Teterboro Airport (Noise Analysis using INM)
• 180 VLJ operations per year in 2014
• 6-7% increase in the noise contour area when VLJ operations are added to the airport base operations
VLJVLJ VLJVLJ
Q3: Will the noise restrictQ3: Will the noise restrictVLJ operations?VLJ operations?
SATS Program Study sponsored by S. A. Cooke (NASA)SATS Program Study sponsored by S. A. Cooke (NASA)

37
CO Emissions (tons)CO Emissions (tons)
SATS Program Study sponsored by S. A. Cooke (NASA)SATS Program Study sponsored by S. A. Cooke (NASA)
Emission (CO) Analysis using EDMS 4.2
Q4: Will the emission restrict Q4: Will the emission restrict VLJ operations?VLJ operations?

38
Suggestions

39
Suggestions
• What if we add one hour delay to all the TEB flights, • TEB VLJ passengers in 2005 with no delay: 62,650 pax/yr.
• TEB VLJ passengers with 1 hr extra delay: 44,993 pax/yr.
• We need the more in-depth analysis in– Terminal area delay using simulation tools such as ACES ,
RAMS, TAAM, or LMI-Net,– Runway delay, – En route delay, and– Environmental constraints.
Flight Trajectory GeneratorTSAM Model
System InducedDelays
Simulation(ACES, RAMS, TAAM, LMINet)
NAS ComponentNAS ComponentCapacitiesCapacities
NSS SimulatorNSS Simulator
Adjusted Adjusted Travel Travel Time/CostTime/Cost

40
Questions?

41
Supplements(TSAM)

42
TSAM
Mode Choice = Mode Choice = f(Travelf(Travel Time, Time, Travel Cost, Travel Cost, Income, Income, Trip Purpose, ..)Trip Purpose, ..)
= = f(Popf(Pop., Income, …)., Income, …)
Legacy GA (Exogenous)
= = f(GDPf(GDP, ..), ..)
= = f(Popf(Pop., Employee, ..)., Employee, ..)
= = f(GDPf(GDP, ..), ..)
= = f(Popf(Pop., Income, …)., Income, …)

43
Convert Air Demand to Flights

44
Converting Trips to Flights (On-demand VLJ)
ETMS Business Aircraft ETMS Business Aircraft Flight DistributionFlight Distribution
Seasonal VariationSeasonal Variation(ATS)(ATS)
VLJ AnnualVLJ AnnualPerson Person TripsTrips
(Airport(Airport--Airport)Airport)(County(County--County)County)
Daily Trip AnalysisDaily Trip Analysis(Hourly Passenger Demand)(Hourly Passenger Demand)
FlightFlightTrajectoryTrajectoryGeneratorGenerator
OnOn--demand VLJdemand VLJACES OutputACES Output
TSAM ModelTSAM Model

45
Airline Flights and Legacy GA
Initial Base Initial Base ScheduleSchedule
AnnualAnnualPerson Person TripsTrips
By modeBy mode(Airport(Airport--Airport)Airport)
Commercial Airline ScheduleCommercial Airline Schedule((FratarFratar Model)Model)
Flight Trajectory AnalysisFlight Trajectory Analysis
Legacy GALegacy GAAirline FlightsAirline FlightsACES OutputACES Output
Legacy GALegacy GAMonte CarloMonte Carlo
Demand ModelDemand Model
NASA Langley / SwalesNASA Langley / Swales

46
NAS Daily Flights
Baseline NAS: 2004 ETMSProjections:
2014 - NAS Flights + VLJ2025 - NAS Flights + VLJ
Baseline and Projected NAS Daily Traffic
3676953902
6964713133
1651221098
18576
25800
0
20000
40000
60000
80000
100000
120000
140000
2004 2014 2025 / 2X
Year of Analysis
SATS / VLJMilitaryFreightG/ACommercial / Air Taxi / Commuter
57,628
97,969
127,421
1.381.76
1.70
2.21

47
Supplements(NGATS Scenarios)
48
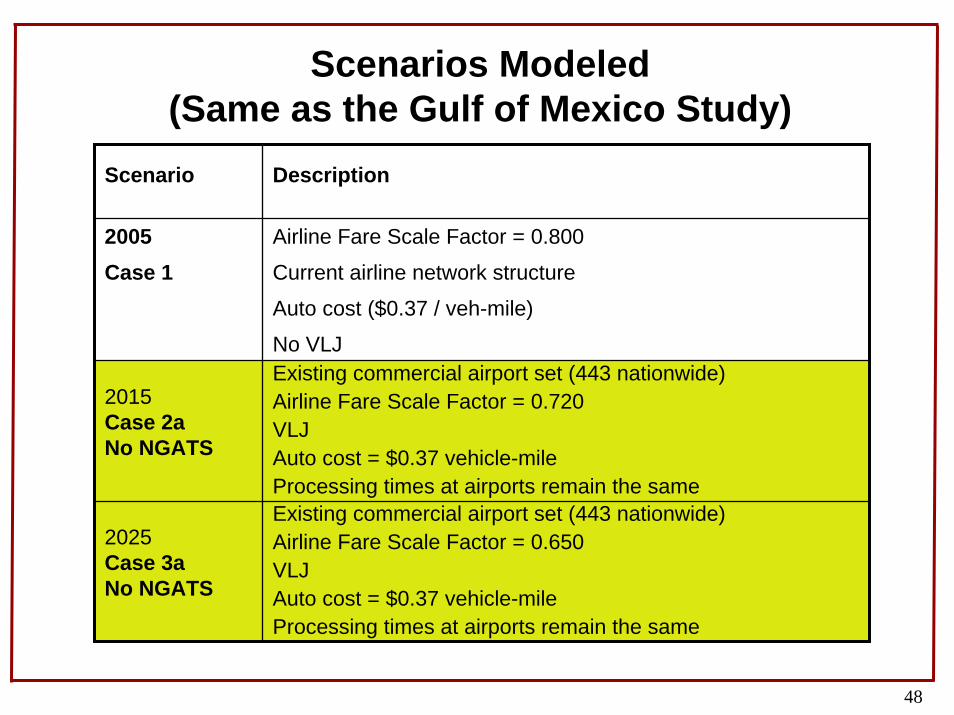
Scenarios Modeled(Same as the Gulf of Mexico Study)
Scenario Description
2005Case 1
Airline Fare Scale Factor = 0.800
Current airline network structure
Auto cost ($0.37 / veh-mile)
No VLJ
2015Case 2aNo NGATS
Existing commercial airport set (443 nationwide)Airline Fare Scale Factor = 0.720VLJ Auto cost = $0.37 vehicle-mileProcessing times at airports remain the same
2025Case 3aNo NGATS
Existing commercial airport set (443 nationwide)Airline Fare Scale Factor = 0.650VLJ Auto cost = $0.37 vehicle-mileProcessing times at airports remain the same
49
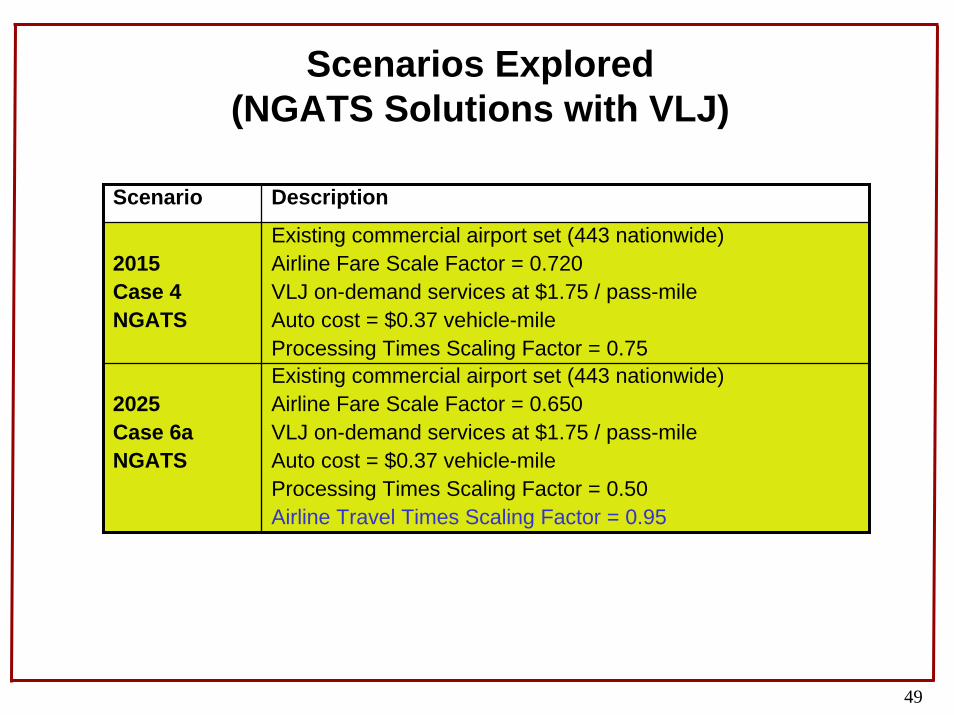
Scenarios Explored(NGATS Solutions with VLJ)
Scenario Description
2015Case 4NGATS
Existing commercial airport set (443 nationwide)Airline Fare Scale Factor = 0.720VLJ on-demand services at $1.75 / pass-mile Auto cost = $0.37 vehicle-mileProcessing Times Scaling Factor = 0.75
2025Case 6aNGATS
Existing commercial airport set (443 nationwide)Airline Fare Scale Factor = 0.650VLJ on-demand services at $1.75 / pass-mileAuto cost = $0.37 vehicle-mileProcessing Times Scaling Factor = 0.50Airline Travel Times Scaling Factor = 0.95

50
VLJ Daily Airport Traffic in 2015 with OEP Airports (NGATS System)

51
VLJ Daily Airport Traffic in 2025 with OEP Airports (NGATS System)

52
Another GA Airport Growth Consideration Constrained Analysis (Noise Impact)
Integrated Noise ModelIntegrated Noise Model
Airport Demand FunctionAirport Demand Function
Noise Impacts to PopulationNoise Impacts to Population
Noise AreasNoise AreasAround Around TeterboroTeterboro
TSAM ModelTSAM Model
SATS Program Study sponsored by S. A. Cooke (NASA)SATS Program Study sponsored by S. A. Cooke (NASA)

53
Supplements(VLJ)

54
VLJ Traffic Will Fly Below Regular Airline Traffic due to Shorter Stage Lengths
0
20
40
60
80
100
0.00 100 200 300 400 500
IFR Jet Traffic TodayVLJ Traffic (2010)
Cum
ulat
ive
Per
cent
of F
light
s
Cruise FL (x 100 ft.)
Median Cruise VLJ Median Cruise VLJ Flight Level = 230*Flight Level = 230*
Median Cruise FLMedian Cruise FLCessna Cessna CitationJetCitationJet I = 240**I = 240**
Median Jet Cruise Median Jet Cruise Flight Level = 320**Flight Level = 320**
* TSAM Analysis* TSAM Analysis** ** FAA ETMS DataFAA ETMS Data

55
VLJ fares by Region
• From MCATS Study
56
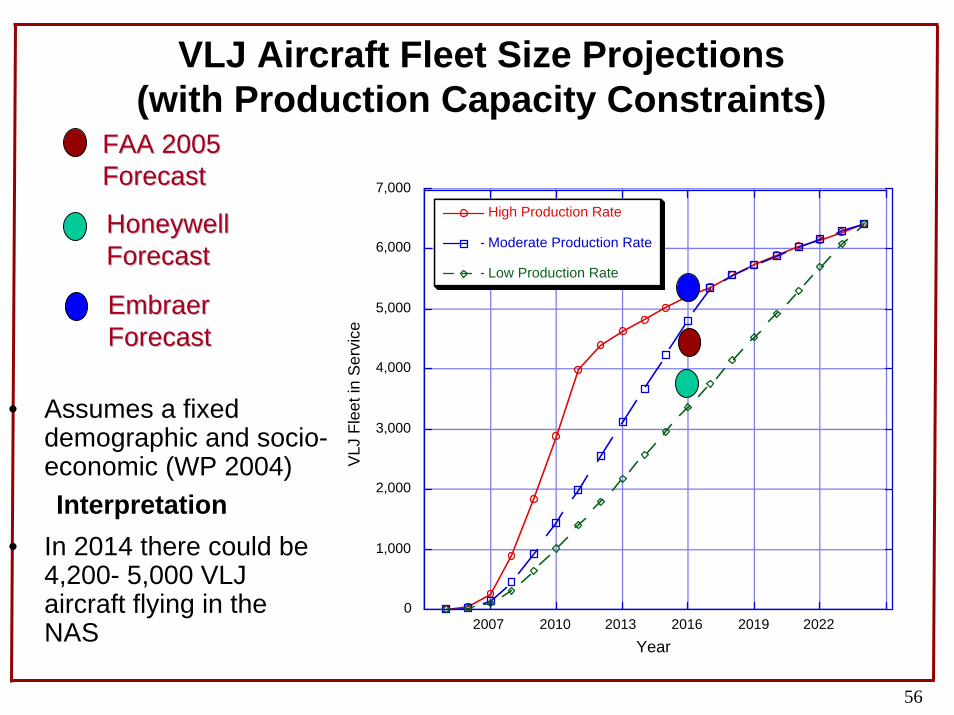
VLJ Aircraft Fleet Size Projections (with Production Capacity Constraints)
FAA 2005FAA 2005ForecastForecast
0
1,000
2,000
3,000
4,000
5,000
6,000
7,000
2007 2010 2013 2016 2019 2022
High Production Rate
Moderate Production Rate
Low Production Rate
VLJ
Fle
et in
Ser
vice
Year
HoneywellHoneywellForecastForecast
EmbraerEmbraerForecastForecast
• Assumes a fixed demographic and socio-economic (WP 2004)Interpretation
• In 2014 there could be 4,200- 5,000 VLJ aircraft flying in the NAS

57
Summary of VLJ Forecast Results (TSAM)
Notes: Notes: 1) Results for year 2047 require large extrapolations 1) Results for year 2047 require large extrapolations of demographic modelof demographic model2) High production capacity scenario2) High production capacity scenario3) 3) VLJ = $1.75 per passenger-mile, optimistic airline fares, auto = 37 cents/veh-mile

58
2014 VLJ Air-Taxi NAS Impacts
Airspace Impacts (Year 2014)
0 2000 4000 6000 8000 10000 12000 14000
ZSEZLCZOAZABZDVZBWZFWZKCZMPZHUZLAZMEZJX
ZMAZAUZID
ZDCZOBZTLZNY
Enro
ute
Cen
ter
Daily Aircraft Operations (IFR)
ETMS Traffic (2004)FAA Center Projections (2014)VLJ Traffic (2014)

59
VLJ Fleet Size vs. Cost for Service
0
2000
4000
6000
8000
10000
1.50 2.00 2.50 3.00 3.50 4.00
1200 hours / year
800 hours / year
Flee
t Siz
e (A
ircra
ft)
SATS Cost ($/passenger-mile)

60
APO View of the VLJ World (March 2005)
• FAA APO assumes microjets (or VLJs) will be used as standard corporate jets (300-342 hours per year) based on historical trends– 4,000 microjets in 2016– Low use rate (< ~ 400 hours per vehicle)
• This results in small number of total hours flown since VLJs are assumed to be used in traditional low use roles

61
Comparison with Virginia Tech Projections
• We have projected that 70-75% of the fleet will go to on-demand services (today Eclipse Aviation claims 67% of the orders are for air taxi services)– 4,800 to 5,400 VLJs in 2016– High use rates (800-1,200 hours per year)– On-demand air taxi services– Fractional ownership
• Conclusion:– APO forecast has substantially fewer hours flown per year
for the fleet– For NGATS planning we recommend a more “optimistic”
view of VLJ demand to be ready for a VLJ wave if it happens

62
Supplements(Non-towered Airport)
63
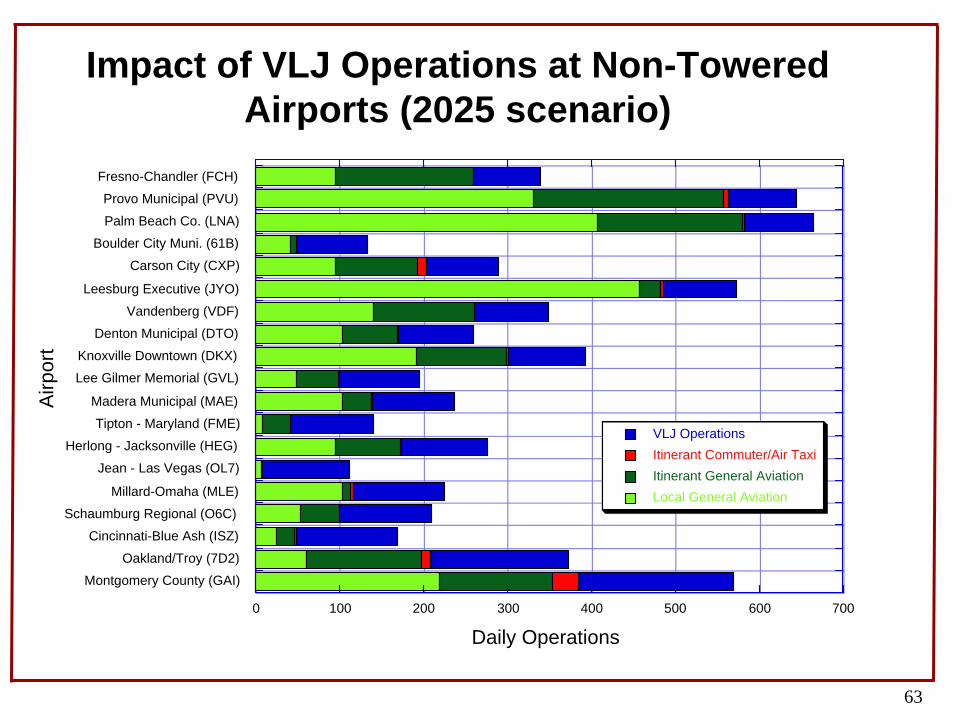
Impact of VLJ Operations at Non-Towered Airports (2025 scenario)
0 100 200 300 400 500 600 700
Montgomery County (GAI)Oakland/Troy (7D2)
Cincinnati-Blue Ash (ISZ)
Schaumburg Regional (O6C)
Millard-Omaha (MLE)
Jean - Las Vegas (OL7)
Herlong - Jacksonville (HEG)
Tipton - Maryland (FME)
Madera Municipal (MAE)
Lee Gilmer Memorial (GVL)Knoxville Downtown (DKX)
Denton Municipal (DTO)
Vandenberg (VDF)
Leesburg Executive (JYO)
Carson City (CXP)
Boulder City Muni. (61B)
Palm Beach Co. (LNA)
Provo Municipal (PVU)
Fresno-Chandler (FCH)
VLJ OperationsItinerant Commuter/Air TaxiItinerant General AviationLocal General Aviation
Daily Operations
Airp
ort

64
Non-towered Airport Capacity Gains
• The SATS Program successfully demonstrated capacity improvements at airports with no control towers
• Use of Airport Management Module (AMM)
• High-Volume Operations (HVO)

65
Future Airport Procedures (SATS Program)
• Example of technology implications for non-towered airports
• High-Volume-Operations (HVO) concept (NASA Langley)
0
2
4
6
8
10
12
0 5 10 15 20
No Control Tower HVO Technology
Airc
raft
Arr
ival
s pe
r Hou
r
Aircraft Departures per Hour
Danville Demo (2005)Danville Demo (2005)
TodayToday
Near FutureNear FutureHVO technologyHVO technologyhashas impactimpacton airport on airport capacitycapacity
66
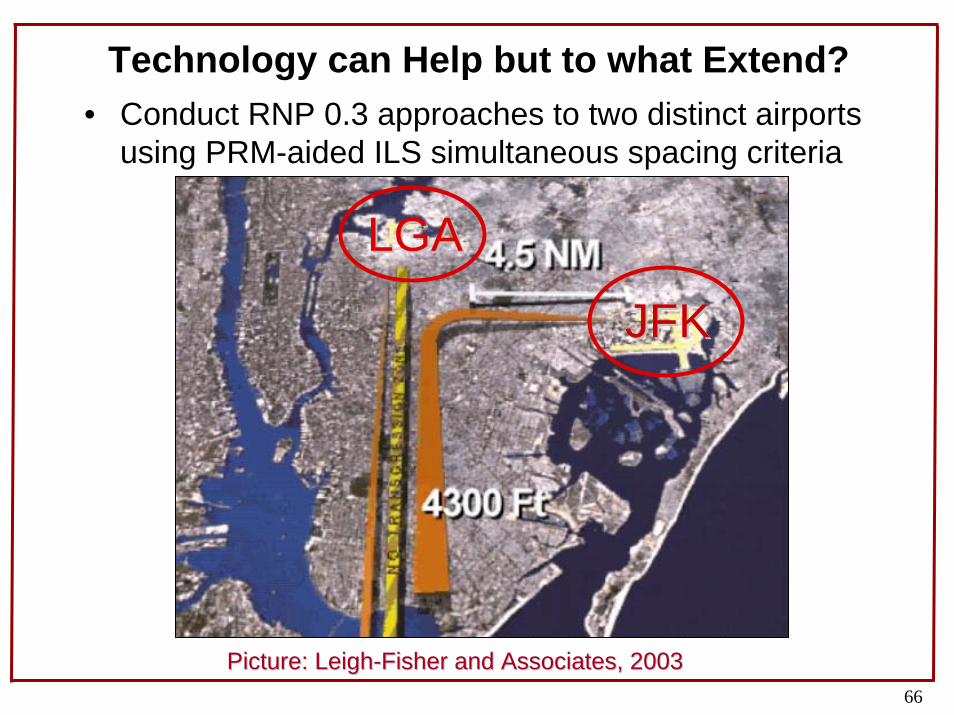
Technology can Help but to what Extend?• Conduct RNP 0.3 approaches to two distinct airports
using PRM-aided ILS simultaneous spacing criteria
LGALGA
JFKJFK
Picture: LeighPicture: Leigh--Fisher and Associates, 2003Fisher and Associates, 2003

67
Supplements(Future Airline Schedules)
68
Methodology to Create Future Airline Schedules• TSAM provides airline demand estimates for 443 domestic airports• Swales Aerospace has developed a Fratar-based module to predict
the future flight schedules (from current schedules) produced by TSAM• Airplanes are assumed to have an average 70% load factor
Direct Flights
• As demand increases between city pairs in the future, when demand justifies it, direct flights are introduced where non existed previously
• We model this by introducing 2 direct flights (each way) per day when passenger demand exceeds 25k trips per year
• Add 1 morning and 1 evening direct flight each way• Remove shortest connecting route flights from future schedule (only
flights of 2 legs considered)• 2 direct flights replace 4 connecting flights

69
Methodology to Create Future Airline Schedules
• Increased passenger demand between airports can be met with a combination of increased flight frequency and larger aircraft
• Research by Airbus1(next slide) indicates that airlines will satisfy increased demand by adding the following service (flights refer to allairlines combined):– Total round trip flights <= 6 - Increase frequency of flights between
airports– Total round trip flights > 60 - Increase capacity (size) of aircraft– Total round trip flights in between: Use a combination of increased
frequency and increased capacity.
1) http://www.airbus.com/pdf/media/GMF2004_demand_passenger.pdf
Adding Frequency and Larger Aircraft

70
Airbus Global Market Forecast Method
71
Supplements(GA)

72
Legacy GA Flights*• Model:
– Uses baseline values for projected active aircraft and itinerant operations derived from TAF & FAA Airspace Forecasts FY 2004-2016.
– Includes airports reporting 10 or more itinerant GA operations (per year) in the 2004.
– Projects a flight “schedule” between 5243 public and private airports using Fratamodel.
• Results:
– About 65,000 itinerant GA flight per day (average) in 2005, and About 76,000 per day in 2025 (17% increase).
• Growth mostly due to business jets which will be IFR flights (275% increase)
– Flight sets: • Single-engine VFR, Single-engine IFR,
• Multi-engine VFR, Multi-engine piston IFR, Multi-engine turbo
• IFR, Jets (assumed to always be IFR)
*By Swales Aerospace.

73
Legacy GA Operations (Swales Aerospace Module)Year 2015 Analysis (VFR + IFR Traffic)Year 2015 Analysis (VFR + IFR Traffic)
69,879 flights per day69,879 flights per day45,649 VFR flights45,649 VFR flights24,230 IFR flights24,230 IFR flights

74
Supplements(International)

75
0
5,000,000
10,000,000
15,000,000
20,000,000
25,000,000
30,000,000
10,000,000
20,000,000
30,000,000
40,000,000
50,000,000
60,000,000
70,000,000
80,000,000
1990 1995 2000 2005 2010 2015 2020 2025 2030
Africa
Middle East
Canada
Mexico
Asia
Oceania
South America
Caribbean
Europe
Ann
ual E
npla
nem
ents
Annual E
nplanements (E
urope Only)
Year
Future Airline Travelers: International

76
Future Airline Travelers: International (2015)
376 million passengers (total)376 million passengers (total)
(Captured from Virginia Tech (Captured from Virginia Tech TTransportation ransportation SSystem ystem AAnalysis nalysis MModel (TSAM))odel (TSAM))

77
TSAM comparison with Domestic Enplanement Data
2004TSAM: Business trips 86.7M
Personal trips: 154.0M
Total Commercial Airline Trips: 240.7M
How does this relate to enplanements?
Assumption: ~36% of trips have connection
Each person trip has 2 trips - Depart and Return
TSAM Commercial Enplanements: 654.7M
ATA/FAA Reported Enplanements: 635.5M (3% difference)

![Jet Airways to launch daily flights to Amsterdam from Mumbai, Delhi and Toranto [Company Update]](https://img.pdfslide.us/doc/110x75/577ca6e71a28abea748c1729/jet-airways-to-launch-daily-flights-to-amsterdam-from-mumbai-delhi-and-toranto.jpg)