Embed Size (px)
Citation preview
Abstract
Impact of Urban Climate on Running and JoggingBrandon Ram1, Kings Odigie2, Muneeb Rana3, Michael Sangobanwo4, Prathap
Ramamurthy5
Many city dwellers utilize the urban spaces: concrete path ways, streets and urban parks for running and jogging. But the urban environment unlike a natural park is dominated by concrete, asphalt, bricks and steel as opposed to bare soil and grass. These materials have a high capacity to store and dissipate heat which makes urban areas much warmer than the natural environment. This heat will add considerable physiological strain which will adversely affect the runners’ performance. In some cases this might even result in excessive fatigue.
A phenomenon which proves to be sweeping this nation for the last couple of years is the aspiration to get or maintain fitness. Though many take vastly different approaches to achieving such fitness, one widely popular method is running. Such is evident in one of the better known cities in the world, New York City. On any given day, it would be rare to not see individuals running through the streets of New York. Such individuals often times can be seen choosing routes based on what may be most convenient for them compared to what may be most efficient. Will different environments provide different results? Does it matter if an individual runs in a very urban area or a park? Is it possible that the presence of trees impacts a person’s overall performance during a run?
For our research project, we aim to answer such questions by conducting tests to see how the environment affects our running performance. Throughout our series of trials, we have put running to the test in different environments such as those accompanied by a body of water, those that are highly populated with cars and buildings, and those surrounded by plants and trees. In these trials, we were attempting to prove our hypothesis regarding running in different areas right or wrong. Specifically, we hypothesized that running in more rural environments that do not include many cars or buildings would increase one’s performance. The main purpose of our experiment is to draw conclusions and collect data about the effect of surroundings on one’s performance while running, which includes focusing in on variables such as heart rate, pace, cadence, and steps per minute.
Six 3k routes of varying environments were found via Google Maps and completed by each of the group members.
For each run, data was recorded using data tracking devices such as a Garmin watch (Fenix 3), temperature sensors, and heart rate monitors.
This data was then extracted from the Garmin Connect database and converted to files capable of being processed and analyzed in Matlab.
The following materials were utilized in completion of this project: Garmin Fenix 3 Air Temperature and Humidity Monitor Garmin Heart Rate and Temperature Monitor Matlab Software
[email protected], The Scholars’ Academy, [email protected], The Scholars’ Academy, [email protected], Curtis High School, [email protected], The City College of New York, [email protected], The City of New York
Centr
al Pa
rkEast
Riv
er
Up
per
Manhatt
an
Background
Methodology & Materials
Results
Observations East River ObservationsTemperature: 95.7 degrees FahrenheitHumidity: 18%Wind: 8kph Mostly sunny with a few clouds here and
there This run included an area mostly
accompanied by a large body of water, with a decent amount of trees and an overall path composed of stone and concrete.
As shown by our heart rate graphs, running in an area more highly noted for a body of water had an influence on our running performance.
As shown by the graphs, our heart rates are clearly increasing more steadily and more constantly at a relatively slower rate.
Central Park ObservationsTemperature: 97.8 degrees FahrenheitHumidity: 41.0%Wind: 6kph Bright and mostly sunny This run had an overall environment
consisting of trees and other plants. The routes presented in this area consists of either asphalt, concrete, or mulch.
If you were to closely examine the heart rate graphs for this run, you can see than the overall heart rate increased at a rate which is a little better than average, but not as steady compared to East River run and not as inconsistent as the run around buildings in Upper Manhattan.
In general, our heart rates were relative to our environment and the trees made for better consistency, but a little harder running path due to the rough textures.
Upper Manhattan ObservationsTemperature: 87.9 degrees FahrenheitHumidity: 42.4%Wind: 6kph Running in a shaded area, surrounded by
tall buildings The surroundings for this run are exactly
what you expected it to be; heavily populated with people and many cars and buildings. There were very little trees and many sloped pathways.
According to our heart rate graphs, our overall performance for this run was poor in comparison to our runs around water and trees. There were clearly more breaks in the data and the rate constantly increases due to many turns and changes of pace due to roads and crossways.
Conclusively, we performed at a lower level during this run due to the more heavily populated environment and the heat absorbent textures found in the surroundings.
This research was supported by NOAA CREST (NOAA CREST– Cooperative Agreement No: NA11SEC4810004) and funded by The Pinkerton Foundation.
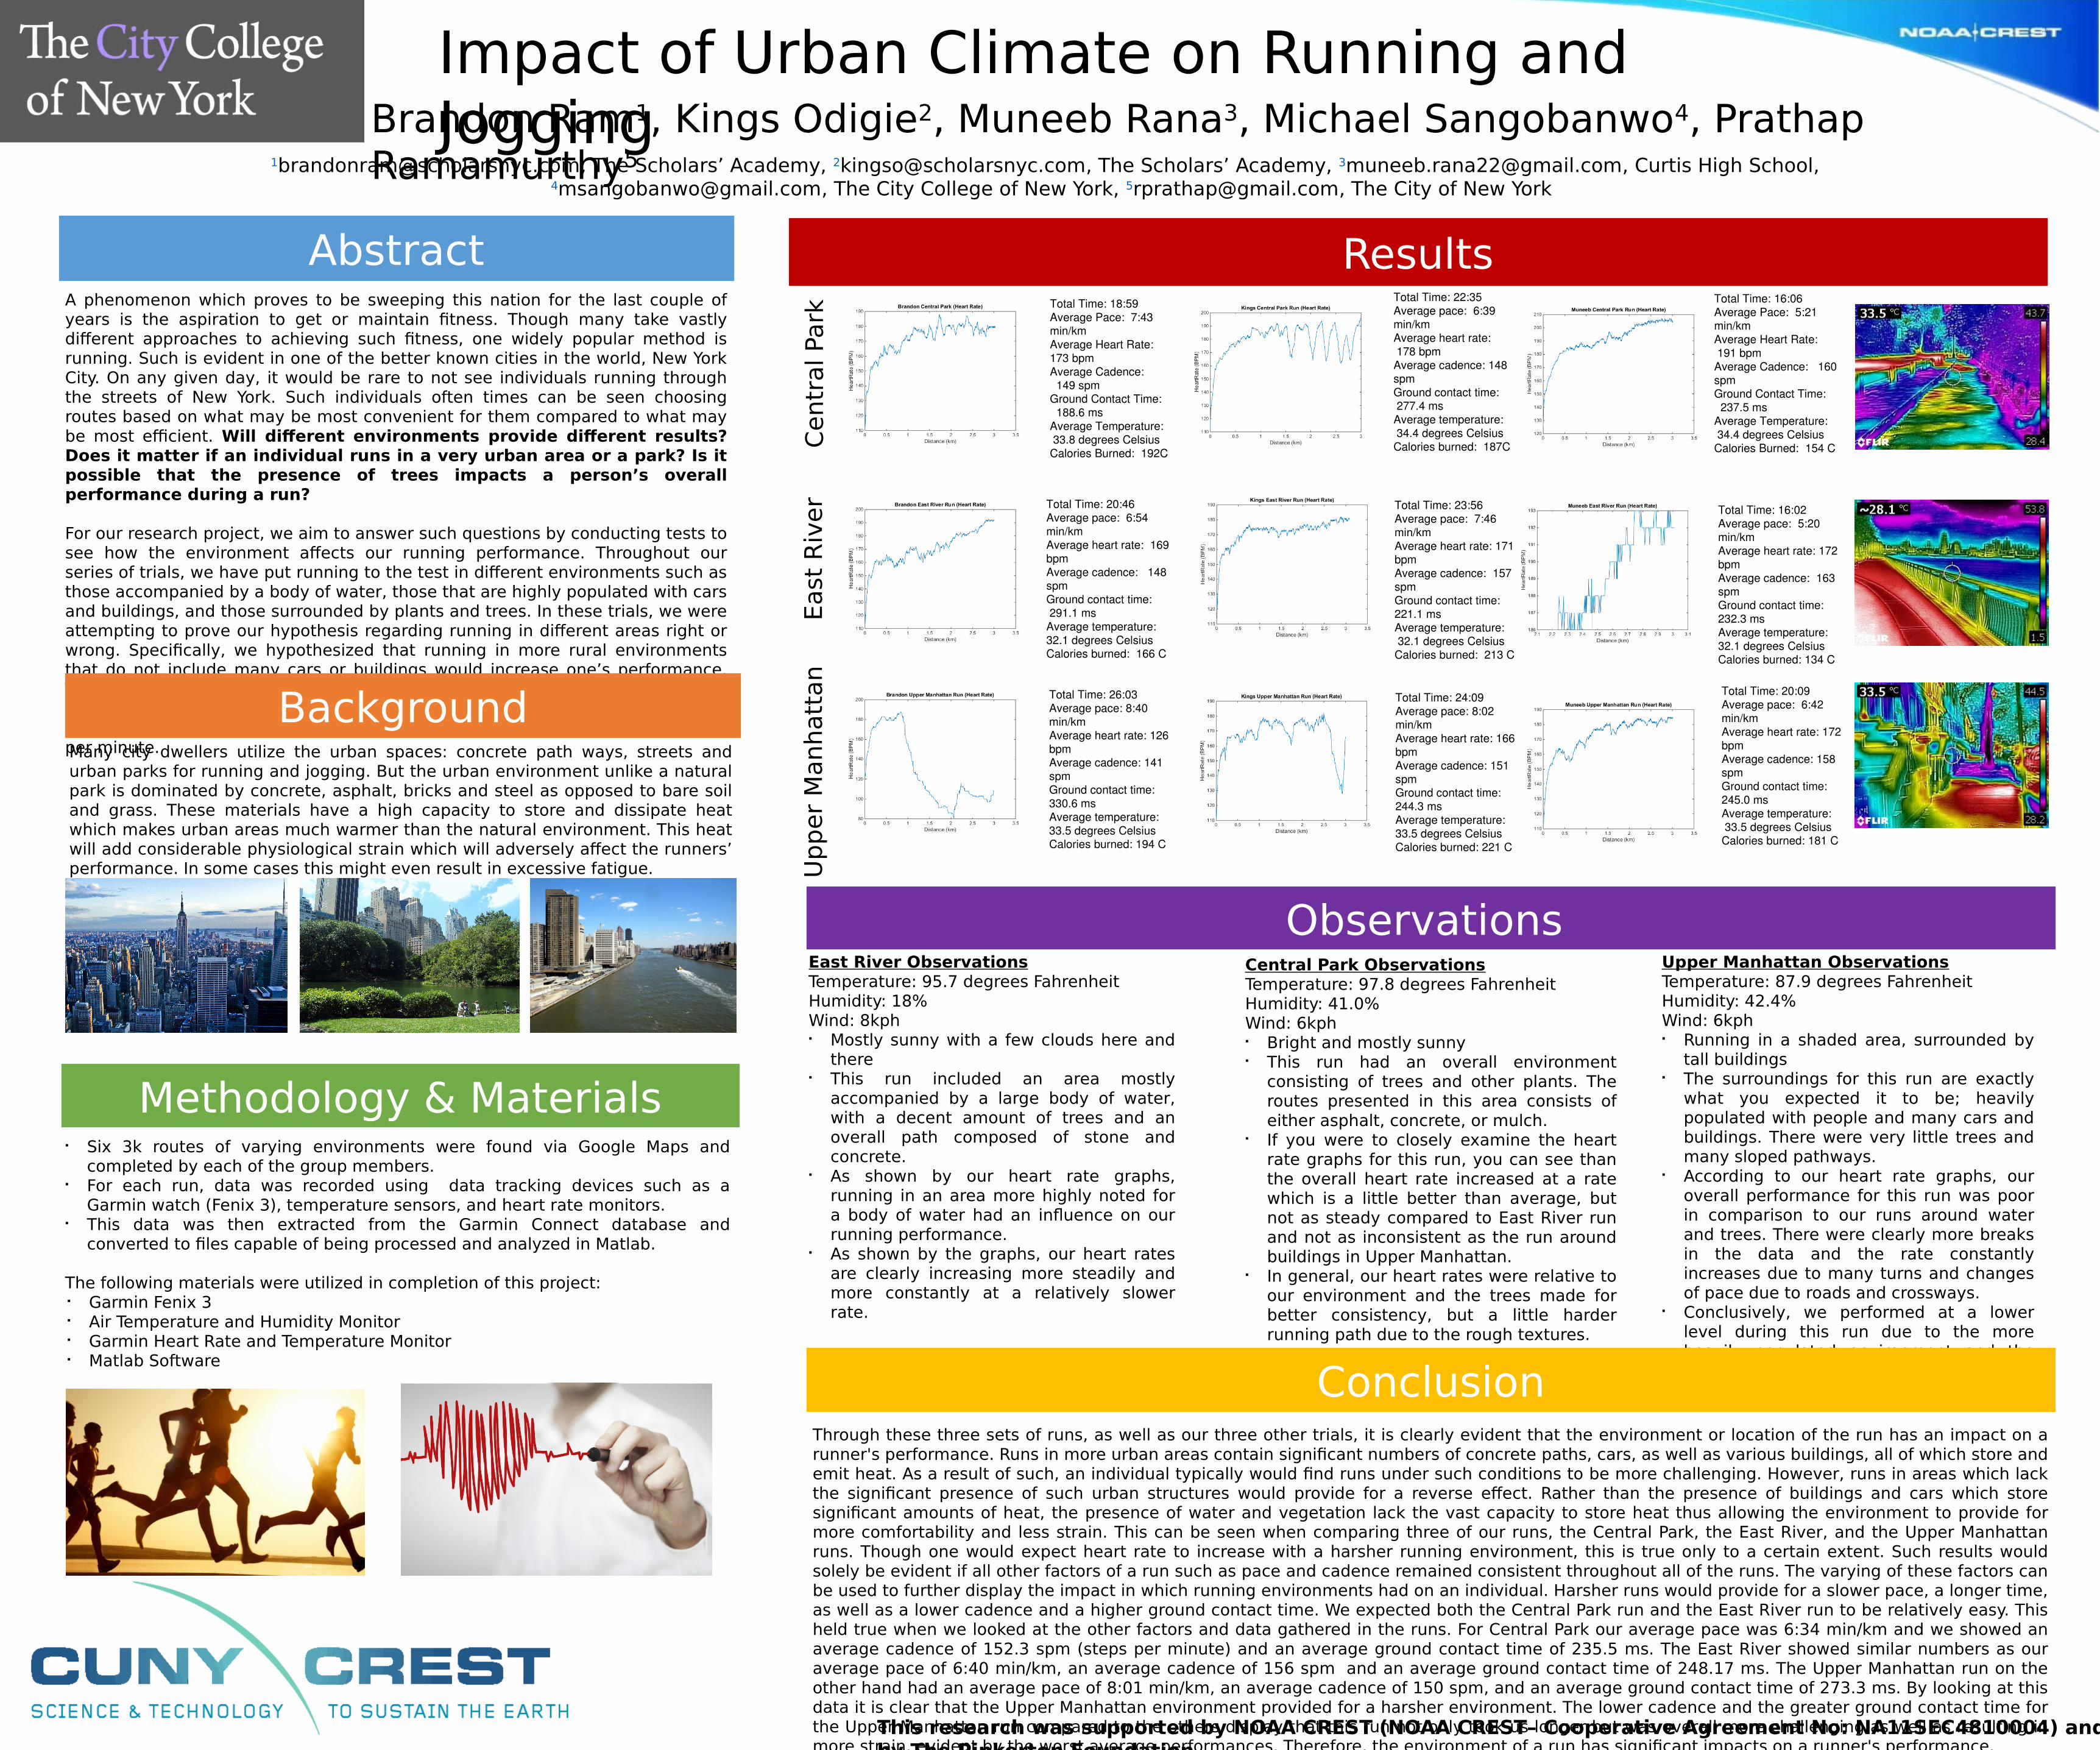
Through these three sets of runs, as well as our three other trials, it is clearly evident that the environment or location of the run has an impact on a runner's performance. Runs in more urban areas contain significant numbers of concrete paths, cars, as well as various buildings, all of which store and emit heat. As a result of such, an individual typically would find runs under such conditions to be more challenging. However, runs in areas which lack the significant presence of such urban structures would provide for a reverse effect. Rather than the presence of buildings and cars which store significant amounts of heat, the presence of water and vegetation lack the vast capacity to store heat thus allowing the environment to provide for more comfortability and less strain. This can be seen when comparing three of our runs, the Central Park, the East River, and the Upper Manhattan runs. Though one would expect heart rate to increase with a harsher running environment, this is true only to a certain extent. Such results would solely be evident if all other factors of a run such as pace and cadence remained consistent throughout all of the runs. The varying of these factors can be used to further display the impact in which running environments had on an individual. Harsher runs would provide for a slower pace, a longer time, as well as a lower cadence and a higher ground contact time. We expected both the Central Park run and the East River run to be relatively easy. This held true when we looked at the other factors and data gathered in the runs. For Central Park our average pace was 6:34 min/km and we showed an average cadence of 152.3 spm (steps per minute) and an average ground contact time of 235.5 ms. The East River showed similar numbers as our average pace of 6:40 min/km, an average cadence of 156 spm and an average ground contact time of 248.17 ms. The Upper Manhattan run on the other hand had an average pace of 8:01 min/km, an average cadence of 150 spm, and an average ground contact time of 273.3 ms. By looking at this data it is clear that the Upper Manhattan environment provided for a harsher environment. The lower cadence and the greater ground contact time for the Upper Manhattan run compared to the others display that this run not only took us longer but was overall more challenging as well as resulting in more strain, evident by the worst average performances. Therefore, the environment of a run has significant impacts on a runner's performance.
Conclusion
Total Time: 20:09Average pace: 6:42 min/kmAverage heart rate: 172 bpmAverage cadence: 158 spmGround contact time: 245.0 msAverage temperature: 33.5 degrees Celsius Calories burned: 181 C
Total Time: 16:06Average Pace: 5:21 min/kmAverage Heart Rate: 191 bpmAverage Cadence: 160 spmGround Contact Time: 237.5 msAverage Temperature: 34.4 degrees CelsiusCalories Burned: 154 C
Total Time: 16:02Average pace: 5:20 min/kmAverage heart rate: 172 bpmAverage cadence: 163 spmGround contact time: 232.3 msAverage temperature: 32.1 degrees Celsius Calories burned: 134 C
Total Time: 22:35Average pace: 6:39 min/kmAverage heart rate: 178 bpmAverage cadence: 148 spmGround contact time: 277.4 msAverage temperature: 34.4 degrees CelsiusCalories burned: 187C
Total Time: 23:56Average pace: 7:46 min/kmAverage heart rate: 171 bpmAverage cadence: 157 spmGround contact time: 221.1 msAverage temperature: 32.1 degrees CelsiusCalories burned: 213 C
Total Time: 24:09Average pace: 8:02 min/kmAverage heart rate: 166 bpmAverage cadence: 151 spmGround contact time: 244.3 msAverage temperature: 33.5 degrees Celsius Calories burned: 221 C
Total Time: 18:59Average Pace: 7:43 min/kmAverage Heart Rate: 173 bpmAverage Cadence: 149 spmGround Contact Time: 188.6 msAverage Temperature: 33.8 degrees CelsiusCalories Burned: 192C
Total Time: 20:46Average pace: 6:54 min/kmAverage heart rate: 169 bpmAverage cadence: 148 spmGround contact time: 291.1 msAverage temperature: 32.1 degrees Celsius Calories burned: 166 C
Total Time: 26:03Average pace: 8:40 min/kmAverage heart rate: 126 bpmAverage cadence: 141 spmGround contact time: 330.6 msAverage temperature: 33.5 degrees Celsius Calories burned: 194 C


![SKMBT C45110121009381[1] - Town of Montague, …...jogging, running, bicycling, individual and team sports, unstructured and playground play, dancing, water- based recreational activity,](https://img.pdfslide.us/doc/110x75/5f6abddaee7596598d7dda6b/skmbt-c451101210093811-town-of-montague-jogging-running-bicycling-individual.jpg)