Embed Size (px)
Citation preview
1
Working Paper
432
IMPACT OF THE GLOBAL RECESSION ON
MIGRATION AND REMITTANCES IN KERALA:
NEW EVIDENCES FROM THE RETURN
MIGRATION SURVEY (RMS) 2009
K.C. Zachariah
S. Irudaya Rajan
June 2010

2
Working Papers can be downloaded from the
Centre’s website (www.cds.edu)

3
IMPACT OF THE GLOBAL RECESSION ON MIGRATION
AND REMITTANCES IN KERALA:
NEW EVIDENCES FROM THE RETURN MIGRATION SURVEY
(RMS) 2009
K.C. ZachariahS. Irudaya Rajan
June 2010
The Return Migration Survey 2009 is financed by the Department ofNon-Resident Keralite Affairs (NORKA), Government of Kerala andexecuted by the Ministry of Overseas Indian Affairs (Government ofIndia) Research Unit on International Migration at the Centre forDevelopment Studies (CDS) Kerala. We are grateful to Mrs SheelaThomas, Principal Secretary to Chief Minster and Secretary, NORKA,for her continued support. The draft version of this report was presentedat an open seminar on December 1, 2009, chaired by Mrs Sheela Thomas,Secretary, NORKA and Professor D N Nararyana, CDS and Dr K N Harilal,Member, State Planning Board, Government of Kerala, as discussants.Comments received from the chairperson, discussants and participantsof the seminar are gratefully acknowledged.

4
EXECUTIVE SUMMARY
The Research Unit on International Migration at the Centre for
Development Studies undertook this study on the request of Department
of Non-Resident Keralite Affairs (NORKA), Government of Kerala.
NORKA envisagaaed that the broad objective of the study should be an
assessment of the impact of global recession on the emigrants from
Kerala.
Its specific objectives are to provide answers to the following questions:
• How many of Kerala emigrants lost their jobs abroad because of
the global recession?
• How many of them returned home due to recession-related factors?
• What are the social and economic impacts of such job losses on
the emigrants, their families and the Kerala economy?
• How their subsequent return to Kerala impacted them, their
families and the Kerala economy?
• What measures can be adopted to minimise the adverse impact
of the recession on the socio-economic situation in the state?
• What measures can be adopted to rehabilitate the emigrants who
have returned as a direct consequence of global recession,
particularly those in low-wage jobs?
These questions are answered in this study by a comparison of
two data panels where information about employment, remittances and
other characteristics have been gathered. The first data panel of emigrants
and return emigrants for 2008 (before the recession) has been compared
with corresponding information for 2009 (eight months into the
recession). The difference between the two sets of data is attributed to
recession.

5
The sample for the panel study consists of about 4000 emigrants
and 2000 return emigrants identified as such in the fourth Kerala
Migration Survey [KMS hereafter] 2008 which was also funded by the
NORKA in 2007. Being a panel study, sampling error is well controlled;
a relatively small sample, would give robust estimates.
The first question posed by NORKA is: “how many of the Kerala
emigrants abroad lost their jobs due to the recession? How many became
unemployed?”
The answer varies depending on whether we are considering the
number of emigrants who became unemployed or the number of
emigrants who had lost their job. The number unemployed may not be
the same as the number who lost their job. There is a subtle difference
between “how many lost their job” and “how many became
unemployed”. To lose a job, one should first have a job. To become
unemployed, one need not have a job (persons not in labour force in
2008 might have joined the labour force and subsequently become
unemployed in 2009). We answer the NORKA question by estimating
increase in unemployment, gross job loss and net job loss during
recession months.
1 Our estimate of the increase in unemployment during the
recession period (the period between the 2008 KMS and 2009
Return Emigration Survey (RMS hereafter) is 37,000.
This number (37,000) is the difference between the number of
emigrants (in 2008) who were unemployed in 2009 (about
59,000) and the number unemployed among them in 2008 just
before the onset of the recession (22,000).
2 Our estimate of gross “job loss” is 54,000. This number is the
number of emigrants who were employed in 2008, but became
unemployed during the recession period. It reflects the actual
job loss during recession.

6
3 Net loss of employment is 22,000. While 54,000 employed
emigrants of 2008 lost their jobs during recession months, 32,000
unemployed emigrants in 2008 became employed. Thus, while
the gross loss of employment is 54,000, net job loss is only
22,000.
These paragraphs supply the answer to the first question by NORKA.
The significance, or more correctly, the non-significance of this
number (37,000 or 54,000) becomes evident when it is compared with:
(i) the number of emigrants in 2008 (about 2.2 million)
(ii) the number of unemployed among them before their emigration
from Kerala, (about 431,000).
Thus, although both unemployment and job loss among the
emigrants have increased due to recession, the increases are relatively
small. Their unemployment rate is very much smaller than their
unemployment rate in Kerala before their emigration. Employment-
wise, the emigrants were perceived to be in a much better position even
during the recession period than in relation to what they were in Kerala
before emigration.
An analysis of the characteristics of the emigrants would throw
more light on the significance of unemployment among them.
One country in the Gulf - United Arab Emirates - contained more
than half of the unemployed emigrants (53 per cent). Saudi Arabia
accounted for about 14 per cent, Kuwait (6 per cent) and Oman and
Bahrain (4 per cent each). Unemployment rate among the emigrants
was 3.9 per cent in the UAE and 3.3 per cent in Kuwait, both higher than
the rate for all the emigrants combined, which was 2.8 per cent.
Emigrants from Malappuram district contributed most to the pool
of the recession-related unemployed in Kerala. However, the ratio of the

7
unemployed to the total number of emigrants was the highest among
those from Kottayam district.
Most of the unemployed emigrants were males, though the
unemployment ratio was higher among the females.
A very large number of the unemployed emigrants were educated
up to 10th or 12th standard, but there was no systematic relationship
between the level of education and the unemployment rate.
More than half the number of unemployed in 2009 comprised
those who had earlier worked in the “private sector” in 2008. “Labourers
in the non-agricultural sector” made up 28 per cent of this group. About
8 per cent of them were those who were not in the labour force in 2008
(household duties).
The hardship to emigrants and their families caused by the
downward movement of employed emigrants to jobs with lower salaries
was not among the questions raised by NORKA. Such employment
transitions were as important as unemployment in causing hardship to
the emigrants and their families. As this question was not raised by the
NORKA, no specific data was collected to assess its magnitude in this
study. However, with the data available in our survey, using household
remittance as a measure, some quantification of the distress caused by
such employment transitions has been made possible (see later).
About 58 per cent of the emigrants remained in the same sector of
employment in 2009 as in 2008, while the remaining 42 per cent were
seen to have shifted to another sector of employment. These figures
give a broad measure of the extent of transitions in employment that
took place during the recession period.
Specifically, about 87 per cent of those who worked in the private
sector before the onset of recession remained in the same sector after the

8
recession struck. However, 4.8 per cent of those who worked in the
private sector moved to the non-agricultural labour sector, 1.5 per cent
to Government jobs and 1.5 per cent became self-employed. A very
large chunk (about 65 per cent) of self-employed workers moved to the
private sector, while 25 per cent stayed self-employed. A large chunk
(about 82 per cent) of those who worked in non-agricultural labour
sector in 2008 moved to the private sector and 3 per cent became job
seekers. Among the Government service personnel, only 29 per cent
remained in the services, while 57 per cent moved to the private sector.
Similar trends were observed among workers in semi-Government jobs
also. Thus, the most significant movements were towards employment
in the private sector.
In consequence, major transitions occurred among the employed
emigrants in all sectors. Such transitions from one employment to
another could be a major means by which a relatively large proportion
(42 per cent) of the Kerala emigrants overcame the danger of job loss
due to the global recession. This could be one reason why the
unemployment rate among the emigrants remained relatively low.
NORKA’s second question is: ‘how many of the Kerala emigrants
have returned to Kerala as a result of the global recession?’
Our Answer is: between 37,000 and 63,000 persons.
This study estimated that a total of 173,000 Kerala emigrants
returned home during the months between October 2008 and June 2009
(the recession months). They returned due to a number of reasons, not
all of which were recession related.
How many returned due to recession-related reasons? Our
conclusion is that most of the return emigration in 2009 was not recession-
related. The conclusion is arrived at from the answers that the return
emigrants provided to the queries on the reasons for their return. The
9
reasons stated by them were mostly unrelated to recession. For instance,
about 11 percent of the return emigrants stated that they returned because
“conditions at home required their presence back home”. Another 4.6
per cent reported “difficult working conditions” as the reason for their
return home. “Personal ill health” was cited as the reason for return by
about 8.2 per cent of the return emigrants.
On the other hand, a little more than a fifth (21.4 per cent) of the
emigrants reported that they returned home because they lost their jobs
due to the financial crisis. This worked out to be about 37,000 emigrants
who returned home owing to the economic recession. Another 3.3 per
cent (5,700) stated that they were compulsorily repatriated, taking the
total number of emigrants who returned home due to recession to 43,000
and the total proportion to 24.7 per cent. Another 11.5 per cent of the
emigrants reported that they returned home because their contract had
expired and was not renewed. If they were also added to emigrants who
returned home owing to the economic recession, the percentage would
increase to 36.2 or about 63,000 emigrants. Thus, the number of
emigrants who returned to Kerala because of recession could be as low
as 21.4 per cent or as high as 36.2 per cent of the total emigrants.
Translated into numbers, these percentages implied that the number of
return emigrants attributable to the global recession would at most be
63,000 or as low as 37,000.
From the policy perspective, it is important to note that among
those who returned to Kerala due to recession-related reasons, not all
remained unemployed. Among them, only about 27,000 were unemployed
at the time of this study; others had already found employment.
These numbers provide answers to the second question raised by
NORKA.
Thus, statistical data indicates that return emigration resulting
from global recession has not been much of a calamity at the state level

10
in Kerala, as the numbers involved are relatively small. Even during the
peak of the recession, when some emigrants were returning to Kerala
due to job loss, others were going back to the Gulf and other destinations.
This study also reveals that among the return emigrants of 2008
(numbering 1,157,127), as many as 97,000 re-emigrated and became
emigrants once again. In addition, Kerala sent out about 142,000 new
emigrants during the recession period in 2009. These are important
developments that have to be taken into account when we consider
rehabilitation policies to redress the problems of a relatively small
number of returnees.
The second part of the list of objectives of this study is:
What is the social and economic impact of job losses on
migrants, their families and Kerala economy? How their
subsequent return to Kerala impacted them, their families
and Kerala economy?
This study does not include a broad analysis of the socioeconomic
impact of the recession on Kerala society. Its objective is limited to the
economic impact of job loss. Most of the economic impact (and even
some of social-psychological impact) on the returnees, their families
and the state was experienced through remittances which the household
received from its members abroad. Our analysis of the socio-economic
impact of the recession uses household cash remittances as its main
tool.
As the sample of households included in this study is not selected
at random from among all households in Kerala in 2009, this study
cannot make an unbiased estimate of remittances to Kerala in absolute
terms. What the study can do is to measure relative change (increases or
decreases) in remittances received by the households in 2008. This
seems fairly adequate to measure the impact of recession on households
and the state.
11
At the state level, our estimate of household cash remittances
does not show a decrease during the recession period. On the other
hand, the total cash remittances received by the 3,045 households in the
sample point to a modest increase of 7 per cent. This is quite an
unexpected result. One would think that the flow of remittances during
the recession would decrease and not increase. The increase could,
however, be partly explained by the fact that the remittances in 2009
were for a 12-month period which included some non-recession months.
Secondly, the recession could, in some cases, actually increase
remittances, as some of the emigrants were returning home permanently,
bringing with them all their accumulated wealth gathered during
prosperous times. As a result, some households could exhibit large
increases in remittances and others could suffer large decreases. That
this is indeed the case is shown by the analysis below.
Evidence supporting an increase in remittances during the
recession period comes from the statistics of other South Asian countries
such as Pakistan, Bangladesh, Sri Lanka and Nepal (Irudaya Rajan and
Narayana, 2010). The statistics of these countries indicate significant
increases in remittances in 2009. The all-India statistics on remittances
also support an increase in remittances to India*. Therefore the observed
increase in remittances in 2009 in the state, although somewhat
unexpected, is highly plausible.
(*Indian Banks mobilised $2.7 billion during April-September
09 from non-resident Indians (NRIs) against inflows worth $1.1 billion
during the same period last year (Economic Times, 13 November 2009)
When the data on remittances from this study are disaggregated,
all the sub-groups do not show an upward trend. Many sub-groups show
very significant decreases in remittances.
All the three major religious groups show increases in cash
remittances, although the proportions vary considerably among them.

12
There is no homogeneity among 14 districts in Kerala in this matter.
Five of 14 districts show decreases, varying from 46 per cent in Idukki
district to 0.7 per cent in Malappuram district. Nine districts show
increases, varying from 48 per cent in Kottayam district to 0.3 per cent
in Kozhikode district.
This is one level of disaggregation. For policy matters, however, a
more meaningful level of disaggregation is that at the household level.
Increases or decreases in household cash remittances give the net effect
of unemployment, shift from one job to another with lower or higher
wages/salary, and return emigration. Decrease in remittances is the factor
underlying most of the socio economic problems of the migrant
households.
Forty-four per cent of the households had received more remittances
in 2009 than they did in 2008; twenty-five per cent received the same
amounts and 31 per cent received smaller cash remittances in 2009 than
they did in 2008.
The range of the percentage of households that received smaller
remittances in 2009 varies from 44 in Idukki district and 37 in Ernakulam
district to 6.6 in Wayanad district. Among the households that received
smaller remittances in 2009, about 18 per cent are in Malappuram district,
and 11 per cent each in Thiruvananthapuram and Pathanamthitta
districts.
Among the households that received smaller remittances in 2009,
29 per cent received less than 25 per cent of what they received in 2008,
44 per cent received less than 50 per cent of what they received in 2008,
and 69 per cent received less than 75 per cent of what they received in
2008.
About 90,000 households that received remittances in 2008 (6.4
per cent of the households) did not receive any remittances at all in
2009. Most of these households are in Thiruvananthapuram district

13
(13,000), followed by Kozhikode district (13,000). Thrissur and
Malappuram districts account for a large number of the households that
received no remittances in 2009.
If at all there is going to be any rehabilitation, households that
did not receive any remittances in 2009 deserve rehabilitation most.
Lastly, we look at policies and programmes to overcome the
recession-related problems.
What measures could be adopted to minimise the adverse
impact on the socio-economic situation in the state? What
measures could be adopted to rehabilitate the emigrants
who had returned as a direct consequence of the global
recession, particularly those who were employed abroad
in low-level jobs?
This study has brought to light some of the broad dimensions of
the problems created by the global recession on Kerala emigrants – the
number of emigrants who became unemployed, the number who lost
jobs abroad, the number who were forced to return to Kerala, the countries
in which the returnees had been working, the districts they hailed from,
the sector of economic activity they were engaged in before the
recession, and their demographic and socio-economic characteristics.
The study also gives a rough estimate of the number of households that
received smaller amounts as household cash remittances in 2009
compared to what they received in 2008; and the number of households
that received remittances in 2008, but not in 2009.
Groups that deserve Special Consideration in Combating
The Adverse Impact of the Recession
• Families in Kerala of the 56,000 emigrants abroad who lost their
jobs
14
• Families in Kerala of the unknown number of emigrants abroad
who suffered loss of income due to salary cuts and increase in
the cost of living
• 173,000 emigrants who returned home during the recession
• 63,000 emigrants who returned in 2009 as a direct result of the
recession
• 28,000 return emigrants who are still unemployed
• 431,000 Kerala households that received smaller amounts as
remittances in 2009 compared with what they received in 2008
• 90,000 Kerala households that received remittances in 2008,
but no remittances in 2009.
This is useful background material for arriving at policies and
programmes to minimise the adverse impact of recession on the
households of the emigrants or return emigrants in the state. However,
they are just background information and do not include policies or
programmes. This study recommends that such policies and programmes
be put together in consultation with NORKA officials (who have a wider
grasp of the migration situation in the state), taking into consideration
the results of this study.
While putting together such policies and programmes, this study
suggests that the following points also can be taken into consideration.
First, the number of Kerala emigrants who returned due to the
recession is not as large as is often reported to be. The number is unlikely
to be more than 63,000. Among these returnees, only about 28,000 are
unemployed at the time of the survey.
Second, even as emigrants returned to Kerala, new emigrants and
former emigrants (who had returned earlier) are going back to the Gulf
and other destination countries, thus regaining their emigrant status.
15
The recession has not been much of a deterrent and has not stood in their
way for re-emigration.
Third, household remittances at the state level have increased
and not decreased during the recession months, although there are several
households whose remittances have decreased. About 6 per cent of the
households that received remittances in 2008 did not receive any
remittances in 2009.
Fourth, NORKA has recently announced a number of new measures
to help emigrants and return emigrants. These include (i) training
programme for the prospective emigrants, and (ii) financial assistance
to returnees by way of loans from Kerala State Financial Corporation.
These measures would go some way in easing the problems of emigrants
and return emigrants. The Government could undertake more such
measures including one to provide future emigrants with multiple skills
that would enable them to move from one employment sector to another
according to the need of the day.
Fifth, the present study indicates that the efforts to utilise the
expertise which the return emigrants have gained abroad for the state’s
development are more likely to succeed now than at any time in the
past. A concerted effort to utilise the return emigrant’s acquired skills
abroad for skill up-gradation and industrial development in the state is
worth undertaking in the present context. This would be the best
rehabilitation package for return emigrants that the Government can
offer at present.
Sixth, the global recession has affected not only emigrants but
also non-migrants, persons who have never stepped out of the state. The
global recession has affected most of the export dependent industries in
Kerala: coir, fishing and cashew, to name a few. Not only were the owners
of the enterprises affected by the recession, but also the workers, some of
whom have lost their jobs. Although these workers themselves do not

16
bring in any foreign exchange directly, the industries which utilise their
labour contribute significantly to the foreign exchange earnings of the
country. Should not the package that is being developed to help the
return emigrants equally benefit non-migrant workers and others affected
by the global recession?
Lastly, the study recommends that the Government should give
as much, or much more importance to “problem-preventing measures”
aimed at future emigrants as to “problem-solving measures” aimed at
returning emigrants.

17
I. INTRODUCTION
The Research Unit on International Migration at the Centre for
Development Studies, Thiruvananthapuram, undertook this study on
the impact of global recession on Kerala emigration at the request of the
Department of Non-Resident Keralite Affairs (NORKA), Government of
Kerala. The objectives of the study were clearly spelt out by NORKA in
terms of a framework of questions on emigration from, and return
emigration to, Kerala since the beginning of the global recession. Based
on these objectives and the specified questions, CDS prepared a proposal
for the study which was approved by NORKA soon after.
According to this proposal, the broad objective of this study is to
assess the impact of the global economic recession on the employment
and economic conditions of emigrants from Kerala. Answers to the
following questions would signify the extent of the impact: How many
of Kerala’s emigrants lost their jobs abroad since the beginning of the
global recession and how many have been forced to return home? What
are the social and economic implications of such job losses and the
subsequent return of the emigrants for their families and for the Kerala
economy? What measures can be adopted to minimise the adverse
impact of return emigration on the socio-economic scenario of the state?
What measures can be adopted to rehabilitate the emigrants who have
returned as a direct consequence of the global recession, particularly
those who were employed abroad in low level jobs?

18
A first step in this endeavour would be to obtain a rough estimate
of the number and characteristics of the emigrants who lost their jobs
abroad; and of those who returned to Kerala either as a result of job
loss or due to other factors directly related to the economic recession
abroad.
In the last two years, CDS had conducted two large scale migration
surveys in Kerala and both were financed by the NORKA, Government
of Kerala. The first survey was carried out during March-July 2007. It
covered a sample of 10,000 households selected at random from all the
63 taluks in the state. Among these 10,000 households, 1,768 had an
emigrant (EMI), 1,065 had a return emigrant (REM) and 2,556
households had either an emigrant or a return emigrant (for more details
of the Kerala Migration Survey 2007, see Zachariah and Irudaya Rajan,
2008)
The second study was carried out during August-December 2008,
just before the global recession started. It was based on a larger sample
of 15,000 households selected at random from all the 63 taluks in the
state. About 2,702 of the 15,000 households had an emigrant (EMI)
each from their households. Similarly 1,765 of the sample households
had a return emigrant (REM) and 3,981 households had either an
emigrant or return emigrant (for more details of the Kerala Migration
Survey 2008, see Zachariah and Irudaya Rajan, 2009)
The new study (Return Migrants Study 2009 or RMS 2009), is
designed to cover 6,537 households (2,556 from the 2007 study and
3,981 from the 2008 study). The households which could not be
contacted were 113. Data were collected from the remaining 6,424
households. The field work was carried out during 16 June – 7 September
2009.
The following data were collected through surveys and were used
for this report:

19
(i) Current information on members of selected households in the
2007 and 2008 studies.
(ii) Current information from the (OLD) EMIs and the REMs
identified as such in the 2007 and 2008 studies.
(iii) Current information on NEW EMIs and REMs (those not
included in (ii) above).
The data now enables the estimation of the number of emigrants
and proportion of those who underwent changes in migration and
employment status since the previous survey (2007 or 2008). It is also
possible now to study the socio-economic conditions of those who were
adversely affected by the global recession with respect to employment.
Although all the 6,537 households which were identified to have
an emigrant or return emigrant in the 2007 and 2008 surveys were
expected to be visited by an investigator, only 6,424 households could
be contacted as others had moved out of the area without leaving any
contact address. The necessary information was collected from these
households with the help of a structured questionnaire. Data from these
6,424 households form the basis for this report.
The present report makes use of data related to emigrants and
return emigrants identified as such in KMS 2008 (not in KMS 2007),
new emigrants (emigrants who emigrated after December 2008) and
new return emigrants (return emigrants who came back to Kerala after
December 2008) in households with an emigrant or return emigrant
covered by KMS 2008
The field work for this study was carried out by specially trained
investigators under the supervision of the Kerala Statistical Institute.
General information about the sample households
The sample households in this study are not a random sample of
the 8 million households in Kerala in 2009. The sample includes only

20
those households with an emigrant or a return emigrant. Therefore, it is
not possible to make generalisations from the sample about the total
number of migrants from the state, total remittances to the state, etc.,
However, the sample would provide unbiased estimate of parameters
directly related to emigrants. An example is the proportion of the 2008
emigrants who returned to Kerala during the time period between the
2008 survey and the 2009 survey. If this proportion is applied to the
total number of emigrants from Kerala in 2008 (2,193,412), it is possible
to get an unbiased estimate of the number of emigrants who had returned
to Kerala since the 2008 survey. As the sampling was done independently
in the various districts and as the sampling fraction was different in
different districts, estimates were obtained independently for the 14
districts and these estimates have been added up to get the state level
estimate.
Against this background, the various questions raised by NORKA
are addressed below
II UNEMPLOYMENT AMONG EMIGRANTS DUE TO THERECESSION
How many of the emigrants from Kerala who continue to
stay abroad have lost their jobs in recent months as a
result of the global recession? How many have become
unemployed?
Employment Before and After Recession
We start this analysis by comparing the employment situation of
emigrants before the recession period (October-December 2008) with
the same set of emigrants after the recession (June-August 2009) see
Table 1 and Annex Table I.
A total of 3,953 emigrants from the KMS 2008 survey were
included in the RMS 2009 survey. Of them, 3,456 were employed in
2008, 39 were unemployed, and 458 were not in the labour force. The
21
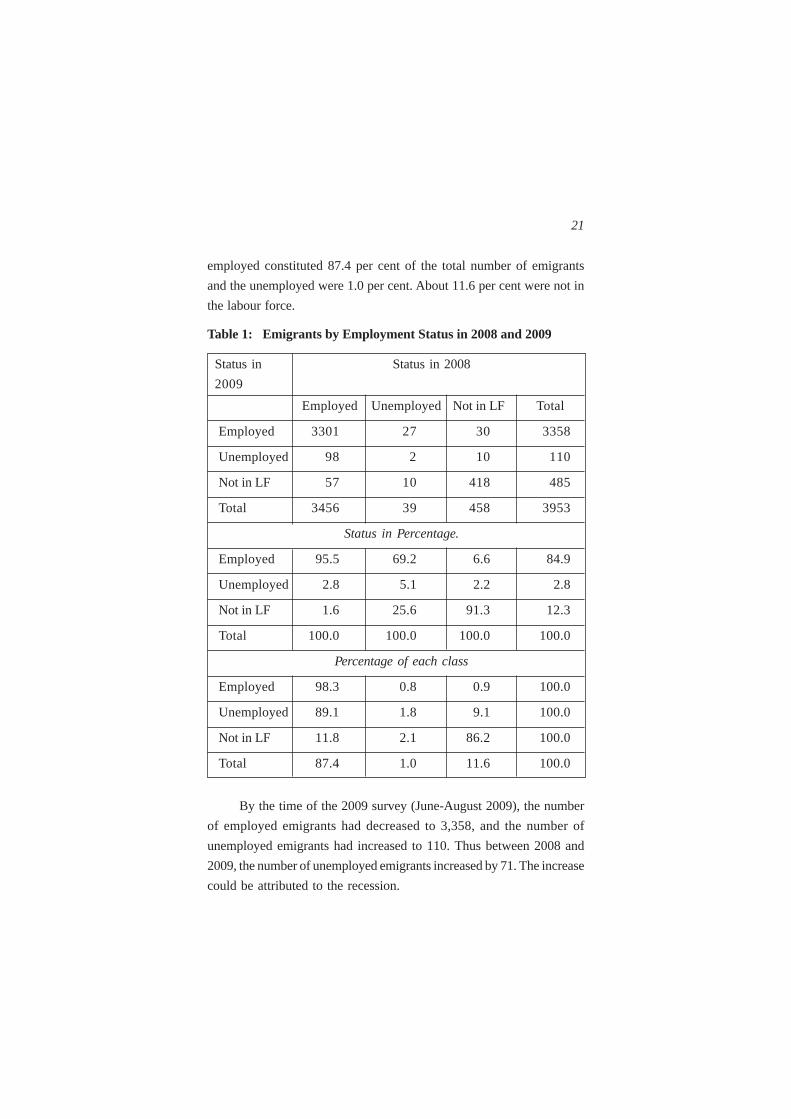
employed constituted 87.4 per cent of the total number of emigrants
and the unemployed were 1.0 per cent. About 11.6 per cent were not in
the labour force.
Table 1: Emigrants by Employment Status in 2008 and 2009
Status in Status in 2008
2009
Employed Unemployed Not in LF Total
Employed 3301 27 30 3358
Unemployed 98 2 10 110
Not in LF 57 10 418 485
Total 3456 39 458 3953
Status in Percentage.
Employed 95.5 69.2 6.6 84.9
Unemployed 2.8 5.1 2.2 2.8
Not in LF 1.6 25.6 91.3 12.3
Total 100.0 100.0 100.0 100.0
Percentage of each class
Employed 98.3 0.8 0.9 100.0
Unemployed 89.1 1.8 9.1 100.0
Not in LF 11.8 2.1 86.2 100.0
Total 87.4 1.0 11.6 100.0
By the time of the 2009 survey (June-August 2009), the number
of employed emigrants had decreased to 3,358, and the number of
unemployed emigrants had increased to 110. Thus between 2008 and
2009, the number of unemployed emigrants increased by 71. The increase
could be attributed to the recession.

22
Unemployment during the Recession
An estimate of the numbers unemployed among the emigrants in
2008 was 22,610 (Table 2). The corresponding number among the same
number of emigrants in 2009 was 60,099. Thus, the increase in the
number of unemployed emigrants was 37,489. This was an estimate of
the number of emigrants who became unemployed during 2008-09 (the
recession period).
Table 2: Estimate of Unemployed among the 2008 Emigrants in 2009
Districts Unemployed Emigrants 2008 Unemployed
2008 2009 Sample Kerala 2008 2009
Thiruvanan-
thapuram 3 12 427 308481 2167 8669
Kollam 4 7 328 207516 2531 4429
Pathanamthitta 3 12 360 120990 1008 4033
Alappuzha 5 5 199 131719 3971 3310
Kottayam 1 7 191 89351 468 3275
Idukki 0 0 20 5792 0 0
Ernakulam 3 2 181 120979 2005 1337
Thrissur 2 12 438 284068 1297 7783
Palakkad 1 8 292 189815 650 5200
Malappuram 8 21 616 334572 4345 11406
Kozhikode 4 7 325 199163 2451 4290
Wayanad 1 0 75 13996 187 0
Kannur 2 8 233 119119 1022 4090
Kasaragode 2 9 268 67851 506 2279
Kerala 39 110 3953 2193412 22610 60099
No of Unemployed 2008 22610
No of Unemployed 2009 60099
Increase 37489
23
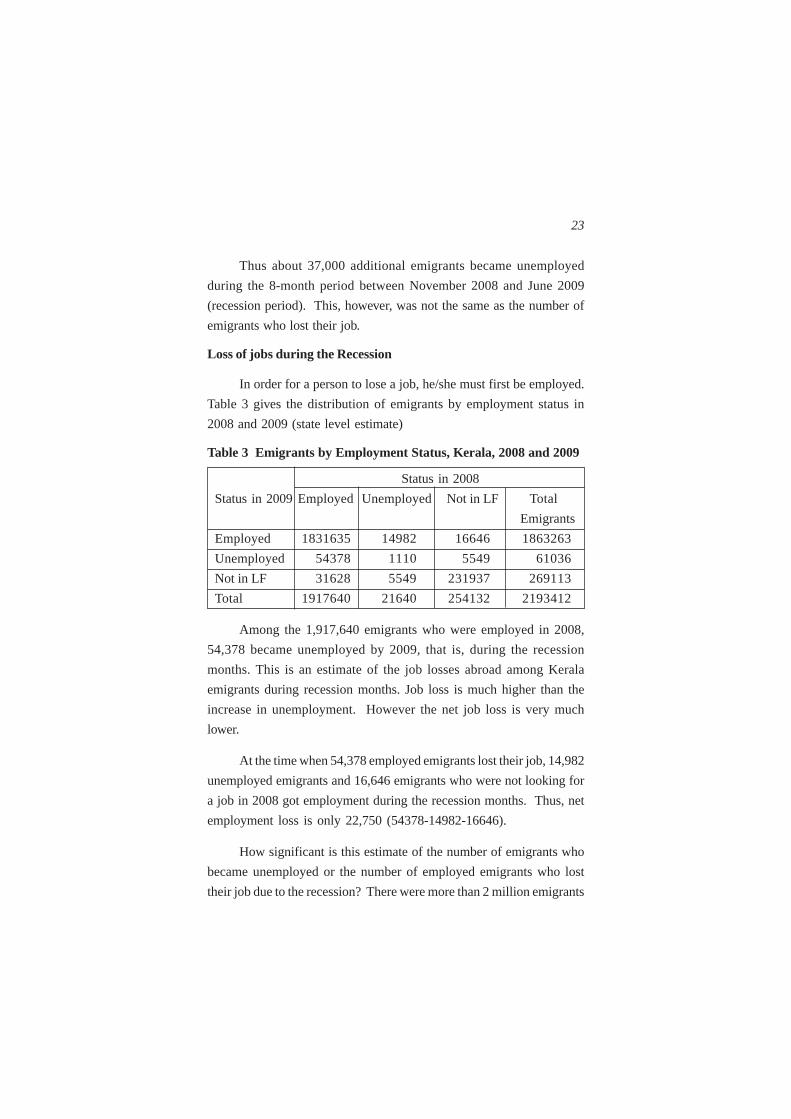
Thus about 37,000 additional emigrants became unemployed
during the 8-month period between November 2008 and June 2009
(recession period). This, however, was not the same as the number of
emigrants who lost their job.
Loss of jobs during the Recession
In order for a person to lose a job, he/she must first be employed.
Table 3 gives the distribution of emigrants by employment status in
2008 and 2009 (state level estimate)
Table 3 Emigrants by Employment Status, Kerala, 2008 and 2009
Status in 2008
Status in 2009 Employed Unemployed Not in LF Total
Emigrants
Employed 1831635 14982 16646 1863263
Unemployed 54378 1110 5549 61036
Not in LF 31628 5549 231937 269113
Total 1917640 21640 254132 2193412
Among the 1,917,640 emigrants who were employed in 2008,
54,378 became unemployed by 2009, that is, during the recession
months. This is an estimate of the job losses abroad among Kerala
emigrants during recession months. Job loss is much higher than the
increase in unemployment. However the net job loss is very much
lower.
At the time when 54,378 employed emigrants lost their job, 14,982
unemployed emigrants and 16,646 emigrants who were not looking for
a job in 2008 got employment during the recession months. Thus, net
employment loss is only 22,750 (54378-14982-16646).
How significant is this estimate of the number of emigrants who
became unemployed or the number of employed emigrants who lost
their job due to the recession? There were more than 2 million emigrants

24
from Kerala in 2008. Fifty four thousand emigrants who lost their job or
37,000 emigrants who became unemployed are by no means very huge
numbers in relation to the total emigrants. The unemployed or those
who lost their job are less than 3 per cent of the total number of emigrants.
It is also instructive to compare the unemployment due to the recession
with unemployment among these same emigrants in Kerala before
emigration.
The number of unemployed emigrants in the sample in 2008 was
39. The number of unemployed emigrants in the sample following the
recession is 110. The number of unemployed among them in Kerala
before their emigration is 805, more than 7 times the number
unemployed after the recession. Thus, although unemployment has
increased considerably (relatively speaking) the unemployment among
Kerala emigrants after the recession is very much lower than the
unemployment among them in Kerala before emigration. In spite of the
impact of recession, from the point of view of employment, the emigrants
are in a much better position than they were before they left Kerala.
25
Are all these job losses due to the global recession? It is certainly
not unusual for employed persons, migrants or non-migrants, to become
unemployed even in ‘normal’ times (when there is no recession). Every
year some emigrants lose their jobs in the normal course of events. Only
when such job losses are much larger than is expected in normal course
of events, we can conclude that all the job losses among the emigrants
in 2008 was due to the global recession during the first half of 2009.
Unfortunately, comparable data for a non-recession year are not available.
Some approximations are however, are possible.
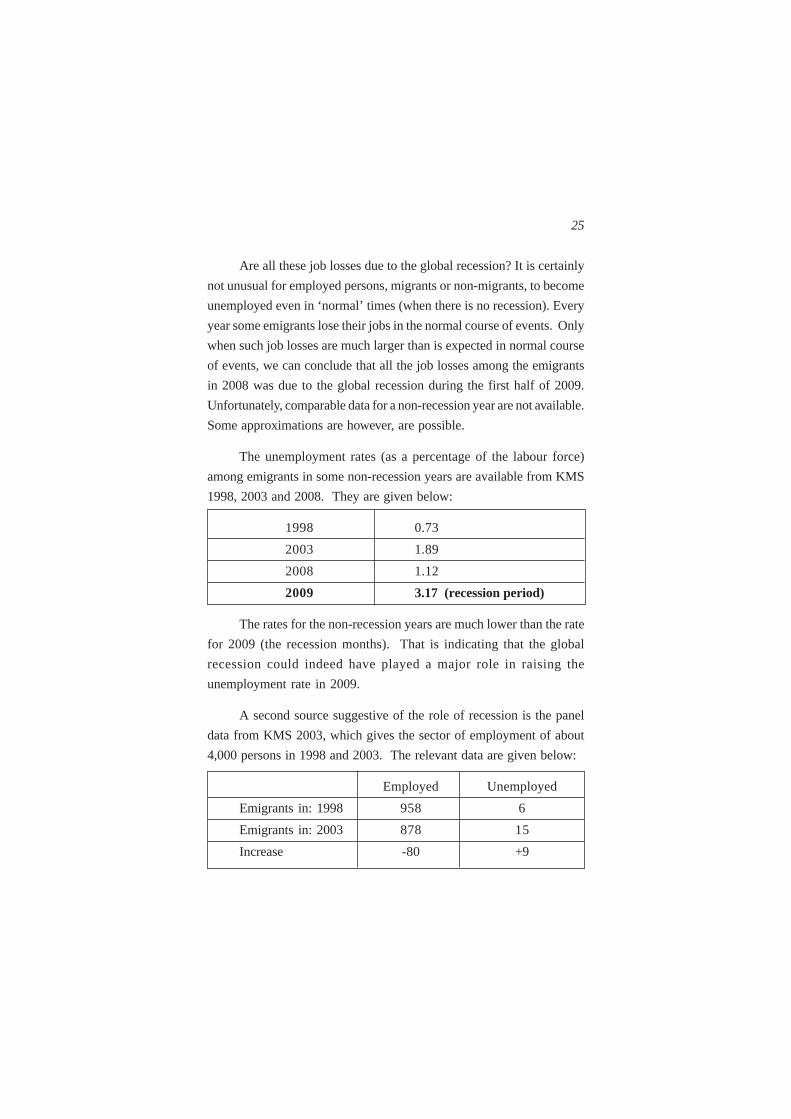
The unemployment rates (as a percentage of the labour force)
among emigrants in some non-recession years are available from KMS
1998, 2003 and 2008. They are given below:
1998 0.73
2003 1.89
2008 1.12
2009 3.17 (recession period)
The rates for the non-recession years are much lower than the rate
for 2009 (the recession months). That is indicating that the global
recession could indeed have played a major role in raising the
unemployment rate in 2009.
A second source suggestive of the role of recession is the panel
data from KMS 2003, which gives the sector of employment of about
4,000 persons in 1998 and 2003. The relevant data are given below:
Employed Unemployed
Emigrants in: 1998 958 6
Emigrants in: 2003 878 15
Increase -80 +9

26
Increase in number unemployed as percent of employed in 1998
= 0.94
Thus, the percent increase in unemployment among the emigrants
during a 5-year non-recession period is relatively very small when
compared to the corresponding increase during the 8-month period of
the global recession.
A logical conclusion from these analyses is that global recession
had an effect on the employment situation among Kerala emigrants
abroad. About 54,000 employed emigrants lost their job and 37,000
additional emigrants became unemployed during the first half of 2009.
It would not be very far from the truth to attribute almost all of this
additional unemployment to global recession.
Our answer to the first question raised by NORKA is that there
was a net increase in unemployment of 37,000 among Kerala
emigrants; and that 54,000 employed emigrants lost their job during
the recession.
Transition to the Unemployment
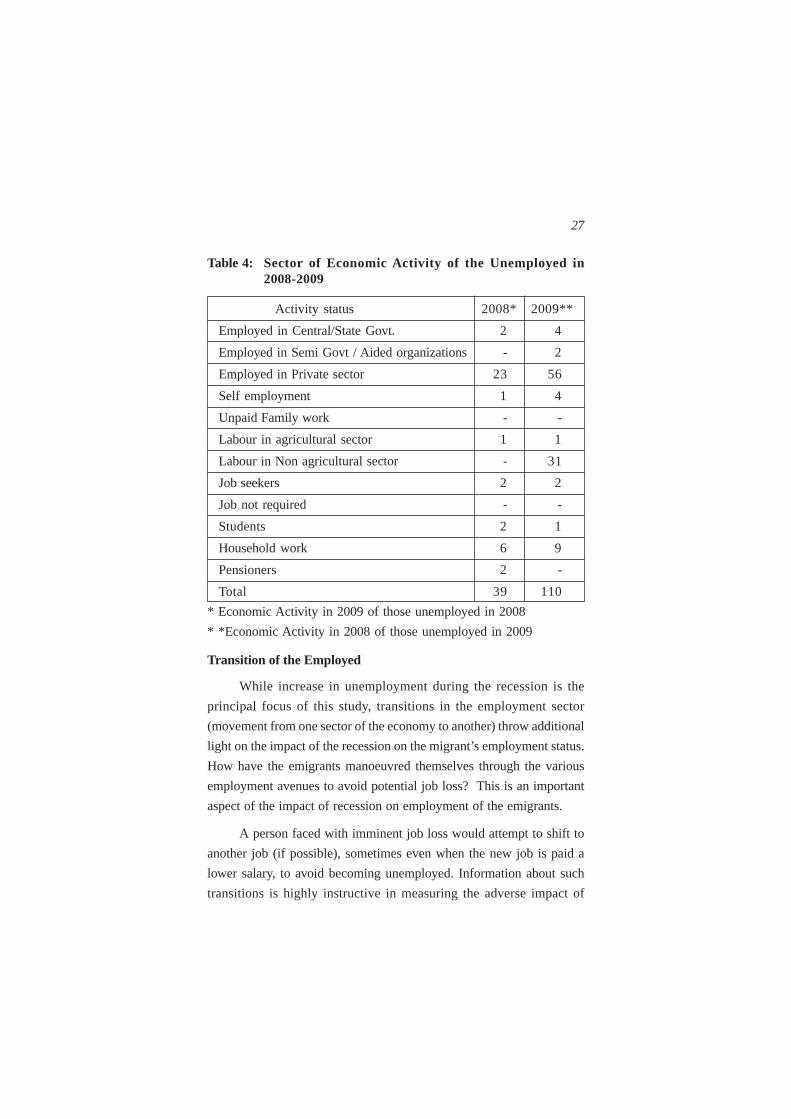
It was mentioned that the number of unemployed emigrants in the
sample had increased by 71 persons. From which sectors of economic
activity did they come from? Table 4 (sample data) shows that 2 persons
came from the Government service category, 2 from semi-government
services, 33 from the private sector, 3 from the self-employment sector
and 31 from the non-agricultural labour sector. These numbers add up
to 71. The changes in the sectors outside the labour force cancel each
other out
Thus, most of the newly unemployed turned up from the
private sector and from among the labourers in the non-agricultural
sector.
27
Table 4: Sector of Economic Activity of the Unemployed in2008-2009
Activity status 2008* 2009**
Employed in Central/State Govt. 2 4
Employed in Semi Govt / Aided organizations - 2
Employed in Private sector 23 56
Self employment 1 4
Unpaid Family work - -
Labour in agricultural sector 1 1
Labour in Non agricultural sector - 31
Job seekers 2 2
Job not required - -
Students 2 1
Household work 6 9
Pensioners 2 -
Total 39 110
* Economic Activity in 2009 of those unemployed in 2008
* *Economic Activity in 2008 of those unemployed in 2009
Transition of the Employed
While increase in unemployment during the recession is the
principal focus of this study, transitions in the employment sector
(movement from one sector of the economy to another) throw additional
light on the impact of the recession on the migrant’s employment status.
How have the emigrants manoeuvred themselves through the various
employment avenues to avoid potential job loss? This is an important
aspect of the impact of recession on employment of the emigrants.
A person faced with imminent job loss would attempt to shift to
another job (if possible), sometimes even when the new job is paid a
lower salary, to avoid becoming unemployed. Information about such
transitions is highly instructive in measuring the adverse impact of

28
recession and devising policies to deal with them. Information on such
movements is more significant than that on job losses.
Between 2008 and 2009, the number of employed persons
decreased by 98 (Table 5), the number of unemployed persons increased
by 71 and the number of those not in labour force increased by 27. As a
result, some employment sectors gained and some others lost. Which
were the sectors that gained and which were the ones that lost?
Table 5 indicates that, the number of emigrants working in the
private sector increased by about 38 per cent. At the same time, the
number of emigrants working as labourers in the non-agricultural sector
has decreased by 100 per cent. There were also significant losses
(relatively) in employment in Government and semi-Government sectors.
Table 5: Economic Activity in 2008 and 2009 of Emigrants of KMS 2008
Activity status 2008 2009 DifferenceEmployed in Government Sector 79 74 -5Semi-Government Sector 65 12 -53Private Sector 2135 2938 803Self Employment 129 90 -39Unpaid Family Worker 8 15 7Agriculture Sector Labourer 7 228 221Non-Agriculture Sector Labourer 1033 1 -1032Job Seekers 39 110 71Job not Needed 4 4 0Students 218 218 0Household Work 122 135 13Pensioners 4 7 3Others 110 121 11TOTAL 3953 3953 0Employed 3456 3358 -98Unemployed 39 110 71Not In Labour force 458 485 27
Total 3953 3953 0

29
At the same time, some persons who were not in the labour force
in 2008 (those engaged in household duties) got employment during
the recession period.
Cross-Classification
A broader understanding of such transitions in employment is
gained from a cross-classification of the of the employment sector of the
emigrants in 2008 by their employment sector in 2009. Such a
classification (Annex Table I) indicates that 2,304 emigrants (58.1
percent) have remained in the same sector of employment in 2009 as
they were in 2008. They did not change their sector of economic activity.
The remaining 41.9 per cent of emigrants changed their sector of
economic activity.
Out of the 2,135 persons who worked in private sector in 2008,
1862 (87.2 per cent) remained in the same sector, 1.5 per cent moved to
Government jobs, 4.8 per cent moved to non-agricultural labour sector
and 1.5 per cent moved to self employment. Out of the 129 persons in
the self employment sector 84 (65 per cent) moved to the private sector,
while 25 per cent remained in self employment. Thus, while 79 moved
out of the private sector, 27 others moved into the private sector. Out of
the 1,033 persons who worked as non-agricultural labour in 2008, 81.5
per cent moved into private sector employment and 3 per cent became
job seekers. Out of the 79 in Government services, only 29 per cent
continued in the same services, while 57 per cent moved to the private
sector. A similar pattern of movement occurred also among workers in
semi-Government jobs.
Thus, several significant transitions occurred among the employed
emigrants in all the sectors. Such transition from one employment sector
to another could have been a major means by which a relatively large
proportion (42 per cent) of the Kerala emigrants withstood the impending
job loss due to the global recession. This could be one reason why the
unemployment rate among the emigrants remained relatively low.
30
Characteristics of the Unemployed
Data on the characteristics of the unemployed provides important
additional information needed to formulate policies to redress their
problems. Those characteristics could be gathered from answers to selected
questions such as: From which district of Kerala did they hail? In which
countries did they live? How many are males and how many, females?
Country of Residence of the Unemployed
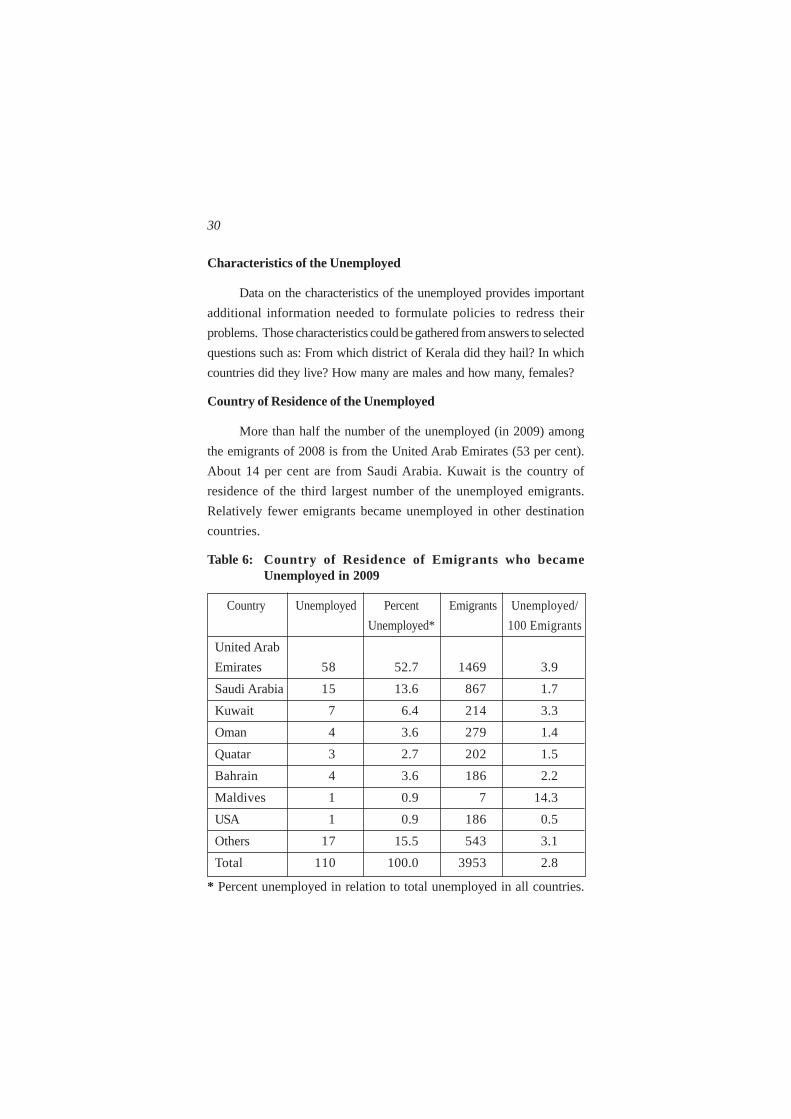
More than half the number of the unemployed (in 2009) among
the emigrants of 2008 is from the United Arab Emirates (53 per cent).
About 14 per cent are from Saudi Arabia. Kuwait is the country of
residence of the third largest number of the unemployed emigrants.
Relatively fewer emigrants became unemployed in other destination
countries.
Table 6: Country of Residence of Emigrants who becameUnemployed in 2009
Country Unemployed Percent Emigrants Unemployed/
Unemployed* 100 Emigrants
United Arab
Emirates 58 52.7 1469 3.9
Saudi Arabia 15 13.6 867 1.7
Kuwait 7 6.4 214 3.3
Oman 4 3.6 279 1.4
Quatar 3 2.7 202 1.5
Bahrain 4 3.6 186 2.2
Maldives 1 0.9 7 14.3
USA 1 0.9 186 0.5
Others 17 15.5 543 3.1
Total 110 100.0 3953 2.8
* Percent unemployed in relation to total unemployed in all countries.

31
District of Origin
The largest number of the unemployed emigrants hailed from
Malappuram district. A considerable number of emigrants also hailed
from Thiruvananthapuram, Kollam and Thrissur districts.
Table 7: Unemployment: Percent and Rate by District, 2009
Districts Unemployed EMI UnemployedPercentage* Rate
Thiruvananthapuram 12 376 10.9 3.2
Kollam 7 300 6.4 2.3
Pathanamthitta 12 301 10.9 4.0
Alappuzha 5 173 4.5 2.9
Kottayam 7 160 6.4 4.4
Idukki 0 16 0.0 0.0
Ernakulam 2 140 1.8 1.4
Thrissur 12 377 10.9 3.2
Palakkad 8 228 7.3 3.5
Malappuram 21 567 19.1 3.7
Kozhikode 7 296 6.4 2.4
Wayanad 0 70 0.0 0.0
Kannur 8 213 7.3 3.8
Kasaragode 9 251 8.2 3.6
Kerala 110 3468 100.0 3.2
* Percentage in relation to the total number of emigrants from all districts.
The unemployment ratio (the number of unemployed emigrants
as a percentage of the total number of emigrants), however, is highest
among emigrants from Kottayam district (4.4 per cent). In this regard,
Pathanamthitta and Kannur districts rank second and third respectively.
Malappuram is only the fourth from the top. The average unemployment
ratio is about 3.6 per cent.

32
Sex
More than 85 per cent of the unemployed among the emigrants in
2008 were males. Females constituted 14.5 per cent of the total. However,
the unemployment rate is higher among females, 5.93 per cent compared
with 2.94 per cent among males. The overall unemployment rate is 3.2
per cent.
Table 8: Unemployment in 2009 among Males and Females of 2008Emigrants
Sex Unemployed Labour Percentage* Rate (%)Force
Males 94 3198 85.5 2.9
Females 16 270 14.5 5.9
Total 110 3468 100.0 3.2
* Percentage in relation to the total number of unemployed of both sexes.
Age
The largest number of the unemployed emigrants is in the 25-29
age group among all the age groups. This group also has the highest
unemployment rate, i.e., 4.72 per cent compared to the overall average
of 3.2 per cent.

33
Levels of Schooling
Nearly one-third (32.7 per cent) of the unemployed emigrants are
from among those with 10th standard education. A fairly large number of
the unemployed emigrants (18.2 per cent) are those with 12th standard
education. However, there is no systematic upward or downward relation
between the unemployment ratio and years of schooling. This relation
between the years of schooling and unemployment rate among emigrants
is given in Table 9.
Table 9: Unemployment Percent and Rate by Level of Schooling,2009
Education Unemployed Labour force Unemployment
Rate %*
Less than class 6 8 190 4.2 7.3
Class 6-9 14 686 2.0 12.7
Class 10-12 57 1574 3.6 51.8
Classes 12+ 29 1006 2.9 26.4
Others 2 12 16.7 1.8
Total 110 3468 3.2 100.0
* Percent unemployed in relation to total unemployed
III RETURN EMIGRATION DUE TO THE RECESSION
How many of the Kerala emigrants returned to Kerala in the
recent months in 2009 as a consequence of the global recession?
Emigrants of 2008 by Migration Status in 2009
The 2009 survey has collected information on the current
migration status of all the 3,953 emigrants identified in the 2008 survey.
How many of them have remained emigrants (EMI) and how many have
returned to Kerala as REM? The data are given below:

34
Table 10: Emigrants of 2008 by Migration Status in 2009 in the RMS,2009
Number Percent
EMI 3649 92.3
REM 304 7.7
Total 3953 100
Of the 3,953 emigrants (sample) in KMS 2008, 304 or 7.7 per cent
have returned to Kerala by the time of the 2009 survey (during the
recession period).
Return Emigration: State level Estimate
At the state level, about 7.7 per cent of the EMI of 2008 became
REM by 2009. If district-wise ratios are applied to the total EMI in
2008, the number of emigrants who returned to Kerala in 2009 would be
173,339. This is for the period between 2008 KMS and 2009 RMS,
roughly November 2008 to June 2009. This period coincides with the
recession months. Thus, an estimate of recession-related return
emigration among Kerala emigrants is 173,000 (roughly for a period of
8 months).
District-wise data
The districts of origin of emigrants and of the return
emigrants are given in Table 11. The table shows the estimated
number of emigrants who returned to Kerala by district of origin
in Kerala.
About 29,000 emigrants who returned were originally
from Thiruvananthapuram district. The corresponding number
for Malappuram district was 24,000 and 23,000 for Thrissur
district.

35
Table 11: Distribution of 2008 Emigrants by Migration Status in2009
Districts
Percent of Total Number in the state
EMI REM REM Percent
Thiruvananthapuram 90.6 9.4 28897 16.7
Kollam 94.2 5.8 12021 6.9
Pathanamthitta 94.4 5.6 6722 3.9
Alappuzha 92.0 8.0 10590 6.1
Kottayam 94.2 5.8 5146 3.0
Idukki 100.0 0.0 0 0
Ernakulam 94.5 5.5 6684 3.9
Thrissur 91.8 8.2 23348 13.5
Palakkad 89.7 10.3 19502 11.3
Malappuram 92.7 7.3 24441 14.1
Kozhikode 90.5 9.5 18997 11.0
Wayanad 93.3 6.7 933 0.5
Kannur 90.6 9.4 11247 6.5
Kasaragode 92.9 7.1 4810 2.8
Kerala 92.3 7.7 173339 100.0
In a non-recession period, i.e., 1998-2003, 2137 of the 2,824
emigrants in the KMS 1998 remained emigrants and 522 became REMs,
60 became OMIs and 105 became ROMs. Thus, a total of 687 (sum of
REM, OMI, ROM) of the EMI became REM. This is 24.3 per cent of the
emigrants in 1998. When this ratio is applied to return emigration among
a total of 1,361,919 emigrants of 1998, the return migrants would be
330,946 during the 5-year period 1998-2003 or about 66,189 per year.
Another method used to calculate return emigrants per year during
a non-recession period is based on distribution of return emigrants by
year of return in 1998, 2003 and 2008. This method gives the following
estimate of return emigration.

36
Table 12: Average Return Emigrants per Year, 1996-2008
Three year Average (per year) 1996-98 102876*
Three Year Average (per year)2001-03 70005**
Three Year Average (per year)2006-08 139363***
* Based on 1998 Survey
** Based on 2003 Survey
*** Based on 2008 Survey
Thus, the average return emigration for a year varies from 102,876
during 1996-08 to 70,005 per year during 2001-03 and to 139,363 per
year during 2006-08. Taking the estimate for the latest year, for an
8-month period, return emigration during 2006-08 would be 93,000.
We have thus the following results:
Return emigration during:
Recession Period November-June 2009 (8 months) = 173,000
Non-Recession Period average 2006-08
(average for 8 months) = 93,900
Return emigration has indeed accelerated since the beginning of
the global recession. An estimate of the number of emigrants who returned
to Kerala during November 2008 to June 2009 is 173,000.
This answers the second question: how many of the emigrants
have returned to Kerala during the recession period. The answer is
173,000.
But can we conclude from this analysis that 173,000 emigrants
returned to Kerala as a result of global recession? Have they all returned
as a result of the global recession?
Return Emigration Due to the Recession
The present survey can provide an answer to this question to a

37
large extent. This survey included a question on the reasons for the
migrant’s return. The answers are given in Table 13.
Table 13 indicates that emigrants generally return to Kerala due
to a number of reasons. Expiry of contract is one reason for return. This
was a major reason cited by the return emigrants in 1998 and 2008 (the
non-recession years). Similarly, many emigrants return because
conditions back home are such that their presence is required here. This
is so particularly in the case of female return emigrants. Their return has
nothing to do with the recession. Another case is when emigrants return
because they cannot withstand the hostile climatic conditions in some
Gulf countries. This too has nothing to do with the recession. Others
return because they fail to get the salary or wages which they were
promised.
Thus, a large number of the emigrants could have returned home
in 2009 for reasons not related to the global recession.
In 2009, the largest number of emigrants returned to Kerala because
they lost their jobs due to financial crisis. Twenty one per cent of the
REM (or 37,000) returned because of they lost their jobs due to the
recession. Another 3.3 per cent underwent compulsory retirement. If
they are also added, about 24.7 per cent or about 43,000 emigrants
returned due to the recession. About 11.5 per cent returned because
their contracts had expired and were not renewed. This is a common
experience among emigrants in the Gulf region and not very much
related to the recession. Emigrants cited this as the reason for their
return in 2003 and 1998 too. However, for argument’s sake, if such
returnees are also added, the number would increase to 36.2 per cent or
63,000 persons. The number of return emigration attributable to the
global recession would at most be 63,000.
Thus, the number of emigrants who returned home due to
recession-related reasons could be in the range between a minimum of
37,000 and a maximum of 63,000.

38Ta
ble
13:
Rea
sons
for
Ret
urn
of R
etur
n E
mig
rant
s am
ong
Em
igra
nts
of 2
008
in 2
009
Sam
ple
Perc
ent
Rea
sons
for
the
Ret
urn
Mal
eFe
mal
eTo
tal
Mal
eFe
mal
eTo
tal
Cum
ulat
ive
Num
ber
Los
t jo
b du
e to
fin
anci
al c
risi
s65
065
25.4
0.0
21.4
21.
437
022
Exp
iry
of C
ontr
act
305
3511
.710
.411
.532
.956
940
Com
puls
ory
Rep
atri
atio
n10
010
3.9
0.0
3.3
36.2
6263
1
Low
wag
es o
r no
t ge
tting
prom
ised
wag
es49
150
19.1
2.1
16.4
52.7
9108
5
Poor
wor
king
con
ditio
n14
014
5.5
0.0
4.6
57.3
9905
2
Har
sh b
ehav
iour
of
Em
ploy
er3
03
1.2
0.0
1.0
58.2
1007
59
Ill
heal
th22
325
8.6
6.3
8.2
66.5
1149
86
Prob
lem
s at
hom
e24
933
9.4
18.8
10.9
77.3
1337
65
Oth
ers
3930
6915
.262
.522
.710
017
3032
Tota
l25
648
304
100.
010
0.0
100.
010
017
3032

39
From Return Emigrants to Emigrants
Some of the return emigrants identified in KMS 2008 re-migrated
out of the country to become an emigrant once again. They were about
9.55 percent of the total return emigrants or about 110,494. Thus, in the first
half of 2009 (the recession period), 173,000 emigrants returned to Kerala
and 110,000 former return emigrants became emigrants once again. The
net change is the return of 63,000 former emigrants back to Kerala.
Characteristics of the Return Emigrants
Country of Residence of Emigrants
The largest number of return emigrants came from the United
Arab Emirates, 46.4 per cent. But the return emigration rate (= return
emigrants /emigrants * 100) was highest among emigrants in Kuwait at
15.0 per cent followed by the UAE with 9.6 per cent. Saudi Arabia
contributed 23 per cent and Kuwait 11 per cent to the flow of return
emigrants to Kerala. Together with the UAE, these countries account for
about 80 per cent of the return emigrants from among the 2008 emigrants.
Table 14: Percent and Rate by Country of Origin of Return Emigrants, 2009
Countries Return Emigrants Percent Rate/100Emigrants Emigrants
United ArabEmirates 141 1469 46.4 9.6
Saudi Arabia 69 867 22.7 8.0
Kuwait 32 214 10.5 15.0
Oman 21 279 6.9 7.5
Qatar 16 202 5.3 7.9
Bahrain 8 186 2.6 4.3
USA 3 186 1.0 1.6
Maldives 3 7 1.0 42.9
Others 11 543 3.6 2.0
Total 304 3953 100.0 7.7

40
Among the countries listed in the table the lowest rate of return
was for the emigrants in the United States of America.
District of Origin of Return Emigrants
The majority of return emigrants hailed from Malappuram district,
i.e., 14.8 per cent. But return emigration as percentage of total emigrants
Table 15: Return Emigrants: Rate and Percent by Districts, 2009
District Return Emigrants Return Return Emigrants Emigrants/ Emigrants
100 (%)Emigrants
Thiruvananthapuram 40 427 9.4 13.2Kollam 19 328 5.8 6.3Pathanamthitta 20 360 5.6 6.6Alappuzha 16 199 8.0 5.3Kottayam 11 191 5.8 3.6Idukki 0 20 0.0 0.0Ernakulam 10 181 5.5 3.3Thrissur 36 438 8.2 11.8Palakkad 30 292 10.3 9.9Malappuram 45 616 7.3 14.8Kozhikode 31 325 9.5 10.2Wayanad 5 75 6.7 1.6Kannur 22 233 9.4 7.2Kasaragod 19 268 7.1 6.3Total 304 3953 7.7 100.0
41
is highest among emigrants from Palakkad district at 10.3 per cent.
Malappuram, Thiruvananthapuram, Thrissur and Kozhikode each had
more than a tenth of the total return emigrants in the state. Palakkad,
Thiruvananthapuram, Kannur also have a relatively high return
emigration ratio.
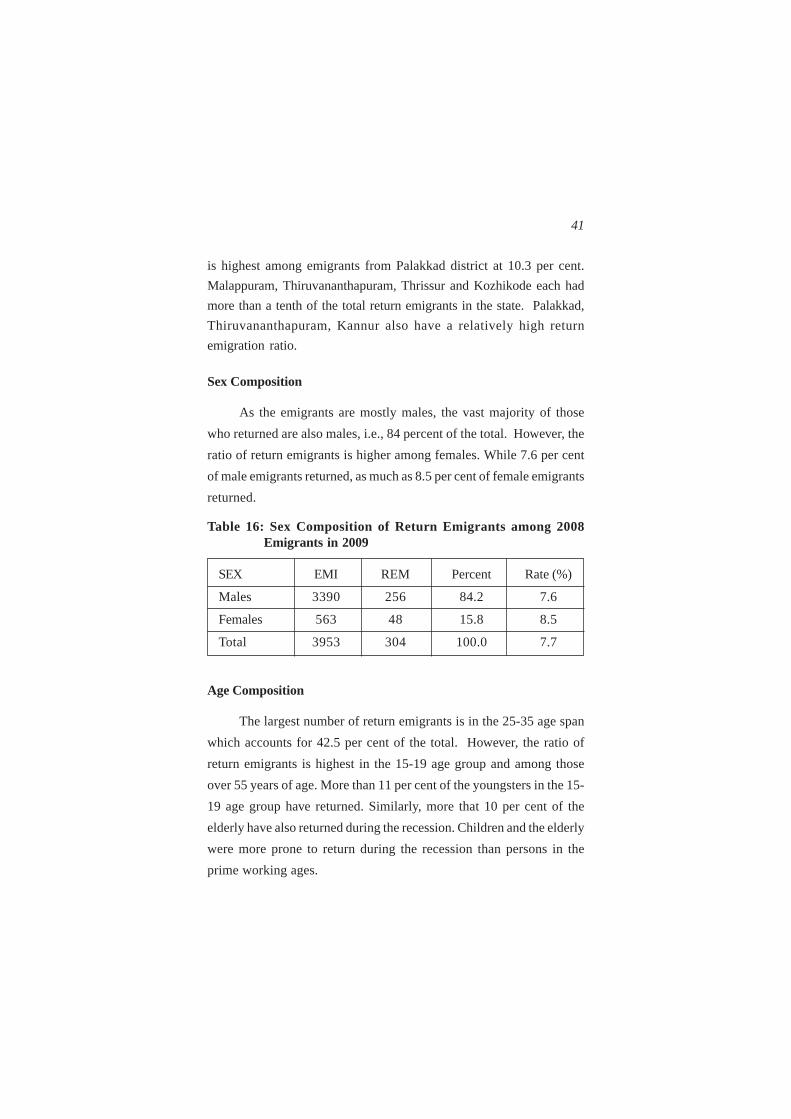
Sex Composition
As the emigrants are mostly males, the vast majority of those
who returned are also males, i.e., 84 percent of the total. However, the
ratio of return emigrants is higher among females. While 7.6 per cent
of male emigrants returned, as much as 8.5 per cent of female emigrants
returned.
Table 16: Sex Composition of Return Emigrants among 2008Emigrants in 2009
SEX EMI REM Percent Rate (%)
Males 3390 256 84.2 7.6
Females 563 48 15.8 8.5
Total 3953 304 100.0 7.7
Age Composition
The largest number of return emigrants is in the 25-35 age span
which accounts for 42.5 per cent of the total. However, the ratio of
return emigrants is highest in the 15-19 age group and among those
over 55 years of age. More than 11 per cent of the youngsters in the 15-
19 age group have returned. Similarly, more that 10 per cent of the
elderly have also returned during the recession. Children and the elderly
were more prone to return during the recession than persons in the
prime working ages.

42
Table 17: Age Distribution among Return Emigrants, 2009
Age group PercentRatio
REM/100EMI
0-4 3.0 8.7
5-9 1.3 4.5
10-14 0.7 2.8
15-19 1.6 11.4
20-24 6.9 7.2
25-29 21.4 8.2
30-34 21.1 8.2
35-39 14.5 6.6
40-44 9.2 6.1
45-49 8.6 8.3
50-54 5.3 8.8
55-59 4.3 11.8
60-64 2.0 16.2
65+ 0.3 6.7
Total 100.0 7.7
43
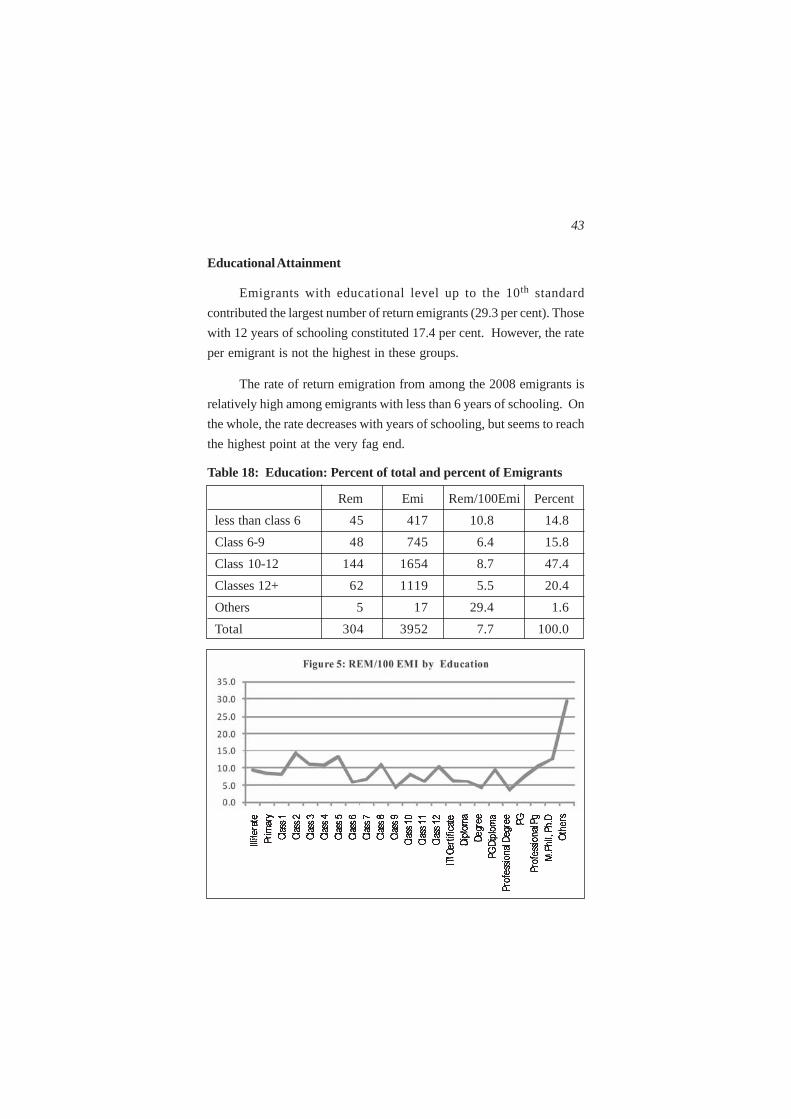
Educational Attainment
Emigrants with educational level up to the 10th standard
contributed the largest number of return emigrants (29.3 per cent). Those
with 12 years of schooling constituted 17.4 per cent. However, the rate
per emigrant is not the highest in these groups.
The rate of return emigration from among the 2008 emigrants is
relatively high among emigrants with less than 6 years of schooling. On
the whole, the rate decreases with years of schooling, but seems to reach
the highest point at the very fag end.
Table 18: Education: Percent of total and percent of Emigrants
Rem Emi Rem/100Emi Percent
less than class 6 45 417 10.8 14.8
Class 6-9 48 745 6.4 15.8
Class 10-12 144 1654 8.7 47.4
Classes 12+ 62 1119 5.5 20.4
Others 5 17 29.4 1.6
Total 304 3952 7.7 100.0
44
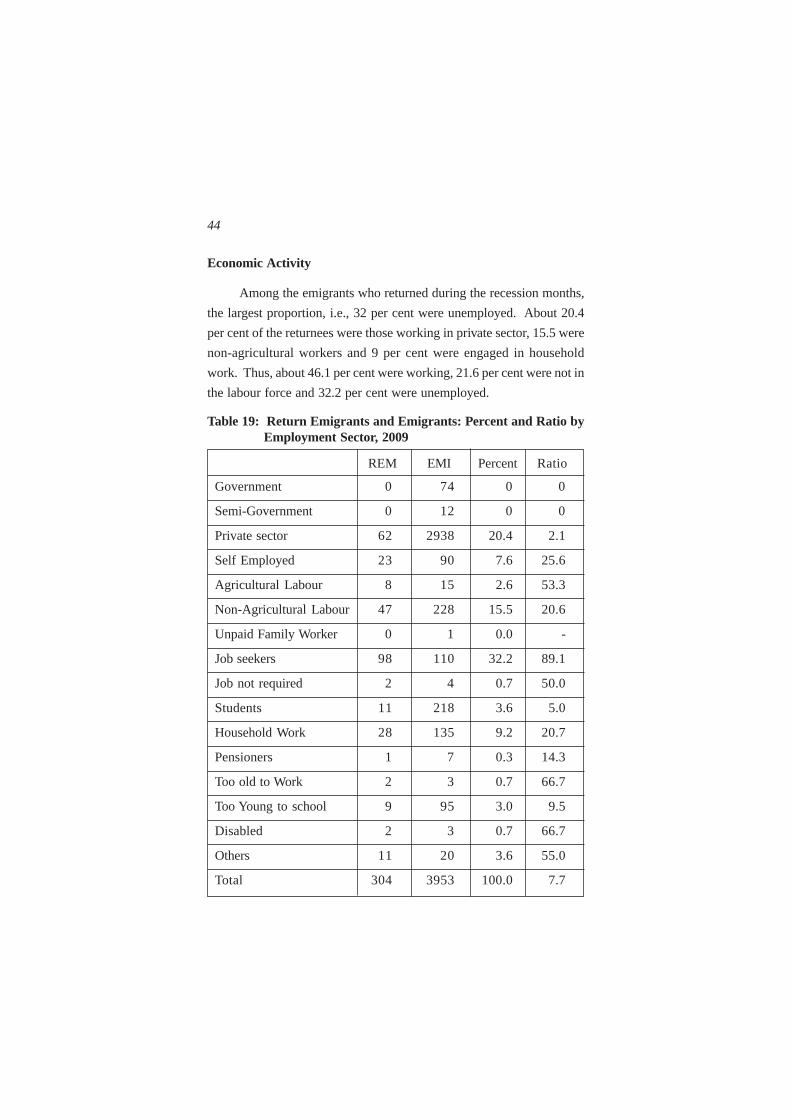
Economic Activity
Among the emigrants who returned during the recession months,
the largest proportion, i.e., 32 per cent were unemployed. About 20.4
per cent of the returnees were those working in private sector, 15.5 were
non-agricultural workers and 9 per cent were engaged in household
work. Thus, about 46.1 per cent were working, 21.6 per cent were not in
the labour force and 32.2 per cent were unemployed.
Table 19: Return Emigrants and Emigrants: Percent and Ratio byEmployment Sector, 2009
REM EMI Percent Ratio
Government 0 74 0 0
Semi-Government 0 12 0 0
Private sector 62 2938 20.4 2.1
Self Employed 23 90 7.6 25.6
Agricultural Labour 8 15 2.6 53.3
Non-Agricultural Labour 47 228 15.5 20.6
Unpaid Family Worker 0 1 0.0 -
Job seekers 98 110 32.2 89.1
Job not required 2 4 0.7 50.0
Students 11 218 3.6 5.0
Household Work 28 135 9.2 20.7
Pensioners 1 7 0.3 14.3
Too old to Work 2 3 0.7 66.7
Too Young to school 9 95 3.0 9.5
Disabled 2 3 0.7 66.7
Others 11 20 3.6 55.0
Total 304 3953 100.0 7.7

45
IV IMPACT OF UNEMPLOYMENT AND RETURN EMIGRATION
The second set of questions raised by NORKA relates to the impact
of recession on emigrants, their families, and the state, and to policies to
minimise their adverse consequences of their return.
What is the social and economic impact of job loss on Kerala
emigrants, their families and the Kerala economy?
What is the social and economic impact of the subsequent return
of Kerala emigrants on their families and the Kerala economy?
What measures can be adopted to minimise the adverse impact of
their return on the socio-economic situation in the state? and
What measures can be adopted to rehabilitate the emigrants who
returned as a direct consequence of the global recession, particularly
those in low-level jobs?
The impact of the global recession on emigrants is not only through
job losses and return emigration, but also through reduction in salaries
or wages.
Return Emigration due to Recession
The number of emigrants who lost their jobs in the destination
country and yet remained there is estimated to be about 37,000. Among
the emigrants, those who returned to Kerala as a result of recession-related
reasons are estimated to be a maximum of 63,000. Of them, only 28,000
were unemployed at the time of the 2009 survey. It is these who actually
need to be rehabilitated more than any other group (Table 20). However,
to these return emigrants, we have to add the number of emigrants who
have undergone salary cuts. This is a largely unknown number. But a
good estimate of their magnitude could be gauged on the basis of their
impact on the remittances that they send back home (see below).

46
Table 20: Number of Return Emigrants in Kerala who would needhelp in Rehabilitation, 2009
Sample Kerala
Total EMI, 2008 * 3953 2193412
REM among the EMI of 2008 (1) 304 168681
From among (2) those who returned
Those Returned Due to Recession
Reasons (1-3) 110 61036
From among (3) those who were:
Employed in 2008 106 58817
Unemployed in 2008 1 555
Not in LF in 2008 3 1665
Total 110 61036
Of the 107 employed EMI (2008)
who returned
employed in 2009 54 29963
Number of unemployed 50 27744
Not in LF 2 1110
Total 106 58817
NUMBER WHO WOULD REQUIRE HELP BECAUSE OF
UNEMPLOYMENT = 27744
Impact of the Recession at the State level
While recession could affect the household of the return emigrant
in many ways – social, psychological and economic – this study is
confined to the economic impact only. We assume that most of the other
consequences come about through economic factors. Much of the
economic impact occurs through the remittances which the households
receive from their members working abroad.
In KMS, a distinction was made between Household Remittances
and Total Remittances. Studies like the KMS or RMS can at best measure

47
household remittances. Fortunately, it is household remittance that
matters most as far as the impact of the recession on households is
concerned.
Before proceeding further a word of clarification is necessary. As
the sample of households included in this study has not been selected at
random, it cannot provide an absolute measure of household remittances
or any other kind of remittances in Kerala in 2009. What this study can
do at best is to measure the relative change (per cent increase or decrease)
in the remittances received by the emigrant households between 2008
and 2009. Such a measure of relative change, however, is fairly adequate
to measure the impact of the global recession on household remittances.
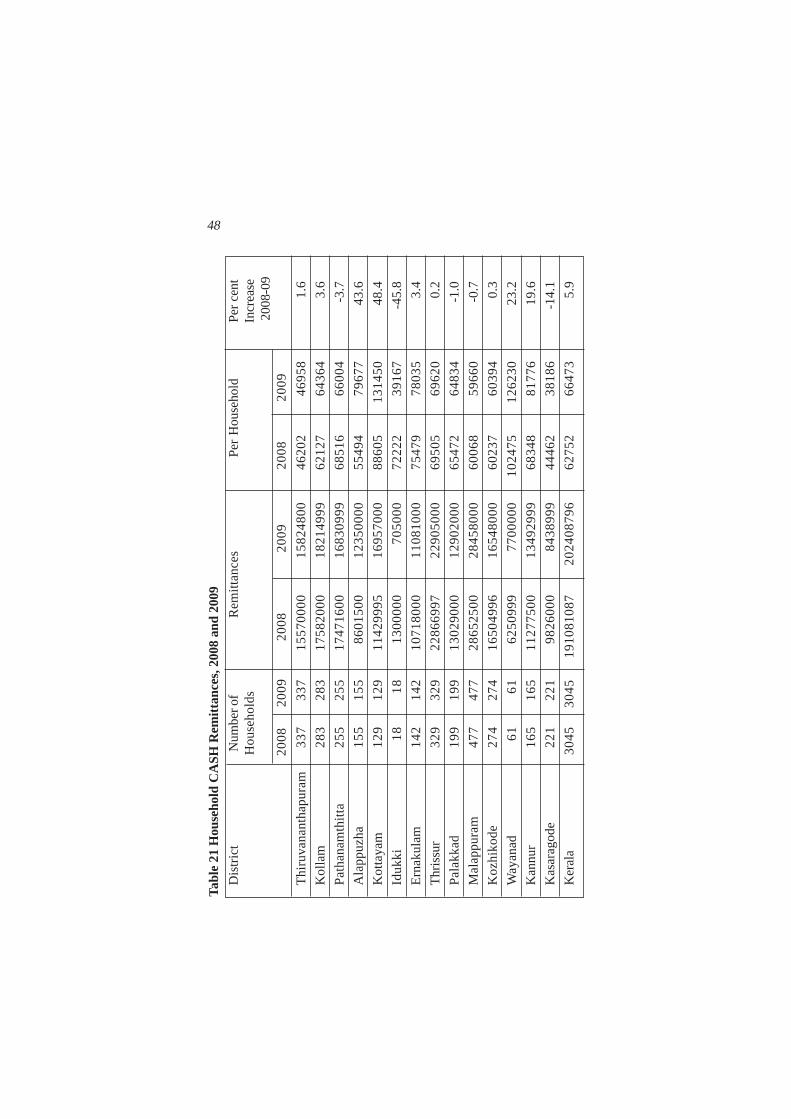
Table 21 shows the total cash remittances and the district-wise
cash remittances per household in 2008 and 2009. The table indicates
that for the state as a whole, the cash remittances increased by 5.9 per
cent between the two 12-month periods, November 2007 to October
2008 (the non-recession period) and October 2008 to September 2009
(the recession period)*
• KMS and RMS included questions about remittances
received by any member of the household during the
12-month period prior to the survey.
This is quite an unexpected result. The recession is supposed to
have decreased remittances, not increased them. The increase could,
however, be partly explained by the fact that the remittances in 2009 are
for a 12-month period which includes some non-recession months also.
Secondly, the recession could, in some cases, actually increase
remittances. Emigrants who chose to return home permanently as a result
of the recession brought all their accumulated wealth with them, with
the result that some households show very large increases in remittances
and others show decreases. That this is indeed the case is shown by the
subsequent analysis.
48Ta
ble
21 H
ouse
hold
CA
SH R
emit
tanc
es, 2
008
and
2009
Dis
tric
tN
umbe
r of
Rem
itta
nces
Per
Hou
seho
ldPe
r ce
ntH
ouse
hold
sIn
crea
se 2
008-
0920
0820
0920
0820
0920
0820
09
Thi
ruva
nant
hapu
ram
337
337
1557
0000
1582
4800
4620
246
958
1.6
Kol
lam
283
283
1758
2000
1821
4999
6212
764
364
3.6
Pat
hana
mth
itta
255
255
1747
1600
1683
0999
6851
666
004
-3.7
Ala
ppuz
ha15
515
586
0150
012
3500
0055
494
7967
743
.6
Kot
taya
m12
912
911
4299
9516
9570
0088
605
1314
5048
.4
Iduk
ki18
1813
0000
070
5000
7222
239
167
-45.
8
Ern
akul
am14
214
210
7180
0011
0810
0075
479
7803
53.
4
Thr
issu
r32
932
922
8669
9722
9050
0069
505
6962
00.
2
Pal
akka
d19
919
913
0290
0012
9020
0065
472
6483
4-1
.0
Mal
appu
ram
477
477
2865
2500
2845
8000
6006
859
660
-0.7
Koz
hiko
de27
427
416
5049
9616
5480
0060
237
6039
40.
3
Way
anad
6161
6250
999
7700
000
1024
7512
6230
23.2
Kan
nur
165
165
1127
7500
1349
2999
6834
881
776
19.6
Kas
arag
ode
221
221
9826
000
8438
999
4446
238
186
-14.
1
Ker
ala
3045
3045
1910
8108
720
2408
796
6275
266
473
5.9
49
That there has been an increase in remittances during the recession
period is supported by the statistics of South Asian countries such as Pakistan,
Malaysia, Sri Lanka, etc. which indicate significant increases in remittances
in 2009. The all-India statistics on remittances also support an increase in
remittances to India*. Therefore, the observed increase in remittances in
Kerala in 2009, although somewhat unexpected, is highly plausible.
Thus, the economic impact of recession at the state level is not a
matter that merits much concern. Remittances to the state during the
recession months seem to have increased by about 6 per cent.
(*Indian Banks have mobilised $2.7 billion during April-
September 09 from non-resident Indians (NRIs) against inflows
worth $1.1 billion in the past one year period (Economic Times,
13 November 2009)
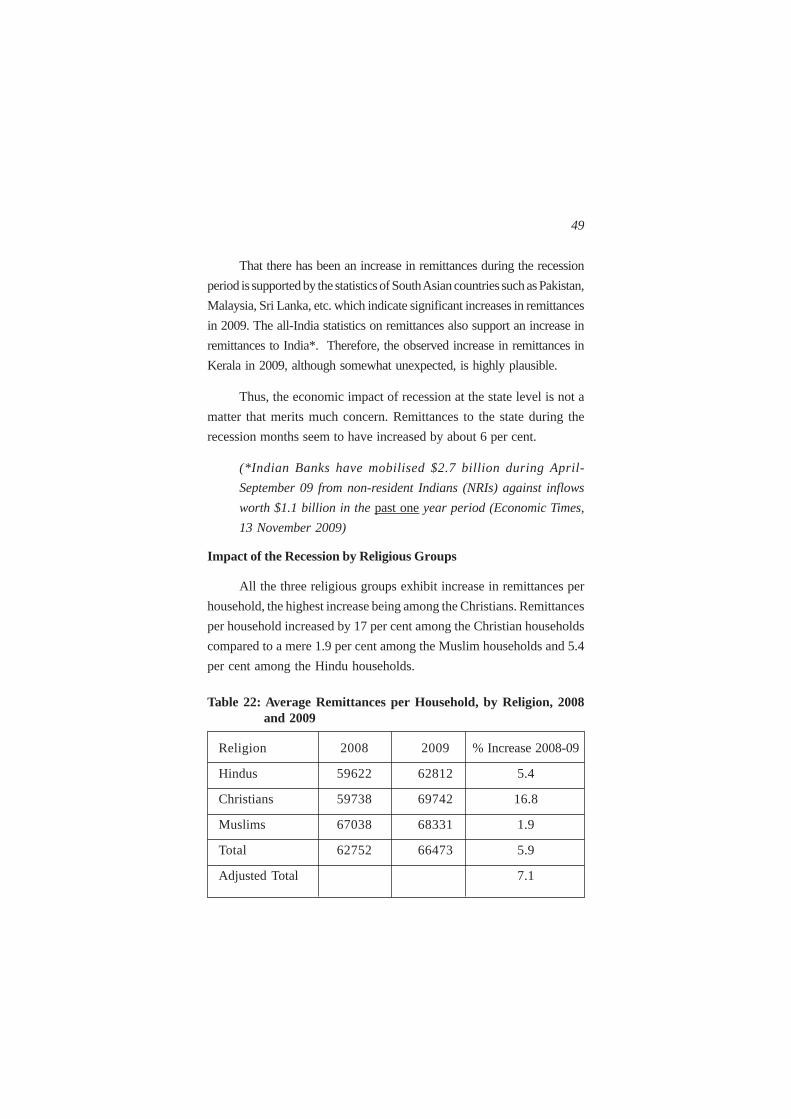
Impact of the Recession by Religious Groups
All the three religious groups exhibit increase in remittances per
household, the highest increase being among the Christians. Remittances
per household increased by 17 per cent among the Christian households
compared to a mere 1.9 per cent among the Muslim households and 5.4
per cent among the Hindu households.
Table 22: Average Remittances per Household, by Religion, 2008and 2009
Religion 2008 2009 % Increase 2008-09
Hindus 59622 62812 5.4
Christians 59738 69742 16.8
Muslims 67038 68331 1.9
Total 62752 66473 5.9
Adjusted Total 7.1

50
Impact of the Recession at the District Level
The state-level trend hides variations by districts and by
households. Although there was an increase in household remittances
for the state as a whole, several districts show decreases. The increase in
remittances between 2008 and 2009 was the highest in Kottayam district
at 48 per cent. The neighbouring Alappuzha district also experienced a
significant increase at 44 per cent. However, Kottayam two other
neighbours, Idukki district in the north and Pathanamthitta district in
the south, experienced significant decreases. In all, five of the 14 districts,
namely, Pathanamthitta, Idukki, Palakkad, Malappuram and Kasseragod,
had varying degrees of diminution.
Table 23: Average Remittances per Household by Districts, 2008 and2009
District 2008 2009 % Increase 2008-09
Thiruvananthapuram 46202 46958 1.6
Kollam 62127 64364 3.6
Pathanamthitta 68516 66004 -3.7
Alappuzha 55494 79677 43.6
Kottayam 88605 131450 48.4
Idukki 72222 39167 -45.8
Ernakulam 75479 78035 3.4
Thrissur 69505 69620 0.2
Palakkad 65472 64834 -1.0
Malappuram 60068 59660 -0.7
Kozhikode 60237 60394 0.3
Wayanad 102475 126230 23.2
Kannur 68348 81776 19.6
Kasaragode 44462 38186 -14.1
Kerala 62752 66473 5.9
Corrected for Inter district variation in sampling fraction 7.1

51
Impact of the Recession at the Household Level
Heterogeneity in the relative change in remittances becomes more
evident when the analysis is done at the household level.
Earlier analysis indicated that not all districts experienced increase
in remittances. Even in districts with positive growth in remittances, not
all households experienced positive expansion in remittances. Some
households received smaller remittances in 2009 compared to 2008.
Some households received larger remittances in 2009 than in 2008. A
detailed analysis by households for the 14 districts is given in Table 24.
About 1.383 million (18.3 per cent) out of a total of 7.566 million
households in Kerala in 2008 had received some amount of remittances
in 2008. Among them, 605,000 households (43.7 per cent) received
larger remittances in 2009 as compared to what they received in 2008.
About 347,000 (25.1 per cent) households received the same amount in
2009 as they did in 2008. The remaining 431,000 households (31.1 per
cent) received smaller amounts as remittances in 2009 vis-à-vis 2008.
These percentages vary considerably by districts. In Alappuzha
district, for example, the remittances for the district as a whole had
increased by 43.7 per cent. However, 28.4 per cent of the households
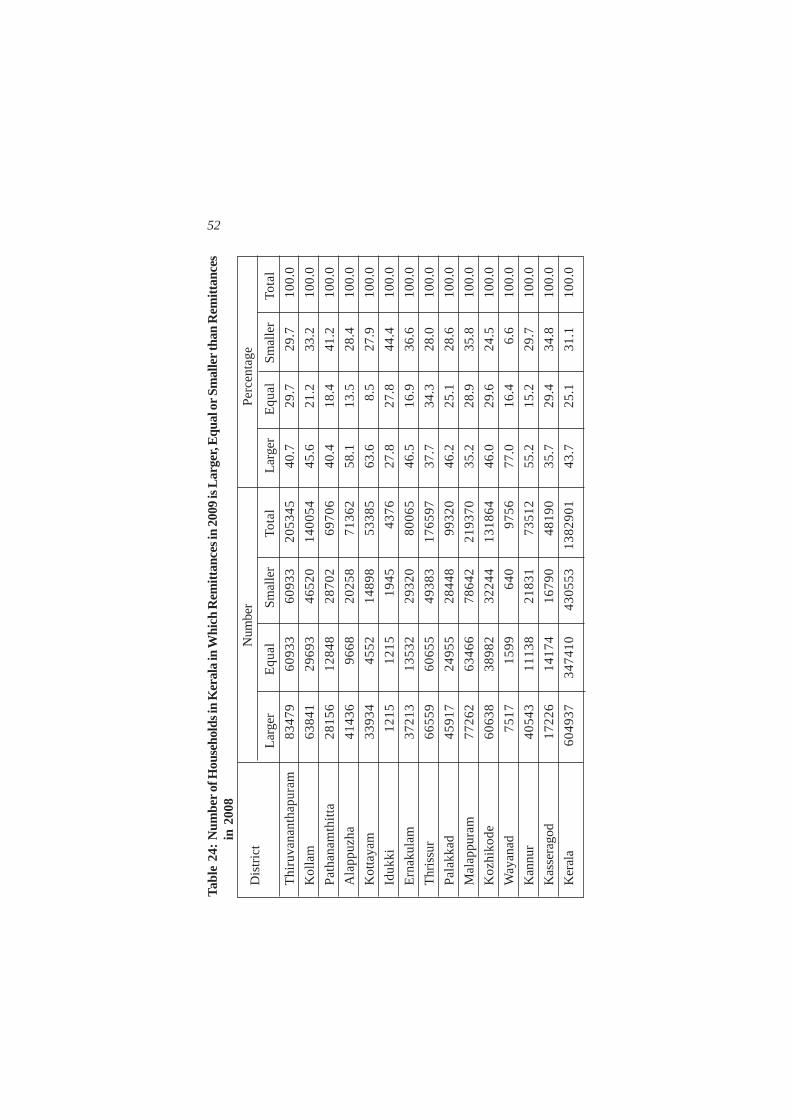
52Ta
ble
24:
Num
ber
of H
ouse
hold
s in
Ker
ala
in W
hich
Rem
ittan
ces i
n 20
09 is
Lar
ger,
Equ
al o
r Sm
alle
r th
an R
emitt
ance
sin
200
8
Dis
tric
tN
umbe
rP
erce
ntag
e
Lar
ger
Equ
alSm
alle
rTo
tal
Lar
ger
Equ
alSm
alle
rTo
tal
Thi
ruva
nant
hapu
ram
8347
960
933
6093
320
5345
40.7
29.7
29.7
100.
0
Kol
lam
6384
129
693
4652
014
0054
45.6
21.2
33.2
100.
0
Pat
hana
mth
itta
2815
612
848
2870
269
706
40.4
18.4
41.2
100.
0
Ala
ppuz
ha41
436
9668
2025
871
362
58.1
13.5
28.4
100.
0
Kot
taya
m33
934
4552
1489
853
385
63.6
8.5
27.9
100.
0
Iduk
ki12
1512
1519
4543
7627
.827
.844
.410
0.0
Ern
akul
am37
213
1353
229
320
8006
546
.516
.936
.610
0.0
Thr
issu
r66
559
6065
549
383
1765
9737
.734
.328
.010
0.0
Pal
akka
d45
917
2495
528
448
9932
046
.225
.128
.610
0.0
Mal
appu
ram
7726
263
466
7864
221
9370
35.2
28.9
35.8
100.
0
Koz
hiko
de60
638
3898
232
244
1318
6446
.029
.624
.510
0.0
Way
anad
7517
1599
640
9756
77.0
16.4
6.6
100.
0
Kan
nur
4054
311
138
2183
173
512
55.2
15.2
29.7
100.
0
Kas
sera
god
1722
614
174
1679
048
190
35.7
29.4
34.8
100.
0
Ker
ala
6049
3734
7410
4305
5313
8290
143
.725
.131
.110
0.0

53
had received smaller amounts as remittances in 2009 compared with
what they received in 2008. Similarly, in Pathanamthitta district, where
the remittances for the district as a whole had decreased by 3.7 per cent,
40.4 per cent of the households had received larger amounts in 2009 as
compared to 2008. The analysis at the household level gives a better
understanding of how the flow of remittances impacted households
during the recession period.
Table 25: Percent of Households with Larger, Equal and SmallerRemittances in 2009 than in 2008 by Districts
Districts Larger Equal Smaller Total
Thiruvananthapuram 10.2 13.3 10.5 11.1
Kollam 9.6 8.0 9.8 9.3
Pathanamthitta 7.7 6.3 11.0 8.4
Alappuzha 6.7 2.8 4.6 5.1
Kottayam 6.1 1.5 3.8 4.2
Idukki 0.4 0.7 0.8 0.6
Ernakulam 4.9 3.2 5.4 4.7
Thrissur 9.3 15.1 9.6 10.8
Palakkad 6.9 6.7 6.0 6.5
Malappuram 12.5 18.4 17.9 15.7
Kozhikode 9.4 10.8 7.0 9.0
Wayanad 3.5 1.3 0.4 2.0
Kannur 6.8 3.3 5.1 5.4
Kasaragode 5.9 8.7 8.1 7.3
Kerala 100 100 100 100
The proportion of households that had received relatively smaller
remittances in 2009 varied from 6.6 per cent in Wayanad district to 44.4
per cent in Idukki district and 41.2 per cent in Pathanamthitta district.
About 18 per cent of the households in Malappuram district, 11
per cent in Pathanamthitta district and 10.5 per cent in

54
Thiruvananthapuram district in Kerala received smaller remittances in
2009. Idukki and Wayanad districts had very few households that
received smaller remittances in 2009.
It was mentioned in Table 24 above that 31.1 per cent of the
households experienced decline in remittances, with the decrease being
minimal in some cases, but quite significant in others. How large was
the decline?
As given in Table 24, the proportion of households that received
smaller remittances in 2009 was 31.1 per cent. Among these households,
68.7 per cent received in 2009 less than 75 per cent of what they received
in 2008, 44.1 per cent received in 2009 less than 50 per cent of their
2008 remittances, and 29.4 per cent received in 2009 less than 25 per
cent of their 2008 remittances.
Households with Remittances in 2008 but no Remittances in 2009
Out of a total of 1.383 million households that received
remittances in 2008 about 89,000 (6.4 per cent) households did not
receive any remittances in 2009. These were the households that were
the most adversely affected by the recession.

55Ta
ble
26:
Num
ber
of H
ouse
hold
s w
here
rem
itta
nces
in 2
009
is 7
5 %
, 50%
and
25%
of t
he R
emit
tanc
es in
200
8, b
yD
istr
ict
Dis
tric
tA
s %
of T
otal
No.
of H
Hs
As
% o
f HH
with
sm
alle
r rem
ittan
ce
0.75
0.5
0.25
0.75
0.5
0.25
Thi
ruva
nant
hapu
ram
21.4
14.2
10.4
72.0
48.0
35.0
Kol
lam
23.0
14.1
9.9
69.1
42.6
29.8
Pat
hana
mth
itta
26.7
12.9
6.3
64.8
31.4
15.2
Ala
ppuz
ha20
.011
.610
.370
.540
.936
.4K
otta
yam
19.4
8.5
3.9
69.4
30.6
13.9
Iduk
ki44
.433
.322
.210
0.0
75.0
50.0
Ern
akul
am30
.322
.512
.082
.761
.532
.7T
hris
sur
18.8
13.4
9.7
67.4
47.8
34.8
Pal
akka
d17
.613
.19.
061
.445
.631
.6M
alap
pura
m21
.813
.88.
460
.838
.623
.4K
ozhi
kode
17.5
12.4
10.9
71.6
50.7
44.8
Way
anad
6.6
4.9
4.9
100.
075
.075
.0K
annu
r22
.412
.77.
375
.542
.924
.5K
asar
agod
e24
.918
.111
.371
.451
.932
.5K
eral
a21
.613
.99.
268
.744
.129
.4

56
Table 27: Number of Households that Received no Remittances in2009
District Sample Rate* Percent Kerala
Thiruvananthapuram 23 6.8 11.7 10446
Kollam 18 6.4 9.2 8175
Pathanamthitta 13 5.1 6.6 5904
Alappuzha 11 7.1 5.6 4996
Kottayam 3 2.3 1.5 1362
Idukki 3 16.7 1.5 1362
Ernakulam 10 7.0 5.1 4542
Thrissur 22 6.7 11.2 9991
Palakkad 13 6.5 6.6 5904
Malappuram 25 5.2 12.8 11354
Kozhikode 26 9.5 13.3 11808
Wayanad 2 3.3 1.0 908
Kannur 10 6.1 5.1 4542
Kasaragode 17 7.7 8.7 7721
Kerala 196 6.4 100.0 89014
* Denominator is the number of HHs
that received remittances in 2008 1382901
Among the districts, Kozhikode had the largest number of such
households, about 12,000 or 13.3 per cent of the total for the state. The
other districts with a large number of such households were Malappuram
(11,000), Thiruvananthapuram (10,000) and Thrissur (10,000).
Remittances as Gifts
Besides cash on a regular basis, Kerala households with emigrants
received gifts from their relatives abroad. These could be treated as part
of the remittances. Table 28 provides a district-wise picture of the cash
value of such gifts in 2008 and 2009.
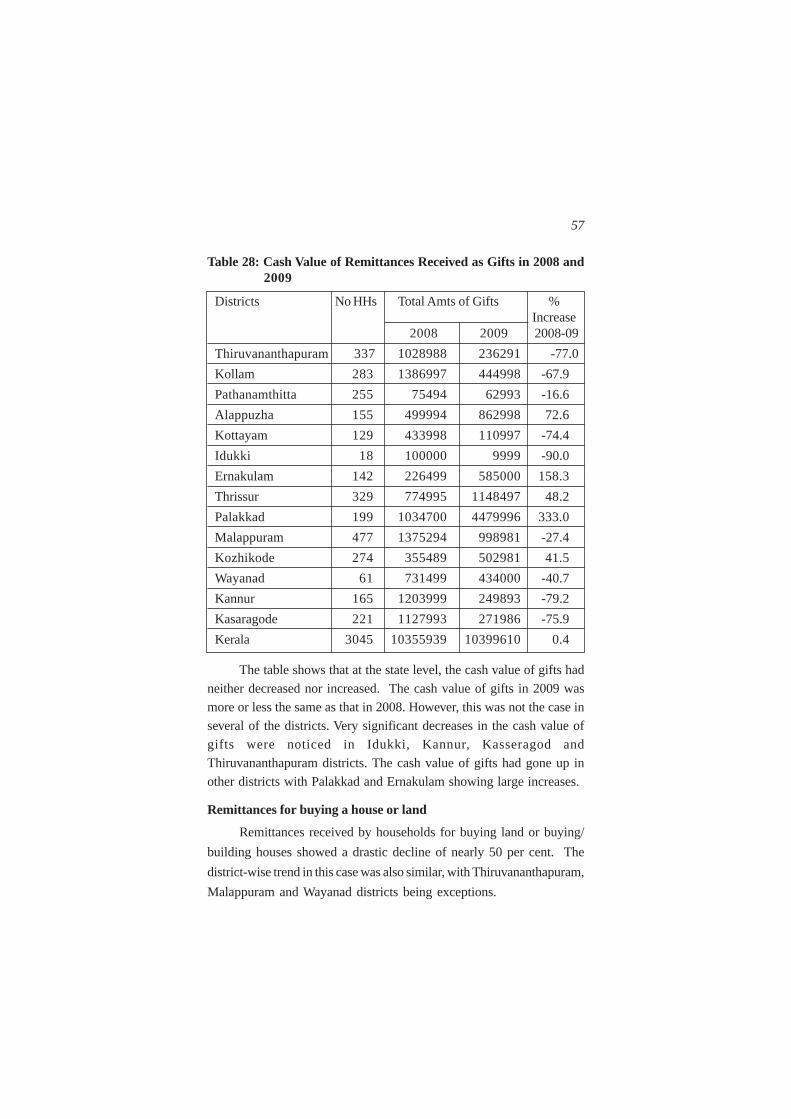
57
Table 28: Cash Value of Remittances Received as Gifts in 2008 and2009
Districts No HHs Total Amts of Gifts %Increase
2008 2009 2008-09
Thiruvananthapuram 337 1028988 236291 -77.0
Kollam 283 1386997 444998 -67.9
Pathanamthitta 255 75494 62993 -16.6
Alappuzha 155 499994 862998 72.6
Kottayam 129 433998 110997 -74.4
Idukki 18 100000 9999 -90.0
Ernakulam 142 226499 585000 158.3
Thrissur 329 774995 1148497 48.2
Palakkad 199 1034700 4479996 333.0
Malappuram 477 1375294 998981 -27.4
Kozhikode 274 355489 502981 41.5
Wayanad 61 731499 434000 -40.7
Kannur 165 1203999 249893 -79.2
Kasaragode 221 1127993 271986 -75.9
Kerala 3045 10355939 10399610 0.4
The table shows that at the state level, the cash value of gifts had
neither decreased nor increased. The cash value of gifts in 2009 was
more or less the same as that in 2008. However, this was not the case in
several of the districts. Very significant decreases in the cash value of
gifts were noticed in Idukki, Kannur, Kasseragod and
Thiruvananthapuram districts. The cash value of gifts had gone up in
other districts with Palakkad and Ernakulam showing large increases.
Remittances for buying a house or land
Remittances received by households for buying land or buying/
building houses showed a drastic decline of nearly 50 per cent. The
district-wise trend in this case was also similar, with Thiruvananthapuram,
Malappuram and Wayanad districts being exceptions.

58
Table 29: Remittances for House/Land Purchase in 2008 and 2009
Districts 2008 2009 % Increase
2008-09
Thiruvananthapuram 876998 1724999 96.7
Kollam 3300000 204999 -93.8
Pathanamthitta 270000 0 -100.0
Alappuzha 561998 225000 -60.0
Kottayam 2150000 40000 -98.1
Idukki - - -
Ernakulam 4287999 750000 -82.5
Thrissur 2500000 200000 -92.0
Palakkad 751998 300000 -60.1
Malappuram 1480996 2589998 74.9
Kozhikode 2510999 1700000 -32.3
Wayanad 2200000 3450000 56.8
Kannur 965999 270000 -72.0
Kasaragode 2115000 930000 -56.0
Kerala 23971987 12384996 -48.3
Remittances for Other Purposes
Besides receiving remittances for the purchase of a house or land,
households also received remittances specifically for other purposes
such as the purchase of a car/scooter, starting new enterprises and
education of family members. These had all declined very much during
the recession period. Exceptions were remittances for investments in
shares, payment of dowry and medical expenses.

59
Table 30: Remittances Received for Specific Purposes in 2008 and2009
Purpose 2008 2009 % increase
2008-09
Cash Remittances 191081087 202408796 5.9
As Gifts 9905939 10399610 5.0
Buying house/land 23971987 12384996 -48.3
Buy Car/Scooter, etc 2185050 1655000 -24.3
Invest in Shares, Bonds 250000 282000 12.8
To Start Enterprises 146000 20000 -86.3
Pay Dowry 1018000 1850000 81.7
For Education 907000 605000 -33.3
Medical Expenses 977000 1620000 65.8
Pay back Debt 2220000 2128000 -4.1
In brief, remittances meant for some basic needs - subsistence,
medical services, dowry payment – had not been affected by the recession.
In fact, remittances for these purposes showed an increase between 2008
and 2009. However, remittances for other purposes such as buying land,
house, vehicles, etc., had decreased.
V. POLICIES TO REHABILIATE RETURN EMIGRANTS
Lastly, we look at policies and programmes to overcome the
recession-related problems. This again is in response to the set of
questions raised by NORKA:
What measures could be adopted to minimise the adverse
impact on the socio-economic situation in the state? What
measures can be adopted to rehabilitate the emigrants
who have returned as a direct consequence of the global
recession, particularly those who were employed abroad
in low-level jobs?
60
This study has brought to light broad dimensions of some of the
problems created by the global recession on Kerala emigrants, such as
the number of emigrants who became unemployed, the number who lost
jobs abroad, the number who were forced to return to Kerala, the countries
in which the returnees had been working, the districts they hailed from,
the sector of economic activity they were engaged in before the recession
and their demographic and socio-economic characteristics. The study
also gives a rough estimate of the number of households that received
smaller amounts as household cash remittances in 2009 compared to
what they received in 2008 and the number of households that received
remittances in 2008, but not in 2009.
Groups that deserve Special Consideration in CombatingThe Adverse Impact of the Recession
• Families in Kerala of the 56,000 emigrants abroad who lost their
jobs
• Families in Kerala of the an unknown number of emigrants abroad
who suffered loss of income due to salary cuts and increase in the
cost of living
• 173,000 emigrants who returned home during the recession
• 61,000 emigrants who returned in 2009 as a direct result of the
recession
• 28,000 return emigrants who are still unemployed
• 431,000 Kerala households that received smaller amounts as
remittances in 2009 compared with what they received in 2008
• 90,000 Kerala households that received remittances in 2008, but
no remittances in 2009.
This is useful background material for arriving at policies and
programmes to minimise the adverse impact of recession on the
households of the emigrants or return emigrants in the state. However,

61
they are just background information only and are not included as
policies or programmes. This study recommends that such policies and
programmes be put together in consultation with NORKA officials (who
have a wider grasp of the migration situation in the state), taking into
consideration the results of this study.
While putting together these policies and programmes, this study
suggests that the following aspects also be taken into consideration.
First, the number of Kerala emigrants who returned due to the
recession is not as large as is often reported to be. The number is
unlikely to be more than 63,000. Among these returnees, only
about 28,000 are unemployed at the time of the survey.
Second, even as emigrants returned to Kerala, new emigrants and
former emigrants (who had returned earlier) are going back to the
Gulf and other destination countries, thus regaining their emigrant
status. The recession has not been much of a deterrent and has
not stood in their way for re-emigration.
Third, household remittances at the state level have increased
(and have not decreased) during the recession months, although
there are several households whose remittances have decreased.
About 6 per cent of the households that received remittances in
2008 did not receive any remittances in 2009.
Fourth, NORKA has recently announced a number of new
measures to help emigrants and return emigrants. These include
(i) training programme for the prospective emigrants, and (ii)
financial assistance to returnees by way of loans from KSFC.
These measures would go some way in easing the problems of
emigrants and return emigrants. The Government could undertake
more such measures including one to provide future emigrants
with multiple skills that would enable them to move from one
employment sector to another according to the need of the day.

62
Fifth, the present study indicates that the efforts to utilise the
expertise which the return emigrants have gained abroad for the
state’s development are more likely to succeed now than at any
time in the past. A concerted effort to utilise the return emigrant’s
acquired skills abroad for skill up-gradation and industrial
development in the state is worth undertaking in the present
context. This would be the best rehabilitation package for return
emigrants that the Government can offer at present.
Sixth, the global recession has affected not only emigrants but
also non-migrants, persons who have never stepped out of the
state. The global recession has affected most of the export
dependent industries in Kerala: coir, fishing and cashew, to name
a few. Not only were the owners of the enterprises affected by the
recession, but also the workers, some of whom have lost their
jobs. Although these workers themselves do not bring in any
foreign exchange directly, the industries which utilise their labour
contribute significantly to the foreign exchange earnings of the
country. Should not the package that is being developed to help
the return emigrants equally benefit non-migrant workers and
others affected by the global recession?
Lastly, the study recommends that the Government should give
as much or more importance to “problem-preventing measures” aimed
at future emigrants as to “problem-solving measures” aimed at returning
emigrants.

63
K.C. Zachariah is Honorary Fellow at the Centrefor Development Studies, Thiruvananthapuram andformer Senior Demographer, The World Bank,Washington D.C.
Email: [email protected]
S. Irudaya Rajan is Professor at Centre forDevelopment Studies, Thiruvananthapuram.Currently he is Chair Professor of the ResearchUnit on International Migration set up by theMinistry of Overseas Indian Affairs. His main areasof research interests are Aging, Migration andKerala Studies.
Email: [email protected]

64
References
Irudaya Rajan, S 2004. ‘From Kerala to the Gulf: Impacts of Labour
Migration,’ Asia Pacific Migration Journal, Volume 13, No.4,
Pp. 497-509.
Irudaya Rajan, S 2006. ‘Remittances,’In Lal, Brij V., ed., The
Encyclopedia of The Indian Diaspora. Editions Didier Millet.
Singapore/Paris, pp. 75-77.
Irudaya Rajan, S and Nair, Gopinathan P. R. 2006. ‘Saudi Arabia, Oman
and the Gulf States’. In Lal, Brij V., ed. The Encyclopedia of the
Indian Diaspora. Editions Didier Millet. Singapore/Paris, pp.
222-233.
Irudaya Rajan and U S Mishra. 2007. ‘Managing Migration in the
Philippines: Lessons for India,’ Centre for Development Studies
(Thiruvananthapuram) Working Paper No.393. www.cds.edu,
Irudaya Rajan, S and Prabha, Remya G. 2008. ‘India’. Asia Pacific
Migration Journal. 17 (3/4), pp.277-86.
Irudaya Rajan, S and Prakash B. A. 2009. ‘Migration and Development
Linkages Re-Examined in the Context of the Global Economic
Crisis.’ Invited paper for the Civil Society Days of the 3rd Global
Forum on Migration and Development, 2-3 November, Athens.
Irudaya Rajan, S, Varghese, V.J and Jayakumar, M.S. 2010. Dreaming
Mobility and Buying Vulnerability: Overseas Recruitment
Practices and its Discontents in India (forthcoming). Routledge
India, New Delhi.
Irudaya Rajan, S and D Narayana. 2010. ‘The Financial Crisis in The
Gulf and Its Impact on South Asian Migrant Workers.’ Report
Submitted to the Asian Development Bank and the Ministry of
Overseas Indian Affairs, Government of India.
Irudaya Rajan, S (ed). 2010. Governance and Labour Migration: India
Migration Report 2010. Routledge India, New Delhi.

65
Zachariah, K.C, ET Mathew and S Irudaya Rajan.1999. ‘Impact of
Migration on Kerala’s Economy and Society,’ Centre for
Development Studies, Working Paper No.297. www.cds.edu, also
published in International Migration. Volume 39, No.1, 63-88.
Zachariah, K.C, ET Mathew and S Irudaya Rajan.2000. ‘Socio-economic
and Demographic Consequences of Migration in Kerala,’ Centre
for Development Studies, Working Paper No.303. www.cds.edu, also
published in International Migration. Volume 39, No.2, 43-72.
Zachariah, K.C and S Irudaya Rajan. 2001a. ‘Gender Dimensions of
Migration in Kerala: Macro and Micro Evidences,’ Asia Pacific
Population Journal, Vol. 16, No.3, Pp. 47-70.
Zachariah, K.C and S Irudaya Rajan. 2001b. ‘Migration Mosaic in Kerala:
Trends and Determinants.’ Demography India, Volume 30, No.1,
Pp. 137-165.
Zachariah, KC, PR Gopinathan Nair and S Irudaya Rajan. 2001. ‘Return
Emigrants in Kerala: Rehabilitation Problems and Development
Potential,’ Centre for Development Studies, Working Paper
No.319. www.cds.edu
Zachariah, KC, BA Prakash and S Irudaya Rajan. 2002. ‘Gulf Migration
Study: Employment Wages and Working Conditions of Kerala
Emigrants in United Arab Emirates,’ Centre for Development
Studies, Working Paper No.326. www.cds.edu
Zachariah, K.C, K.P. Kannan and S. Irudaya Rajan (eds.). 2002. Kerala’s
Gulf Connection: CDS Studies on International Labour Migration
from Kerala State in India. Thiruvananthapuram: Centre for
Development Studies.
Zachariah, K.C, ET Mathew and S. Irudaya Rajan.2003. Dynamics
of Migration In Kerala. Dimensions, Determinants and
Consequences. Hyderabad: Orient Longman Private
Limited.

66
Zachariah, K.C, B. A Prakash and S. Irudaya Rajan. 2003. ‘The Impact of
Immigration Policy on Indian Contract Migrants: The Case of
the United Arab Emirates,’ International Migration, Volume 41.
No.4, Pp. 161-172.
Zachariah, K C, B A Prakash and S Irudaya Rajan. 2004. ‘Indian Workers
in UAE: Employment, Wages and Working Conditions,’ Economic
and Political Weekly, Volume XXXIX, No. 22, May 29 2004,
Pp.2227-2234.
Zachariah, K.C. and S. Irudaya Rajan. 2004a ‘Gulf Revisited: Economic
Consequences of Emigration from Kerala. Emigration and
Employment,’ Centre for Development Studies, Working Paper
No.363. www.cds.edu
Zachariah, K C and S Irudaya Rajan. 2004b ‘Gulf Emigration of Women
in Kerala,’ Samyukta, a Journal of Women’s Studies, Volume IV,
No.2, Pp. 41-52.
Zachariah, KC and S Irudaya Rajan. 2005. ‘Unemployment in Kerala at
the Turn of the Century: Insights from CDS Gulf Migration
Studies,’ Centre for Development Studies, Working Paper No.374.
www.cds.edu
Zachariah, K.C, P.R. Gopinathan Nair and S. Irudaya Rajan. 2006. Return
Emigrants in Kerala: Welfare, Rehabilitation and Development.
Manohar Publishers and Distributors, New Delhi.
Zachariah, K C, B. A Praksah and S. Irudaya Rajan. 2007. ‘Aspects of
Indian Labour Diaspora in the United Arab Emirates,’ Chapter 9,
Pp. 205-236 in Prakash C Jain (ed). Indian Diaspora in West Asia:
A Reader. Manohar Publishers and Distributors, New Delhi.
Zachariah, K.C and S. Irudaya Rajan. 2007a. ‘Economic and Social
Dynamics of Migration in Kerala, 1999-2004: Analysis of Panel
Data,’ Centre for Development Studies, Working Paper No.384.
www.cds.edu

67
Zachariah K.C. and S. Irudaya Rajan. 2007b ‘Migration, remittances
and Employment: Short-term Trends and Long-term
Implications,’ Centre for Development Studies, Working Paper
No. 395,. www.cds.edu
Zachariah K.C. and S. Irudaya Rajan. 2008 ‘Costs of Basic Services in
Kerala: Education, Health, Childbirth and Finance (Loans),’
Centre for Development Studies, Working Paper No. 406,
Thiruvananthapuram. www.cds.edu
Zachariah, K C and S Irudaya Rajan.2009a. Migration and Development:
The Kerala Experience. Daanish Publishers, New Delhi.
Zachariah, K.C and S Irudaya Rajan. 2009b. ‘Migration as a New
Demographic Transition in Kerala’s Development,’ Chapter 12,
Page 221-238 in Gopal K Kadekodi and Brinda Viswanathan.,
eds., Agricultural Development, Rural Institutions and Economic
Policy. Oxford University Press, New Delhi.
Zachariah, K.C and S. Irudaya Rajan. 2009c A Decade of Kreala’s Gulf
Connection: Migration Monitoring Study 2008. Centre for
Development Studies. www.cds.edu
Zachariah, K.C and S. Irudaya Rajan. 2010. Role of Diaspora in Kerala’s
Development. Daanish Publishers, New Delhi (forthcoming).
Zachariah, K.C and S Irudaya Rajan. 2010. ‘Migration Monitoring
Study, 2008: Emigration and Remittances in the Context of Surge
in Oil Prices,’ Centre for Development Studies, Working Paper
No. 424, www.cds.edu

68

69

70

71

72

73

74

75

76
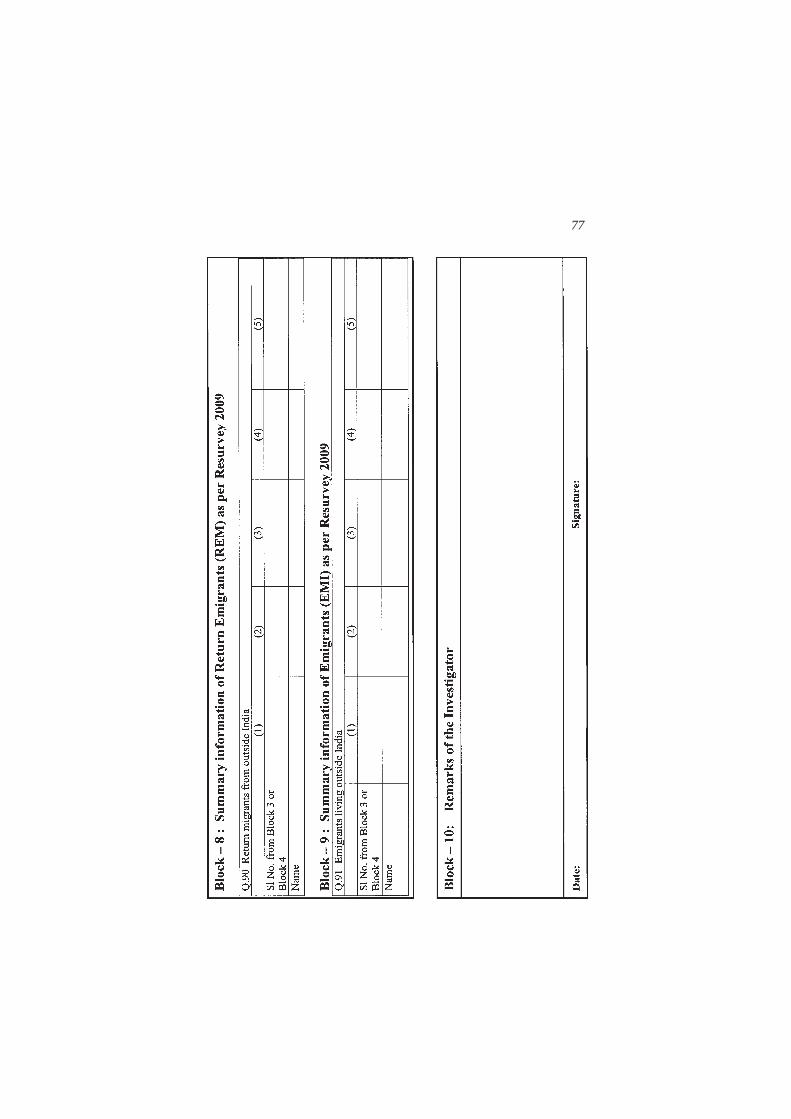
77
78
PUBLICATIONS
For information on all publications, please visit the CDS Website:www.cds.edu. The Working Paper Series was initiated in 1971. WorkingPapers from 279 can be downloaded from the site.
The Working Papers published after April 2007 are listed below:
W.P. 431 GARGI SANATI, Integration of India’s Financial Marketson the Domestic and International Fronts: An EmpiricalAnalysis of the Post-Liberalisation Period, June 2010.
W.P. 430 SUNIL MANI, Has China and India Become moreInnovative Since the onset of Reforms in theTwo Countries?May 2010.
W.P. 429 T. R. DILIP, School Educational Attainment in Kerala:
Trends And Differentials. April 2010.
W.P. 428 SUNIL MANI, The Flight from Defence to Civilian Space:Evolution of the Sectoral System of Innovation of India’s
Aerospace Industry. April 2010.
W.P. 427 J. DEVIKA, V. J. VARGHESE, To Survive or to Flourish?Minority Rights and Syrian Christian Community Assertions
in 20th Century Travancore/Kerala. April 2010.
W.P. 426 ANUP KUMAR BHANDARI, Global Crisis, Environmental
Volatility and Expansion of the Indian Leather Industry.
March 2010.
W.P. 425 P L. BEENA, HRUSHIKESH MALLICK, Exchange Rateand Export Behaviour of Indian Textiles & Clothing Sector:
An Enquiry for Major Destination Countries. March 2010.
W.P. 424 K. C. ZACHARIAH, S. IRUDAYA RAJAN, MigrationMonitoring Study, 2008 Emigration and Remittancesin the Context of Surge in Oil Prices. March 2010.
W.P. 423 VIJAYAMOHANAN PILLAI N, Loss of Load Probabilityof a Power System: Kerala. February 2010.

79
W.P. 422 JAYASEKHAR S, C. NALIN KUMAR, Compliance,Competitiveness and Market Access: A Study on IndianSeafood Industry. February 2010.
W.P. 421 S. IRUDAYA RAJAN, V.J. VARGHESE, M.S. JAYAKUMAROverseas Recruitment in India: Structures, Practices andRemedies. December 2009.
W.P. 420 V.J. VARGHESE, Land, Labour and Migrations:Understanding Kerala’s Economic Modernity, December2009.
W.P. 419 R.MOHAN, D. SHYJAN Tax Devolution and GrantDistribution to States in India Analysis and Roadmap forAlternatives, December 2009.
W.P. 418 WILLIAM JOE & U. S. MISHRA Household Out-of-PocketHealthcare Expenditure in India Levels, Patterns and PolicyConcerns, October 2009.
W.P. 417 NEETHI P Globalisation Lived Locally: New Forms ofControl, Conflict and Response Among Labour in Kerala,Examined Through a Labour Geography Lens. October 2009.
W.P. 416 SUNIL MANI High skilled migration from India, An analysisof its economic implications, September 2009.
W.P. 415 SUNIL MANI Has India Become more Innovative Since1991? Analysis of the Evidence and Some DisquietingFeatures, September 2009.
W.P. 414 WILLIAM JOE, PRIYAJIT SAMAIYAR, U. S. MISHRAMigration and Urban Poverty in India Some PreliminaryObservations, September 2009.
W.P. 413 K. N. NAIR, T.P. SREEDHARAN, M. ANOOPKUMAR, AStudy of National Rural Employment Guarantee Programmein Three Grama Panchayats of Kasaragod District,August 2009
W.P. 412 B.S. SURAN, D. NARAYANA, The Deluge of Debt: Under-standing the Financial Needs of Poor Households. July 2009
W.P. 411 K. NAVANEETHAM , M. KABIR , C.S. KRISHNAKUMAR
Morbidity Patterns in Kerala: Levels and Determinants.April 2009.

80
W.P. 410 ARINDAM BANERJEE, Peasant Classes, Farm Incomesand Rural Indebtedness: An Analysis of HouseholdProduction Data from two States. March 2009.
W.P. 409 SUNIL MANI, The Growth of Knowledge-intensiveEntrepreneurship in India, 1991-2007 Analysis of itsEvidence and the Facilitating Factors. February, 2009
W.P. 408 M. S. HARILAL, Home to Market: Responses, Resurgenceand Transformation of Ayurveda from 1830s to 1920.November 2008
W.P. 407 HRUSHIKESH MALLICK, Do Remittances Impact theEconomy ? Some Empirical Evidences from a DevelopingEconomy. October 2008.
W.P. 406 K.C.ZACHARIAH, S.IRUDAYA RAJAN, Costs of BasicServices in Kerala, 2007, Education, Health, Childbirth andFinance (Loans) September 2008.
W.P. 405 SUNIL MANI Financing of industrial innovations in IndiaHow effective are tax incentives for R&D? August 2008.
W.P. 404 VINOJ ABRAHAM Employment Growth in Rural India:Distress Driven? August 2008.
W.P. 403 HRUSHIKESH MALLICK, Government Spending, TradeOpenness and Economic Growth in India: A Time SeriesAnalysis. July 2008.
W.P. 402 K. PUSHPANGADAN, G. MURUGAN, Dynamics of RuralWater Supply in Coastal Kerala: A Sustainable DevelopmentView, June 2008
W.P. 401 K. K. SUBRAHMANIAN, SYAM PRASAD, Rising InequalityWith High Growth Isn't this Trend Worrisome? Analysis ofKerala Experience, June 2008
W.P. 400 T.R. DILIP, Role Of Private Hospitals in Kerala: AnExploration, June 2008
W.P. 399 V. DHANYA, Liberalisation of Tropical Commodity Marketand Adding-up Problem: A Bound Test Approach,March 2008

81
W.P. 398 P. MOHANAN PILLAI, N. SHANTA, ICT and EmploymentPromotion Among Poor Women: How can we Make itHappen? Some Reflections on Kerala's Experience.February 2008.
W.P. 397 K.N.NAIR, VINEETHA MENON, Distress Debt and Suicidesamong Agrarian Households: Findings from three VillageStudies in Kerala. December 2007
W.P. 396 K.N.NAIR, C.P. VINOD, VINEETHA MENON,Agrarian Distress and Livelihood Strategies: A Studyin Pulpalli Panchayat, Wayanad District , KeralaDecember 2007
W.P. 395 K.C. ZACHARIAH, S.IRUDAYA RAJAN, Migration,Remittances And Employment Short-term Trends and Long-term Implications. December 2007
W.P. 394 K.N.NAIR, ANTONYTO PAUL, VINEETHA MENON,Livelihood Risks and Coping strategies: A Case Study in theAgrarian Village of Cherumad, Kerala. November 2007
W.P. 393 S. IRUDAYA RAJAN, U.S.MISHRA, Managing Migrationin the Philippines: Lessons for India. November 2007.
W.P. 392 K.N. NAIR, R. RAMAKUMAR Agrarian Distress and RuralLivelihoods, a Study in Upputhara Panchayat Idukki District,Kerala. November 2007.
W.P. 391 PULAPRE BALAKRISHNAN, Visible hand: Public policyand economic growth in the Nehru era. November 2007.
W.P. 390 SUNIL MANI, The Growth Performance of India’sTelecommunications Services Industry, 1991-2006 Can itLead to the Emergence of a Domestic Manufacturing Hub?September 2007.
W.P. 389 K. J. JOSEPH, VINOJ ABRAHAM, Information Technologyand Productivity: Evidence from India's ManufacturingSector. September 2007.
W.P. 388 HRUSHIKESH MALLICK, Does Energy Consumption FuelEconomic Growth In India? September 2007.

82
W.P. 387 D. SHYJAN,Public Investment and Agricultural Productivity:A State-wise Analysis of Foodgrains in India. July 2007.
W.P. 386 J. DEVIKA, 'A People United in Development':Developmentalism in Modern Malayalee Identity.June 2007.
W.P. 385 M. PARAMESWARAN, International Trade, R&D Spilloversand Productivity: Evidence from Indian ManufacturingIndustry. June 2007.
W.P. 384 K. C. ZACHARIAH, S. IRUDAYA RAJAN Economic andSocial Dynamics of Migration in Kerala, 1999-2004 Analysisof Panel Data. May 2007.
W.P. 383 SAIKAT SINHA ROY Demand and Supply Factors in theDetermination or India's Disaggregated Manufactured Exports :A Simultaneous Error-Correction Approach. May 2007.

83

This work is licensed under a Creative Commons Attribution – NonCommercial - NoDerivs 3.0 Licence. To view a copy of the licence please see: http://creativecommons.org/licenses/by-nc-nd/3.0/