Embed Size (px)
Citation preview
Impact of the Global Crisis on Banking Sector Soundness in Asian Low-Income Countries
Jack Joo K. Ree
WP/11/115
© 2011 International Monetary Fund WP/11/115
IMF Working Paper
Asia and Pacific Department
Impact of the Global Crisis on Banking Sector Soundness in Asian Low-Income Countries
Prepared by Jack Joo K. Ree1
Authorized for distribution by Masato Miyazaki
May 2011
Abstract
The paper takes stock of the impact of the global financial crisis that began in late 2007 on banking sectors of Asian low-income countries, by exploring bank-level data provided by Bankscope. The paper examines three key channels of possible crisis spillovers: exposures to (i) valuation changes of mark-to-market financial assets, (ii) a drop in crossborder funding, and (iii) rises in NPLs prompted by international real economic linkages. The paper finds that despite relatively low financial integration, the impact of the crisis on LIC banks, particularly the largest ones, were not insignificant. Impacts were most palpable through a loan-to-crossborder funding nexus.
JEL Classification Numbers: G01, G21, E51
Keywords: Asia, low-income countries, lending growth regression, NPL, MTM gains/losses
Author’s E-Mail Address: [email protected]
1 I would like to thank Jonathan Dunn, Shogo Ishii, Byung Kyoon Jang, Mahmood Pradhan, Masahiko Takeda, Olaf Unteroberdoerster, participants at the IMF’s Asia Pacific Department Seminar, and the Financial Surveillance Group Seminar for helpful comments and suggestions, as well as Masato Miyazaki for his invaluable guidance. All remaining errors are mine.
This Working Paper should not be reported as representing the views of the IMF. The views expressed in this Working Paper are those of the author(s) and do not necessarily represent those of the IMF or IMF policy. Working Papers describe research in progress by the author(s) and are published to elicit comments and to further debate.
2
Contents Page Abstract ......................................................................................................................................1 I. Introduction ............................................................................................................................3 II. Data—Stylized Facts .............................................................................................................3 III. How Significant was the Impact of the Crisis through Exposure to Market Risks? ............5 IV. Were Funding and Lending Activities Affected? ................................................................8
A. Descriptive Analysis .................................................................................................8 B. An Empirical Examination ......................................................................................14
V. Was LIC Banks’ Asset Quality Affected? ..........................................................................20 A. Descriptive Analysis ...............................................................................................20 B. An Empirical Examination ......................................................................................25
VI. Findings and Policy Implication ........................................................................................30 Tables 1. Balance Sheets for Banks of Different Sizes .........................................................................4 2. Results from Panel GMM Estimation of Loan and Liquid Asset Regression .....................18 3. Results from Panel GMM Estimation of NPL Regression ..................................................26
Figures 1. Asian LICs and EMEs: MTM Gains/Losses .........................................................................5 2. Asian LICs and EMEs: Funding Behavior ............................................................................9 3. Cross-Border Interbank Capital and Wholesale Funding ....................................................11 4. Asian LICs and EMEs: Deposit and Lending ......................................................................12 5. Asian LICs and EMEs: Adjustment of Liquidity Positions .................................................14 6. Asian LICs and EMEs: NPL Development .........................................................................21 7. Asian LICs and EMEs: Adjustment of NPL Ratios .............................................................23 8. Asian LICs and EMEs: Adjustment of NPL Ratio (Subgroup Analysis) ............................24 9. Asian LICs and EMEs: Driver of Changes of NPLs ...........................................................29
References ................................................................................................................................33
3
I. INTRODUCTION
1. The paper takes stock of the impact of the global financial crisis that began in late 2007 on banking sectors of Asian low-income countries (LICs), by exploring commercially compiled bank-level data provided by Bankscope. Given vast differences in macroeconomic and institutional contexts across the LICs universe, this particular study confines it scope to a set of relatively homogenous LICs in Asia.
2. There are several studies that examined the impact of the crisis on banks in emerging market economics (EMEs). Cetorelli and Goldberg (2009) explored effects of a sudden stop in global banks’ crossborder lending on EME banks’ domestic loan supplies. A separate strand of research studied propagation of dollar liquidity stress through international interbank markets, which recently caused severe dislocation of FX Swap markets in some EMEs (McCauley and Zukunft (2008), Baba and Shim (2010), Yang and Lee (2009), Yu (2010)).
3. However, the impact of the crisis on LIC banks has been largely overlooked, with surprisingly little analyses contributed to the question. In part, this is attributed to data limitation, but it also reflects a widely-held notion that LICs’ relatively low globalization, without a need to test, must have led to better financial insulation. Clearly, more rigorous works are needed in this area, not only to better inform LICs’ policy makers and development partners, but also to get fuller understanding of the crisis.
4. The paper examines three key channels of possible crisis spillovers: exposures to (i) valuation changes associated with mark-to-market financial assets, (ii) a drop in crossborder funding, and (iii) rises in NPLs prompted by international real economic linkages. For channel (ii) and (iii), dynamic panel GMM regression models proposed by Arlerano and Bond (1991) are estimated. An extensive array of descriptive analyses is also conducted across the board. The paper finds that despite relatively low financial integration, the impacts of the crisis on Asian LIC banks, particularly the largest ones, were not insignificant. The impacts were most palpable through a loan-to-crossborder funding nexus.
II. DATA—STYLIZED FACTS
5. The data comprise a cross-section of 523 banks from 6 LICs (Bangladesh, Cambodia, Lao P.D.R., Mongolia, Sri Lanka, and Vietnam) and 4 EMEs (Indonesia, Malaysia, Philippines, and Thailand), spread over a time domain of 2002–09 in an annual frequency (Table 1). Sample banks were first chosen from an unfiltered universe of the Bankscope database based only on country affiliation. The search result was then cleaned up by ruling out duplicates, central banks, and nonbanks such as brokerage firms. Banks with no available observations on total assets throughout the sample period were also removed.
6. Reflecting data imbalance, the size of the cross-section in a year is uneven and substantially less than 523. Regression analyses discussed later in the paper further narrow
4
down these data by imposing some additional filters and also ruling out samples that miss any observations for any of the model variables.
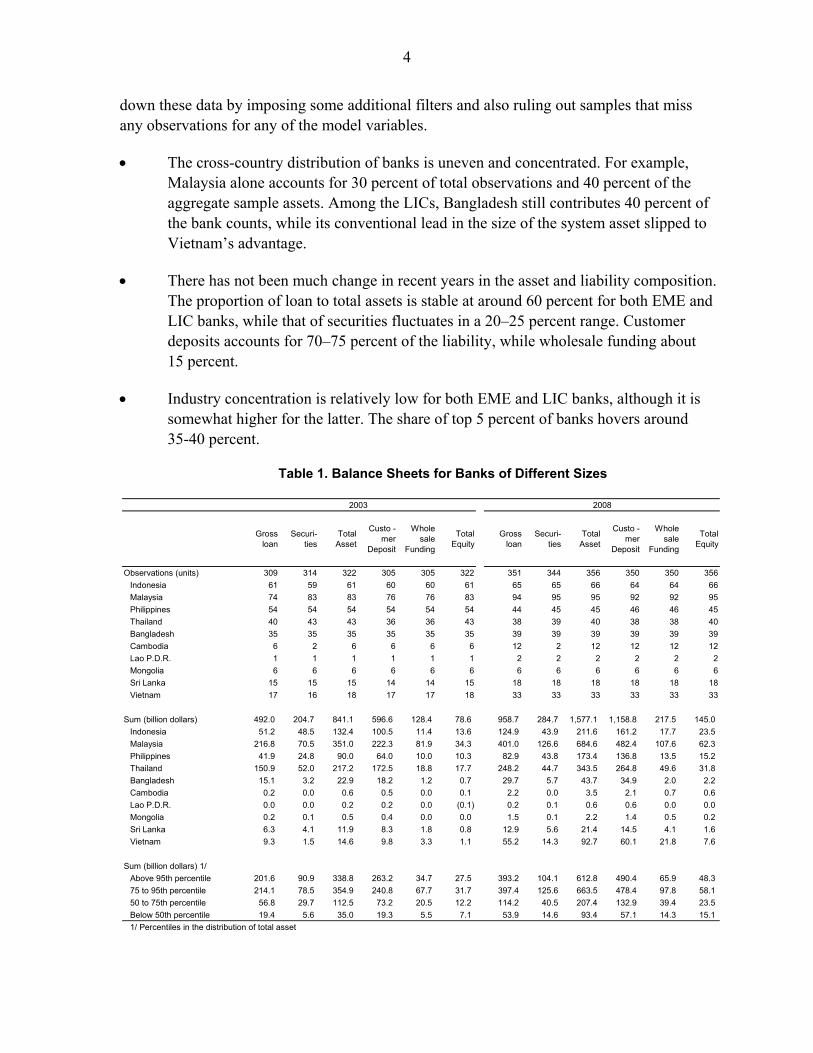
The cross-country distribution of banks is uneven and concentrated. For example, Malaysia alone accounts for 30 percent of total observations and 40 percent of the aggregate sample assets. Among the LICs, Bangladesh still contributes 40 percent of the bank counts, while its conventional lead in the size of the system asset slipped to Vietnam’s advantage.
There has not been much change in recent years in the asset and liability composition. The proportion of loan to total assets is stable at around 60 percent for both EME and LIC banks, while that of securities fluctuates in a 20–25 percent range. Customer deposits accounts for 70–75 percent of the liability, while wholesale funding about 15 percent.
Industry concentration is relatively low for both EME and LIC banks, although it is somewhat higher for the latter. The share of top 5 percent of banks hovers around 35-40 percent.
Table 1. Balance Sheets for Banks of Different Sizes
Gross loan
Securi-ties
Total Asset
Custo -mer
Deposit
Whole sale
Funding
Total Equity
Gross loan
Securi-ties
Total Asset
Custo -mer
Deposit
Whole sale
Funding
Total Equity
Observations (units) 309 314 322 305 305 322 351 344 356 350 350 356
Indonesia 61 59 61 60 60 61 65 65 66 64 64 66
Malaysia 74 83 83 76 76 83 94 95 95 92 92 95
Philippines 54 54 54 54 54 54 44 45 45 46 46 45
Thailand 40 43 43 36 36 43 38 39 40 38 38 40
Bangladesh 35 35 35 35 35 35 39 39 39 39 39 39
Cambodia 6 2 6 6 6 6 12 2 12 12 12 12
Lao P.D.R. 1 1 1 1 1 1 2 2 2 2 2 2
Mongolia 6 6 6 6 6 6 6 6 6 6 6 6
Sri Lanka 15 15 15 14 14 15 18 18 18 18 18 18
Vietnam 17 16 18 17 17 18 33 33 33 33 33 33
Sum (billion dollars) 492.0 204.7 841.1 596.6 128.4 78.6 958.7 284.7 1,577.1 1,158.8 217.5 145.0
Indonesia 51.2 48.5 132.4 100.5 11.4 13.6 124.9 43.9 211.6 161.2 17.7 23.5
Malaysia 216.8 70.5 351.0 222.3 81.9 34.3 401.0 126.6 684.6 482.4 107.6 62.3
Philippines 41.9 24.8 90.0 64.0 10.0 10.3 82.9 43.8 173.4 136.8 13.5 15.2
Thailand 150.9 52.0 217.2 172.5 18.8 17.7 248.2 44.7 343.5 264.8 49.6 31.8
Bangladesh 15.1 3.2 22.9 18.2 1.2 0.7 29.7 5.7 43.7 34.9 2.0 2.2
Cambodia 0.2 0.0 0.6 0.5 0.0 0.1 2.2 0.0 3.5 2.1 0.7 0.6
Lao P.D.R. 0.0 0.0 0.2 0.2 0.0 (0.1) 0.2 0.1 0.6 0.6 0.0 0.0
Mongolia 0.2 0.1 0.5 0.4 0.0 0.0 1.5 0.1 2.2 1.4 0.5 0.2
Sri Lanka 6.3 4.1 11.9 8.3 1.8 0.8 12.9 5.6 21.4 14.5 4.1 1.6
Vietnam 9.3 1.5 14.6 9.8 3.3 1.1 55.2 14.3 92.7 60.1 21.8 7.6
Sum (billion dollars) 1/
Above 95th percentile 201.6 90.9 338.8 263.2 34.7 27.5 393.2 104.1 612.8 490.4 65.9 48.3
75 to 95th percentile 214.1 78.5 354.9 240.8 67.7 31.7 397.4 125.6 663.5 478.4 97.8 58.1
50 to 75th percentile 56.8 29.7 112.5 73.2 20.5 12.2 114.2 40.5 207.4 132.9 39.4 23.5
Below 50th percentile 19.4 5.6 35.0 19.3 5.5 7.1 53.9 14.6 93.4 57.1 14.3 15.1
1/ Percentiles in the distribution of total asset
2003 2008
5
Figure 1. Asian LICs and EMEs: MTM Gains/Losses
III. HOW SIGNIFICANT WAS THE IMPACT OF THE CRISIS THROUGH EXPOSURE TO
MARKET RISKS?
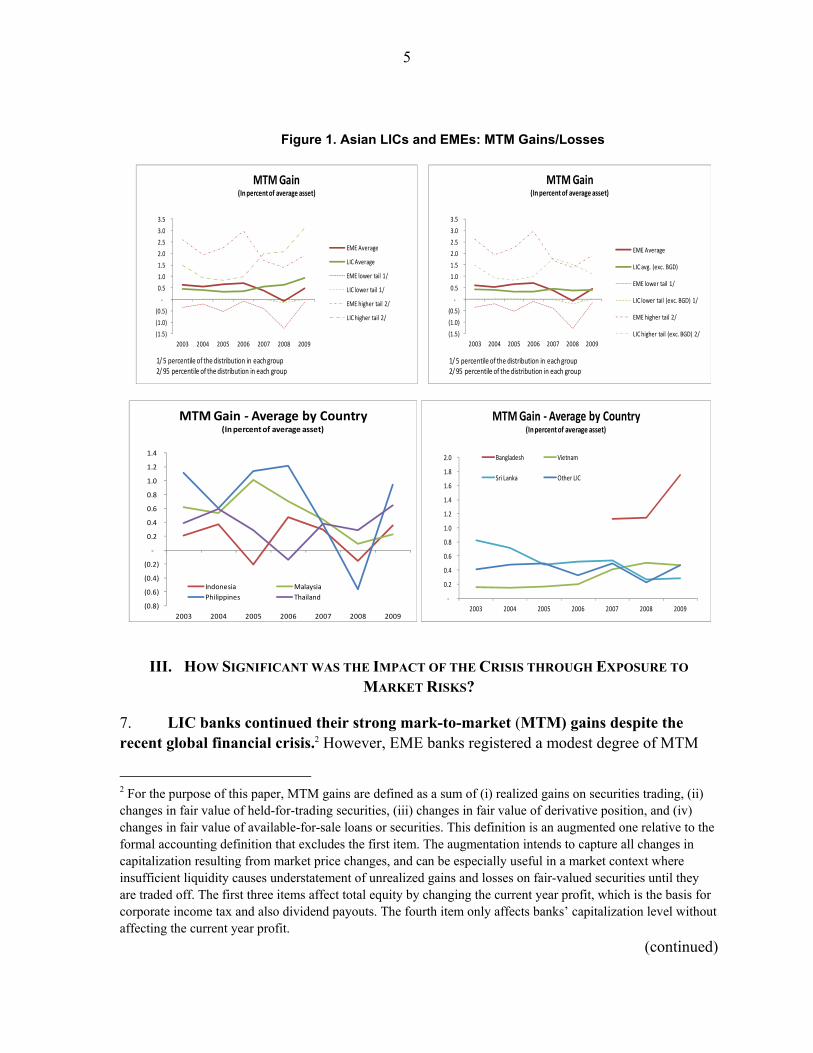
7. LIC banks continued their strong mark-to-market (MTM) gains despite the recent global financial crisis.2 However, EME banks registered a modest degree of MTM
2 For the purpose of this paper, MTM gains are defined as a sum of (i) realized gains on securities trading, (ii) changes in fair value of held-for-trading securities, (iii) changes in fair value of derivative position, and (iv) changes in fair value of available-for-sale loans or securities. This definition is an augmented one relative to the formal accounting definition that excludes the first item. The augmentation intends to capture all changes in capitalization resulting from market price changes, and can be especially useful in a market context where insufficient liquidity causes understatement of unrealized gains and losses on fair-valued securities until they are traded off. The first three items affect total equity by changing the current year profit, which is the basis for corporate income tax and also dividend payouts. The fourth item only affects banks’ capitalization level without affecting the current year profit.
(continued)
(1.5)
(1.0)
(0.5)
-
0.5
1.0
1.5
2.0
2.5
3.0
3.5
2003 2004 2005 2006 2007 2008 2009
MTM Gain(In percent of average asset)
EME Average
LIC Average
EME lower tail 1/
LIC lower tail 1/
EME higher tail 2/
LIC higher tail 2/
1/ 5 percentile of the distribution in each group 2/ 95 percentile of the distribution in each group
(1.5)
(1.0)
(0.5)
-
0.5
1.0
1.5
2.0
2.5
3.0
3.5
2003 2004 2005 2006 2007 2008 2009
MTM Gain(In percent of average asset)
EME Average
LIC avg. (exc. BGD)
EME lower tail 1/
LIC lower tail (exc. BGD) 1/
EME higher tail 2/
LIC higher tail (exc. BGD) 2/
1/ 5 percentile of the distribution in each group 2/ 95 percentile of the distribution in each group
(0.8)
(0.6)
(0.4)
(0.2)
-
0.2
0.4
0.6
0.8
1.0
1.2
1.4
2003 2004 2005 2006 2007 2008 2009
MTM Gain - Average by Country(In percent of average asset)
Indonesia Malaysia
Philippines Thailand -
0.2
0.4
0.6
0.8
1.0
1.2
1.4
1.6
1.8
2.0
2003 2004 2005 2006 2007 2008 2009
MTM Gain - Average by Country(In percent of average asset)
Bangladesh Vietnam
Sri Lanka Other LIC
6
losses on their trading and available-for-sale securities holding, in the wake of the crisis. While direct exposures to U.S. subprime mortgage-related credit products and distressed global banks were insignificant, an abrupt spread widening on virtually all global credit products, working through their heightened correlation with EME sovereign external bonds, along with a tailspin of EME stock prices, caused a considerable slip in the EME banks MTM gains in 2008. On the contrary, LIC banks’ MTM gains picked up to around 0.8 percent of the average asset size after the crisis from an average of 0.4 percent recorded during five years prior to the crisis. Excluding Bangladesh banks, which came into the data set only from 2007 with significantly higher ratios, the Asian LIC banks’ average MTM gain-to-average asset ratio remained unchanged at 0.4 percent post crisis.
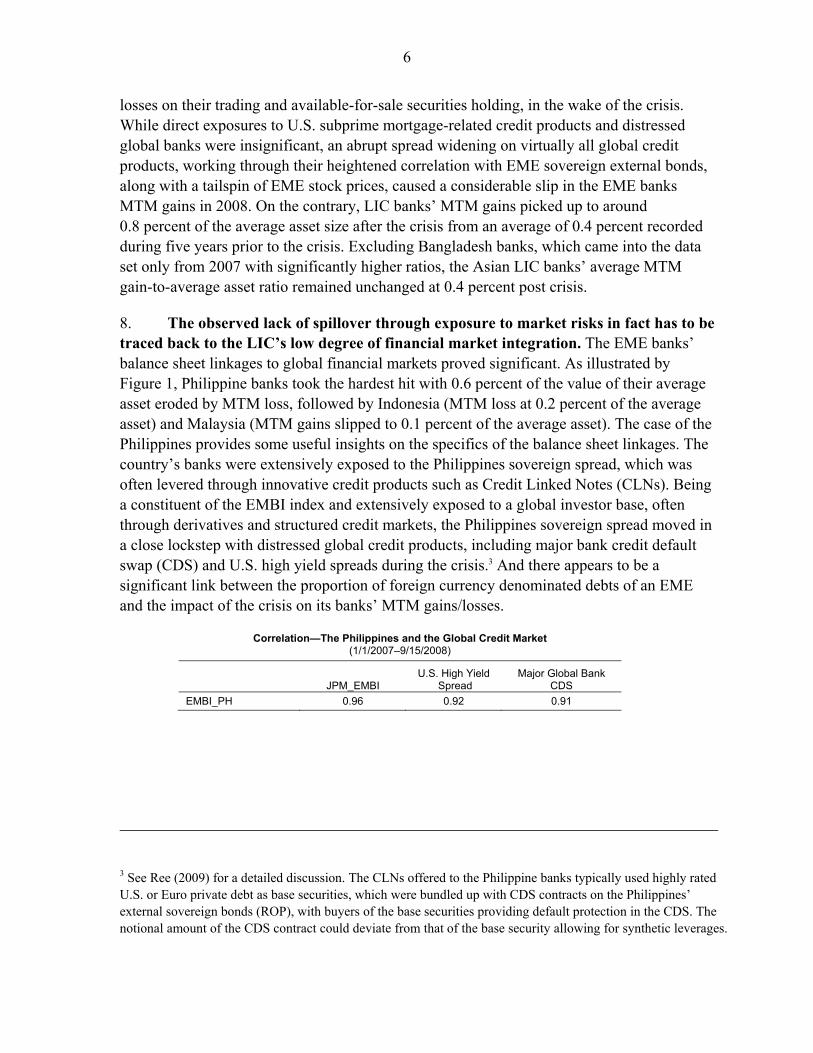
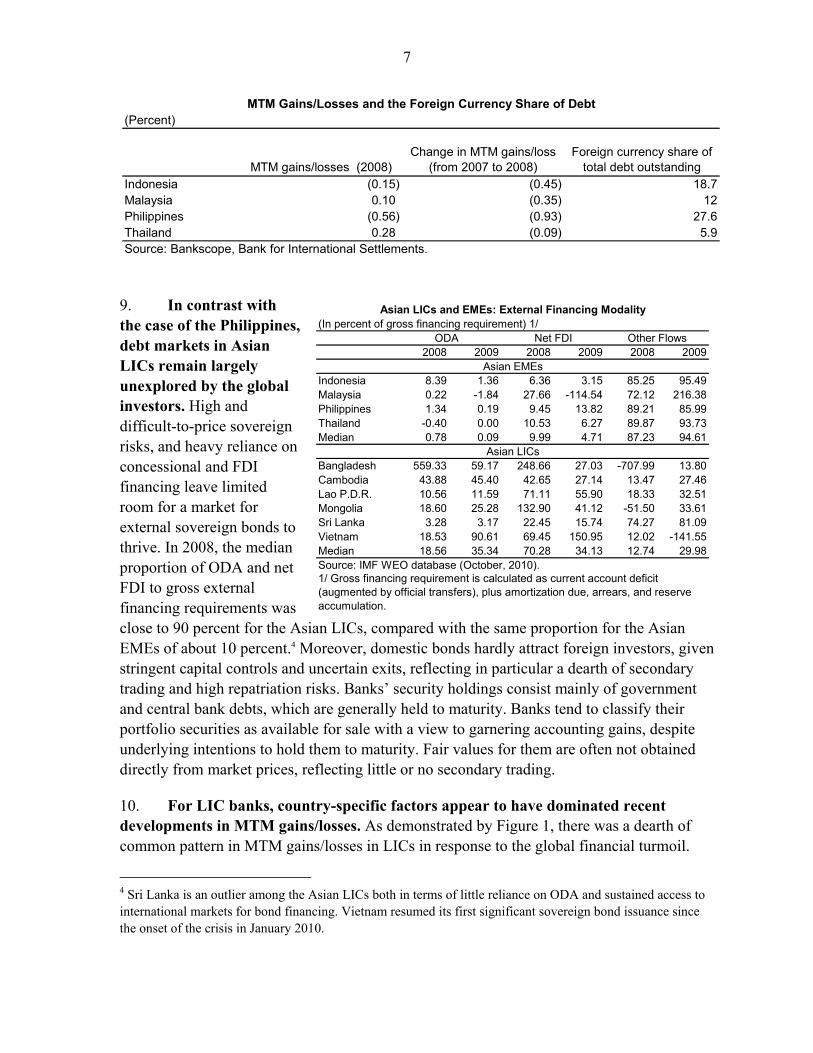
8. The observed lack of spillover through exposure to market risks in fact has to be traced back to the LIC’s low degree of financial market integration. The EME banks’ balance sheet linkages to global financial markets proved significant. As illustrated by Figure 1, Philippine banks took the hardest hit with 0.6 percent of the value of their average asset eroded by MTM loss, followed by Indonesia (MTM loss at 0.2 percent of the average asset) and Malaysia (MTM gains slipped to 0.1 percent of the average asset). The case of the Philippines provides some useful insights on the specifics of the balance sheet linkages. The country’s banks were extensively exposed to the Philippines sovereign spread, which was often levered through innovative credit products such as Credit Linked Notes (CLNs). Being a constituent of the EMBI index and extensively exposed to a global investor base, often through derivatives and structured credit markets, the Philippines sovereign spread moved in a close lockstep with distressed global credit products, including major bank credit default swap (CDS) and U.S. high yield spreads during the crisis.3 And there appears to be a significant link between the proportion of foreign currency denominated debts of an EME and the impact of the crisis on its banks’ MTM gains/losses.
Correlation—The Philippines and the Global Credit Market (1/1/2007–9/15/2008)
JPM_EMBI U.S. High Yield
Spread Major Global Bank
CDS
EMBI_PH 0.96 0.92 0.91
3 See Ree (2009) for a detailed discussion. The CLNs offered to the Philippine banks typically used highly rated U.S. or Euro private debt as base securities, which were bundled up with CDS contracts on the Philippines’ external sovereign bonds (ROP), with buyers of the base securities providing default protection in the CDS. The notional amount of the CDS contract could deviate from that of the base security allowing for synthetic leverages.
7
9. In contrast with the case of the Philippines, debt markets in Asian LICs remain largely unexplored by the global investors. High and difficult-to-price sovereign risks, and heavy reliance on concessional and FDI financing leave limited room for a market for external sovereign bonds to thrive. In 2008, the median proportion of ODA and net FDI to gross external financing requirements was close to 90 percent for the Asian LICs, compared with the same proportion for the Asian EMEs of about 10 percent.4 Moreover, domestic bonds hardly attract foreign investors, given stringent capital controls and uncertain exits, reflecting in particular a dearth of secondary trading and high repatriation risks. Banks’ security holdings consist mainly of government and central bank debts, which are generally held to maturity. Banks tend to classify their portfolio securities as available for sale with a view to garnering accounting gains, despite underlying intentions to hold them to maturity. Fair values for them are often not obtained directly from market prices, reflecting little or no secondary trading.
10. For LIC banks, country-specific factors appear to have dominated recent developments in MTM gains/losses. As demonstrated by Figure 1, there was a dearth of common pattern in MTM gains/losses in LICs in response to the global financial turmoil.
4 Sri Lanka is an outlier among the Asian LICs both in terms of little reliance on ODA and sustained access to international markets for bond financing. Vietnam resumed its first significant sovereign bond issuance since the onset of the crisis in January 2010.
(Percent)
MTM gains/losses (2008)Change in MTM gains/loss
(from 2007 to 2008)Foreign currency share of
total debt outstandingIndonesia (0.15) (0.45) 18.7Malaysia 0.10 (0.35) 12Philippines (0.56) (0.93) 27.6Thailand 0.28 (0.09) 5.9Source: Bankscope, Bank for International Settlements.
MTM Gains/Losses and the Foreign Currency Share of Debt
2008 2009 2008 2009 2008 2009
Indonesia 8.39 1.36 6.36 3.15 85.25 95.49Malaysia 0.22 -1.84 27.66 -114.54 72.12 216.38Philippines 1.34 0.19 9.45 13.82 89.21 85.99Thailand -0.40 0.00 10.53 6.27 89.87 93.73Median 0.78 0.09 9.99 4.71 87.23 94.61
Bangladesh 559.33 59.17 248.66 27.03 -707.99 13.80Cambodia 43.88 45.40 42.65 27.14 13.47 27.46Lao P.D.R. 10.56 11.59 71.11 55.90 18.33 32.51Mongolia 18.60 25.28 132.90 41.12 -51.50 33.61Sri Lanka 3.28 3.17 22.45 15.74 74.27 81.09Vietnam 18.53 90.61 69.45 150.95 12.02 -141.55Median 18.56 35.34 70.28 34.13 12.74 29.98Source: IMF WEO database (October, 2010).
Asian LICs
1/ Gross financing requirement is calculated as current account deficit (augmented by official transfers), plus amortization due, arrears, and reserve accumulation.
Asian LICs and EMEs: External Financing Modality (In percent of gross financing requirement) 1/
ODA Net FDI Other Flows
Asian EMEs
8
The pickup in average MTM gains in three consecutive years through 2009 was led by Bangladesh, as well as Vietnam.
In Bangladesh, a sharp drop in benchmark government bond yields on the back of disinflation appears to have buoyed MTM gains in 2009, while a strong rise of stock prices gave an additional boost.
In Vietnam, rising MTM gains in 2007 was attributed to disproportionately large shifts in asset composition of two large private banks, against a backdrop of rapid asset expansion.5 A further slight rise in 2008 also appears to reflect a similar cause.
In Sri Lanka, MTM gains fell significantly in 2008, likely reflecting losses from external sovereign bond holding.
For other Asian LICs, country-by-country analysis is not very useful given a small and highly unbalanced panel of samples falling into this category. As a group, however, other LICs show an appreciable slippage in MTM gains in 2008, which recovered in 2009.
11. However, uneven accounting quality is an important caveat which places limits on cross-country comparison of the MTM gains/losses. Fair valuation is a relatively more obscure area in accounting where reliability of financial reporting depends on quality of corporate governance. Different degree of market liquidity underpinning the valuation is an additional compounding factor. Overall, there is a greater risk in LICs that MTM gains may lead to overstatement of capital.
IV. WERE FUNDING AND LENDING ACTIVITIES AFFECTED?
A. Descriptive Analysis
12. Was the Asian LIC banks’ wholesale funding6 less exposed to global liquidity strain in 2008 and 2009, compared to that of the Asian EME banks? The question can be a good starting point for investigation as commercial banks’ increased reliance on the wholesale funding (including repo, interbank deposits, and commercial papers) has been frequently flagged as a key vulnerability (Rajan (2006), Shin (2008), Raddatz (2010)), which generated a destructive feedback between funding and market liquidities in the latest crisis.
5 Vietnam Asian Commercial Joint-Stock Bank (ACB) and Á Châu-Asia Commercial Joint-Stock Bank increased their assets by double to triple in 2007. As expansion of the loans slightly lagged behind, both banks expanded their trading and available-for-sale securities holding by 3 to 25 times to fill the slack.
6 Wholesale funding (end of year stock) is defined as total funding minus customer deposit for the purpose of the paper, as is common in other studies.
9
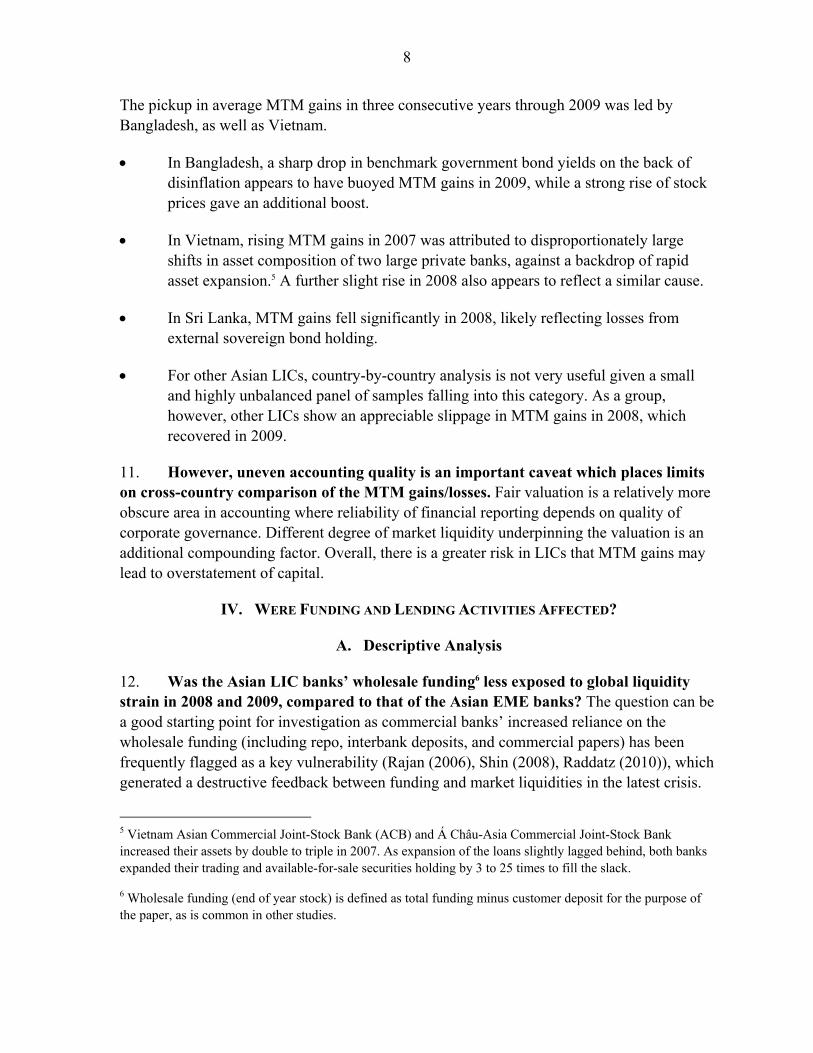
At the highest level of aggregation at least, these data seem to answer this positively. In 2008, the Asian EME banks’ median wholesale funding growth tumbled by 20 percentage points year on year to -5 percent. In the same year, the Asian LIC banks’ median wholesale funding continued to expand by 12 percent, following a 22 percent increase in 2007 (Figure 2).
Figure 2. Asian LICs and EMEs: Funding Behavior
13. However, slight further digging of the same data suggests that the largest LIC banks’ wholesale funding may have strongly reacted to the global liquidity strain. The upper right panel of Figure 2 breaks down both the EME and LIC banks into two groups: top 20 banks7 and the rest. Three points are noteworthy:
The top 20 Asian LIC banks’ wholesale funding sharply decelerated in 2008, followed however by a strong rebound in 2009. Smaller banks in the Asian LICs
7 The top 20 banks were selected based on the size of total assets at end-2007.
(10.0)
-
10.0
20.0
30.0
40.0
50.0
60.0
70.0
80.0
2004 2005 2006 2007 2008 2009
Whole sale funding(In percent, year-on-year)
EME Median
LIC Median
EME mean (tails removed) 1/
LIC mean (tails removed) 1/
1/Tails at 5 percent from each end of the distributions by the groups removed.
50.0
55.0
60.0
65.0
70.0
75.0
80.0
85.0
90.0
95.0
100.0
2004 2005 2006 2007 2008 2009
Customer loan-to-deposit ratio(In percent)
EM Median
LIC Median
EME mean (tail removed) 1/
LIC mean (tail removed) 1/
1/ Upper tails (above 95 percentile ) of the distributions by the groups removed.
(10.0)
(5.0)
-
5.0
10.0
15.0
20.0
25.0
30.0
35.0
40.0
2004 2005 2006 2007 2008 2009
Whole sale funding(In percent, year-on-year)
EME Median (Top 20)
LIC Median (Top 20)
EME Median (other banks)
LIC Median (other banks)
50.0
55.0
60.0
65.0
70.0
75.0
80.0
85.0
90.0
95.0
100.0
2004 2005 2006 2007 2008 2009
Customer loan-to-deposit ratio(In percent)
EME Median (Top 20)
LIC Median (Top 20)
EME Median (other banks)
LIC Median (other banks)
10
continued to expand their wholesale funding in 2008 and 2009, although at increasingly lower rates than in 2007.
Paring back of the wholesale funding by the top 20 Asian EME banks came in 2007, one year ahead of the smaller Asian EME banks, likely reflecting a head-start of deleveraging to better cope with emerging risks to the global financial system.
The magnitude of deceleration for the top 20 Asian EME banks was comparable to that of the top 20 Asian LIC banks. However, no rebound took place yet for the top 20 Asian EME banks.
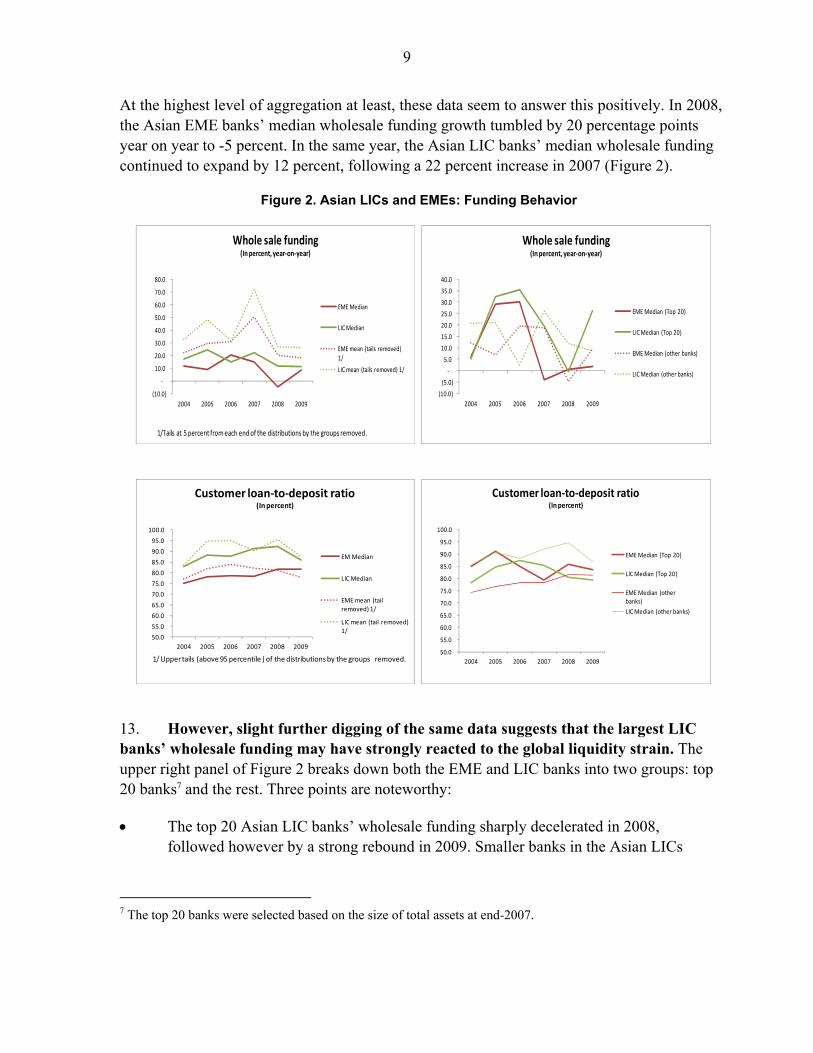
14. How much of the deceleration in the wholesale funding can be attributed to global capital flow factors is not obvious. The Asian EME banks’ wholesale funding growth hit a trough in 2008, when cross-border interbank credit flows to their domicile countries also dipped. Given this concurrence, and based on several studies on propagation of the global financial crisis on EME banks,8 the contraction of wholesale funding experienced by the EME banks probably was affected by the global capital flow factors. However, in case of the Asian LICs, the connection is less evident. First, the cycle of the cross-border interbank capital flows to these countries was somewhat less uniform (Figure 3): while majority of the countries faced a sudden stop in 2009, Cambodian banks saw a large influx of interbank capital flows in the same year and the country saw a sudden stop in 2008 along with Mongolia. Second, the concurrence of the trough in the wholesale funding growth and that of the cross-border interbank capital flows is less evident. The Asian LIC banks’ median wholesale funding growth softened by only ½ percentage point in 2009, a year of sudden stops for the most Asian LICs.
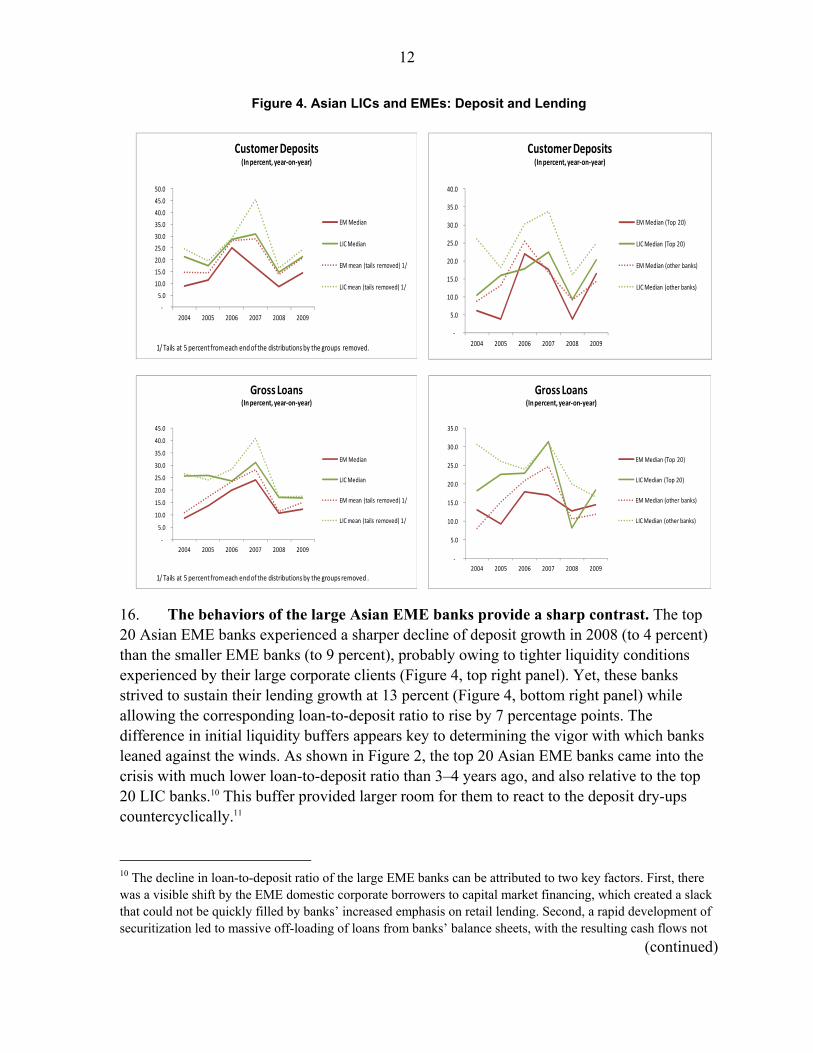
15. Nevertheless, the top 20 LIC banks appear to have been caught by surprise by the global financial crisis at the height of their balance sheet expansion.9 Moreover, the banks attempted to build up their liquidity buffer only as they were already navigating high waves of the crisis, as evidenced by their diminishing loan-to-deposit ratios in 2007 and 2008. The deposit taking and lending behaviors by these banks further affirm procyclicality in their crisis response (Figure 4). As illustrated, the shapes of the troughs of deposit growth were very similar between the top 20 and the rest of the Asian LIC banks (Figure 4, top right panel). However, the corresponding behaviors of lending growth were different (Figure 4, bottom right panel): the top 20 banks allowed their lending growth to plunge by 21 percentage points to 8 percent in 2008, when the smaller banks maintained their lending growth at 20 percent.
8 See IMF World Economic Outlook (April 2009), Cetorelli and Goldberg (2009), McCauley and Zukunft (2008).
9 These banks had their wholesale funding growing at 19 percent (y/y) and gross lending at 31 percent (y/y) in 2007.
11
Figure 3. Cross-Border Interbank Capital and Wholesale Funding
-15000
-10000
-5000
0
5000
10000
2002 2003 2004 2005 2006 2007 2008 2009
EME: Banking Capital Flows(In millions of dollars) 1/
Indonesia
Malaysia
1/ Changes in gross liabilitty of resident banks to non-resident BIS reporting banks, adjusted for valuation effect for non-dollar denomiated liabilities.
-6000
-4000
-2000
0
2000
4000
6000
8000
2002 2003 2004 2005 2006 2007 2008 2009
EME: Banking Capital Flows(In millions of dollars) 1/
Philippines
Thailand
1/ Changes in gross liabilitty of resident banks to non-resident BIS reporting banks, adjusted for valuation effect for non-dollar denomiated liabilities.
-5000
-4000
-3000
-2000
-1000
0
1000
2000
3000
2002 2003 2004 2005 2006 2007 2008 2009
LIC: Banking Capital Flows(In millions of dollars) 1/
Bangladesh
Vietnam
Sri Lanka
1/ Changes in gross liabilitty of resident banks to non-resident BIS reporting banks, adjusted for valuation effect for non-dollar denomiated liabilities.
-50
0
50
100
150
200
250
2002 2003 2004 2005 2006 2007 2008 2009
LIC: Banking Capital Flows(In millions of dollars) 1/
Cambodia
Lao P.D.R.
Mongolia
1/ Changes in gross liabilitty of resident banks to non-resident BIS reporting banks, adjusted for valuation effect for non-dollar denomiated liabilities.
(20.0)
(10.0)
-
10.0
20.0
30.0
40.0
50.0
2004 2005 2006 2007 2008 2009
Wholesale Funding - Median by Country(In percent, year-on-year)
Indonesia Malaysia
Philippines Thailand
(40.0)
(20.0)
-
20.0
40.0
60.0
80.0
100.0
2004 2005 2006 2007 2008 2009
Wholesale Funding - Median by Country(In percent, year-on-year)
Bangladesh Vietnam
Sri Lanka Other LIC
12
Figure 4. Asian LICs and EMEs: Deposit and Lending
16. The behaviors of the large Asian EME banks provide a sharp contrast. The top 20 Asian EME banks experienced a sharper decline of deposit growth in 2008 (to 4 percent) than the smaller EME banks (to 9 percent), probably owing to tighter liquidity conditions experienced by their large corporate clients (Figure 4, top right panel). Yet, these banks strived to sustain their lending growth at 13 percent (Figure 4, bottom right panel) while allowing the corresponding loan-to-deposit ratio to rise by 7 percentage points. The difference in initial liquidity buffers appears key to determining the vigor with which banks leaned against the winds. As shown in Figure 2, the top 20 Asian EME banks came into the crisis with much lower loan-to-deposit ratio than 3–4 years ago, and also relative to the top 20 LIC banks.10 This buffer provided larger room for them to react to the deposit dry-ups countercyclically.11
10 The decline in loan-to-deposit ratio of the large EME banks can be attributed to two key factors. First, there was a visible shift by the EME domestic corporate borrowers to capital market financing, which created a slack that could not be quickly filled by banks’ increased emphasis on retail lending. Second, a rapid development of securitization led to massive off-loading of loans from banks’ balance sheets, with the resulting cash flows not
(continued)
-
5.0
10.0
15.0
20.0
25.0
30.0
35.0
40.0
45.0
50.0
2004 2005 2006 2007 2008 2009
Customer Deposits (In percent, year-on-year)
EM Median
LIC Median
EM mean (tails removed) 1/
LIC mean (tails removed) 1/
1/ Tails at 5 percent from each end of the distributions by the groups removed.
-
5.0
10.0
15.0
20.0
25.0
30.0
35.0
40.0
2004 2005 2006 2007 2008 2009
Customer Deposits(In percent, year-on-year)
EM Median (Top 20)
LIC Median (Top 20)
EM Median (other banks)
LIC Median (other banks)
-
5.0
10.0
15.0
20.0
25.0
30.0
35.0
40.0
45.0
2004 2005 2006 2007 2008 2009
Gross Loans(In percent, year-on-year)
EM Median
LIC Median
EM mean (tails removed) 1/
LIC mean (tails removed) 1/
1/ Tails at 5 percent from each end of the distributions by the groups removed .
-
5.0
10.0
15.0
20.0
25.0
30.0
35.0
2004 2005 2006 2007 2008 2009
Gross Loans(In percent, year-on-year)
EM Median (Top 20)
LIC Median (Top 20)
EM Median (other banks)
LIC Median (other banks)
13
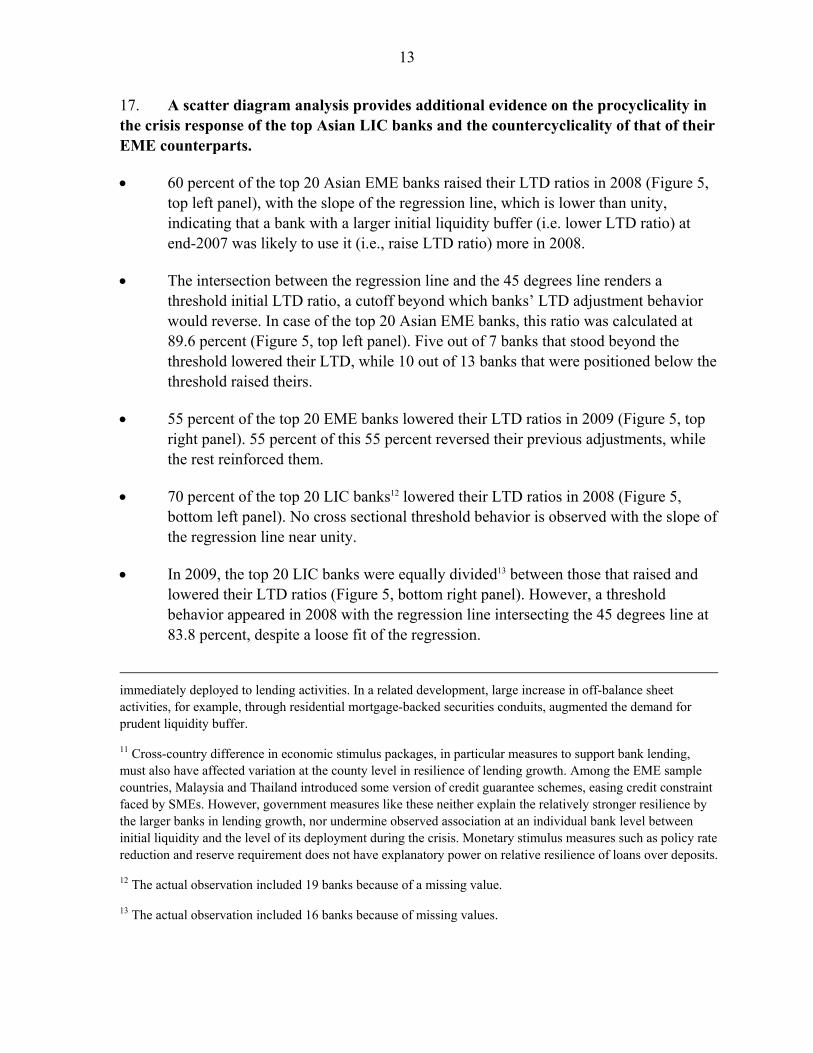
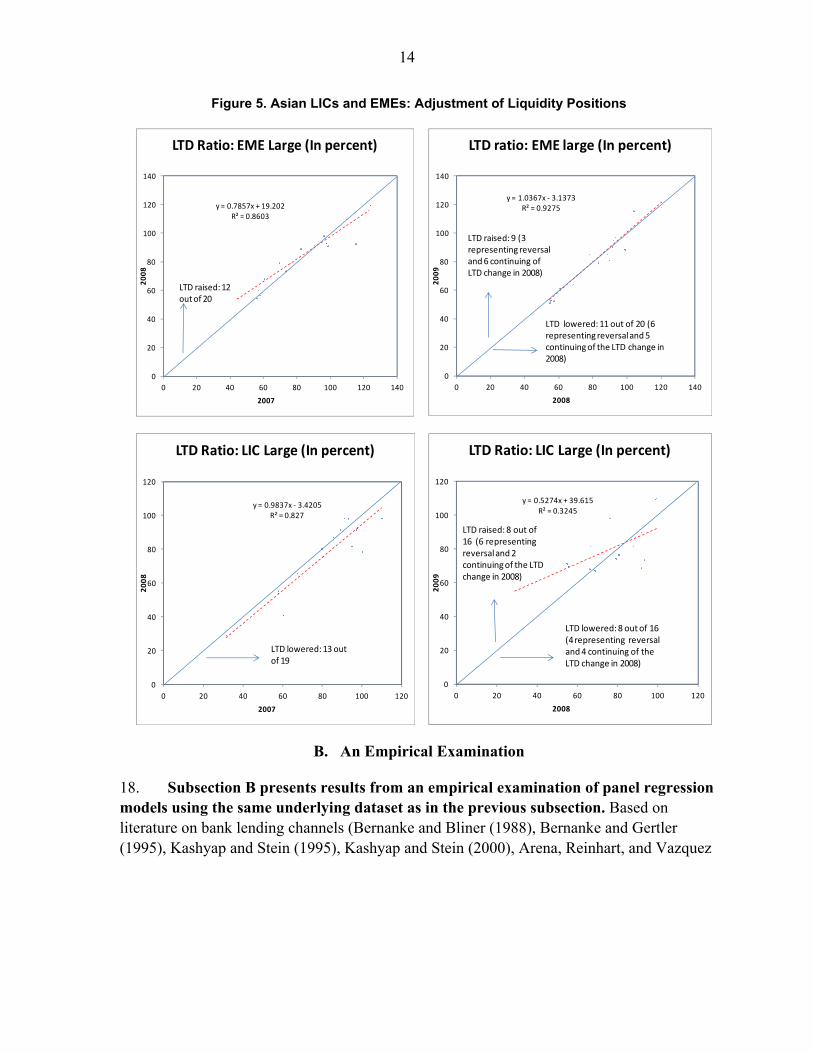
17. A scatter diagram analysis provides additional evidence on the procyclicality in the crisis response of the top Asian LIC banks and the countercyclicality of that of their EME counterparts.
60 percent of the top 20 Asian EME banks raised their LTD ratios in 2008 (Figure 5, top left panel), with the slope of the regression line, which is lower than unity, indicating that a bank with a larger initial liquidity buffer (i.e. lower LTD ratio) at end-2007 was likely to use it (i.e., raise LTD ratio) more in 2008.
The intersection between the regression line and the 45 degrees line renders a threshold initial LTD ratio, a cutoff beyond which banks’ LTD adjustment behavior would reverse. In case of the top 20 Asian EME banks, this ratio was calculated at 89.6 percent (Figure 5, top left panel). Five out of 7 banks that stood beyond the threshold lowered their LTD, while 10 out of 13 banks that were positioned below the threshold raised theirs.
55 percent of the top 20 EME banks lowered their LTD ratios in 2009 (Figure 5, top right panel). 55 percent of this 55 percent reversed their previous adjustments, while the rest reinforced them.
70 percent of the top 20 LIC banks12 lowered their LTD ratios in 2008 (Figure 5, bottom left panel). No cross sectional threshold behavior is observed with the slope of the regression line near unity.
In 2009, the top 20 LIC banks were equally divided13 between those that raised and lowered their LTD ratios (Figure 5, bottom right panel). However, a threshold behavior appeared in 2008 with the regression line intersecting the 45 degrees line at 83.8 percent, despite a loose fit of the regression.
immediately deployed to lending activities. In a related development, large increase in off-balance sheet activities, for example, through residential mortgage-backed securities conduits, augmented the demand for prudent liquidity buffer.
11 Cross-country difference in economic stimulus packages, in particular measures to support bank lending, must also have affected variation at the county level in resilience of lending growth. Among the EME sample countries, Malaysia and Thailand introduced some version of credit guarantee schemes, easing credit constraint faced by SMEs. However, government measures like these neither explain the relatively stronger resilience by the larger banks in lending growth, nor undermine observed association at an individual bank level between initial liquidity and the level of its deployment during the crisis. Monetary stimulus measures such as policy rate reduction and reserve requirement does not have explanatory power on relative resilience of loans over deposits.
12 The actual observation included 19 banks because of a missing value.
13 The actual observation included 16 banks because of missing values.
14
Figure 5. Asian LICs and EMEs: Adjustment of Liquidity Positions
B. An Empirical Examination
18. Subsection B presents results from an empirical examination of panel regression models using the same underlying dataset as in the previous subsection. Based on literature on bank lending channels (Bernanke and Bliner (1988), Bernanke and Gertler (1995), Kashyap and Stein (1995), Kashyap and Stein (2000), Arena, Reinhart, and Vazquez
y = 0.7857x + 19.202R² = 0.8603
0
20
40
60
80
100
120
140
0 20 40 60 80 100 120 140
20
08
2007
LTD Ratio: EME Large (In percent)
LTD raised: 12 out of 20
y = 1.0367x - 3.1373R² = 0.9275
0
20
40
60
80
100
120
140
0 20 40 60 80 100 120 140
20
09
2008
LTD ratio: EME large (In percent)
LTD lowered: 11 out of 20 (6 representing reversal and 5 continuing of the LTD change in 2008)
LTD raised: 9 (3 representing reversal and 6 continuing of LTD change in 2008)
y = 0.9837x - 3.4205R² = 0.827
0
20
40
60
80
100
120
0 20 40 60 80 100 120
20
08
2007
LTD Ratio: LIC Large (In percent)
LTD lowered: 13 out of 19
y = 0.5274x + 39.615R² = 0.3245
0
20
40
60
80
100
120
0 20 40 60 80 100 120
20
09
2008
LTD Ratio: LIC Large (In percent)
LTD lowered: 8 out of 16 (4 representing reversal and 4 continuing of the LTD change in 2008)
LTD raised: 8 out of 16 (6 representing reversal and 2 continuing of the LTD change in 2008)
15
(2006), Hernando and Pagés (2001)) and also building on analyses of the previous section, the impact of the crisis particularly through the crossborder funding channels is examined.14
Methodology
19. The model intends to test the impacts on lending growth of crossborder funding and crisis year period specific effects. It also seeks to identify the extent to which LIC banks responded differently to the crisis, compared with their EME counterparts. Two different combinations of dependent and independent variables were applied to three different sample constellations – a full sample and two subsamples each comprising EME and LIC banks only—using the following general specification,
, , , , , (1)
where 1, 2, … refers to an individual bank, and 1,… a time period.
, , , where ~ 0, and , ~ 0, . Following similar studies using
firm-level panel data, where factors such as entries, exits, and mergers make cross-sectional compositions vary over time, the paper uses an unbalanced panel structure: that is, is time variant and can be missing any elements of I in each time t.15
20. , is the dependent variable. Log differenced gross loans and liquid assets in constant (2002) local currency units were used in different model specifications. Equation 1 allows for a dynamic panel structure by including a lagged dependent variable, as is typical in modeling of lending growth. This implies that an ordinary least square estimation suffers a bias and inconsistency owing to while a fixed effect estimator is also biased and inconsistent for N large and T small, even with the wiped out.16 A random effect GLS estimator is also biased. As a remedy, the paper applies a Panel Generalized Methods of Moment (PGMM) approach proposed by Arlerano and Bond (1991), which was designed to eliminate the bias and inconsistency discussed above. While the original dataset spans eight 14 If deposits and wholesale funding are perfect substitutes to each other, as in Modigliani and Miller (1958), a shock in crossborder funding will affect lending entirely through changes in interest rates. In the presence of an informational asymmetry, however, banks will not be able to seamlessly substitute one source of capital to another. Hence, a shock on crossborder funding will propagate through the same transmission mechanism as studied by the literature on bank lending channels.
15 Monte Carlo studies have revealed a positive relation between imbalances of panel data and the mean squared error of the coefficients estimated on them. Despite the caveat, the paper uses an unbalanced panel data for three reasons, all based on Baltagi and Chang (1994): (i) carving out a balanced subset from an unbalanced panel data is known to worsen the estimation performance; (ii) the imbalances of the data studied here is relatively moderate; and (iii) the size of the cross section is significantly larger than the spectrum of hypothetical dataset in Baltagi and Chang (1994), making large sample asymptotic properties work better.
16 This occurs because the within transformation of the disturbance (while purging off ) brings , (buried in the within average ,.) in the equation, which is correlated with , . See Baltagi (2008), p. 147.
16
years of annual observations, inclusion of a one period lag, differencing, and use of lagged instrument variables diminished the time dimension of the model to five (2005 to 2009).
21. , is a vector of time variant country-specific variables. Alternatively speaking, it
is a vector of macroeconomic variables. A h-th element of this vector , , with
c(i)=j, j 1,2, … , where C denotes the number of domicile countries in the sample, and c(i) is a function that maps a bank to its domicile country. Vector , comprises real GDP growth ( , ), real interest rates ( , ), CPI inflation rates ( , ), changes in nominal exchange rates vis-à-vis US dollar ( . ) (all from IMF’s world economic outlook database), and cross-border interbank gross capital inflows ( . ), published by the Bank for International Settlement and in proportions to nominal GDP. Some of these variables were interacted with an EME dummy variable ( ). is a global factor, which for the purpose of this paper was limited to time period-specific dummy variables.
22. , is a vector of time variant bank-specific variables. As with the general approach in the literature on bank lending channels, size, liquidity, and capital variables were used to control for cross-sectional heterogeneity in the lending supply. The three variables are defined as,
, ln , ln ∑ , ),
, ,
,∑ ∑ ,
,
T / ∑T , and
, ,
,n ∑ ∑ ,
,
T /∑T .
Notice that while all the three balance sheet variables are normalized, , takes out so-called ‘between-averages’ in each period to purge off time trends in the level of total assets. Notice also that , was used to construct dummy variables for large bank both for EMEs ( _ , ) and LICs ( _ , ), picking up banks that are larger than 75 percentile of the distribution for the EME banks and 90 percentile of the same for the LIC ones.17
23. As is common in empirical modeling that uses firm-level balance sheet data, several filtering rules were constructed to rule out nonsensical observations and outliers.
A bank year when total assets more than doubled was eliminated regardless of the source of growth.
17 For large EME banks, the paper uses a relatively lower percentile as a cut-off in a bid to level this with a cut-off that was applied to the LIC banks. However, the estimation results are robust to substantial changes in cut-offs.
17
For both lending and liquid asset growth regressions, bank years when the dependent variable more than tripled or contracted by more than two thirds were eliminated.
All non-positive observations in total assets, total equities, and gross loans were removed.
As the result the number of included banks decreased to 315 (of which 93 were LIC banks).
Estimation result
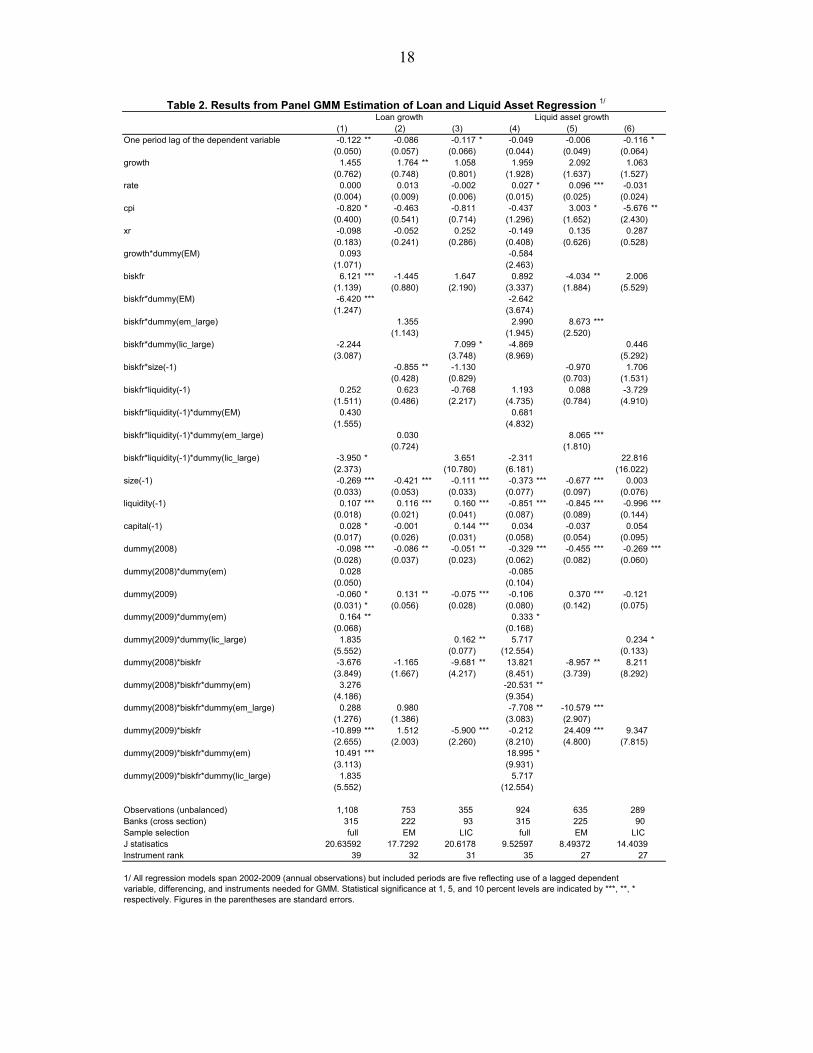
24. The first three columns of Table 2 summarize results from the baseline regression, which was implemented on three different sample constellations discussed earlier. These three columns may not appear, on the surface, to reflect an identical regression specification but in fact they do. For example, growthi,t* DummyEM is not included in equation 2 and 3 because their samples, comprising only EME and LIC banks, do not technically permit its inclusion.18
25. It is interesting to note that the coefficient for dependent lagged variable is significantly negative for the LIC banks, arguably hinting a self-correcting dynamics.19 The size factor showed significantly negative association with lending growth, suggesting dominance of a catching-up dynamic. The liquidity factor showed significantly positive association with lending growth both for the EME and LIC subsamples, further buttressing the observed link between the initial liquidity condition and banks’ tendency to lean against liquidity dry-ups that was discussed in the previous section. However, capitalization mattered only for the LICs once the liquidity and size factors are controlled for.
26. Moving on to the variable of interest, the sensitivity of the growth of lending to crossborder interbank flows (biskfri,t) was significantly positive for the LIC banks in the full sample regression (first column), while an augmented coefficient picking up only the EME banks (biskfri,t* DummyEM) made the same sensitivity negative or insignificant for these banks, with an exception of 2009 (biskfri,t* DummyEM* Dummy09) when the sensitivity puffed up. Likewise, the same estimated sensitivity from the EME subsample regression was negative and insignificant. Meanwhile, the estimate from the LIC subsample regression was significantly positive albeit only for the large banks.
18 Its inclusion in equation 2 will lead to singularity (as the vector is identical with growthi,t) and in equation 3 the same problem (as the variable becomes a vector of all zeros).
19 The result should be interpreted with caution given that the time domain of the regression is rather short.
18
(1) (2) (3) (4) (5) (6)One period lag of the dependent variable -0.122 ** -0.086 -0.117 * -0.049 -0.006 -0.116 *
(0.050) (0.057) (0.066) (0.044) (0.049) (0.064)growth 1.455 1.764 ** 1.058 1.959 2.092 1.063
(0.762) (0.748) (0.801) (1.928) (1.637) (1.527)rate 0.000 0.013 -0.002 0.027 * 0.096 *** -0.031
(0.004) (0.009) (0.006) (0.015) (0.025) (0.024)cpi -0.820 * -0.463 -0.811 -0.437 3.003 * -5.676 **
(0.400) (0.541) (0.714) (1.296) (1.652) (2.430)xr -0.098 -0.052 0.252 -0.149 0.135 0.287
(0.183) (0.241) (0.286) (0.408) (0.626) (0.528)growth*dummy(EM) 0.093 -0.584
(1.071) (2.463)biskfr 6.121 *** -1.445 1.647 0.892 -4.034 ** 2.006
(1.139) (0.880) (2.190) (3.337) (1.884) (5.529)biskfr*dummy(EM) -6.420 *** -2.642
(1.247) (3.674)biskfr*dummy(em_large) 1.355 2.990 8.673 ***
(1.143) (1.945) (2.520)biskfr*dummy(lic_large) -2.244 7.099 * -4.869 0.446
(3.087) (3.748) (8.969) (5.292)biskfr*size(-1) -0.855 ** -1.130 -0.970 1.706
(0.428) (0.829) (0.703) (1.531)biskfr*liquidity(-1) 0.252 0.623 -0.768 1.193 0.088 -3.729
(1.511) (0.486) (2.217) (4.735) (0.784) (4.910)biskfr*liquidity(-1)*dummy(EM) 0.430 0.681
(1.555) (4.832)biskfr*liquidity(-1)*dummy(em_large) 0.030 8.065 ***
(0.724) (1.810)biskfr*liquidity(-1)*dummy(lic_large) -3.950 * 3.651 -2.311 22.816
(2.373) (10.780) (6.181) (16.022)size(-1) -0.269 *** -0.421 *** -0.111 *** -0.373 *** -0.677 *** 0.003
(0.033) (0.053) (0.033) (0.077) (0.097) (0.076)liquidity(-1) 0.107 *** 0.116 *** 0.160 *** -0.851 *** -0.845 *** -0.996 ***
(0.018) (0.021) (0.041) (0.087) (0.089) (0.144)capital(-1) 0.028 * -0.001 0.144 *** 0.034 -0.037 0.054
(0.017) (0.026) (0.031) (0.058) (0.054) (0.095)dummy(2008) -0.098 *** -0.086 ** -0.051 ** -0.329 *** -0.455 *** -0.269 ***
(0.028) (0.037) (0.023) (0.062) (0.082) (0.060)dummy(2008)*dummy(em) 0.028 -0.085
(0.050) (0.104)dummy(2009) -0.060 * 0.131 ** -0.075 *** -0.106 0.370 *** -0.121
(0.031) * (0.056) (0.028) (0.080) (0.142) (0.075)dummy(2009)*dummy(em) 0.164 ** 0.333 *
(0.068) (0.168)dummy(2009)*dummy(lic_large) 1.835 0.162 ** 5.717 0.234 *
(5.552) (0.077) (12.554) (0.133)dummy(2008)*biskfr -3.676 -1.165 -9.681 ** 13.821 -8.957 ** 8.211
(3.849) (1.667) (4.217) (8.451) (3.739) (8.292)dummy(2008)*biskfr*dummy(em) 3.276 -20.531 **
(4.186) (9.354)dummy(2008)*biskfr*dummy(em_large) 0.288 0.980 -7.708 ** -10.579 ***
(1.276) (1.386) (3.083) (2.907)dummy(2009)*biskfr -10.899 *** 1.512 -5.900 *** -0.212 24.409 *** 9.347
(2.655) (2.003) (2.260) (8.210) (4.800) (7.815)dummy(2009)*biskfr*dummy(em) 10.491 *** 18.995 *
(3.113) (9.931)dummy(2009)*biskfr*dummy(lic_large) 1.835 5.717
(5.552) (12.554)
Observations (unbalanced) 1,108 753 355 924 635 289 Banks (cross section) 315 222 93 315 225 90 Sample selection full EM LIC full EM LICJ statisatics 20.63592 17.7292 20.6178 9.52597 8.49372 14.4039Instrument rank 39 32 31 35 27 27
Loan growth Liquid asset growthTable 2. Results from Panel GMM Estimation of Loan and Liquid Asset Regression 1/
1/ All regression models span 2002-2009 (annual observations) but included periods are five reflecting use of a lagged dependent variable, differencing, and instruments needed for GMM. Statistical significance at 1, 5, and 10 percent levels are indicated by ***, **, * respectively. Figures in the parentheses are standard errors.
19
27. What does this mean? An intuitive prior proposition could have been the opposite, predicting stronger dependence on crossborder liquidity by the EME banks, given their higher degree of international financial integration. However, the EME banks’ relatively high sophistication can also be translated into a weaker link between their lending and crossborder borrowing provided that their crossborder funding mainly supported liquid assets but not lending.
28. While difficult to prove, a conjecture along this line appears presumable given (i) relatively more developed market for debts in EMEs, (ii) better availability in the EMEs of instruments to hedge maturity and currency mismatch (interest rate, fx, and cross currency swaps) associated with financing of domestic bond trading with capital flows, and (iii) a likely higher proportion of interoffice funding to overall crossborder interbank flows to LICs, providing an important core source of business, particularly for newly established foreign-owned banks with limited shares in the domestic deposit market.
29. In an attempt to test if this is the case, a regression model that is same as the baseline one was run using the growth of liquid assets as the dependent variable. The full sample regression did not establish the desired link, but the near-significant positive coefficient for biskfri,t* DummyEM_large gave a supportive evidence (see column 4). Moreover, the EME subsample estimation suggested that the sensitivity of liquid asset growth to biskfri,t is significantly positive for most large EME banks20 except in the crisis year. In contrast, both the full sample and LIC subsample estimates found no significant link between LIC banks’ liquid asset growth and biskfri,t, which sits well with the significantly positive link between the LIC banks’ lending growth and biskfri,t discussed earlier.
30. Was there a crisis year period specific effect? This question relates to residual spillover on LIC banks through direct financial linkages, apart from that of the crossborder funding. If either the 2008 or 2009 period specific effect on lending growth is significant and negative, it would imply that bank lending contracted over and above what can be attributed to negative developments in crossborder funding and the macroeconomy.21
31. The full sample baseline estimation indeed shows highly significant and large negative 2008 period fixed effect (Dummy08) for both the EME and LIC banks. The coefficient for Dummy09 is also significant and negative. However the coefficient for DummyEM * Dummy09 is highly significant and positive at a larger absolute value. These
20 The exact condition to assure a positive relationship between the liquid asset growth and interbank capital flows for the large EME banks is liquidityi,t-1 > -0.5752 (=-(-4.034+8.673)/8.065). About three-quarters of all the EME large bank observations meeting the filtering rules satisfy this threshold condition.
21 Residual effects like these can potentially be related to unquantifiable supply side factors, examples of which include lending standards and loan officer sentiments.

20
findings on 2009 suggest that the unidentified residual spillover played a prolonged exacerbating role only in the LICs.
V. WAS LIC BANKS’ ASSET QUALITY AFFECTED?
A. Descriptive Analysis
32. Did the global crisis inflict damages on the Asian LIC banks’ asset quality? There are several important LICs specificities to take into account to address the question. First, LICs’ lower economic openness would likely restrain transmission of shocks through trade linkages, thus limiting spillover on asset quality through them. Indeed, the peak-to-trough retrenchment rate of the median growth rate of the Asian LICs was only about 40 percent, compared to 105 percent in the Asian EMEs.
33. Second, a high level of dollarization in the LICs is expected to affect the relationship between currency and credit risks. As recently observed in the case of the emerging European economies, an endemic loan dollarization can increase financial vulnerability through net open positions (short foreign currency) of unhedged borrowers including households. This vulnerability was shown to grow particularly when borrowers underestimate devaluation risks of their local currency. However, in an environment where devaluation of the local currency is expected for an extended period of time, market participants will formulate long foreign-short local currency positions by hoarding foreign currency revenues while meeting liquidity needs by taking on local currency loans. In such an environment, deposit dollarization will make a bet against the local currency easier,22 and regulations against shorting on the local currency less
22 It would be easier to hoard dollars in an economy where firms and households have easy access to foreign currency deposits, and economic transactions are commonly settled in foreign currencies.
(20.0)
-
20.0
40.0
60.0
80.0
100.0
120.0
20
07
20
08
20
09
20
10
20
11
20
12
20
07
20
08
20
09
20
10
20
11
20
12
Asian LIC Asian EM
Asian LICs and EMEs: Growth(2007=100)
Median
Average
Source: IMF World Economic Outllook.
86.0 88.0 90.0 92.0 94.0 96.0 98.0
100.0 102.0 104.0 106.0
20
07
20
08
20
09
20
10
20
11
20
12
20
07
20
08
20
09
20
10
20
11
20
12
Asian LIC Asian EM
Asian LICs and EMEs: Nominal Dollar Exchange Rate
(2007=100, dollar per local currency)
Median
Average
Source: IMF World Economic Outllook.
21
effective, if there is one. However, the rate of depreciation of the median nominal exchange rate was only 2½ percent for Asian LICs (2¾ percent for EMEs) between 2007 and 2009.
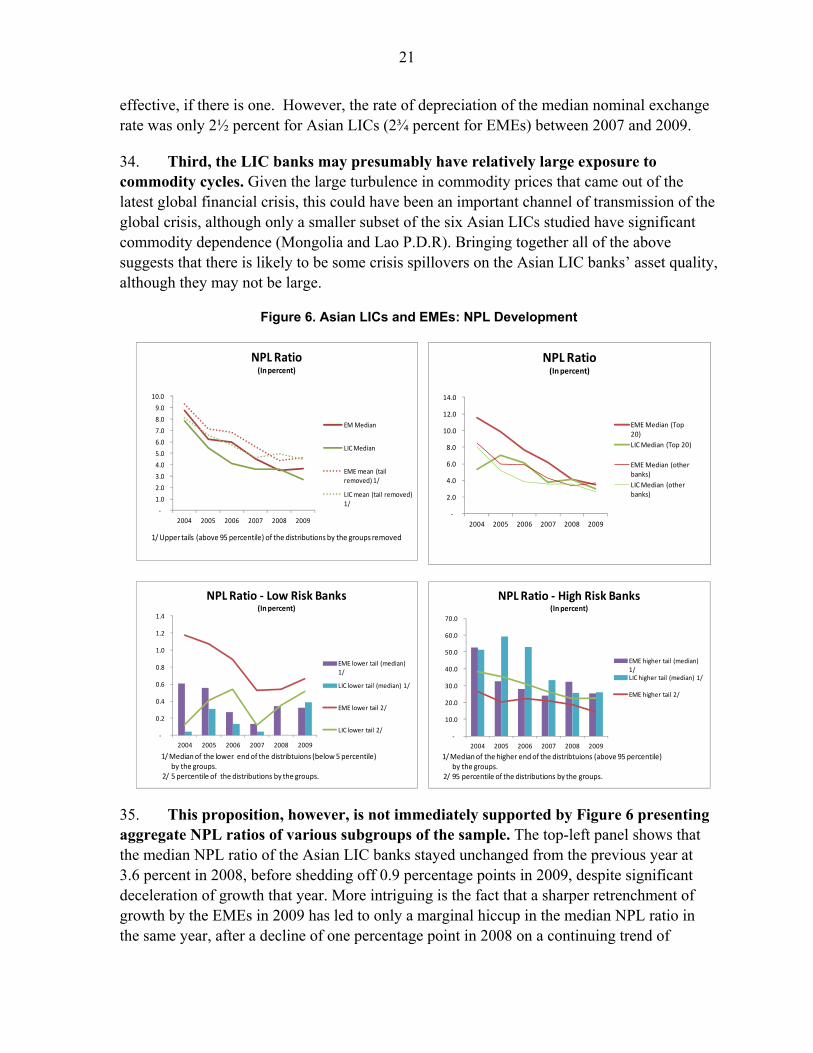
34. Third, the LIC banks may presumably have relatively large exposure to commodity cycles. Given the large turbulence in commodity prices that came out of the latest global financial crisis, this could have been an important channel of transmission of the global crisis, although only a smaller subset of the six Asian LICs studied have significant commodity dependence (Mongolia and Lao P.D.R). Bringing together all of the above suggests that there is likely to be some crisis spillovers on the Asian LIC banks’ asset quality, although they may not be large.
Figure 6. Asian LICs and EMEs: NPL Development
35. This proposition, however, is not immediately supported by Figure 6 presenting aggregate NPL ratios of various subgroups of the sample. The top-left panel shows that the median NPL ratio of the Asian LIC banks stayed unchanged from the previous year at 3.6 percent in 2008, before shedding off 0.9 percentage points in 2009, despite significant deceleration of growth that year. More intriguing is the fact that a sharper retrenchment of growth by the EMEs in 2009 has led to only a marginal hiccup in the median NPL ratio in the same year, after a decline of one percentage point in 2008 on a continuing trend of
-
1.0
2.0
3.0
4.0
5.0
6.0
7.0
8.0
9.0
10.0
2004 2005 2006 2007 2008 2009
NPL Ratio(In percent)
EM Median
LIC Median
EME mean (tail removed) 1/
LIC mean (tail removed) 1/
1/ Upper tails (above 95 percentile) of the distributions by the groups removed
-
2.0
4.0
6.0
8.0
10.0
12.0
14.0
2004 2005 2006 2007 2008 2009
NPL Ratio(In percent)
EME Median (Top 20)
LIC Median (Top 20)
EME Median (other banks)
LIC Median (other banks)
-
0.2
0.4
0.6
0.8
1.0
1.2
1.4
2004 2005 2006 2007 2008 2009
NPL Ratio - Low Risk Banks(In percent)
EME lower tail (median) 1/
LIC lower tail (median) 1/
EME lower tail 2/
LIC lower tail 2/
1/ Median of the lower end of the distribtuions (below 5 percentile) by the groups.
2/ 5 percentile of the distributions by the groups.
-
10.0
20.0
30.0
40.0
50.0
60.0
70.0
2004 2005 2006 2007 2008 2009
NPL Ratio - High Risk Banks(In percent)
EME higher tail (median) 1/LIC higher tail (median) 1/
EME higher tail 2/
1/ Median of the higher end of the distribtuions (above 95 percentile) by the groups.
2/ 95 percentile of the distributions by the groups.
22
consolidation. What explains this remarkable lack of reaction of the NPLs to the large growth shock? Possible explanations can be from offsetting macroeconomic shocks, aggravated delaying of NPL recognition, dilution through new lending, to the power of inertia. Subsection B revisits this question using an empirical analytic framework.
36. An interesting related finding is that the crisis spillover was somewhat more evident in the lower tail of the NPL distribution. As shown by Figure 6 (bottom left panel), the median NPL ratios of banks at the lowest 5 percent of the distribution rose significantly in 2008, considerably undoing a downward trend in recent years. It is not unreasonable to presume that low risk banks also face less pressure to restructure their balance sheets, or to evergreen delinquent loans. In addition, low risk banks are likely to have more robust internal procedures and controls in place, which will act against delayed recognition of asset impairment.
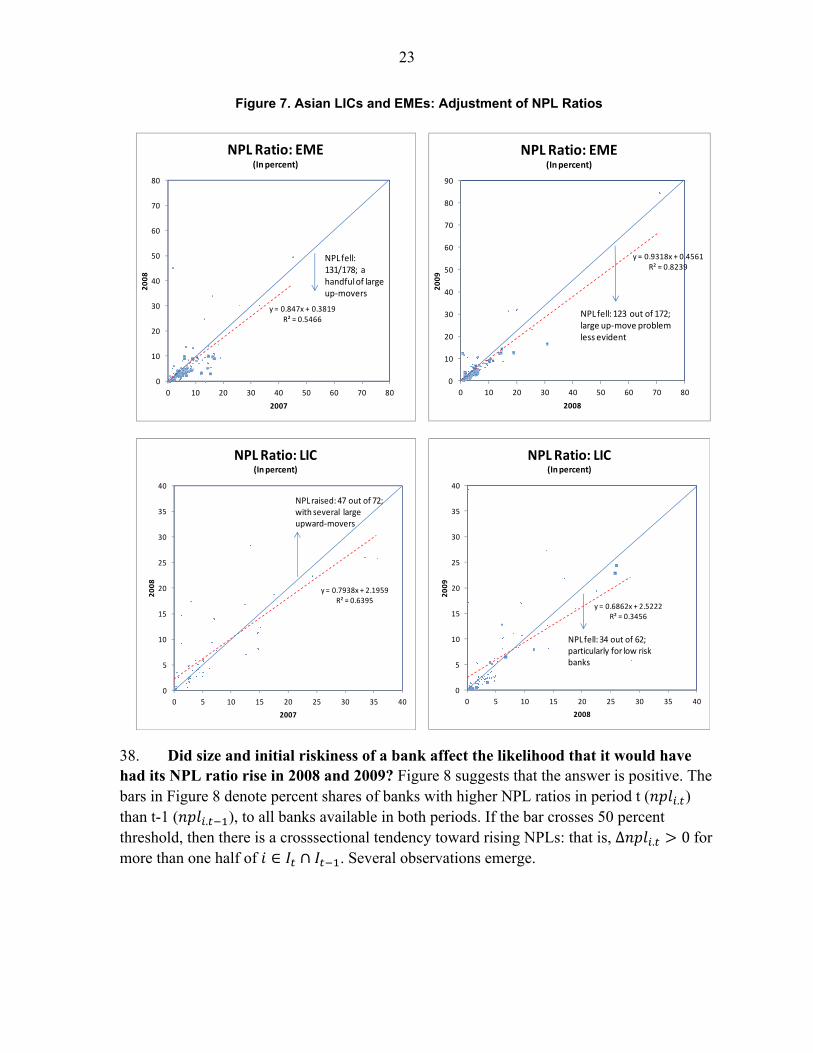
37. A disaggregated view (Figure 7) of the data suggests a possibility that the Asian LIC banks may have suffered somewhat greater spillover of crisis on the NPLs.
74 percent of the Asian EME banks saw reductions in their NPL ratios in 2008 from the previous year (top left panel), although there were a handful of large upward-movers.23
The cross-sectional tendency of NPL reduction continued in 2009, with 72 percent of the Asian EME banks diminishing their NPL ratios in 2009 (top right panel).
65 percent of the Asian LIC banks had their NPL ratios move up in 2008 (bottom left panel). There were again several large upward-movers.
This cross-sectional tendency however reversed in 2009 with 55 percent of the Asian LIC banks lowering their NPL ratios relative to the previous year (bottom right panel).
23 The intersection between the regression line and the 45 degrees line renders a threshold initial NPL ratio, which in this case is 2.5 percent. The thresholds in all the panels appear severely distorted by outliers, and thus ignored.
23
Figure 7. Asian LICs and EMEs: Adjustment of NPL Ratios
38. Did size and initial riskiness of a bank affect the likelihood that it would have had its NPL ratio rise in 2008 and 2009? Figure 8 suggests that the answer is positive. The bars in Figure 8 denote percent shares of banks with higher NPL ratios in period t ( . ) than t-1 ( . ), to all banks available in both periods. If the bar crosses 50 percent threshold, then there is a crosssectional tendency toward rising NPLs: that is, ∆ . 0 for more than one half of . Several observations emerge.
y = 0.847x + 0.3819R² = 0.5466
0
10
20
30
40
50
60
70
80
0 10 20 30 40 50 60 70 80
20
08
2007
NPL Ratio: EME(In percent)
NPL fell: 131/178; a handful of largeup-movers
y = 0.9318x + 0.4561R² = 0.8239
0
10
20
30
40
50
60
70
80
90
0 10 20 30 40 50 60 70 80
20
09
2008
NPL Ratio: EME(In percent)
NPL fell: 123 out of 172; large up-move problem less evident
y = 0.7938x + 2.1959R² = 0.6395
0
5
10
15
20
25
30
35
40
0 5 10 15 20 25 30 35 40
20
08
2007
NPL Ratio: LIC(In percent)
NPLraised: 47 out of 72; with several large upward-movers
y = 0.6862x + 2.5222R² = 0.3456
0
5
10
15
20
25
30
35
40
0 5 10 15 20 25 30 35 40
20
09
2008
NPL Ratio: LIC(In percent)
NPL fell: 34 out of 62; particularly for low risk banks

24
Figure 8. Asian LICs and EMEs: Adjustment of NPL Ratio (Subgroup Analysis)
Size matters for both the Asian EME and LIC banks. The NPL ratios of the top 20 LIC banks were far less likely to rise in 2008 than that of all LIC banks, and much more likely to decline in 2009. This may reflect either better credit risk management or greater tendency toward forbearance of delinquency based on their more favorable liquidity positions relative to other LIC banks. Similarly, the NPL ratios of the top 20 EME banks were significantly more likely to decline in both 2008 and 2009 than the other EME banks. This may most likely reflect better credit risk management as the evergreening explanation is not so plausible given closer supervisory oversight in EMEs, which is increasingly risk-based, and less favorable liquidity conditions compared with the smaller EME banks.
Initial NPL position also matters for both the Asian EMEs and LICs. Asian LIC banks with their initial NPL ratios ( . ) higher than 75 percentile of the distribution were not likely to have their NPL ratios rise in 2008, in contrast with the other LIC banks, and far more likely to have them fall in 2009. Again, this may be a reflection of presumably tighter supervisory intervention, which often involves a
-10.0 20.0 30.0 40.0 50.0 60.0 70.0 80.0 90.0
100.0
2008 2009 2008 2009
EME LIC
(continued)
Indonesia
Malaysia
Philippine
Thailand
Bangladesh
Sri Lanka
Vietnam
Other LICs
1/ Banks with NPL ratios greater than 75 percentile of the distribution in t-1.2/ Top 20 banks within the relevant group.
More than 1/2 banks see their NPL ratios fall
-10.0 20.0 30.0 40.0 50.0 60.0 70.0 80.0 90.0
100.0
2008 2009 2008 2009
EME LIC
Likelihood of NPL Rise(Percent, share of banks with higher NPL ratio than in t-1 )
All banks
Higher risk 1/
Larger 2/
More than 1/2 banks see their NPL ratios rise
25
prescheduled and strictly adhered-to NPL resolution plan. Likewise, high risk Asian EME banks were significantly more likely to lower their NPL ratios in both years compared with the other Asian EME banks.
There is a significant country-by-country disparity in the cross-sectional tendency. While banks domiciled in all other EMEs had their NPL ratios fall in both years, Indonesian banks saw their NPL ratios rise in 2009. In the LICs, the disparity was even crisper, with banks in Vietnam and Bangladesh likely to lower their NPLs in 2009, while banks in Sri Lanka and the other three LICs were more likely to see their NPL ratios rising.
B. An Empirical Examination
39. Subsection B presents results from a panel regression that uses the same modeling approach as the loan regression discussed earlier. The regression examines the impact of the crisis on asset quality, mainly focusing on the sensitivity of NPLs to growth and exchange rates.
Methodology
40. The model specification has the same general form as equation 1, which is replicated as equation 2 for convenience. As before, three different sample constellations—a full sample and two subsamples, one each for the EME and LIC banks—are applied, and an unbalanced panel dataset used:
, , , , , (2)
where 1, 2, … refers to an individual bank, and 1,… a time period.
, , , where ~ 0, and , ~ 0, . As before, all individual bank data
are sourced from Bankscope, and NPLs in proportion of gross loans (i.e., total value of the loan book before provision), after taking a natural log, are used as the dependent variable , . Its one period lagged value , is included on the right hand side, prompting the same endogeneity-related issues as in the lending and liquidity growth regressions. Once again a PGMM is used to deal with these.
Domicile Countries Country Code Indonesia ID Malaysia MY Philippines PH Thailand TH Bangladesh BD Cambodia KH Mongolia MN Lao P.D.R. LA Sri Lanka LK Vietnam VN
26
(1) (2) (3) (4) (5)One period lag of NPL ratio 0.637 *** 0.547 *** 0.233 ** 0.668 *** 0.285 ***
(0.135) (0.120) (0.105) (0.130) (0.099)growth 1.630 1.907 -6.091 ** 6.942 ***
(2.163) (1.890) (2.982) (1.880)growth*dummy(lic) -5.018
(5.454)growth*dummy(ID) -16.233 ** -31.828 ***
(7.328) (7.195)growth*dummy(MY) 5.018
(3.356)growth*dummy(PH) -4.612
(5.352)growth*dummy(TH) -3.128
(3.958)growth*dummy(BD) -3.686
(10.113)growth*dummy(LK) -10.898 ** -16.045 ***
(5.407) (3.899)growth*dummy(VN) -123.645 *
(73.073)rate 0.038 * 0.045 * 0.024 0.043 -0.088 ***
(0.023) (0.027) (0.044) (0.035) (0.025)rate*dummy(EM) 0.020
(0.019)inflation 6.346 * 5.026 * 3.739 7.518 *** -11.672 ***
(2.482) (2.033) (4.879) (2.240) (2.551)lagged lending growth -0.176 -0.096 -0.083 -1.320 ***
(0.212) (0.169) (0.218) (0.495)lagged lending growth*dummy(LIC) 0.229
(0.359)lagged lending growth*dummy(ID) 0.137
(0.219)lagged lending growth*dummy(MY) -0.266
(0.284)lagged lending growth*dummy(PH) 0.650
(0.457)lagged lending growth*dummy(TH) -0.008
(0.461)lagged lending growth*dummy(BD) 1.011 *
(0.522)lagged lending growth*dummy(LK) 0.814
(0.588)lagged lending growth*dummy(VN) 2.002 ***
(0.587)xr 0.944 1.202 * 0.368 5.055 ***
(0.770) (0.677) (0.986) (1.552)xr*dummy(LIC) 0.024
(1.734)xr*dummy(ID) -0.558
(1.188)xr*dummy(MY) 3.372 *
(1.770)xr*dummy(PH) -1.945
(1.630)xr*dummy(TH) -1.410
(1.674)xr*dummy(BD) -8.279 ***
Baseline AlternativeTable 3. Results from Panel GMM Estimation of NPL Regression 1/
27
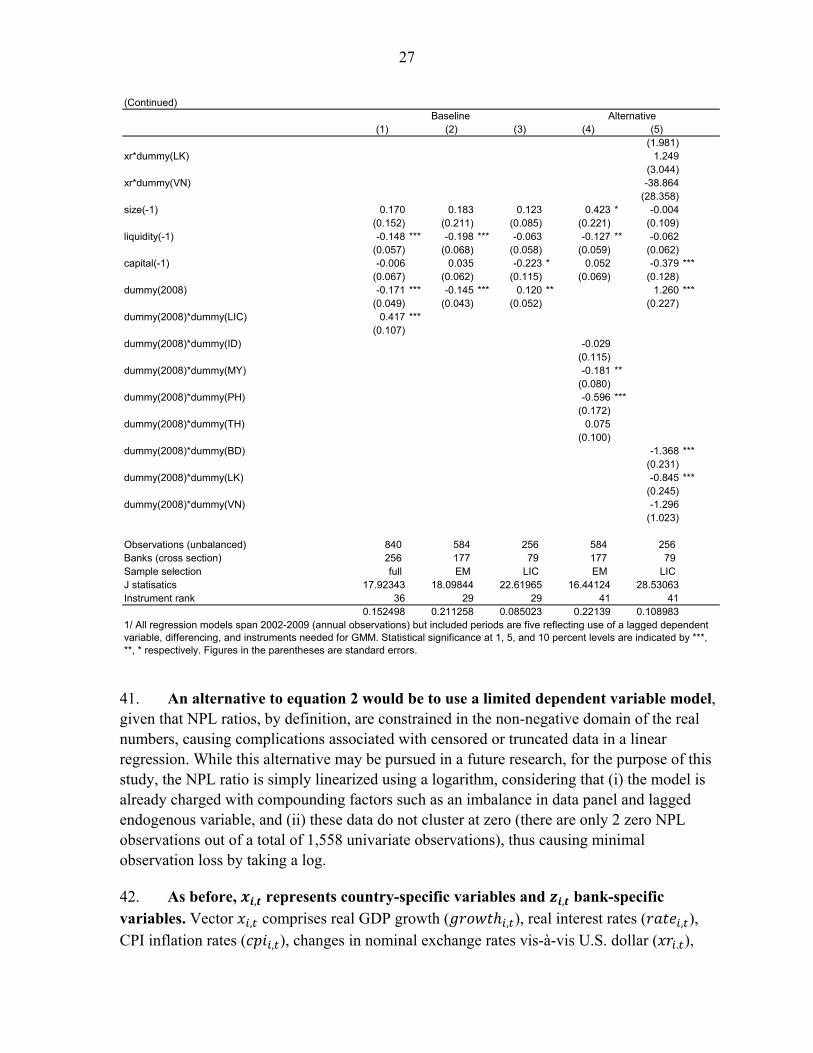
41. An alternative to equation 2 would be to use a limited dependent variable model, given that NPL ratios, by definition, are constrained in the non-negative domain of the real numbers, causing complications associated with censored or truncated data in a linear regression. While this alternative may be pursued in a future research, for the purpose of this study, the NPL ratio is simply linearized using a logarithm, considering that (i) the model is already charged with compounding factors such as an imbalance in data panel and lagged endogenous variable, and (ii) these data do not cluster at zero (there are only 2 zero NPL observations out of a total of 1,558 univariate observations), thus causing minimal observation loss by taking a log.
42. As before, , represents country-specific variables and , bank-specific variables. Vector , comprises real GDP growth ( , ), real interest rates ( , ), CPI inflation rates ( , ), changes in nominal exchange rates vis-à-vis U.S. dollar ( . ),
(Continued)
(1) (2) (3) (4) (5)(1.981)
xr*dummy(LK) 1.249(3.044)
xr*dummy(VN) -38.864(28.358)
size(-1) 0.170 0.183 0.123 0.423 * -0.004(0.152) (0.211) (0.085) (0.221) (0.109)
liquidity(-1) -0.148 *** -0.198 *** -0.063 -0.127 ** -0.062(0.057) (0.068) (0.058) (0.059) (0.062)
capital(-1) -0.006 0.035 -0.223 * 0.052 -0.379 ***(0.067) (0.062) (0.115) (0.069) (0.128)
dummy(2008) -0.171 *** -0.145 *** 0.120 ** 1.260 ***(0.049) (0.043) (0.052) (0.227)
dummy(2008)*dummy(LIC) 0.417 ***(0.107)
dummy(2008)*dummy(ID) -0.029(0.115)
dummy(2008)*dummy(MY) -0.181 **(0.080)
dummy(2008)*dummy(PH) -0.596 ***(0.172)
dummy(2008)*dummy(TH) 0.075(0.100)
dummy(2008)*dummy(BD) -1.368 ***(0.231)
dummy(2008)*dummy(LK) -0.845 ***(0.245)
dummy(2008)*dummy(VN) -1.296(1.023)
Observations (unbalanced) 840 584 256 584 256 Banks (cross section) 256 177 79 177 79 Sample selection full EM LIC EM LICJ statisatics 17.92343 18.09844 22.61965 16.44124 28.53063Instrument rank 36 29 29 41 41
0.152498 0.211258 0.085023 0.22139 0.108983
Baseline Alternative
1/ All regression models span 2002-2009 (annual observations) but included periods are five reflecting use of a lagged dependent variable, differencing, and instruments needed for GMM. Statistical significance at 1, 5, and 10 percent levels are indicated by ***, **, * respectively. Figures in the parentheses are standard errors.
28
with some of these variables interacted with an EME dummy variable ( ) or country dummy variables subscripted with country codes shown above. For the vector , of bank specific variables, the NPL regression uses size, liquidity, and capital variables as before.
Estimation result
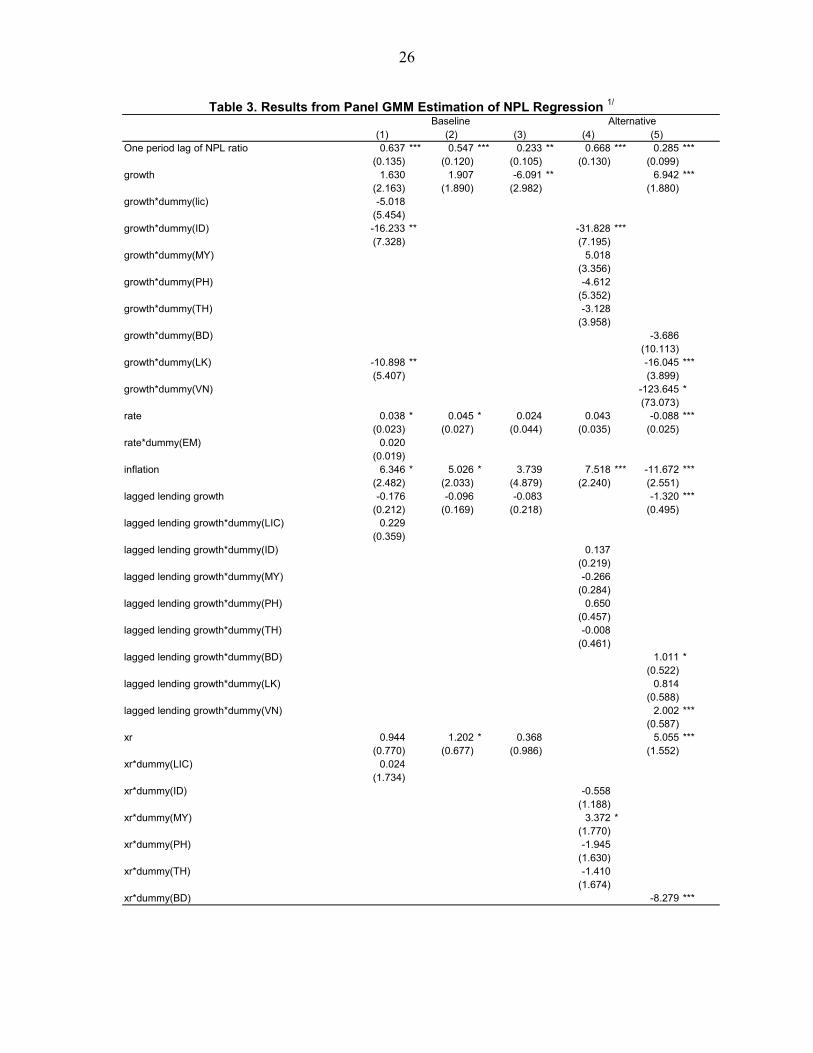
43. The estimation result from the baseline model is provided in the first three columns of Table 3. As before, these three columns represent an identical regression specification despite some difference in appearances. Subsequent two columns show results from both the EME and LIC only estimations where growth, lagged lending growth, and the rate of depreciation are interacted with country dummy variables. According to the full sample baseline estimation (column one), the sensitivity of NPLs to growth is positive on average, albeit insignificant, for EMEs excluding Indonesia, which shows a significantly negative sensitivity. The same average sensitivity for LICs is insignificantly negative, excluding Sri Lanka’s case where it is significant.
44. The result may appear somewhat puzzling as one could expect more significant negative linkage between economic cycles and NPLs, considering (i) improvement of cash flows in a boom; (ii) improved recovery prospectives in a boom, which facilitates elimination of legacy NPLs; and (iii) procyclicality in banks’ credit risk management and banking supervision, which tend to feed forbearance in a boom. However, these favorable effects on asset quality should be weighed against a shift toward riskier borrowers or business models that may also occur during a boom. In particular, a search for an ex ante high risk-adjusted return in a boom (particularly a liquidity-abundant one) can lead to higher NPL ratios (fixing all other things) by tilting banks toward business models with higher known delinquency trends, such as credit cards or noncollateralized personal loans. Thus, it would not be unreasonable to expect cross-sectional heterogeneity in the way . responds to growth as trade-offs between the two opposite forces (i.e. favorable vs. unfavorable) can result in different net effects, depending on the macrofinancial context of a country. This heterogeneity is indeed affirmed by a large disparity in the country-wise sensitivities reported in the last two columns.
45. The sensitivity of NPLs to currency depreciation is positive, but insignificant for both the EMEs and LICs in the full sample regression. In the EME only regression, the same sensitivity was weakly significant and positive. The same sensitivity from the LIC-only estimation was positive, but still insignificant. Given that prolonged lopsidedness in foreign exchange markets is more likely to occur in a LIC context where FX markets are subject to more administrative controls, apparently weaker exchange rate-to-NPL link there resonates. As discussed earlier, exchange rate shocks will affect NPLs differently depending on whether they are expected, causing country-by-country heterogeneity, which may offset one another.

29
Figure 9. Asian LICs and EMEs: Driver of Changes of NPLs
Quantifying the impact of the crisis
46. How large was the impact of the crisis on the NPLs? The baseline estimation results were used to disentangle the drivers of changes in NPLs in 2008 and 2009, in an attempt to address this (Figure 9).
Full sample (upper panel): The growth factor contributed positively to changes in
the mean NPL (∑ , ∑ , ) but the contributions were small in
both years, as the NPLs’ low estimated sensitivity watered down the shocks to growth, which were hefty. In 2008, other macroeconomic and exchange rate factors also pushed the NPLs upward. However, with at 0.64, the inertia effect was large enough to offset adverse macroeconomic effects. In 2009, growth and exchange rates
-40
-30
-20
-10
0
10
20
30
2008 2009
EME Banks
-50
-40
-30
-20
-10
0
10
20
30
40
2008 2009
LIC Banks
-50
-40
-30
-20
-10
0
10
20
30
40
2008 2009
LICs BanksExchange rate
Period effect
Other macro factors
Loan growth
Inertia
Growth
Balance sheet factors
Actual (percent change in mean NPL ratio)
Estimated (percent change in estimated mean NPL ratio)
Note: Estimate based on full sample PGMM regression, all estimated coefficients used regardless of significance
30
continued to add to the upside augmented by balance sheet factors, while offsets were provided mainly by the other macroeconomic factors,24 followed by inertia.
LIC banks (lower right panel): While the upside contributions of the growth factor were much larger than the EMEs, they were still small relative to other drivers. In 2008, the growth factor was augmented by an across-the-board up-shift in the NPL ratios (i.e., period effect) reflecting unobservable cross-sectional common factors,25 despite a mitigating effect of the inertia. In 2009, an upward push by the growth factor was reinforced by the exchange rate factor and the inertia, but offsets from the turned-around period effect and other macroeconomic factors were larger.
EME banks (lower left panel): Contributions from the growth were very small while the period effect, other macroeconomic and exchange rate factors were the game changers. In 2008, an upward push from the other macroeconomic and exchange rate factors was outweighed by a downward pull by the period effect and inertia. In 2009, the period effect flipped to the upside, while the other macroeconomic factor flipped to the down side, leading to near-balancing of up and down side effects.
VI. FINDINGS AND POLICY IMPLICATION
47. Despite relatively low financial integration, impacts of the crisis on the Asian LIC banks, particularly the largest ones, were not insignificant. Analyses of bank-level microdata and regression models suggest that the impacts were most palpable through a loan-to-crossborder funding nexus, led by the largest ones. The Asian LIC banks’ lending growth strongly responded to the unfolding signs of crisis propagation, as suggested by the significantly positive coefficient of the crossborder interbank capital flows in the lending growth regression. Moreover, Figures 2 and 4 showed that the large LIC banks beefed up their liquidity buffer only as they were already navigating the high waves of the crisis, by having their loan growth decelerate more than the deposit growth. Overall, the Asian LIC banks appear to have been caught by surprise at the height of their balance sheet expansion, allowing the subsequent unraveling to exacerbate procyclical unfolding of macro-financial linkages.
48. The Asian EME banks appear to have been less affected by the sudden stop of capital flows, despite higher globalization of funding, as demonstrated by the weak link between the lending growth and crossborder interbank capital flows (Table 2). At the heart of
24 The flipping of the effect of other macroeconomic factors between 2008 and 2009 mainly reflected receding of inflation in 2009 that passed through an estimated positive link between NPLs and the inflation. Average real interest rates fell in 2008 and rose in 2009, partially offsetting the impacts of the inflation in both years.
25 Examples can be global factors directly affecting asset quality, correlated changes in loan policy, or rigor of banking supervision.

31
the successful dilution of the sudden stop was countercyclical liquidity management, particularly by the largest banks, and restraints prior to the crisis on funneling the cross border funding to the lending growth.
49. These findings caution against understating LIC banking systems’ vulnerability to international liquidity and capital flow cycles. Despite that vulnerabilities appear significant and to be growing, macroprudential supervisions are generally nascent or nonexistent. As a starter, compiling and disseminating data on interbank capital flows can be stepped up to inform use of countermeasures, including prudential regulations or capital controls, as needed. Currently, the BIS capital flow data is the only regularly disseminated information on this front, but the data gap may be particularly significant for the Asian LICs given their large exposure to Chinese and other intraregional capital flows, which are not captured well by the BIS statistics.
50. The NPL regression reveals a weak NPL-to-growth linkage both for the EMEs and LICs, which is consistent with only mild observed disruption in the wake of the crisis of the recent downward stabilization of the NPL ratios. The NPL regression analysis also suggests that NPL dynamics may be significantly affected by procyclical fluctuations in banks’ business models and target customer base, which may cause crowding-in of riskier borrowers in booms. This should be interpreted with caution because the NPL dynamics may be asymmetric along the cycle. That is, a change in borrower composition driven by a search for yield can lead to rising NPL ratios in a boom, but the reversal of this composition change in a recession can be disruptive and not leading to lower NPL ratios.
51. The regression result, as well as Figure 9, also demonstrates the power of inertia, raising two interrelated points for consideration. First, recent progress in NPL resolution in both the Asian LICs and EMEs provided an ideal cushion to absorb an upward push to NPL ratios in the wake of the crisis. Second, a coincidental initial condition such as this may not happen to be present in the next crisis. Given this, a continued priority for the Asian LICs would be to firm up banking supervision, which is often plagued with capacity constraints, inappropriate legal backing, and conflicts of interest, aiming to keep NPL dynamics in check in normal times and minimize procyclicality embedded in the banking supervision itself.
52. The analysis of valuation gains affirms a significant impact of the crisis through direct balance sheet exposures for the Asian EME banks. However, the propagation of the crisis on the Asian LIC banks was limited, with their financial asset holding still small and mainly consisting of domestic government bonds, which remain largely insulated from the international capital markets. However, with the Asian LICs—spearheaded by Sri Lanka and Vietnam—stepping up access to the international financial markets, the valuation channel is set to play a more active role in future crises.
53. One lesson that has been learned, in the case of the EME banks, was that even large banks often jump into a new trading technology without understanding the
32
underlying risks. As financial integration of the LICs speeds up, it is inevitable that a drive toward innovative business modalities will kick in, sometimes amid a dangerously complacent herd mentality. The latest financial crisis was an expensive lesson that financial innovation, while it should not be repressed, also should not be allowed to completely run away from supervisory checks. Supervisors should first try to be informed through continual engagement with the market participants, and be proactive staying ahead of emerging vulnerabilities. Supervisors should not be afraid to be seen as naysayers, saying no to an innovation conceived under an inappropriate absorptive environment. They should also be empowered with appropriate backing in terms of legal authorities and protection.
33
REFERENCES
Arellano, Manuel, and Stephen Bond, 1991, “Some Tests of Specification for Panel Data: Monte Carlo Evidence and an Application to Employment Equations,” Review of Economic Studies, Vol. 58(2), pp. 277–97.
Arena, Marcos, Reinhart, Carmen M., and Francisco Vazquez, 2006, “The Lending Channel
in Emerging Economies: Are Foreign Banks Different?” NBER Working Paper No. W12340 (Cambridge, Massachusetts: National Bureau of Economic Research).
Baba, Naohiko, and Ilhyuk Shim, 2010, “Policy Responses to Dislocations In the FX Swap
Market: The Experience of Korea,” BIS Quarterly Review, pp. 29–39. June. Baltagi, Badi H., 2008, Econometric Analysis of Panel Data (4th Edition), John Wiley &
Sons, Ltd. Baltagi, Badi H., and Young-Jae Chang, 1994, “Incomplete Panels: A Comparative Study of
Alternative Estimators for the Unbalanced One-Way Error Component Regression Model,” Journal of Econometrics 62, pp. 67–89.
Bernanke, Ben S., and Alan Blinder, 1988, “Credit, Money and Aggregate Demand,” The
American Economic Review, Vol. 78 (2), pp. 435–39. Bernanke, Ben S., and Mark L. Gertler, 1995, “Inside the Black Box: The Credit Channel of
Monetary Policy Transmission,” The Journal of Economic Perspectives, Vol. 9 (4), pp. 27–48.
Cetorelli, Nicola, and Linda S. Goldberg, 2009, “Global Banks and International Shock
Transmission: Evidence from The Crisis,” mimeo (available at: http://www.ny.frb.org/research/economists/goldberg/IMF-BOF-PSG_121409all.pdf).
Hernando, Ignacio, and Jorge Martinez Pagés, 2001, “Is There a Bank Lending Channel of
Monetary Policy in Spain,” Working Paper 99 (Frankfurt: European Central Bank). International Monetary Fund, 2009, World Economic Outlook (Washington). Kashyap, Anil, and Jeremy C. Stein, 1995, “The Impact of Monetary Policy on Bank Balance
Sheets,” Carnegie-Rochester Conference Series on Public Policy, 42, pp. 151–95. Kashyap, Anil, and Jeremy C. Stein, 2000, “What Do a Million Observation on Banks Say
About the Transmission of Monetary Policy,” American Economic Review, Vol. 90(3), pp. 407–28.
34
McCauley Robert N., and Jenes Zukunft, 2008, “Asian Banks and the International Interbank Market,” BIS Quarterly Review, pp. 67–79, June.
Modigliani, Franco, and Merton Miller, 1958, “The Cost of Capital, Corporation Finance,
and the Theory of Investment,” American Economic Review, Vol. 48(4), pp. 261–97. Raddatz, Claudio, 2010, “When the Rivers Run Dry : Liquidity and the Use of Wholesale
Funds in the Transmission of the U.S. Subprime Crisis,” Policy Research Working Paper Series 5203 (Washington: World Bank).
Rajan, Raghu, 2006, “Has Finance Made the World Riskier?” European Financial
Management, Vol. 12(4), pp. 499–533. Ree, J., 2009, Philippines: Selected Issues: “Contagion of the Recent Global Financial
Turmoil,” IMF Staff Country Report 09/63, Chapter I, (Washington). Shin, H.S., “Reflections on Northern Rock: The Bank Run That Heralded the Global
Financial Crisis,” Journal of Economic Perspectives, Vol. 23(1), pp. 101–19. Yang, Y., and H. Lee, 2008, “An Analysis on Arbitrage Transaction Opportunities and the
Investment in the Domestic Bond Market By Foreign Bank Branches And Foreign Investors,” Bank of Korea Monthly Bulletin, pp. 55–89, August.
Yu, Bok-Keun, 2010, “The Global Financial Crisis and the Covered Interest Rate Differential:
The Case of Korea,” Kukje Kyungje Yongu, Vol. 16 (3), pp. 77–99.