Embed Size (px)
Citation preview
i
Capital Markets Soundness Report
Volume II
“Leading global market access and positive digital disruption through Financial
Technology (FinTech) innovations”
A Quarterly publication of the Capital
Markets Authority
JANUARY – MARCH 2017
The Capital Markets Authority (CMA) Soundness report is a publication on capital markets stability. While reasonable care has been
taken to prepare this report, the Authority accepts no responsibility or liability whatsoever resulting from the use of information contained
herein. Note further, that CMA has no objection to the material contained herein being referenced, provided an acknowledgement of the
same is made. Any comments and/or suggestions on any of the statistics may be sent to [email protected]
.
ii
In this issue…
Overview – International Markets 1
Overview – Domestic Markets 3
Kenya’s Capital Markets Performance & Stability – Equity Markets 4
Kenya’s Capital Markets Performance & Stability – Bond Markets 7
Capital Markets Stability Indicators 9
Market Infrastructure, New Products and Systems Stability Update 15
1
http://www.stats.gov.cn/english/ http://www.chinadaily.com.cn/business/2017-03/18/content_28601299.htm
Overview – International Markets
Global Economy; improved growth driven by infrastructure
development priorities – The Global Interim Economic Outlook of
March 2017 reports that the global GDP growth is projected to
increase to 3.3% in 2017 and around 3.5% in 2018. The anticipated
moderate increase in 2017/18 is reflective of the aftermath of the
various ongoing and envisaged fiscal policies in the United States,
China, the Euro-area and other crucial initiatives in other
economies such as Canada1.
Infrastructure development remains top in the national agenda for
the major global economic powers. Further to US President
Donald Trump’s pledge to close the US$1 trillion infrastructure
gap, the United Kingdom is further championing infrastructure
investments to mitigate the uncertainties caused by Brexit, while
the Eurozone’s €315 billion three-year Juncker Plan is already
ahead of the curve. China’s President Xi Jinping’s New Silk Road
plan to connect China with Central Asia, the Middle East and
Europe through road, rail and port construction is well underway
as a further testimony to growing priority of infrastructure as a key
tool is fiscal stimulus
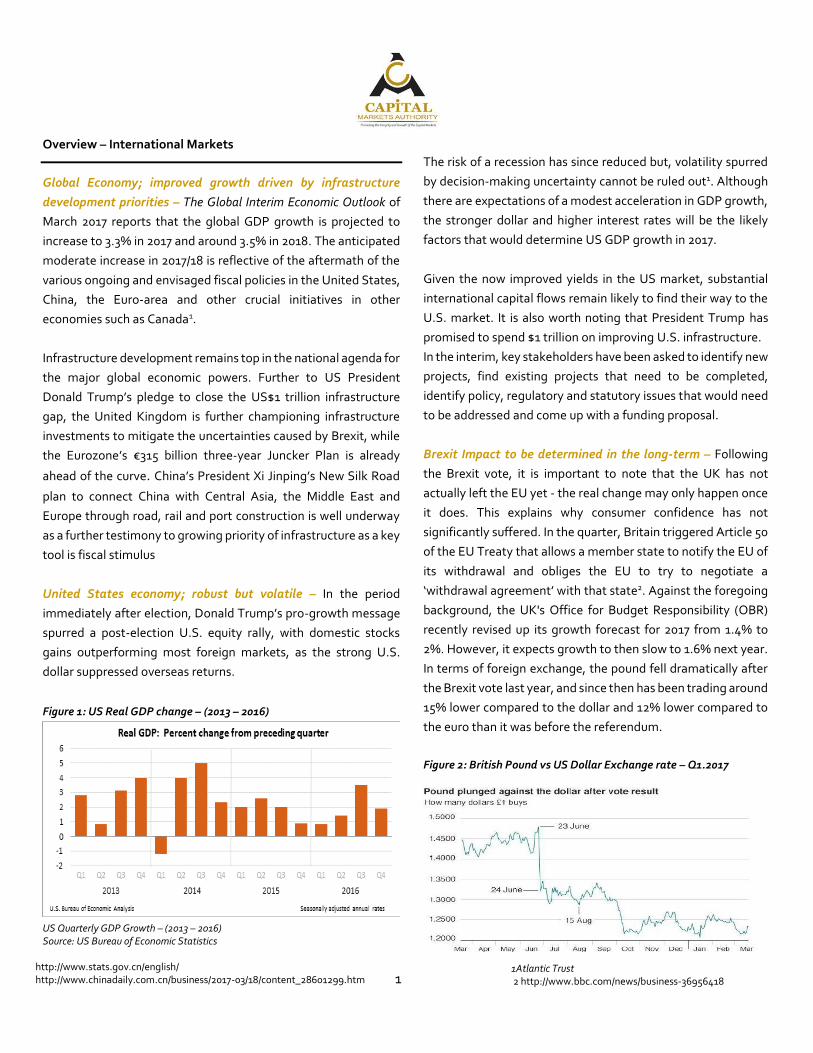
United States economy; robust but volatile – In the period
immediately after election, Donald Trump’s pro-growth message
spurred a post-election U.S. equity rally, with domestic stocks
gains outperforming most foreign markets, as the strong U.S.
dollar suppressed overseas returns.
Figure 1: US Real GDP change – (2013 – 2016)
US Quarterly GDP Growth – (2013 – 2016) Source: US Bureau of Economic Statistics
1Atlantic Trust 2 http://www.bbc.com/news/business-36956418
The risk of a recession has since reduced but, volatility spurred
by decision-making uncertainty cannot be ruled out1. Although
there are expectations of a modest acceleration in GDP growth,
the stronger dollar and higher interest rates will be the likely
factors that would determine US GDP growth in 2017.
Given the now improved yields in the US market, substantial
international capital flows remain likely to find their way to the
U.S. market. It is also worth noting that President Trump has
promised to spend $1 trillion on improving U.S. infrastructure.
In the interim, key stakeholders have been asked to identify new
projects, find existing projects that need to be completed,
identify policy, regulatory and statutory issues that would need
to be addressed and come up with a funding proposal.
Brexit Impact to be determined in the long-term – Following
the Brexit vote, it is important to note that the UK has not
actually left the EU yet - the real change may only happen once
it does. This explains why consumer confidence has not
significantly suffered. In the quarter, Britain triggered Article 50
of the EU Treaty that allows a member state to notify the EU of
its withdrawal and obliges the EU to try to negotiate a
‘withdrawal agreement’ with that state2. Against the foregoing
background, the UK's Office for Budget Responsibility (OBR)
recently revised up its growth forecast for 2017 from 1.4% to
2%. However, it expects growth to then slow to 1.6% next year.
In terms of foreign exchange, the pound fell dramatically after
the Brexit vote last year, and since then has been trading around
15% lower compared to the dollar and 12% lower compared to
the euro than it was before the referendum.
Figure 2: British Pound vs US Dollar Exchange rate – Q1.2017
Source: Bloomberg

2
Britain has expressed its desire to strengthen its relations with
Commonwealth countries, including Kenya. In his recent visit to
Kenya, the United Kingdom Foreign Secretary Boris Johnson
indicated that Kenya-UK trade relations will continue to blossom
despite Britain’s intended exit from the European Union (EU). To
sustain and improve these historical relations, the Authority
shall continue to participate in initiatives aimed at improving
economic relations through portfolio capital flows.
Marginal growth to continue in the EU – According to
preliminary estimates published by Eurostat, the statistical
office of the European Union, seasonally adjusted GDP rose by
0.5% in the euro area (EA19) and by 0.6% in the EU28 during the
fourth quarter of 2016, compared with the previous quarter. In
the third quarter of 2016, GDP had grown by 0.4% in the euro
area and by 0.5% in the EU28. In terms of Kenya’s economic
relations with EU, in September 2016, as members of the EAC,
Kenya and Rwanda signed their part of the Economic
Partnership Agreement (EPA) with EU. The EU-EAC EPA
provisions, however, require that all EAC members sign and
ratify it, for it to be in force. Should the other EAC countries
(Tanzania, Burundi and Uganda) further postpone EPA
signature, no country could enjoy its benefits. Under the EPA,
the EU will keep its market open for the region in exchange for
gradual liberalization of 82.6 per cent of the signatories’ market
over a period of 25 years3. Being the only developing country in
EAC (the rest are classified as Least Developed Countries that
enjoy duty-free trade with EU without reciprocating), Kenya has
had to lobby its partners to endorse EPA because of the shared
customs territory. Consultations are still on-going on EPA’s
signing.
China’s Economic Performance expected to improve in Q1 2017
– The most recent update on China’s economy is positive, with
the world’s second largest economy realizing an improved GDP
growth rate of 6.9% on a year-to year- basis (1.3% quarter-on-
quarter) in the first quarter of 2017, the highest since June 2015
with infrastructure being the main driver.
In March 2017, China's manufacturing purchasing managers
index (PMI) was 51.8 percent, rising for two consecutive months,
an increase of 0.2 percentage points over February 2017, with
the manufacturing industry continuing to keep a steady and
positive trend. It has been an increasingly important strategic
and economic partner to Kenya.
Given the country’s active role in Kenya’s infrastructure, its
economic performance has a bearing on Kenya’s infrastructural
prospects. From a policy standpoint, in line with the Capital
Markets Masterplan, the Authority will proactively avail
information on the potential of Kenya’s capital markets to
mobilize funds to finance Vision 2030 projects. There is already
strong support by market stakeholders for the Government to
brand its infrastructure plan as outlined in Kenya Vision 2030.
The market further supports the setting up of an infrastructure
fund, with seed capital from capital markets participants and/or
existing national development funds to support a national
integrated infrastructure strategy.4 From a domestic policy
perspective, the growing priorities of Kenya’s major partners in
respect of their own infrastructure development is likely to
reduce their support to other emerging and frontier economies,
Kenya inclusive- and there remains a strong case for the smaller
economies to leverage global and domestic capital markets
financing to support similar domestic priorities.
Kenya has greatly benefitted from policy and regulatory support
by its Government and is working steadily towards issuing its
first Sukuk and other conventional sovereign debt issuances,
buoyed by its consistent sovereign rating, the most recent being
Standard & Poor’s affirmation of the country’s short and long
term foreign and local currency sovereign credit ratings at
“B+/B” with a stable outlook on strong external position and
monetary policy flexibility. This is complemented by the tax
neutrality measures pronounced during the 2017/2018 budget
delivery in March 2017 by the Cabinet Secretary for the National
Treasury, designed to support the introduction of Islamic finance
products, Asset Backed Securities (ABS) and Real Estate
Investment Trusts (REITs).
3 https://www.standardmedia.co.ke/business
4 4 The Authority held a round table policy discussion with market players on this
publication on 27th April 2017 whose contributions are herein captured.
3
5 Proposal to conduct survey was incorporated by the Authority following
recommendation by Group 3 during the round table policy discussion hosted by
the Authority on 27th April 2017.
6 Kenya National Bureau of Statistics (KNBS)
It is noteworthy that Kenya’s current estimated infrastructure
funding gap is US$2-3 billion per year over the next 10 years, re-
emphasizing the need to fully leverage market based financing.
While international capital may flow more easily into the US and
other large economies for various reasons outlined above,
Kenya’s capital markets is still likely to attract foreign funds,
especially in bonds space, due to the relatively higher yields
averaging 10 percent. Further, Kenya’s capital markets were
recently opened fully to foreign participation and, international
investors may be attracted to listed companies with growth
horizons, considering that most listed stocks are currently
undervalued. The Authority is engaging with market
stakeholders to ensure that foreign investors onboarding, client
due diligence and that trading and settlement cycles are globally
competitive. A survey to further understand the unique needs of
foreign investors is also planned for the coming quarter.5
Growth in Sub-Sahara Africa – IMF projects economic growth for
the SSA region at 3 percent in 2017, lower than the 3.3 percent in
2016. The institution attributes this decline mainly to lower
commodity prices, a slowdown in inflows from major trading
partners, and tightening borrowing conditions.
Table 1: Likely Top African Economic performers - 2017
Country GDP Growth rate (%)
Ivory Coast 8.0
Ethiopia 7.5
Ghana 7.4
Tanzania 7.2
Senegal 6.8
Kenya 6.1
Rwanda 6.0
Source: IMF Regional Economic Outlook
The IMF sees most of the non–resource-intensive countries
continuing to perform well, as they benefit from lower oil import
prices, an improved business environment and strong
infrastructure investment. In contrast, commodity exporters are
expected to be under economic strains, including the region’s
three largest countries, Angola, Nigeria, and South Africa.
Kenya’s economic relations with the rest of Africa are
concentrated around the EAC region and will have to actively
safeguard its exports to the region which accounted for about 21
per cent of its total exports in 2015, as imports from China and
India crowd out its goods in Uganda, Tanzania and Rwanda, even
as it explores new markets in SSA.
In terms of capital markets, the Authority has actively been
supporting cross and dual listings as one of the approaches to
increase capital markets participation in the region.
Overview – Domestic Markets’ Stability
Kenya’s GDP in 2016 - Latest figures6 show Kenya’s Gross
Domestic Product (GDP) to have expanded by 5.8 per cent in
2016, compared to a revised growth of 5.7 per cent in 2015.
Year-on-year, accommodation, food services, information and
communication, real estate among others recorded improved
growth, compared to a contraction of 1.3 per cent in 2015. On
the other hand, among others, construction, mining and
quarrying decelerated in 2016.
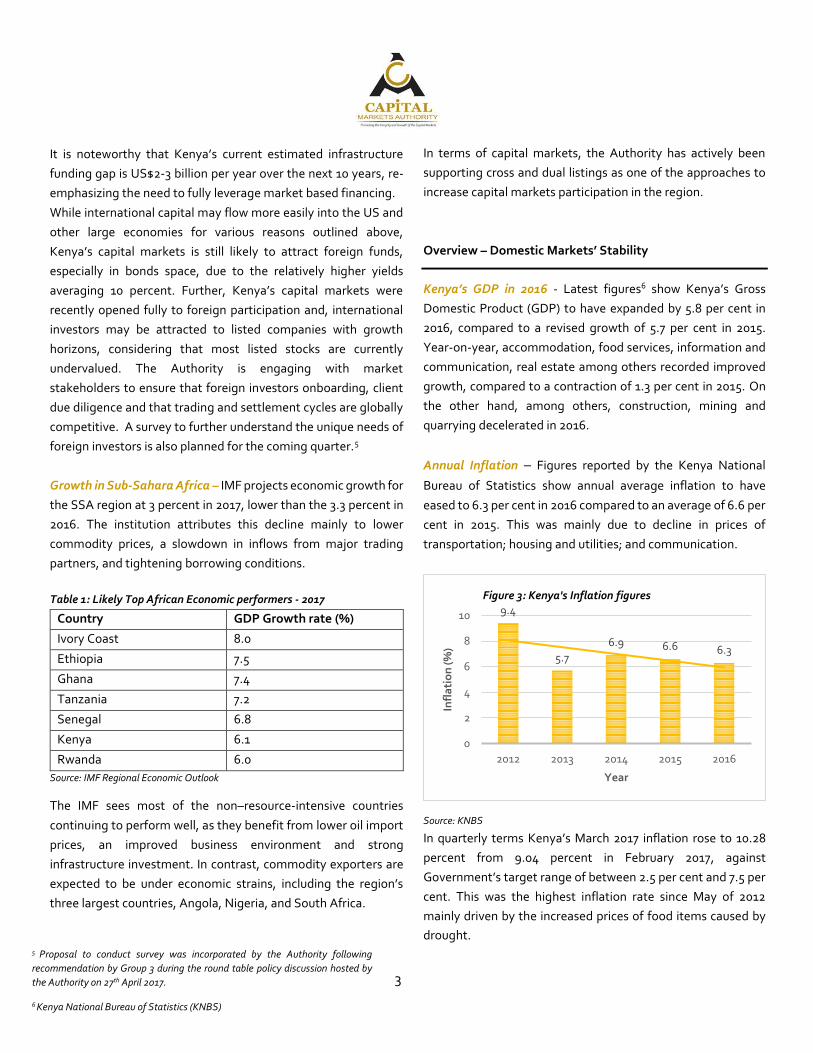
Annual Inflation – Figures reported by the Kenya National
Bureau of Statistics show annual average inflation to have
eased to 6.3 per cent in 2016 compared to an average of 6.6 per
cent in 2015. This was mainly due to decline in prices of
transportation; housing and utilities; and communication.
Source: KNBS
In quarterly terms Kenya’s March 2017 inflation rose to 10.28
percent from 9.04 percent in February 2017, against
Government’s target range of between 2.5 per cent and 7.5 per
cent. This was the highest inflation rate since May of 2012
mainly driven by the increased prices of food items caused by
drought.
9.4
5.7
6.9 6.6 6.3
0
2
4
6
8
10
2012 2013 2014 2015 2016
Infl
ati
on
(%)
Year
Figure 3: Kenya's Inflation figures
4
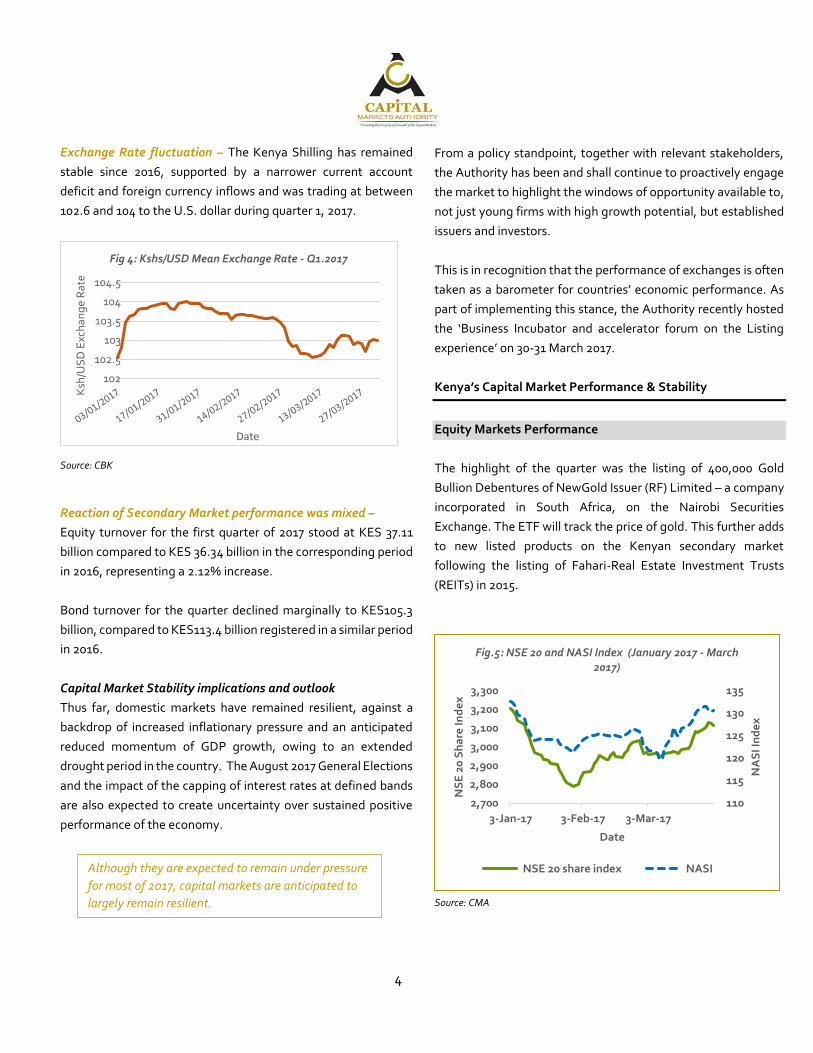
Exchange Rate fluctuation – The Kenya Shilling has remained
stable since 2016, supported by a narrower current account
deficit and foreign currency inflows and was trading at between
102.6 and 104 to the U.S. dollar during quarter 1, 2017.
Source: CBK
Reaction of Secondary Market performance was mixed –
Equity turnover for the first quarter of 2017 stood at KES 37.11
billion compared to KES 36.34 billion in the corresponding period
in 2016, representing a 2.12% increase.
Bond turnover for the quarter declined marginally to KES105.3
billion, compared to KES113.4 billion registered in a similar period
in 2016.
Capital Market Stability implications and outlook
Thus far, domestic markets have remained resilient, against a
backdrop of increased inflationary pressure and an anticipated
reduced momentum of GDP growth, owing to an extended
drought period in the country. The August 2017 General Elections
and the impact of the capping of interest rates at defined bands
are also expected to create uncertainty over sustained positive
performance of the economy.
102
102.5
103
103.5
104
104.5
Ksh
/US
D E
xch
ang
e R
ate
Date
Fig 4: Kshs/USD Mean Exchange Rate - Q1.2017
From a policy standpoint, together with relevant stakeholders,
the Authority has been and shall continue to proactively engage
the market to highlight the windows of opportunity available to,
not just young firms with high growth potential, but established
issuers and investors.
This is in recognition that the performance of exchanges is often
taken as a barometer for countries’ economic performance. As
part of implementing this stance, the Authority recently hosted
the ‘Business Incubator and accelerator forum on the Listing
experience’ on 30-31 March 2017.
Kenya’s Capital Market Performance & Stability
Equity Markets Performance
The highlight of the quarter was the listing of 400,000 Gold
Bullion Debentures of NewGold Issuer (RF) Limited – a company
incorporated in South Africa, on the Nairobi Securities
Exchange. The ETF will track the price of gold. This further adds
to new listed products on the Kenyan secondary market
following the listing of Fahari-Real Estate Investment Trusts
(REITs) in 2015.
Source: CMA
110
115
120
125
130
135
2,700
2,800
2,900
3,000
3,100
3,200
3,300
3-Jan-17 3-Feb-17 3-Mar-17
NA
SI I
nd
ex
NS
E 2
0 S
ha
re In
de
x
Date
Fig.5: NSE 20 and NASI Index (January 2017 - March 2017)
NSE 20 share index NASIAlthough they are expected to remain under pressure
for most of 2017, capital markets are anticipated to
largely remain resilient.
5
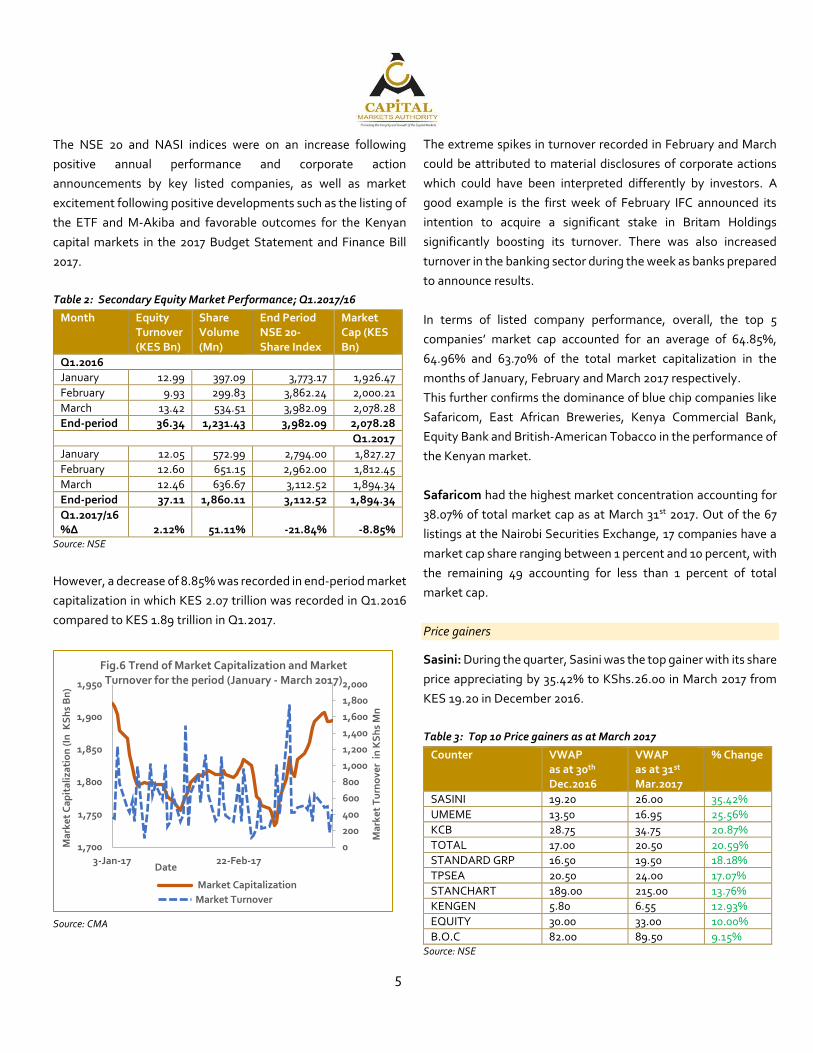
The NSE 20 and NASI indices were on an increase following
positive annual performance and corporate action
announcements by key listed companies, as well as market
excitement following positive developments such as the listing of
the ETF and M-Akiba and favorable outcomes for the Kenyan
capital markets in the 2017 Budget Statement and Finance Bill
2017.
Table 2: Secondary Equity Market Performance; Q1.2017/16
Month Equity Turnover (KES Bn)
Share Volume (Mn)
End Period NSE 20-Share Index
Market Cap (KES Bn)
Q1.2016
January 12.99 397.09 3,773.17 1,926.47
February 9.93 299.83 3,862.24 2,000.21
March 13.42 534.51 3,982.09 2,078.28
End-period 36.34 1,231.43 3,982.09 2,078.28
Q1.2017
January 12.05 572.99 2,794.00 1,827.27
February 12.60 651.15 2,962.00 1,812.45
March 12.46 636.67 3,112.52 1,894.34
End-period 37.11 1,860.11 3,112.52 1,894.34
Q1.2017/16 %Δ 2.12% 51.11% -21.84% -8.85%
Source: NSE
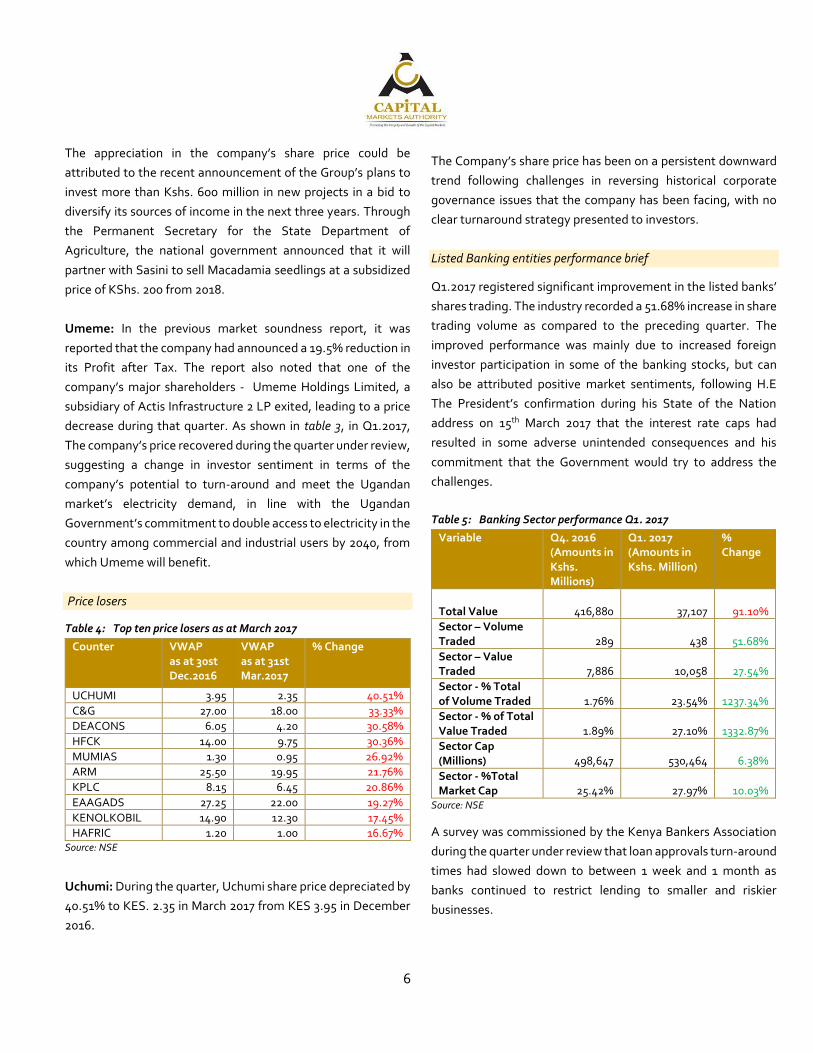
However, a decrease of 8.85% was recorded in end-period market
capitalization in which KES 2.07 trillion was recorded in Q1.2016
compared to KES 1.89 trillion in Q1.2017.
Source: CMA
0
200
400
600
800
1,000
1,200
1,400
1,600
1,800
2,000
1,700
1,750
1,800
1,850
1,900
1,950
3-Jan-17 22-Feb-17
Ma
rke
t T
urn
ove
r in
KS
hs
Mn
Ma
rke
t C
ap
ita
liza
tio
n (
In K
Sh
s B
n)
Date
Fig.6 Trend of Market Capitalization and Market Turnover for the period (January - March 2017)
Market Capitalization
Market Turnover
The extreme spikes in turnover recorded in February and March
could be attributed to material disclosures of corporate actions
which could have been interpreted differently by investors. A
good example is the first week of February IFC announced its
intention to acquire a significant stake in Britam Holdings
significantly boosting its turnover. There was also increased
turnover in the banking sector during the week as banks prepared
to announce results.
In terms of listed company performance, overall, the top 5
companies’ market cap accounted for an average of 64.85%,
64.96% and 63.70% of the total market capitalization in the
months of January, February and March 2017 respectively.
This further confirms the dominance of blue chip companies like
Safaricom, East African Breweries, Kenya Commercial Bank,
Equity Bank and British-American Tobacco in the performance of
the Kenyan market.
Safaricom had the highest market concentration accounting for
38.07% of total market cap as at March 31st 2017. Out of the 67
listings at the Nairobi Securities Exchange, 17 companies have a
market cap share ranging between 1 percent and 10 percent, with
the remaining 49 accounting for less than 1 percent of total
market cap.
Price gainers
Sasini: During the quarter, Sasini was the top gainer with its share
price appreciating by 35.42% to KShs.26.00 in March 2017 from
KES 19.20 in December 2016.
Table 3: Top 10 Price gainers as at March 2017
Counter VWAP as at 30th Dec.2016
VWAP as at 31st Mar.2017
% Change
SASINI 19.20 26.00 35.42%
UMEME 13.50 16.95 25.56%
KCB 28.75 34.75 20.87%
TOTAL 17.00 20.50 20.59%
STANDARD GRP 16.50 19.50 18.18%
TPSEA 20.50 24.00 17.07%
STANCHART 189.00 215.00 13.76%
KENGEN 5.80 6.55 12.93%
EQUITY 30.00 33.00 10.00%
B.O.C 82.00 89.50 9.15% Source: NSE
6
The appreciation in the company’s share price could be
attributed to the recent announcement of the Group’s plans to
invest more than Kshs. 600 million in new projects in a bid to
diversify its sources of income in the next three years. Through
the Permanent Secretary for the State Department of
Agriculture, the national government announced that it will
partner with Sasini to sell Macadamia seedlings at a subsidized
price of KShs. 200 from 2018.
Umeme: In the previous market soundness report, it was
reported that the company had announced a 19.5% reduction in
its Profit after Tax. The report also noted that one of the
company’s major shareholders - Umeme Holdings Limited, a
subsidiary of Actis Infrastructure 2 LP exited, leading to a price
decrease during that quarter. As shown in table 3, in Q1.2017,
The company’s price recovered during the quarter under review,
suggesting a change in investor sentiment in terms of the
company’s potential to turn-around and meet the Ugandan
market’s electricity demand, in line with the Ugandan
Government’s commitment to double access to electricity in the
country among commercial and industrial users by 2040, from
which Umeme will benefit.
Price losers
Table 4: Top ten price losers as at March 2017
Counter VWAP as at 30st Dec.2016
VWAP as at 31st Mar.2017
% Change
UCHUMI 3.95 2.35 40.51%
C&G 27.00 18.00 33.33%
DEACONS 6.05 4.20 30.58%
HFCK 14.00 9.75 30.36%
MUMIAS 1.30 0.95 26.92%
ARM 25.50 19.95 21.76%
KPLC 8.15 6.45 20.86%
EAAGADS 27.25 22.00 19.27%
KENOLKOBIL 14.90 12.30 17.45%
HAFRIC 1.20 1.00 16.67% Source: NSE
Uchumi: During the quarter, Uchumi share price depreciated by
40.51% to KES. 2.35 in March 2017 from KES 3.95 in December
2016.
The Company’s share price has been on a persistent downward
trend following challenges in reversing historical corporate
governance issues that the company has been facing, with no
clear turnaround strategy presented to investors.
Listed Banking entities performance brief
Q1.2017 registered significant improvement in the listed banks’
shares trading. The industry recorded a 51.68% increase in share
trading volume as compared to the preceding quarter. The
improved performance was mainly due to increased foreign
investor participation in some of the banking stocks, but can
also be attributed positive market sentiments, following H.E
The President’s confirmation during his State of the Nation
address on 15th March 2017 that the interest rate caps had
resulted in some adverse unintended consequences and his
commitment that the Government would try to address the
challenges.
Table 5: Banking Sector performance Q1. 2017
Variable Q4. 2016 (Amounts in Kshs. Millions)
Q1. 2017 (Amounts in Kshs. Million)
% Change
Total Value 416,880 37,107 91.10%
Sector – Volume Traded 289
438 51.68%
Sector – Value Traded 7,886
10,058 27.54%
Sector - % Total of Volume Traded 1.76% 23.54% 1237.34%
Sector - % of Total Value Traded 1.89% 27.10% 1332.87%
Sector Cap (Millions) 498,647 530,464 6.38%
Sector - %Total Market Cap 25.42% 27.97% 10.03%
Source: NSE
A survey was commissioned by the Kenya Bankers Association
during the quarter under review that loan approvals turn-around
times had slowed down to between 1 week and 1 month as
banks continued to restrict lending to smaller and riskier
businesses.
7
Interest Rate Capping
It is important to note that prior to the interest rate capping,
private sector lending was already in a decline, due to among
other factors inflationary pressures
According to the March 2017/18 Budget policy
pronouncements, the National Treasury , Kenya Bankers
Association and the CBK will be undertaking a comprehensive
assessment on the impact of the interest rate capping law, to
assess its impact on credit expansion to the private sector which
has slowed down and the perceived impact on economic
growth. The assessment will inform any intervention measures
to be taken to ensure credit availability to consumers. The
Government also anticipates to progressively reduce the
interest rate spread. The assessment is expected to determine
if capping worsened the existing problem of reduced lending.
However, market stakeholders believe that the existing fiscal
deficit and subsequent pressure to the Government to borrow
more, having fallen short of meeting its revenue collection
targets in the first half of 2016/2017, could still push up interest
rates in the near future, although not to the levels experienced
pre-capping. A key emerging risk following the preferential
lending policy by commercial banks arising from capping is the
rise of an unregulated system of lending and borrowing as fewer
people now have access to banking lending services.
Interest rate capping has equally had some positive impact in
the industry. For example, repayment of amounts for
customers who took loans in the post capping period have
reduced. Additionally, the banking industry in February 2017
launched ‘pesalink,’ a solution that enables banks to share
technology infrastructure and create new channels for
providing a state of the art money transfer service to customers.
Pesalink7 is an initiative of the Kenya Bankers Association and
the idea was conceived in 2012 when banks realized that they
were losing about KES 2.3 billion ($23 million) to telcos through
mobile money transfer services.
The platform is the first of its kind offering the first ever 24/7
real time interbank transaction framework with 24 participating
banks as at the time of this publication.
Bond Markets Performance
East African Breweries (EABL) issued a 14.71%, 5-year corporate
bond which received a 141 per cent subscription rate. Investors
offered KES8.45 billion shillings, well above the KES6 billion it
sought. The raised funds shall be used to restructure the
company’s balance sheet. The bond is the second tranche of an
issue that was first offered to the market in 2015.
In the primary Treasury bonds market, during Q1.2017, Four (4)
new Treasury bonds were issued (one was cancelled) together
with two tap sales of the March Bond Offers, as the Government
sought to raise KES90 billion. A total of KES99.28 billion worth
of bond applications were received, with the government
accepting applications worth KES 46.34 billion, indicating a
46.68% acceptance rate. In a similar quarter in 2016, the
Government had sought to raise KES 85 billion, received KES
119.03 billion and accepted KES 71.54 billion worth of Treasury
bonds.
M-Akiba - Following sustained efforts towards introduction of
the mobile phone based bond issuance, during the quarter, after
two years of testing, the National Treasury launched the M-
Akiba bond on March 23rd 2017. The bond was offered as a
Special Limited Offer (SLO). This coincided with the 10th
anniversary of the globally renowned M-Pesa innovation.
The key but highly understated objective of M-Akiba is to
democratize access to Government debt issuance allowing
access to savings and investment opportunities for all ordinary
Kenyans, through an affordable minimum subscription of Ksh.
3,000/-, by fully leveraging our market leading mobile phone
penetration rate of 88%. The initial offer that was to run until
10th April or until Sh150 million was hugely successful, albeit
with a few teething hitches during this pilot phase. The
Government intends to issue an additional Kshs 4.85 billion in
June 2017 and it will be crucial to ensure broader access by
Wanjiku across the country through a longer offer period,
aggressive sensitization campaigns, smoother onboarding
process and seamless clearing and settlement mechanism.
Market stakeholders will continue to review and improve
measures in readiness of the upcoming additional issuance.
7 https://ipsl.co.ke/about-us/
8
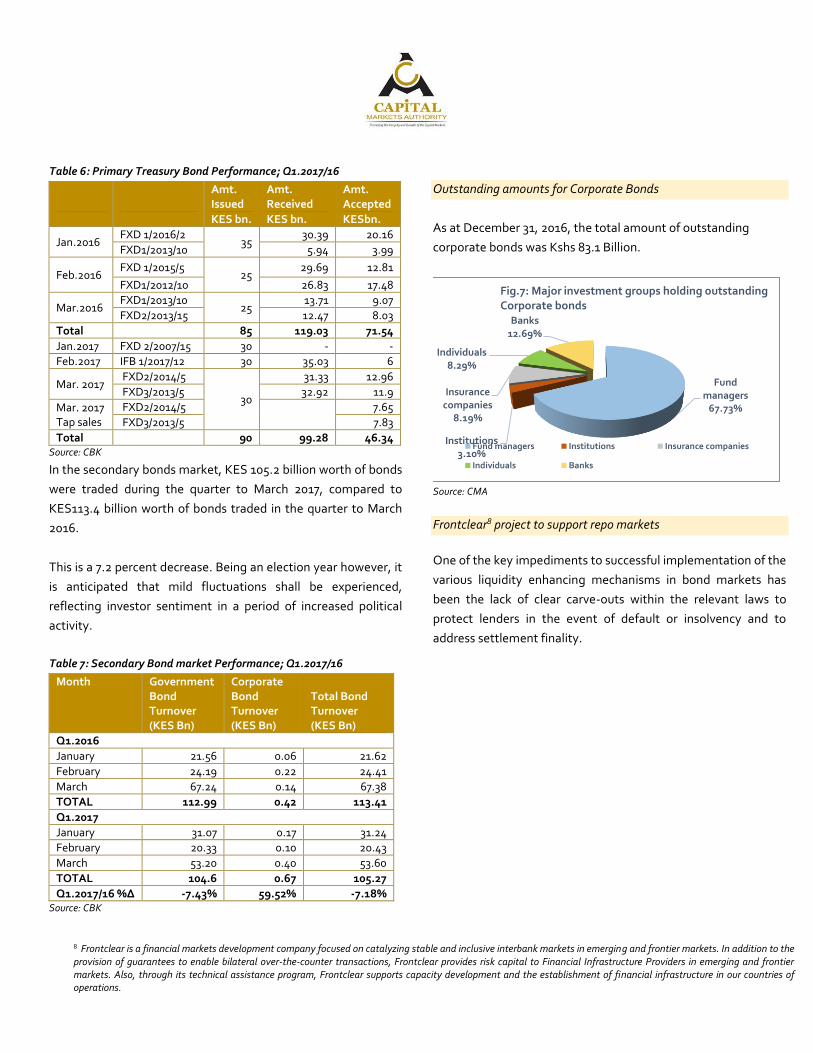
Table 6: Primary Treasury Bond Performance; Q1.2017/16
Amt. Issued
Amt. Received
Amt. Accepted
KES bn. KES bn. KESbn.
Jan.2016 FXD 1/2016/2
35 30.39 20.16
FXD1/2013/10 5.94 3.99
Feb.2016 FXD 1/2015/5
25 29.69 12.81
FXD1/2012/10 26.83 17.48
Mar.2016 FXD1/2013/10
25 13.71 9.07
FXD2/2013/15 12.47 8.03
Total 85 119.03 71.54
Jan.2017 FXD 2/2007/15 30 - -
Feb.2017 IFB 1/2017/12 30 35.03 6
Mar. 2017 FXD2/2014/5
30
31.33 12.96
FXD3/2013/5 32.92 11.9
Mar. 2017 Tap sales
FXD2/2014/5
7.65
FXD3/2013/5 7.83
Total 90 99.28 46.34 Source: CBK
In the secondary bonds market, KES 105.2 billion worth of bonds
were traded during the quarter to March 2017, compared to
KES113.4 billion worth of bonds traded in the quarter to March
2016.
This is a 7.2 percent decrease. Being an election year however, it
is anticipated that mild fluctuations shall be experienced,
reflecting investor sentiment in a period of increased political
activity.
Table 7: Secondary Bond market Performance; Q1.2017/16
Month Government Bond Turnover (KES Bn)
Corporate Bond Turnover (KES Bn)
Total Bond Turnover (KES Bn)
Q1.2016
January 21.56 0.06 21.62
February 24.19 0.22 24.41
March 67.24 0.14 67.38
TOTAL 112.99 0.42 113.41
Q1.2017
January 31.07 0.17 31.24
February 20.33 0.10 20.43
March 53.20 0.40 53.60
TOTAL 104.6 0.67 105.27
Q1.2017/16 %Δ -7.43% 59.52% -7.18% Source: CBK
8 Frontclear is a financial markets development company focused on catalyzing stable and inclusive interbank markets in emerging and frontier markets. In addition to the provision of guarantees to enable bilateral over-the-counter transactions, Frontclear provides risk capital to Financial Infrastructure Providers in emerging and frontier markets. Also, through its technical assistance program, Frontclear supports capacity development and the establishment of financial infrastructure in our countries of operations.
Outstanding amounts for Corporate Bonds
As at December 31, 2016, the total amount of outstanding
corporate bonds was Kshs 83.1 Billion.
Source: CMA
Frontclear8 project to support repo markets
One of the key impediments to successful implementation of the
various liquidity enhancing mechanisms in bond markets has
been the lack of clear carve-outs within the relevant laws to
protect lenders in the event of default or insolvency and to
address settlement finality.
Fund managers
67.73%
Institutions 3.10%
Insurance companies
8.19%
Individuals 8.29%
Banks 12.69%
Fig.7: Major investment groups holding outstanding Corporate bonds
Fund managers Institutions Insurance companies
Individuals Banks
9
In Kenya, there has been a compelling need for a
comprehensive review of all laws affecting SLB, REPOs and
other collateralized lending including but not limited to
Insolvency Act, Companies Act, Capital Markets Act, Central
Depositories Act, Kenya Deposit Insurance Act, among other
laws that may affect effective roll-out of the different liquidity
enhancing mechanisms. To address this challenge, through the
Bond Market Steering Committee, CMA has received technical
assistance from Frontclear4 for a robust and legal review of the
relevant clauses of the Kenyan law to facilitate effective
insolvency netting and set-off for securities transactions in
Kenya.
10
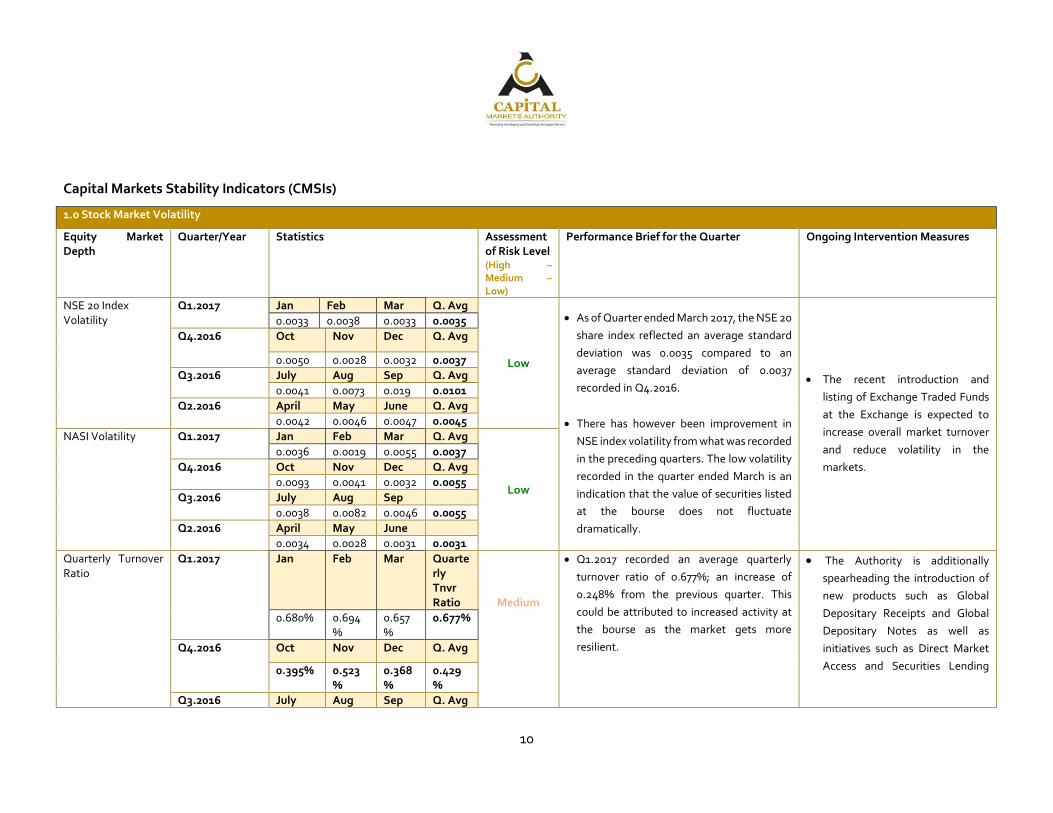
Capital Markets Stability Indicators (CMSIs)
1.0 Stock Market Volatility
Equity Market Depth
Quarter/Year Statistics Assessment of Risk Level (High – Medium – Low)
Performance Brief for the Quarter Ongoing Intervention Measures
NSE 20 Index Volatility
Q1.2017
Jan Feb Mar Q. Avg
Low
As of Quarter ended March 2017, the NSE 20
share index reflected an average standard
deviation was 0.0035 compared to an
average standard deviation of 0.0037
recorded in Q4.2016.
There has however been improvement in
NSE index volatility from what was recorded
in the preceding quarters. The low volatility
recorded in the quarter ended March is an
indication that the value of securities listed
at the bourse does not fluctuate
dramatically.
The recent introduction and
listing of Exchange Traded Funds
at the Exchange is expected to
increase overall market turnover
and reduce volatility in the
markets.
0.0033 0.0038 0.0033 0.0035
Q4.2016 Oct Nov Dec Q. Avg
0.0050 0.0028 0.0032 0.0037
Q3.2016 July Aug Sep Q. Avg
0.0041 0.0073 0.019 0.0101
Q2.2016 April May June Q. Avg
0.0042 0.0046 0.0047 0.0045
NASI Volatility Q1.2017
Jan Feb Mar Q. Avg
Low
0.0036 0.0019 0.0055 0.0037
Q4.2016 Oct Nov Dec Q. Avg
0.0093 0.0041 0.0032 0.0055
Q3.2016 July Aug Sep
0.0038 0.0082 0.0046 0.0055
Q2.2016 April May June
0.0034 0.0028 0.0031 0.0031
Quarterly Turnover Ratio
Q1.2017
Jan Feb Mar Quarterly Tnvr Ratio
Medium
Q1.2017 recorded an average quarterly
turnover ratio of 0.677%; an increase of
0.248% from the previous quarter. This
could be attributed to increased activity at
the bourse as the market gets more
resilient.
The Authority is additionally
spearheading the introduction of
new products such as Global
Depositary Receipts and Global
Depositary Notes as well as
initiatives such as Direct Market
Access and Securities Lending
0.680% 0.694%
0.657%
0.677%
Q4.2016
Oct Nov Dec Q. Avg
0.395% 0.523%
0.368%
0.429%
Q3.2016 July Aug Sep Q. Avg
11
0.664% 0.908%
0.856%
0.809%
and Borrowing to further enhance
liquidity. Q2.2016
April May June Q. Avg
0.494% 0.479%
0.864%
0.612%
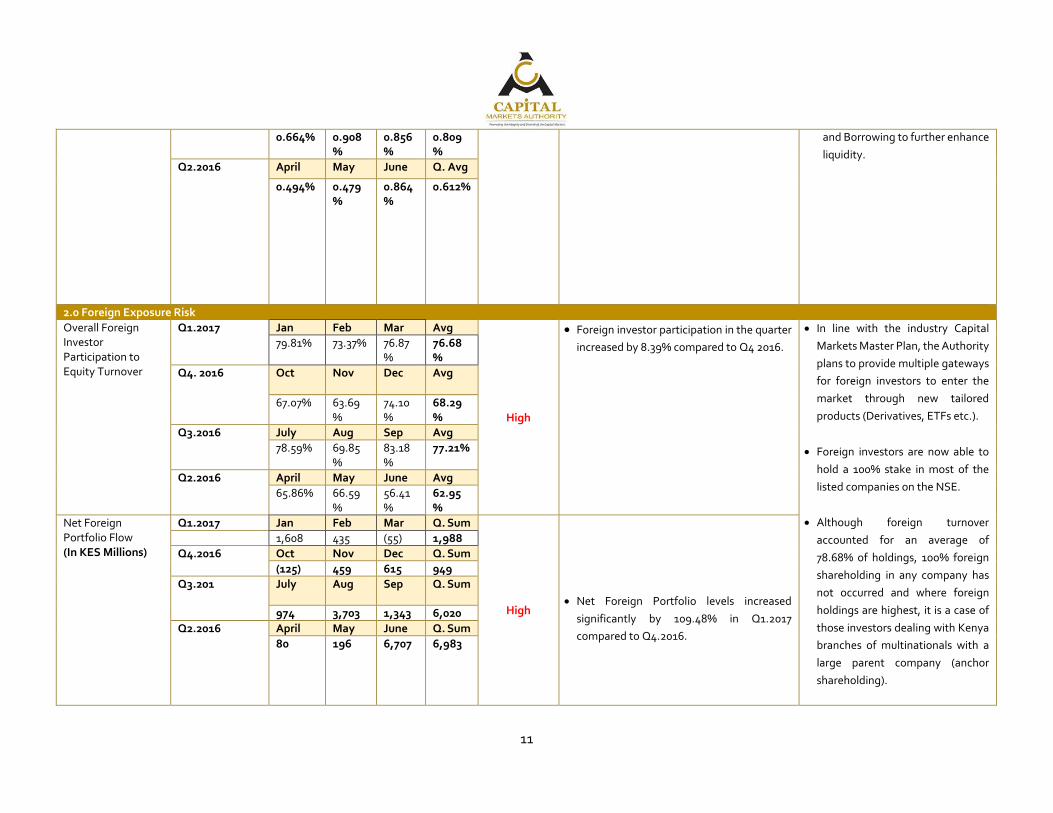
2.0 Foreign Exposure Risk
Overall Foreign Investor Participation to Equity Turnover
Q1.2017
Jan Feb Mar Avg
High
Foreign investor participation in the quarter
increased by 8.39% compared to Q4 2016.
In line with the industry Capital
Markets Master Plan, the Authority
plans to provide multiple gateways
for foreign investors to enter the
market through new tailored
products (Derivatives, ETFs etc.).
Foreign investors are now able to
hold a 100% stake in most of the
listed companies on the NSE.
Although foreign turnover
accounted for an average of
78.68% of holdings, 100% foreign
shareholding in any company has
not occurred and where foreign
holdings are highest, it is a case of
those investors dealing with Kenya
branches of multinationals with a
large parent company (anchor
shareholding).
79.81% 73.37% 76.87%
76.68%
Q4. 2016 Oct
Nov
Dec
Avg
67.07% 63.69%
74.10%
68.29%
Q3.2016 July Aug Sep Avg
78.59% 69.85%
83.18%
77.21%
Q2.2016 April May June Avg
65.86% 66.59%
56.41%
62.95%
Net Foreign Portfolio Flow (In KES Millions)
Q1.2017 Jan Feb Mar Q. Sum
High
Net Foreign Portfolio levels increased
significantly by 109.48% in Q1.2017
compared to Q4.2016.
1,608 435 (55) 1,988
Q4.2016
Oct Nov Dec Q. Sum
(125) 459 615 949
Q3.201 July Aug Sep Q. Sum
974 3,703 1,343 6,020
Q2.2016
April May June Q. Sum
80 196 6,707 6,983
12
In addition, in 2015, the Ministry of
Foreign Affairs launched the Kenya
National Diaspora Policy whose
main objective is to mainstream
and empower Kenyans aboard to
effectively make significant
contributions to the development
of the country. The Authority aims
to work with the Ministry to ensure
implementation of key aspects in
the policy that will attract more
participation by Kenyans abroad in
the capital markets.
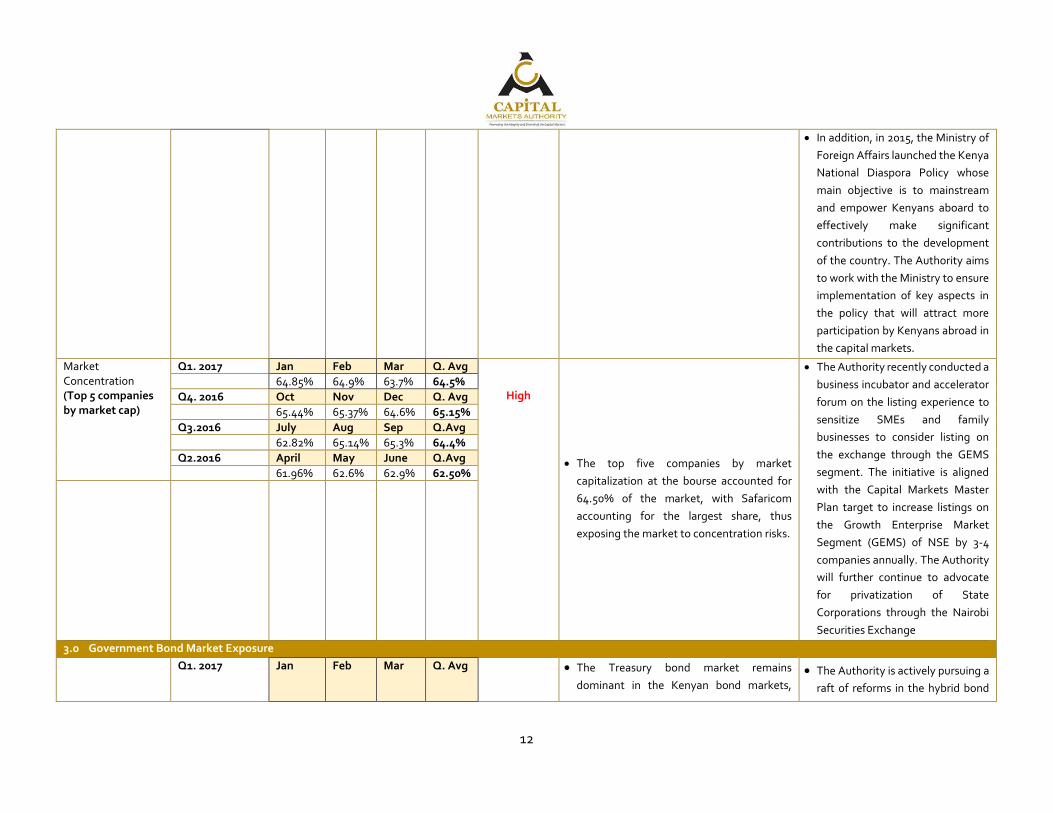
Market Concentration (Top 5 companies by market cap)
Q1. 2017 Jan Feb Mar Q. Avg
High
The top five companies by market
capitalization at the bourse accounted for
64.50% of the market, with Safaricom
accounting for the largest share, thus
exposing the market to concentration risks.
The Authority recently conducted a
business incubator and accelerator
forum on the listing experience to
sensitize SMEs and family
businesses to consider listing on
the exchange through the GEMS
segment. The initiative is aligned
with the Capital Markets Master
Plan target to increase listings on
the Growth Enterprise Market
Segment (GEMS) of NSE by 3-4
companies annually. The Authority
will further continue to advocate
for privatization of State
Corporations through the Nairobi
Securities Exchange
64.85% 64.9% 63.7% 64.5%
Q4. 2016 Oct Nov Dec Q. Avg
65.44% 65.37% 64.6% 65.15%
Q3.2016 July Aug Sep Q.Avg
62.82% 65.14% 65.3% 64.4%
Q2.2016 April May June Q.Avg
61.96% 62.6% 62.9% 62.50%
3.0 Government Bond Market Exposure
Q1. 2017 Jan Feb Mar Q. Avg
The Treasury bond market remains
dominant in the Kenyan bond markets, The Authority is actively pursuing a
raft of reforms in the hybrid bond
13
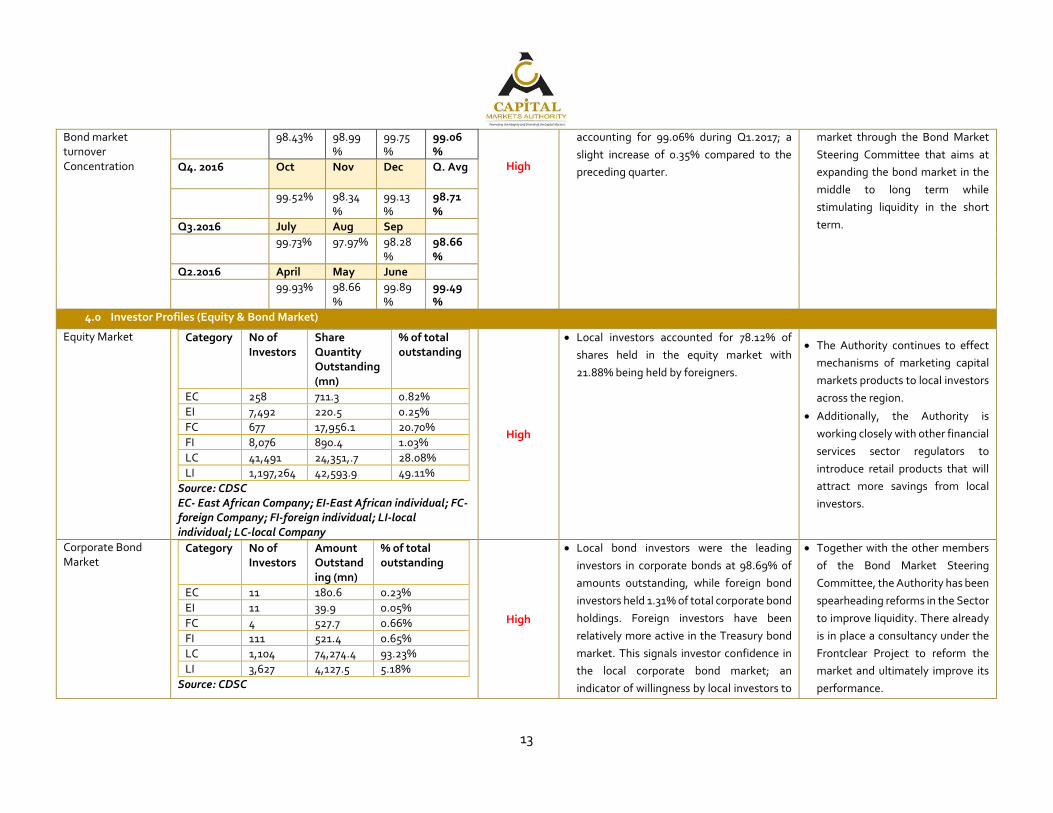
Bond market turnover Concentration
98.43% 98.99%
99.75%
99.06%
High
accounting for 99.06% during Q1.2017; a
slight increase of 0.35% compared to the
preceding quarter.
market through the Bond Market
Steering Committee that aims at
expanding the bond market in the
middle to long term while
stimulating liquidity in the short
term.
Q4. 2016 Oct
Nov
Dec
Q. Avg
99.52% 98.34%
99.13%
98.71%
Q3.2016 July Aug Sep
99.73% 97.97% 98.28%
98.66%
Q2.2016 April May June
99.93% 98.66%
99.89%
99.49%
4.0 Investor Profiles (Equity & Bond Market)
Equity Market Category No of Investors
Share Quantity Outstanding (mn)
% of total outstanding
EC 258 711.3 0.82%
EI 7,492 220.5 0.25%
FC 677 17,956.1 20.70%
FI 8,076 890.4 1.03%
LC 41,491 24,351,.7 28.08%
LI 1,197,264 42,593.9 49.11%
Source: CDSC EC- East African Company; EI-East African individual; FC-foreign Company; FI-foreign individual; LI-local individual; LC-local Company
High
Local investors accounted for 78.12% of
shares held in the equity market with
21.88% being held by foreigners.
The Authority continues to effect
mechanisms of marketing capital
markets products to local investors
across the region.
Additionally, the Authority is
working closely with other financial
services sector regulators to
introduce retail products that will
attract more savings from local
investors.
Corporate Bond Market
Category No of Investors
Amount Outstanding (mn)
% of total outstanding
EC 11 180.6 0.23%
EI 11 39.9 0.05%
FC 4 527.7 0.66%
FI 111 521.4 0.65%
LC 1,104 74,274.4 93.23%
LI 3,627 4,127.5 5.18%
Source: CDSC
High
Local bond investors were the leading
investors in corporate bonds at 98.69% of
amounts outstanding, while foreign bond
investors held 1.31% of total corporate bond
holdings. Foreign investors have been
relatively more active in the Treasury bond
market. This signals investor confidence in
the local corporate bond market; an
indicator of willingness by local investors to
Together with the other members
of the Bond Market Steering
Committee, the Authority has been
spearheading reforms in the Sector
to improve liquidity. There already
is in place a consultancy under the
Frontclear Project to reform the
market and ultimately improve its
performance.
14
EC- East African Company; EI-East African individual; FC-foreign Company; FI-foreign individual; LI-local individual; LC-local Company
participate in building locally owned
companies.
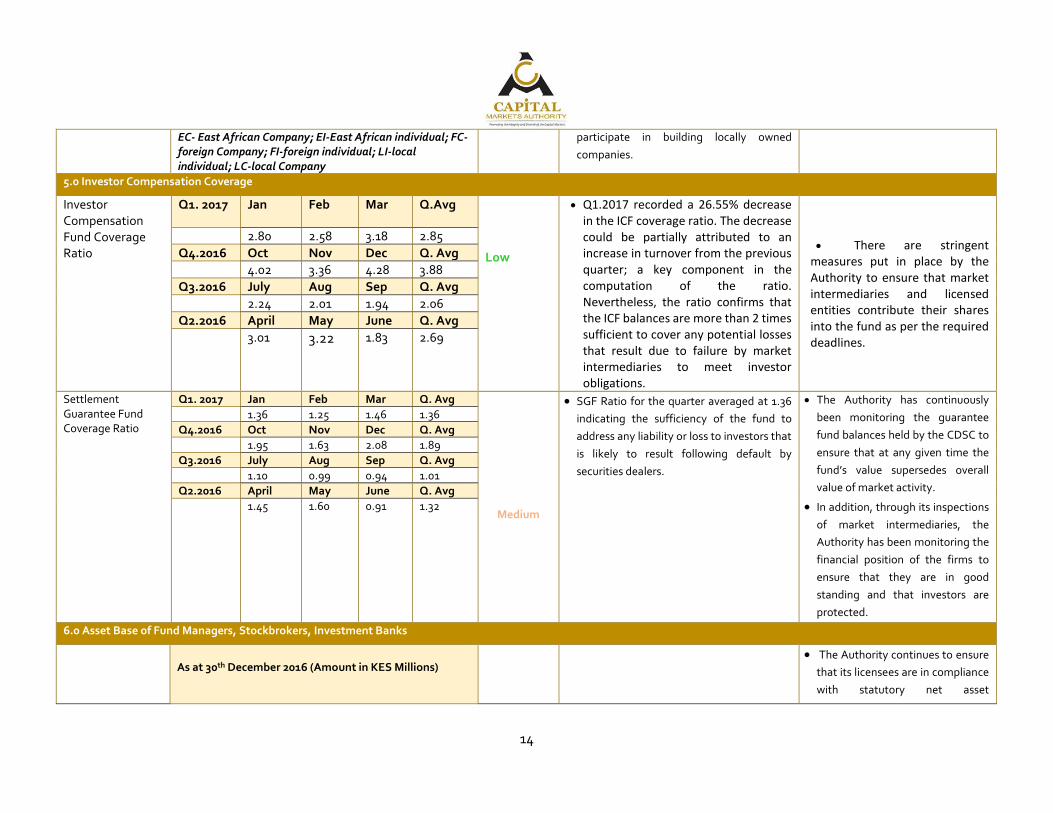
5.0 Investor Compensation Coverage
Investor Compensation Fund Coverage Ratio
Q1. 2017 Jan Feb Mar Q.Avg
Low
Q1.2017 recorded a 26.55% decrease in the ICF coverage ratio. The decrease could be partially attributed to an increase in turnover from the previous quarter; a key component in the computation of the ratio. Nevertheless, the ratio confirms that the ICF balances are more than 2 times sufficient to cover any potential losses that result due to failure by market intermediaries to meet investor obligations.
There are stringent measures put in place by the Authority to ensure that market intermediaries and licensed entities contribute their shares into the fund as per the required deadlines.
2.80 2.58 3.18 2.85
Q4.2016 Oct Nov Dec Q. Avg
4.02 3.36 4.28 3.88
Q3.2016 July Aug Sep Q. Avg
2.24 2.01 1.94 2.06
Q2.2016 April May June Q. Avg
3.01 3.22 1.83 2.69
Settlement Guarantee Fund Coverage Ratio
Q1. 2017 Jan Feb Mar Q. Avg
Medium
SGF Ratio for the quarter averaged at 1.36
indicating the sufficiency of the fund to
address any liability or loss to investors that
is likely to result following default by
securities dealers.
The Authority has continuously
been monitoring the guarantee
fund balances held by the CDSC to
ensure that at any given time the
fund’s value supersedes overall
value of market activity.
In addition, through its inspections
of market intermediaries, the
Authority has been monitoring the
financial position of the firms to
ensure that they are in good
standing and that investors are
protected.
1.36 1.25 1.46 1.36
Q4.2016 Oct Nov Dec Q. Avg
1.95 1.63 2.08 1.89
Q3.2016 July Aug Sep Q. Avg
1.10 0.99 0.94 1.01
Q2.2016 April May June Q. Avg
1.45 1.60 0.91 1.32
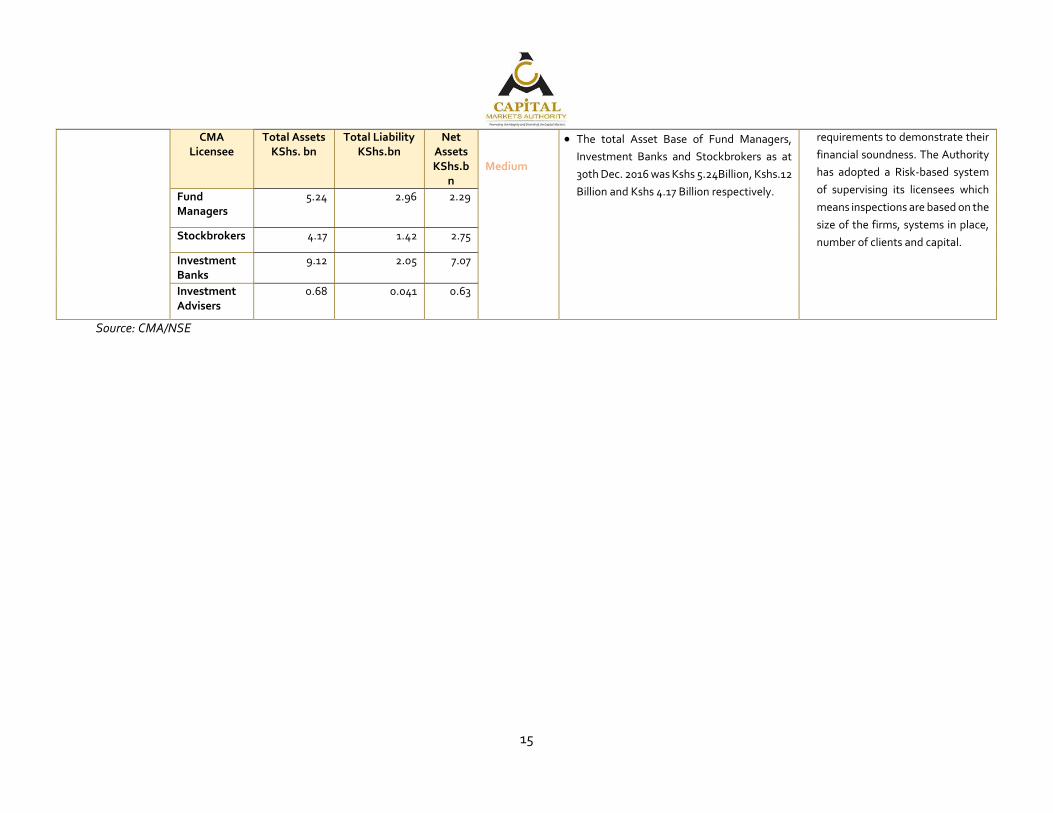
6.0 Asset Base of Fund Managers, Stockbrokers, Investment Banks
As at 30th December 2016 (Amount in KES Millions)
The Authority continues to ensure
that its licensees are in compliance
with statutory net asset
15
Source: CMA/NSE
CMA Licensee
Total Assets KShs. bn
Total Liability KShs.bn
Net Assets KShs.b
n
Medium
The total Asset Base of Fund Managers,
Investment Banks and Stockbrokers as at
30th Dec. 2016 was Kshs 5.24Billion, Kshs.12
Billion and Kshs 4.17 Billion respectively.
requirements to demonstrate their
financial soundness. The Authority
has adopted a Risk-based system
of supervising its licensees which
means inspections are based on the
size of the firms, systems in place,
number of clients and capital.
Fund Managers
5.24 2.96 2.29
Stockbrokers 4.17 1.42 2.75
Investment Banks
9.12 2.05 7.07
Investment Advisers
0.68 0.041 0.63
16
Contact Us: Capital Markets Authority (Kenya)
3rd Floor, Embankment Plaza, Upper Hill P.O BOX – 74800 00200, Nairobi
Tel – 254 – 20 – 2264900/2221910/2226225 Email – [email protected]
Website – www.cma.or.
Market Infrastructure, New Products and Systems Stability
Market Infrastructure updates
Operationalization of the Derivatives Exchange
The Authority through its Derivatives Unit held round-table
discussions with key industry stakeholders (mainly represented
by NSE and CBK) on 23rd and 24th February 2017. Several
pertinent issues were discussed during the two-day forum
including: Margin requirements of the Derivatives contracts;
management fees; and the insolvency protections available to
the Derivatives Market among others. Consequently, CMA, CBK
and NSE shall constitute a technical working group that would
regularly engage and advice the three organizations on the
various product and market structure aspects arising from
Derivatives Market.
One of the key items that was highlighted by the participants
during the forum was the development and publishing of a
benchmark deposit rate curve to be used for mark- to- market
valuation. The Authority has also had extensive discussions with
Nairobi Securities Exchange Consultants focusing on the
preparation of the Exchange for the inception of the derivative
market. Additionally, to manage the risk that the fees applicable
to derivative transactions may affect the level of uptake of
derivative instruments in the market, the Authority placed the
proposed fees under statutory public exposure from 20th January
2017 to 20th February 2017.
In addition, a robust enforcement manual for the Nairobi
Securities Exchange to operate as an SRO for the derivatives
markets is currently under development to ensure market
integrity and build a culture of fair trading and compliance.
The key risk remains the opportunity cost of delayed launch by
the market organizer, particularly for intermediaries who have
invested substantial time and resources preparing to participate
in this market. Investors have suffered a delayed opportunity to
hedge their investments and products against price volatility.
The Authority continues to engage market stakeholders,
particularly the Central Bank of Kenya, whose licensees will be
key players in the derivatives market.
It is also worth noting that, the Nairobi Securities Exchange
(NSE) has supervisory powers over the upcoming derivatives
market after it received formal recognition as a self- regulatory
organization (SRO) from the Authority in July 2016. The
recognition was given after the NSE successfully separated the
management structures for its commercial and regulatory
functions in line with the Capital Markets (Demutualization of
the Nairobi Securities Exchange Limited) Regulations of 2012.
The Authority will still be setting the fees to be paid by investors
participating in the market.
Licensing and Approvals
During the quarter, CMA approved one license - Waugh
MacDonald Limited as an Investment Advisor bringing the total
number of Investment Advisers to fourteen (14). The following
corporate actions were also approved by the Authority during
the quarter; approval of Britam’s Shareholders’ Circular on
acquisition of a 10.37% stake in Britam by IFC Group Limited and
approval of KenGen Shareholders’ Circular on acquisition of the
untaken rights (from the 2016 rights issue) by Public Investment
Corporation (PIC) South Africa. The Board of the Authority also
granted consent for the registration of Watu Capital Collective
Investment Scheme and approved the Issue and Listing of New
Gold Limited Exchange Traded Fund.
17
Already, the Authority has proactively engaged other
regulators and players in the Fintech space by seeking co-
operation and liaison with organizations and/or regulators
with experience in Fintech to benchmark on their strategy and
approach. The ultimate aim is to support FinTech and foster
innovation and participation in capital markets.
Capital Markets Role in Infrastructure Financing
Kenya’s economic blueprint, the Vision 2030 identifies key
infrastructural projects that Kenya seeks to develop by the
year 2030 such as the SGR, LAPSSET, expansion of JKIA and
modernization, dredging of the Mombasa Port, development
of Dongo Kundu Freeport, expansion of the Kisumu Airport
amongst others.
With devolved governance, county governments have equally
developed their own development plans that seek to improve
the status of infrastructural facilities.
Over the years both the National and county governments
have gone to great lengths to secure financing for such
projects; a clear indication of demand for infrastructural
finance in the country.
In many devolved countries such as Nigeria, Brazil, Philippines,
South Africa amongst others, the capital markets has played a
key role in financing infrastructure development through
municipal bonds and other structured debt financing
mechanisms.
The Authority remains committed to ensure that capital
markets raising instruments tailor made for the two levels of
governments are developed in conjunction with stakeholders
in line with its Capital Markets Master Plan (2014-2023). The
Authority will be making proposals to the Government
following stakeholders support for a national integrated
infrastructure plan that will act as a repository for all
infrastructure projects being pursued by both national and
county governments.
The centralized repository can then be shared with
prospective capital markets infrastructure who have an
appetite for investing in government debt facilities.
Other Capital Market Updates
The quarter witnessed a number of new major developments:
ETF Markets launched – As a result of coordinated efforts
between the Authority, the Nairobi Securities Exchange, Central
Depository and Settlement Corporation, the issuer and vast
stakeholder input in developing the policy guidance notes, the
first Exchange Traded Fund (ETF) in the region was launched. To
improve the understanding of this product, the Authority
together with the NSE hosted an ETFs stakeholder education
forum on 12th April 2017 targeting market intermediaries and key
capital markets stakeholders.
This event brought to Kenya one of the foremost global
authorities on ETF’s Ms. Deborah Fuhr of EFTGI. Introduction of
Exchange Traded funds in the capital markets is expected to
increase overall market turnover and reduce volatility in the
markets.
Budget delivered, major implication for Capital markets – The
National budget for FY2017/18 was read. The C.S. National
Treasury made major pronouncements, giving the go-ahead for
amendments to relevant Acts in the financial sector to allow for
the recognition and tax neutral treatment of Islamic finance
products and services and tax neutral treatment of Real Estate
Investment Trusts (REITs) and Asset Banked Securities. These
policies are aimed at attracting greater investor participation in
the sector and drawing more foreign investments.
Financial Technology (FinTech) and Regulatory Sandbox Policy
Framework under development – Kenya is renowned as the
global pace setter in FinTech innovations and will in the next
quarter issue a consultative paper on the policy and guiding
framework to support and nurture Fintech innovations under a
“regulatory sandbox” model to market stakeholders.
18
Contact Us:
Capital Markets Authority (Kenya)
3rd Floor, Embankment Plaza, Upper Hill
P.O BOX – 74800 00200, Nairobi
Tel – 254 – 20 – 2264900/2221910/2226225
Email – [email protected]
Website – www.cma.or.ke