Embed Size (px)
Citation preview
Impact of the electron donor on in situ microbial nitrate reductionin Opalinus Clay: results from the Mont Terri rock laboratory(Switzerland)
Nele Bleyen1 • Steven Smets1 • Joe Small2 • Hugo Moors1 • Natalie Leys1 •
Achim Albrecht3 • Pierre De Canniere4 • Bernhard Schwyn5 • Charles Wittebroodt6 •
Elie Valcke1
Received: 10 March 2016 / Accepted: 17 December 2016 / Published online: 24 February 2017
� The Author(s) 2017. This article is published with open access at Springerlink.com
Abstract At the Mont Terri rock laboratory (Switzerland), an
in situ experiment is being carried out to examine the fate of
nitrate leaching from nitrate-containing bituminized
radioactive waste, in a clay host rock for geological disposal.
Such a release of nitrate may cause a geochemical perturba-
tion of the clay, possibly affecting some of the favorable
characteristics of the host rock. In this in situ experiment,
combined transport and reactivity of nitrate is studied inside
anoxic and water-saturated chambers in a borehole in the
Opalinus Clay. Continuous circulation of the solution from the
borehole to the surface equipment allows a regular sampling
and online monitoring of its chemical composition. In this
paper, in situ microbial nitrate reduction in the Opalinus Clay
is discussed, in the presence or absence of additional electron
donors relevant for the disposal concept and likely to be
released from nitrate-containing bituminized radioactive
waste: acetate (simulating bitumen degradation products) and
H2 (originating from radiolysis and corrosion in the reposi-
tory). The results of these tests indicate that—in case
microorganisms would be active in the repository or the sur-
rounding clay—microbial nitrate reduction can occur using
electron donors naturally present in the clay (e.g. pyrite, dis-
solved organic matter). Nevertheless, non-reactive transport
of nitrate in the clay is expected to be the main process. In
contrast, when easily oxidizable electron donors would be
available (e.g. acetate and H2), the microbial activity will be
strongly stimulated. Both in the presence of H2 and acetate,
nitrite and nitrogenous gases are predominantly produced,
although some ammonium can also be formed when H2 is
present. The reduction of nitrate in the clay could have an
impact on the redox conditions in the pore-water and might
also lead to a gas-related perturbation of the host rock,
depending on the electron donor used during denitrification.
Keywords Nitrite � Redox � Clay � Acetate � Hydrogen �Microorganisms � Nuclear waste disposal
1 Introduction
In several countries such as Belgium and France, clay
formations are foreseen as host rocks for geological dis-
posal of bituminized intermediate-level long-lived waste
(ILW). Suitable clay formations exhibit several favorable
hydromechanical and geochemical characteristics (e.g. low
permeability, reducing chemical conditions), which delay
and spread in time the migration of released radionuclides
(De Craen et al. 2004; Andra 2005; Smith et al. 2009).
Editorial hadling: P. Bossart and A. G. Milnes.
This is paper #18 of the Mont Terri Special Issue of the Swiss Journal
of Geosciences (see Bossart et al. 2017, Table 3 and Fig. 7).
& Nele Bleyen
1 Belgian Nuclear Research Centre SCK•CEN, Boeretang 200,
2400 Mol, Belgium
2 National Nuclear Laboratory NLL, Chadwick House,
Birchwood Park, WA3 6AS Warrington, UK
3 Agence Nationale pour la Gestion des Dechets Radioactifs
Andra, 1-7, Rue Jean-Monnet,
92298 Chatenay-Malabry Cedex, France
4 Federal Agency for Nuclear Control FANC, Rue Ravenstein
36, 1000 Brussels, Belgium
5 National Cooperative for the Disposal of Radioactive Waste
NAGRA, Hardstrasse 73, 5430 Wettingen, Switzerland
6 Institut de Radioprotection et de Surete Nucleaire IRSN, 31,
Avenue de la Division Leclerc, 92260 Fontenay-Aux-Roses,
France
Swiss J Geosci (2017) 110:355–374
DOI 10.1007/s00015-016-0256-x
Besides radionuclides, the bituminized radioactive waste
under investigation here also contains a high amount of
NaNO3, dispersed inside a hydrophobic bitumen matrix
used to immobilize the waste and serving as a highly
efficient semi-permeable membrane. After saturation of the
disposal gallery, the bituminized waste will slowly start to
take up water, resulting in the dissolution and leaching of
NaNO3 (Valcke et al. 2009). In addition, soluble organic
compounds, initially present or resulting from bitumen
degradation, are expected to be released into the clay pore-
water (Valcke et al. 2000a, b). Furthermore, the production
of H2—by anaerobic metal corrosion and by radiolysis of
water and bitumen—will be unavoidable in a repository for
this type of waste.
The release of nitrate could initiate several biogeochemical
processes in the clay surrounding the waste disposal gallery,
possibly affecting some of the favorable characteristics of the
host rock. For example, the nitrate plume could affect the
redox conditions (initially reducing) of the host rock in the
vicinity of the repository due to microbial nitrate reduction
using clay components (e.g. organic matter, pyrite or other
Fe(II)-containing minerals) as electron donor (Hauck et al.
2001; Jørgensen et al. 2009; Marien et al. 2011; Zhang et al.
2012, 2013). As the reducing capacity of the undisturbed clay
formation will strongly impact the speciation, the solubility,
the retention and the transport properties of redox-sensitive
radionuclides (Se, Tc, U, Np, Pu, etc.), clay oxidation might
favor the migration of these radionuclides in the host rock (e.g.
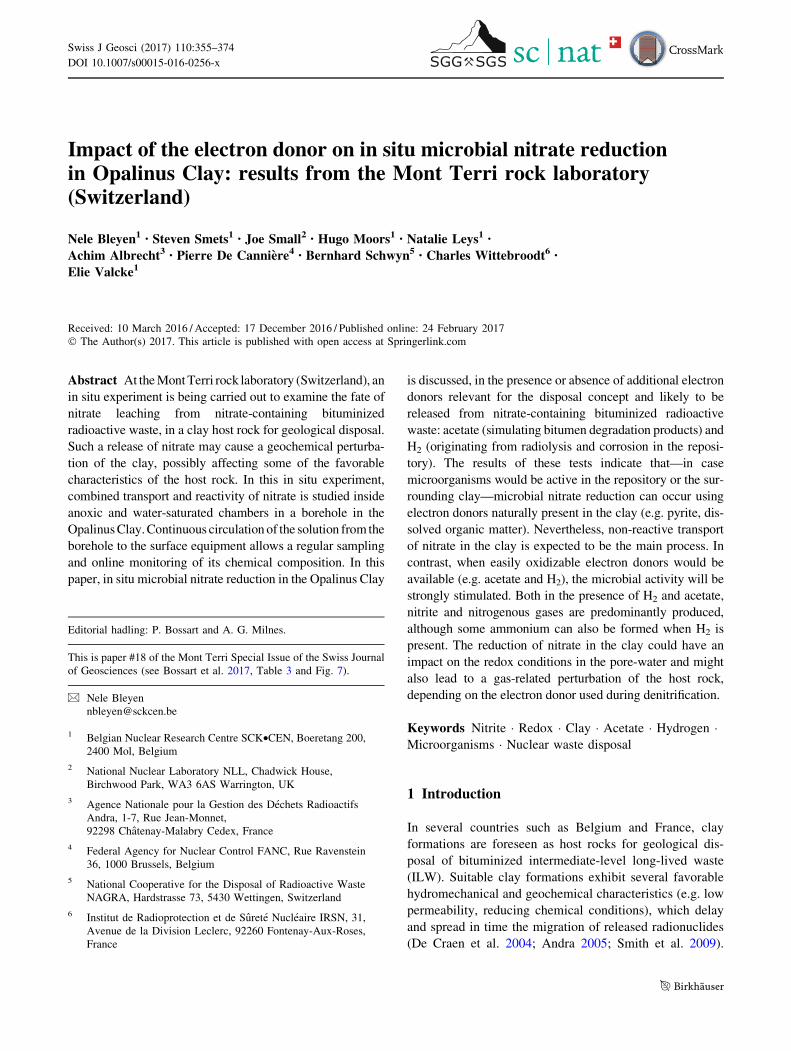
De Canniere et al. 2010). Furthermore, microbial reduction of
nitrate would either lead to the generation of nitrite [by dis-
similative nitrate reduction to nitrite (DNRN)], nitrogenous
gases (by denitrification) or ammonium [by dissimilative
nitrate reduction to ammonium (DNRA)] (Fig. 1) (Madigan
et al. 2000). The DNRN pathway usually occurs as an inter-
mediate step in the denitrification process, but can also occur
without subsequent denitrification, resulting in the accumu-
lation of nitrite (Almeida et al. 1995; Oh and Silverstein 1999).
In turn, the produced nitrite can oxidize the clay both
biotically and abiotically (Bleyen et al. 2015, 2016), again
possibly resulting in a decrease of the reducing capacity of the
clay formation. Continuous denitrification could lead to the
formation of a separate gas phase when the concentration of
produced N gases would exceed the solubility limit of the
gases. This might cause fissuring of the host rock and might
thus result in the formation of preferential pathways for
radionuclide migration (Mallants et al. 2007; Harrington et al.
2012).
To study the possible geochemical and/or gas-related
perturbations induced in the near field of a geological
repository for the disposal of nitrate-containing bitu-
minized waste, an in situ experiment, named Bitumen–
Nitrate–Clay interaction (BN) experiment, is being per-
formed in the Opalinus Clay in the Mont Terri rock labo-
ratory. This in situ experiment consists of a vertical
borehole rigged with downhole equipment containing three
packed-off chambers (or intervals) in contact with the
surrounding clay and initially filled with artificial pore-
water (APW) of the Opalinus Clay. Each interval can be
injected, circulated and monitored separately. In this paper,
the results of two such injection tests are discussed. For
this, two intervals were each injected with APW containing
NaNO3 and were later on given a pulse of either acetate or
H2. These tests provide insights into the microbial nitrate
reactivity (rate and metabolism) in the presence or in the
absence of easily biodegradable electron donors, which are
expected to be present in a repository for nitrate-containing
bituminized ILW.
2 Materials and methods
2.1 Characteristics of the Opalinus Clay at Mont
Terri
The Mont Terri Underground rock laboratory is located in
the Opalinus Clay, a Mesozoic shale formation (*174 Ma)
NO3- NO2
- NO N2O N2
H+2 H+ 2 H+
H2O H2O½ H2O
NH4+
8 H+
2 H2O
2 H+
H2O
DNRN denitrifica on denitrifica on denitrifica on
DNRA
Fig. 1 Biological pathways that reduce nitrate include dissimilative nitrate reduction to nitrite (DNRN), to gaseous N species like NO, N2O and
N2 (denitrification) and to ammonium (DNRA). Each of these pathways requires specific reductase enzymes
356 N. Bleyen et al.
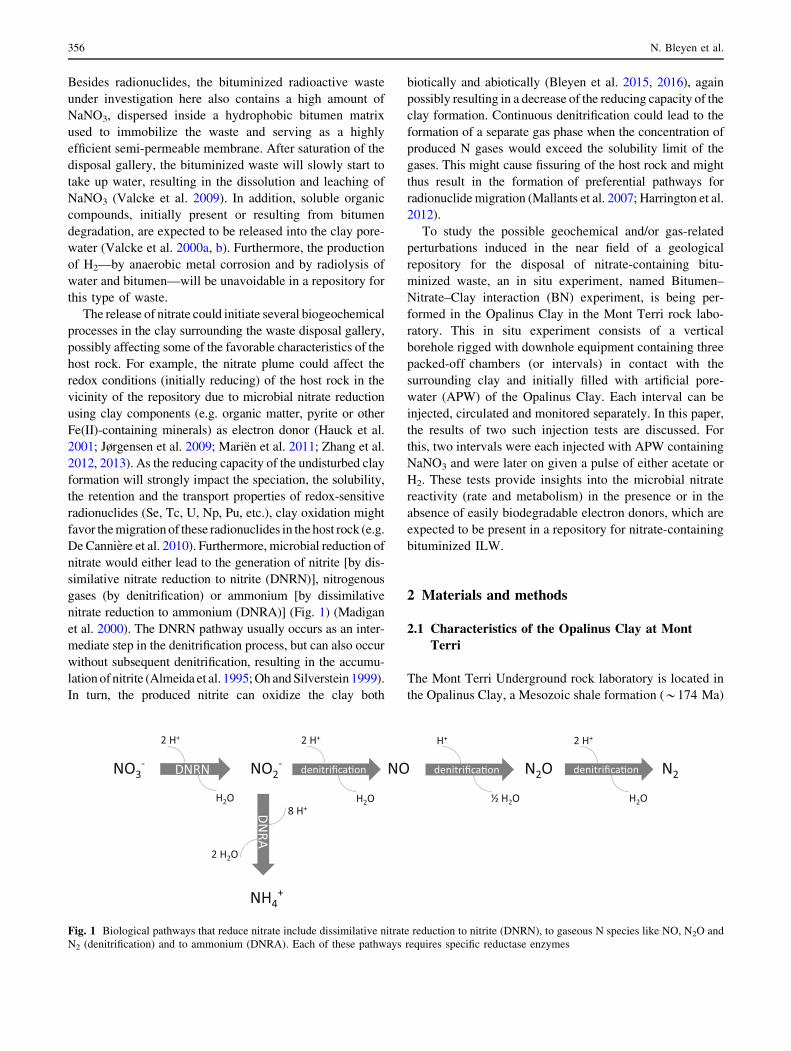
in the Jura Mountains of North-Western Switzerland. It
transects an anticline structure of the folded Jura Moun-
tains and has an overburden of max 320 m (Fig. 2). A
detailed overview of the Mont Terri rock laboratory,
including the location of the in situ experiment discussed in
this paper, is provided by Bossart et al. (2017). The
Opalinus Clay at Mont Terri is subdivided into lithological
sub-units with shaly, sandy and carbonate-rich sandy facies
(Thury and Bossart 1999). The mineral composition of
these subunits is rather similar (though not quantitatively)
and comprises mainly of quartz, illite and mixed-layer
illite–smectite, kaolinite, chlorite, biotite and muscovite,
calcite, aragonite, siderite, dolomite and/or ankerite, albite
and/or plagioclase, K-feldspar, pyrite, organic matter
(mostly kerogen), and other trace minerals like apatite
(Pearson et al. 2003).
The water collected in situ from boreholes at the Mont Terri
rock laboratory is of the NaCl type with Cl- concentrations
ranging from less than 28–310 mM and is characterized by a
near-neutral pH (7–8). The chloride concentration in a certain
borehole of the Mont Terri can be estimated from its location
in the Opalinus Clay (Pearson et al. 2003). Other major
components of the Opalinus Clay pore-water are sulfate
(concentration fixed based on the Cl- concentration and the
SO2�4 /Cl- ratio of present seawater), dissolved carbonate
species (corresponding to a pCO2 ranging from 10-1 to
10-2.7 kPa) and dissolved organic carbon (DOC; usually
below 1.7 mmol C L-1). As the concentrations of SO2�4 and
cations such as Mg2? and Ca2?, as well as the alkalinity are all
linked to the chloride content and the chloride concentration
is depending on the location in the Opalinus Clay (Pearson
1999; Pearson et al. 2003), the chemical composition of the
pore-water in the clay surrounding the BN borehole could be
estimated based on its location in the clay stratigraphy. From
this, the composition of the artificial pore-water used in the BN
experiment was derived (Table 1).
2.2 Design of the BN experiment
2.2.1 Borehole general configuration and drilling
conditions
In 2010, the BN borehole was drilled vertically in the shaly
facies of the Opalinus Clay, in the EZ-A niche of the Mont
Terri rock laboratory (location shown by Bossart et al.
2017). It is 9.8 m deep with a diameter of 400 or 76 mm,
for the first 3.5 m and the next 6.3 m under the gallery
floor respectively (Fig. 3). The small diameter borehole
(used for the BN experiment) was drilled under continuous
nitrogen flushing, to prevent oxidation of clay components
as much as possible and to preserve anaerobic microbial
communities possibly present in the clay.
2.2.2 BN downhole equipment
The BN downhole equipment consists of three packed-off
water chambers (or intervals) of 90 cm long, isolated from
each other and from the gallery by inflatable packers. Each
interval consists of a cylindrical sintered stainless steel
filter screen [porosity 40%; outer diameter (OD) 70 mm,
inner diameter (ID) 66 mm] surrounding a central stainless
steel casing (OD 60.3 mm). The packer system contains
Mont Terrirock laboratory
Alsace Molasse
Reuchette Formation
Courgenay Formation
Vellerat Formation
St-Ursanne Formation
Baerschwil Formation
Ifenthal Formation
Hauptrogenstein
Passwang Formation
Opalinus Clay
Staffelegg Formation
Klettgau Formation
Bänkerjoch Formation
Schinznach Formation
Zeglingen Formation
Kaiseraugst Formation
Basement undifferentiated
NNW SSE
Mont Territunnel
Main Fault
Permo-Carboniferous sediments ?
Permo-Carboniferous sediments ?
Cou
rgen
ay
St-U
rsan
ne
Thrust planes
Extensional faults
0
-1000
1000
m. a. s. l
500
-500
-1500
0 500 1000 1500 2000 2500 3000 3500 4000 4500 5000 m
Fig. 2 Geological cross-section of the Mont Terri anticline and location of the Mont Terri rock laboratory (Nussbaum et al. 2017)
Mont Terri, paper #18: nitrate reduction in Opalinus Clay 357

one 2-m long and two 50-cm long hydraulically inflat-
able packers (Fig. 3) made of a stainless steel central tube
surrounded by sleeves with an inner layer of natural rubber
and an outer layer of neoprene and reinforced with stainless
steel wires. After installation of the downhole equipment,
the packers were inflated individually to a pressure of
5 MPa, by injecting water using dedicated stainless steel
lines. At this pressure, the packers successfully isolate the
intervals from each other and from the gallery. This was
confirmed during later injection tests with nitrate: injection
of the middle interval (Interval 2) with 1–25 mM of nitrate
did not affect the chemical composition of the other
intervals (monitored during max 1 year).
Stainless steel water lines (OD 4 mm and ID 2.4 mm)
connect each of the downhole intervals to a water sampling
unit and an online chemical monitoring unit in the gallery.
To optimize water exchange in the intervals, both the
injection and the extraction lines are connected as close as
possible (i.e. 25 mm) to the opposite interval ends. The
injection line is located at the bottom of the interval while
the extraction line is installed at the top (Fig. 3). The water
pressure in the intervals is measured by automatic pressure
transducers (Keller AG fur Druckmesstechnik, Switzer-
land), connected to separate water lines that are also
positioned 25 mm from the top of each of the chambers of
the downhole equipment. On the bottom of Interval 1
(bottom interval), a temperature sensor (PT1000 type;
JUMO, Switzerland) has been placed (Fig. 3).
Geological and structural mapping of the BN drill core
indicated the presence of one (pre-existing) fault parallel to
the bedding plane close to Interval 1, while no fracturing
was found for Interval 2. Five bedding parallel faults are
located between 4.4 and 5.5 m below the base of the gal-
lery, which is close to Interval 3 (Phister et al. 2010).
2.2.3 BN surface equipment
A schematic overview of the BN surface equipment can be
found in Fig. 3.
The water in each of the intervals is continuously cir-
culated from the downhole equipment to the surface
equipment and back using a circulation pump (Micropump,
USA) combined with a flow meter (ABB, Switzerland).
This results in a homogenous solution and allows real-time
monitoring of its chemical composition. Furthermore, each
test circuit is equipped with 5 sampling containers (40 or
150 mL), which can be removed without causing a per-
turbation when additional chemical and/or microbial
analyses are required (Fig. 3). Additional sampling is also
possible by collecting the interval solution into an argon-
flushed sterile septum bottle via a needle valve positioned
in the water sampling unit (‘sampling port’ in Fig. 3). To
prevent fluctuations of the water pressure in the interval as
much as possible, the latter sampling method was per-
formed only at the start and at the end of the injection tests,
while bypassing the downhole equipment.
To monitor the real-time nitrate and nitrite concentra-
tions, and the redox potential and pH, an UV spectropho-
tometer and a redox and pH electrode (spectro::lyserTM;
redo::lyserTM and pH::lyserTM from S::can Messtechnik
GmbH, Austria) have been installed in the circulation of
two of the test intervals (Interval 1 and 2). When the
interval solution is circulating, it flows continuously
through the slit of the spectrophotometer, thereby passing
between the UV light source and the detector, and through
the housing chambers in which the electrodes are
immersed. Further information regarding the spectropho-
tometer and electrodes is given in Sect. 2.6.3.
To investigate the impact of H2 on the nitrate reactivity, a
Hydrogen Equilibration Unit (HEU) was installed in the
circuit of Interval 1 (Fig. 3). In this unit, the circulating
interval solution drips into a stainless steel vessel of 10 L,
filled with *1 L of solution and *9 L of gas. The gas
pressure in this vessel is monitored online by a pressure
transducer (Keller AG fur Druckmesstechnik, Switzerland;
Table 1 Chemical composition (concentrations in mM) of the arti-
ficial pore-water (APW) used to saturate the intervals [target com-
position derived from Pearson (1999) and Pearson et al. (2003)] and
of the interval solutions after saturation of the borehole and equili-
bration of the surrounding clay for *8 months
Component APW Interval 1 Interval 2 Interval 3
Na? 162 174.0 174.0 174.0
K? 1.05 1.2 1.2 1.2
Ca2? 12.6 11.7 11.0 10.7
Mg2? 8.6 9.7 9.5 9.1
Sr2? 0.4 0.4 0.4 0.4
Total dissolved Fe – n.a. n.a. \0.0004
Cl- 181 203.1 205.9 203.1
SO2�4
12.28 11.03 11.66 11.66
NO�3 – \0.01 \0.01 \0.01
NO�2 – \0.1 \0.1 \0.1
NHþ4
– n.a. n.a. 0.083
CHOO- – \0.0056 \0.0056 \0.0056
CH3COO- – \0.009 \0.009 \0.009
C2O2�4
– \0.006 \0.006 \0.006
TIC 2.8 5.2 2.8 2.8
TOC – 0.7 0.92 0.8
pH (-) 7.8 7.1 7.2 7.4
The errors on the concentrations are 4% ([SO2�4 ]), 5.5% ([NO�
3 ]), 6%
([Cl-]), 10% ([Na?], [K?], [Ca2?], [Mg2?], [Sr2?], [NHþ4 ],
[CHOO-], [CH3COO-], [C2O2�4 ] and TIC), 15% ([NO�
2 ], [total dis-
solved Fe]) and 30% (TOC) (95% confidence), while the uncertainty
on the pH is estimated to be 0.1 pH unit (95% confidence)
n.a. not analyzed
358 N. Bleyen et al.
range 0–1000 kPa) and controls the water pressure in the
interval. Dissolution of the gas into the solution is further
maximized by slowly but continuously stirring of the
solution. The H2 supply tank rests on a balance in order to
monitor the weight of the interval solution within the vessel
to determine the volume of the solution and the gas phase in
the HEU and as such to ensure that the tank does not
completely fill with gas. During the injection test with H2
(Sect. 2.5), the HEU serves both as a supply of H2 and as a
gas trap, collecting the gases produced by denitrification. To
determine the gas composition in the HEU, a gas sampling
container is connected to the HEU vessel. During tests in
the absence of H2 (e.g. tests described in Sect. 2.5.1), the
HEU was not placed in the circuit of Interval 1.
Based on the individual volumes of the equipment (se-
tup as used for the currently discussed tests) and the
Downhole equipment
0 m
3.8 m
5.8 m
6.8 m
7.3 m
8.3 m
8.8 m
9.8 m
Balance
Gas inlet
Pressuretransducer
Gas sampling container
HEU vessel
Pressuretransducer
UV spectrophotometer
pH and Eh electrode
Injectionport
Circulation pumpFlow meter
Sampling containers
Surface equipmentInterval bypass
Filter screen
Solution extraction line
Solution injection line
Pressure line
Temperaturesensor
Interval 1
Interval 2
Interval 3
Packer
Liner
Samplingport
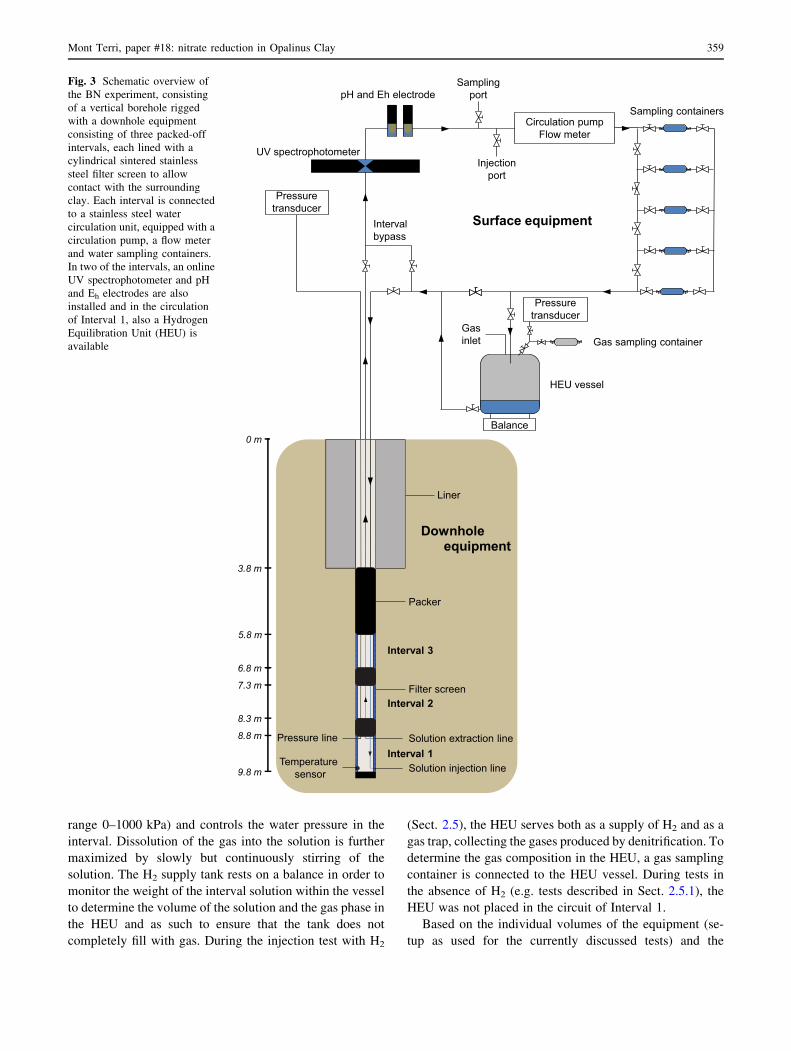
Fig. 3 Schematic overview of
the BN experiment, consisting
of a vertical borehole rigged
with a downhole equipment
consisting of three packed-off
intervals, each lined with a
cylindrical sintered stainless
steel filter screen to allow
contact with the surrounding
clay. Each interval is connected
to a stainless steel water
circulation unit, equipped with a
circulation pump, a flow meter
and water sampling containers.
In two of the intervals, an online
UV spectrophotometer and pH
and Eh electrodes are also
installed and in the circulation
of Interval 1, also a Hydrogen
Equilibration Unit (HEU) is
available
Mont Terri, paper #18: nitrate reduction in Opalinus Clay 359
dimensions of the borehole, an estimation of the initial
volume of the solution in the circuit of intervals 1 and 2
could be made, i.e. 3.3 L for Interval 1 and 2.8 L for
Interval 2, of which 1.4 L is present inside each interval.
Note that the total volumes are depending on the number of
sampling containers and/or HEU present in the circuit.
2.2.4 Prevention of organic and microbial contamination
of the borehole during installation of the experiment
Only stainless steel and neoprene were used as materials
for the downhole and gallery surface equipment to avoid
biodegradation of the equipment and thus the release and
contamination of the borehole water with dissolved organic
matter, like was observed in a previous in situ experiment
in the Mont Terri rock laboratory (De Canniere et al.
2008, 2011). To prevent additional organic and/or micro-
bial contamination of the borehole as much as possible, all
equipment (downhole and in the gallery) was cleaned
before installation by rinsing, first with acetone (to remove
traces of grease) or ethanol (disinfectant) and later thor-
oughly with deionized water to remove the cleaning sol-
vents. Before installation, all metallic parts were
additionally autoclaved, to prevent microbial contamina-
tion as much as possible. Furthermore, the housing cham-
bers of the UV spectrophotometer and electrodes were
cleaned with ethanol and subsequent rinsing with deionized
water before the start of each new test.
2.3 Saturation and equilibration of the borehole
Immediately after installation of the downhole equipment,
the three intervals were injected with APW. Its chemical
composition was derived from the location of the BN
experiment in the clay stratigraphy and the relationship
between sulfate, cations and the chloride content (Pearson
1999; Pearson et al. 2003), though without the organic
matter (Table 1). This APW was prepared, stored and
injected in the intervals anaerobically (Ar atmosphere with
[O2] \5 9 10-4 vol%) to avoid oxidation of the clay
surrounding the borehole. It was injected into the intervals
at a water pressure of 300–500 kPa (absolute). Note that no
special precautions were taken to avoid contamination with
exogenous microorganisms during preparation of the
APW.
To achieve full saturation and hydraulic equilibrium of
the interval with the surrounding clay, APW was rein-
jected when the water pressure in the interval(s) decreased
below atmospheric pressure and until the water pressure
in the intervals remained stable. After the initial injection
of Interval 1 with APW, the water pressure rapidly
decreased and stabilized at *250 kPa (absolute). In
Interval 2, three consecutive injections were needed until
the water pressure stabilized to a pressure of *130 kPa
(absolute). Note that circulation of the solution during the
injection tests resulted in a slightly higher water pressure
in both intervals.
After static water diffusion into and equilibration with
the surrounding clay at a stable water pressure for
*7 months, the APW in each interval was homogenized
by circulation at a flow rate of *5 mL min-1 for 4 weeks.
Next, each interval solution was sampled and its chemical
composition was determined.
2.4 Study of the diffusion-controlled evolution
of anionic and neutral tracers
To assess the diffusion of nitrate into the clay surrounding
the BN borehole, the diffusive behavior of non-reactive
anionic and neutral tracers in the clay was assessed. For
this, the solution in Interval 1 and 2 was replaced com-
pletely with an anaerobically prepared APW solution
containing two tracers: 15.6 mM bromide and 1600 %d2H–H2O (final concentrations in the interval). At the same
time, nitrate and/or acetate were also injected in both
intervals during the first series of injection tests with low
nitrate concentrations (described in Sect. 2.5.1, test codes
INT1_2011 and INT2_2011a in Table 2).
Table 2 Overview of the discussed in situ tests performed for the BN experiment
Test code Interval NO�3 NO�
2 CH3COO- H2
(dissolved)
Start date Time of e- donor pulse Sterility
solution
injected
Parallel injection
of tracers
INT1_2011 1 1.5 – – – 2011-03-16 No pulse injection Not sterile Br- and 2H–H2O
INT1_2014 1 15 – – 2.3 2014-10-01 54 days Sterile –
INT1_2015 1 15 – – 1.6 2015-09-23 48 days Sterile Br-
INT2_2011a 2 1.1 0.8 0.8 – 2011-03-16 No pulse injection Not sterile Br- and 2H–H2O
INT2_2011b 2 1.1 – 0.3 – 2011-05-31 No pulse injection Sterile –
INT2_2013 2 25 – 4 – 2013-11-05 70 days Sterile –
The indicated concentrations (in mM) of nitrate, nitrite, acetate and dissolved H2 are the final concentrations after injection and dilution in the
interval
360 N. Bleyen et al.
The injected solution was initially pressurized at a
higher pressure (*400 kPa) compared to the water pres-
sure in the intervals, possibly resulting in some initial
advective loss of solution. After injection, the interval
solution was equilibrated overnight at a flow rate of
*7 mL min-1. The next day, the water pressure was
decreased to more or less the in situ pressure while sam-
pling the interval solutions and re-injecting new solution
using the needle valves. Since then, the interval solutions
were circulated continuously at a flow rate of
*10 mL min-1. Throughout this diffusion experiment, the
water pressure in the interval remained more or less stable:
256 ± 40 kPa in Interval 1 and 208 ± 30 kPa in Interval
2. Some fluctuations of the water pressure occurred how-
ever due to small changes in the flow rate and to a small
water pressure increase (by *50 kPa) in Interval 2 caused
by denitrification after injection of nitrate and acetate
during the first series of injection tests (Sect. 2.5.1). Sam-
ples of the interval solutions were taken regularly to
monitor the decrease of the tracer concentration.
In September 2015, the diffusive behavior of bromide
was re-examined in Interval 1, during a second injection
test with nitrate and H2 (duplicate test for test INT1_2014
but not discussed in this paper; test code INT1_2015 in
Table 2). In contrast to the first diffusion test, only the
solution in the surface equipment was replaced by a new,
sterile APW solution containing NaNO3 and *29 mM
bromide. Dilution and overnight equilibration with the
remaining interval solution (at a flow rate of *40 mL min-1)
resulted in a final concentration of 17.02 mM bromide.
During injection and equilibration, the interval solution
was pressurized at *550 kPa, possibly resulting in some
advective loss. Afterwards, the water pressure in the
interval was decreased to *370 kPa while sampling the
solution and re-injecting new solution. Since then, the
interval solution was circulated continuously at a flow rate
of *10 mL min-1. During the first *10 days, the water
pressure increased slightly to 404 ± 15 kPa and remained
more or less stable afterwards. At the start of the pulse
injection with H2, the average water pressure in the interval
was not affected, although at the time of the pulse, some
water pressure fluctuations were observed due to temporary
changes in the pressure of the HEU. At the end of the pulse
injection with H2, the water pressure had increased slightly
(to 472 ± 28 kPa) upon switching to an Ar atmosphere in
the HEU vessel (see Sect. 2.5.3). To monitor the decrease
of the tracer concentration, samples of the interval solution
were taken regularly by disconnecting sampling containers.
The diffusion data of the tracers have been modeled
with the Generalized Repository Model (GRM) (Small
et al. 2008). This model of the BN experiment represents
the geometry of Interval 1 and 2 including the volumes
of the circulating fluid, the filter and an assumed void
space adjacent to the borehole with a 1-dimensional finite
difference grid. The Opalinus Clay is represented by 20
model cells that increase exponentially in length from
5 mm for the first cell to 730 mm in the last cell. Each
successive cell is 1.3 times the length of the preceding cell
and the 20 cells cover a total of 3.16 m of clay. This model
configuration was compared with a model of shorter length
(10 cm) and a radial diffusion model, configured in
PHREEQC (Tournassat et al. 2011), which showed that
effects of boundary conditions and radial diffusion were
not significant over a 100-day time scale. A porosity of
0.17 was assumed for the Opalinus Clay (Pearson et al.
2003; Van Loon et al. 2004a) and pore diffusion coeffi-
cients for the clay were fitted to the bromide and d2H–H2O
data.
2.5 Injection of Interval 1 and 2 with a
nitrate-containing solution
2.5.1 Previous injection tests with low nitrate
concentrations
In the first series of tests (not discussed in detail in this paper),
the biogeochemical evolution of the solution in the intervals
was investigated after injection with low concentrations of
nitrate (and/or nitrite) (up to 1.5 mM NO�3 ) with (Interval 2)
or without (Interval 1) acetate (details in Table 2, tests
INT1_2011, INT2_2011a and INT2_2011b). During the first
test in both intervals, tracers were co-injected to perform
diffusion tests. Details regarding the injection of the intervals
can be found in Sect. 2.4. The C/N ratio of the nitrate and
acetate-containing APW solution used in Interval 2 was 0.4
or 0.8 in the 2 consecutive tests in this interval (INT2_2011a
and INT2_2011b). The injected APW solutions were pre-
pared anaerobically. In the first test in both Interval 1 and 2
(Table 2), no special precautions were taken to avoid
external contamination with microorganisms. For all later
tests, a sterile nitrate-containing APW solution was used to
inject the intervals, to prevent further externally influenced
changes in the microbial community.
The results of these tests indicated that microbial
reduction of nitrate and nitrite can occur in the intervals of
the BN experiment, using acetate and/or clay components
as electron donors. Comparing the evolution in nitrate and
nitrite concentrations in the absence or in the presence of
acetate, clearly indicates faster reaction rates of microbial
nitrate reduction when the system is fueled with acetate.
The observed nitrate reduction rates in these preliminary
tests are summarized in Table 3. In these tests, nitrate was
reduced to nitrite, ammonium and/or nitrogenous gases.
Furthermore, high concentrations of nitrate-reducing
prokaryotes were detected after injection of the intervals
with nitrate, indicating that the nitrate (and nitrite)
Mont Terri, paper #18: nitrate reduction in Opalinus Clay 361
reduction, observed during all tests, was microbially
mediated. More details are given by Bleyen et al. (2011).
2.5.2 Injection tests with high nitrate concentrations
In the second series of injection tests, which are discussed
in this paper, sterile APW with higher nitrate concentra-
tions was injected in Interval 1 and 2 (Table 2). For these
tests, injection of the intervals was performed by replacing
the solution in the surface equipment with a new APW
solution containing NaNO3 while bypassing the downhole
equipment. The solutions for injection of Interval 1 and 2
contained 31 and 59 mM NaNO3 respectively, and were
filter sterilized after preparation. This way, the microbial
population present in the intervals would not be disturbed.
Care was taken to prevent O2 and microbial contamination
during injection.
After replacement of the solution in the surface equip-
ment, the solution was circulated (at 40 mL min-1)
through the interval to mix it with the remaining solution in
the downhole equipment, resulting in a dilution of the
injected solution. About 10 h after injection (i.e. overnight
homogenization of the new with the old solution), samples
of the interval solution were taken and the flow rate was
decreased to 10 mL min-1. This flow rate was maintained
during the remainder of the tests. The nitrate concentration
after dilution and overnight homogenization is considered
to be the starting concentration of the test, i.e. 15 and
25 mM NO�3 for Interval 1 and 2 respectively, as indicated
in Table 2. The water pressure in Interval 1 and 2 was 308
and 166 kPa respectively, at the start of the injection tests
(after overnight equilibration of the injected solution).
2.5.3 Pulse injection with H2 or acetate
For the tests in Interval 1 and 2 that are subject to further
discussion in this paper (see Sect. 2.5.2), a pulse injection
with a certain electron donor (H2 and acetate) was per-
formed after a few months of circulation with only nitrate.
This way, the impact of an additional electron donor on the
microbial nitrate reactivity was monitored in one single
test. In Interval 1, the addition of H2 was performed by
changing the head space in the HEU vessel from argon to
100% H2. For this, the head space was repeatedly evacu-
ated to a pressure of *4 kPa and filled with pure H2, while
keeping the inlet and outlet valves of the HEU closed. The
pressure of H2 in the vessel at the start of the pulse was
320 kPa. After restarting the circulation through the HEU,
dissolved H2 circulated the system together with the
interval solution. Based on Henry’s law [with kH =
0.00073 M atm-1 at 14 �C (Lide and Frederikse 1995)],
the initial concentration of dissolved H2 can be calculated:
i.e. 2.3 mM dissolved H2. This information, combined with
the free gas volume in the HEU vessel (9 L) and the total
volume of the interval solution at the time of the pulse
(estimated to be 2.8 L), allows us to calculate the total
initial amount of moles of H2 present in the circuit after
switching to a H2 atmosphere in the HEU: 1.2 mol H2 of
which 7 mmol H2 were dissolved in the circulated solution.
This dissolved H2 fraction was replenished each time the
solution passed through the HEU, but decreased when the
partial pressure of H2 in the gas phase decreased during the
experiment. After *10 mM of nitrate was reduced (24
days later) H2 was removed from the circuit by bypassing
the HEU. At this time, the gas phase of the HEU vessel was
sampled and subsequently switched again to an argon
atmosphere (same method as for the H2 pulse).
The pulse injection of acetate in Interval 2 was per-
formed after 70 days by reconnecting one of the sampling
containers (40 mL) containing freshly prepared APW with
nitrate at the concentration present in the interval at the
time of reconnection (i.e. 16 mM NO�3 ), and 310 mM
sodium acetate. After dilution of the added acetate in the
remaining interval solution by circulating the solution for
4 h at 40 mL min-1, the concentration was *80 times
diluted to a final concentration of 4 mM acetate. The C/N
ratio in the interval solution was 0.4. Afterwards, the flow
rate was decreased again to 10 mL min-1.
Throughout the tests, samples of the interval solution
were taken regularly by disconnecting sampling containers.
All collected samples were stored at *4 �C and under
anaerobic conditions prior to the chemical and microbio-
logical analyses, to slow down as much as possible any
(microbially mediated) reaction. Furthermore, the nitrate
and nitrite concentrations and the pH and Eh were moni-
tored online, enabling sampling of the interval solution at
appropriate times.
Table 3 Summary of the average nitrate reduction rates (in
mM day-1) observed in the in situ tests of the BN experiment, either
in the absence or in the presence of additional electron donors, i.e.
acetate or H2, as indicated in Table 2
Test code NO�3 reduction rate in
absence of additional
electron donors
NO�3 reduction rate in
presence of additional
electron donors
INT1_2011 0.04 –
INT1_2014 0.02 0.2–0.7
INT2_2011a – 0.8
INT2_2011b – 1
INT2_2013 0.02 1.2
362 N. Bleyen et al.
2.6 Monitoring of the in situ chemical composition
2.6.1 Chemical analyses of sampled solution
The chemical analyses of the sampled solutions were per-
formed as soon as possible after sampling. Subsamples of the
solution were taken under an anaerobic atmosphere and ana-
lyzed at SCK•CEN by ion chromatography (IC) for SO2�4 ,
Cl-, Br-, acetate, NO�3 and NO�
2 , by inductively coupled
plasma atomic emission spectroscopy (ICP-AES) for Na?,
K?, Ca2?, Mg2?, Sr2? and dissolved Fe(total), by ion selec-
tive electrode (ISE) for NHþ4 and by TOC/TIC analyzer with
UV persulfate digestion for TOC (total organic carbon) and
TIC (total inorganic carbon). To monitor the diffusion of
deuterated water into the surrounding clay, isotope ratio mass
spectrometry (relative to the VSMOW standard) was per-
formed by Hydroisotop GmbH (Germany).
2.6.2 Analyses of dissolved gases
To detect the presence of certain dissolved gases (N2, N2O,
CO2, H2, O2) in the interval solutions during the tests, the
solution was equilibrated with a gas phase, either (1) in a
sampling container after disconnection from the circuit (for
Interval 2) or (2) in the gas phase of the HEU (for Interval
1).
To equilibrate the dissolved and gaseous gas fractions in
a sampling container, the headspace method [adapted from
(Xiong et al. 2006)] was applied, followed by micro gas
chromatography with a thermal conductivity detector at
SCK•CEN for analysis of N2O and N2 concentrations. For
the headspace method, a volume of * 10 mL of the
solution in the sampling container was removed, while
allowing Ar gas to flow into the created headspace. The
dissolved gases were equilibrated with the headspace
atmosphere during one week at 4 �C (to prevent additional
microbial activity) followed by 4 h at 19 �C while soni-
cating. Afterwards, the gas phase was sampled for analysis.
The concentration of dissolved gases in the interval solu-
tion was derived using Henry’s law [with kH (N2-
) = 0.00056 M atm-1 and kH (N2O) = 0.021 M atm-1 at
19 �C (Wilhelm et al. 1977)].
To determine the gas composition in the gas phase of the
HEU vessel, the head space of the vessel was sampled
before replacing the gas in the vessel by argon (at the end
of the pulse with H2). The gas phase was analyzed by gas
chromatography with a thermal conductivity detector (for
H2, O2, N2, CO2, N2O) at Hydroisotop GmbH (Germany).
The concentration of the dissolved gases was calculated
using Henry’s law applying the following values for kH (at
14 �C): H2: 0.00073 M atm-1; O2: 0.0010 M atm-1; N2:
0.00052 M atm-1; CO2: 0.025 M atm-1; N2O:
0.018 M atm-1 (Wilhelm et al. 1977; Lide and Frederikse
1995).
2.6.3 Online monitoring of nitrate and nitrite
concentrations and pH
A multi-parameter UV spectrophotometer (spectro::ly-
serTM, S::can Messtechnik GmbH, Austria) was used for
the high-resolution online measurements of nitrate and
nitrite. The spectro::lyserTM records the UV light absor-
bance in the wavelength range between 200 and 400 nm,
and displays the results in real time. The measurement of
the nitrate and nitrite concentrations is based on the tur-
bidity-compensated absorbance of 5–7 wavelengths per
parameter (between 210 and 245 nm) using an algorithm
specifically adapted for BN waters, provided by the man-
ufacturer. Further calibration was performed before each
injection test to obtain accurate measurements and long-
term stability of the results. In addition, a cross-checked
calculation of the nitrite concentration is possible, based on
the normalized absorbance at 245 nm. More details are
given by Bleyen et al. (in preparation).
To monitor changes in pH and redox potential in the
interval solutions, an online pH and Eh probe (respectively
pH::lyserTM and redo::lyserTM, S::can Messtechnik GmbH,
Austria) was used. These probes contain a Refex reference
system (Refex Sensors Ltd, Ireland), separating the test
solution from the Ag/AgCl reference electrode compart-
ment by means of ceramic frit junctions covered with a
chemically stable Refex polymeric interface (consisting of
a polyvinyl acetate resin and doped with KCl). The sta-
bility and long-term performance of this type of electrodes
under in situ conditions are discussed in detail by Bleyen
et al. (in preparation).
2.7 Evaluation of the microbial community
Microbiological analyses were performed on the sampled
solutions to monitor the evolution of the microbial com-
munity upon changes in the water composition and to
verify the presence of an active microbial community.
These analyses included ATP measurements [method
according to Wouters et al. (2013)], cultivation-based
techniques and DNA-based molecular biology methods.
2.7.1 Cultivation-based methods
The metabolic versatility of the bacterial community was
determined using a 5-log dilution and threefold biological
replicates (i.e. Most Probable Number (MPN) determina-
tion) in four different anaerobic cultivation media: (1) LB
medium (Bertani 1951) for detection of heterotrophic
Mont Terri, paper #18: nitrate reduction in Opalinus Clay 363
anaerobic microorganisms; (2) R2A medium (Reasoner
and Geldreich 1985) for slow-growing microbes; (3)
Medium 63 (Deutsche Sammlung von Mikroorganismen
und Zellkulturen) for the cultivation of sulfate-reducing
prokaryotes (SRP); (4) N43 medium (Heylen et al. 2006) to
detect nitrate-reducing prokaryotes. All media contained
activated resazurin (1 mg L-1) as redox indicator to verify
anoxicity. The inoculated dilutions were incubated at
30 �C for minimally 4 weeks, after which the turbidity and
gas formation and/or precipitation of end products in the
media was assessed and the microbial concentration was
calculated using the method provided by Garthright and
Blodgett (2003).
2.7.2 DNA-based microbial community analysis
DNA was extracted from the sampled interval solution
applying an in-house developed nucleic acid extraction
procedure using potassium ethyl xanthogenate as described
by Wouters et al. (2013). This DNA was amplified by
polymerase chain reaction (PCR) using universal primers
for the bacterial 16S rDNA gene. To be able to detect
changes in the microbial community during the different
phases of the tests, highly conserved primer sequences
were chosen, yielding amplicons covering several variables
regions of the 16S rDNA gene. Two types of DNA-based
microbial community analyses have been applied for the
tests described in this paper: Illumina MiSeq high
throughput sequencing (Interval 1) and barcoded 454
FLX ? high throughput sequencing (Interval 2) (Moors
et al. 2015b).
For the solutions sampled from Interval 1, 464-bp
fragments covering the variable regions V3 and V4 of the
16S rDNA gene were first amplified by PCR. For this, the
341F and 785R primers described by Klindworth et al.
(2012) and extended with the necessary overhanging
adapters were used: 341F 50-TCGTCGGCAGCGTCAGA
TGTGTATAAGAGACAGCCTACGGGNGGCWGCAG-
30 and 785R 50-GTCTCGTGGGCTCGGAGATGTGTA
TAAGAGACAGGACTACHVGGGTATCTAATCC-30.Details regarding the PCR conditions are described by
Klindworth et al. (2012). Afterwards, a DNA sequencing
library was prepared by performing a second PCR, linking
an index to either side of the amplicons, according to the
instructions of LGC (United Kingdom) who subsequently
performed the MiSeq Illumina DNA sequencing.
For the solutions of Interval 2, DNA was amplified
yielding 1151-bp fragments of the 16S rDNA gene,
including the variable regions V3–V6. The primers for this
PCR were FLX-1492R (50-ATGGAACAATGCTGAA-30)and a series of forward primers consisting of a DNA-an-
nealing part (50-CTACGGRAGGCAGCAG-30) linked to a
set of barcodes (MID 049-059; according to the
instructions of IMGM, Germany). The PCR reaction was
carried out in 50 ll volumes containing 50 vol% Phusion
29 master mix (Thermo Fisher Scientific, USA), 0.5 lM
of each primer and 50–100 ng DNA template. The fol-
lowing PCR conditions were used: initial denaturation at
98 �C for 2 min, followed by 30 cycles of denaturation
(98 �C for 30 s), annealing (52 �C for 30 s) and elongation
(72 �C for 5 min), and a final extension step at 72 �C for
5 min. After equimolar pooling of the amplicon mixtures
(each with different barcodes), IMGM (Germany) per-
formed the 454 FLX? high throughput DNA sequencing.
The obtained raw DNA sequences were treated with an
in-house developed bioinformatics pipeline, optimized to
preprocess the output of different high throughput
sequencing methods. This preprocessing included trim-
ming, denoising (NoDe (Mysara et al. 2015a) or IPED
(Mysara et al. 2016)) and chimera removal (CATCh
(2015b)). Using this software, sequences were clustered
into operational taxonomic units or OTU (Schloss and
Westcott 2011). Each OTU contains a number of sequences
indicating the abundancy of the OTU in the analyzed
sample. Each of the consensus OTU DNA sequences was
used to find the closest matching bacterial species by
BLAST against the GreenGenes database with a minimum
of 90% sequence similarity (DeSantis et al. 2006).
3 Results
3.1 Chemical composition of solution in the BN
borehole
After saturation of the intervals with APW and equilibra-
tion with the surrounding clay for *8 months, solution
was sampled from the intervals. Chemical analyses
(Table 1) show that the target composition of the APW and
thus the theoretical composition of the pore-water in the
Opalinus Clay at the location of the BN experiment do not
differ significantly from that of the equilibrated interval
solutions, except for the TIC measured in Interval 1. The
reason for this difference in TIC is yet unknown, but might
be due to an elevated presence of carbonates close to
Interval 1. Nevertheless, the chemical composition of the
water collected from the three intervals is remarkably
similar. The composition of the solutions in Intervals 1 and
2 was determined again before starting the injection tests
discussed in this paper. This showed no statistical differ-
ences with the composition of the first sampled solution
apart from a slight increase in the dissolved iron (up to 0.05
and 0.003 mM for Interval 1 and 2 respectively) and a
decrease in the sulfate concentration (by *1 mM for both
intervals). These small changes are most likely due to some
microbial activity ongoing in the interval before the start of
364 N. Bleyen et al.
the currently discussed injection tests. Indeed, microbio-
logical analyses confirmed the presence of a large popu-
lation of sulfate-reducing bacteria (strains from genera
Pseudomonas, Gracillibacter, and Desulfosporosinus) in
the sampled solution from both intervals before injection
with nitrate (Moors et al. 2015b). Furthermore, some
ammonium was found in both interval solutions (0.4 mM
in Interval 1 and 0.3 mM in Interval 2), which can be
explained by biomass degradation (Madigan et al. 2000).
The invariable (main) chemical composition of the
interval solutions confirms that geochemical stability was
reached in the BN borehole after 8 months of equilibration
with the surrounding clay. Furthermore, the composition of
the pore-water in the Opalinus Clay can indeed be deduced
with an acceptable accuracy based on its location and the
relationship between sulfate, cations and the chloride
content (Pearson 1999; Pearson et al. 2003).
The results also revealed that some organic matter had
diffused into the intervals during saturation, resulting in a
TOC concentration of *0.8 mmol C L-1 for each inter-
val, which is similar to the TOC concentrations measured
previously in boreholes in the Opalinus Clay at Mont Terri,
i.e. 0.3–3.7 mmol C L-1 (Pearson 1999; Courdouan et al.
2007; Eichinger et al. 2011). According to previous studies
made on clay aqueous extracts (Courdouan et al. 2007;
Eichinger et al. 2011), the low molecular weight (and thus
easily biodegradable) organic fraction found in Opalinus
Clay water contains highly variable concentrations of
acetate (2–31% of DOC), formate (0.2–4% of DOC) and
other small organic compounds. In contrast to these stud-
ies, no detectable concentrations of acetate, formate or
oxalate could be found in the BN interval solutions after
the saturation and equilibration period (Table 1) nor before
the start of the injection tests discussed here.
3.2 Diffusion-controlled evolution of tracers
The diffusive transport of an anion and a neutral species
into the surrounding clay was studied in 2011 by adding
bromide and deuterated water to APW injected in Interval
1 and 2 and monitoring the decrease in concentration in the
interval solution as a function of time over a period of up to
433 days. Later on, a second bromide injection test was
performed in Interval 1 (in 2015), in which the bromide
concentration was monitored during 165 days.
The tracers show a steady decrease in relative concen-
tration, which is similar for both intervals. This is consis-
tent with the diffusion of these species in the surrounding
clay, as the decrease in relative concentrations in the
interval solution is linear with the square root of time after
an initial equilibration period (*1 day). Furthermore, the
evolution of the tracer concentrations in time can be suc-
cessfully fitted using the GRM and assuming only
diffusion. This indicates that diffusive equilibration of the
interval solution and the pore-water in the surrounding clay
occurred without a significant contribution of advective
transport [more details by Small (2015)]. The results of the
first diffusion test also confirm the expected slower diffu-
sion of bromide into the clay compared to deuterated water
(Fig. 4), due to anion exclusion, i.e. the derived pore dif-
fusion coefficient of deuterated water was
1.2 9 10-10 m2 s-1, while that of bromide was 6 times
lower (2 9 10-11 m2 s-1). Both diffusion coefficients are
in the range of coefficients for, respectively, neutral and
anionic species determined previously for Opalinus Clay,
perpendicular and parallel to the bedding plane (Van Loon
et al. 2004a, b; Alt-Epping et al. 2008; Wersin et al. 2008).
Nevertheless, compared to pore diffusion coefficients
estimated for the Pore-water Chemistry (PC) experiment in
the Mont Terri rock laboratory, i.e. 2 9 10-10 m2 s-1 for
deuterated water and 9 9 10-11 m2 s-1 for bromide (Alt-
Epping et al. 2008; Tournassat et al. 2011) the pore dif-
fusion coefficients for bromide and deuterium in the BN
experiment appear to be slightly lower. The reason for this
difference is not fully understood and may reflect the
location of the BN experiment close to the sandy facies of
the Opalinus Clay.
A second injection of Interval 1 with bromide in 2015
indicates that the diffusion rate of bromide has slowed
down compared to the initial tests (Fig. 4). The pore
0
0.1
0.2
0.3
0.4
0.5
0.6
0.7
0.8
0.9
1
0 100 200 300 400
C/C 0
Time (days)
Br- 2015
Deuterated water 2011
Br- 2011
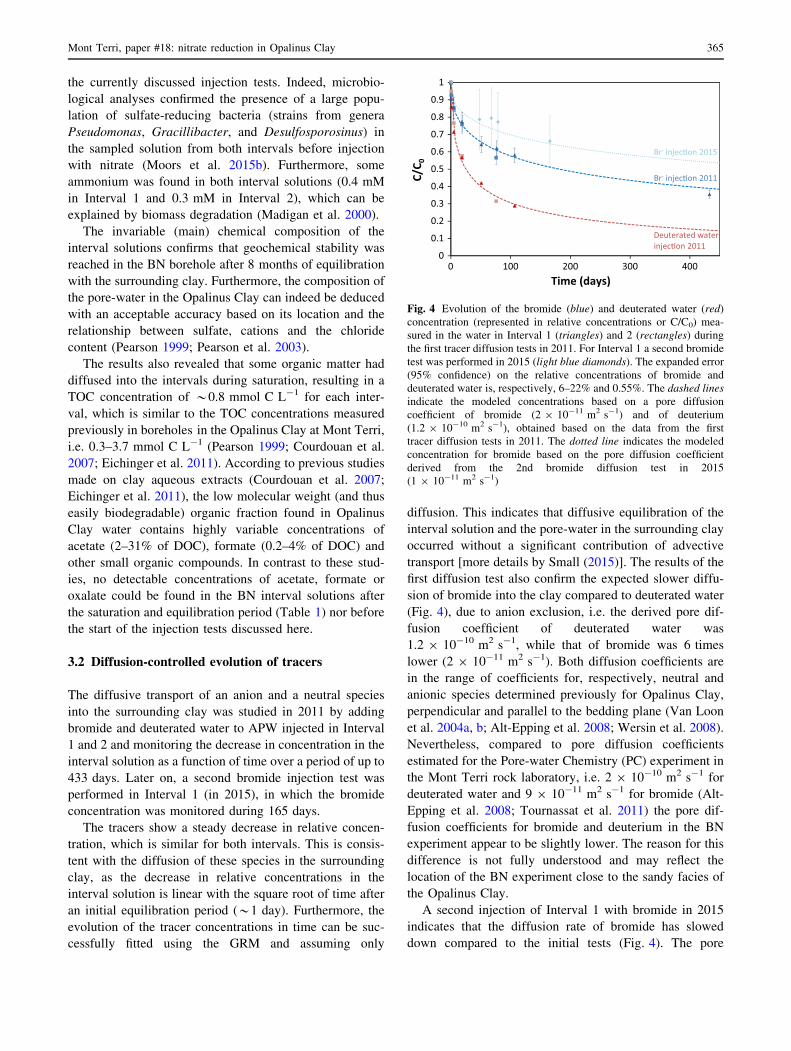
Fig. 4 Evolution of the bromide (blue) and deuterated water (red)
concentration (represented in relative concentrations or C/C0) mea-
sured in the water in Interval 1 (triangles) and 2 (rectangles) during
the first tracer diffusion tests in 2011. For Interval 1 a second bromide
test was performed in 2015 (light blue diamonds). The expanded error
(95% confidence) on the relative concentrations of bromide and
deuterated water is, respectively, 6–22% and 0.55%. The dashed lines
indicate the modeled concentrations based on a pore diffusion
coefficient of bromide (2 9 10-11 m2 s-1) and of deuterium
(1.2 9 10-10 m2 s-1), obtained based on the data from the first
tracer diffusion tests in 2011. The dotted line indicates the modeled
concentration for bromide based on the pore diffusion coefficient
derived from the 2nd bromide diffusion test in 2015
(1 9 10-11 m2 s-1)
Mont Terri, paper #18: nitrate reduction in Opalinus Clay 365
diffusion coefficient of bromide derived from this test is
1 9 10-11 m2 s-1. It is possible that this decrease in diffu-
sion coefficient is a result of clogging of the filter screen
either by creep of the Opalinus Clay, or as a result of
microbial growth or mineral alteration resulting from pre-
vious nitrate reactivity in the interval. As the nitrate injection
tests discussed in this paper were also performed 2–3 years
after the first diffusion test, such clogging could have
occurred in the meantime. Moreover, fitting of the nitrate
evolution of these injection tests indicated indeed a slower
diffusion of nitrate than expected based on the pore diffusion
coefficient derived in the first diffusion test with bromide.
Therefore, the diffusive behavior of anions in the intervals
during the currently discussed tests is assumed to be similar
to the behavior of bromide during the second diffusion test.
Hence, the pore diffusion coefficient derived for bromide
measured in 2015 (1 9 10-11 m2 s-1) has been used to
model the reactive transport behavior of nitrate and nitrite
anions in the intervals during these injection tests.
3.3 Nitrate reactivity in the BN borehole
3.3.1 Microbial community
The microbiological analyses performed on the solutions
sampled after saturation and equilibration of the intervals
have revealed the presence of an active and versatile
microbial population in the BN intervals, before the start of
the injection tests. As no special precautions were taken to
avoid contamination of the APW with exogenous
microorganisms, this population could have been intro-
duced during the first injection or installation of the
downhole equipment.
ATP measurements suggest that 2 9 105 to 7 9 105
equivalents of active cells (EAC) per milliliter solution
were present in all three intervals after saturation (Moors
et al. 2012), based on the estimation that most bacterial
cells contain 3 mM of ATP (Neidhart 1996). In addition,
MPN analyses show the presence of viable microorganisms
in every type of tested MPN medium, but especially
prokaryotes capable of reducing nitrate (5 9 104
cells mL-1 or more). Autotrophic growth capacity is pre-
sent but oligotrophic heterotrophy appears to be the pre-
ferred carbon metabolism of the residing communities in
the BN borehole after saturation with APW.
After injection of Interval 1 and 2 with, respectively, 15
and 25 mM NaNO3, a large population of nitrate-reducing
bacteria had developed in both intervals. These nitrate-re-
ducing microorganisms included predominantly Pseu-
domonas strains but also strains from the genera
Cupriavidus, Pelomonas, Undibacterium, Acidovorax,
Phenylobacterium, Brevundimonas and Corynebacterium.
When an easily oxidizable electron donor, such as acetate
or H2, was supplied as well, the microbial population
changed towards a community consisting predominantly of
species who prefer using such electron donor, e.g. species
from genera Acidovorax (after pulse of acetate) and
Clostridium (after pulse of H2) (Moors et al. 2015a). These
results indicate that the observed nitrate reduction in the
intervals is (mainly) microbially mediated and that changes
in the chemical composition of the interval solution are
rapidly responded to by a shift in the microbial community.
3.3.2 Evolution of the nitrogenous species
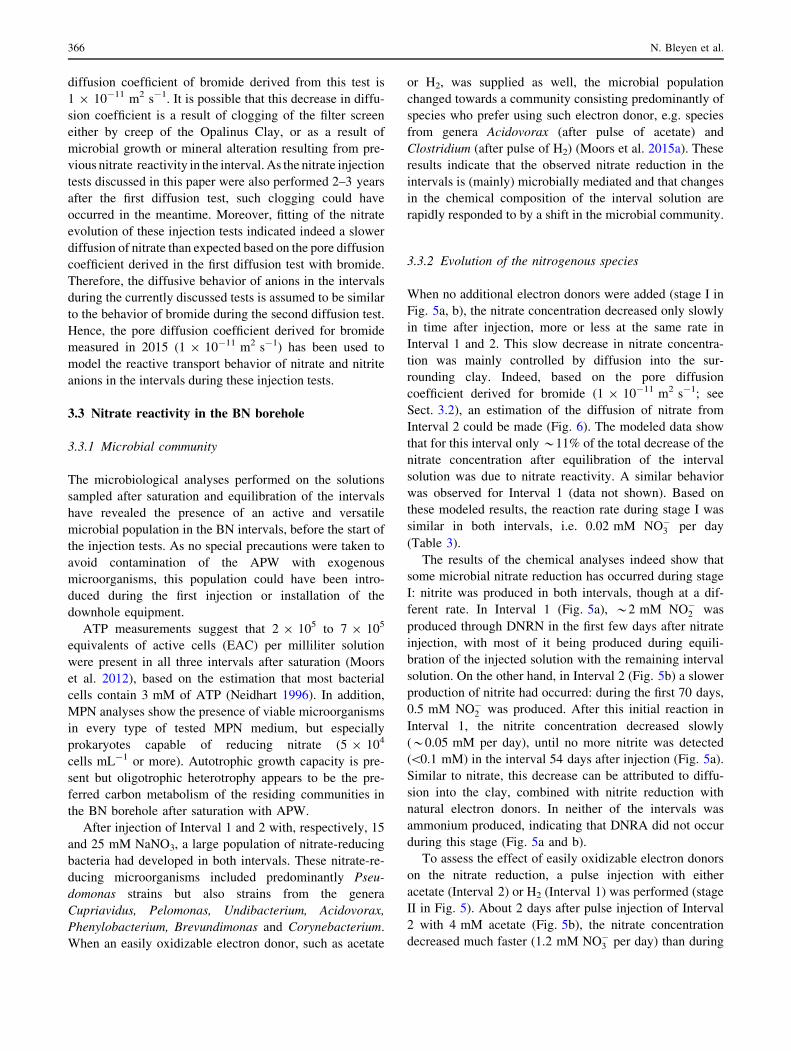
When no additional electron donors were added (stage I in
Fig. 5a, b), the nitrate concentration decreased only slowly
in time after injection, more or less at the same rate in
Interval 1 and 2. This slow decrease in nitrate concentra-
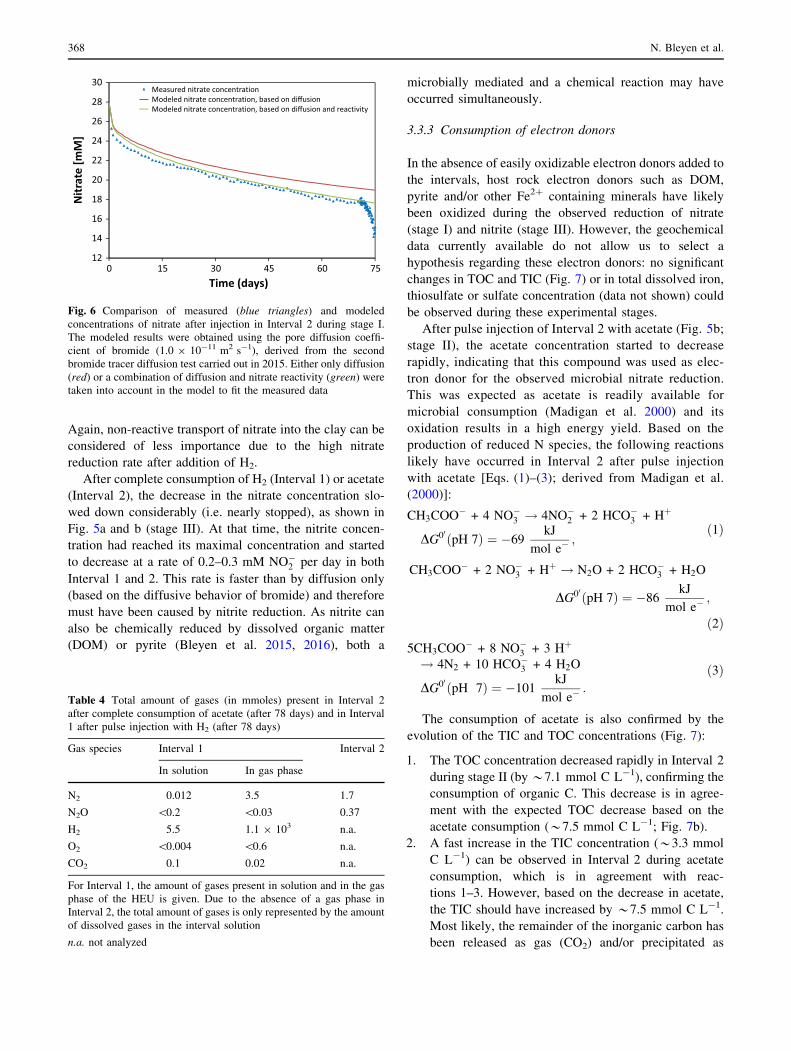
tion was mainly controlled by diffusion into the sur-
rounding clay. Indeed, based on the pore diffusion
coefficient derived for bromide (1 9 10-11 m2 s-1; see
Sect. 3.2), an estimation of the diffusion of nitrate from
Interval 2 could be made (Fig. 6). The modeled data show
that for this interval only *11% of the total decrease of the
nitrate concentration after equilibration of the interval
solution was due to nitrate reactivity. A similar behavior
was observed for Interval 1 (data not shown). Based on
these modeled results, the reaction rate during stage I was
similar in both intervals, i.e. 0.02 mM NO�3 per day
(Table 3).
The results of the chemical analyses indeed show that
some microbial nitrate reduction has occurred during stage
I: nitrite was produced in both intervals, though at a dif-
ferent rate. In Interval 1 (Fig. 5a), *2 mM NO�2 was
produced through DNRN in the first few days after nitrate
injection, with most of it being produced during equili-
bration of the injected solution with the remaining interval
solution. On the other hand, in Interval 2 (Fig. 5b) a slower
production of nitrite had occurred: during the first 70 days,
0.5 mM NO�2 was produced. After this initial reaction in
Interval 1, the nitrite concentration decreased slowly
(*0.05 mM per day), until no more nitrite was detected
(\0.1 mM) in the interval 54 days after injection (Fig. 5a).
Similar to nitrate, this decrease can be attributed to diffu-
sion into the clay, combined with nitrite reduction with
natural electron donors. In neither of the intervals was
ammonium produced, indicating that DNRA did not occur
during this stage (Fig. 5a and b).
To assess the effect of easily oxidizable electron donors
on the nitrate reduction, a pulse injection with either
acetate (Interval 2) or H2 (Interval 1) was performed (stage
II in Fig. 5). About 2 days after pulse injection of Interval
2 with 4 mM acetate (Fig. 5b), the nitrate concentration
decreased much faster (1.2 mM NO�3 per day) than during
366 N. Bleyen et al.
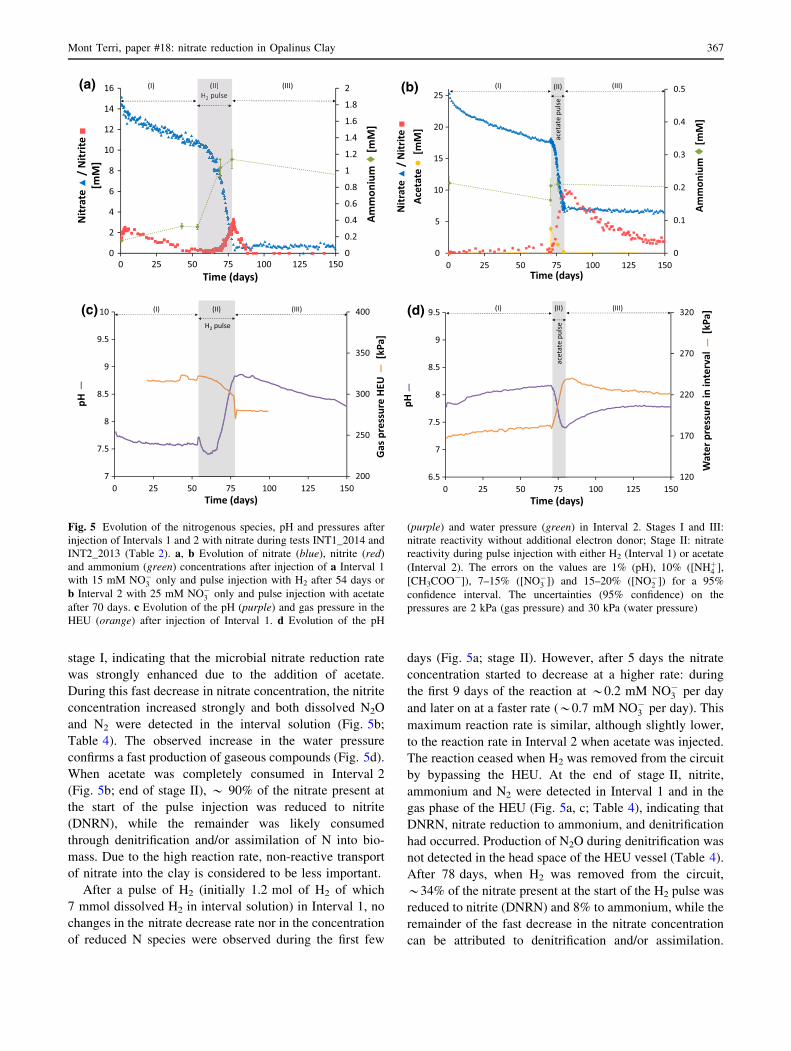
stage I, indicating that the microbial nitrate reduction rate
was strongly enhanced due to the addition of acetate.
During this fast decrease in nitrate concentration, the nitrite
concentration increased strongly and both dissolved N2O
and N2 were detected in the interval solution (Fig. 5b;
Table 4). The observed increase in the water pressure
confirms a fast production of gaseous compounds (Fig. 5d).
When acetate was completely consumed in Interval 2
(Fig. 5b; end of stage II), * 90% of the nitrate present at
the start of the pulse injection was reduced to nitrite
(DNRN), while the remainder was likely consumed
through denitrification and/or assimilation of N into bio-
mass. Due to the high reaction rate, non-reactive transport
of nitrate into the clay is considered to be less important.
After a pulse of H2 (initially 1.2 mol of H2 of which
7 mmol dissolved H2 in interval solution) in Interval 1, no
changes in the nitrate decrease rate nor in the concentration
of reduced N species were observed during the first few
days (Fig. 5a; stage II). However, after 5 days the nitrate
concentration started to decrease at a higher rate: during
the first 9 days of the reaction at *0.2 mM NO�3 per day
and later on at a faster rate (*0.7 mM NO�3 per day). This
maximum reaction rate is similar, although slightly lower,
to the reaction rate in Interval 2 when acetate was injected.
The reaction ceased when H2 was removed from the circuit
by bypassing the HEU. At the end of stage II, nitrite,
ammonium and N2 were detected in Interval 1 and in the
gas phase of the HEU (Fig. 5a, c; Table 4), indicating that
DNRN, nitrate reduction to ammonium, and denitrification
had occurred. Production of N2O during denitrification was
not detected in the head space of the HEU vessel (Table 4).
After 78 days, when H2 was removed from the circuit,
*34% of the nitrate present at the start of the H2 pulse was
reduced to nitrite (DNRN) and 8% to ammonium, while the
remainder of the fast decrease in the nitrate concentration
can be attributed to denitrification and/or assimilation.
(a)
0
0.1
0.2
0.3
0.4
0.5
0
5
10
15
20
25
0 25 50 75 100 125 150
Amm
oniu
m
[mM
]
Nitr
ate
▲/
Nitr
ite ■
Acet
ate ●
[mM
]
Time (days)
)III()I((b) (II)
acet
ate
pulse
200
250
300
350
400
7
7.5
8
8.5
9
9.5
10
0 25 50 75 100 125 150
Gas
pre
ssur
e HE
U
[k
Pa]
pH
Time (days)
)III()I((c) (II)
H2 pulse
120
170
220
270
320
6.5
7
7.5
8
8.5
9
9.5
0 25 50 75 100 125 150
Wat
er p
ress
ure
in in
terv
al
[k
Pa]
pH
Time (days)
)III()I((d) (II)
acet
ate
pulse
0
0.2
0.4
0.6
0.8
1
1.2
1.4
1.6
1.8
2
0
2
4
6
8
10
12
14
16
0 25 50 75 100 125 150
Amm
oniu
m
[mM
]
Nitr
ate
▲/
Nitr
ite ■
[mM
]
Time (days)
(I) (II)H2 pulse
(III)(II)H2 pulse
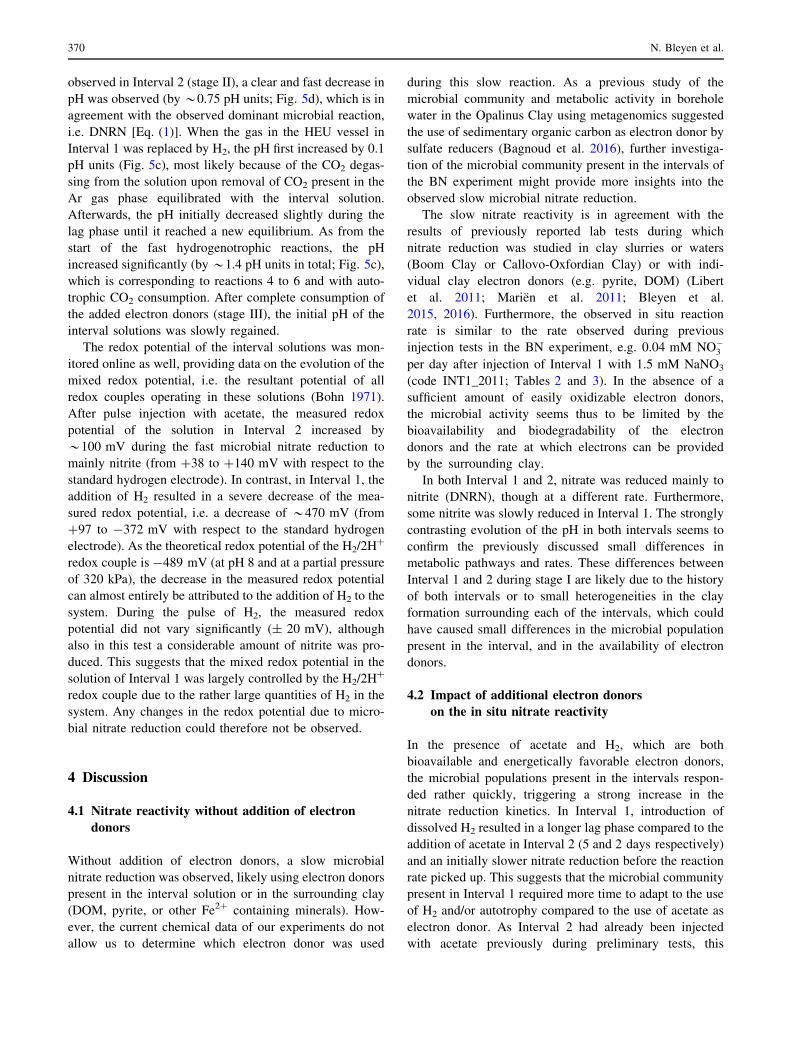
Fig. 5 Evolution of the nitrogenous species, pH and pressures after
injection of Intervals 1 and 2 with nitrate during tests INT1_2014 and
INT2_2013 (Table 2). a, b Evolution of nitrate (blue), nitrite (red)
and ammonium (green) concentrations after injection of a Interval 1
with 15 mM NO�3 only and pulse injection with H2 after 54 days or
b Interval 2 with 25 mM NO�3 only and pulse injection with acetate
after 70 days. c Evolution of the pH (purple) and gas pressure in the
HEU (orange) after injection of Interval 1. d Evolution of the pH
(purple) and water pressure (green) in Interval 2. Stages I and III:
nitrate reactivity without additional electron donor; Stage II: nitrate
reactivity during pulse injection with either H2 (Interval 1) or acetate
(Interval 2). The errors on the values are 1% (pH), 10% ([NHþ4 ],
[CH3COO-]), 7–15% ([NO�3 ]) and 15–20% ([NO�
2 ]) for a 95%
confidence interval. The uncertainties (95% confidence) on the
pressures are 2 kPa (gas pressure) and 30 kPa (water pressure)
Mont Terri, paper #18: nitrate reduction in Opalinus Clay 367
Again, non-reactive transport of nitrate into the clay can be
considered of less importance due to the high nitrate
reduction rate after addition of H2.
After complete consumption of H2 (Interval 1) or acetate
(Interval 2), the decrease in the nitrate concentration slo-
wed down considerably (i.e. nearly stopped), as shown in
Fig. 5a and b (stage III). At that time, the nitrite concen-
tration had reached its maximal concentration and started
to decrease at a rate of 0.2–0.3 mM NO�2 per day in both
Interval 1 and 2. This rate is faster than by diffusion only
(based on the diffusive behavior of bromide) and therefore
must have been caused by nitrite reduction. As nitrite can
also be chemically reduced by dissolved organic matter
(DOM) or pyrite (Bleyen et al. 2015, 2016), both a
microbially mediated and a chemical reaction may have
occurred simultaneously.
3.3.3 Consumption of electron donors
In the absence of easily oxidizable electron donors added to
the intervals, host rock electron donors such as DOM,
pyrite and/or other Fe2? containing minerals have likely
been oxidized during the observed reduction of nitrate
(stage I) and nitrite (stage III). However, the geochemical
data currently available do not allow us to select a
hypothesis regarding these electron donors: no significant
changes in TOC and TIC (Fig. 7) or in total dissolved iron,
thiosulfate or sulfate concentration (data not shown) could
be observed during these experimental stages.
After pulse injection of Interval 2 with acetate (Fig. 5b;
stage II), the acetate concentration started to decrease
rapidly, indicating that this compound was used as elec-
tron donor for the observed microbial nitrate reduction.
This was expected as acetate is readily available for
microbial consumption (Madigan et al. 2000) and its
oxidation results in a high energy yield. Based on the
production of reduced N species, the following reactions
likely have occurred in Interval 2 after pulse injection
with acetate [Eqs. (1)–(3); derived from Madigan et al.
(2000)]:
CH3COO� + 4 NO�3 ! 4NO�
2 + 2 HCO�3 + Hþ
DG00 ðpH 7Þ ¼ �69kJ
mol e�;
ð1Þ
CH3COO� + 2 NO�3 + Hþ ! N2O + 2 HCO�
3 + H2O
DG00 ðpH 7Þ ¼ �86kJ
mol e�;
ð2Þ
5CH3COO� + 8 NO�3 + 3 Hþ
! 4N2 + 10 HCO�3 + 4 H2O
DG00 ðpH 7Þ ¼ �101kJ
mol e�:
ð3Þ
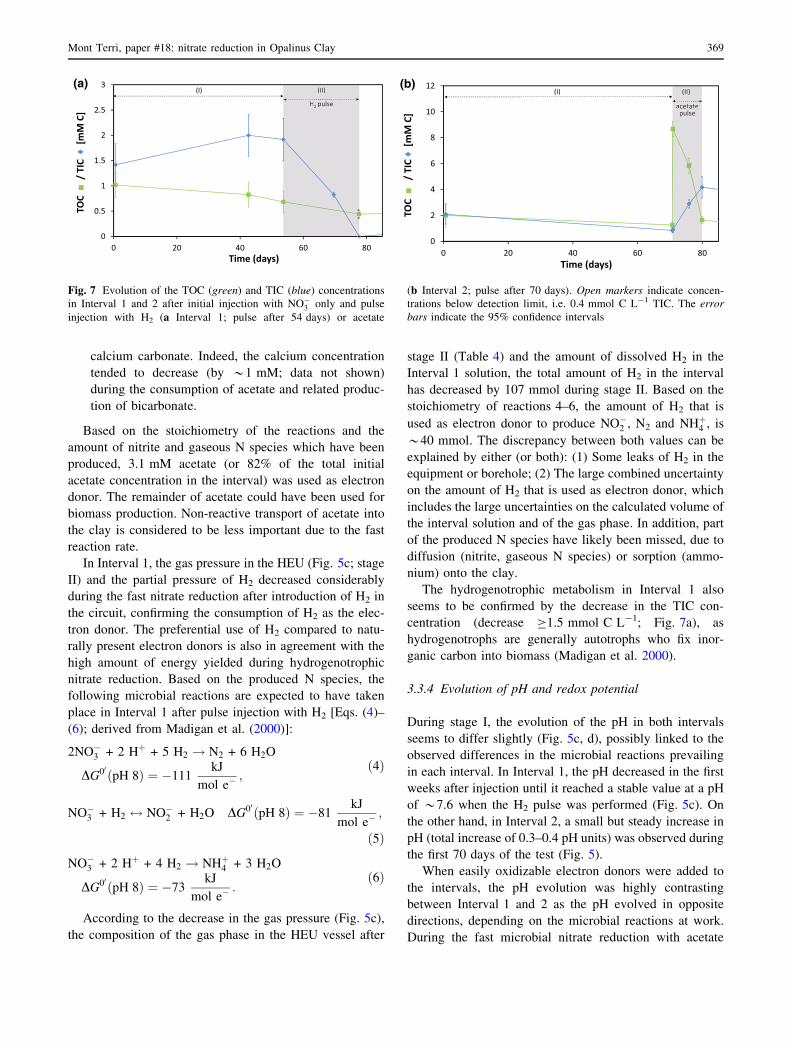
The consumption of acetate is also confirmed by the
evolution of the TIC and TOC concentrations (Fig. 7):
1. The TOC concentration decreased rapidly in Interval 2
during stage II (by *7.1 mmol C L-1), confirming the
consumption of organic C. This decrease is in agree-
ment with the expected TOC decrease based on the
acetate consumption (*7.5 mmol C L-1; Fig. 7b).
2. A fast increase in the TIC concentration (*3.3 mmol
C L-1) can be observed in Interval 2 during acetate
consumption, which is in agreement with reac-
tions 1–3. However, based on the decrease in acetate,
the TIC should have increased by *7.5 mmol C L-1.
Most likely, the remainder of the inorganic carbon has
been released as gas (CO2) and/or precipitated as
12
14
16
18
20
22
24
26
28
30
0 15 30 45 60 75
Nitr
ate
[mM
]
Time (days)
Measured nitrate concentrationModeled nitrate concentration, based on diffusionModeled nitrate concentration, based on diffusion and reactivity
Fig. 6 Comparison of measured (blue triangles) and modeled
concentrations of nitrate after injection in Interval 2 during stage I.
The modeled results were obtained using the pore diffusion coeffi-
cient of bromide (1.0 9 10-11 m2 s-1), derived from the second
bromide tracer diffusion test carried out in 2015. Either only diffusion
(red) or a combination of diffusion and nitrate reactivity (green) were
taken into account in the model to fit the measured data
Table 4 Total amount of gases (in mmoles) present in Interval 2
after complete consumption of acetate (after 78 days) and in Interval
1 after pulse injection with H2 (after 78 days)
Gas species Interval 1 Interval 2
In solution In gas phase
N2 0.012 3.5 1.7
N2O \0.2 \0.03 0.37
H2 5.5 1.1 9 103 n.a.
O2 \0.004 \0.6 n.a.
CO2 0.1 0.02 n.a.
For Interval 1, the amount of gases present in solution and in the gas
phase of the HEU is given. Due to the absence of a gas phase in
Interval 2, the total amount of gases is only represented by the amount
of dissolved gases in the interval solution
n.a. not analyzed
368 N. Bleyen et al.
calcium carbonate. Indeed, the calcium concentration
tended to decrease (by *1 mM; data not shown)
during the consumption of acetate and related produc-
tion of bicarbonate.
Based on the stoichiometry of the reactions and the
amount of nitrite and gaseous N species which have been
produced, 3.1 mM acetate (or 82% of the total initial
acetate concentration in the interval) was used as electron
donor. The remainder of acetate could have been used for
biomass production. Non-reactive transport of acetate into
the clay is considered to be less important due to the fast
reaction rate.
In Interval 1, the gas pressure in the HEU (Fig. 5c; stage
II) and the partial pressure of H2 decreased considerably
during the fast nitrate reduction after introduction of H2 in
the circuit, confirming the consumption of H2 as the elec-
tron donor. The preferential use of H2 compared to natu-
rally present electron donors is also in agreement with the
high amount of energy yielded during hydrogenotrophic
nitrate reduction. Based on the produced N species, the
following microbial reactions are expected to have taken
place in Interval 1 after pulse injection with H2 [Eqs. (4)–
(6); derived from Madigan et al. (2000)]:
2NO�3 + 2 Hþ + 5 H2 ! N2 + 6 H2O
DG00 ðpH 8Þ ¼ �111kJ
mol e�;
ð4Þ
NO�3 + H2 $ NO�
2 + H2O DG00 ðpH 8Þ ¼ �81kJ
mol e�;
ð5Þ
NO�3 + 2 Hþ + 4 H2 ! NHþ
4 + 3 H2O
DG00 ðpH 8Þ ¼ �73kJ
mol e�:
ð6Þ
According to the decrease in the gas pressure (Fig. 5c),
the composition of the gas phase in the HEU vessel after
stage II (Table 4) and the amount of dissolved H2 in the
Interval 1 solution, the total amount of H2 in the interval
has decreased by 107 mmol during stage II. Based on the
stoichiometry of reactions 4–6, the amount of H2 that is
used as electron donor to produce NO�2 , N2 and NHþ
4 , is
*40 mmol. The discrepancy between both values can be
explained by either (or both): (1) Some leaks of H2 in the
equipment or borehole; (2) The large combined uncertainty
on the amount of H2 that is used as electron donor, which
includes the large uncertainties on the calculated volume of
the interval solution and of the gas phase. In addition, part
of the produced N species have likely been missed, due to
diffusion (nitrite, gaseous N species) or sorption (ammo-
nium) onto the clay.
The hydrogenotrophic metabolism in Interval 1 also
seems to be confirmed by the decrease in the TIC con-
centration (decrease C1.5 mmol C L-1; Fig. 7a), as
hydrogenotrophs are generally autotrophs who fix inor-
ganic carbon into biomass (Madigan et al. 2000).
3.3.4 Evolution of pH and redox potential
During stage I, the evolution of the pH in both intervals
seems to differ slightly (Fig. 5c, d), possibly linked to the
observed differences in the microbial reactions prevailing
in each interval. In Interval 1, the pH decreased in the first
weeks after injection until it reached a stable value at a pH
of *7.6 when the H2 pulse was performed (Fig. 5c). On
the other hand, in Interval 2, a small but steady increase in
pH (total increase of 0.3–0.4 pH units) was observed during
the first 70 days of the test (Fig. 5).
When easily oxidizable electron donors were added to
the intervals, the pH evolution was highly contrasting
between Interval 1 and 2 as the pH evolved in opposite
directions, depending on the microbial reactions at work.
During the fast microbial nitrate reduction with acetate
0
0.5
1
1.5
2
2.5
3
0 20 40 60 80
TOC
■/
TIC
♦[m
M C
](II)
H2 pulse
(I) (II)
H2 pulse
0
2
4
6
8
10
12
0 20 40 60 80
TOC
■/
TIC ♦
[mM
C]
(II)
acetatepulse
(I) (II)
acetatepulse
Time (days) Time (days)
(a) (b)
Fig. 7 Evolution of the TOC (green) and TIC (blue) concentrations
in Interval 1 and 2 after initial injection with NO�3 only and pulse
injection with H2 (a Interval 1; pulse after 54 days) or acetate
(b Interval 2; pulse after 70 days). Open markers indicate concen-
trations below detection limit, i.e. 0.4 mmol C L-1 TIC. The error
bars indicate the 95% confidence intervals
Mont Terri, paper #18: nitrate reduction in Opalinus Clay 369
observed in Interval 2 (stage II), a clear and fast decrease in
pH was observed (by *0.75 pH units; Fig. 5d), which is in
agreement with the observed dominant microbial reaction,
i.e. DNRN [Eq. (1)]. When the gas in the HEU vessel in
Interval 1 was replaced by H2, the pH first increased by 0.1
pH units (Fig. 5c), most likely because of the CO2 degas-
sing from the solution upon removal of CO2 present in the
Ar gas phase equilibrated with the interval solution.
Afterwards, the pH initially decreased slightly during the
lag phase until it reached a new equilibrium. As from the
start of the fast hydrogenotrophic reactions, the pH
increased significantly (by *1.4 pH units in total; Fig. 5c),
which is corresponding to reactions 4 to 6 and with auto-
trophic CO2 consumption. After complete consumption of
the added electron donors (stage III), the initial pH of the
interval solutions was slowly regained.
The redox potential of the interval solutions was mon-
itored online as well, providing data on the evolution of the
mixed redox potential, i.e. the resultant potential of all
redox couples operating in these solutions (Bohn 1971).
After pulse injection with acetate, the measured redox
potential of the solution in Interval 2 increased by
*100 mV during the fast microbial nitrate reduction to
mainly nitrite (from ?38 to ?140 mV with respect to the
standard hydrogen electrode). In contrast, in Interval 1, the
addition of H2 resulted in a severe decrease of the mea-
sured redox potential, i.e. a decrease of *470 mV (from
?97 to -372 mV with respect to the standard hydrogen
electrode). As the theoretical redox potential of the H2/2H?
redox couple is -489 mV (at pH 8 and at a partial pressure
of 320 kPa), the decrease in the measured redox potential
can almost entirely be attributed to the addition of H2 to the
system. During the pulse of H2, the measured redox
potential did not vary significantly (± 20 mV), although
also in this test a considerable amount of nitrite was pro-
duced. This suggests that the mixed redox potential in the
solution of Interval 1 was largely controlled by the H2/2H?
redox couple due to the rather large quantities of H2 in the
system. Any changes in the redox potential due to micro-
bial nitrate reduction could therefore not be observed.
4 Discussion
4.1 Nitrate reactivity without addition of electron
donors
Without addition of electron donors, a slow microbial
nitrate reduction was observed, likely using electron donors
present in the interval solution or in the surrounding clay
(DOM, pyrite, or other Fe2? containing minerals). How-
ever, the current chemical data of our experiments do not
allow us to determine which electron donor was used
during this slow reaction. As a previous study of the
microbial community and metabolic activity in borehole
water in the Opalinus Clay using metagenomics suggested
the use of sedimentary organic carbon as electron donor by
sulfate reducers (Bagnoud et al. 2016), further investiga-
tion of the microbial community present in the intervals of
the BN experiment might provide more insights into the
observed slow microbial nitrate reduction.
The slow nitrate reactivity is in agreement with the
results of previously reported lab tests during which
nitrate reduction was studied in clay slurries or waters
(Boom Clay or Callovo-Oxfordian Clay) or with indi-
vidual clay electron donors (e.g. pyrite, DOM) (Libert
et al. 2011; Marien et al. 2011; Bleyen et al.
2015, 2016). Furthermore, the observed in situ reaction
rate is similar to the rate observed during previous
injection tests in the BN experiment, e.g. 0.04 mM NO�3
per day after injection of Interval 1 with 1.5 mM NaNO3
(code INT1_2011; Tables 2 and 3). In the absence of a
sufficient amount of easily oxidizable electron donors,
the microbial activity seems thus to be limited by the
bioavailability and biodegradability of the electron
donors and the rate at which electrons can be provided
by the surrounding clay.
In both Interval 1 and 2, nitrate was reduced mainly to
nitrite (DNRN), though at a different rate. Furthermore,
some nitrite was slowly reduced in Interval 1. The strongly
contrasting evolution of the pH in both intervals seems to
confirm the previously discussed small differences in
metabolic pathways and rates. These differences between
Interval 1 and 2 during stage I are likely due to the history
of both intervals or to small heterogeneities in the clay
formation surrounding each of the intervals, which could
have caused small differences in the microbial population
present in the interval, and in the availability of electron
donors.
4.2 Impact of additional electron donors
on the in situ nitrate reactivity
In the presence of acetate and H2, which are both
bioavailable and energetically favorable electron donors,
the microbial populations present in the intervals respon-
ded rather quickly, triggering a strong increase in the
nitrate reduction kinetics. In Interval 1, introduction of
dissolved H2 resulted in a longer lag phase compared to the
addition of acetate in Interval 2 (5 and 2 days respectively)
and an initially slower nitrate reduction before the reaction
rate picked up. This suggests that the microbial community
present in Interval 1 required more time to adapt to the use
of H2 and/or autotrophy compared to the use of acetate as
electron donor. As Interval 2 had already been injected
with acetate previously during preliminary tests, this
370 N. Bleyen et al.
community was already adapted to a heterotrophic meta-
bolism, which explains its faster response.
The maximal reaction rates were however similar for
both electron donors and were up to 60 times higher than
the rate observed when the in situ available electron donors
were used (Table 3). Furthermore, these reaction rates are
also similar to the rates observed during previous injection
tests (Table 2) with nitrate and acetate in Interval 2 (i.e.
0.8–1 mM NO�3 per day). The observed stimulation of the
nitrate reduction by acetate and H2 is in agreement with
previous lab tests studying nitrate reactivity in sediments
(Devlin et al. 2000; Libert et al. 2011).
In both tests with added electron donors, DNRN and
denitrification were the dominant metabolic pathways,
which was expected as they are thermodynamically
favored over DNRA. In Interval 2 (pulse of acetate), this
fast nitrate reduction resulted in an increase in the redox
potential of the interval solution, which is in agreement
with previously reported lab experiments (Percheron et al.
1998), where an increase in redox potential was observed
during sulfide-dependent DNRN and denitrification.
Nitrite accumulated in both tests through DNRN, due to
limitations in the amount of electron donor compared to that
of the electron acceptor, rendering nitrate reduction more
favorable compared to nitrite reduction. Indeed, the C/N
ratio after pulse injection of Interval 2 with acetate was 0.4,
which is lower than the ratio required to prevent nitrite
accumulation and stimulate denitrification (i.e.*1.2) as was
observed during lab experiments (Almeida et al. 1995; Oh
and Silverstein 1999). Furthermore, nitrate reductase is
reduced preferentially by electrons derived from acetate
oxidation compared to nitrite reductase, which also favors
the DNRN reaction over the subsequent denitrification
pathway (Almeida et al. 1995; Oh and Silverstein 1999),
especially when acetate is limited. Nevertheless, the accu-
mulation of nitrite in the interval (up to * 10 mM) did not
result in inhibition of the microbial reactivity, as was
observed for higher concentrations of nitrite ([20 mM)
during lab tests (Almeida et al. 1995; Parmentier et al. 2014).
In Interval 1 (pulse of H2), nitrite accumulated as well
during the fast hydrogenotrophic nitrate reduction,
although to a lesser extent than in Interval 2 (pulse of
acetate). This accumulation can again be explained by a
limitation of the amount of electron donor (i.e. H2) com-
pared to the available nitrate, due to the solubility (and thus
bioavailability) limit of H2. Indeed, previously performed
studies (Chang et al. 1999; Haugen et al. 2002; Karanasios
et al. 2011) indicated that a decrease of the dissolved H2
concentration below a certain threshold (depending on the
microbial species and other environmental conditions)
would result in a decrease in denitrification rate. Initially,
limitation of the hydrogen availability would only inhibit
nitrite reductase, resulting in accumulation of nitrite.
Lowering the dissolved H2 concentration even further
would also inhibit the hydrogenotrophic nitrate reduction
(Chang et al. 1999).
4.3 Factors influencing the microbial reactions
and their rates
The microbial nitrate reduction rates and dominant meta-
bolic pathways observed in the described experiments do
not seem to be dependent on the nitrate concentration:
similar rates in both intervals and after injection of 1
to 25 mM NO�3 were observed during the preliminary and
currently discussed injection tests. Rather the bioavail-
ability and energy yielded by oxidation of the electron
donor seem to determine the extent of the nitrate reactivity
and the metabolic pathways followed. Note that the reac-
tion rates in the near field of a geological repository for
nitrate-containing bituminized radioactive waste are likely
also controlled by the release rates of nitrate and acetate
from the waste and by the production rate of H2 in the
repository (by anaerobic corrosion of steel and radiolysis).
4.4 Implications for geological disposal of nitrate-
containing waste
The results presented in this paper indicate that microbial
nitrate-dependent oxidation of electron donors naturally
present in the Opalinus Clay is possible, though occurs
only at a slow rate. Acetate leached from the bituminized
waste and H2 produced by radiolysis of bitumen and water
and by anaerobic corrosion of the metallic waste drums
could significantly enhance the reaction kinetics. Further-
more, because of the preferential use of these electron
donors compared to naturally present electron donors, we
do not expect that the reducing capacity of the clay for-
mation would decrease significantly if sufficient amounts
of acetate and H2 are available. However, a substantial
microbially mediated reduction of nitrate with acetate has
been shown to increase the redox potential of the pore-
water. This could result in less reducing conditions in the
pore-water, which might hinder the reduction of redox-
sensitive radionuclides (e.g. Se, Tc, U, Np, Pu, etc.), in turn
favoring the migration of these radionuclides in the host
rock (Oremland et al. 1999; De Canniere et al. 2010).
Furthermore, depending on the electron donor (acetate
or H2), the denitrification reaction would lead to either a
net gas production (of N2 in case of heterotrophic reaction
with acetate) or gas consumption (of H2 in case of
hydrogenotrophic reaction). In case the gas generation rate
would be higher than its dissipation rate by diffusive
transport of the dissolved gas, the former pathway with N2
Mont Terri, paper #18: nitrate reduction in Opalinus Clay 371
production would result in the formation of a free gas
phase, and might therefore give rise to an overpressure with
a (local) gas breakthrough, possibly affecting the
radionuclide migration. On the other hand, the consump-
tion of H2 produced in a repository for bituminized ILW
would prevent a gas pressure build-up in the repository and
thus a gas-related perturbation of the clay.
5 Conclusions
Upon geological disposal of nitrate-containing bituminized
ILW in a clay formation, this type of waste will start to take
up water, leading to the dissolution of the hygroscopic salts
(e.g. NaNO3) in the bitumen matrix and subsequently to
leaching of NaNO3 into the surrounding host rock.
Although it remains uncertain whether nitrate-reducing
microorganisms can be active under the prevailing harsh
conditions for microbes in and around a repository (i.e.
high pH, high ionic strength and lack of free space),
microbial activity cannot be ruled out. The results obtained
by the BN experiment, an in situ experiment in the Opal-
inus Clay, provide insights in the biogeochemical behavior
of nitrate in a clay formation surrounding a repository for
nitrate-containing bituminized ILW, in case active micro-
bial species would be present. This paper focused on two
injection tests performed in the BN borehole, during which
microbial nitrate reactivity was investigated in the presence
or in the absence of additional electron donors relevant for
such a disposal concept, i.e. acetate (a key bitumen
degradation product) and H2 (originating from radiolysis
and anaerobic steel corrosion).
The results of these tests indicate that nitrate reacts
quickly at near neutral pH if external sources of bioavail-
able and energetically favorable electron donors, such as
acetate or H2, are present and if enough space and water are
available in the system. When only naturally present
electron donors are available, nitrate mainly diffuses into
the surrounding clay, although also some microbial nitrate
reduction (mainly to nitrite) occurs at a slow rate. Both in
the presence of H2 and acetate, nitrite and nitrogenous
gases were predominantly produced, although some
ammonium production could also be observed when H2
was added. The microbial nitrate reduction rates and
dominant metabolic pathways observed in the described
experiments are likely depending on the bioavailability and
energy-producing capacity of the electron donor present in
the system.
The observed reduction of nitrate seems to have an
impact on the redox conditions in the pore-water (i.e. an
increase of the redox potential), which might affect the
migration of radionuclides in the host rock. Furthermore,
depending on the electron donor type, denitrification could
lead to either a net gas consumption (i.e. oxidation of H2)
or production (i.e. formation of N2) in the repository. The
latter might cause an additional stress on the clay, which
could lead to gas-related perturbations of the host rock. The
observed processes of microbially mediated nitrate reduc-
tion should be taken into account during future reactive
transport modeling of the migration of (redox-sensitive)
radionuclides released from bituminized ILW in the host
rock.
Further research is necessary to study the impact of the
observed microbial nitrate reduction on the redox state of
redox-sensitive radionuclides. In addition, the nitrate
reduction rates and production of N species should be
investigated further under more realistic repository condi-
tions (e.g. high pH imposed by the use of cementitious
materials), to determine the effect of such conditions on the
microbial activity and the nitrate reactivity.
Acknowledgements This work is undertaken in close co-operation
with Swisstopo, the operator of the rock laboratory and the project
management team at Mont Terri, namely Christophe Nussbaum and
Thierry Theurillat. Financial support was provided by the Mont Terri
Consortium. Joe Small acknowledges funding by the U.K. Natural
Environment Research Council (NERC) BIGRAD consortium
through Grant No. NE/H007768/1 and the National Nuclear Labo-
ratory. Gesine Lorenz (Hydroisotop GmbH) and Elke Jacops
(SCK•CEN) are acknowledged for performing the gas analyses. In
addition, the technical assistance of Wim Verwimp and Patrick Boven
(SCK•CEN) is greatly appreciated. Finally, we thank Dr. Marc Par-
mentier (French Geological Survey BRGM, Orleans, France) and Dr.
Alexandre Bagnoud (Stream Biofilm and Ecosystem Research Lab-
oratory at EPFL, Lausanne, Switzerland) for their constructive com-
ments and suggestions.
Open Access This article is distributed under the terms of the
Creative Commons Attribution 4.0 International License (http://crea
tivecommons.org/licenses/by/4.0/), which permits unrestricted use,
distribution, and reproduction in any medium, provided you give
appropriate credit to the original author(s) and the source, provide a
link to the Creative Commons license, and indicate if changes were
made.
References
Almeida, J., Reis, M., & Carrondo, M. (1995). Competition between
nitrate and nitrite reduction in denitrification by Pseudomonas
fluorescens. Biotechnology and Bioengineering, 46, 476–484.
Alt-Epping, P., Gimmi, T., & Waber, N. (2008). Porewater chemistry
(PC) experiment: Reactive transport simulations. Mont Terri
Technical Report, TR 07-03, Federal Office of Topography
(swisstopo), Wabern, Switzerland. www.mont-terri.ch.
ANDRA (2005). Dossier 2005. ANDRA research on the geological
disposal of high-level long-lived radioactive waste. Results and
perspectives. ANDRA report, ANDRA, Chatenay-Malabry,
France.
Bagnoud, A., de Bruijn, I., Andersson, A. F., Diomidis, N., Leupin, O.
X., Schwyn, B., et al. (2016). A minimalistic microbial food web
in an excavated deep subsurface clay rock. FEMS Microbiology
Ecology, 92, fiv138.
372 N. Bleyen et al.
Bertani, G. (1951). STUDIES ON LYSOGENESIS I: The mode of
phage liberation by lysogenic Escherichia coli. Journal of
Bacteriology, 62, 293–300.
Bleyen, N., Smets, S., Albrecht, A., De Canniere, P., Schwyn, B.,
Witebroodt, C., & Valcke, E. (in preparation) Use of non-
destructive on-line spectrophotometric and pH monitoring to
assess in situ microbial nitrate and nitrite reduction. Interna-
tional Journal of Environmental Analytical Chemistry.
Bleyen, N., Smets, S., & Valcke, E. (2011). BN Experiment: Status
and raw data report of phases 15 and 16. Mont Terri Technical
Note, TN 2009-49, Federal Office of Topography (swisstopo),
Wabern, Switzerland. www.mont-terri.ch.
Bleyen, N., Vasile, M., Bruggeman, C., & Valcke, E. (2015). Abiotic
and biotic nitrate and nitrite reduction by pyrite. In: Proceedings
of the Clays in Natural and Engineered Barriers for Radioactive
Waste Confinement Conference, P-06-16.
Bleyen, N., Vasile, M., Marien, A., Bruggeman, C., & Valcke, E.
(2016). Assessing the oxidising effect of NaNO3 and NaNO2
from disposed EUROBITUM bituminised waste on the dissolved
organic matter in Boom Clay. Applied Geochemistry, 68, 29–38.
Bohn, H. L. (1971). Redox potentials. Soil Science, 112, 39–45.
Bossart, P., Bernier, F., Birkholzer, J., Bruggeman, C., Connolly, P.,
Dewonck, S., Fukaya, M., Herfort, M., Jensen, M., Matray, J-M.,
Mayor, J. C., Moeri, A., Oyama, T., Schuster, K., Shigeta, N.,
Vietor, T., & Wieczorek, K. (2017). Mont Terri rock laboratory,
20 years: introduction, geology and overview of papers included
in the Special Issue. Swiss Journal of Geosciences, 110. doi:10.
1007/s00015-016-0236-1 (this issue).
Chang, C. C., Tseng, S. K., & Huang, H. K. (1999). Hydrogeno-
trophic denitrification with immobilized Alcaligenes eutrophus
for drinking water treatment. Bioresource technology, 69, 53–58.
Courdouan, A., Christl, I., Meylan, S., Wersin, P., & Kretzschmar, R.
(2007). Characterization of dissolved organic matter in anoxic
rock extracts and in situ pore water of the Opalinus Clay.
Applied Geochemistry, 22, 2926–2939.
De Canniere, P., Schwarzbauer, J., & Van Geet, M. (2008). Leaching
experiments and analyses of organic matter released by the
materials used for the construction of Porewater Chemistry
experiment at Mont Terri Rock Laboratory. Mont Terri Tech-
nical Note, TN 2005-12. Federal Office of Topography (swis-
stopo), Wabern, Switzerland. www.mont-terri.ch.
De Canniere, P., Maes, A., Williams, S., Bruggeman, C., Beauwens,
T., Maes, N., Cowper, M. (2010). Behaviour of selenium in
Boom Clay. External Report, SCK•CEN-ER-120, 328 pp.
SCK•CEN, Boeretang 200, 2400 Mol, Belgium.
De Canniere, P., Schwarzbauer, J., Hohener, P., Lorenz, G., Salah, S.,
Leupin, O., et al. (2011). Biogeochemical processes in a clay
formation in situ experiment: part C—organic contamination and
leaching data. Applied Geochemistry, 26, 967–979.
De Craen, M., Wang, L., Van Geet, M., & Moors, H. (2004).
Geochemistry of Boom Clay pore water at the Mol site. Status
2004. Scientific report, SCK•CEN-BLG-990, 179 pp.
SCK•CEN, Mol, Belgium.
DeSantis, T. Z., Hugenholtz, P., Larsen, N., Rojas, M., Brodie, E. L.,
Keller, K., et al. (2006). Greengenes, a chimera-checked 16S
rRNA gene database and workbench compatible with ARB.
Applied and Environmental Microbiology, 72, 5069–5072.
Devlin, J., Eedy, R., & Butler, B. (2000). The effects of electron
donor and granular iron on nitrate transformation rates in
sediments from a municipal water supply aquifer. Journal of
Contaminant Hydrology, 46, 81–97.
Eichinger, F., Lorenz, G., & Eichinger, L. (2011). WS-H Experiment:
Water sampling from borehole BWS-H2—Report on physical-
chemical and isotopic analyses. Mont Terri Technical Note, TN
2010-49. Federal Office of Topography (swisstopo), Wabern,
Switzerland. www.mont-terri.ch.
Garthright, W., & Blodgett, R. (2003). FDA’s preferred MPN
methods for standard, large or unusual tests, with a spreadsheet.
Food Microbiology, 20, 439–445.
Harrington, J., Milodowski, A., Graham, C., Rushton, J., & Cuss, R.
(2012). Evidence for gas-induced pathways in clay using a
nanoparticle injection technique. Mineralogical Magazine, 76,
3327–3336.
Hauck, S., Benz, M., Brune, A., & Schink, B. (2001). Ferrous iron
oxidation by denitrifying bacteria in profundal sediments of a
deep lake (Lake Constance). FEMS Microbiology Ecology, 37,
127–134.
Haugen, K., Semmens, M., & Novak, P. (2002). A novel in situ
technology for the treatment of nitrate contaminated groundwa-
ter. Water Research, 36, 3497–3506.
Heylen, K., Vanparys, B., Wittebolle, L., Verstraete, W., Boon, N., &
De Vos, P. (2006). Cultivation of denitrifying bacteria: opti-
mization of isolation conditions and diversity study. Applied and
Environmental Microbiology, 72, 2637–2643.
Jørgensen, C. J., Jacobsen, O. S., Elberling, B., & Aamand, J. (2009).
Microbial oxidation of pyrite coupled to nitrate reduction in
anoxic groundwater sediment. Environmental Science and
Technology, 43, 4851–4857.
Karanasios, K., Michailides, M., Vasiliadou, I., Pavlou, S., &
Vayenas, D. (2011). Potable water hydrogenotrophic denitrifi-
cation in packed-bed bioreactors coupled with a solar-electrol-
ysis hydrogen production system. Desalination and Water
Treatment, 33, 86–96.
Klindworth, A., Pruesse, E., Schweer, T., Peplies, J., Quast, C., Horn,
M., et al. (2012). Evaluation of general 16S ribosomal RNA gene
PCR primers for classical and next-generation sequencing-based
diversity studies. Nucleic Acids Research, 2012, 1–11.
Libert, M., Bildstein, O., Esnault, L., Jullien, M., & Sellier, R. (2011).
Molecular hydrogen: An abundant energy source for bacterial
activity in nuclear waste repositories. Physics and Chemistry of
the Earth, Parts A/B/C, 36, 1616–1623.
Lide, D. R., & Frederikse, H. P. R. (1995). CRC handbook of
chemistry and physics. Boca Raton: CRC Press.
Madigan, M. T., Martinko, J. M., & Parker, J. (2000). Brock biology
of microorganisms. Upper Saddle River: Prentice-Hall.
Mallants, D., Jacques, D., & Perko, J. (2007). Modelling multi-phase
flow phenomena in concrete barriers used for geological disposal
of radioactive waste. Proceedings of the 11th International
Conference on Environmental Remediation and Radioactive
Waste Management (pp. 741–749). American Society of
Mechanical Engineers.
Marien, A., Bleyen, N., Aerts, S., & Valcke, E. (2011). The study of
abiotic reduction of nitrate and nitrite in Boom Clay. Physics and
Chemistry of the Earth, 36, 1639–1647.
Moors, H., Geissler, A., Boven, P., Selenska-Pobell, S., & Leys, N.
(2012). BN experiment: intermediate results of the microbio-
logical analyses. Mont Terri Technical Note, TN 2011-39.
Federal Office of Topography (swisstopo), Wabern, Switzerland.
www.mont-terri.ch.
Moors, H., Bleyen, N., Ahmed, M., Boven, P., Leys, N., Valcke, E.,
Cherkouk, A., Stroes-Gascoyne, S., Nussbaum, C., Schwyn, B.,
Albrecht, A., Wittebroodt, C., Small, J., & De Canniere, P.
(2015a). The Bitumen-Nitrate-Clay Interaction Experiment at
the Mont Terri Rock Laboratory: Response of microbial
communities to additions of nitrate and acetate. Proceedings to
the Clays in Natural and Engineered Barriers for Radioactive
Waste Confinement Conference, O-06A-03.
Moors, H., Mysara, M., Bleyen, N., Cherkouk, A., Boven, P., & Leys,
N. (2015b). BN Experiment: Results of the microbiological
analyses obtained during phase 19 & 20. Mont Terri Technical
Note, TN 2015-72. Federal Office of Topography (swisstopo),
Wabern, Switzerland. www.mont-terri.ch.
Mont Terri, paper #18: nitrate reduction in Opalinus Clay 373
Mysara, M., Leys, N., Raes, J., & Monsieurs, P. (2015a). NoDe: a fast
error-correction algorithm for pyrosequencing amplicon reads.
BMC Bioinformatics, 16, 1–10.
Mysara, M., Saeys, Y., Leys, N., Raes, J., & Monsieurs, P. (2015b).
CATCh, an ensemble classifier for chimera detection in 16S
rRNA sequencing studies. Applied and Environmental Microbi-
ology, 81, 1573–1584.
Mysara, M., Leys, N., Raes, J., & Monsieurs, P. (2016). IPED: a
highly efficient denoising tool for Illumina MiSeq Paired-end
16S rRNA gene amplicon sequencing data. BMC Bioinformatics,
17, 1–11.
Neidhart, F. (1996). Escherichia coli and Salmonella typhimurium:
Cellular and molecular biology. Washington: ASM Press.
Nussbaum, C., Kloppenburg, A., Caer, T., & Bossart, P. (2017).
Tectonic evolution around the Mont Terri rock laboratory,
northwestern Swiss Jura: constraints from kinematic forward
modelling. Swiss Journal of Geosciences, 110. doi:10.1007/
s00015-016-0248-x (this issue).
Oh, J., & Silverstein, J. (1999). Acetate limitation and nitrite
accumulation during denitrification. Journal of Environmental
Engineering, 125, 234–242.
Oremland, R. S., Blum, J. S., Bindi, A. B., Dowdle, P. R., Herbel, M.,
& Stolz, J. F. (1999). Simultaneous reduction of nitrate and
selenate by cell suspensions of selenium-respiring bacteria.
Applied and Environmental Microbiology, 65, 4385–4392.
Parmentier, M., Ollivier, P., Joulian, C., Albrecht, A., Hadi, J.,
Greneche, J.-M., et al. (2014). Enhanced heterotrophic denitri-
fication in clay media: the role of mineral electron donors.
Chemical geology, 390, 87–99.
Pearson, F. J. (1999). WS-A experiment: artificial waters for use in
laboratory and field experiments with Opalinus Clay. Status June
1998. Mont Terri Technical Note, TN 1999-31. Federal Office of
Topography (swisstopo), Wabern, Switzerland. www.mont-terri.
ch.
Pearson, F. J., Arcos, D., Bath, A., Boisson, J. Y., Fernandez, A. M.,
Gabler, H. E., Gaucher, E., Gautschi, A., Griffault, L., Hernan,
P., & Waber, H. N. (2003). Mont Terri Project - Geochemistry of
water in the Opalinus Clay formation at the Mont Terri Rock
Laboratory. Federal Office for Water and Geology Geology
Series, No. 5. Federal Office of Topography (swisstopo),
Wabern, Switzerland. www.mont-terri.ch.
Percheron, G., Michaud, S., Bernet, N., & Moletta, R. (1998). Nitrate
and nitrite reduction of a sulphide-rich environment. Journal of
Chemical Technology and Biotechnology, 72, 213–220.
Phister, A., Jaeggi, D., & Nussbaum, C. (2010). Drilling campaign of
phase 15: drilling data, photo documentation and drill core
documentation. Mont Terri Technical Note, TN 2010-38. Federal
Office of Topography (swisstopo), Wabern, Switzerland. www.
mont-terri.ch.
Reasoner, D., & Geldreich, E. (1985). A new medium for the
enumeration and subculture of bacteria from potable water.
Applied and Environmental Microbiology, 49, 1–7.
Schloss, P. D., & Westcott, S. L. (2011). Assessing and improving
methods used in operational taxonomic unit-based approaches
for 16S rRNA gene sequence analysis. Applied and Environ-
mental Microbiology, 77, 3219–3226.
Small, J. (2015). BN Experiment: GRM biogeochemical modelling
during Phase 18 and Phase 19 of the Bitumen-Nitrate-Clay
interaction experiment. Mont Terri Technical Note, TN 2013-44.
Federal Office of Topography (swisstopo), Wabern, Switzerland.
www.mont-terri.ch.
Small, J., Nykyri, M., Helin, M., Hovi, U., Sarlin, T., & Itavaara, M.
(2008). Experimental and modelling investigations of the
biogeochemistry of gas production from low and intermediate
level radioactive waste. Applied Geochemistry, 23, 1383–1418.
Smith, P., Cornelis, B., Capouet, M., Depaus, C., & Van Geet, M.
(2009). The long-term safety assessment methodology for the
geological disposal of radioactive waste. SFC1 level 4 report,
NIROND-TR 2009-14 E, ONDRAF/NIRAS, Brussels, Belgium.
Thury, M., & Bossart, P. (1999). The Mont Terri Rock Laboratory, a
new international research project in a Mesozoic shale formation
in Switzerland. Engineering Geology, 52, 347–359.
Tournassat, C., Alt-Epping, P., Gaucher, E. C., Gimmi, T., Leupin, O.
X., & Wersin, P. (2011). Biogeochemical processes in a clay
formation in situ experiment: Part F—reactive transport mod-
elling. Applied Geochemistry, 26, 1009–1022.
Valcke, E., Sneyers, A., & Van Iseghem, P. (2000a). The effect of
radiolytic degradation products of Eurobitum on the solubility
and sorption of Pu and Am in Boom Clay. Proceedings to the
Materials Research Society Symposium, volume 663 (pp.
141–149). Cambridge University Press.
Valcke, E., Sneyers, A., & Van Iseghem, P. (2000b). The long-term
behavior of bituminized waste in a deep clay formation.
Proceedings to the Safewaste Conference, volume 2 (pp.
562–573). Societe francaise d’energie nucleaire.
Valcke, E., Marien, A., & Van Geet, M. (2009). The methodology
followed in Belgium to investigate the compatibility with
geological disposal of Eurobitum bituminized intermediate level
radioactive waste. Proceedings of the Materials Research
Society Symposium, volume 1193 (pp. 105–116). Cambridge
University Press.
Van Loon, L. R., Soler, J. M., Muller, W., & Bradbury, M. H.
(2004a). Anisotropic diffusion in layered argillaceous rocks: a
case study with Opalinus Clay. Environmental Science &
Technology, 38, 5721–5728.
Van Loon, L. R., Wersin, P., Soler, J., Eikenberg, J., Gimmi, T.,
Hernan, P., Dewonck, S., & Savoye, S. (2004b). In-situ diffusion
of HTO, 22Na?, Cs? and I- in Opalinus Clay at the Mont Terri
underground rock laboratory. Radiochimica Acta/International
Journal for Chemical Aspects of Nuclear Science and Technol-
ogy, 92, 757–763.
Wersin, P., Soler, J., Van Loon, L., Eikenberg, J., Baeyens, B.,
Grolimund, D., et al. (2008). Diffusion of HTO, Br-, I-, Cs?,85Sr2? and 60Co2? in a clay formation: results and modelling
from an in situ experiment in Opalinus Clay. Applied Geochem-
istry, 23, 678–691.
Wilhelm, E., Battino, R., & Wilcock, R. J. (1977). Low-pressure
solubility of gases in liquid water. Chemical Reviews, 77,
219–262.
Wouters, K., Moors, H., Boven, P., & Leys, N. (2013). Evidence and
characteristics of a diverse and metabolically active microbial
community in deep subsurface clay borehole water. FEMS
Microbiology Ecology, 86, 458–473.
Xiong, Z., Xing, G., & Zhu, Z. (2006). Water dissolved nitrous oxide
from paddy agroecosystem in China. Geoderma, 136, 524–532.
Zhang, Y.-C., Slomp, C. P., Broers, H. P., Bostick, B., Passier, H. F.,
Bottcher, M. E., et al. (2012). Isotopic and microbiological
signatures of pyrite-driven denitrification in a sandy aquifer.
Chemical Geology, 300, 123–132.
Zhang, J., Dong, H., Liu, D., & Agrawal, A. (2013). Microbial
reduction of Fe(III) in smectite minerals by thermophilic
methanogen Methanothermobacter thermautotrophicus.
Geochimica et Cosmochimica Acta, 106, 203–215.
374 N. Bleyen et al.