Embed Size (px)
Citation preview
Walden UniversityScholarWorks
Walden Dissertations and Doctoral Studies Walden Dissertations and Doctoral StudiesCollection
2014
Impact of Technology Interventions on StudentAchievement in Rural Nigerian SchoolsAderonke Abosede BelloWalden University
Follow this and additional works at: https://scholarworks.waldenu.edu/dissertations
Part of the Instructional Media Design Commons
This Dissertation is brought to you for free and open access by the Walden Dissertations and Doctoral Studies Collection at ScholarWorks. It has beenaccepted for inclusion in Walden Dissertations and Doctoral Studies by an authorized administrator of ScholarWorks. For more information, pleasecontact [email protected].

Walden University
College of Education
This is to certify that the doctoral dissertation by
Aderonke Bello
has been found to be complete and satisfactory in all respects,
and that any and all revisions required by
the review committee have been made.
Review Committee
Dr. Carol Watson, Committee Chairperson, Education Faculty
Dr. Gerald Giraud, Committee Member, Education Faculty
Dr. Paula Dawidowicz, University Reviewer, Education Faculty
Chief Academic Officer
Eric Riedel, Ph.D.
Walden University
2014

Abstract
Impact of Technology Interventions on Student Achievement in Rural Nigerian Schools
by
Aderonke Bello
MEd, Abilene Christian University, USA, 2010
MSc, University of Lagos, Nigeria, 1993
BSc, University of Lagos, Nigeria, 1987
Dissertation Submitted in Partial Fulfillment
of the Requirements for the Degree of
Doctor of Philosophy
Education
Walden University
November 2014
Abstract
Increasing technology intervention in rural schools is still a herculean task, especially
with the lack of adequate infrastructures and limited resources. The purpose of this
quantitative, causal comparative study was to determine the impact of technology
interventions on student achievement in rural Nigerian schools. The study explored the
differences in student achievement in mathematics and English between technology and
nontechnology schools and established a relationship between teachers’ level of
technology implementation and student achievement. The convenience sample comprised
2,369 examination scores in mathematics and English of Senior Secondary Level 2 (SS2)
students and purposive sampling of 34 teachers who participated in an online survey.
Data were analyzed using multivariate analysis of variance (MANOVA), the level of
technology implementation (LoTi) framework, and Pearson’s correlation coefficient test.
The results showed significant differences in student achievement between technology
and nontechnology schools. However, the LoTi framework results indicated a low level
of technology implementation in classroom instruction and no significant relationship
between teachers’ technology integration and student performance. Thus, the mere
presence of technology seems to have more impact on student grades than the ways in
which teachers use it. This study is resource material for stakeholders in education to
ascertain the technology that worked best, teachers’ professional development, and other
infrastructures, prior to the deployment of technology interventions. The results could be
useful for increasing teachers’ technology integration and improving student
performance, thereby leading to positive social change.

Impact of Technology Interventions on Student Achievement in Rural Nigerian Schools
by
Aderonke Bello
MEd, Abilene Christian University, USA, 2010
MSc, University of Lagos, Nigeria, 1993
BSc, University of Lagos, Nigeria, 1987
Dissertation Submitted in Partial Fulfillment
of the Requirements for the Degree of
Doctor of Philosophy
Education
Walden University
November 2014

Dedication
To the glory of my heavenly father who made a way where there is no way by
providing all necessary resources in terms of finance, strength, wisdom, and above all,
grace to excel in this doctoral study. To my husband and lovely children for their
unflinching support, love, and encouragement that made my dream a reality.

Acknowledgments
With God, all things are possible. When human strength fails, His succor upholds
me. I am most thankful to all my facilitators at the Walden University who helped shaped
my doctoral journey. Dr. Wade Smith, Dr. MaryFriend Shepard, and others, too
numerous to mention: You are simply the best. My dissertation committee members Dr.
Gerald Giraud and Dr. Paula Dawidowicz: Your immense contributions to the success of
this dissertation cannot be quantified. The professional experiences you shared in
channeling this process is of exceptional value, and I am very grateful. As always, I am
indebted to my wonderful chair of the committee, facilitator, editor, and mentor, Dr.
Carol Watson. Your words of encouragement, support, care, and understanding of my
challenges made me forge ahead rather than looking back. The first Skype chat we had
made the difference and built my confidence in writing the dissertation. Words cannot
express my heartfelt gratitude. Nkoyo, you introduced Walden to me and never relented
in your efforts to monitor my progress as the month goes by. Patrick, your ever-listening
ears to my plights in this doctoral journey were a source of encouragement. To both of
you, accept my sincere gratitude. Finally, to my husband, Taiwo, Kenny, Tomisin, and
Abiola, the sleepless nights, late dinner, no breakfast, and no social activities are now
over. Thanks for providing me with your unwavering support throughout this doctoral
journey. I love you all.

i
Table of Contents
List of Tables ..................................................................................................................... iv
List of Figures ......................................................................................................................v
Chapter 1: Introduction to the Study ....................................................................................1
Background ....................................................................................................................2
Problem Statement .........................................................................................................4
Purpose Statement ..........................................................................................................5
Research Questions and Hypotheses .............................................................................6
Conceptual Framework ..................................................................................................7
Nature of Study ..............................................................................................................9
Definitions....................................................................................................................10
Assumptions .................................................................................................................12
Scope and Delimitations ..............................................................................................12
Limitations ...................................................................................................................13
Significance of Study ...................................................................................................13
Summary ......................................................................................................................14
Chapter 2: Literature Review .............................................................................................16
Introduction ..................................................................................................................16
Literature Search Strategy............................................................................................16
Theoretical Foundation ................................................................................................17
Literature Review Related to Key Variables ...............................................................18
Technology Interventions ..................................................................................... 18

ii
Technology Interventions in Nigeria .................................................................... 25
Technology Integration ......................................................................................... 27
Rural Schools Access to Technology ................................................................... 39
Summary ......................................................................................................................43
Chapter 3: Research Method ..............................................................................................45
Introduction ..................................................................................................................45
Research Design and Rationale ...................................................................................45
Methodology ................................................................................................................47
Population ............................................................................................................. 47
Sampling and Sampling Procedures ..................................................................... 48
Procedures for Recruitment, Participation, and Data Collection .......................... 48
Instrumentation and Operationalization of Constructs ......................................... 49
Threats to Validity .......................................................................................................55
Ethical Procedures ................................................................................................ 56
Summary ......................................................................................................................57
Chapter 4: Results ..............................................................................................................59
Introduction ..................................................................................................................59
Data Collection ............................................................................................................59
Results of the Study .....................................................................................................63
Research Question 1 ............................................................................................. 63
Research Question 2 ............................................................................................. 72
Summary ......................................................................................................................84

iii
Chapter 5: Discussion, Conclusions, and Recommendations ............................................86
Introduction ..................................................................................................................86
Interpretation of the Findings.......................................................................................86
Limitations of the Study...............................................................................................89
Recommendations ........................................................................................................90
Implications..................................................................................................................91
Conclusion ...................................................................................................................95
References ..........................................................................................................................97
Appendix A: Digital-Age Survey for Teachers Questionnaire ........................................114
Appendix B: Level of Teaching Innovation Framework .................................................119
Appendix C: Personal Computer Use Framework...........................................................124
Appendix D: Current Instructional Practices Framework ...............................................128
Appendix E: Digital-Age Professional Development Priority Description .....................133
Appendix F: Permission to Use LoTi ..............................................................................136
Appendix G: Consent Form .............................................................................................137
Curriculum Vitae .............................................................................................................139

iv
List of Tables
Table 1. Scores Scale ........................................................................................................ 50
Table 2. Level of Technology Implementation Likert Scale ............................................ 52
Table 3. Years of Teaching Experience of Participants (N = 34) ..................................... 63
Table 4. Categorization of Schools and Numbers of SS2 students ................................... 64
Table 5. Means and Standard Deviations on the Dependent Variables for the Schools ... 68
Table 6. Pairwise Comparisons for the Dependent Variables on School Basis................ 71
Table 7. Level of Teaching Innovation Results ................................................................ 74
Table 8. Level of Current Instructional Practices Results ................................................ 76
Table 9. Levels of Personal Computer Use Results .......................................................... 78
Table 10. Summary of Digital-Age Survey for Teachers ................................................. 80
Table 11. LoTi Digital-Age Professional Development Priority Results ......................... 83
Table 12. Correlation between the Dependent Variables and LoTi Subscales ................. 84

v
List of Figures
Figure 1. Distribution of English scores for technology schools ......................................65
Figure 2. Distribution of mathematics scores for technology schools ...............................66
Figure 3. Distribution of English scores for nontechnology schools .................................66
Figure 4. Distribution of mathematics scores for nontechnology schools ........................67
Figure 5. Bar graph showing the level of current instructional practices (CIP) ................73
Figure 6. Bar graph showing the level of personal computer use (PCU) ..........................75
Figure 7. Bar graph showing the level of teaching innovation (LoTi) .............................77

1
Chapter 1: Introduction to the Study
The emergence of technology has made the world into a global village and has
transformed teaching and learning processes. Technology integration into classroom
instruction has gained much ground in both developed and developing countries. The
concept of technology integration is now viewed as a fundamental part of successful
teaching and has gained the interest of many researchers who investigated and explored
effective ways of integrating technology into the school curriculum (Anderson &
Maninger, 2007; Wood & Ashfield, 2008). Almekhlafi and Almeqdadi (2010) identified
one overarching goal of technology integration: a school’s ability to have a global
learning environment with effective and appropriate use of technology in the classroom
(p. 165). However, the high cost of acquiring technology is still a major challenge in
many developing countries, and its adoption is not expanding as quickly as expected.
Many schools still have constraints on the effective use of technology in the
classroom (Lim, Zhao, Tondeur, Chai, & Tsai, 2013). A digital divide exists between
urban, semiurban, and rural schools as a result of varied challenges the rural communities
experience (Akanbi & Akanbi, 2012). Through a series of technology interventions for
rural communities, many rural schools now have access to technology, but the usage is
minimal due to other enormous challenges, such as lack of basic supportive
infrastructures. Levin and Wadmany (2008) noted that educators are yet to effectively
integrate educational technologies into K-12 classrooms. Identifying the barriers and
challenges in rural schools may assist in providing holistic technology interventions that
would be highly effective in the learning environment.

2
The purpose of this study was to determine the impact of technology interventions
on student achievement in rural schools with a focus on a rural community in the
developing country of Nigeria. Researchers have carried out many studies to determine
factors affecting technology adoption, use of technology in the classroom, teachers’
attitudes toward technology usage, and impact of technology on student achievement
(Inan & Lowther, 2010; Levin & Wadmany, 2008; Lim et al., 2013; Straub, 2009;
Thieman, 2008). With the keen interest in technology usage to enhance teaching and
learning process, especially with the deployment of low-cost technology solutions,
researchers have yet to determine the impact of technology interventions on students’
achievement amidst the other challenges faced by rural schools in developing countries.
The quantity of technology does not impact students academically, but effective teaching
practices in conjunction with quality technology usage can improve student achievement
(Lei, 2010). The design of this study was to help define the outcomes of integrating
technology into classroom instruction and determine if the deployed technology solutions
meet the needs of learners and educators.
Background
In 1988, the Nigerian government enacted a policy on computer education,
recognizing the role and integration of information and communication technology (ICT)
in education (Adomi & Kpanghan, 2010). As a follow-up to this policy, computer
systems were deployed to some schools. To harness and support the government
initiative, many private and public organizations, through their corporate social
initiatives, deployed various technology interventions into schools across the country.

3
However, the low level of basic infrastructures in some schools did not allow the
interventions to manifest as expected. Technology integration in the classroom is not
reliant upon technology tools or interventions but upon how technology can have a
meaningful impact on student achievement.
Despite improved access to technology in schools, little research exists on the
level of usage in rural schools, especially in developing countries. The ability of teachers
to integrate technology activities to meet students’ needs is important, not just having
teachers teach only technology skills (Gorder, 2008). However, many teachers find the
change process of innovation daunting and laborious. Considering their current teaching
schedules, integrating technology into class instruction can be a herculean task
(Cifuentes, Maxwell, & Bulu, 2011; Joshi, Pan, Murakami, & Narayanan, 2010; Wachira
& Keengwe, 2011). Studies have shown teachers’ enthusiasm and positive experiences
with using technology but additionally point out the many barriers to effectiveness
(Almekhlafi & Almeqdadi, 2010; Levin & Wadmany, 2008; Wachira & Keengwe, 2011;
Winzeried, Dalgrano, & Tinkler, 2011; Zhao, 2007).
Past related research has focused on urban schools in developed countries (Joshi
et al., 2010; Wachira & Keengwe, 2011), thus creating a gap in generalizing these
identified factors across localities. Although Cakir, Delialioglu, Dennis, and Duffy (2009)
argued that, given adequate technology facilities, the locality of a school does not affect
the impact of technology on student achievement, few studies have explored how
teachers in rural schools integrate technology compared to their contemporaries in urban
schools (Marwan & Sweeney, 2010). One might have to consider the peculiarities of the

4
rural environment, as well as varied and unique challenges faced by rural schools, and
that technology interventions that have been successful in urban schools might be a
failure in rural schools.
Most of the literature reviewed suggested varied factors that contribute to the
success of technology integration. However, there was no clear study that ascertained if
the factors were the same, irrespective of the locale. The need exists for examining the
impact of technology interventions on student achievement in developing countries’ rural
communities and establishing differences in student achievement in a technology-enabled
and nontechnology-enabled school within the same community. This study was designed
to ascertain the technology interventions that have met the needs of teachers and had an
impact on student achievement, thereby making them competitive with their counterparts
in urban areas. In addition, it established how the teachers in this study ascribed meaning
to technology differently than in prior research studies as a result of the peculiarities of
their schools.
Problem Statement
Nigeria, being a developing country, faces the challenges of access to technology-
rich education. The Federal Ministry of Education (FME), Universal Service Provision
Fund (USPF) and several private organizations have assisted many schools by providing
various technology solutions, such as supplying personal computers, setting up computer
laboratories and other facilities inclusive of Internet connection, as well as interactive
whiteboards (IWBs) and projectors (SchoolNet, 2005; USPF, 2010). However, there have
been no means in place to ascertain the impact of technologies on student achievement,
5
especially in rural schools in Nigeria that also faced the lack of electricity, adequate
funding, and basic infrastructures, among other challenges.
Many research studies on technology integration into classroom instruction have
shown that there can be a significant, positive impact on student achievement (Cakir et
al., 2009; Inan & Lowther, 2010; Tamim, Bernard, Borokhovski, Abrami, & Schmid,
2011). However, most of the research studies did not focus on rural schools, especially in
developing countries. There is a need to move beyond assessment of participants’
perceptions and focus on actual student achievement in technology integration efforts
(Smolin & Lawless, 2011). A rigorous evaluation that can provide information with
which to make decisions and guide the deployment of various interventions is important.
This research fills a gap by providing information on the impact of the various
educational technology interventions on student achievement in rural Nigerian schools
(Smolin & Lawless, 2011; Tamim et al., 2011).
Purpose Statement
The intent of this quantitative study was to determine the impact of the
technology interventions that were deployed to rural schools on student achievement in
Nigeria. It helped determine if the holistic technology solutions met teachers’ needs as
well as had a meaningful impact on learners. In this study, the test was based on whether
or not the use of technology, the independent variable, had an impact on English and
mathematics examination scores, the dependent variables. Further tests were based on
teachers’ level of technology usage as related to student achievement to determine the

6
relationship between the level of technology implementation, the independent variable,
and student achievement in mathematics and English as the dependent variables.
Technology initiatives such as one-to-one laptops and IWBs, among other
technology initiatives have had a positive impact on student achievement in mathematics
and English (Hossain & Quinn, 2013; Suleman, Aslam, Habib, & Hussain, 2013;
Thomson & Davis, 2013). This study could lead to a positive social change in rural
schools by increasing the level of awareness of the potential impact of various technology
initiatives on student academic achievement.
Research Questions and Hypotheses
The guiding research questions in this quantitative study follow:
1. Is there a difference in student achievement in mathematics and English
between technology-enabled and nontechnology-enabled schools?
2. What is the relationship between teachers’ level of technology implementation
and student achievement in mathematics and English?
The hypotheses follow:
Ha1: There is a difference in student achievement in mathematics and English
between technology-enabled and nontechnology-enabled schools.
Ha2: There is a relationship between teachers’ level of technology implementation
and student achievement in mathematics and English.
The findings from this study add to the knowledge base of effective use of
technology by teachers, teachers’ perceptions on technology integration, as well as the
impact of technology usage on student achievement in rural learning environments in a

7
developing country. The study also determined the technology interventions that have
worked best in rural schools.
The hypotheses were created to determine the impact of the technology
intervention in a technology-enabled school on student achievement, with a comparison
to a nontechnology-enabled school within the same community. End-of-session
examination scores for SS2 in English and mathematics were used to answer Research
Question 1. The end-of-session examination was a cumulative score comprised of three
term scores. The term score was also cumulative, which comprised the final term score
and three continual assessment scores. The null hypothesis states that when the mean
score of the two groups is the same, there is no difference in achievement. The alternative
hypothesis is the existence of a significant difference in the mean score of the two groups,
showing a difference. The study further examined the relationship between the level of
technology implementation reported by teachers and student examination scores in
mathematics and English as reported in the selected schools. A widely used survey
instrument, Level of Technology Implementation (LoTi), was used to obtain teachers’
level of technology implementation (LoTi Connection, 2011).
Conceptual Framework
The basis of this study was a framework that is referred to as the level of
technology implementation (Moersch, 1995). The foundation of this work was based on
the concerns based adoption model, which asserts that people experience change in the
process of learning, and there must be adequate support throughout the change process to
ensure that the learning process is deeply rooted (Hall & Loucks, 1979). This framework

8
was grounded in the work of Dwyer, Ringstaff, and Haymore (1994) in Apple
Classrooms of Tomorrow (ACOT), after a 13-year research effort that revealed a
substantial increase in student achievement through the use of technology in the
classrooms alongside innovative ways to design curriculum, instruction, and assessment.
The framework entails a set of measures that reflect the level of progress in the
competency of teaching with technology (Moersch, 2001). The survey items were
subjected to an intensive developmental and review process. According to Moersch
(1997), the framework uses a scale based on six levels, comprised of Nonuse (Level 0);
Awareness (Level 1); Exploration (Level 2); Infusion (Level 3); Mechanical (Level 4a)
and Routine Integration (Level 4b); Expansion (Level 5); and Refinement (Level 6).
(Details of the framework and how teachers’ level of technology implementation is
determined will be discussed in Chapter 2.)
This framework has been aligned to several state and national standards, such as
the Texas STaR Chart, Florida STaR Chart, ISTE’s NETS, and TSSA (Learning Quest,
2004). Several studies have used the framework to evaluate teachers’ level of technology
integration into classroom instruction and the extent of impact on student achievement
(Alfaro, 2008; Al-Zaidiyeen, Leong Lai, & Fong Soon, 2010; Malcolm-Bell, 2010;
Truett, 2006). For this study, the LoTi framework is the lens through which one might
determine how the teachers’ usage level of the various technology interventions impacts
student learning potential.

9
Nature of Study
This study employed a causal comparative design in a quantitative approach. The
approach involved collecting and analyzing quantitative data in two consecutive phases
within one study. The analyses from the two phases are related to one another (Ivankova,
Creswell, & Stick, 2006). A quantitative study is a means for testing objective theories by
examining the relationship among variables; in this case, eight schools within the same
rural community, grouped into technology-enabled and nontechnology-enabled schools.
The sample data were estimated at 2,000 students and 50 teachers across the eight
participating schools. For descriptive statistical and comparative analysis, the first phase
employed the end-of-session examination scores of students in SS2 in English and
mathematics. The independent variables were the type of schools in terms of technology
availability while student achievement in English and mathematics were the dependent
variables. The data were used to explore whether there was a significant difference in
student achievement in mathematics and English between technology-enabled and
nontechnology-enabled schools.
The second phase of data collection was based on the teachers’ level of
technology implementation, through a survey instrument designed by LoTi Connection
(2011). The instrument was administered to mathematics and English teachers to
determine the teacher’s level of technology usage. The outcome was related to student
achievement in a statistical analysis for existence of a relationship. The main analysis
determined whether the use of technology had an impact on student achievement and was
carried out using a multivariate analysis of variance (MANOVA). The t test showed the

10
mean difference in student achievement in mathematics and English between technology-
enabled and nontechnology-enabled schools. The F value (Wilks’s lambda) was based on
a comparison of the error variance/covariance matrix. The covariance helped determine
the significance of the correlation between the teachers’ level of technology
implementation and student achievement.
Definitions
Rural school: A rural school is a setting in an underserved community with low-
income earners and inadequate infrastructures to support and sustain an effective
technology-enabled learning environment. In this study, the reference was a senior
secondary school involving learners between the ages of 14 to 18, or Grades 10 through
12. It could also be termed as “a school in a community whose population is less than
25,000 people” (Cullen, Frey, Hinshaw, & Warren, 2004). However, the population size
in a rural community is dependent on the state or country population. In Nigeria, the
National Population Commission (NPC) recorded that the least populated rural
community was about 31,641 people, while the rural community for this study had an
average of 150,000 people (NPC, 2010).
Technology interventions: Technology interventions are the varied technology
solutions that are deployed to schools for technology integration into classroom
instruction. For this study, the interventions were comprised of computer laboratories,
IWBs in the classroom, and the provision of one-to-one laptops, including hardware and
education software tools (SchoolNet, 2005; USPF, 2010).

11
Technology integration: Many researchers have defined technology integration in
their studies. Bauer and Kenton (2005) defined technology integration as reliance on
computer technology for regular lesson delivery (p. 522). For the purpose of this study,
technology integration refers to the reliance on various information and communication
technologies for effective teaching and learning processes. Learners use technology to
construct new knowledge and enhance their learning process, and teachers integrate
technology into their teaching process for effective lesson delivery.
Nontechnology-enabled schools: For the purpose of this study, nontechnology-
enabled schools were schools that did not have large-scale technology interventions to
accommodate technology use by students. However, the schools might have had one or
two computers for administrative purposes.
Technology-enabled schools: For the purpose of this study, technology-enabled
schools were schools with technology interventions. The interventions or technology
solutions deployed could be a computer laboratory, IWBs, or one-to-one learning
environments through funding from government or private organizations (SchoolNet,
2005; USPF, 2010). The schools had received some professional development on the use
of technology in the classroom (SchoolNet, 2005).
Level of Technology Implementation (LoTi): The survey instrument is based on
technology usage, with 37 items that examine the level of teaching innovation, personal
computer use (PCU), and current instructional practices (CIP). The survey design was to
address the need of teachers in attaining a higher level of thinking and technology use in
the classroom (LoTi Connection, 2011). It measures teachers’ reported level of

12
technology integration into classroom instruction by ranking the levels from 0 to 6. 0 –
Nonuse, 1 – Awareness, 2 – Exploration, 3 – Infusion, 4a – Integration: Mechanical, 4b –
Integration: Routine, 5 – Expansion, and 6 – Refinement (LoTi Connection, 2011).
Assumptions
Only mathematics and English teachers were involved in the survey. It was
assumed that the selected teachers would have had some technology training based on the
technology interventions available in the school. Another presumption was that the
teachers in the study were a good representation of the population and that those teachers
in the technology-enabled schools were integrating technology into their classroom
instruction at some level. Additionally, it was assumed that rural schools in developing
countries are different from rural schools in a developed country, such as the United
States. Finally, the expectation was that all participants would provide honest responses
to the survey items. Participants were informed of the right to withdraw at any time as
participation in the study was voluntary.
Scope and Delimitations
The scope of this study covered senior secondary schools in a rural community in
Nigeria in order to determine the impact of technology interventions on student
achievement. The study involved teachers from technology-enabled and nontechnology-
enabled schools within the same community. Based on the Federal Capital Territory
Electronic Management and Information System (FCTEMIS) data, there are eight senior
secondary schools within the community with a sample population of about 8,400
students and 540 teachers (FCTEMIS, 2012). A delimitation of this study was the varied

13
technology interventions in the selected schools. The delimitation was not evaluated with
respect to the teachers’ level of technology implementation.
Limitations
The target population for this study was restricted to schools within the same
community, and the implication was that participants for the study originated from the
selected schools. This is a limitation, as the findings cannot be generalized. The large
variability among rural communities in Nigeria might not permit the findings to be
applicable beyond the immediate community, except for communities with similar
demographics or characteristics. The study was also limited to SS2 students because the
students in SS3 are in their final year of high school. The final examination is
administered at the national level, and the results might not be accessible. The
participating teachers were limited to mathematics and English teachers for SS2 students.
Significance of Study
The study helped determine the needs of learners and outcomes of integrating
technology into classroom instruction, thereby keeping both educators and learners
competitive, irrespective of their locale. Educators and learners remain enthusiastic about
technology integration in the classroom and about opportunities to enhance their teaching
and learning processes amidst challenges faced in their various schools.
This study serves as resource material for developing countries that have yet to
deploy technology solutions to schools in rural areas and can lead to a paradigm shift for
rural schools in developing countries that have been neglected or deprived of access to
technology-rich education. Essentially, the findings provided information on what
14
worked best, the status of technology interventions in selected schools, teachers’ level of
technology implementation, and students’ level of achievement as a result of technology
interventions (or lack thereof), thereby leading to positive social change in these rural
communities.
Summary
Technology interventions in schools have become pervasive. However, they are
still underutilized in many rural schools, especially in developing countries. The need to
understand teachers’ level of technology implementation and integration into classroom
instruction can help determine the impact on student achievement. This study helped to
ascertain if students are getting the full benefits of a technology-enabled learning
environment, or if there are even any differences in student achievement.
This chapter addressed the problems associated with technology interventions in
rural schools, with the aim to explore the impact of technology interventions on student
achievement. The research questions and hypotheses guiding the study were introduced,
with a discussion on the nature and significance of the study. Terms were clearly defined.
This study may serve as a model for rural communities with the same demographic
characteristics in Nigeria and other developing countries to get a valid view of what
technology is a best-fit, as well as determine teachers’ level of usage and proficiency and
their impact on learners’ performance on exams.
It also serves as resource material for developing countries that have yet to deploy
technology solutions to schools in rural areas and could lead to a paradigm shift for rural
schools in developing countries that have been neglected or deprived of access to

15
technology-rich education. Essentially, the findings provide information on what worked
best, the status of technology interventions in selected schools, and student level of
achievement as a result of technology interventions or lack thereof, thereby leading to
positive social change in these rural communities.
Chapter 2 explores related literature on the subject of the research study, the
literature search strategy, and theoretical foundation. Chapter 3 details the methodology
that was used to conduct the study. Chapter 4 presents findings from the quantitative
approach and the concluding chapter, Chapter 5, summarizes the study, the data, and the
importance of the findings, with further implications and recommendations.
16
Chapter 2: Literature Review
Introduction
The review of literature for this study was segmented into three areas:
interventions, technology integration, and access to technology in rural schools. In the
first, interventions, I discuss schools and holistic solutions that have had an impact on
learners. The interventions were in the form of hardware support such as IWBs, desktop
computers, and one-to-one laptops as well as software support. Technology interventions
that have been deployed to schools through government and nongovernment initiatives in
Nigeria will also be discussed. The second area is a review of technology integration into
classroom instruction and its effective usage, as well as the impact on student
achievement. The third aspect of the review is rural schools’ access to technology.
Literature Search Strategy
Databases in the Walden University library used for literature gathering included
ERIC, Google Scholar, and Education Research Complete. The Thoreau search tool was
used to find articles within multiple databases to ascertain the level of relevance of
articles selected for review. The key search terms were rural schools and technology,
teacher and technology integration, and technology and student achievement. The scope
of literature review included peer-reviewed, scholarly articles published within the last 5
years. However, a few articles older than this were used to further buttress some of the
points related to the study. Few recent dissertations were used as a result of inadequate
resources on technology integration in developing countries’ rural schools.

17
Theoretical Foundation
The success of technology interventions provided for schools might largely be
dependent on their effective usage by teachers. A reliable outcome on student learning
potential and achievement can be measured through teachers’ level of technology
implementation. There are several frameworks that have been developed to measure
technology integration in the classroom. However, the basis for this study is the LoTi
framework (LoTi Connection, 2011). Moersch developed this framework based on the
concerns based adoption model, which asserts that people experience change in the
process of learning, and there must be adequate support throughout the change process to
ensure that the learning process is deeply rooted (Hall & Loucks, 1979). The framework
has experienced several reviews from its inception until now, which further enhances its
power. Since its inception in 1994, “The LoTi Framework has been used as a statewide
technology use survey, a district school improvement model, and a classroom
walkthrough tool impacting thousands of schools nationally” (Loti Connection, 2011).
The framework is used to articulate stages of technology implementation in the
classroom. Perspectives on technology integration differ, and researchers have used
various terminologies and concepts. However, the focus is on technology integration into
classroom instruction. According to Joshi et al. (2010), who conducted a study on
technology integration into classroom instruction for young children to determine
teachers’ perceptions, 65% of U.S. teachers said it inspired the children, while only 8.5%
of the Japanese teachers agreed to this same concept. It is unclear if this broad gap in
opinions was a result of the locale or teachers' perceptions of the meaning of technology

18
integration. Berkely-Jones (2012) examined teacher levels of technology implementation
self-ratings and student Texas Assessment of Knowledge and Skills (TAKS) scores,
finding no difference between teachers’ LoTi scores and student mean scores on ELA
and math TAKS. Alfaro (2008) established a relationship between teacher LoTi scores
and student scores in language arts, but found no difference in math and social studies.
However, Truett (2006) found that students’ math scores were influenced by teachers’
LoTi scores. Thus, LoTi scores have helped educators and schools to track the effective
usage of technology integration into classroom instruction and to meet the needs of 21st
century learners.
Literature Review Related to Key Variables
Technology Interventions
Many countries have tried, through various technology interventions, to provide
technology-rich learning environments by equipping the schools with the latest
technology. The technology interventions come in various forms, including IWBs, one-
to-one laptop computing, and computer laboratories, among others. In recent years, the
use of technology to enhance teaching and learning processes had increased
tremendously, even in developing countries. However, the effective usage of technology
interventions is highly dependent on several factors such as teachers’ attitude, beliefs, and
perceptions; school adoption rate; pedagogical aspects; students’ perception and
acceptance; and sustainability (Berry, 2011; Gurevich & Gorev, 2012; Lai, 2010; Levin
& Wadmany, 2008).

19
Effects of IWBs. There has been a growing interest in the use of IWBs in
classrooms. European countries such as Spain, England, and Turkey have invested in
IWBs (Holmes, 2009; Türel, 2010). As of the 2010 statistics of usage, England ranked
highest with 73% penetration rate, followed by Denmark (50%), the United States (35%),
and Asia, with as low as 2% (McIntyre-Brown, 2011). Several related studies on IWBs
focused on teachers’ perceptions, professional development, and training workshops
(Jones & Vincent, 2010; Lai, 2010; Turel & Johnston, 2012) while others were on
students’ perceptions (Yanez & Coyle, 2011) and the use of IWBs in the classroom
(Yelas & Engles, 2010). Most studies have shown that IWBs strengthened student
motivation and active engagement in learning as a result of the interactive features
(Marzano, 2009; Schmid, 2008).
Learners and teachers have widely perceived IWBs as a positive technology tool
in the classroom learning environment, and several studies have shown empirical
evidence for the positive correlation between IWBs and student motivation. However,
only limited studies are available on the relationship between IWBs and learner
achievement (Digregorio & Sobel-Lojeski, 2010; Gurevich & Gorev, 2012). Thus, in
spite of the numerous studies in recent years on IWBs, in the classroom, their direct
impact on learners’ achievement has been sparsely measured.
Digregorio and Sobel-Lojeski (2010) also carried out a literature review of the
effects of IWBs on student performance and learning. The review consisted of several
common themes, such as the effects of IWBs on motivation, interaction, pedagogy,
perception, achievement, and learning. However, the researchers found that these effects

20
were based on contextual factors such as teacher training and confidence, technical
support, lesson planning, and activities and school culture. The review included studies
that suggested the positive effects of IWBs on teaching and learning. However, the
evidence was subjective, and could not be generalized. Data collection instruments such
as focus groups, interviews, and surveys were employed in most studies (as cited in
Digregorio & Sobel-Lojeski, 2010). There was a need to gather more quantitative data or
a larger sample of data.
Furthermore, contextual factors that might affect student outcomes in relation to
IWB classroom usage were not considered in most studies (Digregorio & Sobel-Lojeski,
2010). Contextual factors are vital in explaining the direct and indirect relationships
between student learning and performance and IWB usage (Schuck & Kearney, 2007). In
another study, Glover, Miller, Averis, and Door (2007) found teachers used IWBs to
reinforce current instructional teaching practices, but the impact of IWBs would be
greater if there were a pedagogic change from didactic to interactive teaching. A
progression of interactive pedagogy might lead to long-term motivational and
achievement gains (Glover et al., 2007). The effect of IWBs being integrated into the
classroom is dependent on the contextual factors. In this purview, the researchers
suggested a framework that will focus on context and outcomes of IWBs. Environmental
factors, student outcomes, and IWBs usage are considered in the framework. Interaction
level and pedagogy influence perception, motivation, learning, and achievement (Glover
et al., 2007). The findings of effects of IWBs on perception showed that learners’ and
teachers’ perceptions on the use of IWBs were positive. Learners liked the ability to
21
manipulate objects, as well as the tactile elements, versatility, multimedia, and fun that
IWBs provided (Lai, 2010; Yanez & Coyle, 2011). Whiteboard manufacturers, policy
makers, and academics claimed that interactivity increased engagement, enjoyment, and
motivation, thereby improving achievement (Hall & Higgins, 2005).
With respect to motivation, using IWBs was motivational because of the visual
and conceptual appeal of information (Glover et al., 2007); learners interacted with it and
overcame behavior issues as a result of sequencing and pacing of the learning process. It
promoted learner interest and more sustained attention and concentration. Learners
suggested multimedia aspects held their attention and increased engagement and
motivation, while teachers stated that increased motivation was short-lived, and the
overall quality of teaching was important to IWBs’ successful implementation (Yanez &
Coyle, 2011). Solvie (2007) suggested that increasing students’ attention would also
increase achievement. The interaction revealed IWBs had less impact when teachers did
not use a novel approach to pedagogy. Interaction was vital to learning, teaching and
sustained interest, which involved supported didactic, interactive, and enhanced
interactivity. Teachers should ensure mediating the software and IWB to promote
interactions and interactivity according to Solvie (2007). IWB was used to promote
learning using technology to support a variety of learning styles (Jones & Vincent, 2010).
Therefore, the research suggested learning was dependent on how technology was used in
the classroom and perceptions of both teachers and learners.
An IWB alone cannot enhance learning; rather, it reinforced learning and altered
the way learning takes place. Yet there was insufficient evidence on the impact on

22
achievement. The findings revealed that IWB might not transform pedagogy when not
used interactively. The interaction involved the linking of technology and pedagogy
while enhanced interactivity involved technology integration, pedagogy, and learning
styles. The fluency of teachers with regard to usage can change approaches to pedagogy,
thereby leading to change in teaching practice (Glover et al., 2007; Solvie, 2007).
Effective pedagogical interactivity, with or without technology requires structured lesson
planning, paced activities and a cognitive review (Digregorio & Sobel-Lojeski, 2010).
Lastly, there was insufficient evidence of measured gains in learner achievement with
whiteboard use, and where it does exist it had a negligible effect (Martin, 2007).
However, if using IWB results in variety, challenge, and interactivity, then student
achievement may be enhanced (Digregorio & Sobel-Lojeski, 2010).
Glover et al. (2007) and Holmes (2009) supported of the use of IWBs in the
classroom and revealed disparate findings showing that learners rely on teachers’
attitudes, the quality of teaching, and the level of IWB lesson activities. Additionally,
they found that IWB as a technology tool alone does not guarantee impact on learner
achievement. Higgins, Beauchamp, and Miller (2007), in a 2-year study, found no
significant differences in test scores between IWB-schools and non-IWB schools. Also, a
secondary whiteboard expansion project in London that teachers use IWBs in various
ways reported no impact on learner performance in the first year of the project. Higgins et
al. (2007) concluded that IWBs appeared to have a negligible effect on learner
achievement. In another study, researchers showed positive gains in literacy, mathematics
and science for children aged 7 through 11, as a result of the duration of being taught

23
with an IWB. Learners with above-average prior achievement had gains compared to lack
of impact on learners with low prior achievement (Lewin, Somekh, & Steadman, 2008).
Other researchers found insufficient evidence to identify the actual impact of IWBs on
learner achievement (Martin, 2007; Schuck & Kearney, 2007) and suggested that an
increase in students’ attention might increase achievement (Solvie, 2007).
One-to-one laptops initiatives. There has been a tremendous increase in the
implementation of one-to-one computing initiatives in both developed and developing
countries. The initiative was seen as a technology-rich educational reform providing
teachers and students access to technology and laptop computers on an individual basis.
Although this initiative was controversial, many countries still invest heavily in laptops
or iPads. In 2002, the state of Maine provided iBook laptops to 34,000 students and
teachers. In Michigan, more than 30,000 students were provided with laptop computers
(Jing & Yong, 2008). A government agency in Nigeria, USPF provided over 1,000
government schools with classmate PCs between 2007 and 2010 (USPF, 2010).
However, empirical evidence on the impact of the one-to-one initiatives on student
achievement was limited. Literature in this section will focus on studies related to the
impact on educational outcomes.
Shapley, Sheehan, Maloney, and Caranikas-Walker (2010) examined the
association between implementation of one-to-one computing and student achievement
measured by higher test scores. Shapley et al. analyzed the students’ reading and
mathematics TAKS scores. The two subjects are tested each year, and the pretests were
used as control. Implementing student technology access and use was a positive predictor

24
of students’ TAKS reading and mathematics scores. Students’ home use of laptops was a
stronger predictor of TAKS reading and mathematics scores.
These findings can be related to Bebell and Kay’s (2010) study on teaching and
learning practices. Students and teachers were provided with laptops, appropriate
technology resources, and wireless learning environments. In their longitudinal study, the
authors examined five schools running the one-to-one initiative and found that
implementation and outcome differed across schools and over the duration of the study.
The one-to-one initiative had a positive impact on teacher classroom practices, student
academic achievement, engagement, and research skills when compared to non-one-to-
one schools. ELA state assessment scores for Grade 7 students in the second year of the
initiative improved significantly compared to non-one-to-one students.
Similarly, Jing and Yong (2008) studied how students’ use of laptops affected
learning, communication, exploration, and expression. Students’ learning experiences and
technology proficiency were enriched, as revealed in interviews with teachers and
students. Student Grade Point Average (GPA) increased in the academic year of the
study; however, the relationship between student GPA and laptop use was not
established.
Furthermore, Suhr, Hernandez, Grimes, and Warschauer (2010) found that one-
to-one computer use students had higher achievement on ELA tests related to writing
strategies and literary response and analysis than the non-one-to-one computer students.
Suhr et al. conducted a 2-year study comparing ELA test scores for students who
participated in the one-to-one initiative in the fourth grade to a similar group of students

25
in a normal classroom setting within the same school district. The one-to-one students
outperformed the control group. Similarly, in Mooresville, NC, test scores in the district
increased with overall proficiency growing from 73% to 86% within 3 years (Mellon,
2011).
However, some school districts have found that one-to-one computing has not
lived up its expectations. Interestingly, Boston College researchers found that the impact
of one-to-one computing was largely dependent on classroom teachers (Norris &
Soloway, 2010). A comparative analysis of the literature review in this section showed
that the use of laptops by teachers and students can have a positive impact on student
academic achievement taking adequate cognizance of teacher practices and proficiency
(Mellon, 2011; Shapley et al., 2010; Suhr et al., 2010).
Technology Interventions in Nigeria
Many nations across the world have enacted national information and
communication technology policies, which serve as a framework for integration of ICT
into all facets of society. Nigeria, among other African countries, is not an exception. At
the 32nd ministerial council meeting of the National Council on Education in 1987, the
federal government decided to introduce computer education into the nation’s secondary
school system. This led to the formulation of Nigeria National Computer Policy in 1988
with the objectives to bring about a computer literate society in Nigeria by the mid-1990s
and enable present school children to appreciate and use the computer in various aspects
of life and in future employment (Jegede & Owolabi, 2003). This policy did not penetrate
the education system as expected, and a new national policy on ICT in education has

26
been developed by the FME (2012). While the lack of an adequate policy did not stop the
government or other stakeholders from deploying various technology solutions to
schools, the ICT penetration is still low.
One of the government agencies, the Education Trust Fund (ETF), funded the
ETF DigiNet project. The project was designed to address the severe digital infrastructure
problem in Nigerian schools. Over the years, the project provided schools, irrespective of
their locale, with 21 desktop systems, a server, VSAT-based Internet, and an alternate
power supply in terms of solar or generator. The project transcended the provision of
equipment, by providing adequate teacher training, technical support and a professional
learning community (SchoolNet, 2003). Similarly, a private organization, MTN as part of
their corporate social initiatives, tagged their technology intervention “MTN
Schoolsconnect,” and it was deployed to many schools across the country (SchoolNet,
2005).
As the one-to-one initiatives became popular across the world, another
government agency, USPF deployed 100 Intel Classmate PCs per school, to facilitate
technology usage in several schools. From 2007 to 2010, USPF provided this technology
intervention in over 1,000 government schools. To reach out to the underserved
community, the National Information Technology Development Agency (NITDA)
deployed technology interventions to help rural communities. The rural information
technology centers serve established communities, while the mobile Internet units serve
rural schools (NITDA, 2010). This was further enhanced by i-connect mobile unit
project, which also served schools that do not have access to technology (Begho, 2012).
27
Despite such interventions, the percentage of both private and public schools that have
benefitted was still very low compared with the number of schools in the country. One
major challenge was the lack of adequate evaluation of the various interventions in order
to determine the best fit amidst other challenges such as poor funding, sustainability,
inadequate infrastructures, and constant power outages.
Technology interventions in many schools across the world have attracted huge
financial investments. In addition to government funding, several nongovernmental
organizations have now also intervened through corporate social initiatives. Despite the
effective technology integration, there have been challenges in deploying holistic
solutions. Periodic evaluation of the technology interventions was a large task, especially
in rural communities. Studies focusing on technology interventions that worked best in
many rural communities are still limited.
Technology Integration
Attaining a high level of achievement has been attributed to many factors
inclusive of a technology-enabled learning environment. The rapid evolution of varied
technology tools has created a need for users to keep abreast of the emerging
technologies. However, the success of the technology-based environment has many
challenges, both at the teacher and school level. This section will review literature on the
impact of technology on students’ achievement and the effectiveness of technology usage
in the classroom to enhance teaching and learning process.
Effective use of technology in the classroom. Research (Cakir et al., 2009; Groff
& Mouza, 2008; Inan & Lowther, 2010; Thieman, 2008) has supported teaching and
28
learning with technology across the curriculum in order to transform the learning
environments. But integrating technology into classroom instruction goes beyond
teaching basic computer skills; it must happen across the curriculum and include the
major components of learning such as active engagement of students, teamwork,
collaboration, evaluation of impact, and connection to real-life situations. The use of
technology tool is not a one-time event but must be consistent, transparent, and support
curricular goals.
Researchers have developed frameworks for technology integration in their
studies (Annetta, Murray, Laird, Bohr, & Park, 2008; Groff & Mouza, 2008). In their
study on investigating student attitudes toward a synchronous online graduate course in a
multiuser virtual environment (MUVE), Annetta et al. (2008) shared their findings on the
effective use of technology. The MUVE environment was designed to evoke in the user a
sense of virtual “presence,” that is, a sensation the participant has of being in another
place while visiting a virtual environment. Surveys and observations carried out with a
sample class centered on student products, instructor-student interaction, plans to
implement course features, and perceived difficulties in implementation. The students
benefitted from using the MUVE by moving from a state of virtually no knowledge to
one in which they acquired skills in virtual environments and were able to create a
functional and engaging learning activity. In addition, the students gained a wide range of
comfort and proficiency with the use of technology.
Creating an effective learning environment with technology is still a challenge,
and there is a struggle to find consistent success with technology-based instruction. Groff

29
and Mouza (2008) indicated that amongst the barriers of effective use of technology is
the lack of access to technological resources. The teachers’ lack of technology–based
skills, along with their attitudes and beliefs, was not favorable to a technology-based
learning environment. Groff and Mouza (2008) developed a coherent framework titled
“Individualized Inventory for Integrating Instructional Innovations” (i5), which can
provide practical assistance to teachers as they navigate the process of technology
integration. They found that i5 helped teachers identify and address potential challenges
associated with the implementation of technology-based projects in the classroom,
thereby increasing the likelihood of achieving success in technology integration.
Although most researchers believed that technology can change the teaching process,
making it more flexible, engaging, and challenging for students, little actual evidence
exists to support these claims.
In past years teacher education programs have been criticized for not training
preservice teachers how to integrate technology into their classroom instruction. Thieman
(2008) analyzed how K-12 preservice teachers used technology as a tool for student
learning, given technology standards for teachers and students from the International
Society for Technology in Education (ISTE, 2007) and considered how those experiences
relate to 21st-century citizenship skills. The key findings indicated that 85% of preservice
teachers integrated technology skills and knowledge in instructional practice with their
K-12 students. About half of the sample works suggested that students benefit with the
use of technology in the classroom especially in the areas of creativity, innovation,
communication, collaboration, research, and information fluency. Thieman (2008)
30
believed there was little evidence that K-12 students used technology to support critical
thinking, problem solving, and decision making. However, the author suggested a follow-
up study to evaluate the extent to which teachers and their students are meeting current
expectations for digital citizenship skills through the use of various technology tools.
Other studies (Annetta et al., 2008; Inan & Lowther, 2010; Levin & Wadmany,
2008) explored factors affecting the use of technology. In their 2010 study on factors
affecting technology integration in K-12 classrooms, Inan and Lowther (2010)
established that barriers such as teachers’ demographic characteristics hindered the
successful use of technology. However, teachers’ computer proficiency, beliefs, and
readiness positively influenced the use of technology in the classroom. Other factors such
as the school factors also positively influenced teachers’ belief and readiness. In essence,
teachers’ beliefs and readiness may mediate the indirect effects of school and teacher
level factors on the use of technology by the teacher in the classroom.
Levin and Wadmany (2008) explored teacher views on factors affecting their use
of information and communication technologies (ICT) in the classroom and how those
views reflect changes in teachers’ beliefs and actual classroom practice. The findings
revealed the positive influence on teachers’ use of technology. Levin and Wadmany
(2008) believed it was important to understand teachers’ view, experience and
educational practices when technology was introduced into their classroom. Teachers’
practices and belief may determine to which extent technology will be integrated into
their classroom practice.
31
Palak and Walls (2009) studied teachers’ beliefs and technology practice rationale
because of the ongoing contradictions in findings between teachers’ beliefs and
technology usage. The fundamental goal was to determine if teachers who often integrate
technologies, and work at technology-rich schools, change their beliefs and consequently
their instructional practices toward a student-centered paradigm. The methodology
involved mixed-methods design using multiple variables and sampling techniques in
selecting technology. Teachers from 28 Benedum collaborative professional development
schools participated. The findings in the quantitative analysis revealed no shift in teacher
practice. In the qualitative phase the results of both methods were integrated. The results
showed that teachers’ positive attitudes toward technology did not necessarily have the
same influence on student instructional strategies. Palak and Walls (2009) stated that the
focus of technology integration should be on student-centered pedagogy and future
professional development may need to model a theory of change toward a student-
centered paradigm. The findings further corroborated results from prior research that
indicate teacher technology use in a technology-rich environment did not transform
teaching into more student-centered practice (Judson, 2006).
Hammond, Reynolds, and Ingram (2011) explored the nature and scope of student
teachers’ use of ICT, the factors that led them to use ICT, and the constraints on usage.
The study employed a mixed-methods design involving a survey with a sample
population of 340 teachers and a semistructured interview with a sample of 21 teachers.
Personnel, access, and other environmental factors were identified as factors that affect
the use of ICT while factors that influenced the use of ICT were mentoring, training, and

32
support. The findings revealed that innovative student teachers used ICT in a greater
range of contexts and made more effort to overcome barriers, such as access. ICT use
was seen as emerging from a mix of factors: chiefly student teachers’ access to ICT; their
feeling of “self-efficacy” when using ICT; and their belief that ICT had a positive impact
on learning, and can help promote behavioral and effective engagement.
Almekhlafi and Almeqdadi (2010) investigated teachers’ perceptions of their
technology integration competencies, barriers obstructing such integration, and incentives
to increase it, in addition to other related issues. The authors sought to determine how
teachers perceived their competencies with technology integration; how teachers
perceived obstacles and incentives related to successful classroom technology
integration; and how teachers perceived their students’ classroom usage of technology.
Using a mixed-methods approach with focus group interviews and questionnaires as data
collection instruments, the sample population included 40 female and 60 male teachers
from two schools. Findings showed that both male and female teachers at UAE Model
Schools had high self-perception of their abilities and competencies to integrate
technology successfully in their teaching. In addition, teachers integrated technology in
their classes to varying degrees and with different levels of effectiveness, in spite of the
barriers that hindered such integration. Essentially, teachers at both schools integrated
technology in their classroom activities, and used various technologies to promote
students’ learning, though male and female teachers differed in some cases on methods of
integration.

33
Cifuentes, Maxwell, and Bulu (2011) focused on technology integration through
professional learning community (PLC) in order to support technology integration in
three rural school districts, and the contributions of various program strategies toward
teacher growth. The fundamental question was how effective technology integration was
encouraged in classroom teaching and learning through a shared learning community
comprised of teachers, faculty, and administrators. A longitudinal study that evolved over
the 2-year span employed concurrent mixed-methods approach. Quantitative methods
were used to determine the increase in technology adoption as perceived by the
participating teachers, and qualitative case study methods were used to describe the
process and impacts of the learning community. There was an indirect positive effect on
student achievement and an improvement in teachers’ stages of technology adoption.
Additionally, teachers’ practice of technology integration enhanced student learning.
However, effective technology integration might be encouraged in classrooms through
the strategies applied in shared learning community (Cifuentes et al., 2011).
The impact of technology on students’ achievement. Gracia and Rose (2007),
Martin et al. (2010), and Cakir et al. (2009) focused on a technology-based program in
their research as a tool to determine the level of impact of technology. Garcia and Rose
examined the influence of technocentric collaboration on preservice teachers’ attitudes
about technology’s role in powerful learning and teaching. The authors focused more on
program evaluation than research with the introduction of a technology tool WebSTAR to
enhance teaching and learning. The design of a WebSTAR was based on three areas of
focus: how teachers viewed use of technology, their concerns and needs, the notion of

34
collaboration and community as it relates to teaching and learning, and accepted
instructional strategies that make use of information and communication technologies
(ICT).
Using a mixed-method approach, Garcia and Rose (2007) found computer
technology created opportunities for collaborative learning. Also, web pages can organize
and direct student activities, and participation in the WebSTAR modified students’
perceptions concerning the difference between using technology for teaching, and
students using technology for learning. Furthermore, the positive impact of technology
outweighed the negative impact. Students valued the experiences provided by the
WebSTAR and indicated that they would have welcomed the opportunity for even more
interaction with other classes both virtually and face-to-face. This outcome showed that
the impact of technology was dependent on students’ achievement.
Martin et al. (2010) stated that professional development (PD) fidelity can have
an impact on teachers understanding of the core program concepts (Buckenmeyer, 2008;
Martin et al., 2010). Teachers who experience higher quality PD in the less
comprehensive program spend more time with instructional specialists on planning of the
lessons, reflective practice, and problem solving rather than on technology assisted or
modeling instruction. Categorically, it can be said that Martin et al. (2010) did not show
the level of impact of technology. However, they found that use of PD added value to
students and teachers achievements.
Cakir et al. (2009) examined the impact of student and school factors on student
achievement in a technology-enhanced learning environment. They showed that

35
individual student factors, which must be adequately cared for in a traditional learning
environment, are also vital in a blended learning environment supported with technology.
Students with higher academic performance and good use of computer knowledge excel
above the students with low academic performance and little use of computer knowledge.
Students’ enthusiasm and motivation to use technology had a positive impact on their
achievement. However, the combination of centralized materials and local face-to-face
teaching could provide a strategy for reducing the achievement gap between these two
groups of students.
In contrast, Tamim et al. (2011) and Solvie and Kloek (2007) addressed the
impact of technology in the classroom from another perspective. Tamim et al. (2011)
summarized 40 years of investigation addressing the effect of computer technology use in
educational contexts. The extracted effect sizes showed that the use of technology in the
experimental group had a significant effect size compared to the control group with no
technology. The two substantive moderator variables (subject matter and type of
technology) suggested that support instruction had a negligible but a higher average
effect size compared to that of direct instruction. Furthermore, the average effect size of
K-12 applications of computer technology was higher than computer applications
introduced in post-secondary classrooms, showing a positive impact on their classroom
practice.
Preparing preservice teachers to be good teachers within the confines of the
university classroom is ideal. However, problems have emerged with regard to making
conceptually difficult content easier to grasp, understandable, and retainable. This led to a
36
proposed solution of the use of technology and the positive impact on the teaching and
learning process of preservice teachers. Solvie and Kloek (2007) used technology tools to
engage students with multiple learning styles in a constructivist-learning environment
Solvie and Kloek (2007) sought to gauge the effectiveness of technology used to address
multiple learning styles by using substantial experience, abstract conceptualization, active
experiments, and reflective observation. Students with the most rigid learning styles
performed lower on examinations while students who had strengths in more than one
learning style performed better. To determine the impact of technology, selecting
technology tools to match the characteristics of the four learning styles employed by
students in construction of knowledge is crucial. The impact would be seen when
teachers and learners agreed on the use and evaluation of technology tools in their
constructivist classroom (Solvie & Kloek, 2007). In addition, Cakir et al. (2009) found
that irrespective of the geographic locale of the school, the use of technology does not
change the impact on students’ achievement.
Lowther, Inan, Strahl, and Ross (2008) examined Tennessee EdTEch Launch
(TnETL), a statewide technology program impact on student achievement, teachers’
skills and attitudes toward technology integration, students’ skills in using technology as
a tool, and use of research practices. The study in a quasi-experimental approach
involved 26 schools, 12,420 students and 927 teachers. The data collection instruments
included direct classroom observation, focus groups, student performance assessments,
student achievement analysis, and surveys. Findings revealed that program teachers had
significantly higher confidence to integrate technology and in using technology for
37
learning. Program students used computers as tools, worked in centers, and engaged in
project-based learning.
Neill and Mathews (2009) investigated the influence of two computer-assisted
instructional programs on math and language arts academic achievement. They employed
two groups comprised of academic at-risk middle school students and not at-risk. They
investigated how technological interventions usage improved student achievement in
mathematics and language arts for an identified group of at-risk students. The findings
indicated only a marginal gap in academic achievement between the at-risk students
receiving computer-assisted learning interventions compared to those students engaged in
the traditional instructional strategies. However, there was a considerable increase in the
number of students who met or exceeded the state-mandated growth targets after the first
year of technology intervention.
Alege and Afolabi (2011) surveyed teachers’ use of computer/internet in
secondary schools in southwestern Nigeria, to investigate teachers’ literacy profiles,
attitudes towards computers, integration of ICT, and the hindrances in integrating ICT
into their teaching process. A total of 562 teachers, 58% female and 42% male, were
randomly selected from both private and public schools. The research questions were
based on teachers’ information, computer literacy, attitudes, integration into the
classroom, and barriers. The findings revealed that 87% of the participants, irrespective
of gender or educational qualifications, do not use computers in teaching. The barriers
were lack of expertise in use of ICT, inadequate infrastructures, technophobia, and lack
of incentives and support among others.

38
In Adewole, Akinwale and Omokanye (2008) study on consulting ICT teacher
model for teaching secondary school curriculum, a questionnaire determining the level of
the ICT usage in Nigerian secondary schools was administered to 120 teachers
comprising of 75 males and 45 females. Participants had access to computers aside the
use of Internet and email facilities and the access frequency was 15 hours per week.
However, lack of technical support and teacher’s expertise hindered teachers’ readiness
and confidence on ICT usage (Adewole, Akinwale, & Omokanye, 2008). These findings
corroborate several other findings that there was a need for teacher training and
professional development for effective technology usage (Cakir et al., 2009; Cifuentes et
al., 2011; Levin & Wadmany, 2008).
In the various research studies on effective technology integration into classroom
instruction, diverse research methods and designs were explored, and their findings were
interrelated. Some findings revealed that there is a positive impact of technology usage
on student academic achievement (Cakir et al., 2009; Cifuentes et al., 2011; Lowther et
al., 2008; Martin et al., 2010; Neill & Mathews, 2009). The use of varied technologies in
the classroom improved student learning (Almekhlafi & Almeqdadi, 2010; Hammond et
al., 2011; Solvie & Kloek, 2007). However, for more effectiveness, technology
integration should focus on student-centered pedagogy (Judson, 2006; Palak & Walls,
2009). Other studies focusing on teachers’ perspectives stated that teachers’ use of
technology and adoption, beliefs and practices have enhanced teaching and learning
process (Cifuentes et al., 2011; Levin & Wadmany, 2008; Martin et al., 2010; Tamim et
39
al., 2011; Wright & Wilson, 2011). Studies are still limited to evaluate the technology
integration process that is best-fit in rural schools.
Rural Schools Access to Technology
Technology emergence is now a critical component of education. Rural schools
are accustomed to several challenges inclusive of access to quality education, but with the
emergence of technology, most schools are systematically overcoming the challenges.
However, the provision of technology-enabled learning environments is still faced with
other barriers such as effective implementation of technology interventions, lack of
adequate infrastructure, adequate internet access, funding and shortage of tech-savvy
teachers (Gordon, 2010). In Nigeria, the government agency, NITDA, deployed two
technology interventions to help rural communities. The rural information technology
centers serve established communities while the mobile internet units serve rural schools.
However, the challenges of sustainability in terms of adequate funding and internet
broadband made the projects ineffective (NITDA, 2010). Many rural schools across the
world still lack technology in the classroom.
In the Kodiak, AK, school district, using distance learning technology was the
strategy employed to mitigate some of the challenges (Gordon, 2010). The district
delivers math instruction using video teleconferencing, Elluminate, and Moodle, with the
support of IWBs, projectors, and cameras, among others. In contrast to the district’s past
results, introducing new a form of specialized instruction resulted in successful math
students (Gordon, 2010).

40
Mitchell, Hunter, and Mockler (2010), in their study on connecting classrooms in
rural communities, focused on the use of video conference and interactive whiteboard
technology. The e-program initiative involved five schools in rural New South Wales,
Australia, to extend the range of curriculum options available for students. The findings
showed improved teachers practices and commitment to work with the technologies. The
pedagogy of the e-program met the goal of extending curriculum options for students
beyond their immediate environment and the ability of regional/rural schools to develop
complementary programs for students. Mitchell et al. (2010) found that the engagement
potential with these technologies was high among students in different school sites
relating it to other studies on the use of IWBs.
In another study relating to technology integration and its impact on rural
elementary schools, Howley, Wood, and Hough (2011) compared results of a survey
completed by 500 rural and nonrural teachers. The findings revealed rural teachers had
more positive attitudes toward technology integration than did the nonrural teachers.
Attitudes, teachers’ preparation for technology usage, and availability of technology were
significantly related to technology integration; school locale and socioeconomic status
had no relationship. In addition, engaging students with technology applications is
dependent on teachers’ access to instructional technology and preparedness (Howley,
Wood, & Hough, 2011).
In Jordan, 650 rural secondary school teachers were randomly selected as
participants in a study designed to investigate the level of ICT use for educational
purposes (Al-Zaidiyeen, Leong Lai, & Fong Soon, 2010). Using a quantitative approach,

41
the authors focused on the level of ICT use and teachers’ attitudes toward ICT usage in
the classroom. Survey results revealed that teachers had a low level of ICT use for
educational purposes but held positive attitudes towards the use of ICT with a significant
correlation between teachers’ level of ICT use and their attitudes (Al-Zaidiyeen et al.,
2010). In an effort to document how teachers perceive ICT, Panigrahi (2011) compared
teachers’ perceptions of ICT use in relation to gender, level of qualification, and age as
well as between urban and rural teachers. The findings revealed no significant difference
between urban and rural teachers’ perceptions of use of ICT or in relation to gender, and
age. In essence, effective technology usage was not dependent on locale as this was
corroborated by Cakir et al. (2009).
In a mixed-methods study to explore the beliefs, attitudes, concerns, barriers,
perceptions, and teaching practices of rural K-12 teachers, Lewis (2010), stated that the
findings revealed the need for professional development and technical support for
teachers. The professional development was to encourage the involvement of teachers in
the effective use of technology to enhance the student learning. Furthermore, Jaber’s
(1997) study on factors that influence teachers’ use of technology revealed that access to
computers influenced the usage, but lack of internet access and obsolete equipment had a
negative influence on teachers’ actual usage, and there was a need for professional
development. In a study on the effectiveness of technology professional development for
teachers, Rives (2012) harnessed the essence of professional development on teachers’
effective usage of technology in the classroom.

42
Malcolm-Bell (2010) explored the status of technology integration in primary and
secondary high schools in a rural parish in Jamaica using concurrent nested mixed
methods. The data collection instruments were survey and interviews in which the survey
data was analyzed with the LoTi questionnaire administered to 231 participants selected
from five primary and five secondary schools. The interviews were analyzed for
emerging themes through an open-coding approach. The findings showed a low level of
technology integration in instruction and learning in the schools, which corroborated the
findings by Al-Zaidiyeen et al. (2010). Further, computer use focused on the content
areas that required project-based learning and instructional software. However, barriers
such as inadequate professional development and access to computers in the classroom
required urgent attention to ensure appropriate technology infusion in the curriculum
(Malcolm-Bell, 2010; Rives, 2012).
Essentially, in rural schools, the impact of technology integration into classroom
instruction relies heavily on teachers’ practices, attitudes, level of preparedness, school
technology acceptance, professional development, adequate technology resources and
sustainability among others (Berry, 2011; Cakir et al., 2009; Howley et al., 2011; Lewis,
2010; Mitchell et al., 2010; Rives, 2012). Amidst the various challenges in rural schools,
which differ from one community to another, the provision of a holistic technology
solution that would meet the needs of both teachers and students was important. School
remoteness, race, and socioeconomic status were not the most important factors, as
studies have shown that these dynamics have no relationship to technology integration

43
(Cakir et al., 2009; Howley et al., 2011). However, the technology solutions in rural
communities require adequate evaluation for effectiveness.
Summary
The literature review in this chapter focused on technology interventions,
technology integration, and rural schools’ access to technology. Research has taken place
in both developed and developing countries, and technology interventions have diverse
impacts on teaching and learning processes. There has been great improvement in
infusing technology into the curriculum, but more aspects need to be explored for
effectiveness. The literature provided evidence on the high-level use of IWBs across the
world, but with no clear evidence of its effect on learners’ achievement. Many factors
emanated from technology integration process in which literature clearly identified
personal, organizational, and environmental factors. Effective technology integration and
usage are highly dependent on teachers’ beliefs, attitudes, practices, training, professional
development, technical support, adequate funding, and appropriate resources among
others.
The main focus of the present study was rural schools. Rural schools’ access to
technology tends to be marginalized, but there is still a low penetration in many rural
communities across the world. Research studies are limited on impact of technology on
student achievement in rural schools, especially in developing countries. This study adds
to the knowledge base of impact of technology integration on student achievement in
rural schools amidst other challenges faced in rural communities. It also corroborated
findings in previous researches with no significant difference in student achievement,

44
irrespective of locale. The essential aspect is adequate provision of appropriate
technology resources.
The research methodology is discussed in Chapter 3, with a detailed description
of the data collection and analysis procedures used in this quantitative approach.

45
Chapter 3: Research Method
Introduction
The purpose of this quantitative study was to determine the impact of the
technology intervention that was deployed to rural schools on student achievement in
Nigeria. It helped determine if the holistic technology solutions met teachers’ needs, as
well as had a meaningful impact on learners. This chapter provides sections on the
research design and rationale, methodology, and threats to validity. The methodology
section is subdivided into population, sampling and sampling procedures, procedures for
participation, recruitment and data collection, instrumentation, and operationalization of
constructs. Ethical procedure is discussed as a subsection under threats to validity.
Research Design and Rationale
This quantitative study involved a nonexperimental design. The causal
comparative research employed independent and dependent variables. Johnson and
Christensen (2004) stated that in causal-comparative research, the study focuses on the
relationship between one or more categorical independent variables and one or more
quantitative variables. The research questions follow:
1. Is there a difference in student achievement in mathematics and English
between technology-enabled and nontechnology-enabled schools?
2. What is the relationship between teachers’ level of technology implementation
and student achievement in mathematics and English?
This study was designed to determine the difference in student achievement in
mathematics and English between technology-enabled and nontechnology-enabled

46
schools, as well as establish the relationship, if any, between teachers’ level of
technology implementation and student achievement in mathematics and English. The
independent variable was the level of technology at schools. The dependent variables
were the student examination scores in mathematics and English. This design had a lower
constraint because it did not involve isolating the effects of a modifiable independent
variable on the dependent variable (Johnson, 2001). The variables could not be
manipulated, and the time and resource constraint was lower because archived data on
student examination scores in mathematics and English were used. In cross-sectional
research, data collection from participants is at a single point in time or in a relatively
short period (Johnson, 2001). However, the teachers’ survey was difficult to collate at
once. It involved extensive travel to ensure that the selected teachers in the various
participating schools submitted the survey questionnaire within a specified timeline.
Causal-comparative studies are used to determine the existence of relationships
between independent and dependent variables after the occurrence of the events (Brewer
& Kuhn, 2010). The rationale for this nonexperimental comparative was that it helped
determine differences and relationships between variables and related one variable to
another with no attempt to determine causation. Because the basis of this study was to
determine the impact of technology interventions on student academic achievement, other
types of experimental design were not appropriate. Several studies have used causal-
comparative design because of the advantages in terms of access to the large volume of
data, large sample populations, and data collected from a large population in an
47
economical manner, thereby adding to the knowledge base of the design (Bernardo, 2013;
Brewer & Kuhn, 2008; Johnson, 2001; Page, 2013).
Methodology
Population
The target population involved teachers from eight public senior secondary
schools in a rural community of about 150,000 residents in Nigeria (NPC, 2010). The
socioeconomic status of the inhabitants in this community tended to be low. There was a
mixed ethnicity as many non-Indigenes have settled in the community as a result of
moving the capital of Nigeria to Abuja. Most Indigenes are peasant farmers. The schools
for this study were currently senior secondary schools (SS1 – SS3, an equivalent of
Grade 10 – 12). The government established most of the schools more than 20 years ago.
The education system is subdivided into three levels comprised of the primary and junior
secondary schools, the senior secondary schools, and the tertiary level schools. The
schools in focus were senior secondary schools, which engage students between ages 14
and 18. At the time of this study, the community had eight senior secondary schools with
some being technology-enabled and some not. The total population of the schools was
about 8,400 students and 540 teachers (FCTEMIS, 2012). In this study, only SS2
students’ examination scores were used. The estimated number of students was about
2,400 while the English and mathematics teachers’ population was 40. This sample
population was valuable to the field because of the availability of both technology-
enabled and nontechnology-enabled rural schools in a developing country, which was the
focus of the research study.

48
Sampling and Sampling Procedures
The sampling strategy for this study was convenience sampling. Convenience
sampling is a nonprobability sampling method in which sampled population is based on
"convenient" sources of data for researchers and does not involve known nonzero
probabilities (Lavkaras, 2008). The eight available schools were divided into two groups
comprised of technology-enabled and nontechnology-enabled, as defined in this study.
As the target population was SS2 students’ examination scores and teachers teaching
English and mathematics, convenience sampling was the most appropriate.
The sampling procedure involved the school authority releasing the archived data
for all SS2 students in English and mathematics after I sought adequate permission from
the education agency. The number of students’ scores was dependent on the population of
SS2 graders in the participating schools at the time of the study, an approximation of
2,400 students. The criterion for teachers’ selection was predominantly teachers that are
teaching English and mathematics in SS2, focusing on the students whose data were
used. The teachers’ selection was purposeful sampling, and each participant signed an
informed consent letter prior to the survey. It was expected that all 40 teachers would
participate. However, only 34 teachers responded, which still provided a confidence level
of 95% with a confidence interval of 5 using Creative Research Systems (2012) sample
size calculator.
Procedures for Recruitment, Participation, and Data Collection
Permission was sought from the Walden University Institutional Review Board
(IRB) to commence collection of data. I sent a letter to the authority in charge of senior

49
secondary schools requesting the use of the schools within the specified rural community
for the research study. Upon receipt of permission from the IRB and the authority in
charge of schools inclusive of the principal in each participating school, students’
examination scores were collected from each of the schools in this study. I assigned a
number to each set of records on a school-level basis for ease of analysis. The school also
provided information about the teachers. Teachers teaching English and mathematics in
the participating schools were selected to participate in an online survey on technology
implementation. The selected teachers were informed of the research study through face-
to-face contact, text messages, and e-mails. Thereafter, teachers’ consent was sought for
participation (Appendix A). The estimated number of teachers was 40. However, there
was variation at the time of study. As a result of unsteady electricity and Internet access,
and in order to maximize the timeline for data collection, Internet-enabled laptops were
taken to the schools to enable teachers complete the online survey. The online survey
involved the use of the LoTi questionnaire (LoTi Connection, 2011).
Instrumentation and Operationalization of Constructs
Examination scores. This quantitative study involved the use of examination
scores. Examinations are systems designed to assess learners’ knowledge, ability, and
intelligence (Teddlie & Tashakkori, 2009). Examination scores provided the quantitative
data to be collected and involved the end-of-session cumulative scores for SS2 graders
with a focus on mathematics and English language. These two subjects are offered at all
grade levels in the school system. The end-of-session examination score comprised three
terms scores. Each end-of-term score was also cumulative as it was the average of the

50
term examination plus three continuous term assessments. Continuous assessment is a
test, project, or assignment administered to students over the course of the term and
represents 30% of the total obtainable score for the term. The mathematics and English
scores were the dependent variables while the independent variables were the
technology-enabled and nontechnology-enabled schools. The examination score is graded
according to the specification of the education board as shown in Table 1.
Table 1
Scores Scale
Scores Grade
75 and above A1
70 – 74 B2
65 – 69 B3
60 – 64 C4
55 – 59 C5
50 – 54 C6
45 – 49 D7
44 – 40 E8
Below 40 F9
Level of Technology Implementation (LoTi) questionnaire. The LoTi
questionnaire was used to collect data from teachers through an online survey. Moersch
developed the LoTi questionnaire in 1994 to measure the extent of technology integration
in schools. The questions focus on how teachers integrate technology in the learning

51
process and proficiency levels of usage in different settings. Permission was sought from
the LoTi Connection prior to usage (LoTi Connection, 2014). (See Appendix F)
According to Moersch (1995), as a teacher progresses from one level to the next, the
instructional method shifts from teacher-centered to student-centered.
The following are the levels of the LoTi framework (Moersch, 1995):
1. Level 0 (Nonuse). Teacher perception of lack of access to technology or time
management issues thwarts technology integration.
2. Level 1 (Awareness). Technology not integrated into teacher’s classroom
instruction, a step away from normal classroom proceedings.
3. Level 2 (Exploration). Technology-based tools serve as an appendage to
instructional programs, and use as a learning and teaching enhancement
resource.
4. Level 3 (Infusion). Technology-based tools augment instructional activities,
experiments and support higher order thinking skills.
5. Level 4a (Integration-Mechanical). Technology used to solve authentic
problems and provides a rich context to give student a better understanding of
concept and themes.
6. Level 4b (Integration-Routine). Technology is a tool that teachers can readily
use to create integrated instructional units with little intervention from outside
resources.

52
7. Level 5 (Expansion). Technology usage beyond the walls of the classroom to
enable collaboration and partnering with other sectors, such as businesses and
research institutions.
8. Level 6 (Refinement) Technology as a seamless tool for both teachers and
students to solve authentic problems; create new products and access
information.
The data provided a detailed overview of the technology integration process and
how it was infused into the school curriculum. The reliability and validity of LoTi is very
high, and it is widely used to create data in various schools in the United States and
across many countries. It has been used in many research studies (Fields, 2005; Malcolm-
Bell, 2010; Ray, 2008; Stubbs, 2008; Summak & Samancioglu, 2011) to measure
teachers’ level of technology implementation. The reliability coefficient of LoTi
questionnaire was .94. The survey has 37 items apart from demographic questions and
uses a Likert-type scale with eight responses ranging from 0 to 7 for each question. Table
2 shows the Likert scale narratives.
Table 2
Level of Technology Implementation Likert Scale
Scale Narrative
0 Not applicable
1 and 2 Not true of me now
3, 4 and 5 Somehow true of me now
6 and 7 Very true of me now
53
Operationalization. The key independent variables were the type of schools
comprised of technology-enabled and nontechnology-enabled schools, and teachers’
technology implementation, comprised of six levels as determined by the LoTi
framework. The technology-enabled school is defined as a school with access to
technology, which could be a computer laboratory, use of IWBs or one-to-one laptops
among others. The nontechnology school is a school without access to standard
technology but that might have just one computer for administrative purposes. The level
of technology implementation is measured using the scale in Table 2. The dependent
variables were student achievement in mathematics and English. The sessional
examination score is a cumulative score and the two subjects used in this study are
mandatory or core subjects for all students. The end-of-session score was disaggregated
using the scale in Table 1.
Data analysis. The data analysis in this study was two-fold. The SPSS software
package was used for the analysis of mathematics and English language examination
scores of SS2 graders from the participating schools, which were categorized into
technology-enabled and nontechnology-enabled schools. The teachers’ level of
technology implementation was analyzed within the LoTi framework. However, further
statistical analysis was employed to establish the relationship between the teachers’ level
of technology usage and student achievement in mathematics and English. The goal was
to establish any significant difference in scores, based on the use of technology. The

54
overarching question was to determine the impact of technology interventions on student
achievement. The guiding research questions follow:
1. Is there a difference in student achievement in mathematics and English
between technology-enabled and nontechnology-enabled schools?
2. What is the relationship between teachers’ level of technology implementation
and student achievement in mathematics and English?
The hypotheses follow:
Ha1: There is a difference in student achievement in mathematics and English
between and technology-enabled and nontechnology-enabled schools.
Ha2: There is a relationship between teachers’ level of technology implementation
and student achievement in mathematics and English.
A MANOVA was employed. MANOVA is used to determine whether multiple
levels of independent variables on their own or in combination with one another have an
effect on the dependent variables. MANOVA requires that the dependent variables meet
parametric requirements. Students’ scores in mathematics and English language were the
two dependent variables. The difference in student achievement based on the type of
schools was also determined. The t test showed the mean difference. The F value
(Wilks’s lambda) was based on a comparison of the error variance/covariance matrix.
The covariance helped determine the correlation between the two measures when
performing the significant test. MANOVA was used to test the difference between
student achievement in mathematics in technology-enabled and nontechnology-enabled
schools, as well as in English in both type of schools. The validity was the extent to

55
which inferences can be accurately made based on the students’ scores in both learning
environments.
The assumption was that there were linear relationships among the dependent
variables, mathematics and English achievement. The homogeneity of variance was that
the variance of the scores in one school would be equal to the variance of scores in the
second school. Levene’s test of homogeneity of the variance was used to test equality of
variance as it tolerates violations of normality and examines whether the amount of
variance is equally represented within the independent variable groups. To avoid
limitation of this statistical analysis, outliers were tested prior to performing MANOVA.
If an unequal sample size exists in the schools, SPSS was used to adjust the unequal
sample sizes based on the student population for the grade level. Furthermore, the level of
usage was determined by the survey on teachers’ technology implementation using the
online LoTi framework software. Thereafter, to determine the relationship between
teachers’ level of technology implementation and student achievement, the results
specifying the different levels alongside the student achievement were analyzed using
SPSS.
Threats to Validity
It is expedient to utilize procedures to ensure the validity of the data and findings
(Creswell & Plano-Clark, 2011). Validity serves the purpose of checking on data quality
and ascertaining if what is being measured is what is intended to be measured (Frankfort-
Nachmias & Nachmias, 2008). There is a need as a researcher to design studies to reduce
the threats to internal validity and external validity. According to Creswell and Plano-

56
Clark (2011), internal validity is the extent to which a researcher can conclude the
existence of cause-and-effect relationships among variables. External validity is the
extent to which a conclusion can be derived that the results apply to a large population. In
this study, the threats to external validity included the location of schools selected for the
research. The schools are within the same rural community although characteristics
differ, and the findings might be applicable only to school with similar characteristics.
The findings cannot be generalized based on a rural community and might be less
applicable to an urban community. However, to reduce these threats, the specificity of
variables was based on similar technology-enabled learning environments. Threats to
internal validity were minimal, as the testing involved a large sample of student scores.
The same school curriculum was used irrespective of the learning environment of the
participating schools. However, teaching or instructional methods in various schools
might have differed.
Ethical Procedures
Prior to data collection, approval was sought to conduct the study from the
Walden University Institutional Review Board, the institution governing the schools, and
the principals of the participating schools. Upon approval to carry out the study in
selected schools, students’ scores in mathematics and English were collected based on
schools’ records. To protect the rights of participants, the data gathered were kept
confidential so there would be no link to any student, and codes were used to capture data
on an individual school basis. The data were stored on researcher’s laptop with a
password protection to avoid any form of infiltration by an unknown person. Upon

57
successful completion of this study, the data will be deleted from the researcher’s laptop.
Participation by teachers in the survey was voluntary and maintained the inclusion
criteria of mathematics and English teachers who taught the students whose scores were
used in the study. Informed consent was sought from the participants once identified
based on school records. I had no personal interest in the participating schools, and as
such the bias in data collection was reduced. A recharge card valued at 500 naira (about
$3 U.S.) was given as an incentive to participants who completed the survey. The
incentive was at the cost and discretion of the researcher.
Summary
The causal comparative research design used in this study allowed the collection
of a large amount of data commensurate to the study. The outcome of the first phase of
the study using the students’ examination scores helped form the basis of the second
phase using the LoTi online survey, by providing adequate information on the status of
student achievement as it relates to technology usage. The examination scores determined
the level of student academic achievement, while the survey provided information on
teachers’ level of technology implementation.
A descriptive statistical analysis was used to identify the differences in the mean,
the equality of variance, and correlation between the independent variables and
dependent variables. The outcome of this analysis helped establish the specified
hypotheses. Adequate consideration was given to ethical procedures by protecting the
rights of participants, especially in the archived data of student scores. The bias in this
study was minimal, as I had no relationship with the participating schools.

58
In the next chapter, the data collection process will be discussed, and using the
various data analysis techniques specified earlier, the findings are presented.
59
Chapter 4: Results
Introduction
This study explored the varied technology interventions that were deployed in
eight rural schools in Nigeria and determined the impact of the technology interventions
on student achievement using mathematics and English scores. I had tailored the research
questions to achieve the purpose of this study, which was to establish the difference in
student achievement in mathematics and English between technology-enabled and
nontechnology-enabled schools and to establish a relationship that might exist between
teachers’ level of technology implementation and student achievement in mathematics
and English. The hypotheses were designed to examine a difference in student
achievement in mathematics and English between technology-enabled and
nontechnology-enabled schools, as well as the existence of a relationship between
teachers’ level of technology implementation and student achievement in mathematics
and English. Chapter 4 includes discussion of the data collection process, the results of
the data analysis, and the summary of the findings to the research questions.
Data Collection
The data collection process was conducted in two phases over a 6-week period.
The first phase spanned 3 weeks and included the collection of SS2 student examination
scores in English and mathematics from the participating schools. The second phase
spanned a 3-week period and involved SS2 mathematics and English teachers’
participation in an online survey. The survey instrument (Digital-Age survey for teachers)
was developed by Moersch (1995) to collect data for measuring the level of technology

60
implementation. The recruitment process was slow because of the criterion sampling. In
some of the participating schools, the response rate of the selected participants was high,
as teachers showed a high level of enthusiasm to participate in an online survey. The
biggest challenge faced during data collection was lack of electricity in most of the
schools. After the first week, I traveled to the affected schools with laptops and Internet
modems to enable teachers to complete the online survey. This challenge affected the
response rate because some of the teachers were teaching or otherwise unavailable during
the visit. Invariably, the process became cumbersome as participating schools had to be
visited multiple times. However, 95% of the selected participants were able to contribute
to the study.
The eight schools in the rural community were categorized into technology-
enabled and nontechnology-enabled as earlier defined. The socioeconomic status in this
community was low because most Indigenes are farmers, while others and non-indigenes
are government workers and petty traders who can be classified as average income
earners. Although most of the students resided within the community and immediate
environs, School F differed, as it was a special school for gifted students and accepted
students from across the country. The demography of each school relating to technology
is described as follows:
School A: The estimated student population at the time of study was 1,300. The
number of SS2 students was 385. The school lacked a computer laboratory but had two
computer systems used for administrative purpose only. School A was classified as a
nontechnology-enabled school. The SS2 classes were tutored by four English teachers

61
and four mathematics teachers. One English teacher withdrew from the survey, and one
mathematics teacher did not complete the survey.
School B: The student population was above 1,000 with 325 students in SS2. The
school had two computers, used mainly for administrative purposes. Three mathematics
teachers and two English teachers participated in the study. School B was classified as a
nontechnology-enabled school. Among the five teachers, only two had working e-mail
addresses while others had to create an e-mail address in order to participate in the study.
School C: The school had a large population of about 2,000. The number of SS2
students divided into 12 classes was 565. Three mathematics teachers and three English
teachers tutored the students, but only five teachers participated in the survey. The school
was well equipped with different technology laboratories. The school had two computer
laboratories, each comprising 10 systems, though four systems were nonfunctional. One
of the computer laboratories was donated by a private organization while the government
provided the second laboratory. Also, the government provided 70 classmates PCs for
one-to-one learning while a private organization donated a multimedia laboratory with
digital satellite technology. School C was classified as a technology-enabled school. Out
of the five teachers that participated, only one had a phobia for technology.
School D: This girls’ school had a population of 500 students. The SS2 students
were numbered 204. The school had 100 classmate PCs for one-to-one learning and two
computers for administrative purpose. The school had three mathematics teachers and
two English teachers handling SS2. Only the mathematics teachers participated. The
school was technology-enabled.
62
School E: The school had two computer systems for administrative purposes and
a nonfunctional computer laboratory. As at the time of data gathering, the laboratory was
being renovated. The school’s student population was about 1,800. The SS2 students
were approximately 417. The number of SS2 students’ scores used in the study was 190
because the school did not have comprehensive data. Only students with examination
scores were considered. School E was classified as a nontechnology-enabled school.
School F: A special school with a population of 500 students. The SS2 students
were numbered 111. The school was highly equipped with varied technology
interventions, which included two computer laboratories with 20 computer systems, one
multimedia laboratory, and 100 classmate PCs for one-to-one learning. The school had
only one English teacher, who withdrew from the survey after signing the consent form,
and two mathematics teachers who participated in the survey. The school was
technology-enabled.
School G: The student population was estimated at 1,000. The number of SS2
students was 192. Two mathematics teachers and two English teachers tutored the SS2
students. Both English teachers and one mathematics teacher participated in the survey.
The school had a computer laboratory with Internet facilities, but most of the systems
were nonfunctional. The school was technology-enabled.
School H: The population was about 1,500 students. The SS2 students were 432.
The school was equipped with a computer lab with 10 systems and Internet facilities.
Four mathematics teachers and three English teachers participated in the study.
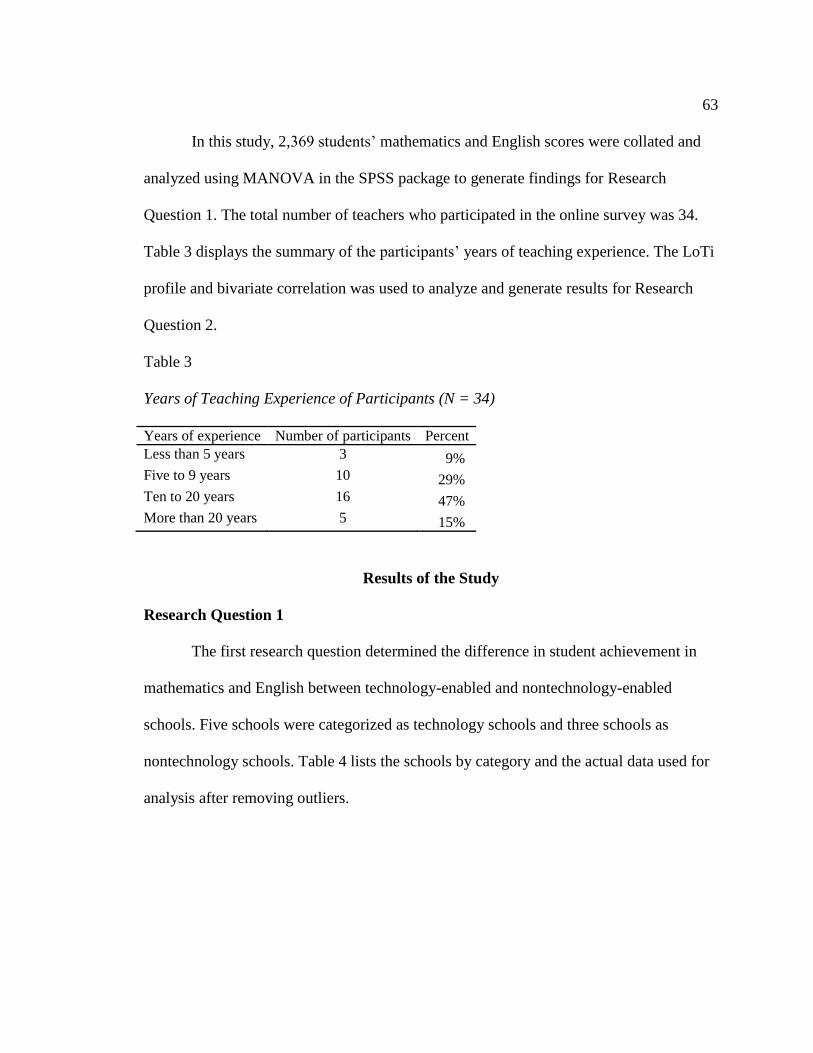
63
In this study, 2,369 students’ mathematics and English scores were collated and
analyzed using MANOVA in the SPSS package to generate findings for Research
Question 1. The total number of teachers who participated in the online survey was 34.
Table 3 displays the summary of the participants’ years of teaching experience. The LoTi
profile and bivariate correlation was used to analyze and generate results for Research
Question 2.
Table 3
Years of Teaching Experience of Participants (N = 34)
Years of experience Number of participants Percent
Less than 5 years 3 9%
Five to 9 years 10 29%
Ten to 20 years 16 47%
More than 20 years 5 15%
Results of the Study
Research Question 1
The first research question determined the difference in student achievement in
mathematics and English between technology-enabled and nontechnology-enabled
schools. Five schools were categorized as technology schools and three schools as
nontechnology schools. Table 4 lists the schools by category and the actual data used for
analysis after removing outliers.

64
Table 4
Categorization of Schools and Numbers of SS2 students
School code Technology code Number of students Exact data used
A Nontechnology 385 385
B Nontechnology 320 317
C Technology 554 554
D Technology 202 202
E Nontechnology 190 189
F Technology 111 84
G Technology 192 192
H Technology 415 415
The student population varied on school basis, as well as the technology
interventions implemented in the technology-enabled schools. The students’ mathematics
and English scores were obtained for SS2 students of the 2013 school year from the
schools. The total number of students’ scores from technology schools was 1,474 while
the number was 895 from nontechnology schools. For the analysis, the total number of
students’ scores gathered was 2,369. A multivariate analysis was used to establish if any
significant differences in student achievement in mathematics and English scores
between technology-enabled and nontechnology-enabled schools.
A normality test established that the dependent variables exhibited a fairly normal
distribution except for few outliers. There were 2,338 cases with valid data, and the
criteria for identifying an outlier were -3.0 for lower bound and 3.0 for upper bound. The
outliers were removed, and a further inspection of the histograms and normal Q-Q plots
showed that the English and mathematics scores were fairly distributed for both
technology and nontechnology schools. The skewness and kurtosis of English and

65
mathematics scores did not exceed the rule of thumb criteria of 1.0. For technology
schools, Figure 1 shows the English scores with a skewness of -.401(SE = .064) and a
kurtosis of .239(SE = .129), while Figure 2 shows the mathematics scores with a
skewness of .005 (SE = .064) and a kurtosis of .175 (SE = .129). For nontechnology
schools, Figure 3 depicts the English scores with a skewness of -.258(SE = .082) and a
kurtosis of -.825 (SE = .164), while in Figure 4, mathematics scores show a skewness of
.634 (SE = .082) and a kurtosis of -.097 (SE = .164). The result was based on exact data
as shown in Table 4.
Figure 1. Q-plots showing the distribution of English score for technology schools.

66
Figure 2. Q-Plots showing the distribution of mathematics scores for technology schools.
Figure 3. Q-Plots showing the distribution of English score for nontechnology schools.

67
Figure 4. Q-Plots showing the distribution of mathematics scores for nontechnology
schools.
The descriptive statistics showing the means and standard deviation on the
dependent variables are presented in Table 5. The dependent variables were the students’
mathematics and English scores for 2013 school session. The independent variables were
the technology code and the school code. The mean score for English in technology
schools was 58.93 and in nontechnology schools was 52.59 showing a difference of 6.34.
The mean score for mathematics in technology schools was 56.87 and in nontechnology
schools was 52.89 revealing a difference of 3.98. The analysis revealed that students’
performance in English was better than students’ performance in mathematics, though, in
nontechnology schools, there was only slight difference in the mean score of both
dependent variables.

68
Table 5
Means and Standard Deviations on the Dependent Variables for the Schools
School code English scores Mathematics scores
M SD M SD n
Technology
C 60.85 4.37 60.31 4.84 554
D 66.96 5.22 63.38 5.62 202
F 73.05 5.41 72.75 9.50 84
G 50.01 8.48 53.23 8.86 192
H 53.74 8.99 47.60 7.75 415
Submean 59.26 9.50 56.87 9.88 1447
Nontechnology
A 60.62 5.68 56.44 8.08 385
B 44.67 8.47 52.09 7.23 317
E 49.50 8.41 47.01 6.25 190
Submean 52.59 10.28 52.89 8.24 891
Grand mean 56.59 10.14 55.36 9.49 2338
A one-way MANOVA was conducted to determine the impact of technology
interventions in schools on two dependent variables, mathematics and English scores.
The analysis revealed a significant multivariate difference for the various schools
categorized into technology-enabled and nontechnology-enabled schools, Wilks’s =
.376, F(12, 4658) = 244.79, p < .01, 2 = .39. The multivariate 2 = .39 indicates 39% of
multivariate variance of the dependent variables is associated with the school code factor.
The power to detect difference was 1.0, which is strong. The hypothesis that there is a

69
significant difference in student achievement in mathematics and English between
technology-enabled and nontechnology-enabled schools was confirmed.
The covariance among the dependent variables was evaluated using the Box’s
test. The homogeneity test of covariance matrices was significant F(21, 2486003) =
28.16, p < .01, revealing that there are differences in the matrices. The Box’s test was
highly sensitive and the significance might be as a result of unequal large sample sizes in
the groups, thereby rejecting the null hypothesis. A Levene’s test was used to verify the
equality of variance on the dependent variables (English and mathematics scores). The
result was significant (p < .01); there is no equality of variance, and the differences in
both English and mathematics scores in the two groups are statistically significant.
Considering the significance of the overall test, and for consistency with the MANOVA
results, the univariate differences were examined. Using the Scheffe’s method, the
analysis on the English scores was significant, F(6, 2330) = 359.39, p < .001, 2 = .481,
power = 1.0, and it also was significant for mathematics scores, F(6, 2330) = 289.24, p <
.001, 2 = .427, power = 1.0.
A further test was run on pairwise comparison of school differences using the two
dependent variables. The results showed a significant difference among the schools, with
the exclusion of some schools in each dependent variable (See Table 6). For English
scores, School A (nontechnology) and School C (technology), and school E
(nontechnology) and School G (technology) exhibited no significant difference with p >
.05. For mathematics scores, School B (nontechnology) and School G (technology) had p
= .871, and school H (technology) and School E (nontechnology) had p = 1.0, exhibiting

70
no significant difference. Table 6 displays the description of the significant pairwise
school differences on English and mathematics scores using Scheffe’s test.

71
Table 6
Pairwise Comparisons for the Dependent Variables on School Basis
DV SC (I) SC (J) p 95% CI
LL UL
English A B .000 13.97 17.95
C 1.000 -1.98 1.51
D .000 -8.62 -4.06
E .000 8.95 13.60
F .000 -16.21 -10.55
G .000 8.29 12.93
H .000 5.02 8.74
E A .000 -13.60 -8.95
B .000 2.28 7.09
C .000 -13.72 -9.30
D .000 -20.27 -14.96
F .000 -27.80 -21.52
G .997 -3.35 2.02
H .000 -6.70 -2.10
Mathematics B A .000 -6.46 -2.31
C .000 -10.18 -6.32
D .000 -13.79 -8.86
E .000 2.51 7.55
F .000 -28.19 -22.13
G .874 -3.69 1.33
H .000 2.42 6.50
E A .000 -11.85 -6.98
B .000 -7.55 -2.51
C .000 -15.59 -10.97
D .000 -19.13 -13.58
F .000 -33.47 -26.91
G .000 -9.02 -3.40
H .998 -2.97 1.84
Note. DV = dependent variables; SC = school code for comparison; CI = confidence interval; LL = lower
limit; UL = upper limit; computed at p < .05.

72
Research Question 2
The second research question established the relationship between teachers’ level
of technology implementation and student achievement in mathematics and English. The
teacher’s level of technology implementation was determined using the results of the
online LoTi Digital-Age survey analyzed by LoTi profile. The survey instrument
encompasses levels of teaching innovation, personal computer use, and current
instructional practices (LoTi, 2014). These three components are pivotal to technology
integration into classroom instructions. The survey focused on teacher perceptions,
behaviors, and instructional practices, which jointly have an impact on student
achievement through the use of the varied digital tools and resources (LoTi, 2014). The
digital-age survey questionnaire was used to determine the level of technology
implementation for the participants (see Appendix A).
The levels of teaching innovation profile approximated the degree to which
participants supported or implemented the principles of digital-age teaching and learning
in a classroom setting. The degrees on the LoTi Framework (See Appendix B) range was
from Level 0 (Nonuse) to Level 6 (Refinement). Table 7 displays the level of teaching
innovation by participants in all the schools. A graphical representation showed that a
high percentage of the participants do not use technology (see Figure 5).
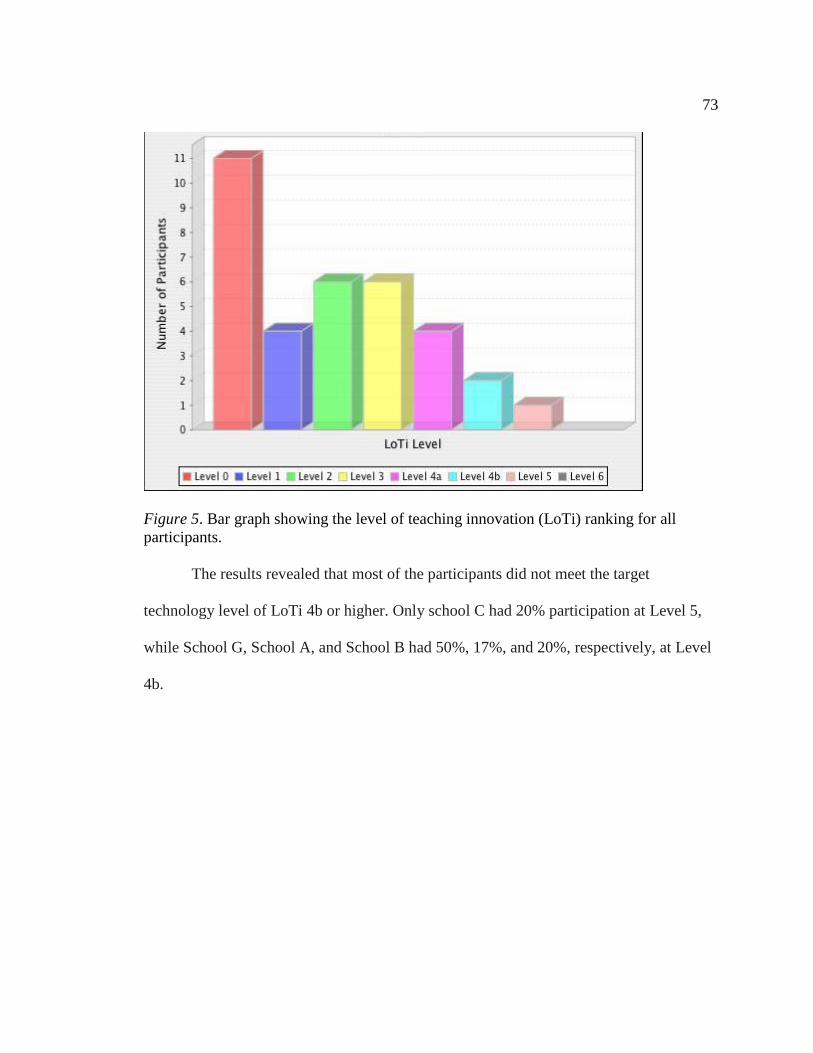
73
Figure 5. Bar graph showing the level of teaching innovation (LoTi) ranking for all
participants.
The results revealed that most of the participants did not meet the target
technology level of LoTi 4b or higher. Only school C had 20% participation at Level 5,
while School G, School A, and School B had 50%, 17%, and 20%, respectively, at Level
4b.
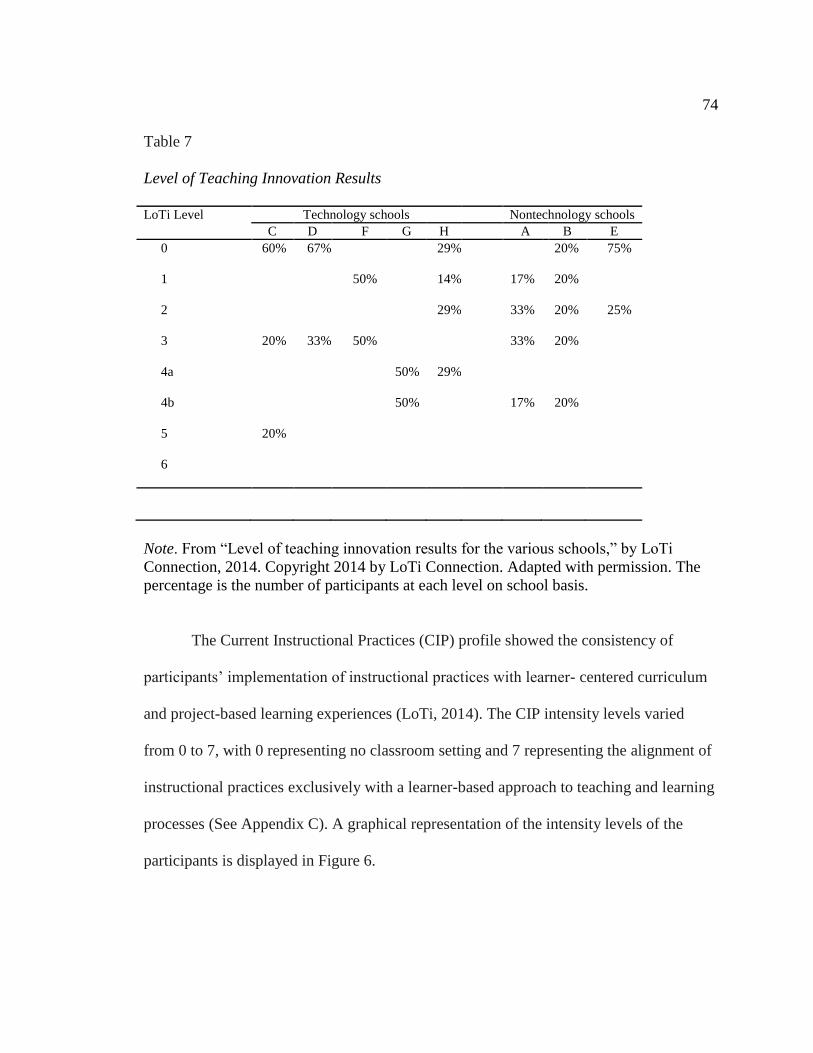
74
Table 7
Level of Teaching Innovation Results
LoTi Level Technology schools Nontechnology schools
C D F G H A B E
0 60% 67% 29% 20% 75%
1 50% 14% 17% 20%
2 29% 33% 20% 25%
3 20% 33% 50% 33% 20%
4a 50% 29%
4b 50% 17% 20%
5 20%
6
Note. From “Level of teaching innovation results for the various schools,” by LoTi
Connection, 2014. Copyright 2014 by LoTi Connection. Adapted with permission. The
percentage is the number of participants at each level on school basis.
The Current Instructional Practices (CIP) profile showed the consistency of
participants’ implementation of instructional practices with learner- centered curriculum
and project-based learning experiences (LoTi, 2014). The CIP intensity levels varied
from 0 to 7, with 0 representing no classroom setting and 7 representing the alignment of
instructional practices exclusively with a learner-based approach to teaching and learning
processes (See Appendix C). A graphical representation of the intensity levels of the
participants is displayed in Figure 6.
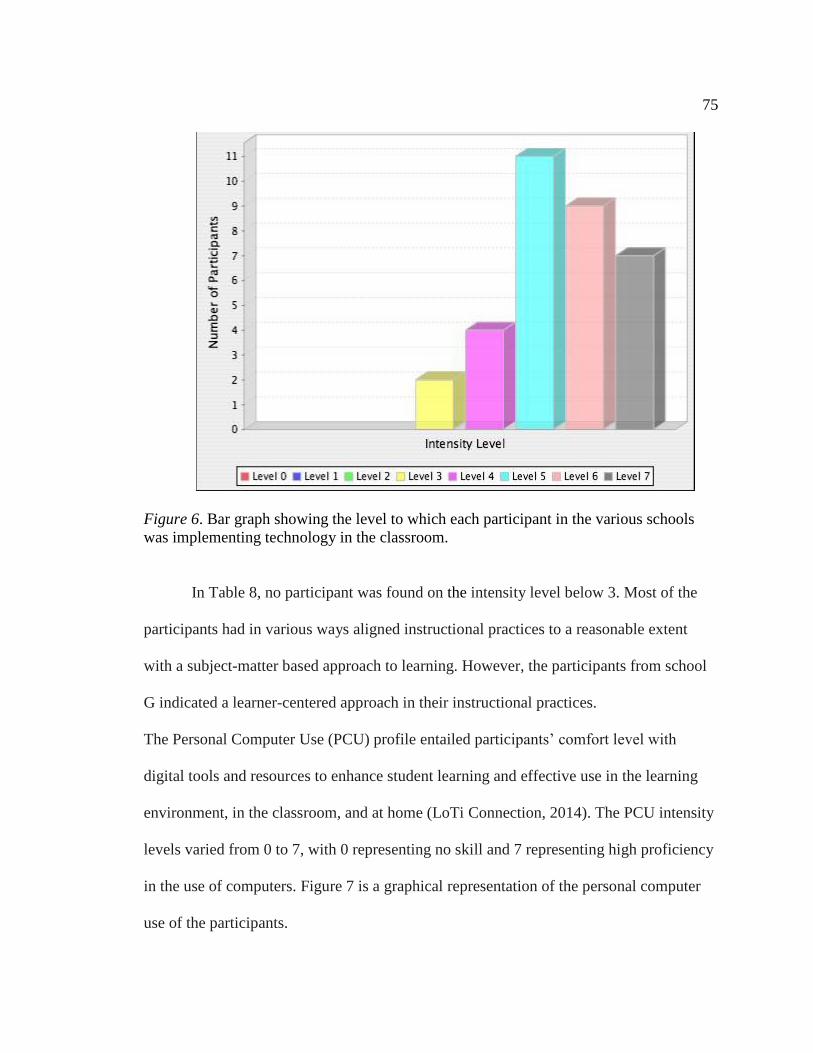
75
Figure 6. Bar graph showing the level to which each participant in the various schools
was implementing technology in the classroom.
In Table 8, no participant was found on the intensity level below 3. Most of the
participants had in various ways aligned instructional practices to a reasonable extent
with a subject-matter based approach to learning. However, the participants from school
G indicated a learner-centered approach in their instructional practices.
The Personal Computer Use (PCU) profile entailed participants’ comfort level with
digital tools and resources to enhance student learning and effective use in the learning
environment, in the classroom, and at home (LoTi Connection, 2014). The PCU intensity
levels varied from 0 to 7, with 0 representing no skill and 7 representing high proficiency
in the use of computers. Figure 7 is a graphical representation of the personal computer
use of the participants.

76
Table 8
Level of Current Instructional Practices Results
CIP Level Technology schools Nontechnology schools
C D F G H A B E
0
1
2
3 20% 25%
4 20% 75%
5 20% 50% 43% 50% 60%
6 20% 66% 50% 43% 33% 20%
7 20% 33% 100% 14% 17% 20%
Note. From “Level of current instructional practices results for the various schools,” by
LoTi Connection, 2014. Copyright 2014 by LoTi Connection. Adapted with permission.
The percent is the number of participants at each level on school basis.

77
Figure 7. Bar graph showing the level to which each participant in the various schools
was implementing technology in the classroom.
Table 9 showed an analysis of participants’ level of proficiency of the various
schools. No participant had intensity level 7 in all the schools. However, most of the
participants were still at low level of intensity, while some participants had no computer
skills.
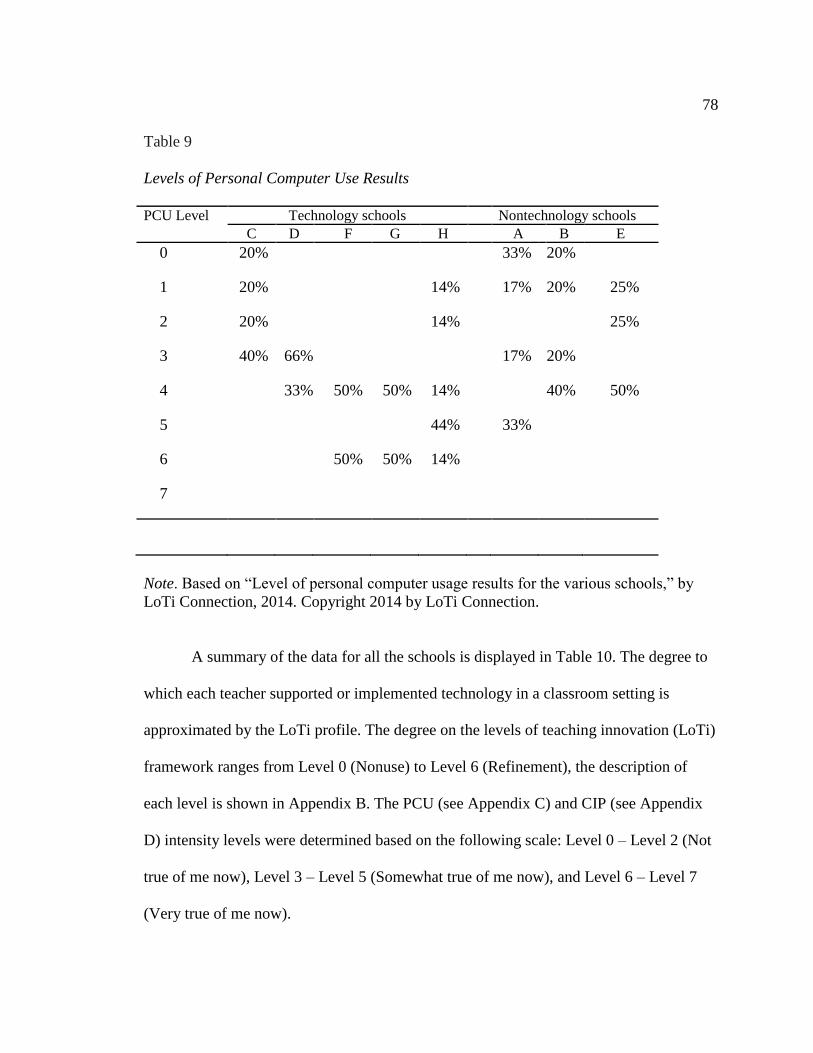
78
Table 9
Levels of Personal Computer Use Results
PCU Level Technology schools Nontechnology schools
C D F G H A B E
0 20% 33% 20%
1 20% 14% 17% 20% 25%
2 20% 14% 25%
3 40% 66% 17% 20%
4 33% 50% 50% 14% 40% 50%
5 44% 33%
6 50% 50% 14%
7
Note. Based on “Level of personal computer usage results for the various schools,” by
LoTi Connection, 2014. Copyright 2014 by LoTi Connection.
A summary of the data for all the schools is displayed in Table 10. The degree to
which each teacher supported or implemented technology in a classroom setting is
approximated by the LoTi profile. The degree on the levels of teaching innovation (LoTi)
framework ranges from Level 0 (Nonuse) to Level 6 (Refinement), the description of
each level is shown in Appendix B. The PCU (see Appendix C) and CIP (see Appendix
D) intensity levels were determined based on the following scale: Level 0 – Level 2 (Not
true of me now), Level 3 – Level 5 (Somewhat true of me now), and Level 6 – Level 7
(Very true of me now).

79
On average, the analysis of the responses of all participants for LoTi was L2
(Exploration) with a median score of 18%. Level 2 indicated that the emphasis was more
on content understanding with support for mastery learning and direct instruction.
However, student learning is at the lower levels of cognitive processing. The mode score
was 32% of the participants at Level 0 (Nonuse). The PCU profile addressed participants’
level of fluency with digital tools and resources to enhance student learning. The average
intensity level for all the participants was Level 3. Level 3 indicates that participants
exhibited adequate fluency with digital tools and resources usage for student learning.
The mode score was 21% with an intensity Level 4, indicating movement from adequate
fluency to high fluency of digital tools usage. The CIP median and mode score had
intensity Level 5; thus, the CIP profile showed participants’ instructional practices
support for learner-centered and research-based approaches. Level 5 indicated that the
participants’ instructional practices were on learning activities and teaching strategies
based on learners’ questions in the classroom.

80
Table 10
Summary of Digital-Age Survey for Teachers
School Code n LoTi PCU CIP
School category Technology
C 5 Level 0 Level 2 Level 5
D 3 Level 0 Level 3 Level 6
F 2 Level 1 Level 4 Level 5
G 2 Level 4a Level 4 Level 7
H 7 Level 2 Level 5 Level 6
Nontechnology
A 6 Level 2 Level 1 Level 5
B 5 Level 2 Level 3 Level 5
E 4 Level 0 Level 1 Level 4
Overall 34 Level 2 Level 3 Level 5
Note. Based on “LoTi data summary for digital-age survey for teachers showing various
levels of LoTi, PCU and CIP results for Each School” by LoTi Connection, 2014.
The LoTi digital-age priorities were based on the balance between instruction,
assessment, and digital tools usage to improve the teaching and learning processes in the
21st century learning environment. The summary was centered on five priorities as
described in Appendix E with details of each level priority. The priorities are: 1 -
Visionary Leadership; 2 - Digital-Age Learning Culture; 3 - Student Learning and
Creativity; 4 - Systemic Improvement; and 5 - Digital Citizenship, and these priorities aid
participants to determine the area of improvement in professional development. The
81
priority areas are aligned to the ISTE National Educational Technology for Teachers. The
overall data summary of participants on school basis is shown in Table 11.
The results from Table 11 revealed that student learning and creativity had the
highest-level need for professional development, while digital-age learning experiences
and assessments had the lowest-level need for professional development. The low priority
implies a score between 0 and 33%; mid priority is between 34% and 66%, and high
priority is between 67% and 100%. The assessment of student learning and creativity was
generated from the scores of the digital-age questionnaire for questions Q1, 4, 5, 8, 10,
14, 21, 22, 36, 38, 40, and 47 (see Appendix A), while, for digital-age learning
experiences, the assessment was generated from the scores of Q6, 20, 32, 41 and 50.
After the teacher’s level of technology implementation had been determined using
LoTi software, a Pearson’s correlation coefficient test to establish a relationship between
teachers’ level of technology implementation and student achievement in mathematics
and English was conducted. The Pearson’s correlation coefficient on the dependent
variables varied for the three aspects (LoTi, CIP, and PCU) of technology
implementation. The Pearson’s correlation coefficient for English mean scores versus
LoTi was not significant (r = -.417, p > .05). The implication is that no correlation exists
between student achievement in English and teachers’ level of teaching innovation. The
correlation coefficient between mathematics and LoTi (r = -.272, n = 8, p > .05) also
showed no significance. The correlation coefficient between English and CIP (r = .082, n
= 8, p > .05), as well as mathematics and CIP (r = .153, p >.05), showed no significance.
Thus, there was no correlation between student achievement in mathematics and English

82
and teachers’ current instructional practices. For the correlation between English and
PCU (r =-.019, n = 8, p > .05) and mathematics and PCU (r = -.017, n = 8, p > .05), the
coefficient implies nonsignificance. The hypothesis that there is a relationship between
teachers’ level of technology implementation and student achievement in English and
mathematics is rejected.
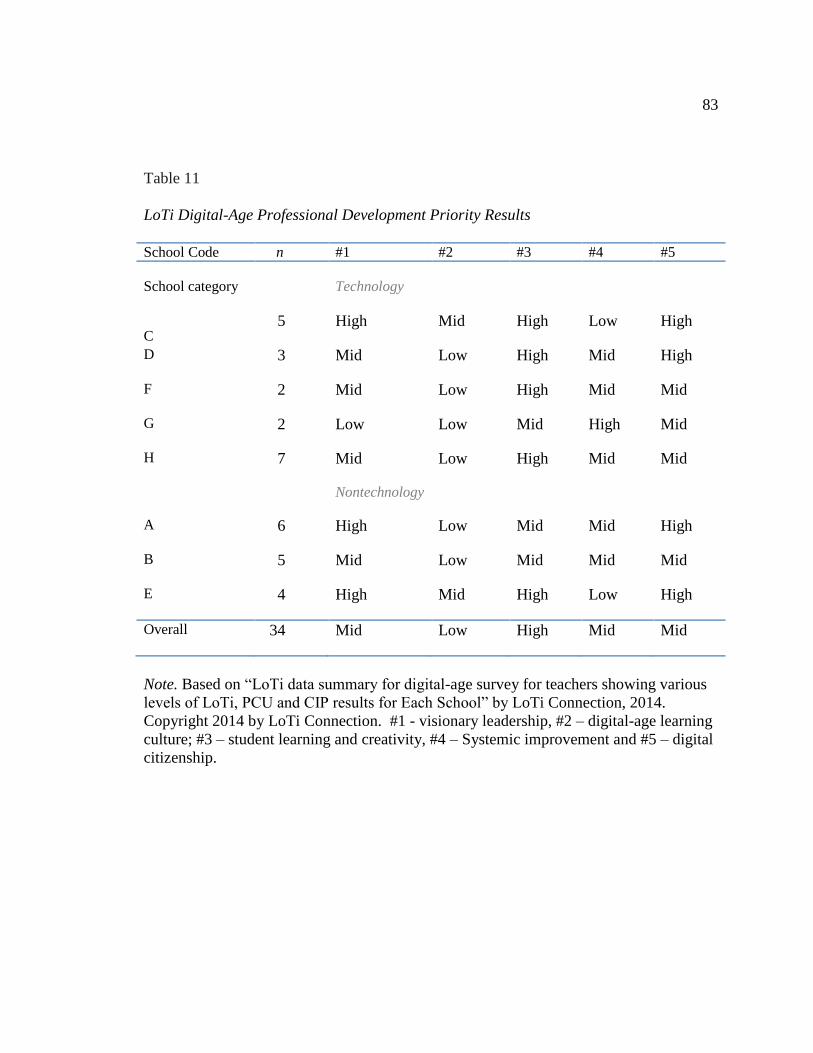
83
Table 11
LoTi Digital-Age Professional Development Priority Results
School Code n #1 #2 #3 #4 #5
School category Technology
C 5 High Mid High Low High
D 3 Mid Low High Mid High
F 2 Mid Low High Mid Mid
G 2 Low Low Mid High Mid
H 7 Mid Low High Mid Mid
Nontechnology
A 6 High Low Mid Mid High
B 5 Mid Low Mid Mid Mid
E 4 High Mid High Low High
Overall 34 Mid Low High Mid Mid
Note. Based on “LoTi data summary for digital-age survey for teachers showing various
levels of LoTi, PCU and CIP results for Each School” by LoTi Connection, 2014.
Copyright 2014 by LoTi Connection. #1 - visionary leadership, #2 – digital-age learning
culture; #3 – student learning and creativity, #4 – Systemic improvement and #5 – digital
citizenship.

84
Table 12 showed the analysis of the Pearson’s correlation coefficient. The
coefficient values for LoTi and PCU are negative tending towards a very weak
relationship. Categorically, teachers’ level of technology implementation does not affect
the student achievement in English and mathematics.
Table 12
Correlation between the Dependent Variables and LoTi Subscales
Pearson’s r P value
English Mathematics English Mathematics
LoTi -.417 -.272 .304 .515
CIP .082 .153 .848 .717
PCU -.019 -.017 .965 .968
Summary
Chapter 4 provided a detailed description of school demographics, data collection
and analysis, results, and summary of the study on the impact of technology interventions
on student achievement in English and mathematics in rural schools. The schools were
categorized into technology-enabled and nontechnology-enabled schools. The data were
analyzed using the SPSS package and LoTi profiler software. The results revealed
significant differences in student achievement in English and mathematics and
technology-enabled and nontechnology-enabled schools. The teachers’ level of
technology implementation was determined based on three aspects: level of teaching
innovation, current instructional practices, and personal computer use. The results
showed a low level of teaching innovation using digital tools and resources, alignment of
instructional practices at a minimal level with subject-matter based approaches, and high
comfort with personal computers use to enhance student learning. Results of further
85
analysis on the relationship of teachers’ level of technology implementation and student
achievement revealed no correlation.
A discussion of these results and recommendations for future research and
practice appear in Chapter 5.

86
Chapter 5: Discussion, Conclusions, and Recommendations
Introduction
The purpose of this causal comparative study was to determine the impact of the
technology interventions that were deployed to rural schools in Nigeria on student
achievement in English and mathematics. This study was designed to determine if the
deployed solutions met teachers’ needs with the ability to integrate technology into
classroom instruction and the impact of technology usage on learners’ achievement. The
findings revealed that the mean score of students for mathematics and English in
technology-enabled schools was higher than nontechnology-enabled schools. Further,
using the LoTi profile, teachers’ level of technology implementation in the classroom
was at low or nonuse levels for both technology-enabled and nontechnology-enabled
schools, and there was no correlation between teachers’ level of technology
implementation and student performance. In the remaining part of this chapter I discuss
the findings, limitations of the study, recommendations for further research, implications
for social change, and conclusions.
Interpretation of the Findings
The technology interventions in the participating schools were mostly one-to-one
laptops, computer laboratories, and multimedia centers, except one school with a
nonfunctional IWB. On this premise, the interpretation of this study’s findings will focus
on one-to-one laptops initiatives, the description of technology integration in the
classroom, and the impact on student achievement based on the peer-reviewed literature
in Chapter 2. The study examined the SS2 students’ scores in mathematics and English

87
from all participating schools. The MANOVA was used to determine the varying
significant differences in mathematics and English between technology and
nontechnology schools. The findings showed a higher mean score for technology schools
and a lower mean score for nontechnology schools. The data set used help answer
Research Question 1: Is there a difference in student achievement in mathematics and
English between technology-enabled and nontechnology-enabled schools?
The results showed a significant difference in student performance in the different
learning environments. The students in technology schools performed better than the
students in nontechnology schools. These findings can be related to Shapley et al. (2010),
who demonstrated that technology access and use were positive predictors of students’
TAKS reading and mathematics scores. Also, other researchers revealed that the one-to-
one initiatives had an impact on student academic achievement and proficiency (Bebell &
Kay, 2010; Jing & Yong, 2008). Further, Neill and Mathews (2009) revealed that
technology interventions improved student achievement in mathematics and language
arts. Suhr et al. (2010) showed that students in technology schools performed better than
students in nontechnology schools. Several studies have confirmed that the use of
technology had a positive impact on student achievement (Bebell & Kay, 2010; Neill &
Mathews, 2009; Shapley et al., 2010; Suhr et al., 2010). A few studies noted that the
impact of technology on student achievement might be dependent on teachers’ usage and
students’ motivation and enthusiasm (Mellon, 2011; Norris & Soloway, 2010). The
implication is that there might be other contextual factors that led to improved student
performance.

88
Furthermore, this study examined the relationship between teachers’ level of
technology implementation and student achievement to determine the impact of
technology use in the classroom on student performance. The findings of teachers’ level
of technology implementation using LoTi framework revealed the levels of technology
implementation based on LoTi, CIP, and PCU. The results indicated that the teachers
have access to computers for instructional use, but most of the teachers were clustered in
Levels 0 to 2. These are low levels of the LoTi framework (see appendices), which
focuses on teacher's use of productivity tools, student use of tutorial programs, and
“project-based” learning opportunities at the low-order thinking levels of knowledge or
comprehension (LoTi Connection, 2014). Malcolm-Bell (2012) corroborated the result
that technology integration is at low levels in instruction and learning in the schools in
Jamaica. Other studies revealed that the low level of implementation might be a result of
other factors affecting teachers’ use of technology (Solvie & Kloek, 2007; Tamim et al.,
2011).
A further analysis of these results was a comparative test of the LoTi scores and
the student performance mean score. The correlation test revealed no relationship
between teachers’ level of technology implementation and student achievement. Based
on other research, the nonexistence of a relationship might be a result of teachers’ use of
technology and adoption, beliefs, and practices (Cifuentes et al., 2011; Levin &
Wadmany, 2008; Martin et al., 2010; Tamim et al., 2011; Wright & Wilson, 2011).
In this study, the result of Research Question 2 was dependent on the result of
Research Question 1. Therefore, the findings did not suggest that the technology

89
interventions had a direct positive impact on student achievement when teachers’ level of
usage was at a low level. The implication is that other factors might have led to better
student performance. Supporting the existence of other factors is the univariate analysis
carried out for Research Question 1, which showed the mean score of a nontechnology
school to be higher than the mean score of two of the technology schools. Invariably,
other factors might accentuate the difference in performance between the schools.
Limitations of the Study
One of the limitations of this study was the restriction that participants were
exclusively SS2 teachers. The number of teachers in most of the schools was very low
compared with the students’ population. Most of the schools were understaffed, thereby
leading to low participation in the online survey. Another unforeseen limitation was
teachers’ poor ability to access and use technology. Some of the teachers lacked a
functional e-mail address, a prerequisite to accessing the online survey. The LoTi
organization does not offer a paper-and-pencil survey; thus, some of the participants were
not technologically able to participate. The difficulty with technology use affected the
timeline, but providing telephonic and online support for the participants mitigated the
problem.
A follow-up telephone conversation with the teachers revealed that the survey
process was cumbersome. Some teachers had a technology phobia or a negative attitude
toward technology. There was a time factor because of the end-of-school term
examination and marking, and there was a lack of electricity (and therefore Internet)
during school hours. One particular school had only one English teacher, who chose not

90
to participate in the study. Though the effect on the overall results might not be
significant, a simple test on school-by-school basis would not generate any result for such
a school. The varied school population, which was unknown at the time of the study
design, might have affected the findings.
Recommendations
The major recommendation that came out of this study is that it be used as a guide
in developing countries with similar demographics. This study focused on two
hypotheses, and the results showed a significant difference in student achievement
between technology and nontechnology schools. However, there were discrepancies
among some of the schools in which the mean score of students in nontechnology school
was better than the mean score of students in technology school. There is a need to
discover the factors that cause such differences. The hypothesis that there was a
relationship between teachers’ level of technology implementation and student
achievement revealed no relationship. Further research involving a mixed-methods
approach and direct interview with teachers might give more insights into how
technology is used in the classroom.
The overall results showed that the level of technology implementation of
teachers both in technology and nontechnology schools was very low. An implication for
further research is to ascertain the hindrances of effective use of technology. Several
studies (Alege & Afolabi, 2011; Anderson & Maninger, 2007; Groff & Mouza, 2008;
Inan & Lowther, 2010) have examined factors affecting the effective use of technology in
the classroom. However, the varied infrastructure and technology tools available in most

91
developing countries might reveal new findings for those in developing countries. The
locations of the schools are within the same rural community, but the demographic
characteristics of the schools varied in terms of the student population, the teacher
population, and facilities. Therefore, categorization of schools within the same population
range might be used for further study.
Other researchers have identified similar needs for further study in their various
research works. According to McKinley (2014), further study need to be conducted to
determine if more specific demographics and attitude toward technology affect
technology implementation. Malcolm-Bell (2012) suggested a further study to ascertain
the findings by replicating the study in similar demographics. Berkeley-Jones (2012)
expressed a study to determine the effect of teachers’ professional development on
student performance in relation to the level of technology implementation.
Implications
The impact of social change in any society reflects the ability of the citizens to
acclimatize with the evolving technological trends in their daily lives. This study has
provided avenues to determine the technology interventions that might work best in a
rural community. The findings of the varied differences in student achievement between
technology and nontechnology-enabled schools gave an accurate description of what is
obtainable in most of the schools, irrespective of their locale or availability of
technology. It also showed the level of teachers’ technology implementation in the varied
learning environments.

92
The study contributed to the potential for social change by providing teachers the
evidential data to integrate technology into classroom instruction. Teachers can increase
the level of innovative teaching, instructional practices, and computer use by moving
from a lower level of technology implementation and thinking skills to a higher level of
technology implementation. Social change in the schools and classrooms is forthcoming
in rural communities as teachers see the need to seamlessly infuse technology at a higher
level in order to fulfill the 21st-century learner-centered approach.
Furthermore, the results of the study will guide the stakeholders, especially the
Ministry of Education and its affiliate bodies, and other private organizations that have
invested and equipped the schools with technology interventions, on what worked best
and the status of usage. The study has added to the knowledge base and literature on the
technology interventions deployed in rural schools in a developing country. Also, the
study will help stakeholders to collaborate and consider other factors that will facilitate
the best use of technology in the schools prior to deployment. It is anticipated that the
study will be an avenue for change by providing a basis for other researchers to conduct
further studies on technology integration in rural communities taking cognizance of other
contextual factors.
The study may be resource material for other developing countries with similar
demographics to consider various factors prior to deploying technology solutions to
schools in rural areas. The results may provide rural schools that have experienced
deprivation of access to technology-rich education the opportunity to receive
interventions from stakeholders.

93
The foundation of this theoretical/conceptual framework used in the study (LoTi
framework) is based on the principles of the constructivist approach to learning that
fosters high levels of student achievement in a student-centered learning environment.
Based on the results of this study, the learner-centered approach is still at a low level.
Schools should encourage teachers to adopt the learner-centered strategies and use the
LoTi framework as a tool for the alignment of instructional practices for teaching and
learning. Most of the participants in the study claimed that they had access to digital
tools, but the results showed a low level of usage. The suggestion is that schools should
incorporate the use of LoTi framework for professional development in order to align
teachers with constructivist instructional and teaching practices.
There was no statistical significant relationship between teachers’ level of
technology implementation and student achievement in mathematics and English. The
observation was that the nontechnology school A students with teachers’ level of
technology implementation at exploration level (Level 2) outperformed technology
School G students with teachers’ level of technology implementation at integration level
(Level 4a). Various factors may account for this inconsistency. Qualitative data in terms
of interviews and classroom observations to determine the actual technology use in the
classroom and the self-reported use as filled in the online LoTi survey instrument may
require consideration.
The following recommendations for the schools and teachers are based upon the
results of this study:

94
Provide staff development tailored toward definite strategies and techniques
for the integration of higher-order thinking skills and engaged learning using
available technology interventions resources. Participants’ level of teaching
innovation will move to a higher level.
Make available staff development that increases participants’ confidence and
competence with designing LoTi higher levels learning experiences using a
constructivist, learner-based approach to curriculum formation. The staff
development will help to move teachers to LoTi Level 4a and 4b (target
technology), and improve the views of teachers at LoTi 4a regarding their
ability to support or promote authentic, problem-solving learning
opportunities.
Review professional development programs where they exist, and where not.
Each school should develop professional development programs that would
help teachers achieve more of the attributes of a student-centered curriculum.
Help schools and the government and private sectors collaborate to develop a
technology plan. Identification of adequate infrastructure and specific
resources to support technology integration should be considered prior to the
deployment of any form of technology interventions.
Give priority to a constant public power supply and alternate power supply,
such as inverters, over generators. Some schools were apparently unable to
fuel their generators because of the cost implication.

95
Create new approaches to professional development to enable teachers make
better connections between technology use and student realistic problem-
solving in the classroom.
Conclusion
Emerging technologies are tools to enhance teaching and learning processes.
Nigeria, as a developing country, still lacks technology-rich education and adequate
expertise to implement technology in a learning environment. The government and
private sector organizations, in an attempt to bridge the digital gap, have invested and
equipped some rural schools with technology facilities. The result, however, has not
evidentially reflected on student academic achievement. The central focus of this study
was to determine the impact of technology interventions that were deployed to rural
schools in Nigeria on student achievement. The findings revealed significant differences
in student achievement in mathematics and English between technology and
nontechnology schools, as well as no correlation between teachers’ level of technology
implementation and student achievement. The nature of the results is important
information for all stakeholders, as it shows that the improper implementation and nonuse
of technology have not added significant value to student learning. The funding partners
should explore other factors that might accentuate ineffective use of the technology
facilities in rural communities, put in place measures that would guide the technology
interventions process, and devise strategies to mitigate barriers to technology integration.
The schools are responsible for sustainable technology plan and provision of adequate
professional development for staff in order to have a technology-rich learning
96
environment. The onus is for teachers to use technological tools effectually and
efficiently for instructional practices that would invariably affect and add value to student
academic performance. It is hoped that this research will motivate all stakeholders to
consider some of the recommendations, and to encourage student-centered learning
approach for the transformation of classroom practices, thereby leading to a positive
social change in our society.

97
References
Adewole, A. P., Akinwale, A. T., & Omokanye, B. M. (2008). A consulting information
and communication technologies (IcTs) teacher model for teaching secondary
school curriculum. College of Natural Sciences Proceedings, 1, 38-46. Retrieved
from journal.unaab.edu.ng/index.php/COLNAS/article/download/138/141
Adomi, E. E., & Kpangban, E. (2010). Application of ICTs in Nigerian secondary
schools. Library Philosophy and Practice (e-journal), 12(3), 45-52. Retrieved
from http://www.webpages.uidaho.edu/~mbolin/adomi-kpangban.htm
Akanbi, B. E. & Akanbi, C.O. (2012). Bridging the digital divide and the impact on
poverty in Nigeria. Journal of Computing, Information Systems & Development
Informatics, 3(4), 81-87. Retrieved from
http://iiste.org/Journals/index.php/CIS/article/view/10139
Alege, B., & Afolabi, S. (2011). Survey of teachers’ use of computer/internet in
secondary schools in Southwest Nigeria. Proceedings of the European
Conference on e-Learning 2011. Retrieved from
http://connection.ebscohost.com/c/articles/69728079/survey-teachers-use-
computer-internet-secondary-schools-south-west-nigeria
Alfaro, F. (2008). The relationship of teacher perceptions of the impact of technology
integration on Texas assessment of knowledge and skills (TAKS) scores of 9th--
11th grade students at Alamo Heights Independent school district, San Antonio,
Texas (Doctoral dissertation). Retrieved from ProQuest Dissertations and Theses
database. (AAT 3321629)
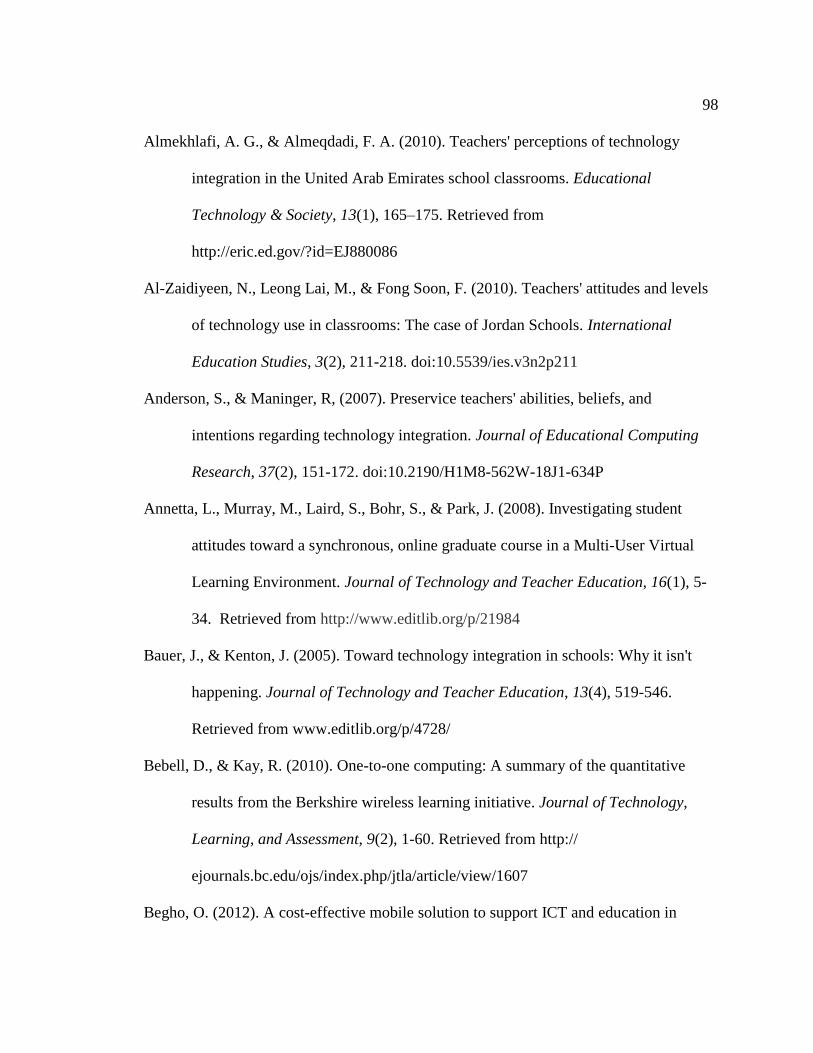
98
Almekhlafi, A. G., & Almeqdadi, F. A. (2010). Teachers' perceptions of technology
integration in the United Arab Emirates school classrooms. Educational
Technology & Society, 13(1), 165–175. Retrieved from
http://eric.ed.gov/?id=EJ880086
Al-Zaidiyeen, N., Leong Lai, M., & Fong Soon, F. (2010). Teachers' attitudes and levels
of technology use in classrooms: The case of Jordan Schools. International
Education Studies, 3(2), 211-218. doi:10.5539/ies.v3n2p211
Anderson, S., & Maninger, R, (2007). Preservice teachers' abilities, beliefs, and
intentions regarding technology integration. Journal of Educational Computing
Research, 37(2), 151-172. doi:10.2190/H1M8-562W-18J1-634P
Annetta, L., Murray, M., Laird, S., Bohr, S., & Park, J. (2008). Investigating student
attitudes toward a synchronous, online graduate course in a Multi-User Virtual
Learning Environment. Journal of Technology and Teacher Education, 16(1), 5-
34. Retrieved from http://www.editlib.org/p/21984
Bauer, J., & Kenton, J. (2005). Toward technology integration in schools: Why it isn't
happening. Journal of Technology and Teacher Education, 13(4), 519-546.
Retrieved from www.editlib.org/p/4728/
Bebell, D., & Kay, R. (2010). One-to-one computing: A summary of the quantitative
results from the Berkshire wireless learning initiative. Journal of Technology,
Learning, and Assessment, 9(2), 1-60. Retrieved from http://
ejournals.bc.edu/ojs/index.php/jtla/article/view/1607
Begho, O. (2012). A cost-effective mobile solution to support ICT and education in

99
Nigeria. Retrieved from http://www.futuresoft-ng.com/IT-Talk/Articles/ict-
education-africa/
Berkeley-Jones, C. S. (2012). A study of the relationship between levels of technology
implementation (LoTi) and student performance on Texas Assessment of
Knowledge and Skills (TAKS) Scores (Doctoral dissertation). ProQuest
Dissertations and Theses database. (UMI No. 3532058)
Berry, R. L. (2011). Teachers' perception of computer use and technical support in a
rural Virginia school division: A case study (Doctoral dissertation). ProQuest
Dissertations and Theses database. (UMI No. 3490693)
Brewer, E. W., & Kuhn, J. (2010). Causal-comparative design. In Encyclopedia of
research design. Retrieved from http://sage-
ereference.com/view/researchdesign/n42.xml
Buckenmeyer, J. (2008). Revisiting teacher adoption of technology: Research
implications and recommendations for successful full technology integration.
College Teaching Methods & Styles Journal (CTMS), 4(6), 7-10. Retrieved from
http://www.cluteinstitute.com/ojs/index.php/CTMS/article/view/5554
Cakir, H., Delialioglu, O., Dennis, A. & Duffy, T. (2009). Technology enhanced learning
environments for closing the gap in student achievement between regions: Does it
work? AACE Journal, 17(4), 301-315. Retrieved from
http://www.editlib.org/p/29511
Cifuentes, L., Maxwell. G., & Bulu, S. (2011). Technology integration through
professional learning community. Journal of Educational Computing Research,

100
44(1), 59-82.
Creative Research Systems. (2012). The survey system. Retrieved from
http://www.surveysystem.com/sscalc.htm
Creswell, J. W., & Plano Clark, V. L. (2011). Designing and conducting mixed methods
research. Thousand Oaks, CA: Sage.
Cullen, T., Frey, T., Hinshaw, R., & Warren, S. (2004). Technology grants and rural
schools: The power to transform. Paper presented at the annual meeting of the
Association for Educational Communications and Technology, Chicago, IL.
Digregorio, P. & Sobel-Lojeski, K. (2010). The effects of interactive whiteboards (IWBs)
on student performance and learning: A literature review. Journal of Educational
Technology, 38(3), 255-312. doi:10.2190/ET.38.3.b
Dwyer, D. C., Ringstaff, C., & Haymore, J. (1994). Apple classrooms of tomorrow.
Educational Leadership, 51(7), 4-10. Retrieved from
http://www.ascd.org/publications/educational-
leadership/apr94/vol51/num07/Apple-Classrooms-of-Tomorrow@-What-We've-
Learned.aspx
Federal Capital Territory. (2012). Education Management Information System. Retrieved
from www.fctemis.net
Fields, V. (2005). Teacher levels of technology implementation and student achievement
in reading and mathematics. In C. Crawford et al. (Eds.), Proceedings of Society
for Information Technology & Teacher Education International Conference 2005
(pp. 3358-3361). Retrieved from http://www.editlib.org/p/19649
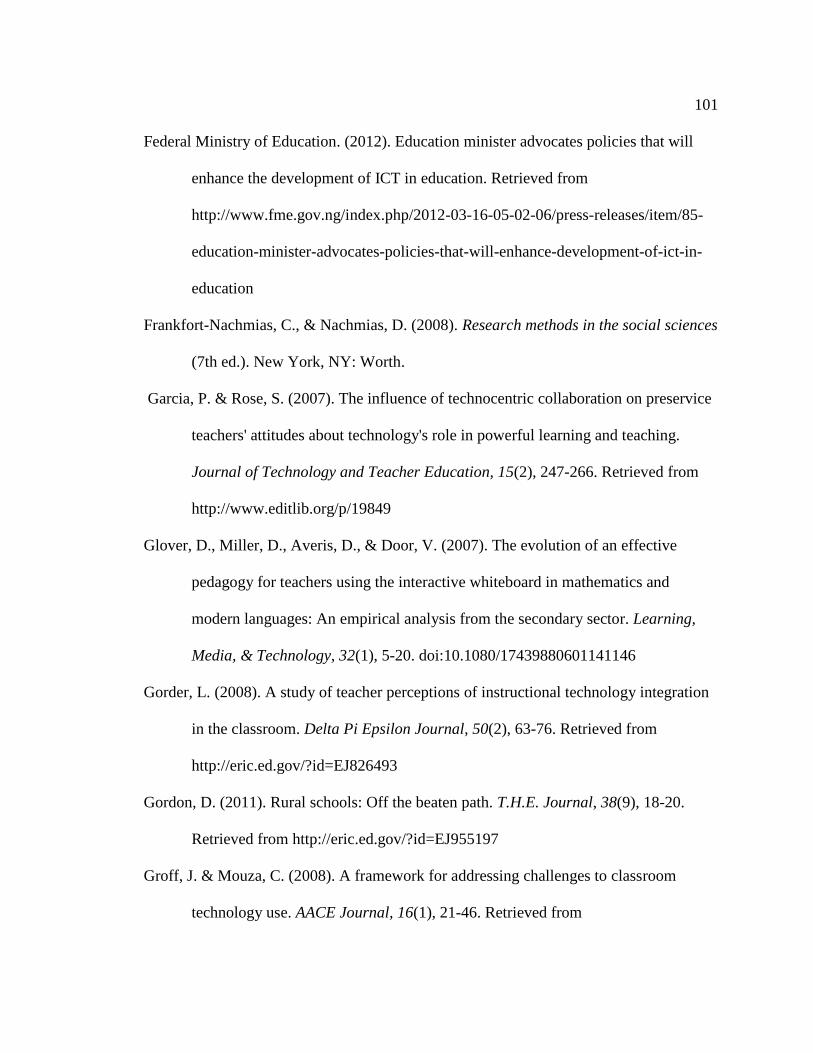
101
Federal Ministry of Education. (2012). Education minister advocates policies that will
enhance the development of ICT in education. Retrieved from
http://www.fme.gov.ng/index.php/2012-03-16-05-02-06/press-releases/item/85-
education-minister-advocates-policies-that-will-enhance-development-of-ict-in-
education
Frankfort-Nachmias, C., & Nachmias, D. (2008). Research methods in the social sciences
(7th ed.). New York, NY: Worth.
Garcia, P. & Rose, S. (2007). The influence of technocentric collaboration on preservice
teachers' attitudes about technology's role in powerful learning and teaching.
Journal of Technology and Teacher Education, 15(2), 247-266. Retrieved from
http://www.editlib.org/p/19849
Glover, D., Miller, D., Averis, D., & Door, V. (2007). The evolution of an effective
pedagogy for teachers using the interactive whiteboard in mathematics and
modern languages: An empirical analysis from the secondary sector. Learning,
Media, & Technology, 32(1), 5-20. doi:10.1080/17439880601141146
Gorder, L. (2008). A study of teacher perceptions of instructional technology integration
in the classroom. Delta Pi Epsilon Journal, 50(2), 63-76. Retrieved from
http://eric.ed.gov/?id=EJ826493
Gordon, D. (2011). Rural schools: Off the beaten path. T.H.E. Journal, 38(9), 18-20.
Retrieved from http://eric.ed.gov/?id=EJ955197
Groff, J. & Mouza, C. (2008). A framework for addressing challenges to classroom
technology use. AACE Journal, 16(1), 21-46. Retrieved from
102
http://www.editlib.org/p/24421
Gurevich, I., & Gorev, D. (2012). Examining the impact of an integrative method of
using technology on students' achievement and efficiency of computer usage and
on pedagogical procedure in geometry. International Journal for Technology in
Mathematics Education, 19(3), 95-104. Retrieved from
http://eric.ed.gov/?id=EJ990817
Hall, I., & Higgins, S. (2005). Primary school students’ perceptions of interactive
whiteboards. Journal of Computer Assisted Learning, 21(2), 102-117. doi:
10.1111/j.1365-2729.2005.00118.x
Hall, G., & Loucks, S. (1979). Implementing innovations in schools: A concerns-based
approach. Austin, TX: Research and Development Center for Teacher Education,
University of Texas.
Hammond, M. M., Reynolds, L. L., & Ingram, J. J. (2011). How and why do student
teachers use ICT? Journal of Computer Assisted Learning, 27(3), 191-203. doi:
10.1111/j.1365-2729.2010.00389.x
Higgins, S., Beauchamp, G., & Miller, D. (2007). Reviewing the literature on interactive
whiteboards. Learning, Media, & Technology, 32(3), 213-225. doi:
10.1080/17439880701511040
Holmes, K. (2009). Planning to teach with digital tools: Introducing the interactive
whiteboard to pre-service secondary mathematics teachers. Australasian Journal
of Educational Technology, 25(3), 351-365. Retrieved from
http://www.ascilite.org.au/ajet/ajet25/holmes.html

103
Hossain, M.M. & Quinn, R.J. (2013). Investigating relationships between attitudes
toward the use of Web 2.0 technologies and mathematical achievement. In R.
McBride & M. Searson (Eds.), Proceedings of Society for Information
Technology & Teacher Education International Conference 2013 (pp. 3916-
3922). Retrieved from http://www.editlib.org/p/48728
Howley, A., Wood, L., & Hough, B. (2011). Rural elementary school teachers’
technology integration. Journal of Research in Rural Education, 26(9), 1-13.
Retrieved from http://jrre.psu.edu/articles/26-9.pdf
Inan, F., & Lowther, D. (2010). Factors affecting technology integration in K-12
classrooms: a path model. Educational Technology, Research and
Development, 58(2), 137-154. doi:10.1007/s11423-009-9132-y
Ivankova, N. V., Creswell, J. W., & Stick, S. L. (2006). Using mixed-methods sequential
explanatory design: From theory to practice. Field Methods, 18(1), 3-20. doi:
10.1177/1525822X05282260
Jaber, W. E. (1997). A survey of factors which influence teachers’ use of computer-based
technology (Doctoral dissertation).Retrieved from ProQuest Dissertations and
Theses database. (UMI No. 9936916)
Jegede, P. O., & Owolabi, J. A. (2003). Computer education in Nigerian secondary
schools. Gaps between policy and practice. Meridian: A Middle School
Computer Technologies Journal, 6(2), 1-5. Retrieved from
http://www.ncsu.edu/meridian/sum2003/nigeria/index.html
Johnson, B. (2001). Toward a new classification of non-experimental quantitative

104
Research. Educational Researcher, 30(2), 3-13. Retrieved from
http://eric.ed.gov/?id=EJ624225
Johnson, B. & Christensen, L. (2004). Educational research: Quantitative, qualitative,
and mixed approaches (2nd ed.). Boston, MA: Pearson A and B.
Jones, A., & Vincent, J. (2010). Collegial mentoring for effective whole school
professional development in the use of IWB technologies. Australasian Journal of
Educational Technology, 26(4), 477-493. Retrieved from
http://eric.ed.gov/?id=EJ895455
Joshi, A., Pan, A., Murakami, M., & Narayanan, S. (2010). Role of computers in
educating young children: U.S. and Japanese teachers' perspectives. Computers in
the Schools, 27(1), 5-19. doi:10.1080/07380560903536249
Judson, E. (2006). How teachers integrate technology and their beliefs about learning: Is
there a connection? Journal of Technology and Teacher Education, 14(3), 581–
597. Retrieved from http://eric.ed.gov/?id=EJ729639
Lai, H. (2010). Secondary school teachers' perceptions of interactive whiteboard training
workshops: A case study from Taiwan. Australasian Journal of Educational
Technology, 26(4), 511-522. Retrieved from http://eric.ed.gov/?id=EJ895457
Lavrakas, P. (2008). Encyclopedia of survey research methods. doi:
10.4135/9781412963947
Lei, J. (2010). Quantity versus quality: A new approach to examine the relationship
between technology use and student outcomes. British Journal of Educational
Technology, 41(3), 455-472. doi:10.1111/j.1467-8535.2009.00961.x

105
Lei, J., & Zhao, Y. (2008). One-to-one computing: What does it bring to schools?
Journal of Educational Computing Research, 39(2), 97-122.
doi:10.2190/EC.39.2.a
Levin, T. & Wadmany, R. (2008). Teachers’ views on factors affecting effective
integration of information technology in the classroom: Developmental scenery.
Journal of Technology and Teacher Education, 16(2), 233-263. Retrieved from
http://www.editlib.org/p/22950
Lewin, C., Somekh, B., & Steadman, S. (2008). Embedding interactive whiteboards in
teaching and learning: The process of change in pedagogic practice. Education &
Information Technologies, 13(4), 291-303. doi:10.1007/s10639-008-9070-z
Lewis, J. A. (2010). Improving rural K-12 teachers' use of technology for instruction and
student learning (Doctoral dissertation). ProQuest Dissertations and Theses
database. (UMI No. 3413572)
Lim, C. P., Zhao, Y., Tondeur, J., Chai, C. S., & Tsai, C. C. (2013). Bridging the gap:
Technology trends and use of technology in schools. Educational Technology &
Society, 16 (2), 59–68. Retrieved from
http://repository.ied.edu.hk/dspace/handle/2260.2/13176
LoTi Connection. (2011). LoTi framework. Retrieved from
http://www.loticonnection.com/index.php/more/frameworks/20-loti-framework
LoTi Connection. (2014). Level of technology implementation use profile for Bello’s
dissertation study. Carlsbad, CA: LoTi Connection.
Lowther, D. L., Inan, F. A., Strahl, J. D., & Ross, S. M. (2008). Does technology

106
integration when key barriers are removed? Educational Media International,
45(3), 189–206. doi:10.1080/09523980802284317
Malcolm-Bell, A. (2010). A mixed methods study of technology integration in rural
primary and secondary high schools in Jamaica (Doctoral dissertation). ProQuest
Dissertations and Theses database. (UMI No. 3403023)
Martin, S. (2007). Interactive whiteboards and talking books: A new approach to teaching
children to write? Literacy, 41(1), 26-34. doi:10.1111/j.1467-9345.2007.00449.x
Martin, W., Strother, S., Beglau, M., Bates, L., Reitzes, T., & Culp, K. (2010).
Connecting instructional technology professional development to teacher and
student outcomes. Journal of Research on Technology in Education, 43(1), 53-
74. doi:10.1080/15391523.2010.10782561
Marwan, A., & Sweeney, T. (2010). Teachers’ perceptions of educational technology
integration in an Indonesian polytechnic. Asia Pacific Journal of Education,
30(4), 463-476. doi:10.1080/02188791.2010.519554
Marzano, R. J. (2009). Teaching with interactive whiteboards. Educational Leadership,
67(3), 80-82. Retrieved from http://www.ascd.org/publications/educational-
leadership/nov09/vol67/num03/Teaching-with-Interactive-Whiteboards.aspx
McIntyre-Brown, C. (2011). Understanding the next wave of technology innovation in
education: UK. Retrieved from http://www.futuresource-
consulting.com/pdfs/2011-01_Futuresource-
UK_UnderstandingNext%20WaveTechnology.pdf
McKinley, B. M. (2014). The relationship of faculty demographics and attitudes toward

107
technology integration (Doctoral dissertation). Retrieved from ProQuest
Dissertations and Theses database. (UMI No. 3610201)
Mellon, E. (2011). Laptops lead to love of learning. Retrieved from
http://www.districtadministration.com/article/laptops-lead-love-learning
Mitchell, J., Hunter, J., & Mockler, N. (2010). Connecting classrooms in rural
communities through interactive whiteboards. Australasian Journal of
Educational Technology, 26(4), 464-476. Retrieved from
http://www.ascilite.org.au/ajet/ajet26/mitchell.html
Moersch, C. (1995). Levels of technology implementation (LoTi): A framework for
measuring classroom technology use. Learning and Leading with Technology.
23(3), 40-42. Retrieved from http://eric.ed.gov/?id=EJ515029
Moersch, C. (1997). Computer efficiency: Measuring the instructional use of technology.
Learning & Leading with Technology, 24(4), 52-56. Retrieved from
http://eric.ed.gov/?id=EJ539708
Moersch, C. (2001). Next steps: Using LoTi as a research tool. Learning and Leading
with Technology, 29(3), 22-27. Retrieved from
http://loticonnection.cachefly.net/global.../2001_11NOV_NextSteps.pdf
National Population Commission. (2010). Retrieved from www.qtsnigeria.com
Neill, M., & Mathews, J. (2009). Does the use of technological interventions improve
student academic achievement in mathematics and language arts for an identified
group of at-risk middle school students? Southeastern Teacher Education
Journal, 2(1), 57-65.

108
National Information Technology Development Agency. (2012). Interview with the
director general. Retrieved from
http://www.nitda.gov.ng/index.php/component/content/article/60-general/185-
interviews-dg-angaye
Norris, C., & Soloway, E. (2010). One-to-one computing has failed our expectations.
District Administration, 46(5), 58. Retrieved from
http://www.districtadministration.com/article/one-one-computing-has-failed-our-
expectations
Palak, D., & Walls, R. T. (2009). Teachers' beliefs and technology practices: A mixed-
methods approach. Journal of Research on Technology in Education, 41(4), 417-
441. doi:10.1080/15391523.2009.10782537
Panigrahi, M. (2011). Perception of teachers’ towards extensive utilization of information
and communication technology. Turkish Online Journal of Distance Education
(TOJDE), 12(4), 45-57. Retrieved from
https://tojde.anadolu.edu.tr/tojde45/notes_for_editor/notes_for_editor_5.htm
Patton, M. Q. (2002). Qualitative research and evaluation methods (3rd ed.). Thousand
Oaks, CA: Sage.
Ray, A. L. (2008). Changed by design: Using instructional strategies to influence
teachers’ attitudes. Retrieved from
http://www.docstoc.com/docs/20626346/CHANGED-BY-DESIGN-USING-
INSTRUCTIONAL-STRATEGIES-TO-INFLUENCE
Rives, M. B. (2012). Effectiveness of technology professional development in elementary
109
classrooms (Doctoral dissertation). Retrieved from ProQuest Dissertations and
Theses database. (UMI No. 3523200)
Roblyer, M. D., & Doering, A. H. (2010). Integrating educational technology into
teaching (5th ed.). Upper Saddle River, NJ: Pearson/Merrill Prentice Hall.
Schmid, E. C. (2008). Potential pedagogical benefits and drawbacks of multimedia use in
the English language classroom equipped with interactive whiteboard technology.
Computers & Education, 51, 1553-1568.
SchoolNet. (2003). ETF DigiNet. Retrieved from
http://www.schoolnetng.net/projects/etf/
SchoolNet. (2005). MTN Schoolsconnect. Retrieved from
http://www.schoolnetng.net/projects/mtn-schools-connect/
Schuck, S. & Kearney, M. (2007). Exploring pedagogy with interactive whiteboards. A
research report. Retrieved from http://www.ed-
dev.uts.edu.au/teachered/research/iwbproject/pdfs/iwbreportweb.pdf
Shapley, K. S., Sheehan, D., Maloney, C., & Caranikas-Walker, F. (2010). Evaluating the
implementation fidelity of technology immersion and its relationship with student
achievement. Journal of Technology, Learning, and Assessment, 9(4), 1-69.
Retrieved from http://ejournals.bc.edu/ojs/index.php/jtla/article/view/1609
Smolin, L., & Lawless, K. A. (2011). Evaluation across contexts: Evaluating the impact
of technology integration professional development partnerships. Journal of
Digital Learning in Teacher Education, 27(3), 92-98.
doi:10.1080/21532974.2011.10784663
110
Solvie, P., & Kloek, M. (2007). Using technology tools to engage students with multiple
learning styles in a constructivist learning environment. Contemporary Issues in
Technology and Teacher Education, 7(2), 7-27. Retrieved from
http://www.editlib.org/p/22811.
Solvie, P. (2007). Leaping out of our skins: Postmodern considerations in use of an
electronic whiteboard to foster critical engagement in early literacy lessons.
Educational Philosophy & Theory, 39(7), 737-754. doi:10.1111/j.1469-
5812.2007.00312.x
Straub, E. (2009). Understanding technology adoption: Theory and future directions for
informal learning. Review of educational research, 79(2), 625-649.
doi:10.3102/0034654308325896
Stubbs, K. (2008). Technology in elementary teacher preparation programs: Traditional
vs. integrated models. In K. McFerrin et al. (Eds.), Proceedings of Society for
Information Technology & Teacher Education International Conference 2008
(pp. 3952-3959). Retrieved from http://www.editlib.org/p/27871
Suhr, K. A., Hernandez, D. A., Grimes, D., & Warschauer, M. (2010). Laptops and
fourth-grade literacy: Assisting the jump over the fourth-grade slump. Journal of
Technology, Learning, and Assessment, 9(5), 1-46. Retrieved from
http://ejournals.bc.edu/ojs/index.php/jtla/article/view/1610/
Suleman, Q., Aslam, H. D., Habib, M. B., & Hussain, I. (2013). Effectiveness of
educational technology in strengthening student’s achievement in English at
secondary school level in Kohat division (Pakistan). International Journal of

111
Learning and Development, 3(1), 121. doi:10.5296/ijld.v3i1.3154
Summak, M. & Samancioglu, M. (2011). Assessment of technology integration in
vocational education and training schools. International Journal of Education and
Development using Information and Communication Technology, 7(1), 68-85.
Tamim, R.M., Bernard, R. M., Borokhovski, E., Abrami, P. C., & Schmid, R. F. (2011).
What forty years of research says about the impact of technology on learning: A
second-order meta-analysis and validation study. Review of Educational
Research, 81(1). 4-28. doi: 10.3102/0034654310393361.
Teddlie, C., & Tashakkori, A. (2009). Foundations of mixed methods research:
Integrating quantitative and qualitative approaches in the social and behavioral
science. Thousand Oaks, CA: Sage.
Thieman, G. (2008). Using technology as a tool for learning and developing 21st century
skills: an examination of technology use by pre-service teachers with their K-12
students. Contemporary Issues in Technology and Teacher Education, 8(4), 342-
366. Retrieved from http://www.editlib.org/p/29288
Thompson, C. & Davis, S. (2013). Predictive relationships among uses of technology in
elementary mathematics classrooms and student achievement: Graduate
mathematics education students engaged in community-based observational
research. In R. McBride & M. Searson (Eds.), Proceedings of Society for
Information Technology & Teacher Education International Conference 2013
(pp. 2466-2472). Retrieved from http://www.editlib.org/p/48472
Truett, P. (2006). Factors impacting technology implementation of fourth grade math

112
teachers. (Doctoral dissertation). Retrieved from ProQuest Dissertations and
Theses database. (AAT 3238961)
Türel, Y. K. (2010). Developing teachers’ utilization of interactive whiteboards. In D.
Gibson & B. Dodge (Eds.), Proceedings of Society for Information Technology &
Teacher Education International Conference 2010 (pp.3049-3054).
Turel, Y., & Johnson, T. E. (2012). Teachers' belief and use of interactive whiteboards
for teaching and learning. Educational Technology & Society, 15(1), 381-394.
Universal Service Provision Fund. (2010). School access programme. Retrieved from
http://uspf.gov.ng/index.htm
Wachira, P. & Keengwe, J. (2011). Technology integration barriers: Urban school
mathematics teachers’ perspectives. Journal of Science Education and
Technology, 20(1), 17-25. doi:10.1007/s10956-010-9230-y
Winzenried, A., Dalgarno, B., & Tinkler, J. (2010). The interactive whiteboard: A
transitional technology supporting diverse teaching practices. Australasian
Journal of Educational Technology, 26(4), 534-552. Retrieved from
http://eric.ed.gov/?id=EJ895459
Wood, R. & Ashfield, J. (2008). The use of the interactive whiteboard for creative
teaching and learning in literacy and mathematics: a case study. British Journal of
Educational Technology, 39(1), 84-96. doi:10.1111/j.1467-8535.2007.00703.x
Wright, V. H., & Wilson, E. K. (2011). Teachers' use of technology: Lessons learned
from the teacher education program to the classroom. SRATE Journal, 20(2), 48-
60. Retrieved from http://eric.ed.gov/?id=EJ959529
113
Yanez, L., & Coyle, Y. (2011). Children's perceptions of learning with an interactive
whiteboard. ELT Journal, 65(4), 446-457. doi:10.1093/elt/ccq069
Yelas, J., & Engles, P. (2010). Project ACTIVate: Innovations from New Zealand.
Australasian Journal of Educational Technology, 26(4), 432-446. Retrieved from
www.editlib.org/p/73294
Zhao, Y. (2007). Social studies teachers' perspectives of technology integration. Journal
of Technology and Teacher Education, 15(3), 311-333. Retrieved from
www.editlib.org/p/20005

114
Appendix A: Digital-Age Survey for Teachers Questionnaire
Scoring rubric: 0 – Never; 1 - At least once a year; 2 - At least once a semester; 3 - At
least once a month; 4 - A few times a month; 5 - At least once a week; 6 - A few times a
week; 7 - At least once a day
Q1: My students use digital tools and/or enriched resources in my classroom to engage in
learning activities that require them to analyze information, think creatively, make
predictions, and/or draw conclusions.
Q4: My students use digital tools to create web-based or multimedia presentations (e.g.,
Prezi, PowerPoint) that showcase information gathered on topics that I assign in class.
Q5: My students participate in web-based projects that emphasize complex thinking
strategies (e.g., problem-solving, decision-making, experimental inquiry) aligned to the
content standards.
Q6: I provide multiple and varied formative and summative assessment opportunities that
encourage students to "showcase" their content understanding in nontraditional ways.
Q8: My students use digital tools and/or enriched resources to explore multiple solutions
to teacher-directed problems that require creative and innovative thinking.
Q10: My students identify important real world issues (e.g., environmental pollution,
elections, health awareness), then use collaborative digital tools and enriched resources
within and beyond the school building (e.g., partnerships with business professionals,
community action groups) to solve them.
Q12: I promote, monitor, and model the ethical use of digital information and technology
in my classroom (e.g., appropriate citing of resources, respecting copyright permissions).

115
Q13: I use digital tools to communicate and collaborate with students, parents, and peers.
Q14: My students propose innovative ways to use our school's advanced digital tools
(e.g., 1:1 mobile devices, digital media authoring tools, probeware with GPS systems)
and enriched resources (e.g. ready access to outside experts) to address challenges/issues
affecting their local and global communities.
Q15: I model and facilitate the effective use of current and emerging digital tools to
support teaching and learning in my classroom.
Q16: I use digital tools to enhance my lectures or presentations (e.g., multimedia
presentations) so that students can better understand the content that I teach.
Q17: I alone use the digital tools due to the amount of content that I have to cover in my
classroom by the end of each marking period.
Q18: I use a variety of digital tools that support the evolving nature of my grade level
content and elevate student success and innovation in my class- room.
Q19: My students are well versed in current and emerging technologies and readily self-
select the most appropriate tool or resource to aid them in completing any given task.
Q20: I employ learner-centered strategies (e.g., communities of inquiry, learning
contracts) to address the diverse needs of all students using develop- mentally-
appropriate digital tools or enriched resources.
Q21: My students participate in collaborative projects involving face-to-face and/or
virtual environments with students of other cultures that address current problems, issues,
and/or themes.
Q22: My students use digital tools and enriched resources for (1) collaboration with
116
others beyond the classroom, (2) publishing, (3) communication, and (4) research to
solve issues and problems of personal interest that ad- dress specific content standards.
Q23: I model for my students the safe and legal use of digital tools while I am delivering
content and/or reinforcing their understanding of pertinent concepts.
Q25: My students model the "correct and careful" (e.g., ethical usage, proper digital
etiquette, protecting their personal information) use of digital re- sources and are aware of
the consequences regarding their misuse.
Q26: I participate in local and global learning communities to explore creative
applications of technology to improve student learning.
Q27: My students use digital tools to solve "real-world" problems or issues of importance
to them related to the content standards.
Q30: My students engage in standards-based instructional units and related learning
experiences that emphasize innovative thinking, student use of digital tools, and applied
learning to the real world.
Q31: I seek outside help with designing student-centered performance assessments using
the available digital tools that involve students transferring what they have learned to a
real world context.
Q32: My students' questions, interests, and readiness levels directly impact how I design
learning activities that address the content standards. Q36: My students use the classroom
digital tools to engage in relevant, challenging, self-directed learning experiences that
address the content standards.
Q37: My students complete web-based projects that emphasize high level cognitive skills

117
(e.g., analyzing, evaluating, creating). Q38: My students use digital tools or enriched
resources to supplement their content understanding or to improve their basic math and
literacy skills.
Q40: My students use digital tools or enriched resources for research purposes (e.g., data
collection, questionnaires, Internet research) that require them to investigate a teacher-
directed issue/problem, take a position, make decisions, and/or seek out a solution.
Q41: My students collaborate with me in setting both group and individual academic
goals that provide opportunities for them to direct their own learning aligned to the
content standards.
Q42: I promote global awareness in my classroom by providing students with digital
opportunities to collaborate with others of various cultures.
Q43: My students apply their classroom content learning to real-world problems within
the local or global community using the digital tools at our disposal.
Q45: My students use classroom digital tools (e.g., interactive whiteboard, digital student
response system) or enriched resources (e.g., manipulatives, graphic organizers,
dioramas) to supplement the curriculum and reinforce specific content standards.
Q46: My students use digital tools for higher-order thinking (e.g., analyzing, evaluating,
creating) and personal inquiry related to problem-based learning experiences.
Q47: My students use all forms of the most advanced digital tools and re- sources to
pursue collaborative problem-solving opportunities surrounding issues of personal and/or
social importance.
Q48: I model and advocate for the use of assistive technologies that are available to meet
118
the diverse demands of special needs students.
Q49: I promote the effective use of digital tools on my campus and within my
professional community and actively develop the technology skills of others.
Q50: I consider how my students will apply what they have learned in class to the world
they live when planning instruction and assessment strategies.
119
Appendix B: Level of Teaching Innovation Framework
LoTi Level of description
Level 1: Nonuse
At level 0 (Non-Use), the instructional focus ranges anywhere from traditional direct
instruction approach to a collaborative student-centered learning environment. The use of
research-based best practices may or may not be evident, but those practices do not
involve the use of digital tools and resources. The use of digital tools and resources in the
classroom is non-existent due to (1) competing priorities (e.g., high stakes testing, highly-
structured and rigid curriculum programs), (2) lack of access, or (3) a perception that
their use is inappropriate for the instructional setting or student readiness levels. The use
of instructional materials is predominately text-based (e.g., student handouts,
worksheets).
Level 1: Awareness
At level 1 (Awareness), the instructional focus emphasizes information dissemination to
students (e.g., lectures, teacher-created multimedia presentations) and supports the
lecture/discussion approach to teaching. Teacher questioning and/or student learning
typically focuses on lower cognitive skill development (e.g., knowledge, comprehension).
Digital tools and resources are either (1) used by the classroom teacher for classroom
and/or curriculum management tasks (e.g., taking attendance, using grade book
programs, accessing email, retrieving lesson plans from a curriculum management system
or the Internet), (2) used by the classroom teacher to embellish or enhance teacher
lectures or presentations (e.g., multimedia presentations), and/or (3) used by students

120
(usually unrelated to classroom instructional priorities) as a reward for prior work
completed in class.
Level 2: Exploration
At level 2 (Exploration), the instructional focus emphasizes content understanding and
supports mastery learning and direct instruction. Teacher questioning and/or student
learning focuses on lower levels of student cognitive processing (e.g., knowledge,
comprehension). Digital tools and resources are used by students for extension activities,
enrichment exercises, or information gathering assignments that generally reinforce lower
cognitive skill development relating to the content under investigation. There is a
pervasive use of student multimedia products, allowing students to present their content
understanding in a digital format that may or may not reach beyond the classroom.
Level 3: Infusion
At level 3 (Infusion), the instructional focus emphasizes student higher order thinking
(i.e., application, analysis, synthesis, evaluation) and engaged learning. Though specific
learning activities may or may not be perceived as authentic by the student, instructional
emphasis is, nonetheless, placed on higher levels of cognitive processing and in-depth
treatment of the content using a variety of thinking skill strategies (e.g., problem-solving,
decision-making, reflective thinking, experimentation, scientific inquiry). Teacher-
centered strategies including the concept attainment, inductive thinking, and scientific
inquiry models of teaching are the norm and guide the types of products generated by
students. Digital tools and resources are used by students to carry out teacher-directed
tasks that emphasize higher levels of student cognitive processing relating to the content
121
under investigation.
Level 4a: Integration (Mechanical)
At level 4a (Integration: Mechanical) students are engaged in exploring real-world issues
and solving authentic problems using digital tools and resources; however, the teacher
may experience classroom management (e.g., disciplinary problems, internet delays) or
school climate issues (lack of support from colleagues) that restrict full-scale integration.
Heavy reliance is placed on prepackaged materials and/or outside resources (e.g.,
assistance from other colleagues), and/or interventions (e.g., professional development
workshops) that aid the teacher in sustaining engaged student problem-solving. Emphasis
is placed on applied learning and the constructivist problem-based models of teaching
that require higher levels of student cognitive processing and in-depth examination of the
content. Students’ use of digital tools and resources is inherent and motivated by the
drive to answer student-generated questions that dictate the content, process, and
products embedded in the learning experience.
Level 4b: Integration (Routine)
At level 4b (Integration: Routine) students are fully engaged in exploring real-world
issues and solving authentic problems using digital tools and resources. The teacher is
within his/her comfort level with promoting an inquiry-based model of teaching that
involves students applying their learning to the real world. Emphasis is placed on learner-
centered strategies that promote personal goal setting and self-monitoring, student action,
and issues resolution that require higher levels of student cognitive processing and in-
depth examination of the content. Students’ use of digital tools and resources is inherent
122
and motivated by the drive to answer student-generated questions that dictate the content,
process, and products embedded in the learning experience.
Level 5: Expansion
At level 5 (Expansion), collaborations extending beyond the classroom are employed for
authentic student problem-solving and issues resolution. Emphasis is placed on learner-
centered strategies that promote personal goal setting and self-monitoring, student action,
and collaborations with other diverse groups (e.g., another school, different cultures,
business establishments, governmental agencies). Students’ use of digital tools and
resources is inherent and motivated by the drive to answer student-generated questions
that dictate the content, process, and products embedded in the learning experience. The
complexity and sophistication of the digital resources and collaboration tools used in the
learning environment are now commensurate with (1) the diversity, inventiveness, and
spontaneity of the teacher's experiential-based approach to teaching and learning and (2)
the students' level of complex thinking (e.g., analysis, synthesis, evaluation) and in-depth
understanding of the content experienced in the classroom.
Level 6: Refinement
At level 6 (Refinement), collaborations extending beyond the classroom that promote
authentic student problem-solving and issues resolution are the norm. The instructional
curriculum is entirely learner-based. The content emerges based on the needs of the
learner according to his/her interests, needs, and/or aspirations and is supported by
unlimited access to the most current digital applications and infrastructure available.
At this level, there is no longer a division between instruction and digital tools and

123
resources in the learning environment. The pervasive use of and access to advanced
digital tools and resources provides a seamless medium for information queries, creative
problem-solving, student reflection, and/or product development. Students have ready
access to and a complete understanding of a vast array of collaboration tools and related
resources to accomplish any particular task.
124
Appendix C: Personal Computer Use Framework
PCU Level Description
PCU Intensity Level 0
A PCU Intensity Level 0 indicates that the participant does not possess the inclination or
skill level to use digital tools and resources for either personal or professional use.
Participants at Intensity Level 0 exhibit a general disinterest toward emerging
technologies relying more on traditional devices (e.g., use of overhead projectors,
chalkboards, paper/pencil activities) than using digital resources for conveying
information or classroom management tasks.
PCU Intensity Level 1
A PCU Intensity Level 1 indicates that the participant demonstrates little fluency with
using digital tools and resources for student learning. Participants at Intensity Level 1
may have a general awareness of various digital tools and media including word
processors, spreadsheets, or the internet, but generally are not using them. Participants at
this level are generally unaware of copyright issues or current research on the impact of
existing and emerging digital tools and resources on student learning.
PCU Intensity Level 2
A PCU Intensity Level 2 indicates that the participant demonstrates little to moderate
fluency with using digital tools and resources for student learning. Participants at
Intensity Level 2 may occasionally browse the internet, use email, or use a word
processor program; yet, may not have the confidence or feel comfortable using existing
and emerging digital tools beyond classroom management tasks (e.g., grade book,

125
attendance program). Participants at this level are somewhat aware of copyright issues
and maintain a cursory understanding of the impact of existing and emerging digital tools
and resources on student learning.
PCU Intensity Level 3
A PCU Intensity Level 3 indicates that the participant demonstrates moderate fluency
with using digital tools and resources for student learning. Participants at Intensity Level
3 may begin to become “regular” users of selected digital-age media and formats (e.g.,
internet, email, word processor, multimedia) to (1) communicate with students, parents,
and peers and (2) model their use in the classroom in support of research and learning.
Participants at this level are aware of copyright issues and maintain a moderate
understanding of the impact of existing and emerging digital tools and resources on
student learning.
PCU Intensity Level 4
A PCU Intensity Level 4 indicates that the participant demonstrates moderate to high
fluency with using digital tools and resources for student learning. Participants at
Intensity Level 4 commonly use a broader range of digital-age media and formats in
support of their curriculum and instructional strategies. Participants at this level model
the safe, legal, and ethical uses of digital information and technologies and participate in
local discussion forums that advocate the positive impact of existing digital tools and
resources on student success in the classroom.
PCU Intensity Level 5
A PCU Intensity Level 5 indicates that the participant demonstrates a high fluency level

126
with using digital tools and resources for student learning. Participants at Intensity Level
5 are commonly able to use an expanded range of existing and emerging digital-age
media and formats in support of their curriculum and instructional strategies. Participants
at this level advocate the safe, legal, and ethical uses of digital information and
technologies and participate in local and global learning that advocate the positive impact
of existing digital tools and resources on student success in the classroom.
PCU Intensity Level 6
A PCU Intensity Level 6 indicates that the participant demonstrates high to extremely
high fluency level with using digital tools and resources for student learning. Participants
at Intensity Level 6 are sophisticated in the use of most, if not all, existing and emerging
digital-age media and formats (e.g., multimedia, productivity, desktop publishing, web-
based applications). They begin to take on a leadership role as advocates for technology
infusion as well as the safe, legal, and ethical uses of digital resources in the schools.
Participants at this level continually reflect on the latest research discussing the impact of
digital tools on student success.
PCU Intensity Level 7
A PCU Intensity Level 7 indicates that the participant possesses an extremely high
fluency level with using digital tools and resources for student learning. Participants at
Intensity Level 7 are sophisticated in the use of any existing and emerging digital-age
media and formats (e.g., multimedia, productivity, desktop publishing, web-based
applications). Participants at this level set the vision for technology infusion based on the
latest research and continually seek creative uses of digital tools and resources that

127
impact learning. They actively participate in global learning communities that seek
creative uses of digital tools and resources in the classroom

128
Appendix D: Current Instructional Practices Framework
CIP Level Description
CIP Intensity Level 0
A CIP Intensity Level 0 indicates that the participant is not involved in a formal
classroom setting (e.g., pull-out program).
CIP Intensity Level 1
At a CIP Intensity Level 1, the participant's current instructional practices align
exclusively with a subject-matter based approach to teaching and learning. Teaching
strategies tend to lean toward lectures and/or teacher-led presentations. The use of
curriculum materials aligned to specific content standards serves as the focus for student
learning. Learning activities tend to be sequential and uniform for all students. Evaluation
techniques focus on traditional measures such as essays, quizzes, short-answers, or true-
false questions, but no effort is made to use the results of the assessments to guide
instruction. Student projects tend to be teacher-directed in terms of identifying project
outcomes as well as requirements for project completion. No effort is made to
differentiate instruction. The use of research-based best practices focuses on basic
classroom routines (e.g., providing homework and practice, setting objectives and
providing feedback, students summarizing and note taking, providing adequate wait
time).
CIP Intensity Level 2
At a CIP Intensity Level 2, the participant supports instructional practices consistent with
a subject-matter based approach to teaching and learning, but not at the same level of

129
intensity or commitment as a CIP Intensity Level 1. Teaching strategies tend to lean
toward lectures and/or teacher-led presentations. The use of curriculum materials aligned
to specific content standards serves as the focus for student learning. Learning activities
tend to be sequential and uniform for all students. Evaluation techniques focus on
traditional measures such as essays, quizzes, short-answers, or true-false questions with
the resulting data used to guide instruction. Student projects tend to be teacher-directed in
terms of identifying project outcomes as well as requirements for project completion. No
effort is made to differentiate instruction. The use of research-based best practices
focuses on basic classroom routines (e.g., providing homework and practice, setting
objectives and providing feedback, students summarizing and note taking, providing
adequate wait time).
CIP Intensity Level 3
At a CIP Intensity Level 3, the participant supports instructional practices aligned
somewhat with a subject-matter based approach to teaching and learning. An approach
characterized by sequential and uniform learning activities for all students, teacher-
directed presentations, and/or the use of traditional evaluation techniques. However, the
participant may also support the use of student-directed projects that provide
opportunities for students to determine the "look and feel" of a final product based on
their modality strengths, learning styles, or interests. Evaluation techniques continue to
focus on traditional measures with the resulting data serving as the basis for curriculum
decision-making. The use of research-based best practices expands beyond basic
classroom routines (e.g., providing opportunities for non-linguistic representation,

130
offering advanced organizers).
CIP Intensity Level 4
At a CIP Intensity Level 4, the participant may feel comfortable supporting or
implementing either a subject-matter or learning-based approach to instruction based on
the content being addressed. In a subject-matter based approach, learning activities tend
to be sequential, student projects tend to be uniform for all students, the use of lectures
and/or teacher-directed presentations are the norm as well as traditional evaluation
strategies.
In a learner-based approach, learning activities are diversified and based mostly on
student questions, the teacher serves more as a co-learner or facilitator in the classroom,
student projects are primarily student-directed, and the use of alternative assessment
strategies including performance-based assessments, peer reviews, and student reflections
are the norm. Although traditional learning activities and evaluation techniques are used,
students are also encouraged to contribute to the assessment process when appropriate to
the content being addressed. The amount of differentiation is moderate based on the
readiness level, interests, and learning styles of the students. The use of research-based
best practices expands beyond basic classroom routines (e.g., providing opportunities for
non-linguistic representation, offering advanced organizers).
CIP Intensity Level 5
At a CIP Intensity Level 5, the participant's instructional practices tend to lean more
toward a learner-based approach. The essential content embedded in the standards
emerges based on students “need to know” as they attempt to research and solve issues of

131
importance to them using critical thinking and problem-solving skills. The types of
learning activities and teaching strategies used in the learning environment are diversified
and driven by student questions. Both students and teachers are involved in devising
appropriate assessment instruments (e.g., performance-based, journals, peer reviews, self-
reflections) by which student performance will be assessed.
Although student-directed learning activities and evaluations are the norms, the use of
teacher-directed activities (e.g., lectures, presentations, teacher-directed projects) may
surface based on the nature of the content being addressed and at the desired level of
student cognition. The amount of differentiation is substantial based on the readiness
level, interests, and learning styles of the students. The use of research-based best
practices delves deeper into complex classroom routines (e.g., students generating and
testing hypotheses, implementing cooperative learning, students identifying similarities
and differences).
CIP Intensity Level 6
The participant at a CIP Intensity Level 6 supports instructional practices consistent with
a learner-based approach, but not at the same level of intensity or commitment as a CIP
Intensity Level 7. The essential content embedded in the standards emerges based on
students “need to know” as they attempt to research and solve issues of importance to
them using critical thinking and problem-solving skills. The types of learning activities
and teaching strategies used in the learning environment are diversified and driven by
student questions. Students, teacher/facilitators, and occasionally parents are all involved
in devising appropriate assessment instruments (e.g., performance-based, journals, peer

132
reviews, self-reflections) by which student performance will be assessed. The amount of
differentiation is substantial based on the readiness level, interests, and learning styles of
the students. The use of research-based best practices delves deeper into complex
classroom routines (e.g., students generating and testing hypotheses, implementing
cooperative learning, students identifying similarities and differences).
CIP Intensity Level 7
At a CIP Intensity Level 7, the participant's current instructional practices align
exclusively with a learner-based approach to teaching and learning. The essential content
embedded in the standards emerges based on students “need to know” as they attempt to
research and solve issues of importance to them using critical thinking and problem-
solving skills. The types of learning activities and teaching strategies used in the learning
environment are diversified and driven by student questions. Students,
teacher/facilitators, and occasionally parents are all involved in devising appropriate
assessment instruments (e.g., performance-based, journals, peer reviews, self-reflections)
by which student performance will be assessed. The amount of differentiation is seamless
since students completely guide the pace and level of their learning. The use of research-
based best practices delves deeper into complex classroom routines (e.g., students
generating and testing hypotheses, implementing cooperative learning, students
identifying similarities and differences).
133
Appendix E: Digital-Age Professional Development Priority Description
Visionary Leadership (#1): According to the National Education Technology Standards
for Teachers (NETS-T) from ISTE, Visionary Leadership signifies a teacher's exhibition
of the “knowledge, skills, and work processes representative of an innovative
professional in a global and digital society.” Based on this priority area, a teacher is able
to demonstrate fluency in a variety of technology systems, communicate relevant
information and collaborate with others (e.g., students, parents, community members)
using a variety of digital tools and resources, and employ current and emerging
technologies for data analysis purposes in support of research and learning.
Digital-Age Learning Culture (#2): According to the National Education Technology
Standards for Teachers (NETS-T) from ISTE, Digital-Age Learning Experiences and
Assessments signify a teacher's ability to “design, develop, and evaluate authentic
learning experiences and assessments incorporating contemporary tools and resources to
maximize content learning....” Based on this priority area, a teacher is able to create and
implement engaging and relevant learning experiences that incorporate a variety of
digital tools and resources, promote learner-based investigations, and provide a myriad of
formative and summative assessment schemes aligned to the content and technology
standards to improve and adjust future learning experiences.
Excellence in Professional Practice (#3): According to the National Education
Technology Standards for Teachers (NETS-T) from ISTE, Excellence in Professional

134
Practice signifies a teacher's ability to “use their knowledge of subject matter, teaching
and learning, and technology to facilitate experiences that advance student learning,
creativity, and innovation in both face-to-face and virtual environments.” Based on this
priority area, a teacher is able to promote, support, and model creative and innovative
thinking; engage students in real-world problem-solving and issues resolution; model
collaborative learning communities; and support student reflection using a variety of
collaborative tools and resources.
Systemic Improvement (#4): According to the National Education Technology Standards
for Teachers (NETS-T) from ISTE, Systemic Improvement signifies a teacher's
inclination to “continuously improve their professional practice, model lifelong learning,
and exhibit leadership in their school and professional community by promoting and
demonstrating the effective use of digital tools and resources.” Based on this priority
area, a teacher is able to participate in local and global learning communities, evaluate
and reflect on current research and professional practice involving the use of digital tools
and resources, and exercise leadership in promoting the technology skills of others as
well as improvements to the teaching profession.
Digital Citizenship (#5): According to the National Education Technology Standards for
Teachers (NETS-T) from ISTE, Digital Citizenship and Responsibility signifies a
teacher's understanding of the “local and global societal issues and responsibilities in an
evolving digital culture and (the ability to) exhibit legal and ethical behavior in their

135
professional practice.” Based on this priority area, a teacher is able to advocate, model,
and teach safe, legal, and ethical use of digital information and technology; employ
learner-centered strategies to address the diverse needs of all learners; promote and model
digital etiquette; and promote Digital-Age communication and collaboration tools with
diverse groups and cultures.

136
Appendix F: Permission to Use LoTi
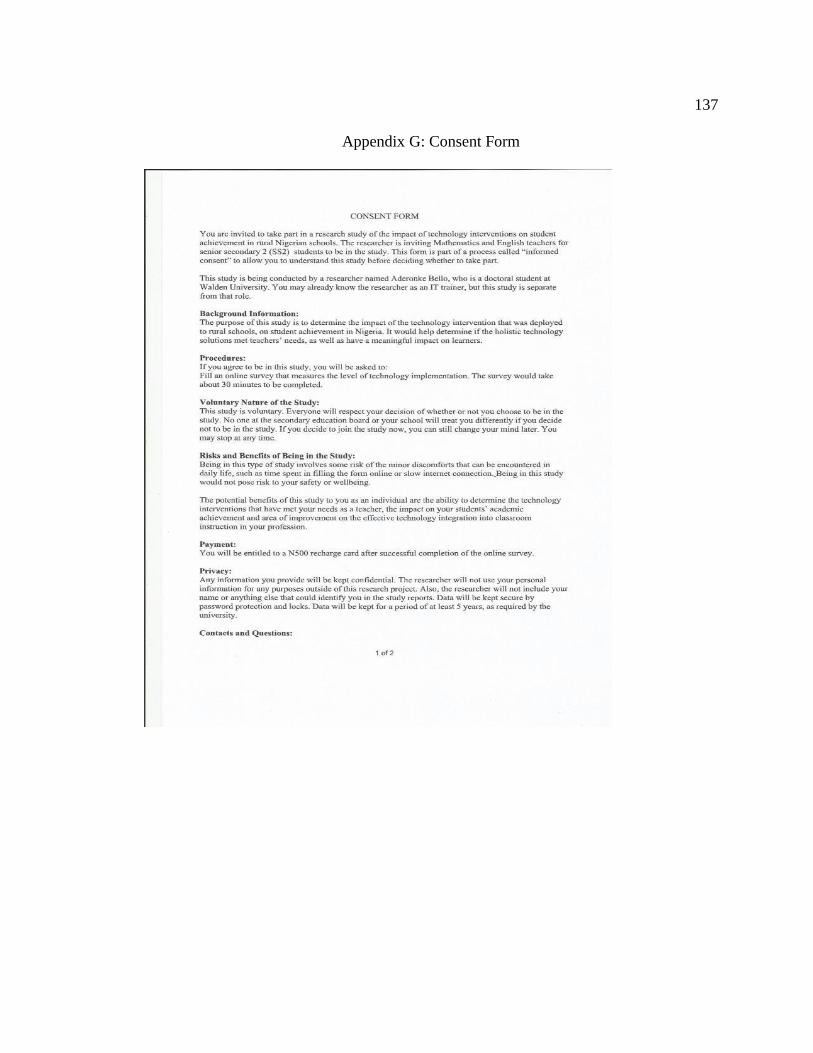
137
Appendix G: Consent Form

138

139
Curriculum Vitae
INTRODUCTION
Mrs. Aderonke Bello has over 27 years of experience in both IT and Education sectors.
She is the managing director of Innovative Technology Literacy Services Limited; an
ICT in education consulting firm with a mission of reaching out to all learners
irrespective of culture, ethnicity, race, and gender through technology integration into
their everyday activities to earn a better living. Over the years, she has served in the
following strategic positions: deputy national coordinator, SchoolNet Nigeria, project
director for the Intel Teach Program, coordinator of Microsoft Partners in Learning
program, coordinator of IEARN and Multichoice Resource Center programs among
several others. She coordinated various teams that have set up over 250 computer
laboratories in secondary schools across the nation. She has served in several committees
at the national level on issues relating to ICT, which includes among others the
development of the National ICT in Education policy for Nigeria. A seasoned and
professional IT trainer has actively participated in training teachers on the integration of
technology into classroom instruction. She coordinates and manages ICT related
programs for schools. Her prowess for training of teachers was not limited to Nigeria; she
has trained teachers in Ghana, Equatorial Guinea, Kenya, Gambia, Liberia, and Sierra
Leone just to mention a few. She has acted in the capacity of a judge at several national
and international competitions. She is on the board of some organizations as a director.
PERSONAL INFORMATION
Surname: Bello
Other names: Aderonke Abosede
Sex: Female
Nationality: Nigerian
EDUCATIONAL QUALIFICATIONS
INSTITUTIONS YEAR COURSE OF STUDY DEGREE
Walden University
Minneapolis, USA
2014 Educational Technology Doctor of
Philosophy
Abilene Christian
University, Abilene,
Texas, USA
2010 Curriculum and
Instruction Technology
Master of Education
University of Lagos,
Akoka, Lagos,
Nigeria
1993 Computer Science Master of Science
University of Lagos,
Akoka, Lagos,
Nigeria
1987 Computer Science Bachelor of Science
Redeemed Christian 1999 Theology Post Graduate
140
Bible College, Lagos
Nigeria
Diploma
PROFESSIONAL QUALIFICATIONS AND CERTIFICATIONS
INSTITUTIONS/PROFESSIONAL
BODIES
YEAR PROGRAM
DESCRIPTION
Harvard Graduate School of Education,
Massachusetts, USA
2011 Systemic Change for
Student Success
Abilene Christian University, Abilene,
Texas, USA
2010 Conflict Resolution &
Mediation
Harvard Graduate School of Education,
Massachusetts, USA
2010 Universal Design
Learning
IEARN Master Trainer 2004 Productivity tools and
Collaborative Learning
Microsoft Certified Professional 2002 System Administration
and Software Installation
EMPLOYMENT HISTORY
POSITION/ORGANIZATION/YEAR
Managing Director
Innovative Technology Literacy Services Limited, Abuja
2012 - present
Deputy National Coordinator
SchoolNet Nigeria, Abuja
2004 - 2012
Program Officer (Teacher Development)
SchoolNet Nigeria, Abuja
2003 - 2004
ICT Consultant
Federal Ministry of Information, Abuja
2001 - 2002
Executive Director
Roattabel Nigeria Limited
1998 - 2003
Software Development and Training Manager
Inlaks Computers Limited
1995 - 1998
Head of Software Unit
Inlaks Computers Limited
1993 – 1995

141
Senior Systems Analyst
Nigerian Ports Authority, Lagos
1993 - 1993
Principal Programmer
Royal Exchange Assurance, Lagos
1991 - 1993
Programmer
Royal Exchange Assurance, Lagos
1989 - 1991
Training Officer
Computer Links Limited
1988 - 1989
Graduate Assistant
Anambra State University of Technology (Now Enugu), Enugu State
1987 - 1988
LANGUAGES
English & Yoruba - fluent in reading, writing and speaking
AWARD/HONOR
Distinguished Citizenship Award 2009
PROFESSIONAL AFFILIATIONS/ASSOCIATIONS
Member Association for Educational Communications and Technology, USA
Member Computer Professionals of Nigeria, Nigeria
Member International Education and Resource Network, USA
Fellow Nigeria Computer Society, Nigeria
Member Nigerian Women in Information Technology
WORKSHOPS/CONFERENCES ATTENDED
Annual e-LEARNING Conference in African countries
Annual ICT conferences (CPN, AECT and NCS among others)
Several ICT-related workshops at a global level
Organized the first ICT in education conference in Nigeria
Annual Microsoft Worldwide Innovative Education Forum around the globe
SOME OF THE PROJECTS UNDERTAKEN
Curriculum mapping for Computer Studies Education (College of Education)
ICT Entrepreneurship training for technical schools
Implementation of ICT training for Health workers
Localization of Intel Teach Program training materials
Localization of Multichoice Resource Center course materials

142
Development of several training materials for teachers on use of ICT in Education
Implementation of DigiNet laboratories in 89 schools
Implementation of MTNschoolsconnect laboratories in 62 schools
Implementation of Multichoice Resource Center laboratories in 300 schools
Have handled over 100 training sessions in the last five years
Organized several national award programs for teachers
EXTRA CURRICULA ACTIVITIES
Vice-President, Nigerian Women in Information Technology
Council member, Computer Professionals of Nigeria
Chairperson, Board of Trustees, Technology Literacy Foundation
Ex-officio, Nigeria Computer Society
Region 10 Coordinator, Sunday school dept., Redeemed Christian Church of God
Former Director, Linuxchix Africa, South Africa.
INTERESTS
Social work
Pastoral work/Counseling
Game-based learning
Travelling