Embed Size (px)
Citation preview
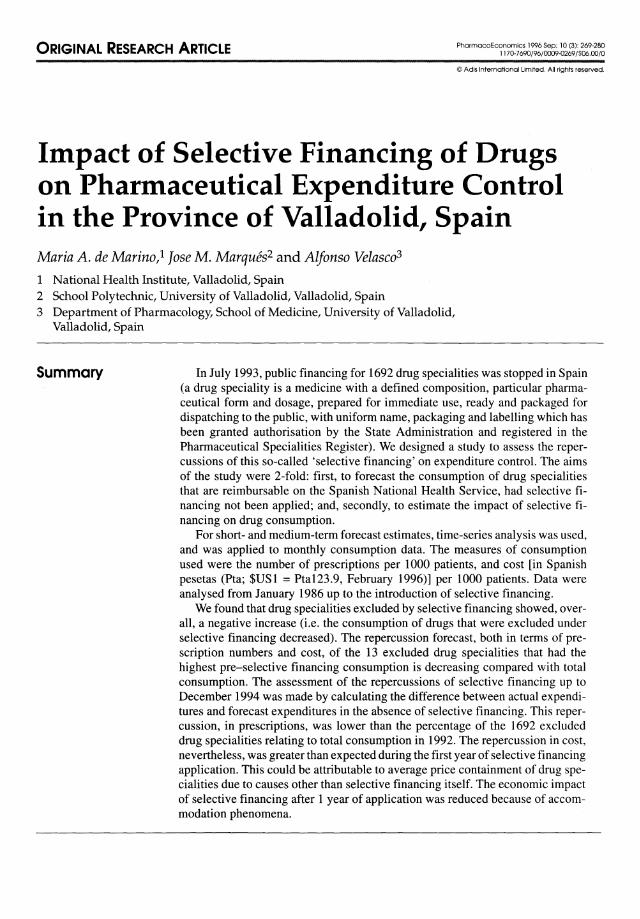
ORIGINAL RE5EARCH ARTICLE PharmacoEconomics 1996 Sep; 10 (3): 269-2801170-7690/96/0009-0269/$06.00/0
© Adis International Limited. Ali rights reserved.
Impact of Selective Financing of Drugson Pharmaceutical Expenditure Controlin the Province of Valladolid, SpainMaria A. de Marino,1 fose M. Marqués2 and Alfonso Velasco3
1 National Health Institute, Valladolid, Spain2 School Polytechnic, University of Valladolid, Valladolid, Spain3 Department of Pharmacology, School of Medicine, University of Valladolid,
Valladolid, Spain
Summary In July 1993, public financing for 1692 drug specialities was stopped in Spain(a drug speciality is a medicine with a defined composition, particular pharmaceutical form and dosage, prepared for immediate use, ready and packaged fordispatching to the public, with uniform name, packaging and labelling which hasbeen granted authorisation by the State Administration and registered in thePharmaceutical Specialities Register). We designed a study to assess the repercussions of this so-called 'selective financing' on expenditure contraI. The aimsof the study were 2-fold: first, to forecast the consumption of drug specialitiesthat are reimbursable on the Spanish National Health Service, had selective financing not been applied; and, secondly, to estimate the impact of selective financing on drug consumption.
For short- and medium-term forecast estimates, time-series analysis was used,and was applied to monthly consumption data. The measures of consumptionused were the number of prescriptions per 1000 patients, and cost [in Spanishpesetas (Pta; $US1 = Pta123.9, February 1996)] per 1000 patients. Data wereanalysed from January 1986 up to the introduction of selective financing.
We found that drug specialities excluded by selective financing showed, overall, a negative increase (i.e. the consumption of drugs that were excluded underselective financing decreased). The repercussion forecast, both in terms of prescription numbers and cost, of the 13 excluded drug specialities that had thehighest pre-selective financing consumption is decreasing compared with totalconsumption. The assessment of the repercussions of selective financing up toDecember 1994 was made by calculating the difference between actual expenditures and forecast expenditures in the absence of selective financing. This repercussion, in prescriptions, was lower than the percentage of the 1692 excludeddrug specialities relating to total consumption in 1992. The repercussion in cost,nevertheless, was greater than expected during the first year of selective financingapplication. This could be attributable to average price containment of drug specialities due to causes other than selective financing itself. The economic impactof selective financing after 1 year of application was reduced because of accommodation phenomena.

270
In Spain, the National Health Service (NHS)covers 98.9% of the population (the current population of Spain is 40 460 055), and the user paysonly 10% of the total cost of drugs. Until 1993, thepublic financing of medicines was indiscriminate,and included all drugs except those that relied ondirect advertising to patients. From the 1980s onwards, systems of selective financing (SF)[l] wereintroduced in other European Union public healthservices, in the form of a positive or negative list.[2-4]
Given that uncontrolled growth in expenditurecould cause financial difficulties for the SpanishNHS, SF was introduced in July 1993. Under thissystem, 1692 drug specialities (DS) were excludedfrom public financing, each of them belonging toone of the following categories:[5]• food supplements, anabolic or antiobesity prod
ucts;• hygiene products and products for minor derma
tological symptoms or syndromes (e.g. emollient creams, com preparations, wart treatment,medicinal shampoo, antiseptics);
• products used in the treatment of minor symptoms (e.g. antacids, laxatives, cough and coldpreparations, nasal decongestants).The aim of SF was twofold: first, to give priority
to the public financing of medicines according totheir necessity and the seriousness of the pathologies for which they are indicated, whilst rationalising their use; and, secondly, to exclude drugs oflowtherapeutic value.
The 1692 DS that were excluded under SF represented 19.8% ofthe total number ofDS financedby the Spanish NHS in 1993. Of these, 90.1 % hadbeen registered (i.e. authorised by the State Administration and registered in the Pharmaceutical Specialities Register) before 1972, and their average prescription price in 1993 was 291 Spanish pesetas (Pta;$US1 = Pta123.9, February 1996). This compareswith an average price for all DS prescriptions, including those excluded under SF, ofPta1247 in 1993.
This study had a dual aim. First, to forecast theconsumption of DS that are reimbursable on theSpanish NHS had SF not been applied. Second, toevaluate the impact of SF through: (i) analysis of
© Adis International Limited. Ali rights reseNed.
de Marino et al.
the consumption forecast for each of the most-usedexcluded DS up to the time of their exclusion; (ii)forecast of the repercussions of the consumption ofexcluded DS versus total public expenditure ondrugs; and (iii) comparison of the introduction ofSF until December 1994.
Methods
Data Sources
In Spain, for all NHS-invoiced prescriptions,details are recorded of the DS dispensed, the prescribing doctor and the pharmacy. With this information, the Ministry of Health has constructed the'ECOM' database. Since 1980, this has providedautomated information on the number of prescriptions and annual expenditures for all DS at the national and provinciallevels.
To compile information on monthly drug consumption, it is necessary to use computerised invoicing for each province, using written reports onevery DS prescribed and dispensed during thatmonth.
Because, at the nationallevel, monthly figures fordrug consumption were only available for the previous 2 years, we decided to study the written invoicing reports of a single Spanish province thathad kept these since 1986. The province of Valladolid (population 505 309) was chosen because ofgood data accessibility, and because the per capitadrug consumption and annual invoicing turnover(2% of the national total) both approximate the provincial averages.
There were no written reports conceming the1692 DS excluded under SF, because some of themhad insignificant sales figures and reports weretherefore not issued. Thus, for study purposes wedecided to choose lO DS that had a consumptionof >10000 units (i.e. packets or boxes), and lOwhose sales exceeded Pta5 000 000, in Valladolidduring 1992. As there were DS for which both criteriawere applicable, 13 DS were finally selected. Thesum total ofprescriptions and costs for these 13 DSin 1992 represented 29.2 and 41.8%, respectively,
PharmacoEconomics 1996 Sep; 10 (3)

Selective Financing of Drugs in Spain
of the total consumption of alI excluded DS inValladolid in that year.
To eliminate the infiuence of increases in theenrolled population and interannual infiation, wehave expressed our data as consumption in prescriptions per 1000 patients and cost in constant Ptaper 1000 patients. For this purpose, we used dataon those members of the population covered by theNHS, which is published yearly on December 31by the NHS Provincial Offices in Valladolid. Thefinal figures published by the National StatisticsInstitute on the monthly development of the generaI consumption price index were also used (1983base). This index was chosen instead of the annualpharmaceutical price indices because the former isused to generate the consumption indicators by theSpanish Ministry of Health.
In addition, a data-fitting exercise was done because of the change in the rate of value-added tax(VAT) from 6 to 3%, which carne into effect in January 1993.
In this way, the following monthly consumption
271
series chargeable to the NHS were obtained for theprovince of Valladolid:
(a) A total consumption series, expressed as thenumber of prescriptions per 1000 patients (i.e. 'total units') and constant Pta per 1000 patients (Le.'total cost'). This was made up of 90 data items collated from January 1986 to June 1993.
(b) Aconsumption series for the 13 excluded DSthat had a consumption of >10000 units and/orcosts >Pta5 000 000 in Valladolid during 1992.Consumption was expressed as number of prescriptions per 1000 patients, and was identified bythe National Code (NC) given to each DS at thetime of registration or alteration of supply conditions. This was made up of 89 data items collatedfrom January 1986 to May 1993.
(c) A percentage series, giving the consumptionof aH 13 selected DS versus the total consumption.Consumption was expressed as the number of prescriptions (% units) and the cost in constant Pta(% cost). These percentages were compiled from89 data items collated from January 1986 to May 1993.
Table I. Short-term forecast of the consumption of 13 of the 1692 drugs excluded from National Health Service financing in Spain in July1993. The data shown are for the province of Valladolid only, and are expressed as the number of prescriptions per 1000 patients duringeach given month. These 13 drugs were selected because they had the highest consumption and expenditures of ali the drugs excluded(>10000 prescriptions and/or >5000000 Spanish pesetas in Valladolid in 1992) [$US1 = Pta123.9, February 1996]
Drug Smoothing No. of prescriptions per 1000 patients
code constants Jun 93 Jul 93 Aug 93 Sep 93 Oct 93 Nov 93 Dec 93 Jan 94 Feb 94 Mar 94 Apr 94 May 94
712836 0.1,0.1,0.4 1.8037 1.6954 1.7201 1.6751 1.3192 1.2025 1.0762 0.9562 1.2306 1.1777 1.3923 1.4256
715227 0.6,0.1,0.4 1.5405 1.4649 1.4110 1.3906 1.4131 1.5023 1.3950 1.2095 1.3391 1.2247 1.2773 1.1965
719245 0.3,0.1,0.3 2.3573 1.7458 1.7873 2.4295 4.0811 5.0820 5.6457 6.7328 6.0946 4.3141 3.5956 3.2152
724179 0.4,0.4,0.5 3.2008 3.1928 2.8767 3.0662 3.2193 3.7298 3.7830 3.2770 4.0879 3.9701 4.5384 4.5880
728485 0.2,0.2,0.5 2.1906 2.1403 2.0394 2.0778 1.9829 1.8903 1.9804 1.8896 2.2662 2.0716 2.1621 2.1094
737478 0.1,0.1,0.3 2.2573 1.5755 1.5214 2.5856 6.3036 5.8397 5.6181 7.6796 7.0815 4.8301 3.4264 2.9936
749127 0.1,0.1,0.6 1.8199 1.4620 1.4813 1.5749 1.4826 1.4116 1.3884 1.2782 1.5326 1.4055 1.4912 1.4404
798546 0.2,0.1,0.6 2.8012 2.7641 2.9203 2.8711· 2.6162 2.4542 2.4087 2.3551 2.3232 2.0355 2.2376 2.2610
937219 0.2,0.1,0.6 1.2823 1.0969 1.0468 1.0872 0.8959 0.8490 0.8124 0.6983 0.808 0.8488 0.9058 0.8827
939629 0.5,0.1,0.6 2.9511 2.2558 2.0776 2.3679 2.4002 2.5065 2.3064 2.0764 2.8155 2.4585 2.6817 3.0123
947226 0.8,0.1,0.9 0.9808 0.8094 0.7020 0.9511 1.2090 1.3781 1.2069 0.9973 1.2182 1.0090 0.9742 0.8541
966770 0.2,0.1,0.9 0.6632 0.6202 0.4967 0.5999 0.7096 0.6994 0.6901 0.6287 0.7423 0.6335 0.6514 0.6193
988295 0.2,0.1,0.4 3.9362 3.7422 3.4481 3.6339 3.5950 3.6065 3.4445 3.1189 3.9950 3.3291 3.4631 3.3043
% Unitsa 0.1,0.1,0.4 3.1252 2.9740 2.9634 3.1520 3.3050 3.3499 3.3361 3.5217 3.4595 3.2856 3.0991 3.1126
% Costa 0.4,0.4 1.5554 1.5271 1.4988 1.4706 1.4423 1.4141 1.3858 1.3575 1.3293 1.3010 1.2727 1.2445
a Consumption of the 13 excluded drug specialities (in both numbers of prescriptions and cost) expressed as a percentage of the totalnumber of prescriptions or cost.
© Adis International Limited. Ali rights reseNed. PharmacoEconomics 1996 Sep; 10 (3)

272 de Marino et al.
930
Short-Term Forecasts
Results
1008060
Time index
4020o
910Cf)c.~
co 890 Da.o ~D
DDo
DDo yDrPD
cn D E:I=ID
c 870D
o D
aDr9.°5
Cf)
~a. 850o
#Dci lz Dm D D
D
830 D
D~D
810D
• mean absolute percentage error (MAPE), whichwas used to interpret the goodness-of-fit.For time-series processing, the Statgraphics Ver
sion 6.0 statistical package was used.
To systematise their presentation, the results obtained have been grouped according to the technique employed in establishing the forecast.
In table I, the forecasts are shown for the 12months following the last available data item in thetime series of each of the 13 excluded DS studied,together with % units and % cost. The smoothingconstants, which minimise the MSE, are also shown.
In the consumption series of total units and totalcost, the smoothing constants used were 0.1,0.1,
Fig. 1. Trend curve for the nonseasonal time-series of the totaldrug specialities consumption, expressed as the number of prescriptions per 1000 patients. The solid line represents the regression line. The time index is a sequential number to indicatethe period assigned to each of the moving average calculatedvalues. A 12-period moving average has been calculated, thus78 moving average values have been obtained which correspond one-to-one with the time index values.
Forecasting Methods
With regard to short- and medium-tenn forecasting, time-series analysis is acknowledged as themost reliable methodology. We decided to use thesmoothing and decomposition methods, since theyare accurate, intuitive, user-friendly and inexpensive.
To determine what type of technique should beused in each series, it was decided to apply autocorrelation coefficient analysis for different timelags, thereby determining the randomness, seasonality (i.e. seasonal factors) and stationary components of each one. The pharmaceutical consumption series showed no randomness; once this waschecked and the seasonal pattem identified, theforecast calculation was undertaken. According toMakridakis and Wheelwright[6] and Uriel andMufiiz,[7] the best short-term forecasts (Le. up to 12months) are obtained with smoothing methods,whereas for medium-term forecasts (from 1 to 2years) decomposition methods are suitable. Consequently, the following forecast techniques wereused.[6] Among smoothing methods, in serieswith a seasonal pattern, Holt-Winter's exponentialsmoothing technique was used. In series with anonseasonal pattem, Holt's exponential smoothingtechnique was used. Among decomposition methods, the ratio-to-moving averages technique wasused. The smoothing methods provide a series ofvalues obtained by weighting the past observationsin a time series in order to obtain a forecast for thefuture. This kind of method produces a data serieswhich is the forecast values for the time series. Thedecomposition methods provide the parameters ofa multiplicative mode!. The results are interpretedas the values of the polynomial function to be substituted in the mathematical model reflecting themajor time series subcomponents and its relationships.
To quantify the accuracy of forecasting, the following measures were used:• mean absolute error (MAE)• mean squared error (MSE), which was given
priority when its behaviour was different fromthat ofMAE;
© Adis International Limited. Ali rights reserved. PharmacoEconomics 1996 Sep: 10 (3)
Selective Financing of Drugs in Spain 273
Fig. 2. Trend curve for the nonseasonal time-series of the totaldrug specialities consumption, expressed as cost in constantSpanish pesetas (Pta; $US1=Pta123.9) per 1000 patients. Thesolid line represents the regression line.
Time index
58
54
~c: 50Q)
~a.ooo 46-(ti'~Cf)
Ci) 42oo
38
34
O 20 40 60 80 100
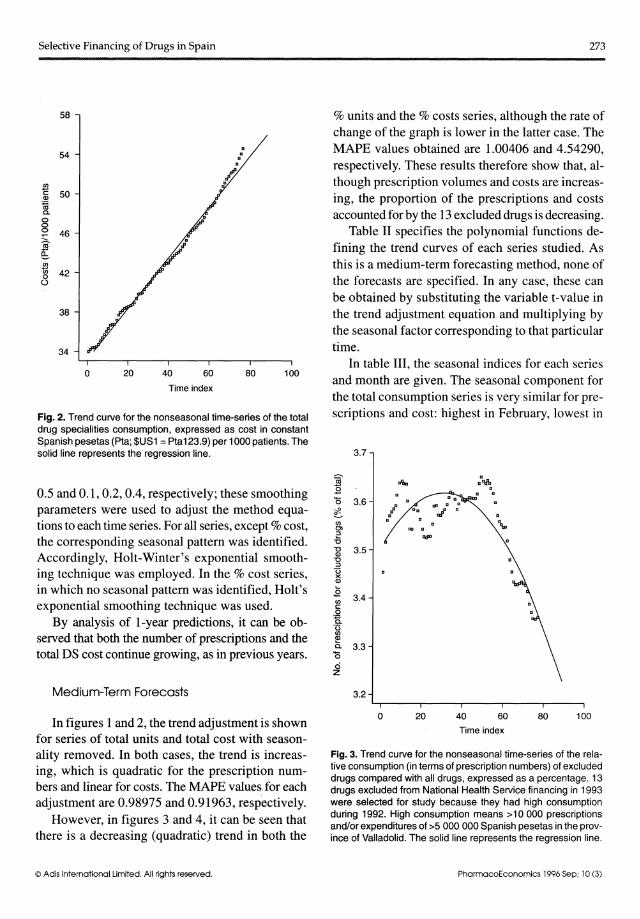
% units and the % costs series, although the rate ofchange of the graph is lower in the latter case. TheMAPE values obtained are 1.00406 and4.54290,respectively. These results therefore show that, although prescription volumes and costs are increasing, the proportion of the prescriptions and costsaccounted for by the 13 excluded drugs is decreasing.
Table II specifies the polynomial functions defining the trend curves of each series studied. Asthis is a medium-term forecasting method, none ofthe forecasts are specified. In any case, these canbe obtained by substituting the variable t-value inthe trend adjustment equation and multiplying bythe seasonal factor corresponding to that particulartime.
In table III, the seasonal indices for each seriesand month are given. The seasonal component forthe total consumption series is very similar for prescriptions and cost: highest in February, lowest in
3.7
0.5 and 0.1, 0.2, 0.4, respectively; these smoothingparameters were used to adjust the method equations to each time series. For alI series, except % cost,the corresponding seasonal pattem was identified.Accordingly, Holt-Winter's exponential smoothing technique was employed. In the % cost series,in which no seasonal pattem was identified, Holt'sexponential smoothing technique was used.
By analysis of 1-year predictions, it can be observed that both the number of prescriptions and thetotal DS cost continue growing, as in previous years.
Medium-Term Forecasts
~.EQ 3.6cfCf)C))~
-O~ 3.5"O:::J
C3><Q)
.ECf) 3.4c:
oQa0
0Cf)
~Q. 3.3Q
ciz
3.2
Fig. 3. Trend curve for the nonseasonal time-series of the relative consumption (in terms of prescription numbers) of excludeddrugs compared with ali drugs, expressed as a percentage. 13drugs excluded from National Health Service financing in 1993were selected for study because they had high consumptionduring 1992. High consumption means >10 000 prescriptionsand/or expenditures of >5 000 000 Spanish pesetas in the province of Valladolid. The solid line represents the regression line.
Time indexIn figures 1and 2, the trend adjustment is shown
for series of total units and total cost with seasonality removed. In both cases, the trend is increasing, which is quadratic for the prescription numbers and linear for costs. The MAPE values for eachadjustment are 0.98975 and 0.91963, respectively.
However, in figures 3 and 4, it can be seen thatthere is a decreasing (quadratic) trend in both the
o 20 40 60 80 100
© Adis International Limited. Ali rights reserved. PharmacoEconomics 1996 Sep; 10 (3)

274 de Marino et al.
4.1
5.1 No relationship between indications and seasonality was observed for the other 6 drugs.
Forecasting lotalPharmaceutical Consumption
It might have been possible to forecast total consumption by employing only the prescription consumption series. However, forecasting total DS expenditures involves taking into account the numberof prescriptions dispensed and the average prescription price, which is infiuenced not only byprice revisions, but also by the shift of the prescriptions to the latest DS registration and higher price.As a result, it was necessary to also work with thecosts series.
Both short term forecasts, carried out by theHolt-Winter method, as well as medium term ones,for which the moving average ratio was employed,indicate that, if no significant strategies were instituted, pharmaceutical consumption in the provinceofValladolid will continue expanding, regarding bothprescriptions dispensed and, especially, cost.
However, in figures 1 and 3, a break with thistrend can be observed at the end of 1989 (or 52 onthe time index scale), a break that is not apparentin consumption trends based on cost (figs 2 and 4).If the possible causes are analysed, one finds thatFebruary 1990 saw the introduction of a new prescription form in Spain for charging to the NHS. Itwas necessary to include much more information:duration of treatment, posology, advice to the patient and warnings directed at the pharmacist. Theintroduction of this form met with resistance on thepart of doctors, which resulted in the prescriptionof those presentations that had more units per box(e.g. 60 tablets per box compared with 30 tabletsper box). In this way, it was not necessary to writethat amount of information a second time shouldthere have been a need to prescribe further in orderto continue the treatment because for each prescription only one DS packing can be included. Giventhe fact that the price of larger units was alsohigher, this strategy did not affect total sales.
Discussion
80 100 12060
Time index
4020
aa
a a
o
3.1
1.1
2.1
Fig. 4. Trend curve for the nonseasonal time-series of the relative consumption [in terms of costs, in Spanish pesetas (Pta;$US1 =Pta123.9)] of excluded drugs compared with ali drugs,expressed as a percentage. 13 drugs excluded from NationalHealth Service financing in 1993 were selected for study because they had high consumption during 1992. High consumption means >10 000 prescriptions and/or expenditures of>5 000 000 Spanish pesetas in the province of Valladolid. Thesolid line represents the regression line.
August, on the increase once again in October, anddeclining in December. In the series relating to %
consumption in prescriptions of the 13 DS out ofthe total, the highest point can be observed in February, the lowest in July and August, and intermediate values in November and December.
By a simple observation of the seasonal index foreach of the 13 DS studied, behavioural patterns areisolated that may reiate to the indications of the corresponding drug:• tonics-restoratives (NC: 712836, 749127, 937219
and 939629) have high seasonal factors in June;• cough and cold preparations (NC: 719245,
737478) have the lowest seasonal factor from Mayto September;
• emollient cream (NC 728485) has its peaks inAprii, May and June.
© Adis International Limited. Ali rights reserved. PharmacoEconomics 1996 Sep; 10 (3)

Selective Financing of Drugs in Spain
Evaluaticn cf the Impact cf SF
For an evaluation of the effect of SF on changesin pharmaceutical consumption in the province ofVaHadolid, it would be necessary to have available:(i) the series of monthly consumption figures forprescriptions and the cost of aH the DS sold, and(ii) the series of monthly consumption figures inprescriptions and cost for each and every one of theDS excluded from financing. With these, another 2series could be calculated, made up of the percentages representing consumption each month of aHexcluded DS, in prescriptions and cost, out of totalconsumption. The forecast made as a result of bothseries of percentages would make it possible toevaluate the impact of the measure.
Table Il. Polynomial functions defining the nonseasonal seriestrends for the medium-term forecasts (using the ratio-to-movingaverages technique). Individuai drug specialities are indicated inthe table by their national code (NC) number
Time series Polynomial
Total unitsa 821.753 + 0.536703*T + 5.58111 E - 3*T2
Total costa 332054 + 2514.16*T
NC 712836b 2.74335 - 8.4493E - 5*T2
NC 715227b 2.7455 - 0.0114579*T
NC 719245b 2.35132 + 0.0132921*T
NC 724179b 0.798772 - 0.0195191*T + 4.23649E - 4*T2
NC 728485b 0.384722 + 0.0251813*T
NC 737478b 6.10628 - 0.0183627*T
NC 749127b 2.05316 - 4.81063E - 3*T
NC 798546b 3.05063 + 0.0203381*T - 2.31237E - 4*T2
NC 937219b 0.705034 + 0.0377215*T - 3.94911 E - 4*T2
NC 939629b 0.719102 + 0.0102038*T + 1.37867E - 4*T2
NC 947226b 1.08766 + 1.3519E - 4*T + 1.11652E - 4*T2
NC 966770b 0.881723 + 6.73592E - 3*T -1.36787E - 4*T2
NC 988295b 5.62993 + 3.93438E - 3*T - 3.24225E - 4*T2
% UnitsC 3.50724 + 7.16013E - 3*T - 1.16553E - 4*T2
% Cosf 2.84385 + 7.08039E - 4*T -1.68178E - 4*T2
a Total consumption expressed in prescriptions or costs [inconstant pesetas (Pta)] per 1000 patients.
b Consumption, expressed as the number of prescriptions per1000 patients, for each of the drug specialities shown. Thesedrugs were selected according to their expenditures inValladolid during 1992 (>10 000 prescriptions and/or>Pta5 000 000).
c Percentage representing the consumption of the 13 excludeddrug specialities, in terms of number of prescriptions or cost(in constant Pta).
Symbols: E indicates power of 10; T indicates the time index.
© Adis International Limited. Ali rights reserved.
275
As previously mentioned, the written reports onaH of the 1692 excluded DS, which would havemeant that the series of monthly consumption figures for aH the excluded DS could have been obtained, were not available. Consequently, it wasdecided that an approximation to the generaI impact should be carried out, by means of assessingthe upshot of excluding those whose consumptionin VaHadolid during 1992 exceeded lO 000 prescriptions and/or Pta5 000 000.
Below, in accordance with the planned objectives, an evaluation was made of the impact of SFby means of:• an analysis of the forecasts for each of the 13
most consumed excluded DS;• the forecast relating to the repercussion of the
consumption of the 13 DS with regard to totalexpenditures;
• the comparison of the total consumption forecast with real expenditures from the introduction of SF until December 1994.
Forecast AnalysisIn the excluded DS, the price may be assumed
to be constant or influenced solely by authorised percentage revisions. As a result, unlike in the seriesof total consumption, forecasts have been limitedonly to consumption in prescriptions.
It is necessary to point out the difficulty involved in determining forecasts for specific and isolated DS, because of the significant influence thatthe so-caHed irregular (unpredictable) componentmay exert on their behaviour. Thus, for example, acertain manufacturer's sales strategy to promote aspecific drug on an intensive basis a specific speciality, even at the expense of others marketed bythe same company, influences to a large extent thesales pattern of the drug. However, out of total expenditures, these factors, which are unforeseeableand at times difficult to identify, are balanced outby different DS. For this reason, the MAPE of adjustments carried out in some of the 13 DS has beenmore than lO, and the particular behaviour causingthis rise has been able to be identified.
By analysing the short term forecasts for theexcluded DS and comparing them with consumption
PharmacoEconomics 1996 Sep; 10 (3)

276 de Marino et al.
Table III. Seasonal indices for the ratio-to-moving averages technique for the long term forecasts estimates. Individuai drug specialities areindicated in the table by their national code number
Jan Feb Mar Apr May Jun Jul Aug Sep Cct Nov Dec
Total unitsa 103.87 111.86 95.30 100.95 96.89 99.38 92.04 90.41 94.98 107.74 105.92 100.63
Total costa 101.89 109.05 95.32 102.77 99.53 102.82 94.71 90.19 93.74 103.62 105.40 101.75
712836b 75.24 101.26 95.50 104.48 107.97 116.45 114.32 115.33 116.56 93.56 84.83 74.49
715227b 92.06 105.04 96.65 105.38 102.63 103.44 99.64 95.94 98.27 99.40 104.69 96.83
719245b 177.84 168.13 104.49 98.23 82.31 65.04 47.30 47.67 60.99 98.75 119.95 129.28
724179b 92.21 103.78 98.30 108.63 106.88 106.77 100.74 87.78 88.80 96.26 106.32 103.52
728485b 93.71 101.37 99.93 109.19 108.96 110.14 102.82 101.05 99.40 92.06 89.22 92.12
737478b 187.05 180.85 108.87 83.37 64.69 51.67 35.37 36.10 59.87 135.27 129.92 126.97
749127b 93.04 112.73 102.63 98.83 101.20 111.33 96.80 90.35 98.99 104.73 99.52 89.86
798546b 93.84 96.42 87.98 98.31 97.01 101.43 104.80 112.62 114.64 103.62 98.01 91.32
937219b 76.94 97.18 97.08 100.88 102.89 121.23 111.73 112.96 116.06 96.87 87.39 78.78
939629b 81.73 107.21 98.51 108.34 122.11 128.50 96.87 88.13 94.13 95.25 95.29 83.94
947226b 105.10 103.78 85.69 85.91 81.86 78.41 70.75 67.37 100.37 131.41 153.32 136.03
966770b 97.60 112.14 98.83 103.89 101.60 100.73 90.85 77.64 94.32 111.19 108.71 102.48
988295b 88.2 121.74 96.48 99.13 98.93 104.82 100.84 93.62 100.39 101.71 101.14 92.92
% UnitsC 111.5 113.5 104.0 96.5 96.5 94.0 91.5 91.0 97.0 99.7 102.3 102.3
a Total consumption expressed in prescriptions or costs in constant pesetas per 1000 patients.
b Consumption, expressed in prescriptions per 1000 patients, for each of the drug specialities whose national code is shown, selected byconsumption in Valladolid during 1992 that was over 10 000 prescriptions and/or 5 000 000 pesetas.
c Percentage representing the 13 excluded drug specialities consumption, in prescriptions or cost in constant pesetas, the consumption ofwhich in Valladolid during 1992 was over 10000 prescriptions and/or 5000000 pesetas, out of the total prescriptions or cost ($US1 =123.9 pesetas, February 1996).
for the same month in previous years, it can be easilyobserved which were expanding on the NHS market atthe time of exclusion and which, on the contrary, showed a downtum in consumption. In only3 forecasts (NCs 719245,724179,939629), bothshort term and medium term, is there growth. In 2forecasts (NCs 728485, 947226), with a mediumterm increasing trend, a prompt stabilisation, withan initial downturn, has been observed in relationto the short term forecast; this regression, havingbegun in the last few months, has not yet managedto modify the trend. Six drugs (NCs 712836,715227, 749127, 798546, 937219, 988295) are infull decline according to the two methods used;another 2 (NCs 737478, 966770), with an apparentlystable short term consumption, appear to have adownward trend in the medium terme
Total ExpendituresBoth the short term and medium term forecasts
carried out with the % units and % cost series indi-
© Adis International Limited. Ali rights reserved.
cate the progressive fall for both prescriptions andcost after the introduction of SF.
Comparing the growth in total expenditures inthe 5 years prior to the application of the measure,with that of the 1692 excluded DS as a whole supports this same conclusion: while total consumption in prescriptions in 1992 was 15.4% higher thanthat of 1987, during the same period the excludedDS underwent negative growth (-11.4%). Regarding cost, this was positive in both cases, with totalexpenditures increasing 104.7%, compared withonly 12.4% in the case of the excluded DS.
By analysing the consumption distribution ofthe 1692 excluded DS in the province of Valladolidduring 1992, it may be observed that 938 (55.4%)had no sales and 478 (28.3%) produced sales offewer than 250 units. In addition, only lO of theexcluded DS were to be found among the 100 mostconsumed, in terms of units, in the province ofValladolid that year, and 2 out of the 100 most consumed with regard to cost. This implies that only
PharmacoEconomics 1996 Sep; 10 (3)

Selective Financing af Drugs in Spain
0.6% of the excluded DS had sales of relevancefrom the point of view of generaI consumption inprescriptions and 0.1 % in cost. To this must be addedthe fact that only 10% of them increased consumption by more than 100 prescriptions in the period1987-1992.
From what has been said so far, it is possible tosuppose that, for the excluded DS as a whole, therewould be no greater expectations as regards growththan for the 13 that were selected for analysis. Consequently, in the most favourable case, the overallrepercussion of SF would show a downward trendsimilar to the one found for the 13 DS under study.
Comparison with Real ExpendituresIn the absence of other factors determining con-
sumption, the difference between real expendituresand the forecast carried out with time series priorto the measure's introduction could be attributableto the withdrawal of the 1692 DS. Therefore, thisdifference would represent a measure of the impactofSF.
Before undertaking an assessment of this kind,it was necessary to make several corrections withregard to real consumption in 1994, so as to eliminate the distortion originating from the folIowingsituations: (i) the 3% discount on the laboratorysales price of medicines agreed on with the industry; (ii) the change in the reimbursement periodsfor the first quarter of 1994 (in those months, prescription turnover was counted for 8 days morethan in previous years because of administrativechanges). As a consequence of these adjustments,in table IV, one can observe corrected real consumption, with regard to prescriptions· and cost,and forecasts carried out over the short term (July1993 to June 1994) and the medium term (July1994 to December 1994). The effect of the changein the method of forecasting in the months immediately prior and subsequent to the change of technique is of no relevance for forecasts relating tounits. For those relating to cost, the final conclusion as regards a decreasing influence remains thesame, albeit more significant.
© Adis International Limited. Ali rights reseNed.
277
Repercussion EvolutionAs a reference for an evaluation of the repercus-
sion, one must consider the percentage of consumption of the subsequently excluded 1692 DSversus total expenditures in 1992; in prescriptions(11.6%) and cost (4.4%). The difference betweenthese percentages shows the lower average pricesfor the excluded DS.
In July 1993, it is observed that real consumption was 18.54% (in prescriptions) and 19.02% (incost) higher than predicted. SF carne into force on25 July, when reimbursement for that month closed.The reason for that increase in real consumptionmay be attributed to an accumulation of productsprior to their withdrawal.
In August, however, the repercussion was greaterthan expected considering 1992 data. The reasonfor this, presumably, is precipitate or insufficientinformation. InitialIy, out of ignorance, productsthat were stilI financed were not prescribed (i.e.although some items continued to be funded, prescribers thought that they weren't and so didn'tprescribe these items). Thus, for example, antacidswere excluded and continued to be financed as single drugs, despite undergoing a fall in consumptionduring August.
Therefore, in order to calculate the repercussionof SF in 1993 by means of the percentage difference between real consumption and forecast, themonth before and that folIowing the introductionof the measure should not be considered. In theperiod September to December 1993, the estimatedrepercussion was an increase of 9.47% in prescriptions and 6.03% in cost. These figures are somewhat lower than those for 1992 regarding prescriptions, but higher in the case of cost.
In 1994, behaviour during January appears to beerratico GeneraI pharmaceutical expenditures underwent an increase that was difficult to explain inValladolid. As a consequence, actual consumptionwas greater than that forecast. In order to identifythe causes for this, total expenditures in the otherprovinces were studied, and it was observed thatthe average increase in the NHS for January 1994compared with January 1993, adjusting invoiced
PharmacoEconomics 1996 Sep; 10 (3)

278 de Marino et al.
Table IV. Comparison of the total consumption forecast (as prescriptions per 1000 patients and cost in constant pesetas per 1000 patients)with real expenditures from the Selective Financing application to December 1994
MoNTH/year Prescription amount (prescriptions per 1000 patients) Prescription costs [constant pesetas (Pta) per 1000 patients]a
actual forecast difference (%)b actual forecast difference (%)b
Jul93 989.44 834.69 -18.54 648645.35 545000.00 -19.02
Aug 93 645.69 800.94 +19.38 440389.60 520419.00 +15.38
Sep93 764.04 850.49 +10.16 515279.03 542250.00 +4.97
Oct93 à77.20 966.81 +9.27 574346.51 605884.00 +5.21
Nov93 853.01 945.40 +9.77 575981.09 619798.00 +7.07
Dec93 852.44 933.44 +8.68 579147.12 620862.00 +6.72
Jan 94 920.54 900.00 2.28 630553.39 590563.00 -6.77
Feb94 879.42 1008.90 +12.83 534896.72 664109.00 +19.46
Mar94 796.69 908.18 +12.28 548436.99 601 736.00 +8.86
Apr94 824.49 928.45 +11.20 571 488.89 640490.00 +10.77
May94 842.39 895.29 +5.91 586108.88 623764.00 +6.04
Jun 94 867.53 928.03 +6.52 605013.43 648704.00 +6.74
Jul94 780.91 861.72 +9.38 542146.73 559747.92 +3.14
Aug94 795.21 847.99 +6.22 540861.49 535301.68 -1.04
Sep94 843.55 892.47 +5.48 569405.83 558728.65 -1.91
Oct94 896.55 1014.21 +11.60 601 139.07 620222.65 +3.08
Nov94 888.26 998.91 +11.08 611 595.39 633526.85 +3.46
Dec94 882.80 950.77 +7.15 610499.50 614145.99 +0.59
a $US1 = 123.9 pesetas, February 1996.
b Forecast compared with actual values.
prescription days, was also greater than the expected interannual increase.
The annual repercussion attributable to SF in thewhole of 1994 is a decrease of 8.23% for consumption in prescriptions and 4.65% as regards cost. Anassessment of these figures in relation to 1992 information, as well as to the downward trend encountered for the 13 most consumed excluded DS,makes an evaluation of the repercussion on prescriptions reasonable. Nevertheless, 4.65% in the caseof cost is greater than that expected for two reasons: (i) on the one hand, whilst the repercussionon prescriptions is lower than the percentage of allexcluded DS in 1992, in cost it is higher withoutprice increases; (ii) on the other hand, forecast series quotient, obtained by dividing the % units and% costs series (table I), gives values from a valueof 2, in the first months following the introductionof SF, to 3 in the months at the end of the studyperiodo Comparing these quotients with the ratio onprescriptions/cost (8.23/4.65 =1.76) in 1994, it can
© Adis International Limited. Ali rights reserved.
be observed that the value is out of range, as can beexpected. In addition, the analysis of consumptionfrom 1987 to 1992 reinforces this opinion becausethe percentage of consumption of the 1692 excludedDS as part of total expenditures was more than double in prescriptions than in cost. According to thisinformation, the cost repercussion would have tobe progressively less in respect of that for prescriptions.
Analysing in detail the repercussion on costspercentages for each month during 1994, a different effect is observed between the first and the second 6-month periods. The decrease was 7.7% fromJanuary to June, but only to 1.31 % in the intervalJuly to December. Then, the increase of repercussion in cost was restricted to the first year after SFapplication (July 1993 to June 1994). This repercussion in cost (ratio excluded DS versus total DS)is higher than expected and must be attributed tothe containment of total invoiced cost. This cost isthe result of 2 factors, the number of prescriptions
PharmacoEconomics 1996 Sep; 10 (3)

Selective Financing of Drugs in Spain
and the DS average prices. As the number of prescriptions has continued to grow (fig. l), containment has to be attributed to a control with regardto DS average price increase due to other reasons.
Assessing the interannual growth relating to theaverage price of DS in constant Pta in the 3 yearsprior to the measure's introduction it may be observed that this increased by 6.78% during the period1990-1991, 7.56% in 1991-1992 and 6.85%for 1992-1993. However, from 1993 to 1994 thisprice grew by only 2.61 %. Among the possiblecauses of this containment must be considered thesetting up, almost simultaneously with the introduction of SF, of the so-called Rational Use ofMedication Programme. This entailed the launching (in Valladolid and 27 other provinces) of arange of activities, among which the folIowingshould be highlighted:• the drawing up of an area therapeutic formulary;• agreement on therapeutic records;• the circulation of reports on new medicines on
the market;• individualised information concerning pre
scription cost and quality.This information was sent to each generaI med
icine professional, and there were personal interviews with those whose pharmaceutical consumption indicators showed considerable deviationfrom the health sector average.
Overal! Findings
The lower economic impact of SF after a yearof application must be attributed to 2 reasons.
First, prescription of other therapeutic alternatives that are not justified and are more costly maycounteract these effects. After the exclusion of anyNHS DS, several alternatives are possible: (i) thepatient for whom medication is prescribed may acquire such medication on a private basis (with orwithout the advice of the doctor); (ii) the patientmay have another medicine prescribed, which isfinanced; (iii) given that no other financed medicine is prescribed, the problem may go untreated.After an evaluation of the therapeutic indicationsofthe de-listed DS, it may be affirmed that the treat-
© Adis International Limited. Ali rights reseNed.
279
ment of serious problems has not been excludedfrom NHS financing. Consequently, the less affluent section of the population wilI stilI have accessto the treatment of such ·problems. Nevertheless,the prescription of those treatment alternatives thatremain financed wilI, despite their higher therapeutic value, not always be justified and their pricewilI rise.
Secondly, the pharmaceutical industry may attempt to reinstate a de-listed DS by adapting itscomposition. The majority of the new registrationrequests have brought about the authorisation ofDS in which their main active principle has beenformulated as a monodrug. Although these DS mayhave a more rational composition, the price hasmultiplied.
From alI that has been said, it may be concludedthat:• total pharmaceutical consumption is expanding,
both as regards prescriptions dispensed and, especialIy, as regards cost;
• overall, the DS excluded by SF showed negativegrowth;
• the repercussion forecast out of total expenditures, both in the case of prescriptions and cost,of the 13 most consumed excluded DS shows adecline.AIso, the SF repercussion up to December 1994,
calculated by the difference between real expenditures and the forecast (assuming that the measurenot been introduced) shows that: (i) prescriptionsof the 1692 de-listed DS are lower than in 1992;and (ii) costs during the first year of the introduction of SF are higher than expected. This may beattributable to the containment (Le. stability) of theaverage price of a DS prescription, due to reasonsother than SF in itself. However, after the first year,the cost is markedly reduced as a result of adaptation to the measure.
It is important to highlight that, although theresults ofthis study cannot be extrapolated to Spainas a whole, because the real impact of the regulatorymeasure may depend on the previous relative useof de-listed DS in different parts of Spain, they arecomparable with data collected in other provinces.[8]
PharmacoEconomics 1996 Sep; 10 (3)

280
Comparison with Experience inOther Countries
It is difficult to compare the effects of nationalpolicies that have limited medicaI prescriptions byDS exclusion because the type of medicines withdrawn will condition adjustment phenomena. Inthose cases in which excluded DS have been 'marginaI' pharmaceutical products and less expensivethan their alternatives, the number of patients whoacquired the medicine on a private basis was greaterthan those patients who had alternative financedmedication prescribed.[9] Nevertheless, in theNetherlands, the withdrawal of financing of analgesics led to an increase in the consumption ofnonsteroidal anti-inflammatory drugs. In Denmark,prescriptions of cimetidine increased following thewithdrawal of antacidsJIO] Despite these differences, experiences of several countries have confirmed that the withdrawal of financing fromHealth Systems does not bring about a reductionthat is directly proportional to the use of those exciuded medicines at the moment of the withdrawal. [9, II] The effects of adaptation to exclusion,revealed by compensation phenomena, begin a fewmonths after exclusion[3,IO,Il,12,13]
To conclude, it should be mentioned that, although from the economie point of view the resultshave failed, as in other countries, to live up to expectations as regards saving money, the withdrawalof public financing from drugs of low therapeuticvalue constitutes a benefit in itself.
© Adis International Limited. Ali rights reserved.
de Marino et al.
References1. Directiva del Consejo (89/l05/CEE) de 21 de diciembre de 1988,
relativa a la trasparencia de las medidas que regulan la fijacionde precios de los medicamentos para uso humano y suinclusion en el ambito de los sistemas nacionales del segurode enfermedad. DOL 40 de Il de febrero de 1989. Brussels:Consejo de Europa
2. Limon C. La financiacion del medicamento en los paises de laComunidad Europea. Madrid: Insalud, 1991
3. Smith T. Limited lists of drugs: lessons from abroad. BMJ 1985;290: 532-4
4. Taylor D. Prescribing in Europe - forces for change. BMJ 1992;304: 239-42
5. Orden de 6 de abril de 1993, por la que se desarrolla el RealDecreto 83/93, de 22 de enero, que regula la seleccion de losmedicamentos a efectos de su financiacion por el SistemaNacional de Salud. (BOE nO 88, de 13 de abril de 1993).Madrid: Boletmn Oficial del Estado (BOE)
6. Makridakis S, Wheelwright SC. Forecasting: methods and applications, 2nd ed. New York: John Wiley & Sons, 1983
7. Uriel E, Mufiiz M. Estadistica Economica y Empresarial: teoriay ejercicios. Madrid: Editorial AC, 1988
8. Catalan A, Parellada N. Impacto del decreto de financiacionselectiva de medicamentos sobre el gasto farmacéutico enCatalufia. Cuadernos de Gestion 1994; 1: 34-44
9. Smith D, McKercher P. The elimination of select drug productsfrom the Michigan Medicaid formulary: a case study. HospFormul 1984; 19: 366-72
lO. Ferrando C, Henman MC, Corrigan 01. Impact of a nationwidelimited prescribing list: preliminary findings. Drug Intell ClinPharm 1987; 21: 653-8
Il. Soumerai S, Ross-Degnan D, Gortmaker S, et al. Withdrawingpayment for nonscientific drug therapy. JAMA 1990; 263: 831-9
12. Lurie N, Ward NB, Shapiro MF, et al. Termination from Medi-Cal:does it affect health? N Engl J Med 1984; 311: 480-4
13. Soumerai S, Avom J, Ross-Degnan D, et al. Payment restrictions for prescription drugs under Medicaid: effects on therapy,cost, and equity. N Engl J Med 1987: 317: 550-6
Correspondence and reprints: Dr M. Angeles de Marino,Gerencia de Atenci6n Primaria, C / Cardenal Torquemada54, 47071 Valladolid, Spain.
PharmacoEconomics 1996 Sep; 10 (3)