Embed Size (px)
Citation preview
1
1
2
Impact of Sample Type and DNA Isolation Procedure on Genomic 3
Inference of Microbiome Composition 4
5
6
Berith E. Knudsena, Lasse Bergmarka*, Patrick Munka, Oksana Lukjancenkoa, Anders 7
Priemé2, Frank M. Aarestrupa, Sünje J. Pampa# 8
9
aNational Food Institute, Technical University of Denmark, Kgs. Lyngby, Denmark 10
bDepartment of Biology, University of Copenhagen, Copenhagen, Denmark 11
12
B.E.K and L.B. contributed equally to this work. 13
*Present address: Novo Nordisk, Bagsværdvej, 2880 Bagsværd, Denmark 14
#Address correspondence to: Sünje J. Pamp, [email protected] 15
16
17
18
19
Running title: DNA Isolation Methodology for Microbiome Genomics 20
Keywords: microbial ecology, microbiome, DNA isolation, 16S rDNA gene sequencing, 21
metagenomics 22
.CC-BY 4.0 International licenseIt is made available under a (which was not peer-reviewed) is the author/funder, who has granted bioRxiv a license to display the preprint in perpetuity.
The copyright holder for this preprint. http://dx.doi.org/10.1101/064394doi: bioRxiv preprint first posted online Jul. 18, 2016;
2
ABSTRACT 23
24
Explorations of complex microbiomes using genomics greatly enhance our 25
understanding about their diversity, biogeography, and function. The isolation of DNA 26
from microbiome specimens is a key prerequisite for such examinations, but challenges 27
remain in obtaining sufficient DNA quantities required for certain sequencing 28
approaches, achieving accurate genomic inference of microbiome composition, and 29
facilitating comparability of findings across specimen types and sequencing projects. 30
These aspects are particularly relevant for the genomics-based global surveillance of 31
infectious agents and antimicrobial resistance from different reservoirs. Here, we 32
compare in a stepwise approach a total of eight commercially available DNA extraction 33
kits and 16 procedures based on these for three specimen types (human feces, pig 34
feces, and hospital sewage). We assess DNA extraction using spike-in controls, and 35
different types of beads for bead-beating facilitating cell lysis. We evaluate DNA 36
concentration, purity, and stability, and microbial community composition using 16S 37
rRNA gene sequencing and for selected samples using shotgun metagenomic 38
sequencing. Our results suggest that inferred community composition was dependent on 39
inherent specimen properties as well as DNA extraction method. We further show that 40
bead-beating or enzymatic treatment can increase the extraction of DNA from Gram-41
positive bacteria. Final DNA quantities could be increased by isolating DNA from a 42
larger volume of cell lysate compared to standard protocols. Based on this insight, we 43
designed an improved DNA isolation procedure optimized for microbiome genomics that 44
can be used for the three examined specimen types and potentially also for other 45
.CC-BY 4.0 International licenseIt is made available under a (which was not peer-reviewed) is the author/funder, who has granted bioRxiv a license to display the preprint in perpetuity.
The copyright holder for this preprint. http://dx.doi.org/10.1101/064394doi: bioRxiv preprint first posted online Jul. 18, 2016;
3
biological specimens. A standard operating procedure is available from: 46
https://dx.doi.org/10.6084/m9.figshare.3475406. 47
48
IMPORTANCE 49
50
Sequencing-based analyses of microbiomes may lead to a breakthrough in our 51
understanding of the microbial world associate with humans, animals, and the 52
environment. Such insight could further the development of innovative ecosystem 53
management approaches for the protection of our natural resources, and the design of 54
more effective and sustainable solutions to prevent and control infectious diseases. 55
Genome sequence information is an organism- (pathogen-) independent language that 56
can be used across sectors, space, and time. Harmonized standards, protocols, and 57
workflows for sample processing and analysis can facilitate the generation of such 58
actionable information. In this study, we assessed several procedures for the isolation of 59
DNA for next-generation sequencing. Our study highlights several important aspects to 60
consider in the design and conduction of sequence-based analysis of microbiomes. We 61
provide a standard operating procedure for the isolation of DNA from a range of 62
biological specimens particularly relevant in clinical diagnostics and epidemiology. 63
.CC-BY 4.0 International licenseIt is made available under a (which was not peer-reviewed) is the author/funder, who has granted bioRxiv a license to display the preprint in perpetuity.
The copyright holder for this preprint. http://dx.doi.org/10.1101/064394doi: bioRxiv preprint first posted online Jul. 18, 2016;
4
INTRODUCTION 64
65
Microbial communities fulfill central roles in biological systems, such as in human, 66
animal, and environmental ecosystems. Genomics-based interrogations of these 67
communities can provide unprecedented insight into their composition and function, and 68
reveal general principles and rules about their ecology and evolution (1-4). 69
Genomics-based microbiome analyses can also have important practical implications, 70
such as for the diagnosis and management of infectious diseases. Together with 71
relevant metadata, attribute data, and appropriate bioinformatics and statistical 72
approaches, genomic sequencing data could enable the global surveillance of emerging 73
and re-emerging infectious diseases, and teach us about the reservoirs and 74
transmission pathways of pathogens (5-7). Ultimately, genomics-based information 75
about infectious disease epidemiology may help us to predict, prevent, and control 76
infectious diseases faster, more precisely, and more sustainably. 77
In order to facilitate large-scale microbiome analyses, harmonized standards for sample 78
handling and data analysis need to be ensured. To be able to establish pathogen 79
reservoirs and transmission pathways, specimens from different sources, such as from 80
humans, animals, and the environment, will need to be examined. For genomics 81
analysis, the DNA needs to be isolated from the specimens for DNA sequencing. 82
However, DNA isolation methods are often only evaluated and established in the context 83
of specimens from an individual source (e.g. human fecal specimens), and seldom 84
across a variety of specimen types (8-12), which is addressed in the present study. 85
Current sequencing technologies, such as Illumina MiSeq and Hiseq, PacBio, 86
IonTorrent, and Nanopore systems, still require large initial DNA template quantities, 87
.CC-BY 4.0 International licenseIt is made available under a (which was not peer-reviewed) is the author/funder, who has granted bioRxiv a license to display the preprint in perpetuity.
The copyright holder for this preprint. http://dx.doi.org/10.1101/064394doi: bioRxiv preprint first posted online Jul. 18, 2016;
5
particularly from the perspective of PCR-free metagenomics-based analysis. In contrast, 88
16S rRNA gene profiling can reveal a bacterial and archaeal composition for samples 89
with low initial DNA template quantities. In metagenomics, low quantities of input DNA 90
can result in low sequencing data output, and impact the inferred microbial community 91
composition (13). Hence, modified DNA isolation protocols for increasing DNA quantities 92
obtained from different types of specimens are desirable. 93
Here, we examine three specimen types (human feces, animal feces, and sewage), a 94
total of eight commercially available DNA isolation kits, and a number of protocol 95
modifications in regard to output DNA (quantity, purity, stability) and microbiome 96
composition (16S rRNA gene profiling, metagenomics). Our results suggest that both, 97
the specimen itself as well as the DNA isolation procedure, can affect DNA quantity and 98
quality, and inferred microbiome composition. Based on the insight gained, we have 99
developed an improved laboratory protocol that can be used for DNA isolations from a 100
variety of biological specimens. 101
.CC-BY 4.0 International licenseIt is made available under a (which was not peer-reviewed) is the author/funder, who has granted bioRxiv a license to display the preprint in perpetuity.
The copyright holder for this preprint. http://dx.doi.org/10.1101/064394doi: bioRxiv preprint first posted online Jul. 18, 2016;
6
RESULTS 102
103
DNA concentration, purity, and stability depend on the type of specimen and DNA 104
isolation method. We extracted DNA from human feces, pig feces, and hospital 105
sewage, using seven commonly used DNA isolation kits and determined DNA 106
concentration, purity, and stability of the isolated DNA (Fig. 1A and Table 1). The DNA 107
concentrations varied greatly (Fig. 1B; see also Table S1A in the supplemental 108
material). For human feces, the highest DNA concentrations were obtained using the 109
EasyDNA, MagNAPure, and QIAStool procedure, for pig feces using the EasyDNA, 110
QIAStool, and QIAStool+BB procedures, and for sewage using the MagNAPure and 111
EasyDNA procedure, while for three methods the DNA concentration from sewage was 112
below the detection limit. On average across the three types of specimen, the highest 113
DNA concentrations were obtained using EasyDNA (44.96 ng/µl +/- 20.99 SEM) and 114
QIAStool 27.88 ng/µl +/- 2.55 SEM), and the lowest using the PowerSoil.HMP (1.55 115
ng/µl +/-0.31 SEM) and InnuPURE (7.77 ng/µl +/- 5.54 SEM) methods. 116
With regard to DNA purity, the best results for human and pig feces were obtained using 117
the EasyDNA, QIAStool, and QIAStool+BB procedure (see Table S1A in the 118
supplemental material). The DNA was generally stable for at least 7 days when stored at 119
room temperature (22°C) with some exceptions (see Table S1A in the supplemental 120
material). A decrease in DNA concentration over time was observed for example for the 121
human feces when extracted with EasyDNA (57% decease in DNA concentration) or 122
MagNAPure (21% decrease in DNA concentration), suggesting the presence of DNases 123
in these extracts. In some cases, an increase in DNA concentration over time was 124
observed, such as for the pig feces when extracted with EasyDNA (32% increase in 125
.CC-BY 4.0 International licenseIt is made available under a (which was not peer-reviewed) is the author/funder, who has granted bioRxiv a license to display the preprint in perpetuity.
The copyright holder for this preprint. http://dx.doi.org/10.1101/064394doi: bioRxiv preprint first posted online Jul. 18, 2016;

7
DNA concentration). An increase in DNA concentration over time at room temperature 126
was previously shown to be related to the hyperchromicity of DNA, and dependent on 127
the DNA concentration and ionic strength of the solution (14). 128
129
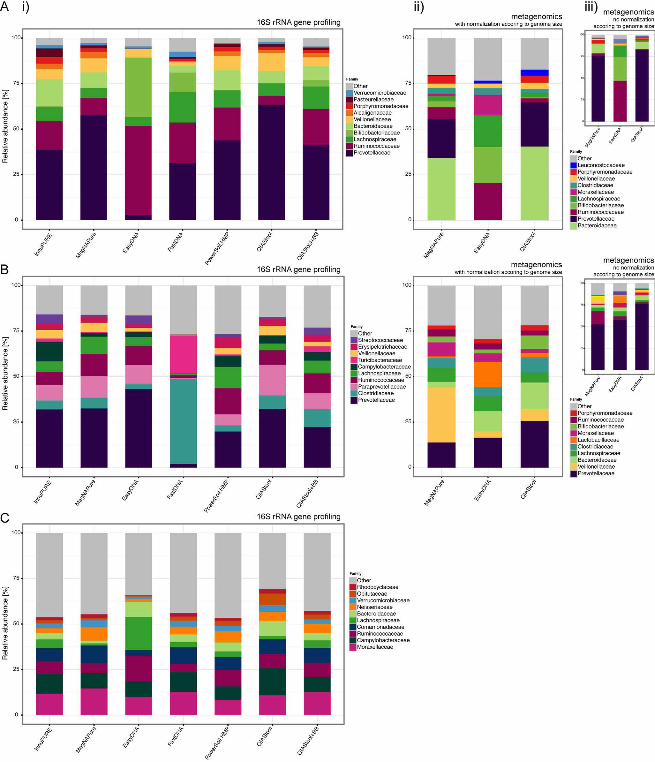
Microbial richness and diversity are influenced by DNA isolation procedure. For 130
the human fecal specimen, the highest bacterial Operational Taxonomic Unit (OTU) 131
richness and diversity were detected using the QIAStool+BB and FastDNA methods, 132
followed by InnuPURE and PowerSoil.HMP as assessed by 16S rRNA gene profiling 133
(Fig. 1C; see also Table S1B in the supplemental material). In comparison, the 134
determined richness and diversity for the EasyDNA method was low, and the relative 135
abundance of Ruminococcaceae and Bifidobacteriaceae dominated the composition 136
compared to the extracts from the other methods (Fig. 1C; see also Fig. S1A in the 137
supplemental material). Thirty-nine samples (human feces, pig feces, and sewage) with 138
high DNA concentration were selected and examined using metagenomic sequencing. 139
In this assessment, the species richness and diversity for human feces was highest for 140
the EasyDNA procedure, and a high relative abundance of Ruminococcaceae and 141
Bifidobacteriaceae was apparent in this analysis as well (see Fig. S1A in the 142
supplemental material). 143
For the pig fecal specimen, the highest bacterial richness and diversity were detected 144
using the PowerSoil.HMP and MagNAPure methods, followed by QIAStool+BB (Fig. 1C; 145
see also Table S1B in the supplemental material). Similarly, richness and diversity were 146
highest using the MagNAPure and EasyDNA methods when assessed using 147
metagenomics. Based on 16S rRNA gene profiling, the richness and diversity for the 148
FastDNA method were lower compared to all other methods, and the relative 149
.CC-BY 4.0 International licenseIt is made available under a (which was not peer-reviewed) is the author/funder, who has granted bioRxiv a license to display the preprint in perpetuity.
The copyright holder for this preprint. http://dx.doi.org/10.1101/064394doi: bioRxiv preprint first posted online Jul. 18, 2016;
8
abundance of Clostridiaceae and Turicibacteraceae was higher and the abundance of 150
Prevotellaceae and Ruminococcaceae lower using this method, compared to the other 151
methods (Fig. 1C; see also Fig. S1A in the supplemental material). 152
For the sewage specimen, the highest bacterial richness and diversity was detected 153
using the InnuPURE method, followed by PowerSoil.HMP and QIAStool+BB, and similar 154
levels were achieved using the other methods (Fig. 1C; see also Table S1B in the 155
supplemental material). The relative abundance of Clostridiaceae was highest in the 156
samples extracted using EasyDNA, and the abundance of Enterobacteriales highest in 157
the samples extracted using PowerSoil.HMP. 158
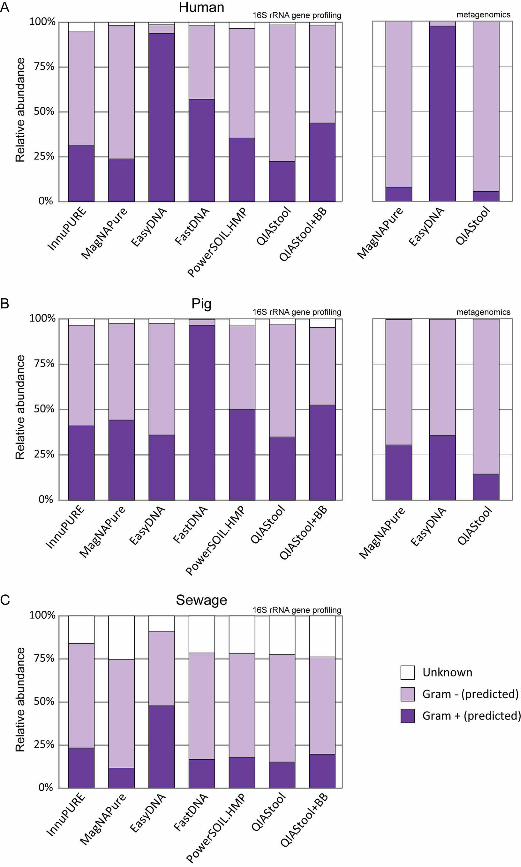
Overall, the relative abundance of predicted Gram-positive bacteria was highest in the 159
human and sewage specimens when extracted with the EasyDNA method, and highest 160
in the pig specimen when extracted using the FastDNA method (see Fig. S2 in the 161
supplemental material). The abundance of predicted Gram-positive bacteria was lowest 162
using MagNAPure and QIAStool, the two methods that did neither include a bead-163
beating step nor specific enzymatic cell-wall digestion. 164
165
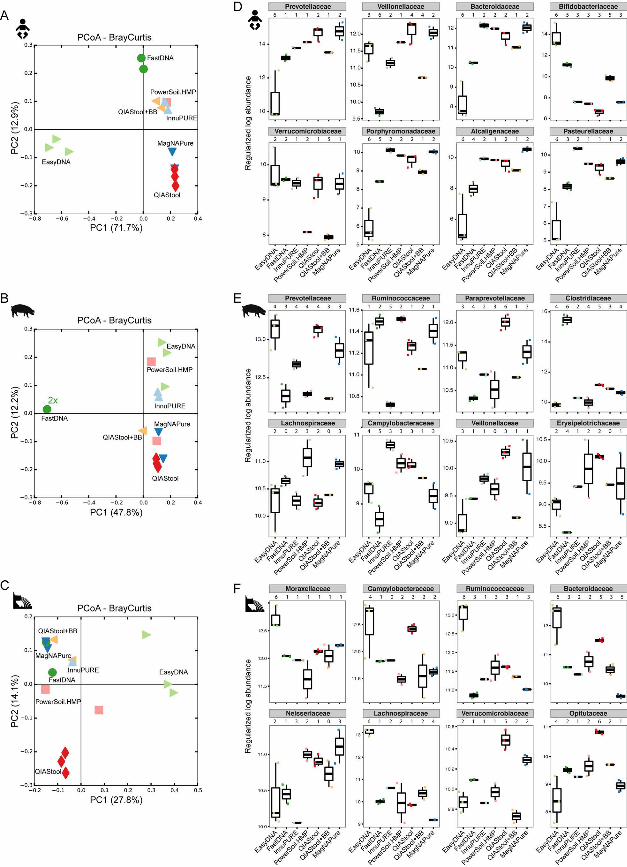
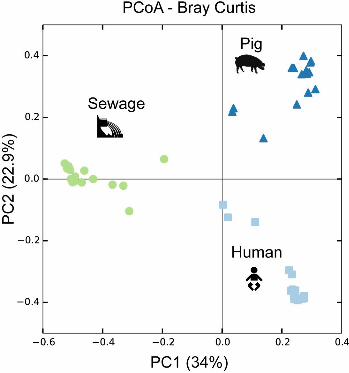
Microbial community composition depends on the choice of DNA isolation 166
procedure. The microbial communities from the three types of specimen clustered 167
separately according to specimen type when examined in PCoA Bray-Curtis ordination, 168
and not according to DNA isolation procedure (see Fig. S3 in the supplemental 169
material), indicating that the largest differences between these samples are driven by 170
the inherent microbiota composition. Bray-Curtis dissimilarity distance analysis carried 171
out separately for each of the three specimens revealed that the samples largely 172
clustered according to DNA isolation procedure (Fig. 2A-C). For the human fecal 173
.CC-BY 4.0 International licenseIt is made available under a (which was not peer-reviewed) is the author/funder, who has granted bioRxiv a license to display the preprint in perpetuity.
The copyright holder for this preprint. http://dx.doi.org/10.1101/064394doi: bioRxiv preprint first posted online Jul. 18, 2016;
9
specimen, the bacterial community composition derived from the EasyDNA isolation 174
differed from the communities obtained using all other methods (Fig. 2A), which is in 175
agreement with the observations on microbial richness (above). The Bray-Curtis 176
distances between the samples from InnuPURE, MagNAPure, FastDNA, 177
PowerSoil.HMP, QIAStool, and QIAStool+BB DNA isolations were on average 0.337 +/- 178
0.012 SEM, whereas the distances between these and the ones derived from the 179
EasyDNA procedure were on average 0.825 +/- 0.014 SEM. 180
For the pig fecal specimen, the bacterial communities derived from the FastDNA 181
isolation differed from all other communities (Fig. 2B). The average Bray-Curtis distance 182
between the samples originating from all but the FastDNA procedure was on average 183
0.473 +/- 0.008 SEM, whereas the distance between these and the ones derived from 184
the FastDNA procedure was on average 0.877 +/- 0.007 SEM. 185
For the hospital sewage specimen, the bacterial communities originating from the 186
EasyDNA method differed from all others (average Bray-Curtis distance 0.600 +/- 0.006 187
SEM) (Fig. 2C), similar to the human fecal matrix (Fig. 2A). In addition, the communities 188
originating from the QIAStool DNA isolation differed from all others (average Bray-Curtis 189
distance 0.514 +/- 0.009 SEM), whereas the average Bray-Curtis distance between all 190
but the QIAStool and EasyDNA samples was 0.460 +/-0.11 SEM on average. 191
192
Distinct taxa account for the differences observed between DNA isolation 193
methods. To quantify the effect of DNA isolation method on microbial community 194
composition we tested for differential abundance of taxa between the communities 195
derived from the different DNA isolation methods using DESeq2 analyses. In pairwise 196
.CC-BY 4.0 International licenseIt is made available under a (which was not peer-reviewed) is the author/funder, who has granted bioRxiv a license to display the preprint in perpetuity.
The copyright holder for this preprint. http://dx.doi.org/10.1101/064394doi: bioRxiv preprint first posted online Jul. 18, 2016;
10
comparisons, significant differences between the DNA isolation methods were observed 197
(Fig. 2D-F; see also Table S2 in the supplemental material). 198
The most abundant family on average in the human fecal specimen was Prevotellaceae 199
(Bacteroidetes), and its abundance was significantly lower in the samples extracted with 200
EasyDNA as compared to all other methods (e.g. 18.3-fold lower in EasyDNA vs. 201
QIAStool, adjusted p-value 1.91-6) (Fig. 2D; see also Table S2 in the supplemental 202
material). Similarly, the abundance of Bacteroidaceae (Bacteroidetes), 203
Porphyromonadaceae (Bacteroidetes), Alcaligenaceae (β-Proteobacteria), and 204
Pasteurellaceae (γ-Proteobacteria) was lower in the samples from the EasyDNA 205
isolation compared to the other methods. In contrast, the abundance of 206
Bifidobacteriaceae (Actinobacteria) was higher in the samples originating from the 207
EasyDNA procedure compared to all other methods (e.g. 770-fold higher in EasyDNA 208
vs. QIAStool, adjusted p-value 7.49-57). The abundance of Verrucomicrobiaceae 209
(Verrucomicrobia) was significantly lower in the samples from the QIAStool+BB and 210
PowerSoil.HMP DNA isolations (e.g. 4.15-fold lower in QIAStool+BB vs. QIAStool, 211
adjusted p-value 0.001). 212
The most abundant family on average in the pig fecal specimen was Prevotellaceae 213
(Bacteroidetes), and its abundance differed significantly between the DNA isolation 214
procedures (e.g. 2.3-fold lower in EasyDNA vs. PowerSoil.HMP, adjusted p-value 1.28-5) 215
(Fig. 2E; see also Table S2 in the supplemental material). The abundance of 216
Clostridiaceae (Clostridia), the on average fourth most abundant family in the pig feces, 217
was significantly higher in the samples extracted by the FastDNA method (e.g. 166-fold 218
higher in FastDNA vs. EasyDNA, adjusted p-value 7.35-110). 219
.CC-BY 4.0 International licenseIt is made available under a (which was not peer-reviewed) is the author/funder, who has granted bioRxiv a license to display the preprint in perpetuity.
The copyright holder for this preprint. http://dx.doi.org/10.1101/064394doi: bioRxiv preprint first posted online Jul. 18, 2016;
11
Moraxellaceae (γ-Proteobacteria) was the most abundant family on average in the 220
hospital sewage, and its abundance was significantly higher in the samples from the 221
EasyDNA isolation compared to other DNA isolation methods (e.g. 2.6-fold higher in 222
EasyDNA vs. PowerSoil.HMP, adjusted p-value 3.82-5) (Fig. 2F; see also Table S2 in 223
the supplemental material). Ruminococcaceae (Clostridia), the on average third most 224
abundant family in sewage, were also significantly more abundant in the samples from 225
the EasyDNA isolation compared to other DNA isolation procedures (e.g. 7.3-fold higher 226
in EasyDNA vs. FastDNA, adjusted p-value 4.28-17). 227
228
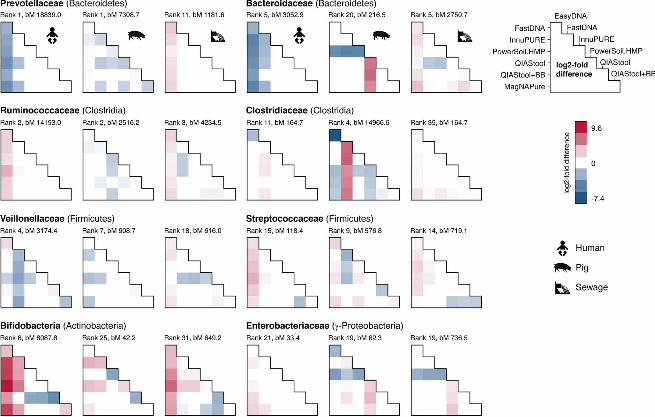
DNA isolation procedure affects the abundance of taxa differently across 229
specimens. Given that differential taxa abundances were observed for the different 230
DNA isolation procedures for the three specimen types, we investigated whether the 231
abundance differed in the same way between DNA isolation procedures across 232
specimens. For example, we were asking: If taxon A is observed at a higher abundance 233
upon DNA isolation with method X compared to method Y in specimen type 1, is this 234
taxon also observed at a higher abundance upon DNA isolation with method X 235
compared to method Y in specimen type 2? We examined taxa that were detected in all 236
three specimen types, and selected representative families from different phyla (Fig. 3). 237
Similar patterns of differential abundance were observed for certain taxa across 238
specimen types, with exceptions, including two families from the Bacteroidetes phylum. 239
The abundance of Prevotellaceae and Bacteroidaceae was significantly lower when 240
human fecal specimen were extracted with EasyDNA compared to other methods. In 241
contrast, these two families were observed at a significantly higher abundance when 242
sewage was extracted with EasyDNA compared to other methods (Fig. 3). 243
.CC-BY 4.0 International licenseIt is made available under a (which was not peer-reviewed) is the author/funder, who has granted bioRxiv a license to display the preprint in perpetuity.
The copyright holder for this preprint. http://dx.doi.org/10.1101/064394doi: bioRxiv preprint first posted online Jul. 18, 2016;
12
Likewise, Ruminococcaceae of the phylum Clostridia were observed at a significantly 244
higher abundance in human fecal and hospital sewage samples but not in pig fecal 245
samples when extracted with the EasyDNA method compared to other methods. The 246
same pattern was however not observed for all families of the phylum Clostridia. 247
Clostridiaceae abundance appeared higher in human and pig feces when extracted with 248
FastDNA compared to other methods, and Clostridiaceae abundance appeared higher 249
in sewage when extracted using the EasyDNA method compared to other methods (Fig. 250
3). 251
Thus, we found significant differences in the abundance of certain families according to 252
specimen type, which sometimes depend on the DNA isolation procedure. Some of the 253
differential abundance patterns were similar across the three types of specimens, while 254
others differed. 255
256
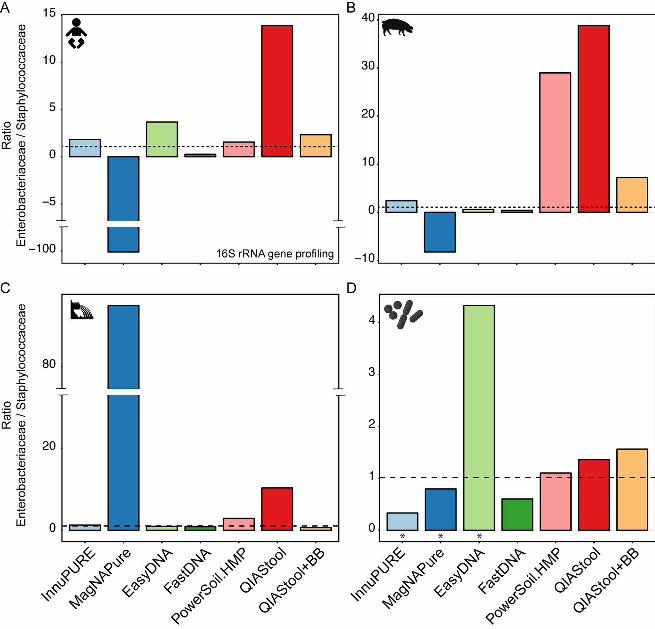
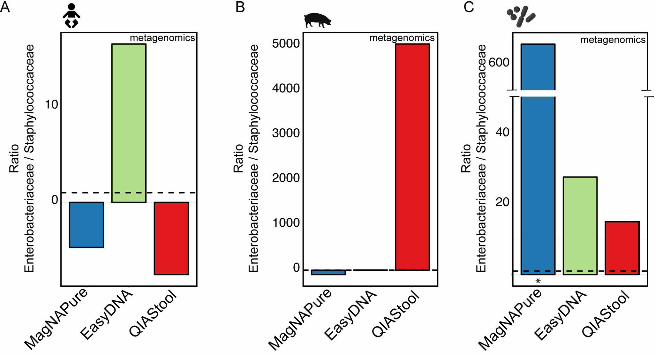
Detection of spiked bacteria is dependent on DNA isolation procedure and 257
specimen type. In order to quantify DNA isolation efficiency, we spiked the three 258
specimen with known numbers of two bacterial representatives, namely Salmonella 259
enterica serotype Typhimurium DT104 (Gram-negative) and Staphylococcus aureus 260
ST398 (Gram-positive) in a CFU ratio of 1.02. Both, S. enterica and S. aureus were 261
present in negligible numbers in the three specimens before spiking. DNA was isolated 262
from these samples using the seven different DNA isolation methods, and the 263
abundance of the two strains determined using 16S rRNA gene profiling, and for some 264
samples also using metagenomics. Based on 16S rRNA gene profiling, the spiked 265
organisms accounted for an average abundance of 1.0% (+/-0.29 SEM) 266
.CC-BY 4.0 International licenseIt is made available under a (which was not peer-reviewed) is the author/funder, who has granted bioRxiv a license to display the preprint in perpetuity.
The copyright holder for this preprint. http://dx.doi.org/10.1101/064394doi: bioRxiv preprint first posted online Jul. 18, 2016;
13
Enterobacteriaceae, and 0.29% (+/-0.11 SEM) Staphylococcaceae across the three 267
types of specimen. 268
Using QIAStool, a DNA isolation method that does not involve a bead-beating step, the 269
abundance of Enterobacteriaceae was higher in the spiked human fecal specimen than 270
expected, with an Enterobacteriaceae/Staphylococcaceae (E/S) ratio of 13.9 (Fig. 4A). 271
This ratio was lower in the spiked human fecal specimen using InnuPURE, FastDNA, 272
PowerSoil.HMP, and QIAStool+BB, which are all methods that involve a bead-beating 273
step (E/S ratio range 0.3-2.3). The EasyDNA method involves an additional enzymatic 274
lysis step, and using this method the determined E/S ratio was 3.7. Using the 275
MagNAPure method no or lower read numbers assigned to Staphylococcaceae were 276
detected in the spiked samples compared to not spiked samples in the human fecal 277
specimen, and hence the ratio resulted in negative values (Fig. 4A). A similar result was 278
obtained when the samples were examined using metagenomics (see Fig. S4 in the 279
supplemental material). 280
Overall, most DNA isolation methods exhibited a similar tendency across the three types 281
of specimen. For example, for all three specimen types, the E/S ratio was higher using 282
the QIAStool method, compared to the other methods (except MagNAPure for sewage). 283
However, when the strain mix, composed of S. enterica and S. aureus only, was 284
extracted using the seven DNA isolation procedures, their determined E/S ratio was in 285
almost all cases similar to the expected ratio of 1.02, including the QIAStool method. 286
287
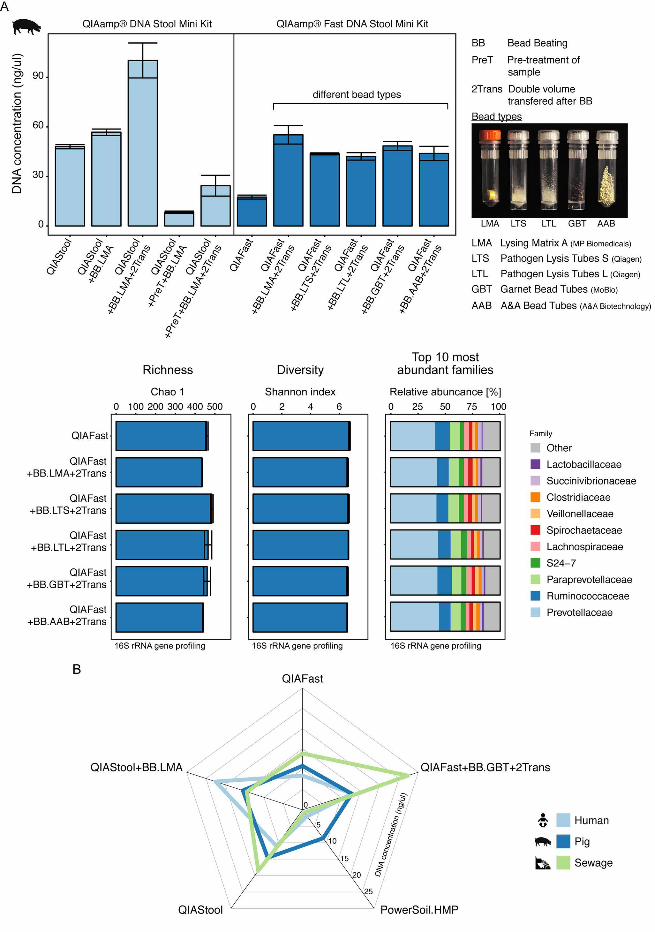
Protocol modifications for increasing DNA concentration. One goal in genomics is 288
to obtain a predicted pattern of microbial community composition that closely resembles 289
the actual composition of microorganisms in a particular environment. Another challenge 290
.CC-BY 4.0 International licenseIt is made available under a (which was not peer-reviewed) is the author/funder, who has granted bioRxiv a license to display the preprint in perpetuity.
The copyright holder for this preprint. http://dx.doi.org/10.1101/064394doi: bioRxiv preprint first posted online Jul. 18, 2016;
14
is to obtain sufficient DNA for metagenome sequencing. To address this aspect, we 291
examined the effect of modifications to standard protocols on output DNA concentration 292
(modifications are described in detail in the Supplemental Materials & Methods section). 293
We chose the QIAStool method as a starting point, as we obtained DNA extracts using 294
this method that were of high purity and stability (see Table S1A in the supplemental 295
material). Another concern is processing time and costs for DNA isolation procedures, 296
particularly for large-scale microbiome projects. The protocol of the QIAamp Fast DNA 297
Stool Mini kit (QIAFast), a kit that became available at the time the present study was 298
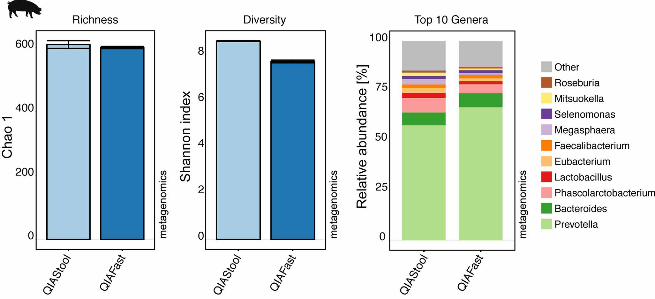
carried out, suggested reduced processing time compared to the QIAStool method. 299
When we compared the QIAStool and QIAFast methods using metagenomic 300
sequencing, we obtained a similar richness, diversity, and microbial community 301
composition with these two methods (see Fig. S5 in the supplemental material). 302
Furthermore, given that our previous results suggested that including a bead-beading 303
step might result in a predicted community composition that was more similar to the 304
community of known composition than without this step (Fig. 4), we included a bead-305
beating step and examined the effect of beads of differing types and cost (Table 1). We 306
obtained a higher DNA concentration using pig feces and the QIAStool kit, when bead 307
beating was applied and the double amount of volume after cell lysis was transferred 308
(Fig. 5A). Similarly, for the QIAFast method, we obtained an on average 2.6-fold higher 309
DNA concentration by including a bead beading step and transferring the double amount 310
of volume after cell lysis, compared to DNA isolations without these modifications (Fig. 311
5A). Both, DNA purity and stability were in the expected range (see Table S3 in the 312
supplemental material). Even though the DNA concentration was higher with these 313
.CC-BY 4.0 International licenseIt is made available under a (which was not peer-reviewed) is the author/funder, who has granted bioRxiv a license to display the preprint in perpetuity.
The copyright holder for this preprint. http://dx.doi.org/10.1101/064394doi: bioRxiv preprint first posted online Jul. 18, 2016;
15
protocol modifications, the richness, diversity and community composition did not 314
significantly differ when assessed by 16S rRNA gene profiling (Fig. 5A). 315
A particular DNA isolation method did not however lead to the highest DNA 316
concentrations for each of the three types of specimen. Whereas the highest DNA 317
concentration for sewage was achieved using the QIAFast+BB.GBT+2Trans method 318
(27.30 ng/ul +/- 4.5 SEM), the highest DNA concentration for human feces was obtained 319
using the QIAStool+BB.LMA method (22.50 ng/ul +/- 4.77 SEM) (Fig. 5B). For pig feces, 320
the highest DNA concentrations were obtained using the QIAStool+BB.LMA (15.43 ng/ul 321
+/-3.48 SEM) and QIAStool (14.57 ng/ul +/-3.62 SEM) methods. On average across the 322
three types of specimen, the highest DNA concentrations were obtained using the 323
QIAFast+BB.GBT+2Trans (17.66 ng/ul +/- 4.82 SEM) and QIAStool+BB.LMA (17.46 324
ng/ul +/- 2.54 SEM) methods. 325
326
DISCUSSION 327
328
Genomics-based investigations of complex microbiomes greatly enhance our 329
understanding about microbial community composition and function relevant to human, 330
animal, and plant health, infectious diseases, environmental pollution, agriculture, and 331
food safety. One current ambitious goal is to establish a global surveillance system for 332
infectious agents and antimicrobial resistance based on next-generation DNA 333
sequencing approaches (15). Given that infectious agents occupy various ecological 334
habitats, DNA needs to be extracted from various types of specimen using standardized 335
approaches in a time- and cost-efficient manner. It is advantageous, if a range of 336
different specimens can be processed using the same standard operating procedure. In 337
.CC-BY 4.0 International licenseIt is made available under a (which was not peer-reviewed) is the author/funder, who has granted bioRxiv a license to display the preprint in perpetuity.
The copyright holder for this preprint. http://dx.doi.org/10.1101/064394doi: bioRxiv preprint first posted online Jul. 18, 2016;

16
light of these considerations, we compared eight commercially available DNA isolation 338
kits (a total of 16 protocols), and based on the findings developed an improved protocol 339
using the QIAamp® Fast DNA Stool Mini kit. 340
Overall, the amounts of DNA obtained from each DNA isolation method differed greatly, 341
and there was no significant correlation between increasing DNA amount and increase 342
in community diversity or richness. The taxonomic microbiome composition appeared to 343
be dependent on both, the specimen and DNA isolation method. For example, the 344
EasyDNA procedure preferentially extracted DNA from Gram-positive bacteria from the 345
human feces and hospital sewage, while the FastDNA procedure preferentially extracted 346
DNA from Gram-positive bacteria from pig feces. Methods that did not include a bead-347
beating or enzymatic treatment step generally extracted less DNA from Gram-positive 348
bacteria. Furthermore, the results from our experiment that included the detection of 349
spiked bacteria (Gram-negative and Gram-positive) suggests that quantification of 350
distinct organisms from complex specimens is more challenging when the organisms 351
are present at lower abundance levels. Inherent specimen properties may influence the 352
DNA isolation efficiency leading to a biased pattern of microbial community composition. 353
When using a particular procedure we found some similar abundance patterns of 354
specific bacterial families between the three specimen types. However, we also 355
observed several differences (e.g. Fig. 2 and Fig. 3). Hence, one cannot conclude that 356
the DNA from a particular bacterial family will be extracted preferentially using one 357
specific DNA isolation method across different types of specimens. This could be due to 358
different inherent cellular properties of the taxa belonging to a specific family, affecting 359
mechanical and enzymatic cell lysis. Moreover, the chemical and physical composition 360
of the specimen could influence DNA isolation and downstream procedures. For 361
.CC-BY 4.0 International licenseIt is made available under a (which was not peer-reviewed) is the author/funder, who has granted bioRxiv a license to display the preprint in perpetuity.
The copyright holder for this preprint. http://dx.doi.org/10.1101/064394doi: bioRxiv preprint first posted online Jul. 18, 2016;
17
example, it is well known that certain compounds, such as humic acid, polysaccharides, 362
and bilirubin can affect PCR (16). Furthermore, fecal sample consistency, reflecting 363
differences in water content and activity, can impact on microbial community 364
composition (17). 365
Our observations from 16S rRNA gene profiling and metagenomics generally agreed, 366
but the taxonomic patterns also exhibited some differences. One reason could be the 367
known primer biases towards certain taxa in 16S rRNA gene based analysis (18). An 368
additional reason could be differences in the composition of the reference databases 369
used for the two sequence-based strategies. While 16S rRNA gene databases are 370
composed of 16S rRNA gene sequences from a large diversity of taxa, the 371
metagenomic sequence databases are based on whole and draft genome sequences 372
from fewer and less diverse taxa. Both strategies complement each other, and efforts 373
are ongoing in developing harmonized analytical workflows for sequence-based 374
microbial community analysis. 375
Based on the insight gained in this study, we have developed an improved DNA 376
isolation method based on the QIAamp® Fast DNA Stool Mini kit. This procedure 377
includes a bead beading step to obtain DNA from both, Gram-positive and Gram-378
negative taxa, and a step in which the double amount of cell lysate is transferred to the 379
column to increase the DNA quantity. For aqueous sample types, like sewage, 380
additional modifications are included, such as increasing the input amount and 381
processing aliquots in parallel, as described in the SOP. While there was no single 382
approach among the 16 procedures tested that appeared to completely resolve all 383
challenges, we find the SOP based one the QIAamp® Fast DNA Stool Mini kit useful for 384
a number of reasons, including: 1) DNA extracts contained high amounts of DNA 385
.CC-BY 4.0 International licenseIt is made available under a (which was not peer-reviewed) is the author/funder, who has granted bioRxiv a license to display the preprint in perpetuity.
The copyright holder for this preprint. http://dx.doi.org/10.1101/064394doi: bioRxiv preprint first posted online Jul. 18, 2016;
18
(sufficient to permitting PCR-free metagenomic sequencing) with high reproducibility 2) 386
DNA extracts were of high quality in terms of DNA purity and stability, 3) DNA from both, 387
Gram-positive and Gram-negative bacteria were reasonably well extracted (including 388
Bifidobacteria), as determined by 16S rRNA amplicon profiling and metagenomic 389
sequencing of spiked and un-spiked complex samples, 4) the method worked well for all 390
examined sample types based on the DNA quality assessment and inferred microbiota 391
composition, 5) the reagents and materials required were cheaper, and 6) the time 392
needed for carrying out the DNA isolation was shorter, compared to several of the other 393
procedures. A standard operating procedure for this DNA isolation method is available 394
from https://dx.doi.org/10.6084/m9.figshare.3475406, and which can be used for 395
different specimen types, and may be relevant to projects like EFFORT-against-AMR, 396
COMPARE-Europe, the International Microbiome Initiative, and International Human 397
Microbiome Standards. 398
In summary, our findings provide new insight into the effect of different specimen types 399
and DNA isolation methods on DNA quantities and genomic-based inference of 400
microbiome composition. We offer an optimized strategy for the DNA isolation for 401
different sample types providing a representative insight into community composition, 402
and which can be conducted in a time- and cost-efficient manner. 403
.CC-BY 4.0 International licenseIt is made available under a (which was not peer-reviewed) is the author/funder, who has granted bioRxiv a license to display the preprint in perpetuity.
The copyright holder for this preprint. http://dx.doi.org/10.1101/064394doi: bioRxiv preprint first posted online Jul. 18, 2016;
19
MATERIAL AND METHODS 404
405
Specimen Collection and Handling 406
Human fecal specimens were collected from a healthy individual. Pig fecal specimens 407
were collected from animals at a conventional pig production farm in Denmark. 408
Untreated sewage was collected from the sewage inlet of the Herlev hospital waste 409
water treatment plant, Denmark. For details regarding sample handling and processing, 410
see Supplemental Materials and Methods (Text S1). 411
412
Spiking with strain mix 413
Subsequent to specimen collection, about half of the aliquots from the human, pig, and 414
sewage were spiked with a representative of Gram-positive and Gram-negative bacteria, 415
namely Staphylococcus aureus ST398 (strain S0385) and Salmonella enterica serotype 416
Typhimurium DT104. For details regarding the preparation of the strain mix, see 417
Supplemental Materials and Methods (Text S1). 418
419
DNA isolation 420
In a first step, seven DNA isolation procedures were examined, namely: InnuPure® C16, 421
Analytic Jena AG (InnuPURE); MagNA Pure LC DNA isolation Kit III, Roche 422
(MagNAPure); Easy-DNATM gDNA Purification Kit, Invitrogen (EasyDNA); MP 423
FastDNATM Spin Kit, MP Biomedicals (FastDNA); PowerSoil® DNA Isolation kit, MoBio 424
(PowerSoil.HMP); QIAamp® DNA Stool Mini Kit, Qiagen (QIAStool); QIAamp® DNA 425
Stool Mini Kit +Bead Beating, Qiagen (QIAStool+BB) (see Table 1, and details below). 426
In a second step, a variety of modifications to two Qiagen kits were examined, namely 427
.CC-BY 4.0 International licenseIt is made available under a (which was not peer-reviewed) is the author/funder, who has granted bioRxiv a license to display the preprint in perpetuity.
The copyright holder for this preprint. http://dx.doi.org/10.1101/064394doi: bioRxiv preprint first posted online Jul. 18, 2016;
20
the QIAamp® DNA Stool Mini Kit (QIAStool), and QIAamp® Fast DNA Stool Mini Kit 428
(QIAFast). The standard operating procedure for an improved DNA isolation method (i.e. 429
QIAamp Fast DNA Stool Modified, corresponding to QIAFast+BB.GBT+2Trans 430
described here) can be found at https://dx.doi.org/10.6084/m9.figshare.3475406. For 431
details regarding the individual DNA isolation procedures, see Supplemental Materials 432
and Methods (Text S1). 433
434
DNA quantitation and quality assessment 435
Subsequent to DNA isolation, the DNA was portioned into 10-µl aliquots to prevent 436
repeated freeze-thawing cycles, and stored at -20°C. DNA concentrations were 437
measured using Qubit® dsDNA BR Assay Kit on a Qubit® 2.0 Fluorometer (Invitrogen, 438
Carlsbad, CA). As DNA extracts can contain contaminants, such as proteins and other 439
organic molecules that can affect downstream procedures such as DNA amplifications in 440
PCR, we determined the DNA purity by measuring the ratios of absorbance at 260/280 441
and 260/230, respectively, using a NanoDrop 1000 Spectrophotometer (Thermo 442
Scientific, Pittsburgh, USA). DNA extracts with a 260/280 ratio between ~1.7 to ~ 2.0, 443
and 260/230 ration between ~2.0 to ~2.2 are regarded as “pure”. The stability of the 444
DNA in the extracts was determined by measuring the DNA concentration after 2 and 7 445
days incubation at 22°C. A decrease in DNA concentration over time can indicate the 446
presence of DNases in the extract. 447
448
16S rRNA gene profiling 449
16S rRNA gene amplicon libraries were generated using a two-step protocol similar as 450
described in Part # 15044223 Rev. B by Illumina. In a first PCR, the V4 region of the 451
16S rRNA genes were amplified using the universal primers (515f 5’-452
.CC-BY 4.0 International licenseIt is made available under a (which was not peer-reviewed) is the author/funder, who has granted bioRxiv a license to display the preprint in perpetuity.
The copyright holder for this preprint. http://dx.doi.org/10.1101/064394doi: bioRxiv preprint first posted online Jul. 18, 2016;
21
TGCCAGCAGCCGCGGTAATAC (19) and 806r 5’-GGACTACNNGGGTATCTAAT (20). 453
The samples were pooled in equal concentrations, and concentrated using ‘DNA clean 454
and concentrator-5 kit’ (Zymo Research, Orange, CA). Paired-end 2 × 250 bp 455
sequencing of barcoded amplicons was performed on a MiSeq machine running v2 456
chemistry (Illumina Inc., San Diego, CA, USA). The sequences were processed using 457
the UPARSE pipeline (21) and a OTU x sample contingency table was created. Using 458
QIIME1.8.0 (22), taxonomy was assigned with uclust using assign_taxonomy.py based 459
on the Greengenes 13.8 reference database. Ecological diversity estimates and 460
microbial community comparisons were performed using the relevant scripts provided by 461
QIIME, phyloseq, and R (22-24). For details regarding the 16S rRNA gene-based 462
microbial community analysis, see Supplemental Materials and Methods (Text S1), and 463
the additional material provided through Figshare, 464
https://figshare.com/projects/DNA_Isolation_Methodology_for_Microbiome_Genomics/1465
4774. 466
467
Metagenomics 468
A subset of the DNA extracts was subjected to metagenomic sequencing. The samples 469
were prepared and sequenced following the Nextera XT DNA Library Preparation Guide 470
for the MiSeq system Part # 15031942 Rev. D, using paired-end v2 2×250bp 471
sequencing. The taxonomic microbiome compositions were determined through the use 472
of the MGmapper pipeline (25). The MGmapper package is available for download at 473
www.cbs.dtu.dk/public/MGmapper/. For details regarding the metagenomics-based 474
microbial community analysis, see Supplemental Materials and Methods (Text S1). 475
476
Differential abundance analysis 477
.CC-BY 4.0 International licenseIt is made available under a (which was not peer-reviewed) is the author/funder, who has granted bioRxiv a license to display the preprint in perpetuity.
The copyright holder for this preprint. http://dx.doi.org/10.1101/064394doi: bioRxiv preprint first posted online Jul. 18, 2016;
22
In order to test for the differential abundance of taxa that may drive the differences 478
observed between the communities derived from the different DNA isolation procedures, 479
we performed DESeq2 analyses. The read count tables from the 16S rRNA gene 480
profiling and metagenomics sequence analysis, respectively, were aggregated to the 481
family level in R (v. 3.2.3, 64bit) (24) We performed an analysis that allows for varied 482
sequencing depth, similar as suggested previously (26), and carried out two-sided Wald 483
tests as implemented in the DESeq2 (v. 1.10.1) package (27). The size factors were 484
determined by DESeq2 from the read count tables. For details regarding the differential 485
abundance analysis, see Supplemental Materials and Methods (Text S1). 486
487
Quantification of strain mix 488
The samples that were spiked with the strain mix composed of S. enterica Typhimurium 489
DT104 and S. aureus ST398 were extracted, sequenced, and analyzed together with 490
the non-spiked samples. For each type of specimen and isolation method, the 491
abundance of Enterobacteriaceae and Staphylococcaceae for 16S rRNA gene profiling 492
and metagenomics, respectively, were determined. The ratios between 493
Enterobacteriaceae and Staphylococcaceae was determined for each sample matrix 494
and isolation method, and compared to the S. enterica Typhimurium DT104 / S. aureus 495
ST398 ratio of CFU that were added to the original samples. For details regarding the 496
quantification of the strain mix, see Supplemental Materials and Methods (Text S1). 497
498
Ethics 499
The collection of human and pig fecal specimens as well as sewage was non-invasive, 500
and were performed in accordance with the Declaration of Helsinki, and complied with 501
Danish and European directives (86/609/EEC). The collection of specimens was 502
.CC-BY 4.0 International licenseIt is made available under a (which was not peer-reviewed) is the author/funder, who has granted bioRxiv a license to display the preprint in perpetuity.
The copyright holder for this preprint. http://dx.doi.org/10.1101/064394doi: bioRxiv preprint first posted online Jul. 18, 2016;
23
conducted in accordance with the act on research ethics of heath research projects as 503
administrated and confirmed by the National Committee on Health Research Ethics of 504
Denmark (Region Hovedstaden), Journal nr. H-14013582. 505
506
Accession numbers 507
The 16S rRNA gene sequences are available through the INSDC, such as from the 508
European Nucleotide Archive (ENA) at the European Bioinformatics Institute (EBI) under 509
accession number PRJEB12431, and the metagenomic sequences from ENA at EBI 510
under accession number PRJEB14814. 511
512
ACKNOWLEDGEMENTS 513
We thank Karin Vestberg (University of Copenhagen), Christina A. Svendsen (Technical 514
University of Denmark) and Jacob D. Jensen (Technical University of Denmark) for 515
technical assistance related to DNA sequencing. Marie S. Jensen (Technical University 516
of Denmark) is acknowledged for the collection of pig fecal samples. 517
518
FUNDING INFORMATION 519
This work was supported by the European Unions’s Seventh Framework Programme, 520
FP7 (613754), the Framework Programme for Research and Innovation, Horizon2020 521
(643476), and The Villum Foundation (VWR023052). Sünje J. Pamp was supported by a 522
grant from Carlsbergfondet (2013_01_0377). The funders had no role in study design, 523
data collection and interpretation, or the decision to submit the work for publication. 524
525
AUTHOR CONTRIBUTIONS 526
.CC-BY 4.0 International licenseIt is made available under a (which was not peer-reviewed) is the author/funder, who has granted bioRxiv a license to display the preprint in perpetuity.
The copyright holder for this preprint. http://dx.doi.org/10.1101/064394doi: bioRxiv preprint first posted online Jul. 18, 2016;
24
B.E.K., L.B., F.M.A., and S.J.P. designed the research; B.E.K., L.B., O.L., and P.M. 527
performed the research; B.E.K., L.B., O.L., P.M., A.P., F.M.A., and S.J.P. contributed 528
analytic tools; B.E.K., L.B., O.L., P.M., and S.J.P. analyzed the data; B.E.K., L.B., and 529
S.J.P. wrote the manuscript; and O.L., P.M., and A.P. edited the manuscript. All authors 530
have read and approved the manuscript as submitted. 531
.CC-BY 4.0 International licenseIt is made available under a (which was not peer-reviewed) is the author/funder, who has granted bioRxiv a license to display the preprint in perpetuity.
The copyright holder for this preprint. http://dx.doi.org/10.1101/064394doi: bioRxiv preprint first posted online Jul. 18, 2016;
25
REFERENCES 532
1. Ding T, Schloss PD. 2015. Dynamics and associations of microbial community types 533
across the human body. Nature 509:357–360. 534
2. Schloissnig S, Arumugam M, Sunagawa S, Mitreva M, Tap J, Zhu A, Waller A, 535
Mende DR, Kultima JR, Martin J, Kota K, Sunyaev SR, Weinstock GM, Bork P. 2013. 536
Genomic variation landscape of the human gut microbiome. Nature 493:45–50. 537
3. Guidi L, Chaffron S, Bittner L, Eveillard D, Larhlimi A, Roux S, Darzi Y, Audic S, 538
Berline L, Brum JR, Coelho LP, Espinoza JCI, Malviya S, Sunagawa S, Dimier C, 539
Kandels-Lewis S, Picheral M, Poulain J, Searson S, Stemmann L, Not F, Hingamp P, 540
Speich S, Follows M, Karp-Boss L, Boss E, Ogata H, Pesant S, Weissenbach J, 541
Wincker P, Acinas SG, Bork P, de Vargas C, Iudicone D, Sullivan MB, Raes J, 542
Karsenti E, Bowler C, Gorsky G. 2016. Plankton networks driving carbon export in the 543
oligotrophic ocean. Nature 532:465–470. 544
4. Costello EK, Stagaman K, Dethlefsen L, Bohannan BJM, Relman DA. 2012. The 545
application of ecological theory toward an understanding of the human microbiome. 546
Science 336:1255–1262. 547
5. Relman DA. 2014. Actionable Sequence Data on Infectious Diseases in the Clinical 548
Workplace. Clinical Chemistry 61:38–40. 549
6. Petersen TN, Rasmussen S, Hasman H, Carøe C, Bælum J, Schultz AC, Bergmark L, 550
Svendsen CA, Lund O, Sicheritz-Ponten T, Aarestrup FM. 2015. Meta-genomic 551
analysis of toilet waste from long distance flights; a step towards global surveillance of 552
infectious diseases and antimicrobial resistance. Sci Rep 1–9. 553
7. Lipkin WI. 2013. The changing face of pathogen discovery and surveillance. Nature 554
Reviews Microbiology 11:133–141. 555
.CC-BY 4.0 International licenseIt is made available under a (which was not peer-reviewed) is the author/funder, who has granted bioRxiv a license to display the preprint in perpetuity.
The copyright holder for this preprint. http://dx.doi.org/10.1101/064394doi: bioRxiv preprint first posted online Jul. 18, 2016;

26
8. Wesolowska-Andersen A, Bahl MI, Carvalho V, Kristiansen K, n TS-P, Gupta R, 556
Licht TR. 2014. Choice of bacterial DNA extraction method fromfecal material influences 557
community structure asevaluated by metagenomic analysis. Microbiome 2:1–11. 558
9. Mackenzie BW, Taylor MW, Waite DW. 2015. Evaluating variation in human gut 559
microbiota profiles dueto DNA extraction method and inter-subject differences 1–11. 560
10. Henderson G, Cox F, Kittelmann S, Miri VH, Zethof M, Noel SJ, Waghorn GC, 561
Janssen PH. 2013. Effect of DNA Extraction Methods and Sampling Techniques on the 562
Apparent Structure of Cow and Sheep Rumen Microbial Communities. PLoS ONE 563
8:e74787. 564
11. Yuan S, Cohen DB, Ravel J, Abdo Z, Forney LJ. 2012. Evaluation of Methods for the 565
Extraction and Purification of DNA from the Human Microbiome. PLoS ONE 7:e33865. 566
12. Albertsen M, Karst SM, Ziegler AS, Kirkegaard RH, Nielsen PH. 2015. Back to Basics 567
– The Influence of DNA Extraction and Primer Choice on Phylogenetic Analysis of 568
Activated Sludge Communities. PLoS ONE 10:e0132783. 569
13. Bowers RM, Clum A, Tice H, Lim J, Singh K, Ciobanu D, Ngan CY, Cheng J-F, 570
Tringe SG, Woyke T. 2015. Impact of library preparation protocols and template quantity 571
on the metagenomic reconstruction of a mock microbial community. BMC Genomics 572
16:1–12. 573
14. Gupta Das NN, Basu S, Bagchi B. 1967. Conformational Changes in Denaturated DNA, 574
pp. 663–688. In Ramachandran, GN (ed.), Conformation of Biopolymers. Academic 575
Press, London and New York. 576
15. Aarestrup FM, Koopmans MG. 2016. Sharing Data for Global Infectious Disease 577
Surveillance and Outbreak Detection. Trends in Microbiology 24:241–245. 578
.CC-BY 4.0 International licenseIt is made available under a (which was not peer-reviewed) is the author/funder, who has granted bioRxiv a license to display the preprint in perpetuity.
The copyright holder for this preprint. http://dx.doi.org/10.1101/064394doi: bioRxiv preprint first posted online Jul. 18, 2016;
27
16. Radstrom P, Knutsson R, Wolffs P, Lovenklev M, Lofstrom C. 2004. Pre-PCR 579
processing: strategies to generate PCR-compatible samples. Mol Biotechnol 26:133–146. 580
17. Vandeputte D, Falony G, Vieira-Silva S, Tito RY, Joossens M, Raes J. 2016. Stool 581
consistency is strongly associated with gut microbiota richness and composition, 582
enterotypes and bacterial growth rates. Gut 65:57–62. 583
18. Klindworth A, Pruesse E, Schweer T, Peplies J, Quast C, Horn M, Glockner FO. 584
2012. Evaluation of general 16S ribosomal RNA gene PCR primers for classical and next-585
generation sequencing-based diversity studies. Nucleic Acids Research 41:e1–e1. 586
19. Yu Y, Lee C, Kim J, Hwang S. 2005. Group-specific primer and probe sets to detect 587
methanogenic communities using quantitative real-time polymerase chain reaction. 588
Biotechnol Bioeng 89:670–679. 589
20. Sundberg C, Al-Soud WA, Larsson M, Alm E, Yekta SS, Svensson BH, Sørensen SJ, 590
Karlsson A. 2013. 454 pyrosequencing analyses of bacterial and archaeal richness in 21 591
full-scale biogas digesters. FEMS Microbiology Ecology 85:612–626. 592
21. Edgar RC. 2013. UPARSE: highly accurate OTU sequences from microbial amplicon 593
reads. Nature Methods 10:996–998. 594
22. Caporaso JG, Kuczynski J, Stombaugh J, Bittinger K, Bushman FD, Costello EK, 595
Fierer N, Peña AG, Goodrich JK, Gordon JI, Huttley GA, Kelley ST, Knights D, 596
Koenig JE, Ley RE, Lozupone CA, McDonald D, Muegge BD, Pirrung M, Reeder J, 597
Sevinsky JR, Turnbaugh PJ, Walters WA, Widmann J, Yatsunenko T, Zaneveld J, 598
Knight R. 2010. QIIME allows analysis of high-throughput community sequencing data. 599
Nature Methods 7:335–336. 600
23. McMurdie PJ, Holmes S. 2013. phyloseq: An R Package for Reproducible Interactive 601
.CC-BY 4.0 International licenseIt is made available under a (which was not peer-reviewed) is the author/funder, who has granted bioRxiv a license to display the preprint in perpetuity.
The copyright holder for this preprint. http://dx.doi.org/10.1101/064394doi: bioRxiv preprint first posted online Jul. 18, 2016;
28
Analysis and Graphics of Microbiome Census Data. PLoS ONE 8:e61217. 602
24. R Development Core Team. 2014. R: A Language and Environment for Statistical 603
Computing. R Foundation for Statistical Computing, Vienna, Austria. 604
25. Petersen TN, Bælum J, Lukjancenko O, Geertz-Hansen HM, Thomsen MCF, 605
Sperotto MM, Lund O, Aarestrup FM, Sicheritz-Ponten T. 2015. MGmapper: an 606
automated pipeline for mapping and stratification of metagenomics sequence data. 607
Submitted. 608
26. McMurdie PJ, Holmes S. 2014. Waste Not, Want Not: Why Rarefying Microbiome Data 609
Is Inadmissible. PLOS Computational Biology 10:e1003531. 610
27. Love MI, Huber W, Anders S. 2014. Moderated estimation of fold change and dispersion 611
for RNA-seq data with DESeq2. Genome Biology 15:31. 612
613
.CC-BY 4.0 International licenseIt is made available under a (which was not peer-reviewed) is the author/funder, who has granted bioRxiv a license to display the preprint in perpetuity.
The copyright holder for this preprint. http://dx.doi.org/10.1101/064394doi: bioRxiv preprint first posted online Jul. 18, 2016;
29
FIGURE LEGENDS 614
615
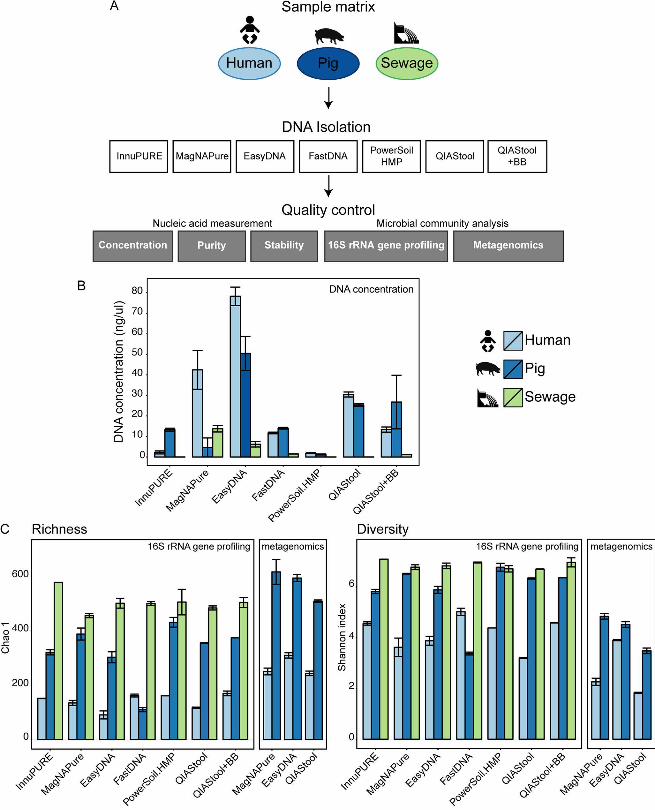
FIG 1. Comparison of DNA extraction methods. (A) Experimental design. Human 616
feces, pig feces, and hospital sewage were extracted using seven different DNA 617
extraction methods (see also Table 1): InnuPure® C16, MagNA Pure LC DNA isolation 618
Kit III, Easy-DNATM gDNA Purification Kit, MP FastDNATM Spin Kit, PowerSoil® DNA 619
Isolation kit, QIAamp® DNA Stool Mini Kit, QIAamp® DNA Stool Mini Kit + Bead Beating 620
(For details see Materials and Methods). DNA concentration, purity, and stability were 621
examined, and microbial community composition determined using 16S rRNA gene 622
profiling and metagenomics (selected samples). (B) DNA from each method was 623
dissolved in 100 ul solution and DNA concentrations were determined using Qubit® 624
dsDNA BR Assay Kit measurements. Values represent averages from duplicate or 625
triplicate DNA extractions (See also Supplemental Table S1A). (C) Ecological richness 626
(Chao 1) and diversity (Shannon index) were determined based on contingency tables 627
from 16S rRNA gene profiling and metagenomic sequencing data at OTU and species 628
levels, respectively (See also Supplemental Table S1B). 629
630
FIG 2. Microbial community dissimilarity. The dissimilarity between the microbiotas 631
from the human, pig, and sewage samples based on DNA extraction methods was 632
examined using Principal Coordinates Analysis of Bray-Curtis distances (A-C) and 633
differential abundance analysis using DESeq2 (D-F) from 16S rRNA amplicon data. (A-634
F) For the PCoA Bray-Curtis ordination analysis only samples with 800 or more reads 635
were included. (D-F) For the differential abundance analysis pairwise testing by DNA 636
extraction method was performed, and bacterial families were considered significantly 637
differentially abundant if their adjusted P-value was <0.1 (see also Table S2 in the 638
supplemental material). Examples for differentially abundant families are shown that are 639
among the top10 most abundant taxa found in the sample, respectively. For each family, 640
the total number of DNA isolation procedures, that exhibit significantly different 641
abundance values compared to a particular DNA isolation procedure, are indicated 642
above the plot, respectively. 643
644
645
.CC-BY 4.0 International licenseIt is made available under a (which was not peer-reviewed) is the author/funder, who has granted bioRxiv a license to display the preprint in perpetuity.
The copyright holder for this preprint. http://dx.doi.org/10.1101/064394doi: bioRxiv preprint first posted online Jul. 18, 2016;
30
FIG 3. Differential abundance of bacterial families. Pairwise testing by DNA 646
extraction method was performed using DESeq2, and the log2-fold difference displayed 647
(column vs. rows) for selected families present in all sample matrices if their adjusted P-648
value was <0.1 (see also Table S2 in the supplemental material). The rank abundance 649
position for each family per sample matrix type is noted according to their regularized 650
log abundance. The baseMean (bM) indicates the mean of negative-binominal-based 651
normalized read counts. The pairwise comparisons based on relative abundance 652
normalization (total-sum scaling) of the bacterial families for the different DNA isolation 653
procedures and three sample types is available though figshare at 654
https://dx.doi.org/10.6084/m9.figshare.3811254. 655
656
FIG 4. Detection of spiked bacteria. The human fecal (A), pig fecal (B), and hospital 657
sewage (C) samples were spiked with a strain mix composed of Salmonella enterica 658
serotype Typhimurium DT104 and Staphylococcus aureus ST398 in a CFU ratio of 1.02. 659
The three sample matrices, as well as aliquots of the strain mix (D) were extracted using 660
seven different DNA extraction methods. The two strains were detected by 16S rRNA 661
gene profiling, and their ratios determined. For details, see Materials and Methods. An 662
asterisk in (D) indicates that the values for the particular DNA extraction of the strain mix 663
are based on single measurements. All other values are based on averages from 664
duplicate or triplicate DNA extractions. The dashed line indicates the ratio of the strain 665
mix based on CFU determinations. The x-axis scale is the same for all panels (A-D), and 666
the y-axis scale specific for each sample type. 667
668
669
FIG 5. Effect of protocol modifications. A) Pig feces was extracted using standard as 670
well as modified protocols based on the QIAamp® DNA Stool Mini and QIAamp® Fast 671
DNA Stool Mini kits. The modifications included bead beading, pre-treatment of the 672
sample, and transfer of the double amount of volume after cell lysis. In the bead-beating 673
step, different bead types were examined (For details, see Materials and Methods, and 674
Table 1). The alpha diversity (Chao 1 and Shannon index) was determined at OTU-675
level, and the microbial community composition examined at family-level based on 16S 676
rRNA gene profiling. B) Selected standard and modified DNA extraction protocols were 677
.CC-BY 4.0 International licenseIt is made available under a (which was not peer-reviewed) is the author/funder, who has granted bioRxiv a license to display the preprint in perpetuity.
The copyright holder for this preprint. http://dx.doi.org/10.1101/064394doi: bioRxiv preprint first posted online Jul. 18, 2016;
31
employed to extract DNA from human feces, pig feces, and sewage and their DNA 678
concentration was displayed in a star plot. The values indicate the averages from 679
duplicate extractions. 680
681
.CC-BY 4.0 International licenseIt is made available under a (which was not peer-reviewed) is the author/funder, who has granted bioRxiv a license to display the preprint in perpetuity.
The copyright holder for this preprint. http://dx.doi.org/10.1101/064394doi: bioRxiv preprint first posted online Jul. 18, 2016;
32
SUPPLEMENTAL MATERIAL LEGENDS 682
683
Text S1. Supplemental Materials and Methods. Details regarding specimen collection 684
and handling, spiking with the strain mix, DNA isolation, DNA quantitation and quality 685
assessment, 16S rRNA gene profiling, metagenomics, differential abundance analysis, 686
and quantification of the strain mix are described. 687
688
FIG S1. Microbial community composition. The Top 10 most abundant families for 689
the human fecal (A), pig fecal (B), and hospital sewage (C) samples based on (i) 16S 690
rRNA gene profiling, (ii) metagenomics analysis that include normalization based on 691
reference genome size, and (iii) metagenomics analysis without normalization according 692
to genome size. For details regarding sequence data analysis and normalization see 693
Materials and Methods. 694
695
FIG S2. Microbial community composition based on predicted Gram-staining. 696
Gram-positive and Gram-negative affiliations were assigned at the order-level based on 697
information found in the literature. For some taxa the Gram-staining status was 698
unknown. 699
700
FIG S3. Microbial community dissimilarity. The dissimilarity between the microbiotas 701
from the human, pig, and sewage samples was examined using Principal Coordinates 702
Analysis of Bray-Curtis distances based on the 16S rRNA gene count data. For the 703
PCoA Bray-Curtis ordination analysis only samples with a minimum of 800 reads were 704
included. Additional results regarding community dissimilarity (based on Bray Curtis) 705
and similarity (based on Jaccard similarity coefficient) within and between DNA 706
extraction procedures across sample types as well as for a given sample type, are 707
available through figshare: https://dx.doi.org/10.6084/m9.figshare.3814239.708
709
FIG S4. Detection of spiked bacteria using metagenomics. The human fecal (A), and 710
pig fecal (B) samples were spiked with a strain mix composed of Salmonella enterica 711
serotype Typhimurium DT104 and Staphylococcus aureus ST398 in a CFU ratio of 1.02. 712
These two sample matrices, as well as aliquots of the strain mix (C) were extracted 713
.CC-BY 4.0 International licenseIt is made available under a (which was not peer-reviewed) is the author/funder, who has granted bioRxiv a license to display the preprint in perpetuity.
The copyright holder for this preprint. http://dx.doi.org/10.1101/064394doi: bioRxiv preprint first posted online Jul. 18, 2016;
33
using three different DNA extraction methods. The two strains were detected by 714
metagenomics analysis, and their ratios determined. For details, see Materials and 715
Methods. An asterisk indicates that the values for the particular DNA extraction of the 716
strain mix (D) are based on single measurements. All other values are based on 717
averages from duplicate or triplicate measurements. The dashed line indicates the ratio 718
of the strain mix based on CFU determinations. 719
720
FIG S5. Comparison between QIAStool and QIAFast DNA extraction methods by 721
metagenomics. Pig feces was extracted using the QIAamp® DNA Stool Mini and 722
QIAamp® Fast DNA Stool Mini kits, and analyzed using metagenomics. The alpha 723
diversity (Chao 1 and Shannon index) was determined at species-level. The microbial 724
community composition was examined at genus-level and the relative abundance of the 725
Top 10 most abundant taxa are shown here. 726
727
Table S1. Comparison of DNA extraction methods. (A) DNA concentration, purity, 728
and stability, and (B) Microbiome richness and diversity. 729
730
Table S2. Differential abundance of families. (A) Human fecal microbial community, 731
(B) Pig fecal microbial community, (C) Hospital sewage microbial community. 732
733
Table S3. Comparison of DNA extraction methods. DNA concentration, purity, and 734
stability, for different DNA isolation procedures based on the QIAamp® DNA Stool Mini 735
and QIAamp® Fast DNA Stool Mini Kits. 736
737
.CC-BY 4.0 International licenseIt is made available under a (which was not peer-reviewed) is the author/funder, who has granted bioRxiv a license to display the preprint in perpetuity.
The copyright holder for this preprint. http://dx.doi.org/10.1101/064394doi: bioRxiv preprint first posted online Jul. 18, 2016;
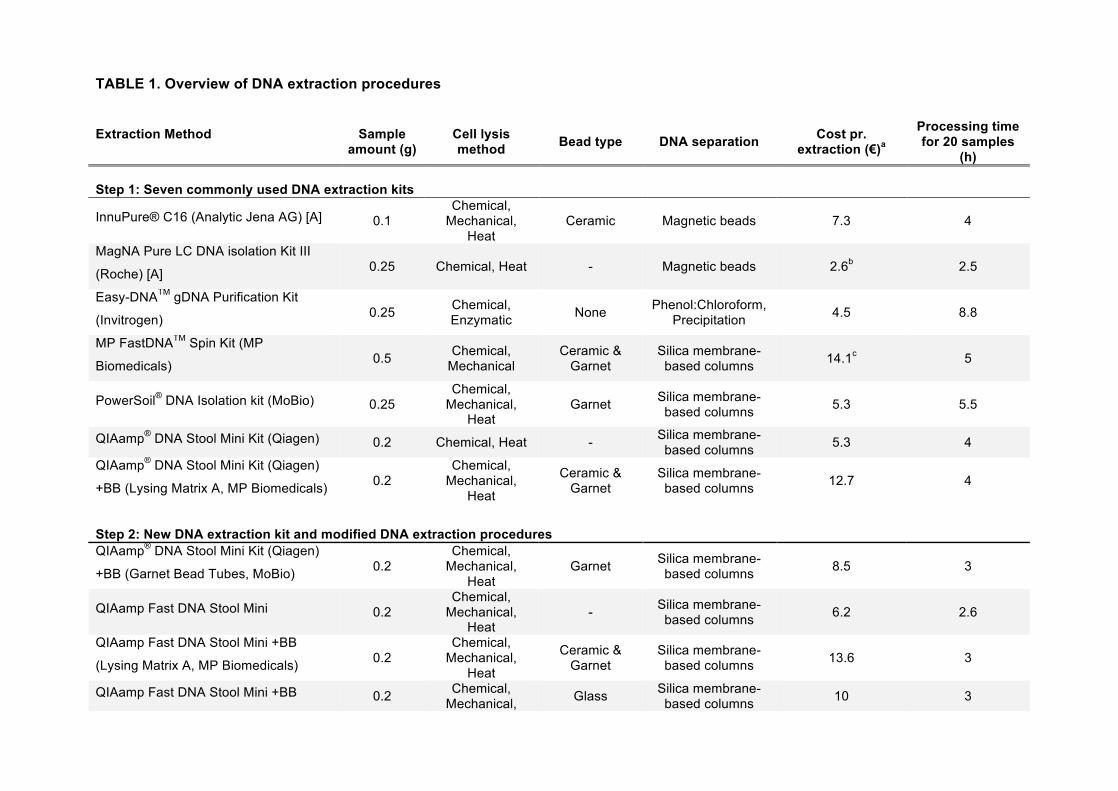
TABLE 1. Overview of DNA extraction procedures
Extraction Method
Sample amount (g)
Cell lysis method Bead type DNA separation Cost pr.
extraction (€)a
Processing time for 20 samples
(h) Step 1: Seven commonly used DNA extraction kits
InnuPure® C16 (Analytic Jena AG) [A] 0.1 Chemical,
Mechanical, Heat
Ceramic Magnetic beads 7.3 4
MagNA Pure LC DNA isolation Kit III
(Roche) [A] 0.25 Chemical, Heat - Magnetic beads 2.6b 2.5
Easy-DNATM gDNA Purification Kit
(Invitrogen) 0.25 Chemical, Enzymatic None Phenol:Chloroform,
Precipitation 4.5 8.8
MP FastDNATM Spin Kit (MP
Biomedicals) 0.5 Chemical, Mechanical
Ceramic & Garnet
Silica membrane-based columns 14.1c 5
PowerSoil® DNA Isolation kit (MoBio) 0.25 Chemical,
Mechanical, Heat
Garnet Silica membrane-based columns 5.3 5.5
QIAamp® DNA Stool Mini Kit (Qiagen) 0.2 Chemical, Heat - Silica membrane-based columns 5.3 4
QIAamp® DNA Stool Mini Kit (Qiagen)
+BB (Lysing Matrix A, MP Biomedicals) 0.2 Chemical,
Mechanical, Heat
Ceramic & Garnet
Silica membrane-based columns 12.7 4
Step 2: New DNA extraction kit and modified DNA extraction procedures QIAamp® DNA Stool Mini Kit (Qiagen)
+BB (Garnet Bead Tubes, MoBio) 0.2 Chemical,
Mechanical, Heat
Garnet Silica membrane-based columns 8.5 3
QIAamp Fast DNA Stool Mini 0.2 Chemical,
Mechanical, Heat
- Silica membrane-based columns 6.2 2.6
QIAamp Fast DNA Stool Mini +BB
(Lysing Matrix A, MP Biomedicals) 0.2 Chemical,
Mechanical, Heat
Ceramic & Garnet
Silica membrane-based columns 13.6 3
QIAamp Fast DNA Stool Mini +BB 0.2 Chemical, Mechanical, Glass Silica membrane-
based columns 10 3
.CC-BY 4.0 International licenseIt is made available under a (which was not peer-reviewed) is the author/funder, who has granted bioRxiv a license to display the preprint in perpetuity.
The copyright holder for this preprint. http://dx.doi.org/10.1101/064394doi: bioRxiv preprint first posted online Jul. 18, 2016;
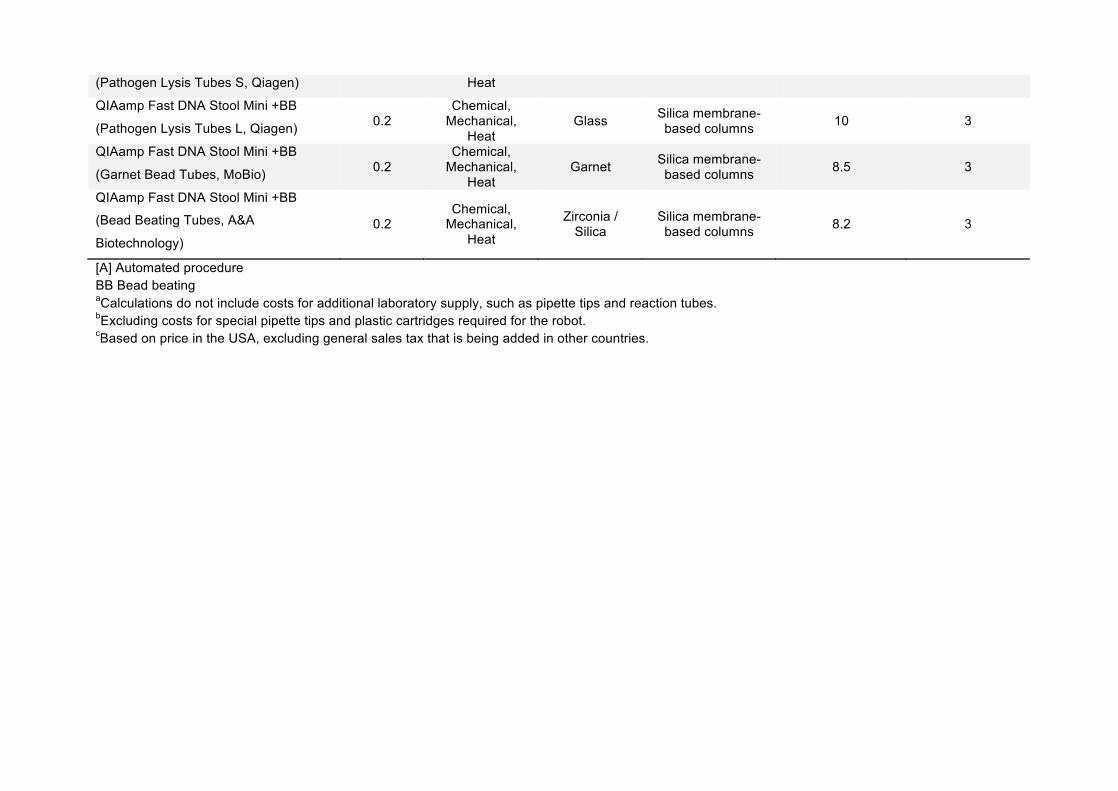
(Pathogen Lysis Tubes S, Qiagen) Heat
QIAamp Fast DNA Stool Mini +BB
(Pathogen Lysis Tubes L, Qiagen) 0.2 Chemical,
Mechanical, Heat
Glass Silica membrane-based columns 10 3
QIAamp Fast DNA Stool Mini +BB
(Garnet Bead Tubes, MoBio) 0.2 Chemical,
Mechanical, Heat
Garnet Silica membrane-based columns 8.5 3
QIAamp Fast DNA Stool Mini +BB
(Bead Beating Tubes, A&A
Biotechnology) 0.2
Chemical, Mechanical,
Heat
Zirconia / Silica
Silica membrane-based columns 8.2 3
[A] Automated procedure BB Bead beating aCalculations do not include costs for additional laboratory supply, such as pipette tips and reaction tubes. bExcluding costs for special pipette tips and plastic cartridges required for the robot. cBased on price in the USA, excluding general sales tax that is being added in other countries.
.CC-BY 4.0 International licenseIt is made available under a (which was not peer-reviewed) is the author/funder, who has granted bioRxiv a license to display the preprint in perpetuity.
The copyright holder for this preprint. http://dx.doi.org/10.1101/064394doi: bioRxiv preprint first posted online Jul. 18, 2016;

ImpactofSampleTypeandDNAIsolationProcedureonGenomicInferenceofMicrobiomeCompositionKnudsenetal.
1
SUPPLEMENTAL MATERIAL AND METHODS Specimen Collection and Handling Human fecal specimens were collected from a healthy individual at three time points over a single day. The specimens were kept at 4°C, and transported to the laboratory within 24 hours. Upon arrival, the three samples were pooled and homogenized. For this study, fecal specimens from an infant were chosen, as infant fecal samples often contain a high proportion of Actinobacteria (e.g. Bifidobacteria), from which genomic DNA can be difficult to isolate. Pig fecal specimens were collected from animals at a conventional pig production farm in Denmark. Samples from individual animals were obtained directly after defecation, stored in a cooling box, and transported to the laboratory within four hours. Upon arrival, three random samples were pooled and homogenized. Untreated sewage was collected from the sewage inlet of the Herlev hospital waste water treatment plant, Denmark. Specimens were stored in a cooling box and transported to the laboratory within two hours. Upon arrival 24 x 40 ml sewage samples were sedimented for 10 minutes at 8000xg in an Eppendorf 5810R centrifuge. The sewage pellets were pooled and homogenized. For all three types of specimen (human feces, pig feces, sewage), the homogenized samples were separated into 0.5 g aliquots, respectively. A subset of aliquots for each specimen type was spiked with two bacterial strains (see details below). The individual sample aliquots with and without strain mix were stored at -80°C until further processing. Spiking with strain mix Subsequent to specimen collection, about half of the aliquots from the human feces, pig feces, and sewage were spiked with a representative of Gram-positive and Gram-negative bacteria, namely Staphylococcus aureus ST398 (strain S0385) and Salmonella enterica serotype Typhimurium DT104. The strains were cultivated in Luria-Bertani (LB) broth at 37°C. Cells were harvested when the culture reached late exponential growth phase at OD600 ~0.9. The strain mix was prepared by mixing equal volumes of the bacterial cultures. To determine the number of cells of S. aureus ST398 and Salmonella Typhimurium DT104 in the two cultures, dilutions of these were plated on LB agar, the plates incubated overnight at 37°C, and colony forming units (CFU) determined the following day. The strain mix was added at about 5% of the volume of the aliquot, and the added cell numbers of S. aureus and S. enterica Thyphimurium were calculated based on the CFU determinations. DNA isolation In a first step, seven DNA isolation procedures were examined, namely: InnuPure® C16 (Analytic Jena AG), MagNA Pure LC DNA isolation Kit III (Roche), Easy-DNATM gDNA Purification Kit (Invitrogen), MP FastDNATM Spin Kit (MP Biomedicals), PowerSoil® DNA Isolation kit (MoBio), QIAamp® DNA Stool Mini Kit (Qiagen), QIAamp® DNA Stool Mini Kit (Qiagen) +Bead Beating (see Table 1, and details below). These methods were selected because they are
.CC-BY 4.0 International licenseIt is made available under a (which was not peer-reviewed) is the author/funder, who has granted bioRxiv a license to display the preprint in perpetuity.
The copyright holder for this preprint. http://dx.doi.org/10.1101/064394doi: bioRxiv preprint first posted online Jul. 18, 2016;
ImpactofSampleTypeandDNAIsolationProcedureonGenomicInferenceofMicrobiomeCompositionKnudsenetal.
2
widely used and represent a variety of isolation procedures involving manual or automated DNA isolation, DNA separation using filter-columns or magnetic beads, chemical or mechanical lysis, and phenol/chloroform-based or non-chloroform based isolations. Bead-beating steps were performed in a Qiagen TissueLyser II if not stated otherwise, and centrifugation steps were carried out in an Ole Dich 157.MP Microcentrifuge (Denmark). DNA isolation was performed on duplicate or triplicate aliquots, dependent on specimen availability. One to two isolation controls were included at each round of isolation. InnuPure® C16, Analytic Jena AG (InnuPURE) Automatic isolation with the InnuPURE–C16 robot using the InnuPURE Stool DNA Kit–IP–C16 according to the manufacture’s instructions. Prior to the automatic isolation, a lysis step was performed according to the protocol for lysis of bacterial DNA from stool samples using a SpeedMILL PLUS provided by the manufacturer. The cell disruption process was carried out two times for 30 sec at 50 Hz (50 s-1). The DNA was eluted in 100 ul of buffer supplied with the kit. MagNA Pure LC DNA isolation Kit III, Roche (MagNAPure) Automatic isolation with the MagNA Pure LC instrument using the DNA Isolation Kit III (Bacteria, Fungi) according to the manufacture’s instructions. The pre-isolation step for stool samples described in the protocol was performed before transferring the samples to the MagNA Pure LC. The protocol states a starting amount of a peanut-size sample, and in order to ensure consistency across isolations a starting amount of 0.25 g was chosen. The DNA was eluted in 100 ul of buffer supplied with the kit. Easy-DNATM gDNA Purification Kit, Invitrogen (EasyDNA) The DNA isolation was performed according to the manufacturer’s instructions with minor modifications. Pretreatment of the samples were performed following the protocol for small amounts of cells, tissues, or plant leaves. Initially, 0.25 g sample aliquots were resuspended in 1.5 ml 0.9% NaCl, respectively. The samples were centrifuged at 600xg for 3 minutes. The supernatant was transferred to new tubes and centrifuged at 8000xg for 10 minutes. After centrifugation, the supernatant was discarded and the pellet was resuspended in 200 µl PBS. 30 µl lysozyme (10 mg/ml) and 15 µl lysostaphin (10 mg/ml) were added and the samples were incubated at 37°C for 20 minutes shaking at 550 rpm, before adding 30 µl 10% SDS. The final pretreatment step included the addition of 15 µl proteinase K (20 mg/ml) and incubation at 37°C for 20 minutes. The final step in the isolation protocol was prolonged to an incubation for 1.5 (instead of 0.5) hours at 37°C. The DNA was eluted in 100 ul of buffer supplied with the kit. MP FastDNATM Spin Kit, MP Biomedicals (FastDNA) The DNA isolation was performed according to the manufacturer’s instructions with minor modifications. A centrifugation step at 3000xg for 2 minutes was included to ensure proper settling of the silica matrix. The protocol suggested
.CC-BY 4.0 International licenseIt is made available under a (which was not peer-reviewed) is the author/funder, who has granted bioRxiv a license to display the preprint in perpetuity.
The copyright holder for this preprint. http://dx.doi.org/10.1101/064394doi: bioRxiv preprint first posted online Jul. 18, 2016;
ImpactofSampleTypeandDNAIsolationProcedureonGenomicInferenceofMicrobiomeCompositionKnudsenetal.
3
eluting the DNA in 50-100 µl DNase/Pyrogen-Free water, and here the DNA was eluted in 100 µl. PowerSoil® DNA Isolation kit, MoBio Laboratories Inc. (PowerSoil.HMP) The DNA isolation was performed according to the protocol employed in the Human Microbiome Project (HMP Protocol # 07-001 version 12), with a minor modification to the initial protocol step. The HMP protocol states to resuspend 2 ml fecal sample in 5 ml MoBio lysis buffer. Here, we resuspended 0.5 g sample in 1.25 ml MoBio lysis buffer (i.e. same ratio). Subsequently, the samples were centrifuged according to the HMP protocol and 1 ml of supernatant transferred to a garnet bead tube containing 0.75 ml MoBio buffer. The samples were heated at 65°C for 10 minutes followed by an additional heating step at 95°C for 10 minutes. The samples were processed further according to the HMP protocol including the modification at step 12, where the centrifugation step was prolonged to 2 minutes. The DNA was eluted in 100 ul of buffer supplied with the kit. QIAamp® DNA Stool Mini Kit, Qiagen (QIAStool) The DNA isolation was performed according to the manufacturer’s protocol for isolation of DNA from stool for pathogen detection with minor modifications. In the lysis step, the samples were first heated at 70°C for 5 minutes and subsequently at 95°C for 5 minutes. The DNA was eluted in 100 µl elution buffer. QIAamp® DNA Stool Mini Kit, Qiagen +Bead Beating (QIAStool+BB) The DNA isolation was performed according to the manufacturer’s protocol for isolation of DNA from stool for pathogen detection with minor modifications that included a bead-beating step. Sample aliquots of 0.2 g were mixed with 1.4 ml ASL buffer, respectively, and added to Lysing matrix A bead beating tubes (MP Biomedicals) and were briefly homogenized. The samples were treated in a Qiagen TissueLyser II at 30 f/s (Hz) three times for 30 seconds, with placement of the samples on ice in between bead beating steps. Subsequently, the samples were heated at 95°C for 15 minutes. The remaining steps were carried out according to the manufacturer’s recommendations, and the DNA eluted in 100 ul elution buffer. In a second step, a variety of modifications to two Qiagen kits were examined, namely the QIAamp® DNA Stool Mini Kit (QIAStool), and QIAamp® Fast DNA Stool Mini Kit (QIAFast). The latter was released to the market during the course of this study. The main difference between the QIAStool and the QIAFast kits relies in the way inhibitor compounds are being removed. In the QIAStool kit, InhibitEX tablets are being dissolved in the samples that are adsorbing the inhibitors and together are removed via centrifugation. The QIAFast kit contains an InhibitEX buffer to remove inhibitor compounds, and no tablets are required. QIAamp® DNA Stool Mini Kit, Qiagen and Modifications
.CC-BY 4.0 International licenseIt is made available under a (which was not peer-reviewed) is the author/funder, who has granted bioRxiv a license to display the preprint in perpetuity.
The copyright holder for this preprint. http://dx.doi.org/10.1101/064394doi: bioRxiv preprint first posted online Jul. 18, 2016;
ImpactofSampleTypeandDNAIsolationProcedureonGenomicInferenceofMicrobiomeCompositionKnudsenetal.
4
Five different protocols based on the QIAamp® DNA Stool Mini Kit were examined. i) QIAStool: see above, ii) QIAStool+BB.LMA: QIAStool+BB procedure using Lysing matrix A tubes (see above), iii) QIAStool+BB.LMA+2Trans: QIAStool+BB procedure using Lysing matrix A tubes (see above) with modifications. To reduce the loss of sample, the double amount of supernatant was transferred to proteinase K (i.e. 400 µl instead of 200 µl). The volumes of Proteinase K, buffer AL and ethanol were doubled, respectively. Due to the increased volume, the passing of the sample through the spin columns is performed in two centrifugation steps. The DNA was washed twice before elution in 100 µl elution buffer. iv) QIAStool+PreT+BB.LMA: QIAStool+BB procedure using Lysing matrix A tubes (see above) with modifications. An increased starting sample amount was used and pre-treated. 0.5g of sample was mixed with 1.5 ml 0.9% NaCl solution. After homogenization by vortexing, the samples were centrifuged at 600 x g for 3 minutes to settle large particles. The supernatant was centrifuged at 8000 x g for 10 minutes to pellet microbial cells. The pellet was resuspended in 200 µl PBS and transferred to Lysing Matrix A bead beating tubes. v) QIAStool+PreT+BB.LMA+2Trans: QIAStool+BB procedure using Lysing matrix A tubes (see above) with modifications described in iii) and iv). QIAamp® Fast DNA Stool Mini Kit, Qiagen and Modifications Six different protocols (i–vi) based on the QIAamp® Fast DNA Stool Mini Kit were examined using five different bead types (ii–vi). i) QIAFast: The DNA isolation was performed according to the manufacturer’s protocol for isolation of DNA from stool for pathogen detection with minor modifications. In the lysis-step, the samples were first heated at 70°C for 5 minutes and subsequently at 95°C for 5 minutes. The DNA was eluted in 100 µl elution buffer for 2 minutes. ii) QIAFast+BB.LMA+2Trans: The DNA isolation was performed according to the manufacturer’s protocol for isolation of DNA from stool for pathogen detection with minor modifications that included a bead-beating step. Sample aliquots of 0.2 g were mixed with 1 ml InhibitEX buffer, respectively, and added to Lysing matrix A bead beating tubes (MP Biomedicals) and are briefly homogenized. The samples are treated in a Qiagen TissueLyser II at 30 f/s (Hz) three times for 30 seconds, with placement of the samples on ice in between bead beating steps. Subsequently, the samples are heated at 95°C for 7 minutes. Similar to the modifications described above, following the bead-beating and heating steps, the double amount of supernatant was transferred to proteinase K (i.e. 400 µl instead of 200 µl). The volumes of proteinase K, Buffer AL and ethanol were also doubled. The passing of the sample through the filter columns were subsequently carried out in two centrifugation steps rather than one, to accommodate the increased sample volume. The remaining steps were carried out according to the manufacturer’s recommendations, and the DNA eluted in 100 ul elution buffer. A laboratory protocol for this procedure can be found at https://dx.doi.org/10.6084/m9.figshare.3475406. iii) QIAFast+BB.LTS+2Trans: Same procedure as described in ii) with Pathogen Lysis Tubes S (Qiagen). iv) QIAFast+BB.LTL+2Trans: Same procedure as described in ii) with Pathogen Lysis Tubes L (Qiagen). v) QIAFast+BB.GBT+2Trans: Same procedure as
.CC-BY 4.0 International licenseIt is made available under a (which was not peer-reviewed) is the author/funder, who has granted bioRxiv a license to display the preprint in perpetuity.
The copyright holder for this preprint. http://dx.doi.org/10.1101/064394doi: bioRxiv preprint first posted online Jul. 18, 2016;
ImpactofSampleTypeandDNAIsolationProcedureonGenomicInferenceofMicrobiomeCompositionKnudsenetal.
5
described in ii) with Garnet Bead Tubes (MoBio). vi) QIAFast+BB.AAB+2Trans: Same procedure as described in ii) with A&A Bead Tubes (A&A Biotechnology, Gdynia, Poland). Together, the evaluation and improvements of DNA isolation methods were carried out in a step-wise approach. In the first step, seven DNA extraction kits were evaluated using human feces, pig feces, and hospital sewage (Figures 1–4, Supplemental Figures S1-S4, and Supplemental Tables S1+S2). The standard and modified procedures based on the QIAStool and QIAFast methods were tested using a second set of pig fecal samples (Figure 5A, and Supplemental Figure S5, and Supplemental Table S3). Upon evaluation of the different DNA isolation methods, promising procedures were selected and examined using a new set of human feces, pig feces, and hospital sewage (Figure 5B). DNA quantitation and quality assessment Subsequent to DNA isolation, the DNA was portioned into 10 µl aliquots to prevent repeated freeze-thawing cycles, and stored at -20°C. DNA concentrations were measured using Qubit® dsDNA BR Assay Kit on a Qubit® 2.0 Fluorometer (Invitrogen, Carlsbad, CA). As DNA extracts can contain contaminants, such as proteins or other organic molecules that can affect downstream procedures such as DNA amplifications in PCR, we determined the DNA purity by measuring the ratios of absorbance at 260/280 and 260/230, respectively, using a NanoDrop 1000 Spectrophotometer (Thermo Scientific, Pittsburgh, USA). DNA extracts with a 260/280 ratio between ~1.7 to ~ 2.0, and 260/230 ration between ~2.0 to ~2.2 are regarded as “pure”. The stability of the DNA in the extracts was determined by measuring the DNA concentration after 2 and 7 days incubation at 22°C. A decrease in DNA concentration over time can indicate the presence of DNases in the extract. 16S rRNA gene profiling 16S rRNA amplicon libraries were generated using a two-step protocol similar as described in Part # 15044223 Rev. B by Illumina (http://www.illumina.com/con tent/dam/illumina-support/documents/documentation/chemistry_documenta tion/16s/16s-metagenomic-library-prep-guide-15044223-b.pdf). In a first PCR, the V4 region of the 16S rRNA genes were amplified using the universal primers (515f 5’-TGCCAGCAGCCGCGGTAATAC (1) and 806r 5’-GGACTACNNGGGTATCTAAT (2). Each 20-µl PCR reaction contained 2 µl of 10 x AccuPrime PCR Buffer II (15mM MgCl2, Invitrogen), 1 µl (10 µM) of the primers, 0.12 µl AccuPrime Taq DNA polymerase (2 units/µl, Invitrogen), 1 µl template DNA and 14.88 µl ddH2O. PCR conditions: denaturation at 94°C for 2 min; 30 cycles at 94°C for 20 s, 56°C for 20 s, 68°C for 30 s; followed by 68°C for 5 min, and 3 min at 70 °C. Subsequently, the PCR products were placed on ice to prevent hybridization between PCR products and nonspecific amplicons. Samples were quantified using Quant-iT™ PicoGreen® dsDNA Assay Kit (Invitrogen, Carlsbad, CA) on a Lightcycler 96 (Roche, Mannheim, Germany) and adjusted to equal concentrations. In the second PCR the same conditions were
.CC-BY 4.0 International licenseIt is made available under a (which was not peer-reviewed) is the author/funder, who has granted bioRxiv a license to display the preprint in perpetuity.
The copyright holder for this preprint. http://dx.doi.org/10.1101/064394doi: bioRxiv preprint first posted online Jul. 18, 2016;
ImpactofSampleTypeandDNAIsolationProcedureonGenomicInferenceofMicrobiomeCompositionKnudsenetal.
6
used as in the first round, except the PCR was reduced to 15 cycles and the primers had a unique adaptor/linker/index sequence per sample (3). The PCR products were purified using Agencourt AmPure XP beads (Beckman Coulter Inc, A63881), and concentrations were measured using Quant-iT™ PicoGreen® dsDNA Assay Kit on a Lightcycler 96. The samples were pooled in equal concentrations, and concentrated using ‘DNA clean and concentrator-5 kit’ (Zymo Research, Orange, CA). Paired-end 2 × 250 bp sequencing of barcoded amplicons was performed on a MiSeq machine running v2 chemistry (Illumina Inc., San Diego, CA, USA) at University of Copenhagen, Section of Microbiology. The primer sequences were trimmed, quality filtering performed, and paired sequences assembled using the UPARSE pipeline http://drive5.com/usearch/manual/uparse_pipeline.html (4). Low quality reads were removed with a maximum expected error threshold of 0.5 (maxee). Sequences were barcoded and pooled before dereplication and removal of duplicates (-minseqlength 64). Prior to clustering of the OTUs the dereplicated reads were sorted according to abundance, and singeltons where removed (http://drive5.com/usearch/manual/upp_readprep.html). Chimera filtering was performed using UCHIME (5) with rdp_gold.fa as reference database. The reads were mapped back to OTUs, including singletons, at a 97% identity level and an OTU-table was generated using uc2otutab.py. Using QIIME1.8.0 (6), taxonomy was assigned with uclust using assign_taxonomy.py based on the Greengenes 13.8 reference database. The average number of reads per sample was 192965, and the read length was between 186-251 bp. The average number of reads in the isolation controls was 34063 and the majority of these reads were affiliated with the two strains used for spiking (Enterobacteriaceae and Staphylococcaceae), as well as dominant taxa that were present in the complex samples, such as Ruminococcaceae, Prevotellaceae, and Bacteroidales. Ecological diversity estimates and microbial community comparisons were performed using the relevant scripts provided by QIIME, phyloseq, and R (6-8). For the estimation of bacterial diversity and richness (Fig. 1C, and Fig. 5A), and principal coordinate analysis (Fig. 2A-C, and Fig. S3) the samples were rarefied to 800 reads per sample. The abundance of Gram-positive and Gram-negative bacteria was predicted at order levels based on information from the literature. For some bacteria (mainly Firmicutes), the Gram status could not be assigned at this level, and for those the family level was used instead. Metagenomics A subset of thirty-nine DNA extracts was subjected to metagenomic sequencing. The samples were prepared and sequenced following the Nextera XT DNA Library Preparation Guide for the MiSeq system, Part # 15031942 Rev. D (http://support.illumina.com/content/dam/illumina-support/documents/documen tation/chemistry_documentation/samplepreps_nextera/nextera-xt/nextera-xt-library-prep-guide-15031942-01.pdf), using paired-end v2 2×250bp sequencing. The taxonomic microbiome compositions were determined through the use of the MGmapper pipeline (9). The MGmapper package is available for download at
.CC-BY 4.0 International licenseIt is made available under a (which was not peer-reviewed) is the author/funder, who has granted bioRxiv a license to display the preprint in perpetuity.
The copyright holder for this preprint. http://dx.doi.org/10.1101/064394doi: bioRxiv preprint first posted online Jul. 18, 2016;
ImpactofSampleTypeandDNAIsolationProcedureonGenomicInferenceofMicrobiomeCompositionKnudsenetal.
7
www.cbs.dtu.dk/public/MGmapper/. The analysis consisted of three main steps: i) Pre-processing and quality trimming of raw reads, ii) Mapping of reads to reference sequence databases, and iii) Analysis of read count data. In the first step, cutadapt (10) was employed for adapter sequence removal, trimming of low-quality bases from the ends of the reads (-q 30), and removal of reads that were shorter than 30 bp. In a second step, the remaining paired-end reads were mapped in chain-mode to four databases: 1. complete bacterial genomes, 2. draft bacterial genomes, 3. MetaHit Assembly (http://www.sanger.ac.uk/ resources/downloads/bacteria/metahit/, July 2014), and 4. Human Microbiome assemby (http://www.hmpdacc.org/resources/data_browser.php, July 2014) using the BWA-MEM algorithm (http://bio-bwa.sourceforge.net). For the analysis in the present study only the reads mapping to the two primary bacterial databases (complete and draft bacterial genomes) were considered. These two databases were composed of 2685 complete and 22224 draft bacterial and archaeal genomes obtained from Genbank on July 2014 and December 2014, respectively. The order by which the databases are specified in chain-mode is important, as reads that exhibit a significant hit to the previous reference database are removed before mapping to the next database. Samtools (10) was used to remove singletons and all reads that did not map as pairs. An alignment of a read pair with a region in a genome was considered a hit only if the sum of the alignment scores (SAS) was higher than any SAS values from other hits in the database. In the third step, the alignments were filtered based on the Fraction of Matches+Mismatches (FMM) threshold, i.e. the fraction of a read that should align. Here, the default FMM threshold of 80% was used. From 96 155 142 raw read pairs, 7 567 574 read pairs mapped genomes in the two reference databases. The final read count table was composed of 9436 bacterial and archaeal reference strains with an average of 69952 mapped read pairs per sample. For each sample, the read counts were normalized according to the genome length of the respective genomes in the database, and for sequencing depth using total sum scaling. Differential abundance analysis In order to test for the differential abundance of taxa that may drive the differences observed between the communities derived from the different DNA isolation procedures, we performed DESeq2 analyses. The (unnormalized) read count tables from the 16S rRNA gene profiling and metagenomics sequence analysis, respectively, were aggregated to the family level in R (v. 3.2.3, 64bit) (8). We performed an analysis that allows for varied sequencing depth, similar as suggested previously (12), and carried out two-sided Wald tests as implemented in the DESeq2 package (v. 1.10.1) (13). The size factors were determined by DESeq2 from the read count tables. An example for such an analysis is available from https://dx.doi.org/10.6084/m9.figshare.3811251 (available as .Rmd, .html, and .pdf). When testing the effect of added strain mix, we included the samples to which the strain mix was added as well as the corresponding samples to which no strain mix was added and accounted for DNA isolation method and sample
.CC-BY 4.0 International licenseIt is made available under a (which was not peer-reviewed) is the author/funder, who has granted bioRxiv a license to display the preprint in perpetuity.
The copyright holder for this preprint. http://dx.doi.org/10.1101/064394doi: bioRxiv preprint first posted online Jul. 18, 2016;

ImpactofSampleTypeandDNAIsolationProcedureonGenomicInferenceofMicrobiomeCompositionKnudsenetal.
8
matrix type. When testing the effects of the DNA isolation method, we analyzed the data from the three types of fecal specimen separately and extracted results from all two-wise comparisons of DNA isolation methods. For each DESeq2 test, p-values were adjusted for the false-discovery rate (FDR) using the Benjamini-Hochberg procedure (14). As recommended by DESeq2, comparisons with an FDR below 0.1 were considered significant. For the visualization of the data, the read count data were variance-stabilized using the DESeq2 regularized log (rlog) transformation. This transformation also accounts for sequencing depth differences, allowing inter-sample comparisons of taxa. Quantification of strain mix The samples that were spiked with the strain mix composed of S. enterica Typhimurium DT104 and S. aureus ST398 were extracted, sequenced, and analyzed together with the non-spiked samples. For each type of specimen and isolation method, the relative abundance of Enterobacteriaceae and Staphylococcaceae for 16S rRNA gene profiling and metagenomics, respectively, were determined. Our differential abundance analysis using DESeq2 confirmed, that these two strains were present in significantly higher abundance in the spiked samples than in the not spiked samples for 16S rRNA gene profiling: Enterobacteriaceae adjusted P-value 3.08-30 and Staphylococcaceae adjusted P-value 2.13-10; and for metagenomics: Enterobacteriaceae adjusted P-value 1.74-77 and Staphylococcaceae adjusted P-value 1.07-4. The average relative abundance values from the samples without added strain mix were subtracted from the corresponding samples to which the strain mix was added. Subsequently, the 16S rRNA gene copy numbers of the two added strains were taken into account with 5 for S. aureus and 7 for S. enterica (for 16S rRNA gene profiling). The ratios between Enterobacteriaceae and Staphylococcaceae were determined for each sample matrix and isolation method, and compared to the S. enterica Typhimurium DT104 / S. aureus ST398 ratio of CFU that were added to the original samples.
.CC-BY 4.0 International licenseIt is made available under a (which was not peer-reviewed) is the author/funder, who has granted bioRxiv a license to display the preprint in perpetuity.
The copyright holder for this preprint. http://dx.doi.org/10.1101/064394doi: bioRxiv preprint first posted online Jul. 18, 2016;
ImpactofSampleTypeandDNAIsolationProcedureonGenomicInferenceofMicrobiomeCompositionKnudsenetal.
9
Supplemental References 1. Yu Y, Lee C, Kim J, Hwang S. 2005. Group-specific primer and probe sets to
detect methanogenic communities using quantitative real-time polymerase chain reaction. Biotechnol Bioeng 89:670–679.
2. Sundberg C, Al-Soud WA, Larsson M, Alm E, Yekta SS, Svensson BH, Sørensen SJ, Karlsson A. 2013. 454 pyrosequencing analyses of bacterial and archaeal richness in 21 full-scale biogas digesters. FEMS Microbiology Ecology 85:612–626.
3. Riber L, Poulsen PHB, Al-Soud WA, Skov Hansen LB, Bergmark L, Brejnrod A, Norman A, Hansen LH, Magid J, Sørensen SJ. 2014. Exploring the immediate and long-term impact on bacterial communities in soil amended with animal and urban organic waste fertilizers using pyrosequencing and screening for horizontal transfer of antibiotic resistance. FEMS Microbiology Ecology 90:206–224.
4. Edgar RC. 2013. UPARSE: highly accurate OTU sequences from microbial amplicon reads. Nature Methods 10:996–998.
5. Edgar RC, Haas BJ, Clemente JC, Quince C, Knight R. 2011. UCHIME improves sensitivity and speed of chimera detection. Bioinformatics 27:2194–2200.
6. Caporaso JG, Kuczynski J, Stombaugh J, Bittinger K, Bushman FD, Costello EK, Fierer N, Peña AG, Goodrich JK, Gordon JI, Huttley GA, Kelley ST, Knights D, Koenig JE, Ley RE, Lozupone CA, McDonald D, Muegge BD, Pirrung M, Reeder J, Sevinsky JR, Turnbaugh PJ, Walters WA, Widmann J, Yatsunenko T, Zaneveld J, Knight R. 2010. QIIME allows analysis of high-throughput community sequencing data. Nature Methods 7:335–336.
7. McMurdie PJ, Holmes S. 2013. phyloseq: An R Package for Reproducible Interactive Analysis and Graphics of Microbiome Census Data. PLoS ONE 8:e61217.
8. R Development Core Team. 2014. R: A Language and Environment for Statistical Computing. R Foundation for Statistical Computing, Vienna, Austria.
9. Petersen TN, Bælum J, Lukjancenko O, Geertz-Hansen HM, Thomsen MCF, Sperotto MM, Lund O, Aarestrup FM, Sicheritz-Ponten T. 2015. MGmapper: an automated pipeline for mapping and stratification of metagenomics sequence data. Submitted.
10. Martin M. 2011. Cutadapt removes adapter sequences from high-throughput sequencing reads. EMBnetjournal 17:10–12.
11. Li H, Handsaker B, Wysoker A, Fennell T, Ruan J, Homer N, Marth G, Abecasis G, Durbin R, 1000 Genome Project Data Processing Subgroup. 2009. The Sequence Alignment/Map format and SAMtools. Bioinformatics
.CC-BY 4.0 International licenseIt is made available under a (which was not peer-reviewed) is the author/funder, who has granted bioRxiv a license to display the preprint in perpetuity.
The copyright holder for this preprint. http://dx.doi.org/10.1101/064394doi: bioRxiv preprint first posted online Jul. 18, 2016;
ImpactofSampleTypeandDNAIsolationProcedureonGenomicInferenceofMicrobiomeCompositionKnudsenetal.
10
25:2078–2079.
12. McMurdie PJ, Holmes S. 2014. Waste Not, Want Not: Why Rarefying Microbiome Data Is Inadmissible. PLOS Computational Biology 10:e1003531.
13. Love MI, Huber W, Anders S. 2014. Moderated estimation of fold change and dispersion for RNA-seq data with DESeq2. Genome Biology 15:31.
14. Benjamini Y, Hochberg Y. 1995. Controlling the False Discovery Rate: a Practical and Powerful Approach to Multiple Testing. Journal of the Royal Statistical Society Series B (Methodological) 57:289–300.
.CC-BY 4.0 International licenseIt is made available under a (which was not peer-reviewed) is the author/funder, who has granted bioRxiv a license to display the preprint in perpetuity.
The copyright holder for this preprint. http://dx.doi.org/10.1101/064394doi: bioRxiv preprint first posted online Jul. 18, 2016;