Embed Size (px)
Citation preview

Impact of relative demand for ecosystem
services on their stacking markets
Presenter: Marzieh Motallebi, Ph.D.
Clemson University
12/08/2016
1
Motallebi, M., Tasdighi, A., Hoag, D., and Arabi, M.

2
In the United States, 60 percent of assessed lakes, reservoirs, and
ponds are threatened or impaired by nutrients (Selman, et al. 2009).
Jordan Lake Watershed, North Carolina

Water Quality Trading Program (WQT)
Best Management Practices Waste Water Treatment Plants

• Design an ecosystem services stacking for Jordan Lake Watershed.
• Investigate the role of relative ecosystem services demand on
stacking condition.
5

Credit stacking1-Horizontal credit stacking
2-Vertical credit stacking
3-Temporal credit stacking
6Reference: EPRI, 2014
Horizontal Vertical

Vertical Stacking
7
Total Nitrogen (TN) reduction (TNR)
Farmers
are credit
sellers
Installing
buffer zones
Total Phosphorus (TP) reduction (TPR)
Vertical stacking
A farmer can maximize his/her profit (π) by selling crops, TN credits, and TP credits.
For simplicity, TNR and TPR are referred to as ecosystem services here because total
nitrogen (TN) and total phosphorus (TP) reductions improve ecosystem services that
better human wellbeing.

EPRI (2011) survey showed 83% of the respondents agreed
that the best definition for stacking is vertical stacking.
Vertical Stacking is challenging
because of double dipping
(Fox et al., 2011).
Double Dipping: “additional payments
do not result in additionality” (White and Penelope, 2013;
Robertson et al., 2013; Ott 2010;
Cooley & Olander 2011).
8
• Electric Power Research Institute (EPRI, 2011) survey showed 70% of the respondents believed that stacking increases the financial value of the conservation projects.

Double-dipping
9
Double-dipping occurred in North Carolina.
Wetland and stream ecosystem services were first defined and
sold as wetland credits and then a decade later, again in a separate
market as water-quality improvement credits, despite a lack of
additional improvements in the meantime (Program Evaluation
Division, 2009; Kane, 2009).

Methodology
10
Credit Stacking in Jordan Lake, NC
11
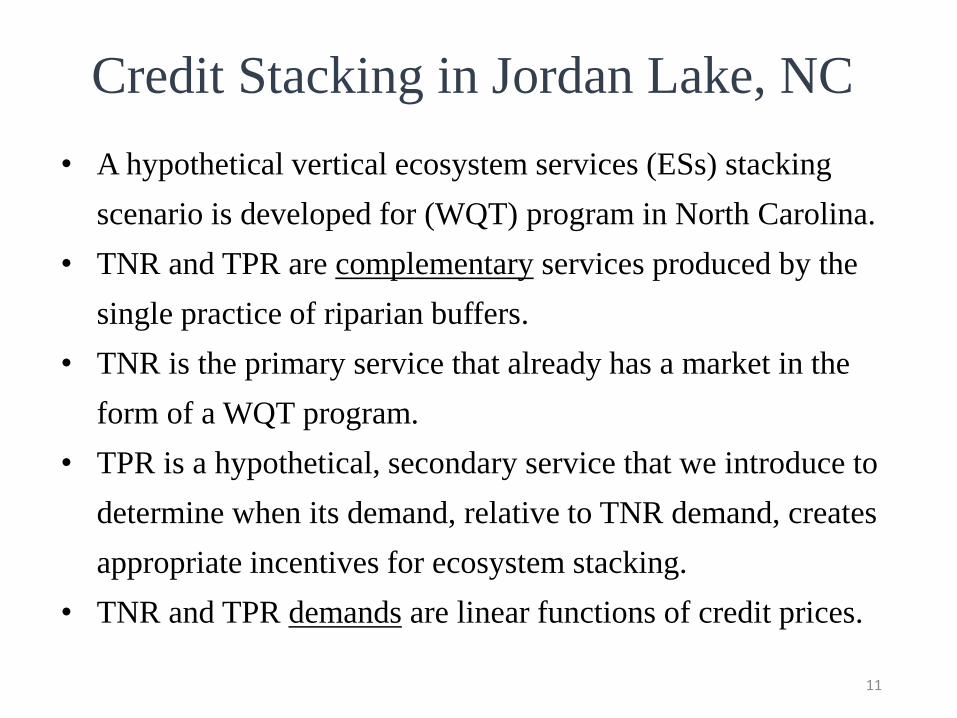
• A hypothetical vertical ecosystem services (ESs) stacking
scenario is developed for (WQT) program in North Carolina.
• TNR and TPR are complementary services produced by the
single practice of riparian buffers.
• TNR is the primary service that already has a market in the
form of a WQT program.
• TPR is a hypothetical, secondary service that we introduce to
determine when its demand, relative to TNR demand, creates
appropriate incentives for ecosystem stacking.
• TNR and TPR demands are linear functions of credit prices.

TN (8% reduction)
Installing buffer
zones (50 feet)
TP (5% reduction)
Double-dipping
12Double-dipping
complementary
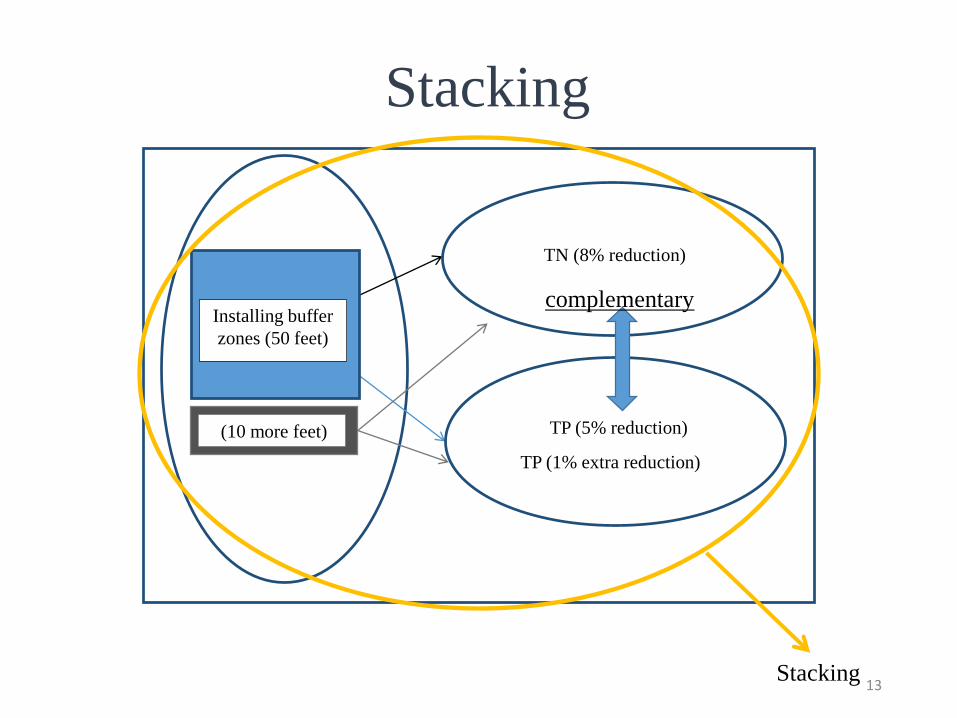
TN (8% reduction)
Installing buffer
zones (50 feet)
TP (5% reduction)(10 more feet)
TP (1% extra reduction)
Stacking
13Stacking
complementary

14
Credit Supply Credit Demand
Cost from
NRCS,
2014
Cost from
economics of
structural
stormwater
BMPs report for
NC (Wossink
and Hunt, 2003)
Load
from SWAT
model
Load from
Jordan Lake’s
Nutrient Loading
Accounting Tool
(NCDENR,
2007)
Model
Jordan Lake WQT Program Model

Sufficient
15
Q (amount of BMP adoption) QMR (TPR)QT
P2
DTPRMRTPR
MRTNR
DTNR
MRT
MC
P
QD (TPR) QD (TNR)QMR (TNR)
P1
E
Stacking can be an incentive for farmers to
adopt BMPs.
MRT= MRTNR+MRTPR
MR: Marginal revenue
MC: Marginal cost
E*

Double Dipping
16
Farmers are paid more but
do not change their BMP
adoption.
Q (amount of BMP adoption) QMR (TPR) QT
P2
DTPR
MRTPR
MRTNR
DN
MRTMC
P
QD (TPR) QD (TNR)QMR (TNR)
P1
Let’s change the slope and intercept of TPR
MR: Marginal revenue
MC: Marginal cost
E*

Insufficient
17
Q (amount of BMP adoption) QMR (TPR) QT
P2
DTPR
MRTPR
MRTNR
D(TNR)
MRT
MC
P
QD(TPR) QD (TNR)QMR (TNR)
The willingness to pay for the
secondary ecosystem service is not
enough to offer any additional
incentive for credit producers to
adopt more BMPs.
Let’s change the slope and intercept of TPR
MR: Marginal revenue
MC: Marginal cost
E*
18
Results

Role of relative demand intercept for two ESs
0
100
200
300
400
500
600
0
500,000
1,000,000
1,500,000
2,000,000
2,500,000
0 0.2 0.4 0.6 0.8 1 1.2
TN
red
uci
ton (
lbs)
Net
ret
urn
($
)
TPR to TNR demand intercept ratio
Net return (S)
TN reduction (lbs)
Double
dipping Functioning
Insufficient
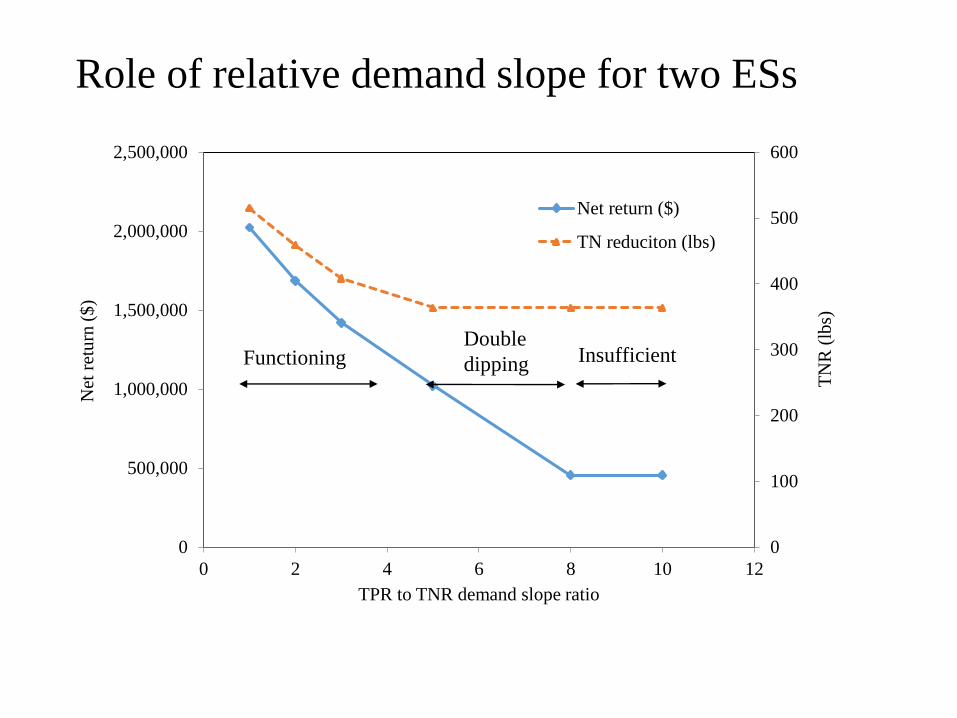
Role of relative demand slope for two ESs
0
100
200
300
400
500
600
0
500,000
1,000,000
1,500,000
2,000,000
2,500,000
0 2 4 6 8 10 12
TN
R (
lbs)
Net
ret
urn
($
)
TPR to TNR demand slope ratio
Net return ($)
TN reduciton (lbs)
FunctioningDouble
dipping Insufficient

Conclusion
• Ecosystem services credit stacking is a motivating tool, because
stacking diversifies the sources of revenues and decreases the
risk of cooperating with a program (Olander, 2011).
• We were able to apply a realistic and measurable stacking
program to the emerging WQT program in Jordan Lake
watershed, NC.
• Based on the analysis, relative services’ demands plays
profound role on ecosystem service stacking strategies.

Acknowledgments
USEPA grant RD835570 and USDA National Institute of Food and Agriculture Integrated Water Quality Grant award # 2011-05151.

Email: [email protected]