Embed Size (px)
DESCRIPTION
Impact of ISORROPIA II on air quality model predictions. Prakash Bhave, Golam Sarwar, Havala Pye, George Pouliot, Heather Simon, Jeffrey Young, Chris Nolte, Ken Schere, Rohit Mathur U.S. Environmental Protection Agency CMAS Conference Chapel Hill, NC October 24 – 26, 2011. - PowerPoint PPT Presentation
Citation preview
U.S. EPA Office of Research & Development October 25, 2011
Prakash Bhave, Golam Sarwar, Havala Pye, George Pouliot, Heather Simon, Jeffrey Young,
Chris Nolte, Ken Schere, Rohit Mathur
U.S. Environmental Protection Agency
CMAS ConferenceChapel Hill, NC
October 24 – 26, 2011
Impact of ISORROPIA II on air quality model predictions
Acknowledgements: S. Napelenok, K. Fahey, S. Howard, S. Roselle, S. Capps
U.S. EPA Office of Research & Development, Atmospheric Modeling & Analysis Division
2
Overview1.What is ISORROPIA?
2.Motivation for ISORROPIA II
3. Implementation in CMAQ v5.0β
• model results interspersed throughout
4.Summary & Future Work
U.S. EPA Office of Research & Development, Atmospheric Modeling & Analysis Division
What is ISORROPIA?• Inorganic, gas/particle, thermodynamic, equilibrium module
embedded in numerous air quality models (e.g., CMAQ,
GEOS-Chem, CAMx, CHIMERE)
–Computationally efficient
–Consumes <10% of CMAQ model run time
–Fun facts:
• Developed by Thanos Nenes for his Masters thesis!
• ISORROPIA means equilibrium in Greek
• In CMAQ, subroutine is purposely misspelled ISOROPIA
U.S. EPA Office of Research & Development, Atmospheric Modeling & Analysis Division
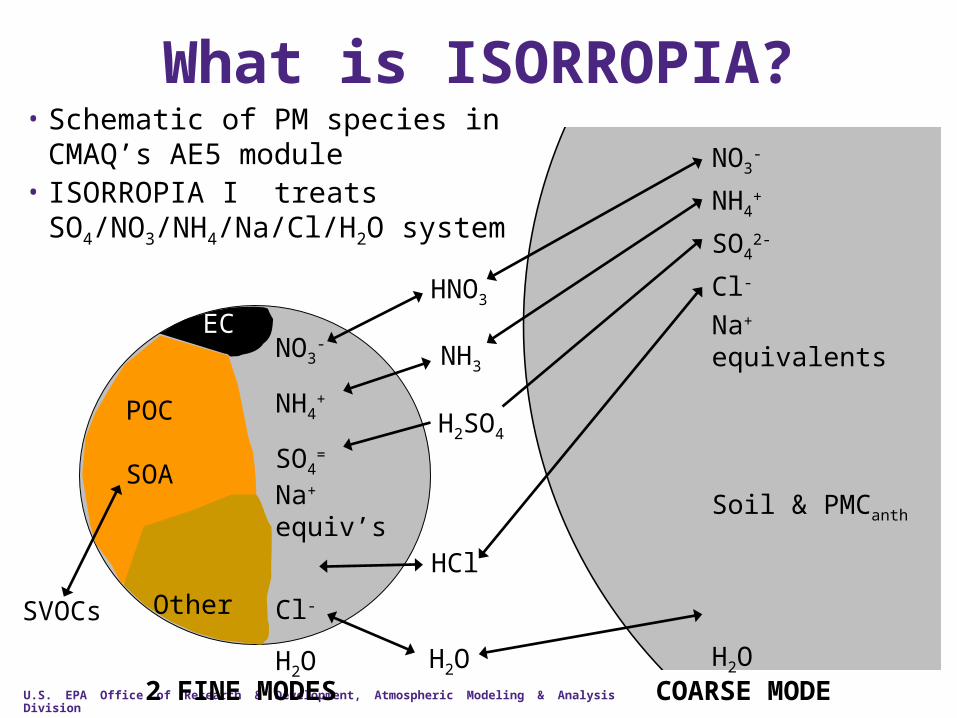
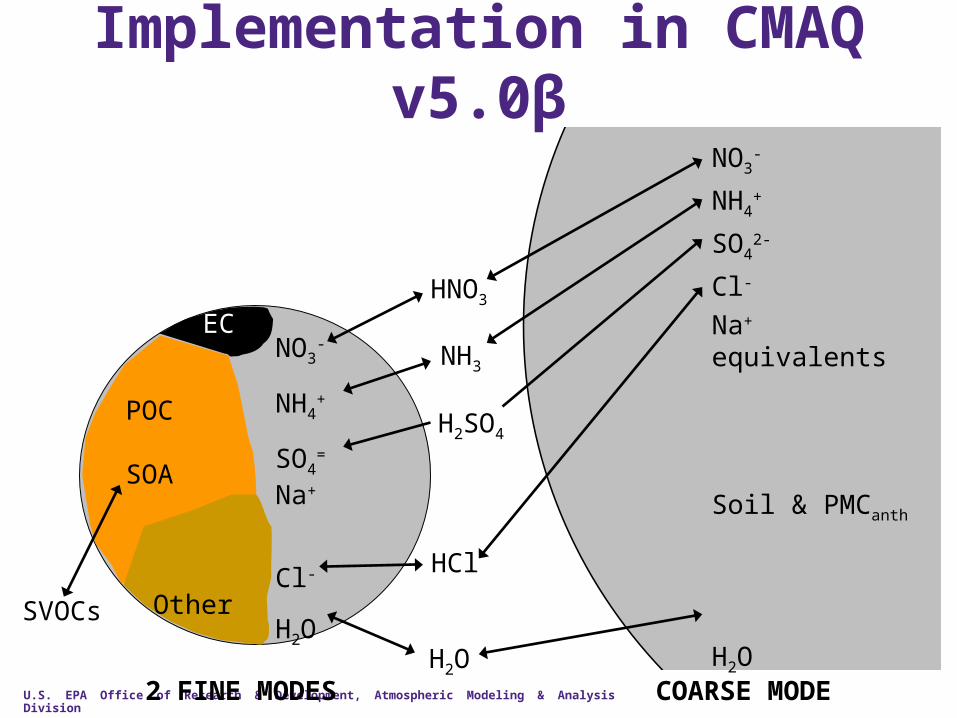
What is ISORROPIA?• Schematic of PM species in
CMAQ’s AE5 module• ISORROPIA I treats
SO4/NO3/NH4/Na/Cl/H2O system
NO3-
NH4+
SO4=
Na+ equiv’s
Cl-
H2O
POC
SOA
EC
Other
HNO3
NH3
H2O
SVOCs
NO3-
NH4+
SO42-
Cl-
Na+ equivalents
Soil & PMCanth
H2O
COARSE MODE2 FINE MODES
H2SO4
HCl
U.S. EPA Office of Research & Development, Atmospheric Modeling & Analysis Division
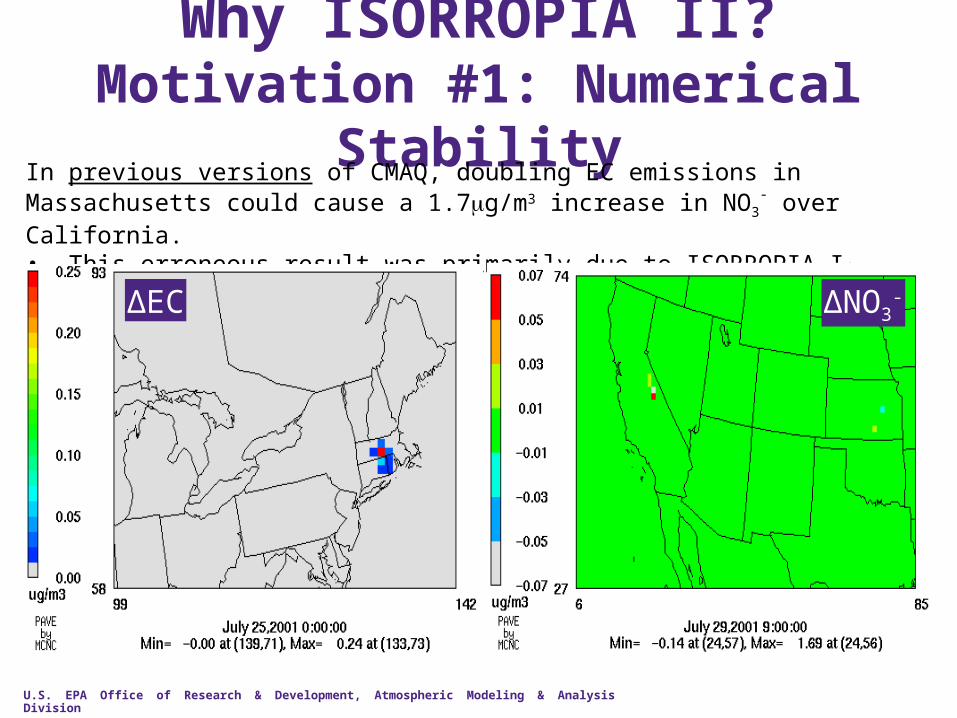
Why ISORROPIA II?Motivation #1: Numerical Stability
In previous versions of CMAQ, doubling EC emissions in Massachusetts could cause a 1.7g/m3 increase in NO3
- over California. • This erroneous result was primarily due to ISORROPIA I
ΔEC ΔNO3-
U.S. EPA Office of Research & Development, Atmospheric Modeling & Analysis Division
Mas
s co
nce
ntr
atio
n d
M/d
lnD
p(μ
g/m
3)
Aerodynamic diameter (μm)
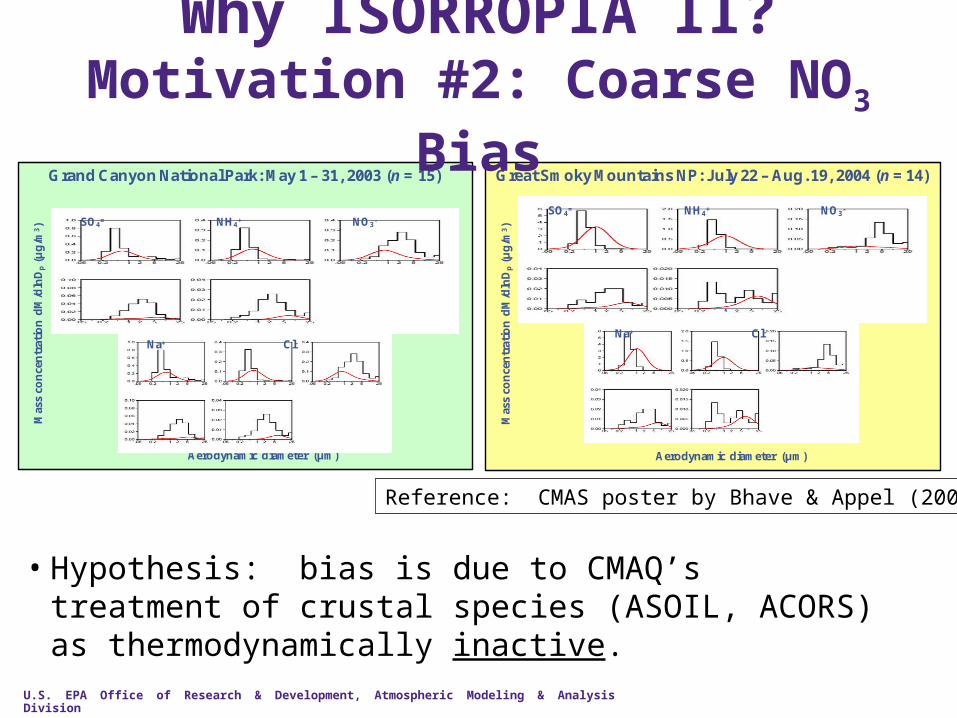
Grand Canyon National Park: May 1 – 31, 2003 (n = 15)
SO4= NH4
+ NO3-
Na+ Cl-
Mas
s co
nce
ntr
atio
n d
M/d
lnD
p(μ
g/m
3)
Aerodynamic diameter (μm)
Great Smoky Mountains NP: July 22 – Aug. 19, 2004 (n = 14)
SO4= NH4
+ NO3-
Na+ Cl-
• Hypothesis: bias is due to CMAQ’s treatment of crustal species (ASOIL, ACORS) as thermodynamically inactive.
Reference: CMAS poster by Bhave & Appel (2009)
Why ISORROPIA II?Motivation #2: Coarse NO3 Bias

U.S. EPA Office of Research & Development, Atmospheric Modeling & Analysis Division
Why ISORROPIA II?• Optimized activity coefficient calculations
– to minimize model runtime and improve numerical stability
• Treats thermodynamics of crustal materials
–Mg2+, K+, Ca2+
–MgSO4, Mg(NO3)2, MgCl2, K2SO4, KHSO4, KNO3, KCl, CaSO4, Ca(NO3)2,
CaCl2
• Peer-reviewed literature: Fountoukis & Nenes (ACP, 2007)
• ISORROPIA versions released in CMAQCMAQ v4.5 v4.6 v5.0ISORROPIA v1.5 v1.7 v2.1
U.S. EPA Office of Research & Development, Atmospheric Modeling & Analysis Division
Implementation in CMAQ v5.0β
NO3-
NH4+
SO4=
Na+
Cl-
H2O
POC
SOA
EC
Other
HNO3
NH3
H2O
SVOCs
NO3-
NH4+
SO42-
Cl-
Na+ equivalents
Soil & PMCanth
H2O
COARSE MODE2 FINE MODES
H2SO4
HCl
U.S. EPA Office of Research & Development, Atmospheric Modeling & Analysis Division
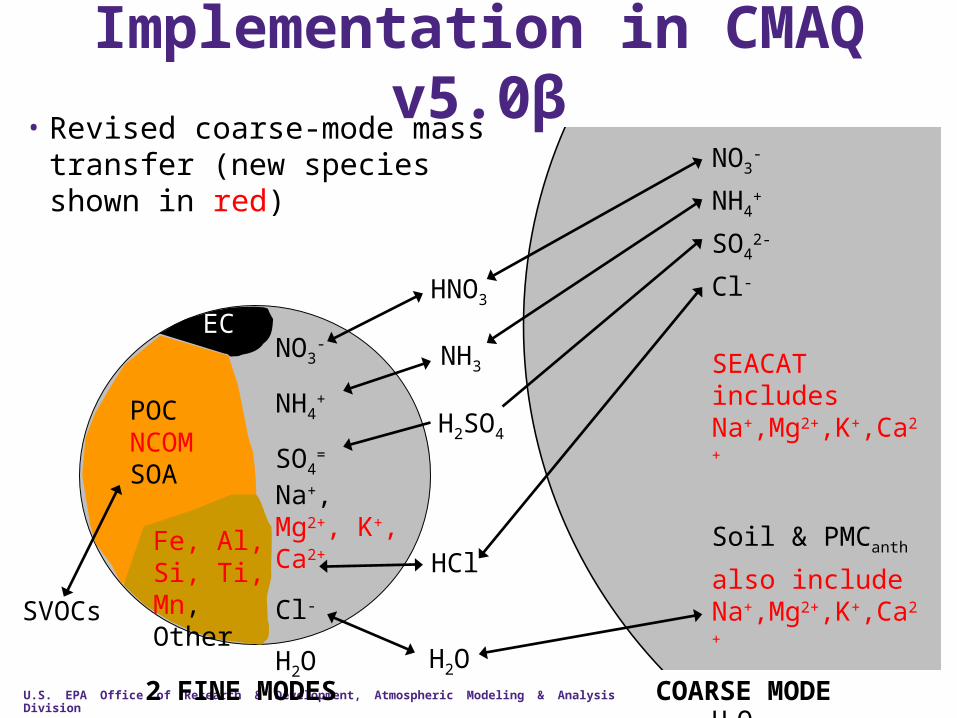
Implementation in CMAQ v5.0β• Revised coarse-mode mass
transfer (new species shown in red)
NO3-
NH4+
SO4=
Na+, Mg2+, K+, Ca2+
Cl-
H2O
POCNCOMSOA
EC
Fe, Al, Si, Ti, Mn, Other
HNO3
NH3
H2O
SVOCs
NO3-
NH4+
SO42-
Cl-
SEACAT includes Na+,Mg2+,K+,Ca2+
Soil & PMCanth
also include Na+,Mg2+,K+,Ca2+
H2O
COARSE MODE2 FINE MODES
H2SO4
HCl
U.S. EPA Office of Research & Development, Atmospheric Modeling & Analysis Division
10
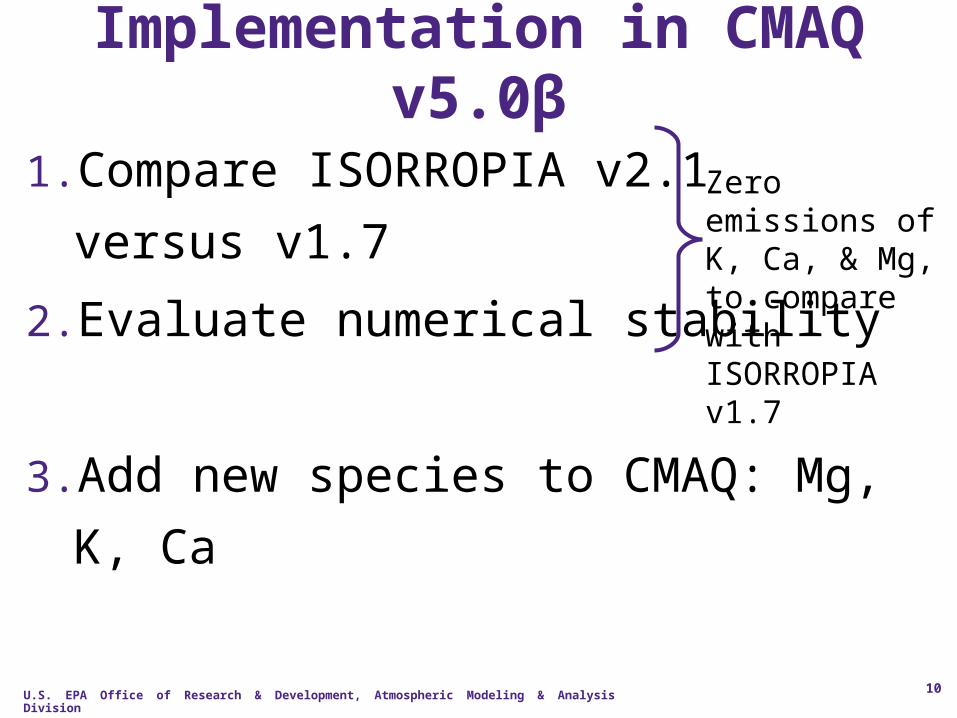
Implementation in CMAQ v5.0β
1. Compare ISORROPIA v2.1
versus v1.7
2. Evaluate numerical stability
3. Add new species to CMAQ: Mg, K, Ca
Zero emissions of K, Ca, & Mg, to compare with ISORROPIA v1.7
U.S. EPA Office of Research & Development, Atmospheric Modeling & Analysis Division
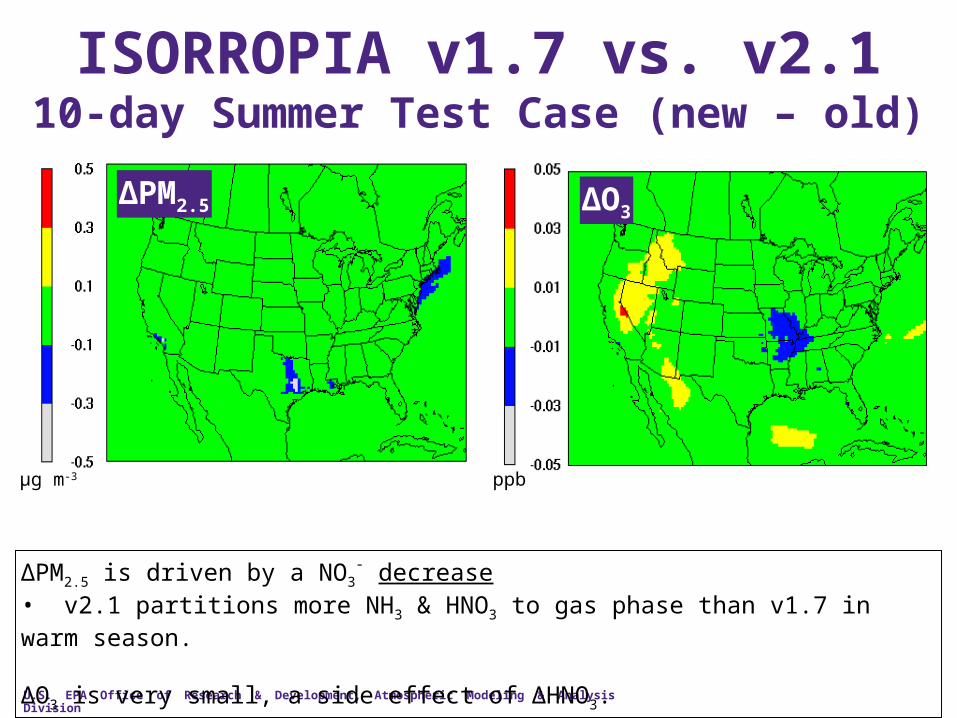
ISORROPIA v1.7 vs. v2.110-day Summer Test Case (new – old)
ΔPM2.5
µg m-3 ppb
ΔO3
ΔPM2.5 is driven by a NO3- decrease
• v2.1 partitions more NH3 & HNO3 to gas phase than v1.7 in warm season.
ΔO3 is very small, a side effect of ΔHNO3.
U.S. EPA Office of Research & Development, Atmospheric Modeling & Analysis Division
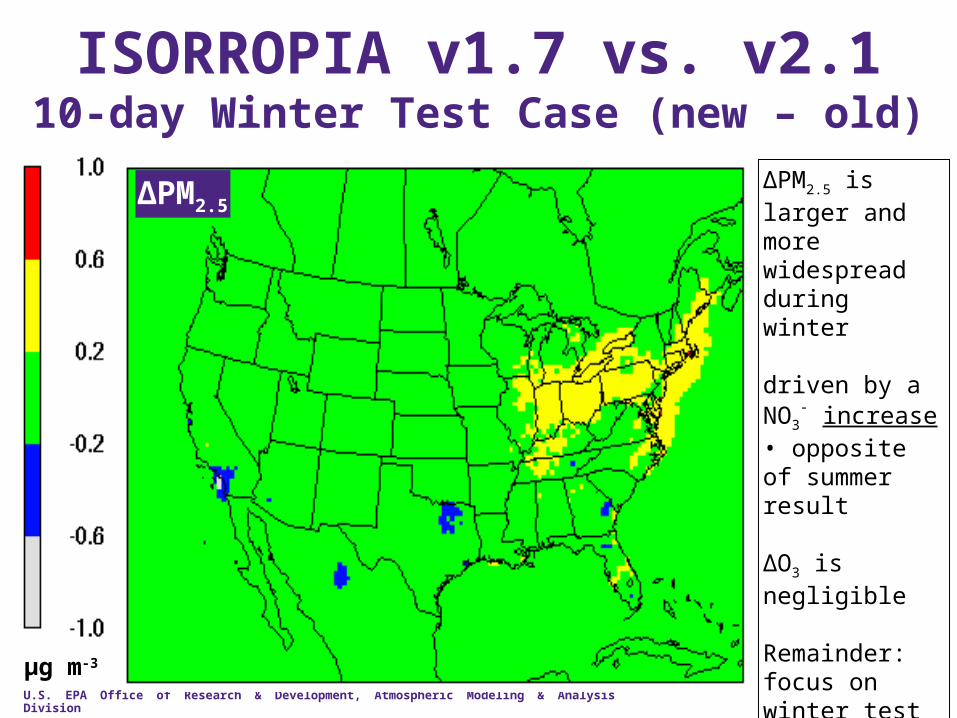
ISORROPIA v1.7 vs. v2.110-day Winter Test Case (new – old)
ΔPM2.5
µg m-3
ΔPM2.5 is larger and more widespread during winter
driven by a NO3-
increase• opposite of summer result
ΔO3 is negligible
Remainder: focus on winter test period
U.S. EPA Office of Research & Development, Atmospheric Modeling & Analysis Division
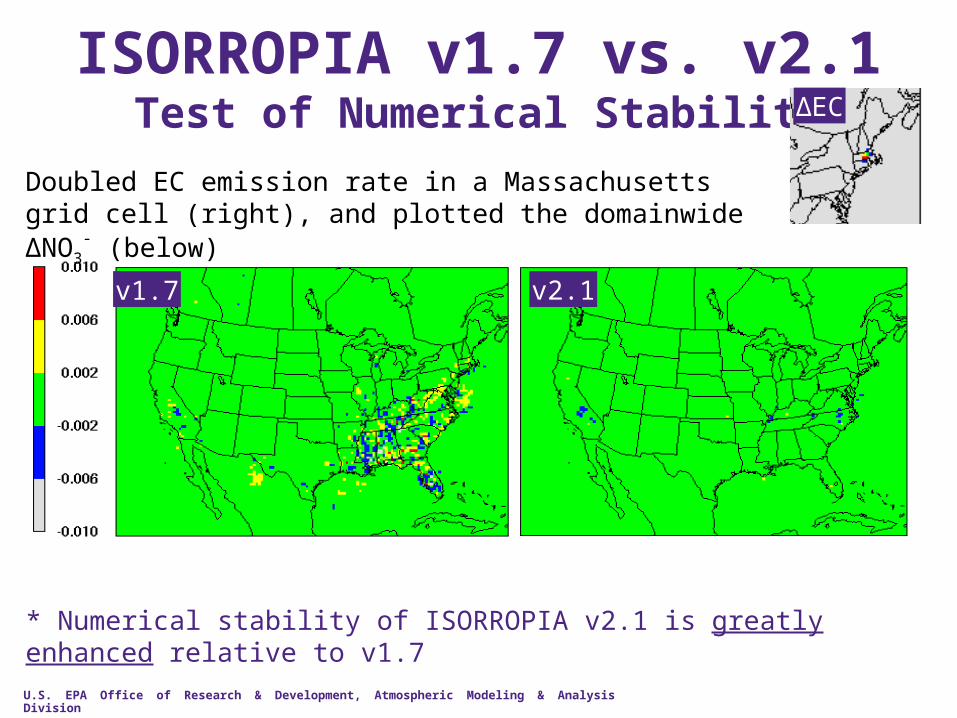
ISORROPIA v1.7 vs. v2.1Test of Numerical Stability ΔEC
v1.7
Doubled EC emission rate in a Massachusetts grid cell (right), and plotted the domainwide ΔNO3
- (below)
v2.1
* Numerical stability of ISORROPIA v2.1 is greatly enhanced relative to v1.7
U.S. EPA Office of Research & Development, Atmospheric Modeling & Analysis Division
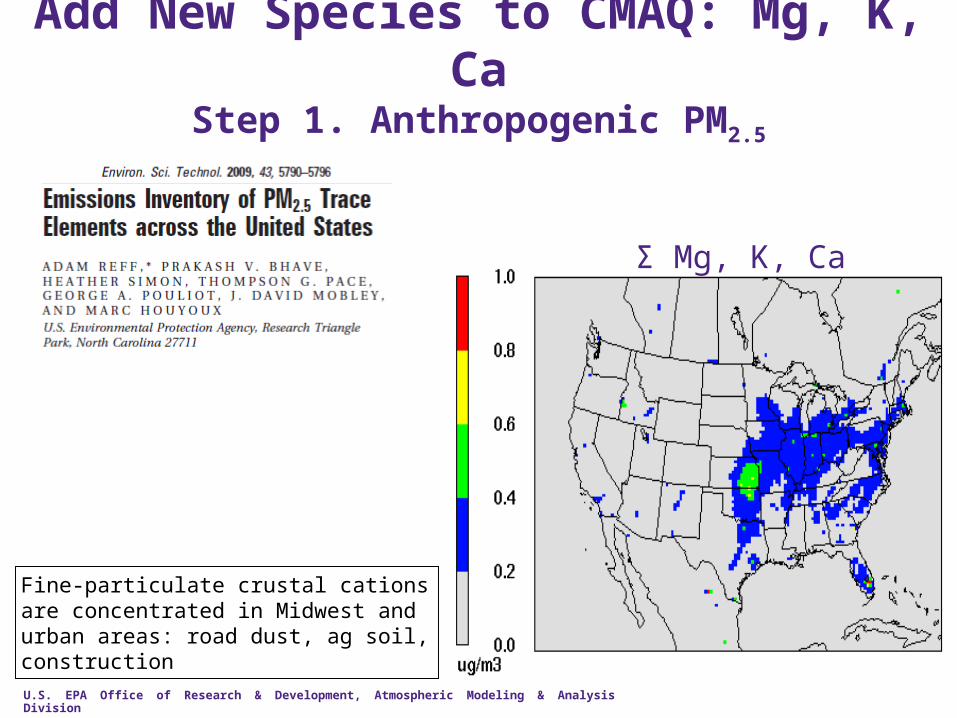
Add New Species to CMAQ: Mg, K, CaStep 1. Anthropogenic PM2.5
Σ Mg, K, Ca
Fine-particulate crustal cations are concentrated in Midwest and urban areas: road dust, ag soil, construction
U.S. EPA Office of Research & Development, Atmospheric Modeling & Analysis Division
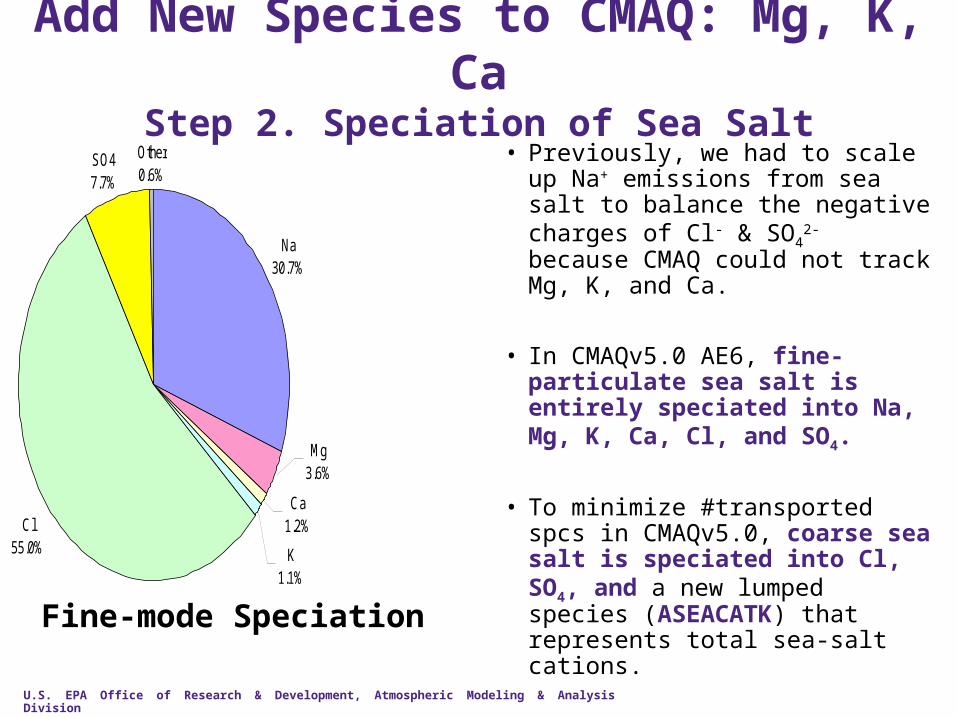
Na30.7%
Ca1.2%
K1.1%
Cl55.0%
SO47.7%
Other0.6%
Mg3.6%
Fine-mode Speciation
• Previously, we had to scale up Na+ emissions from sea salt to balance the negative charges of Cl- & SO4
2- because CMAQ could not track Mg, K, and Ca.
• In CMAQv5.0 AE6, fine-particulate sea salt is entirely speciated into Na, Mg, K, Ca, Cl, and SO4.
• To minimize #transported spcs in CMAQv5.0, coarse sea salt is speciated into Cl, SO4, and a new lumped species (ASEACATK) that represents total sea-salt cations.
• ASEACAT is disaggregated in CMAQ only when individual species are needed (e.g., ISORROPIA, CLDPROC, postproc)
Add New Species to CMAQ: Mg, K, CaStep 2. Speciation of Sea Salt
U.S. EPA Office of Research & Development, Atmospheric Modeling & Analysis Division
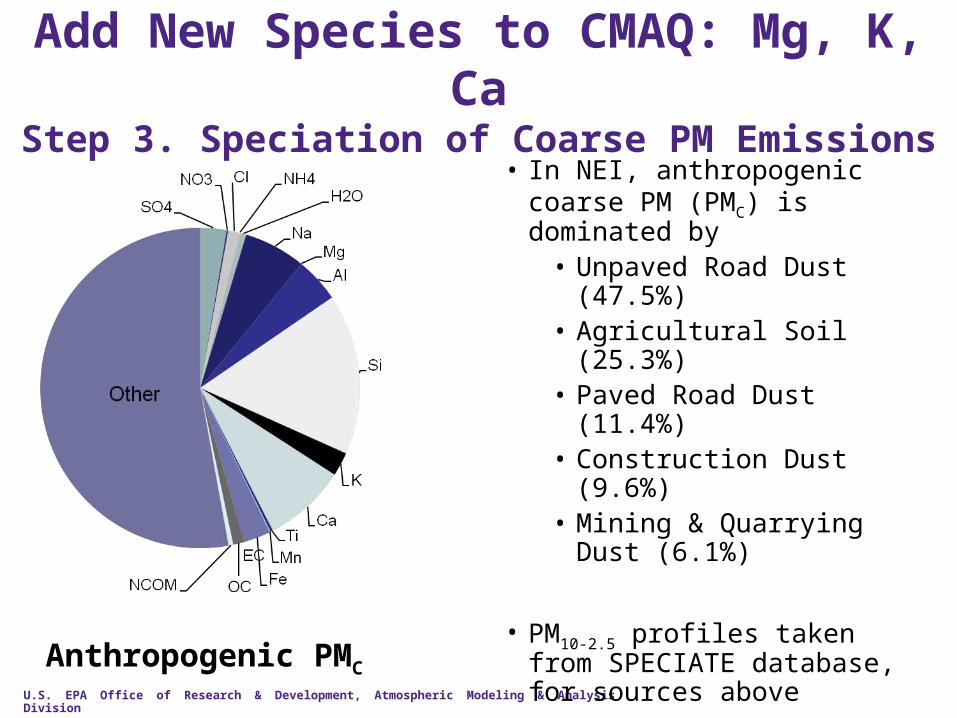
Add New Species to CMAQ: Mg, K, CaStep 3. Speciation of Coarse PM Emissions
Anthropogenic PMC
• In NEI, anthropogenic coarse PM (PMC) is dominated by
• Unpaved Road Dust (47.5%)
• Agricultural Soil (25.3%)• Paved Road Dust (11.4%)• Construction Dust (9.6%)• Mining & Quarrying Dust
(6.1%)
• PM10-2.5 profiles taken from SPECIATE database, for sources above
• Composite speciation profile shown on left
U.S. EPA Office of Research & Development, Atmospheric Modeling & Analysis Division
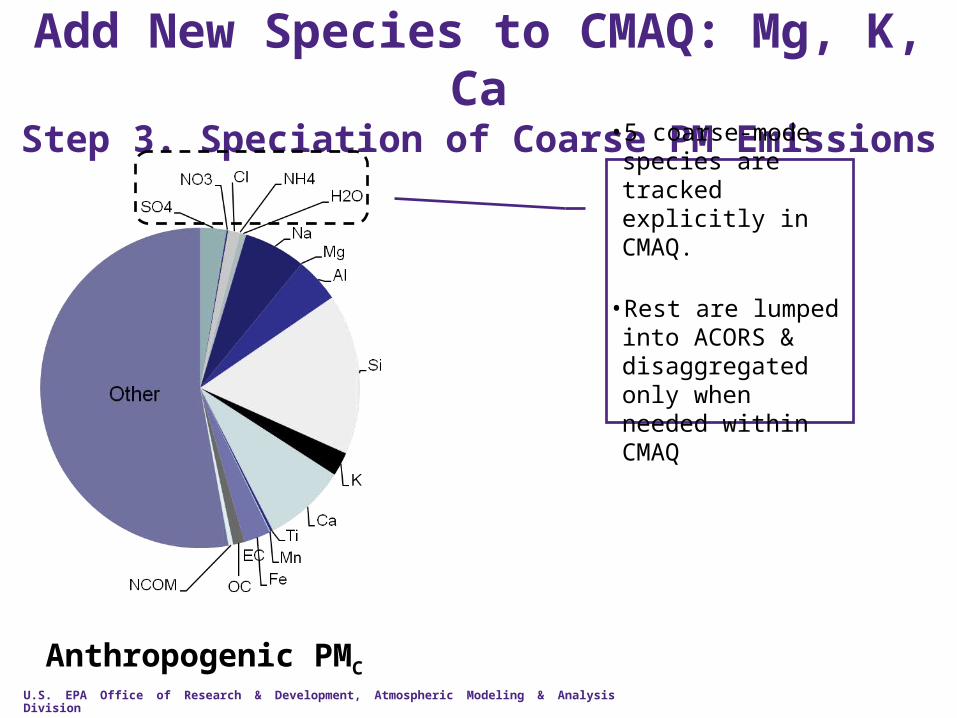
Add New Species to CMAQ: Mg, K, CaStep 3. Speciation of Coarse PM Emissions
Anthropogenic PMC
• 5 coarse-mode species are tracked explicitly in CMAQ.
• Rest are lumped into ACORS & disaggregated only when needed within CMAQ
U.S. EPA Office of Research & Development, Atmospheric Modeling & Analysis Division
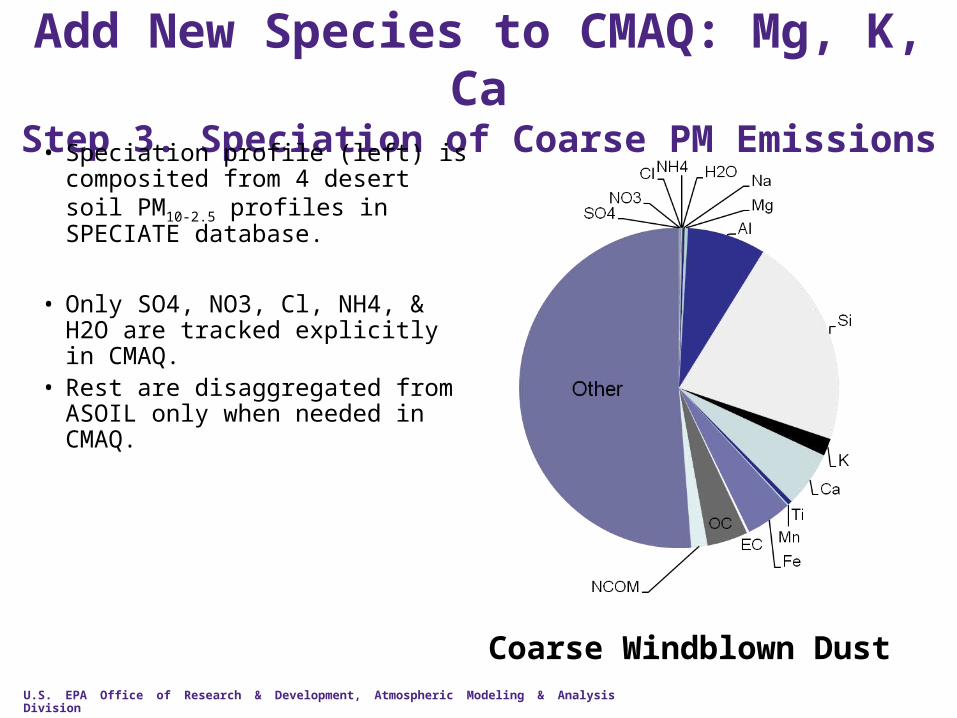
Add New Species to CMAQ: Mg, K, CaStep 3. Speciation of Coarse PM Emissions
Coarse Windblown Dust
• Speciation profile (left) is composited from 4 desert soil PM10-2.5 profiles in SPECIATE database.
• Only SO4, NO3, Cl, NH4, & H2O are tracked explicitly in CMAQ.
• Rest are disaggregated from ASOIL only when needed in CMAQ.
U.S. EPA Office of Research & Development, Atmospheric Modeling & Analysis Division
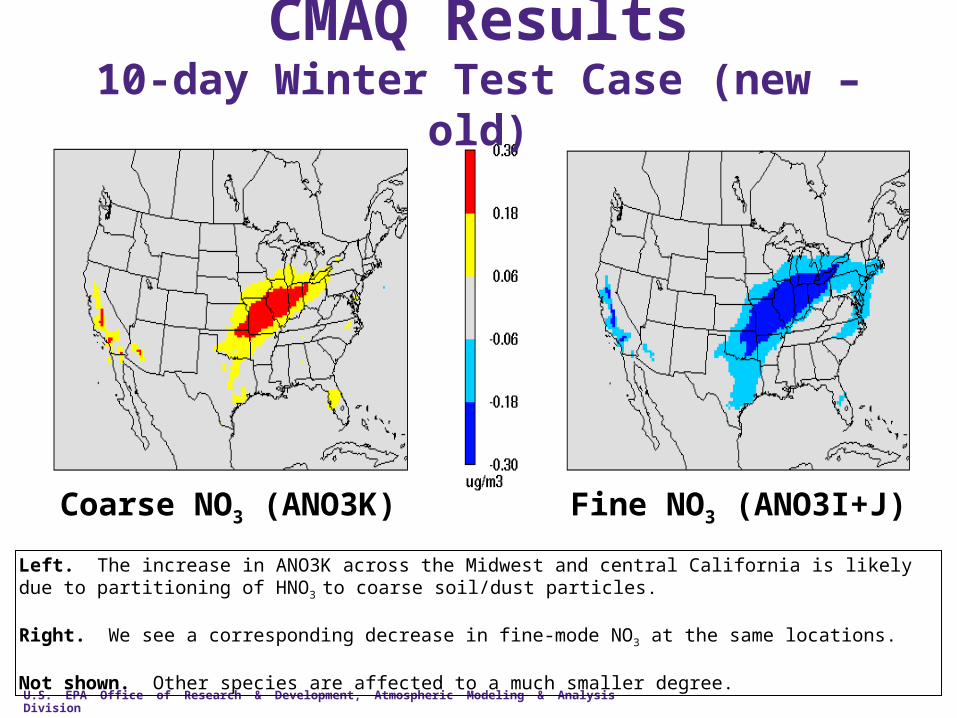
CMAQ Results10-day Winter Test Case (new – old)
Left. The increase in ANO3K across the Midwest and central California is likely due to partitioning of HNO3 to coarse soil/dust particles.
Right. We see a corresponding decrease in fine-mode NO3 at the same locations.
Not shown. Other species are affected to a much smaller degree.
Coarse NO3 (ANO3K) Fine NO3 (ANO3I+J)
U.S. EPA Office of Research & Development, Atmospheric Modeling & Analysis Division
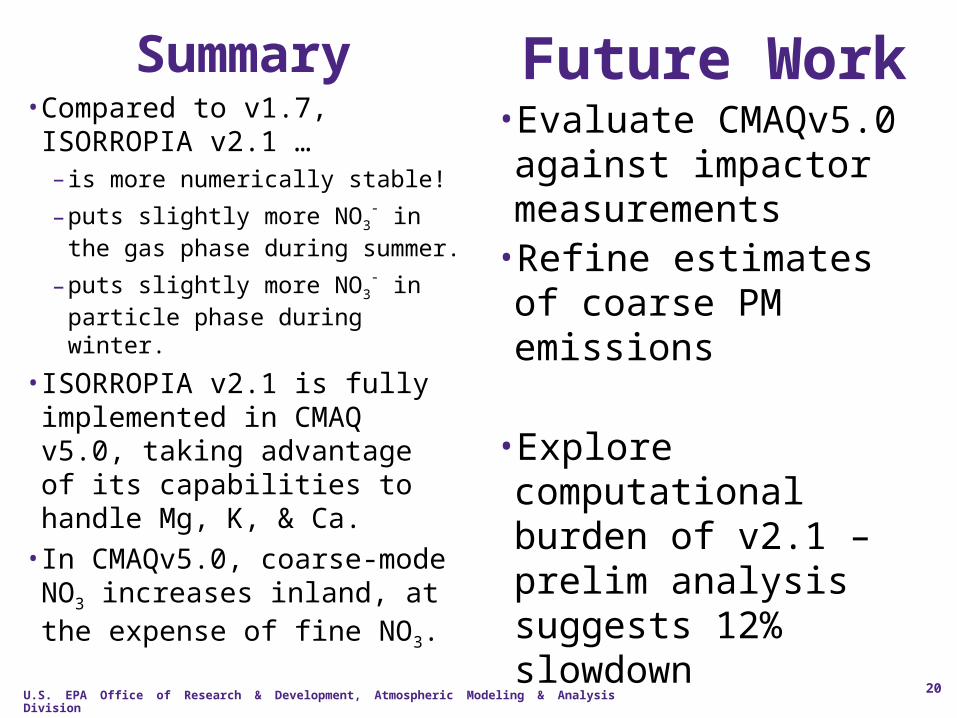
Summary• Compared to v1.7, ISORROPIA v2.1 …– is more numerically stable!
–puts slightly more NO3- in the
gas phase during summer.
–puts slightly more NO3- in
particle phase during winter.
• ISORROPIA v2.1 is fully implemented in CMAQ v5.0, taking advantage of its capabilities to handle Mg, K, & Ca.• In CMAQv5.0, coarse-mode NO3 increases inland, at the expense of fine NO3.
Future Work•Evaluate CMAQv5.0 against impactor measurements•Refine estimates of coarse PM emissions
•Explore computational burden of v2.1 – prelim analysis suggests 12% slowdown
20

U.S. EPA Office of Research & Development, Atmospheric Modeling & Analysis Division
21
Appendix
U.S. EPA Office of Research & Development, Atmospheric Modeling & Analysis Division
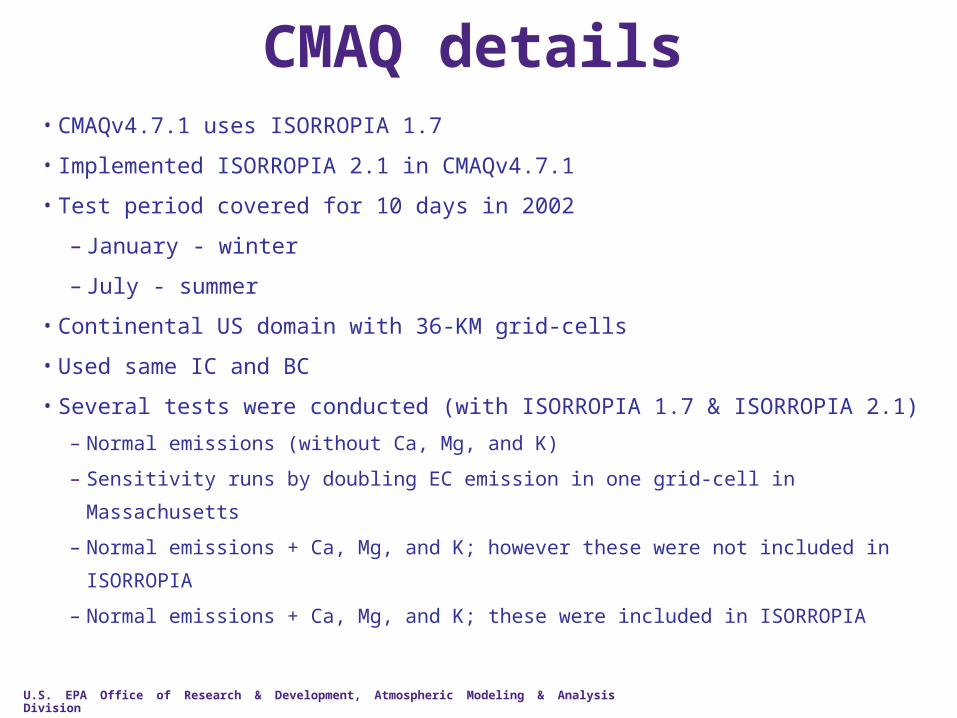
CMAQ details • CMAQv4.7.1 uses ISORROPIA 1.7
• Implemented ISORROPIA 2.1 in CMAQv4.7.1
• Test period covered for 10 days in 2002
– January - winter
– July - summer
• Continental US domain with 36-KM grid-cells
• Used same IC and BC
• Several tests were conducted (with ISORROPIA 1.7 & ISORROPIA 2.1)
– Normal emissions (without Ca, Mg, and K)
– Sensitivity runs by doubling EC emission in one grid-cell in Massachusetts
– Normal emissions + Ca, Mg, and K; however these were not included in ISORROPIA
– Normal emissions + Ca, Mg, and K; these were included in ISORROPIA