Embed Size (px)
Citation preview

African Journal of Basic & Applied Sciences 7 (4): 206-218, 2015ISSN 2079-2034© IDOSI Publications, 2015DOI: 10.5829/idosi.ajbas.2015.7.4.1145
Corresponding Author: Kidane Gebremeskel, Werer Research Center, Ethiopian Agricultural Research Organization,P.O. Box: 2003, Addis Ababa, Ethiopia.
206
Impact of Grazing Around a Watering Point onBotanical Composition of a Semi-Arid Rangeland in the
Southern Afar Region of Ethiopia
Kidane Gebremeskel and P.J. Pieterse1 2
Werer Research Center, Ethiopian Agricultural Research Organization,1
P.O. Box: 2003, Addis Ababa, EthiopiaDepartement of Agronomy, University of Stellenbosch, Private Bag X01,2
Matieland 7602, South Africa
Abstract: The botanical composition along a stratified grazing gradient around a watering point in a semi-aridrangeland in northeastern Ethiopia was investigated by means of the wheel point method for two growingseasons. Annual grasses and unpalatable forbs, which are indicators of degradation, characterized the severelydegraded area in both seasons. In moderately and lightly degraded areas an increase in abundance of perennialspecies was observed and was more preferred by the pastoral community as animal feed. In both seasons, themost frequently occurring perennial species were Chrysopogon plumulosus, Paspalidium desertorum andPanicum coloratum. Thus the study confirmed that there were differences in botanical composition atincreasing distances from the watering point.
Key words: Botanical composition Degradation Grazing gradient Species ordination Watering point
INTRODUCTION studies on the major indigenous grasses of the area and
The Allaidege rangeland of Ethiopia is one of the composition of the range.prominent grazing areas of the pastoral community of the Various researchers have reported grazing pressure,Afar Regional State. In the past the rangeland was known rainfall, edaphic condition and grazing history to influenceto be the best traditional wet season grazing area before botanical composition of a range [3, 4, 5]. Otherthe intervention of commercial agriculture in the region. researchers [6, 7, 8] have explicitly indicated that livestockDegradation of the rangeland gradually took place with grazing pressure in dry land regions of Africa due tothe development of a watering point causing grazing traditional range management caused changes inpressure in the area. This was also accompanied with the vegetation composition of the range. Amsalu and Baarsfailure of exercising the developed grazing utilization [9] have also reported that the communally grazedscheme in the community [1]. This failure and lack of agro-pastoral range areas showed poor botanicalknowledge in the community compelled the pastoral composition due to grazing pressure. Thus livestockpeople to persevere with grazing systems practiced in the grazing can have a profound impact on vegetationpast. This mode of grazing effected complete local composition. The general pattern of grazing inducedextinction of palatable perennial species, a fact that is now botanical composition change is well documented bywidely acknowledged by the community (Personal Kirkman [10], Owen-Smith and Danckwerts [11] andcommunication with clan leaders and elders). Amsalu and Baars [9]. The heavy utilization by livestock
Up to now, there was no scientific study carried out of forage plants around watering points compared toto quantify the herbaceous compositional change of the areas further away is confirmed by Friedel [12] andrange. Beruke [2] in a survey assessment report of the Hart et al. [13]. To this effect it is known that lessAfar rangeland emphasized the very limited identification palatable or undesirable plants increase at the expense of
recommended a comprehensive study on species
African J. Basic & Appl. Sci., 7 (4): 206-218, 2015
207
desirable plants. The decrease of palatable plants was species and life forms with in the grazing gradientsconfirmed by Tainton [14, 15] to be attributed to the (SD, MSD, MD & LD areas). To compare all life formsimpact of selective livestock grazing inducing a shift in with all grazing gradient a Chi-square test wasbotanical composition [16]. Hence this study evaluates performed. Then to determine more specifically wherethe long-term effects of grazing impact around watering differences occurred, all combinations of degradationpoint on vegetation dynamics of the range. by life forms (2 factor x 2 level combinations) were
The objective of the study was to assess the analyzed with Chi-square tests, applying Bonferroniunrestricted grazing effect on the botanical composition multiple testing. Compositional difference alongof the range around a watering point. The following the years was determined using classification treehypothesis was tested: there is no difference in botanical analysis.composition at increasing distances from the wateringpoint. RESULTS
MATERIALS AND METHODS Species Frequency in Year 1: The rangeland consisted of
The experiment was conducted for two seasons in a herbaceous forbs (Table 1). In the SD grazing area,communal grazing land around a watering point. perennial grasses were not prominent in the compositionIndividuals from the community group were involved in and represented about 4% of the total herbagethe field layout to stratify the grazing land into different composition. Annual grasses and unpalatable herbaceousgrazing gradients. In cognizance of the vegetation cover forbs dominated the grazing area. Both groups (annualthe grazing area was quantitatively stratified into four grasses and un-palatable herbaceous forbs) comprisedgrazing categories: severely degraded (SD), moderately to about 80% of the total composition of the grazing areaseverely degraded (MSD), moderately degraded (MD) and (Table 1). Perennial grasses that occurred in this grazinglightly degraded (LD) areas. Coordinates were taken by area (albeit in low numbers) were Sporobolus ioclados,GPS to map and calculate the area. The distance of each Paspalidium desertorum, Cynodon dactylon andstratified grazing field from a watering point was also Digitaria rivae (Table 1). recorded as 1500, 3600, 5150 and 6250 m for SD, MS, MD In the MSD area, perennial grasses, annual grassesand LD, respectively. A 1.2 km transect was laid out and others (non grass species) comprised 16, 63 and 21%perpendicular to the direction of the grazing gradient, of the botanical composition respectively. The annualmore or less in the middle of each of the grazed categories. grass, Setaria verticillata, predominantly covers thisThis consideration was to avoid border effects on both grazing area, which was also abundant in the SD areasides of the different grazing gradient categories. On each (Table 1).transect, five 30 x 30 m sample plots were laid out at 300 m The botanical composition of the MD grazing areaintervals, resulting in a total of 20 plots in the experimental consisted of 40% perennial grasses. P. desertorum,field. In each of the sampling plots, proportional species S. ioclados and Panicum coloratum contributed 8, 5 andcomposition is determined using the nearest plant 4% respectively to the total species composition.approach at 250 points [17, 18, 19], using the wheel point Chrysopogon plumulosus was more abundant,method of [20] for two seasons. The sampling was done contributing 21% of the total species composition in thewhen majority of the pasture plants were at flowering area. S. verticillata and other herbaceous forbs havestage. The abundance of species in the sample site is however contributed almost 60% to the plant compositionexpressed as a proportion of the total number of in the area (Table 1).observations made for the sample site. For some species In the LD area perennial grassess contributed 47% tonot identified in the field a representative plant was the composition. The perennial grasses C. plumulosus,pressed, labeled and transported to the National S. ioclados and P. coloratum contributed 16, 17 and 10%Herbarium of Addis Ababa University (AAU) for to the composition respectively. Other perennial grassesidentification. that contributed less than 2% to the composition were
Statistical Analysis: Descriptive statistics with S. verticillata and other herbaceous forbs were presentfrequency counts and percentages were calculated for contributing 24 and 27% to the composition respectively,each species and life form identified. Correspondence but were less prominent compared to the other grazinganalysis was done to graphically show the occurrences of gradients (Table 1).
a matrix of perennial grasses, annual grasses and
also present. Similar to the more degraded grazing areas,
African J. Basic & Appl. Sci., 7 (4): 206-218, 2015
208
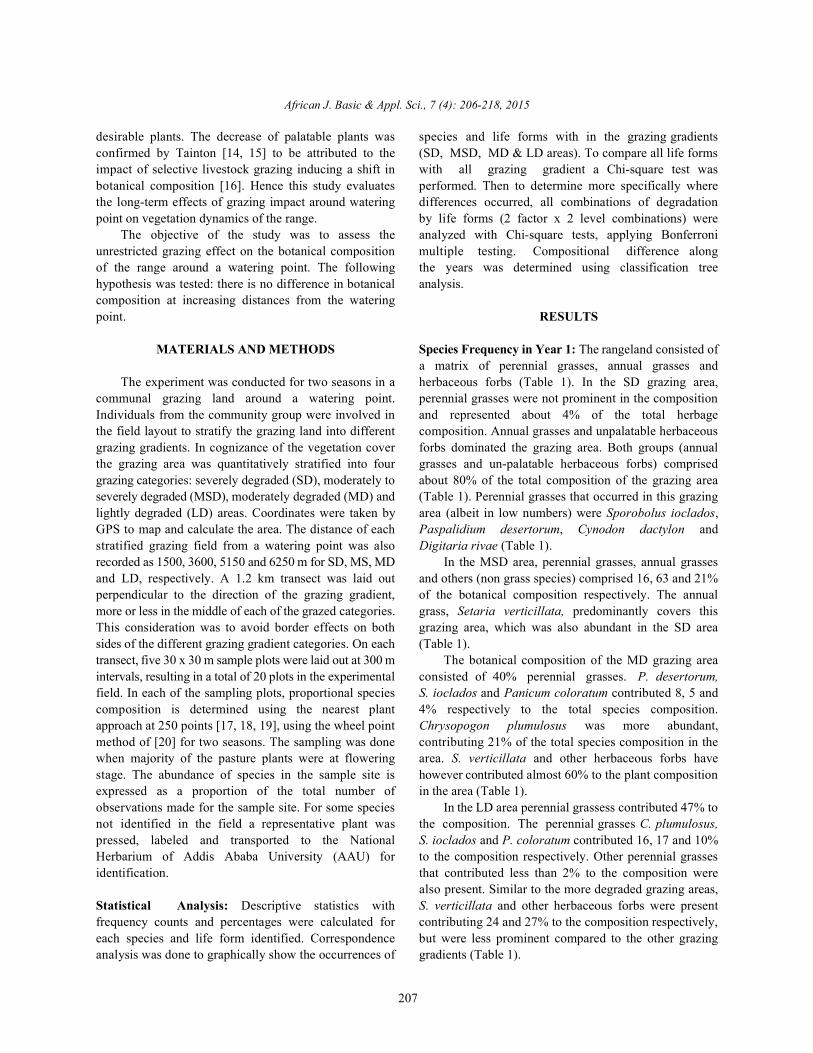
Table 1: Species composition (%) in each grazing gradient in year 1
Percent composition------------------------------------------------------------------------
Species Name SD MSD MD LDPerennial Grasses Afar vernacular name Life form % % % %
Chrysopogon plumulosus Hochst Durfu perennial 0 0.24 20.96 16.4Sporobolus ioclados Denekto perennial 1.84 11.52 4.8 16.6Panicum coloratum Denekto(p) perennial 0 3.6 3.6 9.6Paspalidium desertorum Bohale perennial 0.88 0.32 7.92 2.16Bothriochloa radicans (Lehm) As ayso perennial 0 0 2.88Cynodon dactylon Pers Rareta perennial 1.04 0 0 0Cenchrus ciliaris Serdoyta perennial 0 0 0 0.4Lintonia nutans Stapf Afara mole perennial 0 0 0 0.16Sporobolus pellucidus Hoehst Sosokete perennial 0 0 0.16 1.28Digitaria rivae (choir) stapf Forele/ Hamanto perennial 0.16 0 0.08 0
Total percentage (%) 3.92 15.46 40.42 46.6
Annual GrassesSetaria verticillata (L.) P.Beauv Delayta annual 40 62.64 33.28 23.6Tetrapogon tenellus(Roxb)chior Aytodyta annual 0 0 0.24 0.32Sporobolus panicoides A. Ruch Gewita/Bekelayso annual 0 0.24 0.72 2.16
Total percentage (%) 40 62.88 34.24 26.1
Edible annual forbsIpomoea sinensis Halal annual 15.4 2.24 7.68 1.76Other edible forbsBlepharis persica Yamarukta annual 0 0 4.88 8.16Legume annual forbsRhynchosia melacophylla (spreng,Boj) Haro annual 0.56 2.64 3.44 2.48
Total percentage (%) 15.9 4.88 16 12.4
OthersPhyllanthus maderaspa tensis L. Akelekelmi annual 14.7 6.24 0.8 8.64Leucas nubica Benth Ergufuma annual 14.2 0 0 0Amaranthus spp. Bunkete annual 0.8 0 0 0.08Orthosiphon pallidus Royle Hebeke annual 1.76 0.88 0 0.24Unidentified Alelus annual 0.56 0 0 0Portulaca quadrifiola L. Halihara annual 0.08 2.56 0.48 2.24Unidentified Ashara annual 2 0 0 0Abutilon fruticosum Hanbukto annual 4.8 0.8 0.64 0.64Unidentified Aburi annual 1.28 0 0 0Koheutia caespitosa Baroberbere annual 0 6.08 5.92 3.04Unidentified Mituki annual 0 0 1.52 0.08
Total percentage (%) 40.2 16.56 9.36 15
Grand total percentage (%) 100% 100% 100% 100%
SD = severely degraded area, MSD = moderately to severely degraded area, MD = moderately degraded area and LD = lightly degraded area
Ordination of the Species in Year 1: In this study the P. desertorum and C. plumulosus were present in MDspecies ordination was done by giving emphasis to and LD areas but more abundant in the MD area.species with frequency of occurrence above 1%, P. coloratum, which is closely plotted to the LD area, iswhich also limits the number of species. It was more abundant in this particular area than in the MD areaevident that most unpalatable forb species (others) (Fig. 1).appear dominantly in the SD area. The annual grass The MSD, MD and LD areas did share commonS. verticillata was present in all areas but was relatively species such as S. verticillata, S. ioclados andprominent in abundance in the MSD area. Similarly Rhynchosia melacophylla but a higher abundance wasthe analysis implicated that perennial grasses such as revealed in the MSD area for the first two species alone.

African J. Basic & Appl. Sci., 7 (4): 206-218, 2015
209
Fig. 1: Ordination of the most abundant species in the rangeland according to degradation areas in year 1SD = severely degraded area, MSD = moderately to severely degraded area, MD = moderately degraded area and LD =lightly degraded area
Fig. 2: Ordination of life form groups in the rangeland according to degradation areas in year 1SD = severely degraded area, MSD = moderately to severely degraded area, MD = moderately degraded area and LD =lightly degraded area

African J. Basic & Appl. Sci., 7 (4): 206-218, 2015
210
Fig. 3. Frequency of occurrence of different species in the degradation areasSD = severely degraded area, MSD = moderately to severely degraded area, MD = moderately degraded area and LD =lightly degraded area
R. melacophylla maintained an equal frequency annual grass S. verticillata in the SD and MSD areasdistribution in the three degradation areas (Fig. 1). The life respectively. The percentages for the MD and LD areasform ordination also identified similar species ordination were 21 and 15% respectively (Fig. 3)for S. verticilata (Annual grass) and R. melacophylla(Legume annual forb) (Fig. 2). Blepharis spp. is the only Species Frequency in Year 2: The botanical compositionannual strictly limited to the MD and LD areas (Fig. 1). of the rangeland in general was similar to that of the
The species percentage distribution across the preceding year with only slight changes in speciesgrazing gradient was identified using Classification composition in some of the degradation areas. In the SDTree Analysis (CTA). The perennial grass species, area, perennial species comprised 6% of the vegetationother edible and legume annual forbs (Blepharis spp. and compared to 4% in year 1 (Table 2). The most abundantR. melacophylla) had a high frequency of occurrence in perennial species were S. ioclados and P. desertorum,the MD and LD areas (37 and 42% respectively) compared which are characteristic inhabitants of degraded orto a low frequency of occurrence of 2 and 18% in the SD disturbed areas. In contrast, annual grasses,and MSD areas respectively (Fig. 3). In contrast, the predominantly S. verticillata comprise 50% of the totalunpalatable species (Phyllanthus maderaspa, Leucas botanical composition and unpalatable herbaceous forbsnubica & Abutilon fruticosum) relatively high in (others) 12% (Table 2).frequency and edible annual (I. sinensis) which are The MSD area consisted of 20, 65 and 15% perennialpioneers were found to have a total frequency of grasses, annual grasses and others respectively. Similaroccurrence of 62% in the SD area and a consistent 12-14% to the previous year, S. verticillata was the mostfrequency of occurrence in the other areas (Fig. 3). A abundant species comprising 65% composition of thefrequency of occurrence of 25 and 39% was recorded for total herbage of this grazing area (Table 2).
African J. Basic & Appl. Sci., 7 (4): 206-218, 2015
211
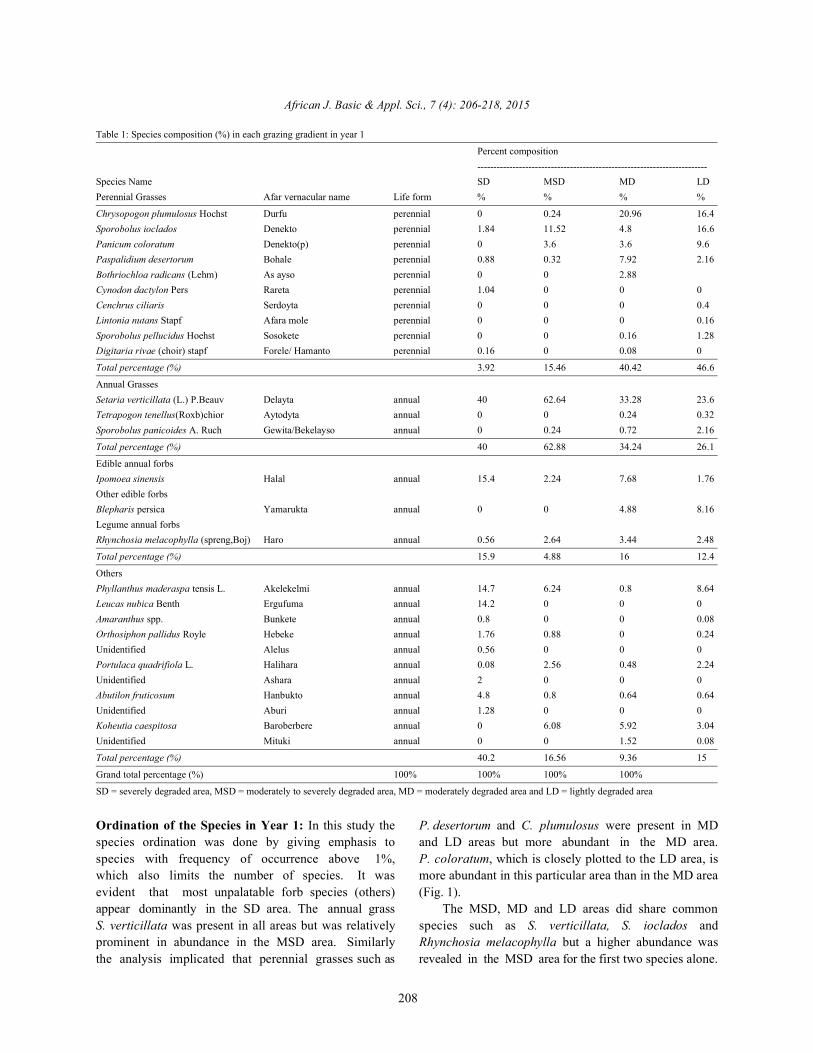
Table 2: Species composition in the grazing gradients in year 2Percent composition of each grazing gradients-------------------------------------------------------------------------------------------
Species Name Severely Moderate to severely Moderately LightlyPerennial Grasses Afar vernicular name Life form % (%) % %Chrysopogon plumulosus Hochst Durfu Perennial 0 4.72 20.16 20.08Sporobolus ioclados Denekto Perennial 2 3.04 3.36 0.4Panicum coloratum Denekto(p) Perennial 0 1.04 4.72 12.4Paspalidium desertorum Bohale Perennial 2.56 11.04 7.92 0.88Bothriochloa radicans (Lehm) As ayso Perennial 0 0 2.8 0.96Cenchrus ciliaris Serdoyta Perennial 0 0 0 0.24Lintonia nutans Stapf Afara mole Perennial 0 0 0 2.56Sporobolus pellucidus Hoehst Sosokete Perennial 0 0.16 0.16 0.64Digitaria rivae (choir) stapf Forele/hamanto Perennial 0.96 0 0.08 0.16Total percentage (%) 5.52 20 39.2 38.32Annual GrassesSetaria verticillata (L.) P.Beauv Delayta Annual 50.2 64.8 34.16 25.44Tetrapogon tenellus (Roxb)chior Aytodyta Annual 0 0.24 0.24 0.08Sporobolus panicoides A. Ruch Gewita Annual 0 0 0.72 10.64Total percentage (%) 50.2 65.04 35.12 36.16Edible forbsEdible annualIpomoea sinensis Halal Annual 31.7 4.4 7.36 1.2Other edibleBlepharis spp. Yamarukta Annual 0 6.64 5.52 20.8Legume annualRhynchosia melacophylla (spreng,Boj) Haro Annual 0.24 0.72 3.44 0.16Total percentage (%) 31.9 11.76 16.32 22.16OthersPhyllanthus maderaspa tensis L. Akelekelmi Annual 4.48 0.48 0.8 0.56Leucas nubica Benth Ergufuma Annual 0 0 0 0Amaranthus spp. Bunkete Annual 0.16 0 0 0Orthosiphon pallidus Royle Hebeke Annual 0.32 0 0 0
Alelus Annual 0.96 0 0 0Portulaca quadrifiola L. Halihara Annual 0.88 0.08 0.48 0.32
Ashara Annual 0.08 0 0 0Abutilon fruticosum Hanbukto Annual 0.88 0.16 0.64 0.16
Baroberbere Annual 4.64 1.6 5.92 0.16Mituki Annual 0 0.88 1.52 1.92
Total percentage (%) 12.4 3.2 9.36 3.12Grand total percentage (%) 100% 100% 100% 100%
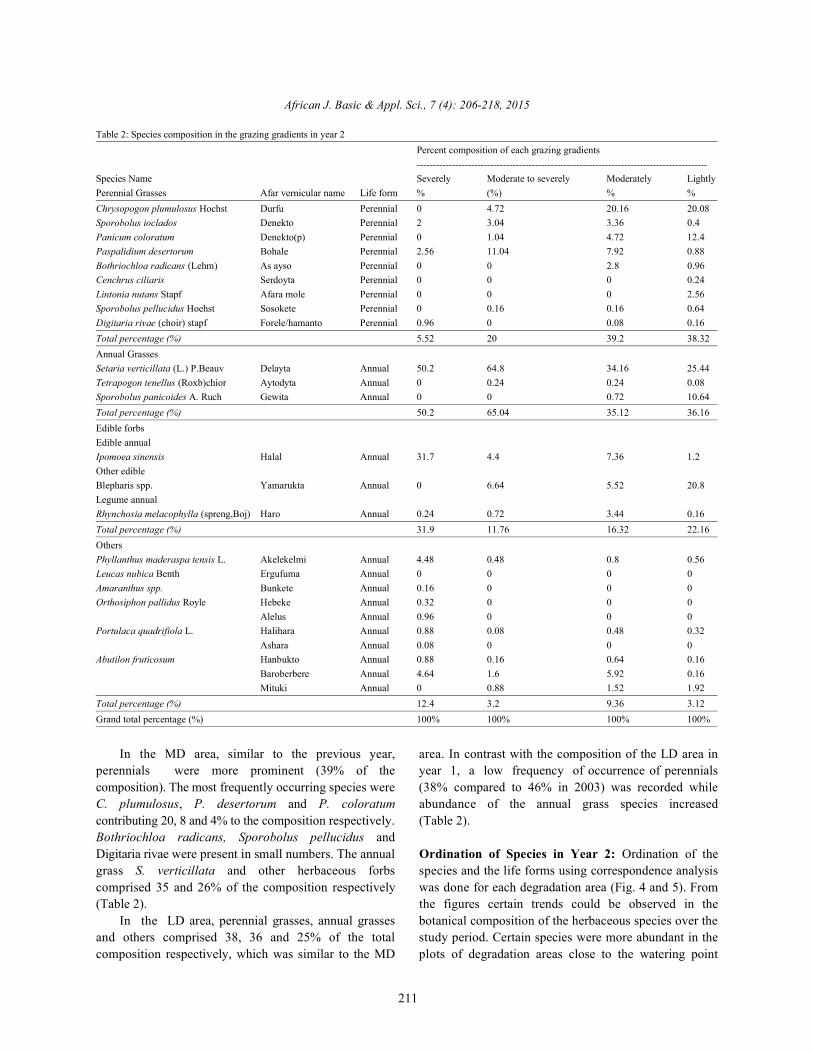
In the MD area, similar to the previous year, area. In contrast with the composition of the LD area inperennials were more prominent (39% of the year 1, a low frequency of occurrence of perennialscomposition). The most frequently occurring species were (38% compared to 46% in 2003) was recorded whileC. plumulosus, P. desertorum and P. coloratum abundance of the annual grass species increasedcontributing 20, 8 and 4% to the composition respectively. (Table 2). Bothriochloa radicans, Sporobolus pellucidus andDigitaria rivae were present in small numbers. The annual Ordination of Species in Year 2: Ordination of thegrass S. verticillata and other herbaceous forbs species and the life forms using correspondence analysiscomprised 35 and 26% of the composition respectively was done for each degradation area (Fig. 4 and 5). From(Table 2). the figures certain trends could be observed in the
In the LD area, perennial grasses, annual grasses botanical composition of the herbaceous species over theand others comprised 38, 36 and 25% of the total study period. Certain species were more abundant in thecomposition respectively, which was similar to the MD plots of degradation areas close to the watering point

African J. Basic & Appl. Sci., 7 (4): 206-218, 2015
212
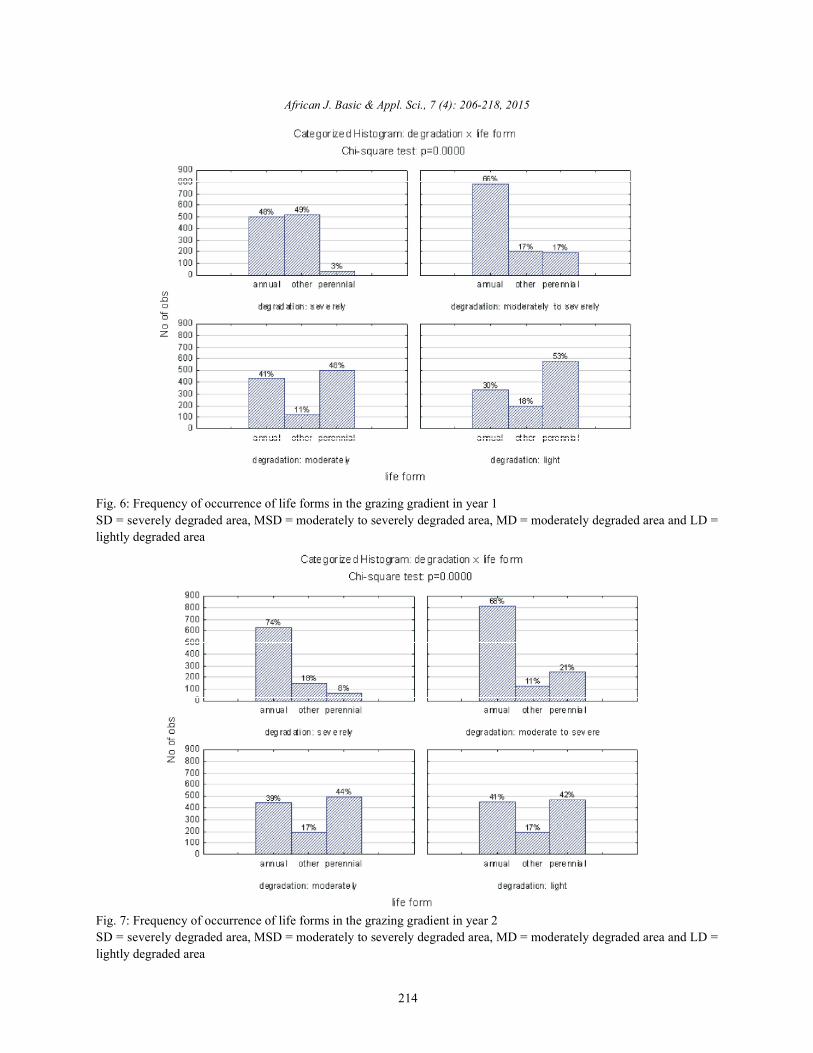
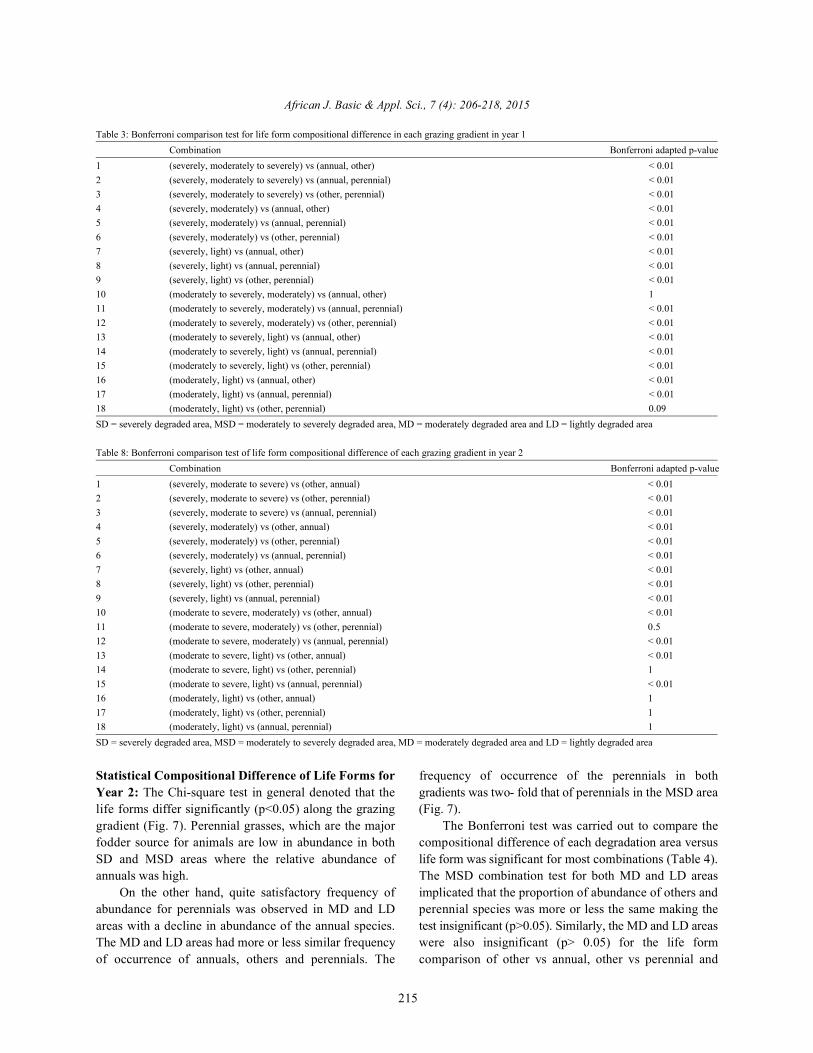
relative to the plots of degradation areas further away comparison of each grazing gradient for the different lifefrom the watering point. On the other hand, the decrease forms that occurred, a chi square test of the degradationin abundance of other species was a common phenomena levels (SD, MSD, MD & LD areas) and life forms of theobserved. The species that increased in abundance species was carried out to evaluate if life forms arerelative to plots further from the watering point were the dependent on degradation or not. Accordingly, a highlyunpalatable species and Ipomoea sinensis, which is significant difference (p<0.05) was recorded in both yearspalatable. Although lower in abundance, the unpalatable for the different degradation areas and the three life formsspecies were also detected in the degradation areas considered (Figs. 6 and 7).further away from the watering point. The annual grass, S. In year 1, annual grasses and others were mostverticillata existed in all grazing gradients but was more abundant in the SD area with 48 and 49% frequency offrequent in MSD and SD areas, similar to the trend occurrence respectively compared to the 3% occurrenceobserved for the same species in year 1 (Fig. 4). of perennials. In the MSD area, annual grass species were
The perennial species were ordinated in accordance dominant with a frequency of occurrence of 66%, whereasto their preference/palatability for animals and it was perennials and others were at equal proportions of 17%.sometimes impossible to detect patterns of change of In MD and LD areas a three-fold increase of frequencybotanical composition for some of the species. For was recorded for perennials compared to the MSD area.example, P. desertorum, which is less palatable, was more On the other hand, annual grasses decreased to 41 andabundant in the MSD area relative to the MD and SD 30% and the others to 11 and 30% in MD and LD areasareas (Fig. 4). The lower abundance of this species in the respectively (Fig. 6). This in general was evidence that theSD area indicates that availability of preferred species is grazing gradient had an impact on the herbaceousscarce and animals are persuaded to graze the less composition.palatable species available. In year 2, the occurrence of annuals was high in SD
Chrysopogon plumulosus which is known to be a and MSD areas with frequency of occurrence of 74 andpalatable species has a very low abundance in the MSD 66% respectively. The others and perennials were 18 andarea closer to the watering point relative to the higher 8, 11 and 21% for SD and MSD areas respectively. In MDabundance observed in MD and LD areas further away and LD areas the annual grasses were more or less similarfrom the watering point. C. plumulosus did not occur in in frequency in both areas in both years. The others andthe SD area. Similarly P. coloratum was more abundant in perennials were almost similar in both MD and LD areasthe LD area relative to the abundance in the MD area. The (Fig. 7). abundance of the species varied from nil to very low in SDand MSD areas respectively. S. ioclados, despite its low Statistical Compositional Difference of Life Forms forabundance in the SD area, existed at a consistent Year 1: A Bonferroni multiple comparison tests werefrequency in both MSD and MD areas (Fig. 4). made to observe the compositional difference in each
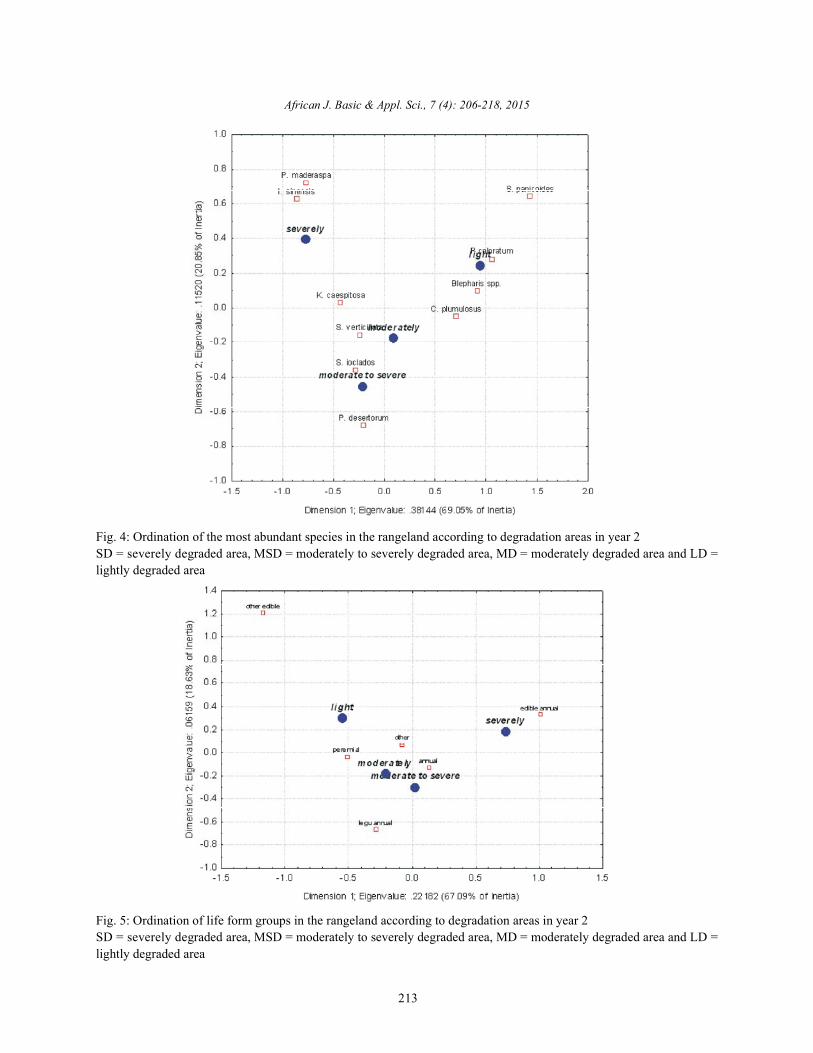
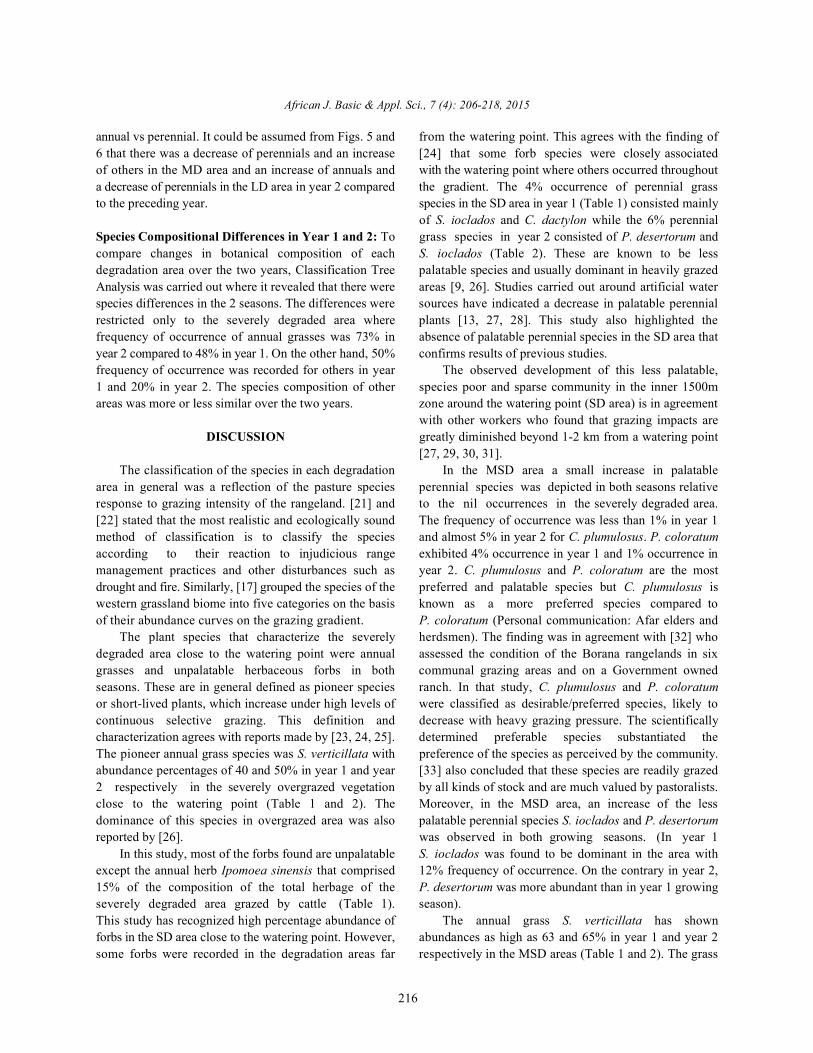
In terms of life forms the same trends as in year 1 were degradation area for the different life forms (Table 3). Theevident. The only deviation was the case of the “others” comparison made for almost all the combined testsgroup that were more evenly distributed over the four implicated that the different life forms were significantlydegradation areas (Fig. 5) than in year 1, when it occurred different (p< 0.05) for each comparison test of the life formmainly in the SD area (Fig. 2). vs (versus) degradation showing the impact of
Frequency of Life Forms in Grazing Gradients in Year 1 test entry No. 10 made for MSD and MD areas vs the lifeand 2: Species compositional difference in each forms of annuals and others, in which the case was notdegradation area was examined based on the frequency of significant (p> 0.05). This means that the frequency ofoccurrence of different life forms (perennial grass, annual occurrence of the annuals and others was similar in bothgrass and others) observed in the field including all those areas (Fig. 6). The same applies for entry No. 18, made forspecies found to be very few in frequency of occurrence. MD and LD areas vs others and perennials. RegardingThis is because the life forms concisely categorized the perennial species, the relative proportion was comparedspecies distribution in each degradation area. The to annuals and others in relation to each degradation area.perennial species distribution in the grazing gradient was The figure shows that the frequency of abundance ofemphasized for the important role they play in both animal perennials increased along the grazing gradient away fromproduction and soil erosion control. Before running a test the watering point for each comparison made (Fig. 6).
degradation on life form. One exception is combination
African J. Basic & Appl. Sci., 7 (4): 206-218, 2015
213
Fig. 4: Ordination of the most abundant species in the rangeland according to degradation areas in year 2SD = severely degraded area, MSD = moderately to severely degraded area, MD = moderately degraded area and LD =lightly degraded area
Fig. 5: Ordination of life form groups in the rangeland according to degradation areas in year 2SD = severely degraded area, MSD = moderately to severely degraded area, MD = moderately degraded area and LD =lightly degraded area
African J. Basic & Appl. Sci., 7 (4): 206-218, 2015
214
Fig. 6: Frequency of occurrence of life forms in the grazing gradient in year 1SD = severely degraded area, MSD = moderately to severely degraded area, MD = moderately degraded area and LD =lightly degraded area
Fig. 7: Frequency of occurrence of life forms in the grazing gradient in year 2SD = severely degraded area, MSD = moderately to severely degraded area, MD = moderately degraded area and LD =lightly degraded area
African J. Basic & Appl. Sci., 7 (4): 206-218, 2015
215
Table 3: Bonferroni comparison test for life form compositional difference in each grazing gradient in year 1Combination Bonferroni adapted p-value
1 (severely, moderately to severely) vs (annual, other) < 0.012 (severely, moderately to severely) vs (annual, perennial) < 0.013 (severely, moderately to severely) vs (other, perennial) < 0.014 (severely, moderately) vs (annual, other) < 0.015 (severely, moderately) vs (annual, perennial) < 0.016 (severely, moderately) vs (other, perennial) < 0.017 (severely, light) vs (annual, other) < 0.018 (severely, light) vs (annual, perennial) < 0.019 (severely, light) vs (other, perennial) < 0.0110 (moderately to severely, moderately) vs (annual, other) 111 (moderately to severely, moderately) vs (annual, perennial) < 0.0112 (moderately to severely, moderately) vs (other, perennial) < 0.0113 (moderately to severely, light) vs (annual, other) < 0.0114 (moderately to severely, light) vs (annual, perennial) < 0.0115 (moderately to severely, light) vs (other, perennial) < 0.0116 (moderately, light) vs (annual, other) < 0.0117 (moderately, light) vs (annual, perennial) < 0.0118 (moderately, light) vs (other, perennial) 0.09SD = severely degraded area, MSD = moderately to severely degraded area, MD = moderately degraded area and LD = lightly degraded area
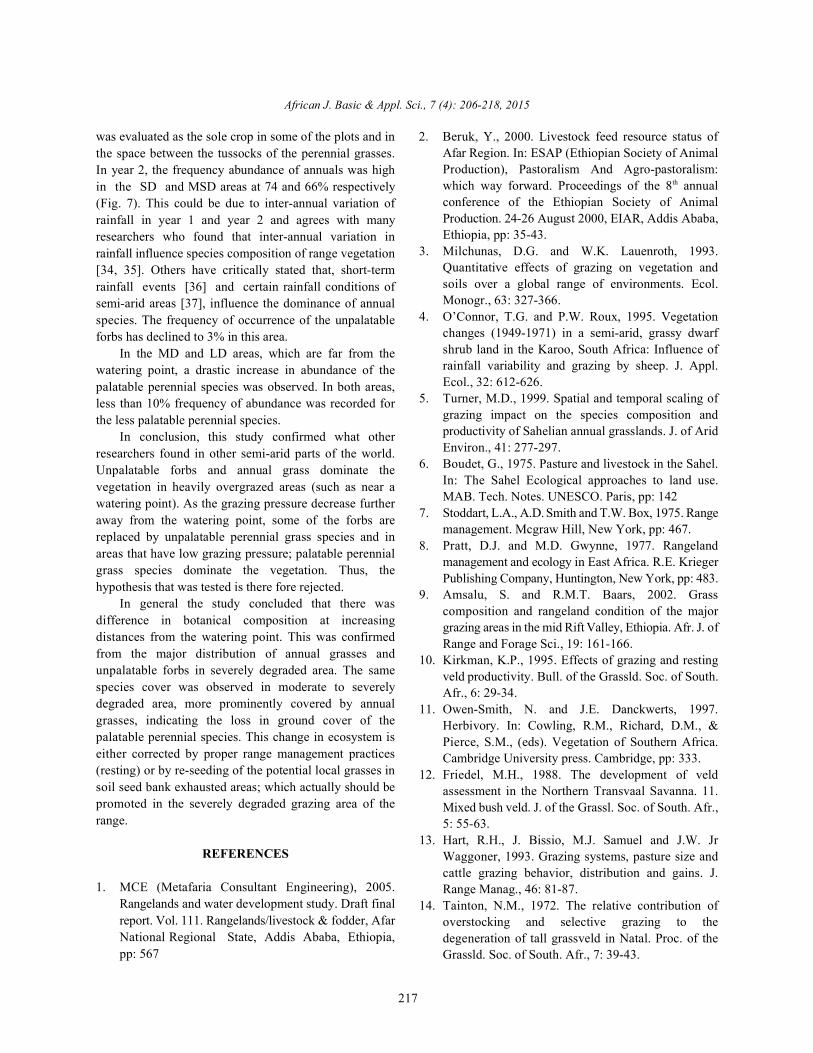
Table 8: Bonferroni comparison test of life form compositional difference of each grazing gradient in year 2Combination Bonferroni adapted p-value
1 (severely, moderate to severe) vs (other, annual) < 0.012 (severely, moderate to severe) vs (other, perennial) < 0.013 (severely, moderate to severe) vs (annual, perennial) < 0.014 (severely, moderately) vs (other, annual) < 0.015 (severely, moderately) vs (other, perennial) < 0.016 (severely, moderately) vs (annual, perennial) < 0.017 (severely, light) vs (other, annual) < 0.018 (severely, light) vs (other, perennial) < 0.019 (severely, light) vs (annual, perennial) < 0.0110 (moderate to severe, moderately) vs (other, annual) < 0.0111 (moderate to severe, moderately) vs (other, perennial) 0.512 (moderate to severe, moderately) vs (annual, perennial) < 0.0113 (moderate to severe, light) vs (other, annual) < 0.0114 (moderate to severe, light) vs (other, perennial) 115 (moderate to severe, light) vs (annual, perennial) < 0.0116 (moderately, light) vs (other, annual) 117 (moderately, light) vs (other, perennial) 118 (moderately, light) vs (annual, perennial) 1SD = severely degraded area, MSD = moderately to severely degraded area, MD = moderately degraded area and LD = lightly degraded area
Statistical Compositional Difference of Life Forms for frequency of occurrence of the perennials in bothYear 2: The Chi-square test in general denoted that the gradients was two- fold that of perennials in the MSD arealife forms differ significantly (p<0.05) along the grazing (Fig. 7). gradient (Fig. 7). Perennial grasses, which are the major The Bonferroni test was carried out to compare thefodder source for animals are low in abundance in both compositional difference of each degradation area versusSD and MSD areas where the relative abundance of life form was significant for most combinations (Table 4).annuals was high. The MSD combination test for both MD and LD areas
On the other hand, quite satisfactory frequency of implicated that the proportion of abundance of others andabundance for perennials was observed in MD and LD perennial species was more or less the same making theareas with a decline in abundance of the annual species. test insignificant (p>0.05). Similarly, the MD and LD areasThe MD and LD areas had more or less similar frequency were also insignificant (p> 0.05) for the life formof occurrence of annuals, others and perennials. The comparison of other vs annual, other vs perennial and
African J. Basic & Appl. Sci., 7 (4): 206-218, 2015
216
annual vs perennial. It could be assumed from Figs. 5 and from the watering point. This agrees with the finding of6 that there was a decrease of perennials and an increase [24] that some forb species were closely associatedof others in the MD area and an increase of annuals and with the watering point where others occurred throughouta decrease of perennials in the LD area in year 2 compared the gradient. The 4% occurrence of perennial grassto the preceding year. species in the SD area in year 1 (Table 1) consisted mainly
Species Compositional Differences in Year 1 and 2: To grass species in year 2 consisted of P. desertorum andcompare changes in botanical composition of each S. ioclados (Table 2). These are known to be lessdegradation area over the two years, Classification Tree palatable species and usually dominant in heavily grazedAnalysis was carried out where it revealed that there were areas [9, 26]. Studies carried out around artificial waterspecies differences in the 2 seasons. The differences were sources have indicated a decrease in palatable perennialrestricted only to the severely degraded area where plants [13, 27, 28]. This study also highlighted thefrequency of occurrence of annual grasses was 73% in absence of palatable perennial species in the SD area thatyear 2 compared to 48% in year 1. On the other hand, 50% confirms results of previous studies.frequency of occurrence was recorded for others in year The observed development of this less palatable,1 and 20% in year 2. The species composition of other species poor and sparse community in the inner 1500mareas was more or less similar over the two years. zone around the watering point (SD area) is in agreement
DISCUSSION greatly diminished beyond 1-2 km from a watering point
The classification of the species in each degradation In the MSD area a small increase in palatablearea in general was a reflection of the pasture species perennial species was depicted in both seasons relativeresponse to grazing intensity of the rangeland. [21] and to the nil occurrences in the severely degraded area.[22] stated that the most realistic and ecologically sound The frequency of occurrence was less than 1% in year 1method of classification is to classify the species and almost 5% in year 2 for C. plumulosus. P. coloratumaccording to their reaction to injudicious range exhibited 4% occurrence in year 1 and 1% occurrence inmanagement practices and other disturbances such as year 2. C. plumulosus and P. coloratum are the mostdrought and fire. Similarly, [17] grouped the species of the preferred and palatable species but C. plumulosus iswestern grassland biome into five categories on the basis known as a more preferred species compared toof their abundance curves on the grazing gradient. P. coloratum (Personal communication: Afar elders and
The plant species that characterize the severely herdsmen). The finding was in agreement with [32] whodegraded area close to the watering point were annual assessed the condition of the Borana rangelands in sixgrasses and unpalatable herbaceous forbs in both communal grazing areas and on a Government ownedseasons. These are in general defined as pioneer species ranch. In that study, C. plumulosus and P. coloratumor short-lived plants, which increase under high levels of were classified as desirable/preferred species, likely tocontinuous selective grazing. This definition and decrease with heavy grazing pressure. The scientificallycharacterization agrees with reports made by [23, 24, 25]. determined preferable species substantiated theThe pioneer annual grass species was S. verticillata with preference of the species as perceived by the community.abundance percentages of 40 and 50% in year 1 and year [33] also concluded that these species are readily grazed2 respectively in the severely overgrazed vegetation by all kinds of stock and are much valued by pastoralists.close to the watering point (Table 1 and 2). The Moreover, in the MSD area, an increase of the lessdominance of this species in overgrazed area was also palatable perennial species S. ioclados and P. desertorumreported by [26]. was observed in both growing seasons. (In year 1
In this study, most of the forbs found are unpalatable S. ioclados was found to be dominant in the area withexcept the annual herb Ipomoea sinensis that comprised 12% frequency of occurrence. On the contrary in year 2,15% of the composition of the total herbage of the P. desertorum was more abundant than in year 1 growingseverely degraded area grazed by cattle (Table 1). season).This study has recognized high percentage abundance of The annual grass S. verticillata has shownforbs in the SD area close to the watering point. However, abundances as high as 63 and 65% in year 1 and year 2some forbs were recorded in the degradation areas far respectively in the MSD areas (Table 1 and 2). The grass
of S. ioclados and C. dactylon while the 6% perennial
with other workers who found that grazing impacts are
[27, 29, 30, 31].
African J. Basic & Appl. Sci., 7 (4): 206-218, 2015
217
was evaluated as the sole crop in some of the plots and in 2. Beruk, Y., 2000. Livestock feed resource status ofthe space between the tussocks of the perennial grasses.In year 2, the frequency abundance of annuals was highin the SD and MSD areas at 74 and 66% respectively(Fig. 7). This could be due to inter-annual variation ofrainfall in year 1 and year 2 and agrees with manyresearchers who found that inter-annual variation inrainfall influence species composition of range vegetation[34, 35]. Others have critically stated that, short-termrainfall events [36] and certain rainfall conditions ofsemi-arid areas [37], influence the dominance of annualspecies. The frequency of occurrence of the unpalatableforbs has declined to 3% in this area.
In the MD and LD areas, which are far from thewatering point, a drastic increase in abundance of thepalatable perennial species was observed. In both areas,less than 10% frequency of abundance was recorded forthe less palatable perennial species.
In conclusion, this study confirmed what otherresearchers found in other semi-arid parts of the world.Unpalatable forbs and annual grass dominate thevegetation in heavily overgrazed areas (such as near awatering point). As the grazing pressure decrease furtheraway from the watering point, some of the forbs arereplaced by unpalatable perennial grass species and inareas that have low grazing pressure; palatable perennialgrass species dominate the vegetation. Thus, thehypothesis that was tested is there fore rejected.
In general the study concluded that there wasdifference in botanical composition at increasingdistances from the watering point. This was confirmedfrom the major distribution of annual grasses andunpalatable forbs in severely degraded area. The samespecies cover was observed in moderate to severelydegraded area, more prominently covered by annualgrasses, indicating the loss in ground cover of thepalatable perennial species. This change in ecosystem iseither corrected by proper range management practices(resting) or by re-seeding of the potential local grasses insoil seed bank exhausted areas; which actually should bepromoted in the severely degraded grazing area of therange.
REFERENCES
1. MCE (Metafaria Consultant Engineering), 2005.Rangelands and water development study. Draft finalreport. Vol. 111. Rangelands/livestock & fodder, AfarNational Regional State, Addis Ababa, Ethiopia,pp: 567
Afar Region. In: ESAP (Ethiopian Society of AnimalProduction), Pastoralism And Agro-pastoralism:which way forward. Proceedings of the 8 annualth
conference of the Ethiopian Society of AnimalProduction. 24-26 August 2000, EIAR, Addis Ababa,Ethiopia, pp: 35-43.
3. Milchunas, D.G. and W.K. Lauenroth, 1993.Quantitative effects of grazing on vegetation andsoils over a global range of environments. Ecol.Monogr., 63: 327-366.
4. O’Connor, T.G. and P.W. Roux, 1995. Vegetationchanges (1949-1971) in a semi-arid, grassy dwarfshrub land in the Karoo, South Africa: Influence ofrainfall variability and grazing by sheep. J. Appl.Ecol., 32: 612-626.
5. Turner, M.D., 1999. Spatial and temporal scaling ofgrazing impact on the species composition andproductivity of Sahelian annual grasslands. J. of AridEnviron., 41: 277-297.
6. Boudet, G., 1975. Pasture and livestock in the Sahel.In: The Sahel Ecological approaches to land use.MAB. Tech. Notes. UNESCO. Paris, pp: 142
7. Stoddart, L.A., A.D. Smith and T.W. Box, 1975. Rangemanagement. Mcgraw Hill, New York, pp: 467.
8. Pratt, D.J. and M.D. Gwynne, 1977. Rangelandmanagement and ecology in East Africa. R.E. KriegerPublishing Company, Huntington, New York, pp: 483.
9. Amsalu, S. and R.M.T. Baars, 2002. Grasscomposition and rangeland condition of the majorgrazing areas in the mid Rift Valley, Ethiopia. Afr. J. ofRange and Forage Sci., 19: 161-166.
10. Kirkman, K.P., 1995. Effects of grazing and restingveld productivity. Bull. of the Grassld. Soc. of South.Afr., 6: 29-34.
11. Owen-Smith, N. and J.E. Danckwerts, 1997.Herbivory. In: Cowling, R.M., Richard, D.M., &Pierce, S.M., (eds). Vegetation of Southern Africa.Cambridge University press. Cambridge, pp: 333.
12. Friedel, M.H., 1988. The development of veldassessment in the Northern Transvaal Savanna. 11.Mixed bush veld. J. of the Grassl. Soc. of South. Afr.,5: 55-63.
13. Hart, R.H., J. Bissio, M.J. Samuel and J.W. JrWaggoner, 1993. Grazing systems, pasture size andcattle grazing behavior, distribution and gains. J.Range Manag., 46: 81-87.
14. Tainton, N.M., 1972. The relative contribution ofoverstocking and selective grazing to thedegeneration of tall grassveld in Natal. Proc. of theGrassld. Soc. of South. Afr., 7: 39-43.
African J. Basic & Appl. Sci., 7 (4): 206-218, 2015
218
15. Noy-Meir, I., M. Gutman and Y. Kaplan, 1989. 26. Van Oudtshoorn, F., 1999. Guide to grasses ofResponse of Mediterranean grassland plants to Southern Africa. 1 edition, Briza Publications,grazing and protection. J. Ecol., 77: 290-310. Pretoria, South Africa, pp: 46.
16. Morris, C.D. and N.M. Tainton, 1993. The effect of 27. Pinchak, W.E., R.H. Smith, R.H. Hart and J.W. Jr.defoliation on the regrowth of Themedia triandra Waggoner, 1991. Beef cattle distribution on foothilland Aristida junciformis subsp. junciformis. Afr. J. range. J. Range Manag., 44: 267-276.Range and Forage Sci., 10: 124-128. 28. Hart, R.H., K.W. Hepworth, M.A. Smith and J.W. Jr.
17. Bosch, O.J.H. and F.P. Janse Van Rensburg, 1987. Waggoner, 1991. Cattle grazing behavior on a foothillEcological status of species on grazing gradients on elk winter range in south eastern Wyoming. J. Rangethe shallow soils of the western grasslands biome in Manag., 44: 262-267.South Africa. J. the Grassld. Soc. of South. Afr., 29. Foran, B.D., 1980. Change in range condition with4: 143-147. distance from watering point and its implications for
18. Bosch, O.J.H. and K. Kellner, 1991. The use of a veld survey. Aust. Rangel. J., 2: 59-66.degradation gradient for the ecological interpretation 30. Perkins, J.S. and D.S.G. Thomas, 1993. Spreadingof condition assessments in the western deserts or spatially confined environmental impacts?grassland biome of southern Africa. J. Arid Environ., Land degradation and cattle ranching in the Kalahari21: 21-29. desert of Botswana. Land Degradation &
19. Hardy, M.B. and R.S. Walker, 1991. Determining Rehabilitation., 4: 179-194.sample size for assessing species composition in 31. Fusco, M., J. Holecheck, A. Tembo, A. Daniel andgrassland. J. the Grassld. Soc. of South. Afr., M. Cardenas, 1995. Grazing influences on watering8: 70-73. point vegetation in the Chihuahuan desert. J. Range
20. Tidmarsh, C.E.M. and C.M. Havenga, 1955. The Manag., 48: 32-38. wheel-point method of survey and measurement of 32. Ayana, A. and R.M.T. Baars, 2000. Ecologicalsemi-open grasslands and Karroo vegetation in condition of encroached and non- encroachedSouth Africa. Mem. Bot. Surv. S. Afr., No. 29, pp: 49. rangelands in Borana, Ethiopia. Af. J. Ecol.,Government Pinter. Pretoria. 38: 321-328.
21. Dyksterhuis, E.J., 1949. Condition and management of 33. Bogdan, A.V., 1977. Tropical pasture and fodderrangeland based on quantitative ecology. J. Range plants. Longman Inc. New York, pp: 313.Manag., 2: 104-115. 34. Ellis, J.E. and D.M. Swift, 1988. Stability of African
22. Foran, B.D., N.M. Tainton and P.DE.V. Booysen, pastoral ecosystems: alternate paradi gms and1978. The development of a method for assessing implications for development. J. Range Manag.,veld condition in three grassveld types in Natal. Proc. 41: 450-459. of the Grassld. Soc. of South. Afr.., 13: 27-33. 35. Westoby, M., B. Walker and I. Noy-Meir, 1989.
23. Andrew, M.H. and R.T. Lange, 1986. Development of Opportunistic management for rangelands not ata new piosphere in arid Chenopod shrubland grazed equilibrium. J. Range Manag., 42: 266-273.by sheep. 1. Changes to the soil surface. Aust J. 36. Van Royen, N., D. Bezuidenhout, G.K. Theron andEcol., 11: 395-409. J.DU.P. Bothma, 1990. Monitoring of vegetation
24. Friedel, M.H. and A.C. Blackmore, 1988. The around artificial watering points (windmills) in thedevelopment of veld assessment in the northern Kalahari Gemsbok National Park. Koedoe., 33: 63-68.Transvaal bushveld 1. Red turfveld. J. the Grassld. 37. Figueroa, M.E. and A.J. Davy, 1991. Response ofSoc.of South. Afr., 5: 26-38. Mediterranean grassland species to changing rainfall.
25. Beukes, P.C. and F. Ellis, 2003. Soil and vegetation J. Ecol., 79: 925-941.changes across a succulent Karoo grazing gradient.Af. J. Range and Forage Sci., 20: 11-19.
st