Embed Size (px)
Citation preview
Science for conServation 291
Impact of fire on tussock grassland invertebrate populations
Impact of fire on tussock grassland invertebrate populations
B.I.P. Barratt, C.M. Ferguson, D.M. Barton and P.D. Johnstone
Science for conServation 291
Published by
Publishing Team
Department of Conservation
PO Box 10420, The Terrace
Wellington 6143, New Zealand
Cover: A smouldering summer burn plot at Mount Benger. Photo: Barbara Barratt.
Science for Conservation is a scientific monograph series presenting research funded by New Zealand
Department of Conservation (DOC). Manuscripts are internally and externally peer-reviewed; resulting
publications are considered part of the formal international scientific literature.
Individual copies are printed, and are also available from the departmental website in pdf form. Titles
are listed in our catalogue on the website, refer www.doc.govt.nz under Publications, then Science &
technical.
© Copyright March 2009, New Zealand Department of Conservation
ISSN 1173–2946 (hardcopy)
ISSN 1177–9241 (web PDF)
ISBN 978–0–478–14577–9 (hardcopy)
ISBN 978–0–478–14578–6 (web PDF)
This report was prepared for publication by the Publishing Team; editing by Helen O’Leary and layout
by Amanda Todd. Publication was approved by the General Manager, Research and Development Group,
Department of Conservation, Wellington, New Zealand.
In the interest of forest conservation, we support paperless electronic publishing. When printing,
recycled paper is used wherever possible.
CONTeNTS
Abstract 5
1. Introduction 6
1.1 Background 7
1.2 Objectives 9
2. Methods 10
2.1 Sites 10
2.2 Treatments 11
2.3 Invertebrate sampling 13
2.4 Invertebrate extraction and processing 13
2.5 Statistical analyses 14
3. Results 16
3.1 Deep Stream versus Mount Benger invertebrate communities 16
3.1.1 Taxonomic composition 16
3.1.2 Trophic composition 17
3.2 effect of burning treatments on invertebrate density 18
3.2.1 Deep Stream 19
3.2.2 Mount Benger 22
3.2.3 Summary 24
3.3 effect of burning treatments on community trophic structure 25
3.3.1 2–3 months post-burn 25
3.3.2 3 years post-burn 25
3.4 Coleoptera: a detailed study 28
3.4.1 Density, species composition and effect of burn treatments 28
3.4.2 Species richness 30
3.4.3 Species diversity 31
3.4.4 Rank-abundance patterns 33
3.4.5 Community trophic structure and response to treatments 35
3.4.6 exotic component of the community 36
4. Discussion 39
4.1 Comparisons between Deep Stream and Mount Benger
invertebrate communities 39
4.1.1 Taxonomic composition 39
4.1.2 Trophic composition 40
4.2 Invertebrate responses to burning 40
4.3 Seasonal effect of burning on invertebrates 42
4.4 effect of burning treatments on community trophic structure 43
4.4.1 Herbivore response 43
4.4.2 Carnivore response 44
4.4.3 Detritivore response 44
4.4.4 Fungivore response 44
4.5 Coleoptera: a detailed study 44
4.5.1 effect of treatments on species richness 45
4.5.2 Species diversity and rank abundance patterns 46
4.5.3 Trophic structure and response to treatments 46
4.5.4 exotic component of the community 47
4.6 Limitations of this study 47
5. Conclusions 48
6. Recommendations 49
7. Acknowledgements 49
8. References 50
Appendix 1
Taxonomic groups and common names of invertebrates identified 55
Appendix 2
Coleoptera taxa found at Deep Stream and Mount Benger 57
Appendix 3
Notes on identification and ecology of some species 63
Appendix 4
Mean density of invertebrate groups at Deep Stream 65
Appendix 5
Mean density of invertebrate groups at Mount Benger 70
Appendix 6
Summary of Coleoptera taxa recorded at Deep Stream (DS) and Mount
Benger (MB) 75
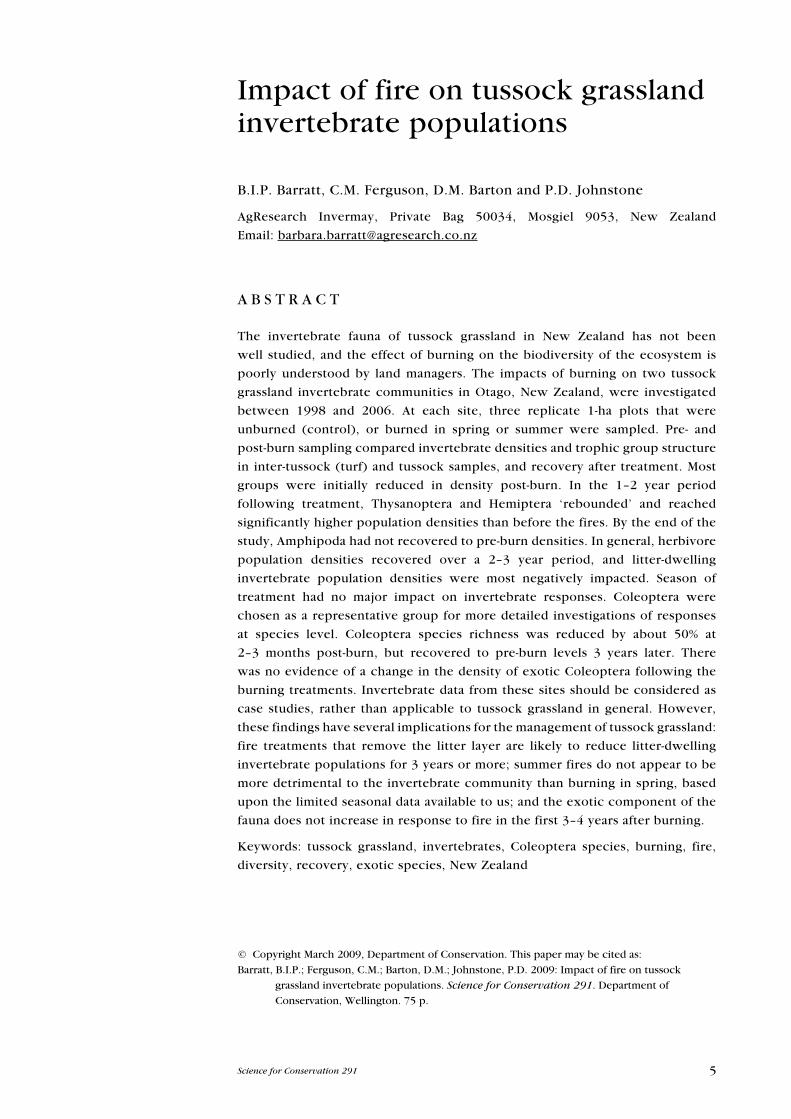
5Science for Conservation 291
© Copyright March 2009, Department of Conservation. This paper may be cited as:
Barratt, B.I.P.; Ferguson, C.M.; Barton, D.M.; Johnstone, P.D. 2009: Impact of fire on tussock
grassland invertebrate populations. Science for Conservation 291. Department of
Conservation, Wellington. 75 p.
Impact of fire on tussock grassland invertebrate populations
B.I.P. Barratt, C.M. Ferguson, D.M. Barton and P.D. Johnstone
AgResearch Invermay, Private Bag 50034, Mosgiel 9053, New Zealand
email: [email protected]
A B S T R A C T
The invertebrate fauna of tussock grassland in New Zealand has not been
well studied, and the effect of burning on the biodiversity of the ecosystem is
poorly understood by land managers. The impacts of burning on two tussock
grassland invertebrate communities in Otago, New Zealand, were investigated
between 1998 and 2006. At each site, three replicate 1-ha plots that were
unburned (control), or burned in spring or summer were sampled. Pre- and
post-burn sampling compared invertebrate densities and trophic group structure
in inter-tussock (turf) and tussock samples, and recovery after treatment. Most
groups were initially reduced in density post-burn. In the 1–2 year period
following treatment, Thysanoptera and Hemiptera ‘rebounded’ and reached
significantly higher population densities than before the fires. By the end of the
study, Amphipoda had not recovered to pre-burn densities. In general, herbivore
population densities recovered over a 2–3 year period, and litter-dwelling
invertebrate population densities were most negatively impacted. Season of
treatment had no major impact on invertebrate responses. Coleoptera were
chosen as a representative group for more detailed investigations of responses
at species level. Coleoptera species richness was reduced by about 50% at
2–3 months post-burn, but recovered to pre-burn levels 3 years later. There
was no evidence of a change in the density of exotic Coleoptera following the
burning treatments. Invertebrate data from these sites should be considered as
case studies, rather than applicable to tussock grassland in general. However,
these findings have several implications for the management of tussock grassland:
fire treatments that remove the litter layer are likely to reduce litter-dwelling
invertebrate populations for 3 years or more; summer fires do not appear to be
more detrimental to the invertebrate community than burning in spring, based
upon the limited seasonal data available to us; and the exotic component of the
fauna does not increase in response to fire in the first 3–4 years after burning.
Keywords: tussock grassland, invertebrates, Coleoptera species, burning, fire,
diversity, recovery, exotic species, New Zealand
6 Barratt et al.—Impact of fire on tussock invertebrates
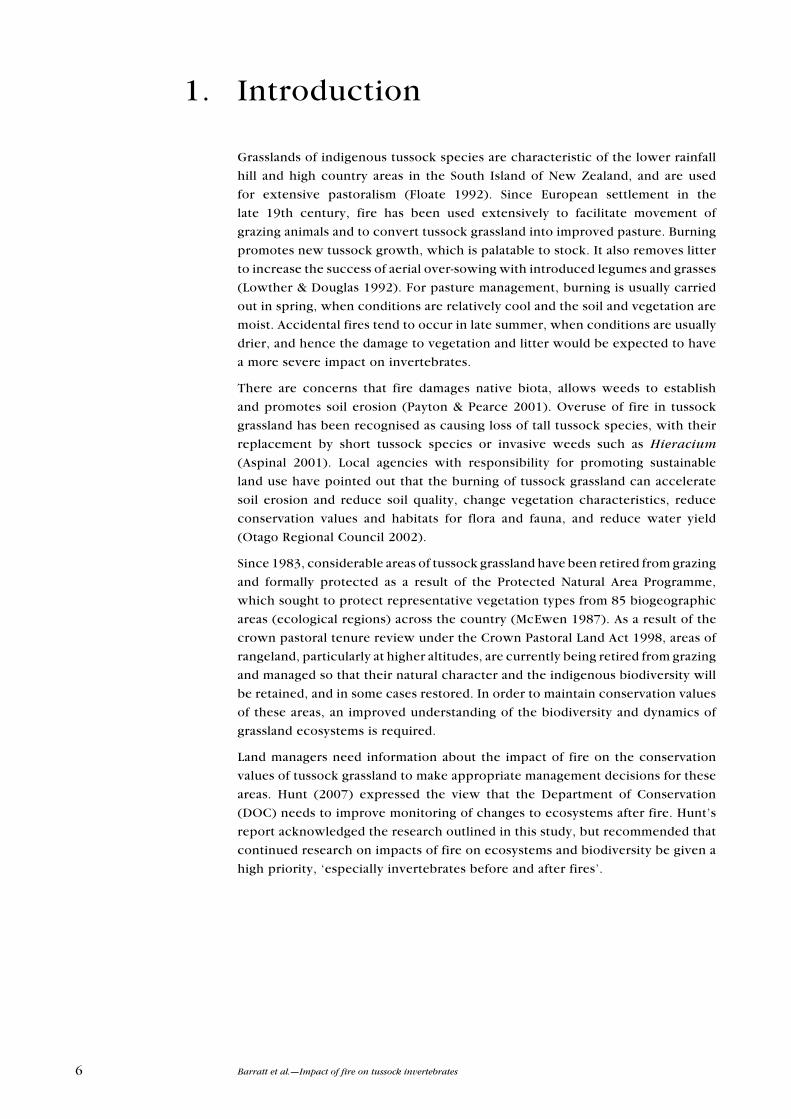
1. Introduction
Grasslands of indigenous tussock species are characteristic of the lower rainfall
hill and high country areas in the South Island of New Zealand, and are used
for extensive pastoralism (Floate 1992). Since european settlement in the
late 19th century, fire has been used extensively to facilitate movement of
grazing animals and to convert tussock grassland into improved pasture. Burning
promotes new tussock growth, which is palatable to stock. It also removes litter
to increase the success of aerial over-sowing with introduced legumes and grasses
(Lowther & Douglas 1992). For pasture management, burning is usually carried
out in spring, when conditions are relatively cool and the soil and vegetation are
moist. Accidental fires tend to occur in late summer, when conditions are usually
drier, and hence the damage to vegetation and litter would be expected to have
a more severe impact on invertebrates.
There are concerns that fire damages native biota, allows weeds to establish
and promotes soil erosion (Payton & Pearce 2001). Overuse of fire in tussock
grassland has been recognised as causing loss of tall tussock species, with their
replacement by short tussock species or invasive weeds such as Hieracium
(Aspinal 2001). Local agencies with responsibility for promoting sustainable
land use have pointed out that the burning of tussock grassland can accelerate
soil erosion and reduce soil quality, change vegetation characteristics, reduce
conservation values and habitats for flora and fauna, and reduce water yield
(Otago Regional Council 2002).
Since 1983, considerable areas of tussock grassland have been retired from grazing
and formally protected as a result of the Protected Natural Area Programme,
which sought to protect representative vegetation types from 85 biogeographic
areas (ecological regions) across the country (Mcewen 1987). As a result of the
crown pastoral tenure review under the Crown Pastoral Land Act 1998, areas of
rangeland, particularly at higher altitudes, are currently being retired from grazing
and managed so that their natural character and the indigenous biodiversity will
be retained, and in some cases restored. In order to maintain conservation values
of these areas, an improved understanding of the biodiversity and dynamics of
grassland ecosystems is required.
Land managers need information about the impact of fire on the conservation
values of tussock grassland to make appropriate management decisions for these
areas. Hunt (2007) expressed the view that the Department of Conservation
(DOC) needs to improve monitoring of changes to ecosystems after fire. Hunt’s
report acknowledged the research outlined in this study, but recommended that
continued research on impacts of fire on ecosystems and biodiversity be given a
high priority, ‘especially invertebrates before and after fires’.
7Science for Conservation 291
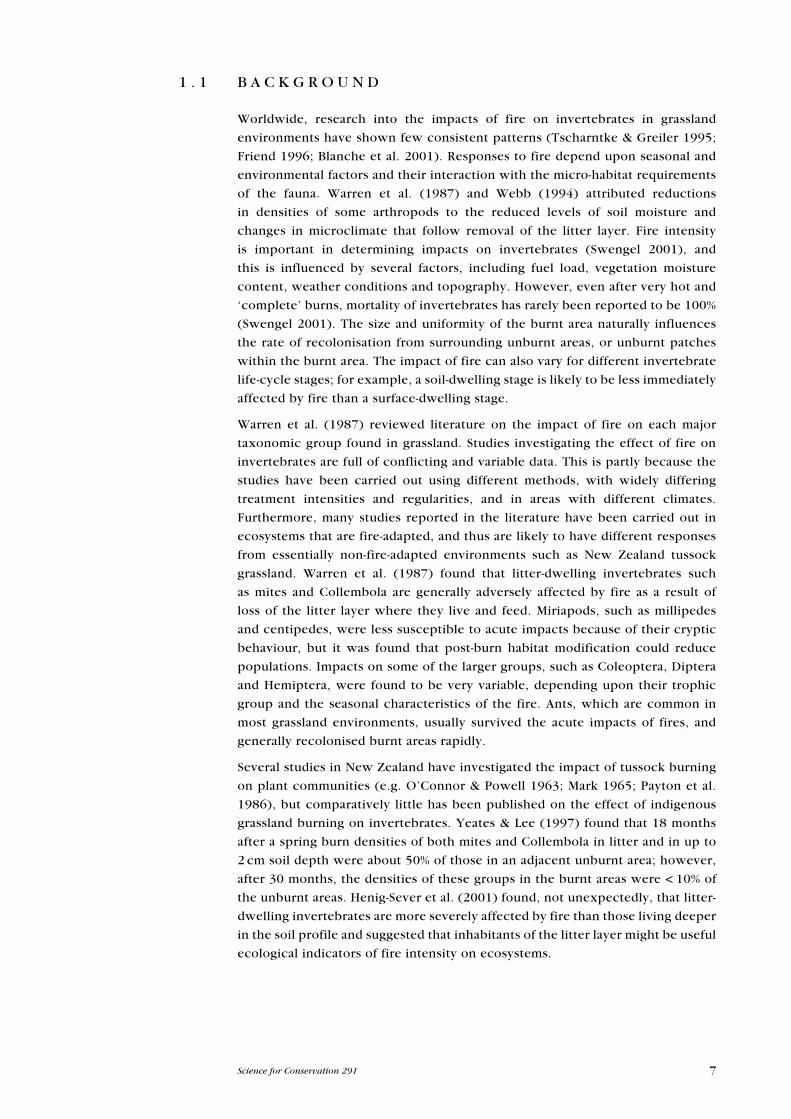
1 . 1 B A C K G R O u N D
Worldwide, research into the impacts of fire on invertebrates in grassland
environments have shown few consistent patterns (Tscharntke & Greiler 1995;
Friend 1996; Blanche et al. 2001). Responses to fire depend upon seasonal and
environmental factors and their interaction with the micro-habitat requirements
of the fauna. Warren et al. (1987) and Webb (1994) attributed reductions
in densities of some arthropods to the reduced levels of soil moisture and
changes in microclimate that follow removal of the litter layer. Fire intensity
is important in determining impacts on invertebrates (Swengel 2001), and
this is influenced by several factors, including fuel load, vegetation moisture
content, weather conditions and topography. However, even after very hot and
‘complete’ burns, mortality of invertebrates has rarely been reported to be 100%
(Swengel 2001). The size and uniformity of the burnt area naturally influences
the rate of recolonisation from surrounding unburnt areas, or unburnt patches
within the burnt area. The impact of fire can also vary for different invertebrate
life-cycle stages; for example, a soil-dwelling stage is likely to be less immediately
affected by fire than a surface-dwelling stage.
Warren et al. (1987) reviewed literature on the impact of fire on each major
taxonomic group found in grassland. Studies investigating the effect of fire on
invertebrates are full of conflicting and variable data. This is partly because the
studies have been carried out using different methods, with widely differing
treatment intensities and regularities, and in areas with different climates.
Furthermore, many studies reported in the literature have been carried out in
ecosystems that are fire-adapted, and thus are likely to have different responses
from essentially non-fire-adapted environments such as New Zealand tussock
grassland. Warren et al. (1987) found that litter-dwelling invertebrates such
as mites and Collembola are generally adversely affected by fire as a result of
loss of the litter layer where they live and feed. Miriapods, such as millipedes
and centipedes, were less susceptible to acute impacts because of their cryptic
behaviour, but it was found that post-burn habitat modification could reduce
populations. Impacts on some of the larger groups, such as Coleoptera, Diptera
and Hemiptera, were found to be very variable, depending upon their trophic
group and the seasonal characteristics of the fire. Ants, which are common in
most grassland environments, usually survived the acute impacts of fires, and
generally recolonised burnt areas rapidly.
Several studies in New Zealand have investigated the impact of tussock burning
on plant communities (e.g. O’Connor & Powell 1963; Mark 1965; Payton et al.
1986), but comparatively little has been published on the effect of indigenous
grassland burning on invertebrates. Yeates & Lee (1997) found that 18 months
after a spring burn densities of both mites and Collembola in litter and in up to
2 cm soil depth were about 50% of those in an adjacent unburnt area; however,
after 30 months, the densities of these groups in the burnt areas were < 10% of
the unburnt areas. Henig-Sever et al. (2001) found, not unexpectedly, that litter-
dwelling invertebrates are more severely affected by fire than those living deeper
in the soil profile and suggested that inhabitants of the litter layer might be useful
ecological indicators of fire intensity on ecosystems.
8 Barratt et al.—Impact of fire on tussock invertebrates
In 1960, the Tussock Grasslands and Mountain Lands Institute (TGMLI) was set
up to assist farming in tussock grassland, and Graeme White, employed by the
TGMLI, emphasised the importance of understanding insect population dynamics
if management was to be successful (White 1972). Invertebrate biodiversity
and ecology in tussock grassland in Otago is not well known, although the
body of knowledge is steadily increasing. As for the New Zealand invertebrate
fauna in general, studies have indicated that the fauna exhibits a high degree
of endemism. One of the earliest papers on tussock grassland insects reported
on a study in Canterbury, where damage to tussock plants from noctuids and
other Lepidoptera was described, and Odontria (Coleoptera: Scarabaeidae)
larvae were found to be killing patches of grasses (Dick 1940). The author noted
that run-holders believed that burning tussock in spring reduced the numbers of
caterpillars found in tussock plants.
In 1978, the senior author was appointed to work on tussock grassland
entomology in Otago. The work, as in Canterbury, was mainly applied with
emphases on the ecology and management of the striped chafer (Odontria
striata White), and pests of white clover (Trifolium repens L.) seedlings
oversown into tussock. Research on these two topics was prompted by the
concerns of farmers and researchers, respectively, and the studies resulted
in a series of publications (Barratt 1982a, b, 1983; Barratt & Campbell 1982;
Barratt & Johnstone 1984; Barratt & Lauren 1984). However, it was Brian Patrick,
a well-known lepidopterist, who really laid the foundation for our current
knowledge of tussock grassland insect biodiversity and ecology, by instigating
a series of collecting trips with colleagues to tussock grassland sites throughout
Otago and Southland, which resulted in a series of reports and publications
(Patrick et al. 1984, 1985a, b, 1986, 1993a, b, 1987; Barratt & Patrick 1987;
Patrick & Barratt 1988, 1989; Patrick 1991, 1994; Dickinson et al. 1998).
Since then, there have been a number of students at the university of Otago,
Dunedin, under the guidance of Prof. Katherine Dickinson, who have focussed
their ecological studies on tussock grassland, some of whom have used the sites
that are the topic of this report (Derraik et al. 2001, 2002, 2003; Murray 2001;
Goodman 2002; Murray et al. 2003, 2006; Dixon 2004; Rate 2005; Scott 2007).
Recently, a student at Lincoln university, Christchurch, has initiated a PhD study
of spiders at the Deep Stream site.
Since we still know so little about the composition of tussock grassland
invertebrate communities, we use Coleoptera as a surrogate group in this
report. Coleoptera are a suitable group for this because they are speciose, they
include representatives of all trophic groups and they are reasonably well known
taxonomically (Hutcheson et al. 1999). Furthermore, Bulan & Barrett (1971),
working in cereal plots in Ohio, uSA, found that the responses of Coleoptera to
fire were representative of the rest of the arthropod community, and reported
that changes in biomass and species diversity were good measures for evaluating
the impact of fire.
9Science for Conservation 291
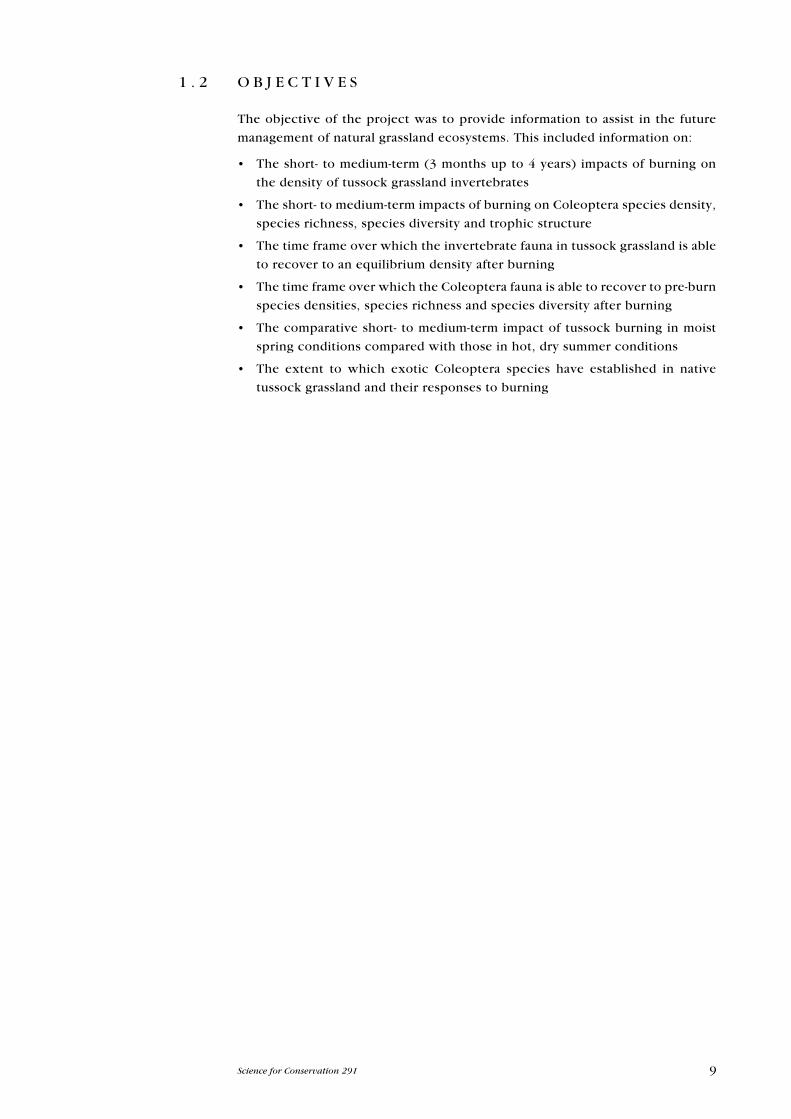
1 . 2 O B J e C T I v e S
The objective of the project was to provide information to assist in the future
management of natural grassland ecosystems. This included information on:
The short- to medium-term (3 months up to 4 years) impacts of burning on •
the density of tussock grassland invertebrates
The short- to medium-term impacts of burning on Coleoptera species density, •
species richness, species diversity and trophic structure
The time frame over which the invertebrate fauna in tussock grassland is able •
to recover to an equilibrium density after burning
The time frame over which the Coleoptera fauna is able to recover to pre-burn •
species densities, species richness and species diversity after burning
The comparative short- to medium-term impact of tussock burning in moist •
spring conditions compared with those in hot, dry summer conditions
The extent to which exotic Coleoptera species have established in native •
tussock grassland and their responses to burning
10 Barratt et al.—Impact of fire on tussock invertebrates
2. Methods
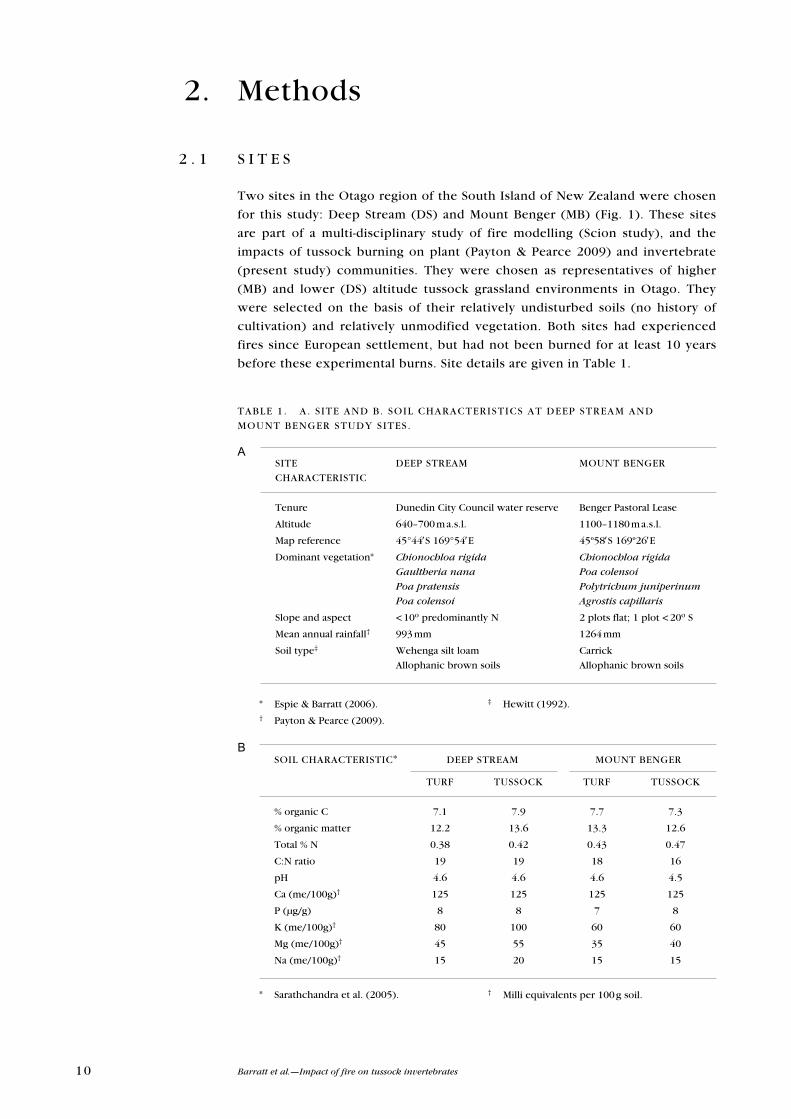
2 . 1 S I T e S
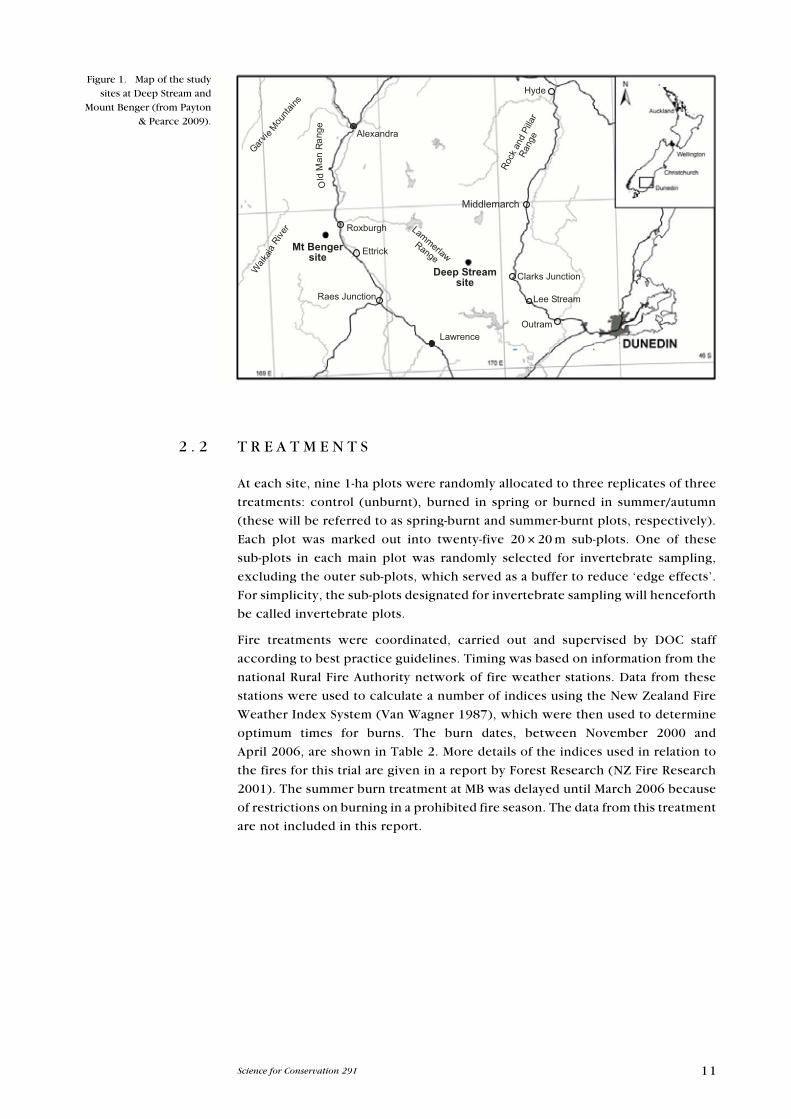
Two sites in the Otago region of the South Island of New Zealand were chosen
for this study: Deep Stream (DS) and Mount Benger (MB) (Fig. 1). These sites
are part of a multi-disciplinary study of fire modelling (Scion study), and the
impacts of tussock burning on plant (Payton & Pearce 2009) and invertebrate
(present study) communities. They were chosen as representatives of higher
(MB) and lower (DS) altitude tussock grassland environments in Otago. They
were selected on the basis of their relatively undisturbed soils (no history of
cultivation) and relatively unmodified vegetation. Both sites had experienced
fires since european settlement, but had not been burned for at least 10 years
before these experimental burns. Site details are given in Table 1.
TABLe 1. A. S ITe AND B. SOIL CHARACTeRISTICS AT DeeP STReAM AND
MOuNT BeNGeR STuDY SITeS.
SOIL CHARACTeRISTIC* DeeP STReAM MOuNT BeNGeR
TuRF TuSSOCK TuRF TuSSOCK
% organic C 7.1 7.9 7.7 7.3
% organic matter 12.2 13.6 13.3 12.6
Total % N 0.38 0.42 0.43 0.47
C:N ratio 19 19 18 16
pH 4.6 4.6 4.6 4.5
Ca (me/100g)† 125 125 125 125
P (μg/g) 8 8 7 8
K (me/100g)† 80 100 60 60
Mg (me/100g)† 45 55 35 40
Na (me/100g)† 15 20 15 15
B
* Sarathchandra et al. (2005). † Milli equivalents per 100 g soil.
ASITe DeeP STReAM MOuNT BeNGeR
CHARACTeRISTIC
Tenure Dunedin City Council water reserve Benger Pastoral Lease
Altitude 640–700 m a.s.l. 1100–1180 m a.s.l.
Map reference 45°44′S 169°54′e 45º58′S 169º26′e
Dominant vegetation* Chionochloa rigida Chionochloa rigida
Gaultheria nana Poa colensoi
Poa pratensis Polytrichum juniperinum
Poa colensoi Agrostis capillaris
Slope and aspect < 10o predominantly N 2 plots flat; 1 plot < 20o S
Mean annual rainfall† 993 mm 1264 mm
Soil type‡ Wehenga silt loam Carrick
Allophanic brown soils Allophanic brown soils
* espie & Barratt (2006).† Payton & Pearce (2009).
‡ Hewitt (1992).
11Science for Conservation 291
2 . 2 T R e A T M e N T S
At each site, nine 1-ha plots were randomly allocated to three replicates of three
treatments: control (unburnt), burned in spring or burned in summer/autumn
(these will be referred to as spring-burnt and summer-burnt plots, respectively).
each plot was marked out into twenty-five 20 × 20 m sub-plots. One of these
sub-plots in each main plot was randomly selected for invertebrate sampling,
excluding the outer sub-plots, which served as a buffer to reduce ‘edge effects’.
For simplicity, the sub-plots designated for invertebrate sampling will henceforth
be called invertebrate plots.
Fire treatments were coordinated, carried out and supervised by DOC staff
according to best practice guidelines. Timing was based on information from the
national Rural Fire Authority network of fire weather stations. Data from these
stations were used to calculate a number of indices using the New Zealand Fire
Weather Index System (van Wagner 1987), which were then used to determine
optimum times for burns. The burn dates, between November 2000 and
April 2006, are shown in Table 2. More details of the indices used in relation to
the fires for this trial are given in a report by Forest Research (NZ Fire Research
2001). The summer burn treatment at MB was delayed until March 2006 because
of restrictions on burning in a prohibited fire season. The data from this treatment
are not included in this report.
���������������
�������������
��������������
����������
���������������
�����������
����
���������
�������������
���
���
���
��
����
��
�����
���
�
������������ ���������
�����
�������������
�����
��������
�������
Figure 1. Map of the study sites at Deep Stream and
Mount Benger (from Payton & Pearce 2009).
12 Barratt et al.—Impact of fire on tussock invertebrates
TReATMeNT/ DATe PLOT
SAMPLe 1 2 3 4 5 6 7 8 9
Deep Stream
Control × × ×
Spring burn 2 Oct 2001 × × ×
Summer burn 7 Mar 2001 × × ×
Samples 3 Apr 1998 × × × × × × × × ×
19 Aug 1998 × × × × × ×
11 Jan 1999 × × × × × × × × ×
14 Sept 1999 × × × × × ×
6 Jan 2000 × × × × × × × × ×
18 Sept 2000 × × × × × ×
12 Jan 2001 × × × × × × × × ×
9 Mar 2001 × × × × × × 24 Sept 2001 × × × × × ×
5 Oct 2001 × × × × × ×
11 Jan 2002 × × × × × × × × × 17 Jan 2003 × × × × × × × × × 6 Jan 2004 × × × × × × × × × 11 Jan 2005 × × × × × × × × ×Mount Benger
Control × × ×
Spring burn 3 Nov 2000 × × ×
Summer burn 31 Mar 2006 × × ×
Samples 15 Apr 1998 × × × × × × × × ×
26 May 1998 × × × × × × × × ×
13 Jan 1999 × × × × × × × × ×
20 Sept 1999 × × × × × ×
7 Jan 2000 × × × × × × × × ×
20 Sept 2000 × × × × × ×
10 Nov 2000 × × × × × × 15 Jan 2001 × × × × × × × × × 14 Jan 2002 × × × × × × × × × 8 Jan 2003 × × × × × × × × × 16 Jan 2004 × × × × × × × × × Jan 2005 × × × × × × × × × Apr 2006 × × × × × ×
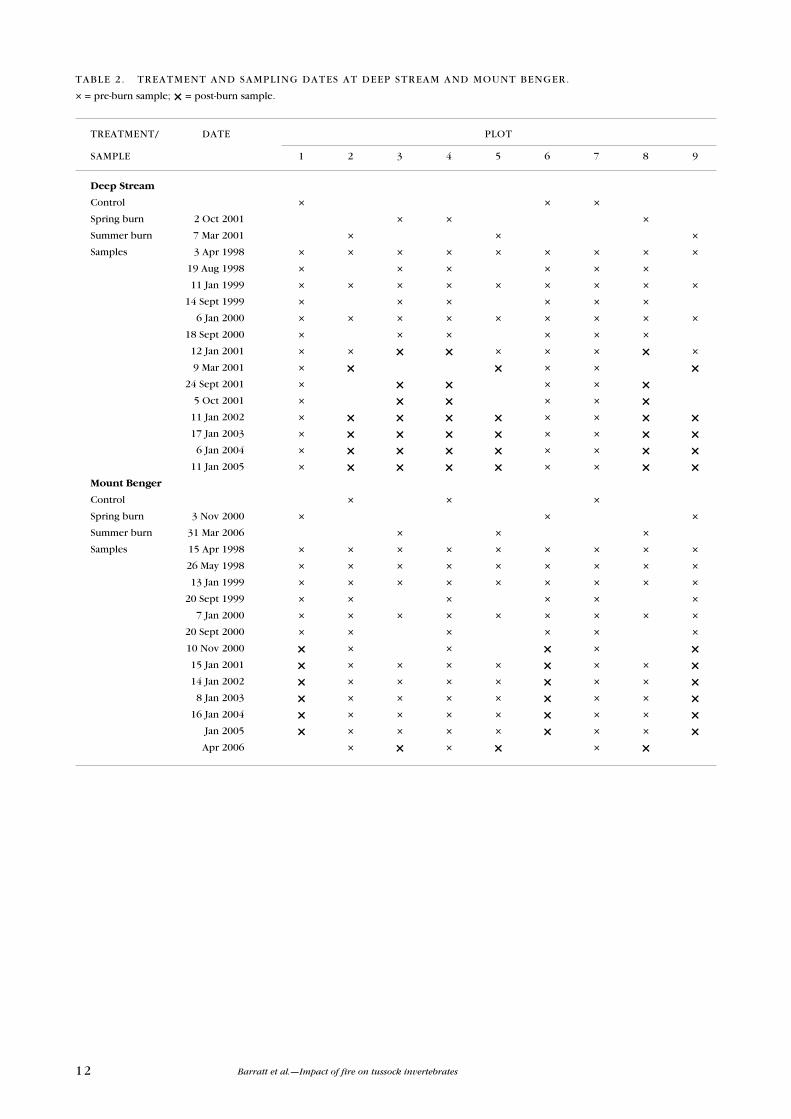
TABLe 2. TReATMeNT AND SAMPLING DATeS AT DeeP STReAM AND MOuNT BeNGeR.
× = pre-burn sample; × = post-burn sample.
13Science for Conservation 291
2 . 3 I N v e R T e B R A T e S A M P L I N G
Invertebrate sampling dates for each site are shown in Table 2. Not all invertebrate
plots were sampled on each sampling date; for example, where a spring burn
had been carried out, only the control and spring-burnt plots were sampled, and
not the plots to be burned in summer. Invertebrates were sampled quantitatively
using a 320 × 320 mm quadrat (0.1 m2) as a guide and cutting turves with a spade to
a depth of approximately 50 mm. The invertebrates extracted from these samples
(see below) provided a measure of density (number/m2). For each sample date
(Table 2), twenty 0.1-m2 inter-tussock (‘turf’) samples were taken by throwing
the quadrat and cutting turves in a general pattern of four rows of five turves
from within the invertebrate plots. In addition, in each invertebrate plot, nine
samples (three rows of three) were taken as above, but which included a tussock
(Chionochloa rigida) plant (‘tussock samples’). Thus, on a date when all plots
were sampled, a total of 180 turf samples and 81 tussock samples were taken
from each site. Care was taken to avoid resampling areas that had been sampled
previously.
All samples were individually bagged, transported to AgResearch Invermay, and
stored at 4°C for a maximum of 3 weeks before processing (Bremner 1988).
2 . 4 I N v e R T e B R A T e e x T R A C T I O N A N D P R O C e S S I N G
In the laboratory, invertebrates were extracted from each turf sample over a
7-day period using modified Tullgren funnel heat extractors (Crook et al. 2004).
Sample extraction was arranged to avoid differential storage of treatments and
plots. After extraction from turves, the invertebrates were stored in 70% ethanol
at 4°C until sorting.
Samples were washed through fine muslin, which retained all invertebrates
but allowed fine silt to pass though. The ‘cleared’ samples were then sorted
and invertebrates counted under a 6.3–40× binocular microscope. A list of
the 55 taxonomic groups into which invertebrates were identified is shown in
Appendix 1, which also gives common names where possible. The only groups
not identified and counted for each sampling date were Collembola and Acari,
although for some dates these have been further subsampled and identified to
family (Barratt et al. 2006); the Collembola and Acari from all other dates have
been retained for future study.
Coleoptera were identified to species, so that further analysis at species level
(species richness/diversity) could be carried out on a representative insect group.
Adult Coleoptera were identified to morphospecies (recognisable taxonomic
units) or, where possible, to species level. Larval Coleoptera were identified
to family, but identification beyond this was rarely possible. In the Coleoptera
species analyses, larval morphospecies are included as separate taxa even though
this is likely to over-estimate species numbers. This is because it is impossible in
most cases to match larvae with adults, and this also allows for the fact that larvae
and adults are sometimes in different trophic groups, occupying different niches
and in general performing different functions in the community.
14 Barratt et al.—Impact of fire on tussock invertebrates
The higher taxonomic groups were allocated to the functional categories of
herbivores, carnivores, fungivores and detritivores. Carrion-feeders (Coleoptera:
Dermestidae) were also present, but at densities too low to be worthwhile
including in the analyses. In some cases where taxa comprised either sub-groups
that varied in feeding characteristics (e.g. Lepidoptera larvae can be herbivores
or detritivores), or where adults and larvae belonged in different groups (e.g.
Lepidoptera again, where adults are often nectar feeders), a judgement was made
on the predominant function for the particular taxon. Trophic group could not
always be allocated with complete confidence, but the literature was consulted
as far as possible to assist (e.g. Klimaszewski & Watt 1997).
A species list for Coleoptera from both sites is shown in Appendix 2, along
with their native/adventive status and allocation to trophic group. The higher
taxonomic classification of Leschen et al. (2003) was used for guidance on
native/exotic status, although this was not available at the species level.
The January 2001 tussock Coleoptera samples for DS were identified for the
spring-burnt plots but not for the control and summer-burnt plots. Regrettably,
this omission was discovered too late to be rectified and limits our scope for data
analysis for that date.
All invertebrate material has been stored fully labelled in 70% ethanol. The material
identified to major groups has been separated and stored in vials. Collembola
(springtails) and Acari have been stored together with the material retained by
the muslin after filtering.
2 . 5 S T A T I S T I C A L A N A L Y S e S
Invertebrate density data and the proportion of individuals in each trophic group
were analysed for each site using restricted maximum likelihood (ReML, which
is a method for fitting linear mixed models producing unbiased estimates of
variance) to model the effect of treatments and dates and their interactions on
the loge counts of number of individuals (Payne et al. 2006).
For the more detailed analyses of coleopteran species density data, a similarity
matrix for the nine plots from DS and six plots (three replicates of control and
spring-burnt plots) from MB was calculated using a euclidean metric (which was
considered appropriate since distance measures are on a continuous rather than
a discontinuous scale). From this, a distance matrix (using distances between
the individual plot data points) was obtained as (2(1 – similarity))0.5. This was
used for non-metric multidimensional scaling (MDS) using two dimensions
(Payne et al. 2006) for Coleoptera species density data to obtain a visual
assessment of the degree of similarity between the sites, and the treatment plots
within the sites.
Coleopteran species richness (number of species present per plot) was calculated
for the turf and tussock samples for each plot at each site on each date. Restricted
maximum likelihood was used to model the effect of site, treatment and date and
their interactions on the loge species richness counts (Payne et al. 2006).
15Science for Conservation 291
Coleopteran species diversity was examined by calculating Shannon-Wiener
indices of diversity (H) for each plot at each site on each date. This index is
probably the most commonly used measure of biodiversity, and takes into
account the number of species and the number of individuals of each species
in the sample. Restricted maximum likelihood was used to model the effect of
site, treatment and date and their interactions on the indices (Payne et al. 2006).
Changes in coleopteran species diversity following burning treatments were also
investigated using k-dominance plots. These plots were used in addition to the
Shannon-Wiener index because they give a good visual appreciation of the data
showing all data points and the shape of the curve provides an indication of
dominance (steep plots) or evenness (shallow curves) of species assemblages.
Log10 density was ranked for Coleoptera species and plotted against cumulative
percentage density. This produced curves in which the most diverse samples
appear on the lower part of the plot. The pre-burn and post-burn data were
compared for the same plots for DS and MB spring-burnt turf plots and for DS
summer-burnt turf plots. Comparisons were not possible for DS summer-burnt
tussock plots, as the pre-burn data were not available. There are no pre-burn and
post-burn comparisons for the MB summer-burnt plots because of the late date
(31 March 2006) of the MB summer burn.
The percentage of Coleoptera in each of five trophic groups and the percentage of
exotic Coleoptera species were calculated for each plot at each site on each date.
Restricted maximum likelihood was used to model the effect of site, treatment
and date and their interactions.
16 Barratt et al.—Impact of fire on tussock invertebrates
3. Results
Between April 1998 and April 2006, a total of 6177 0.1-m2 samples were
taken from the nine 1-ha treatment plots at DS and MB. Approximately
1.26 million invertebrates were extracted, identified and counted from the
samples collected.
Two burn treatments were successfully undertaken on treatment plots at DS
in March (summer burn) and October (spring burn) 2001. At MB, the spring
burning treatment was carried out in November 2000. However, as noted above,
it was not possible to conduct the summer burn at MB until March 2006.
3 . 1 D e e P S T R e A M v e R S u S M O u N T B e N G e R I N v e R T e B R A T e C O M M u N I T I e S
At DS, the mean density of all invertebrates in control plots over the study period
was 4018 individuals/m2 in turf samples and 3059 individuals/m2 in tussock
samples. The equivalent mean values at MB were 2309 individuals/m2 and
2644 individuals/m2, respectively.
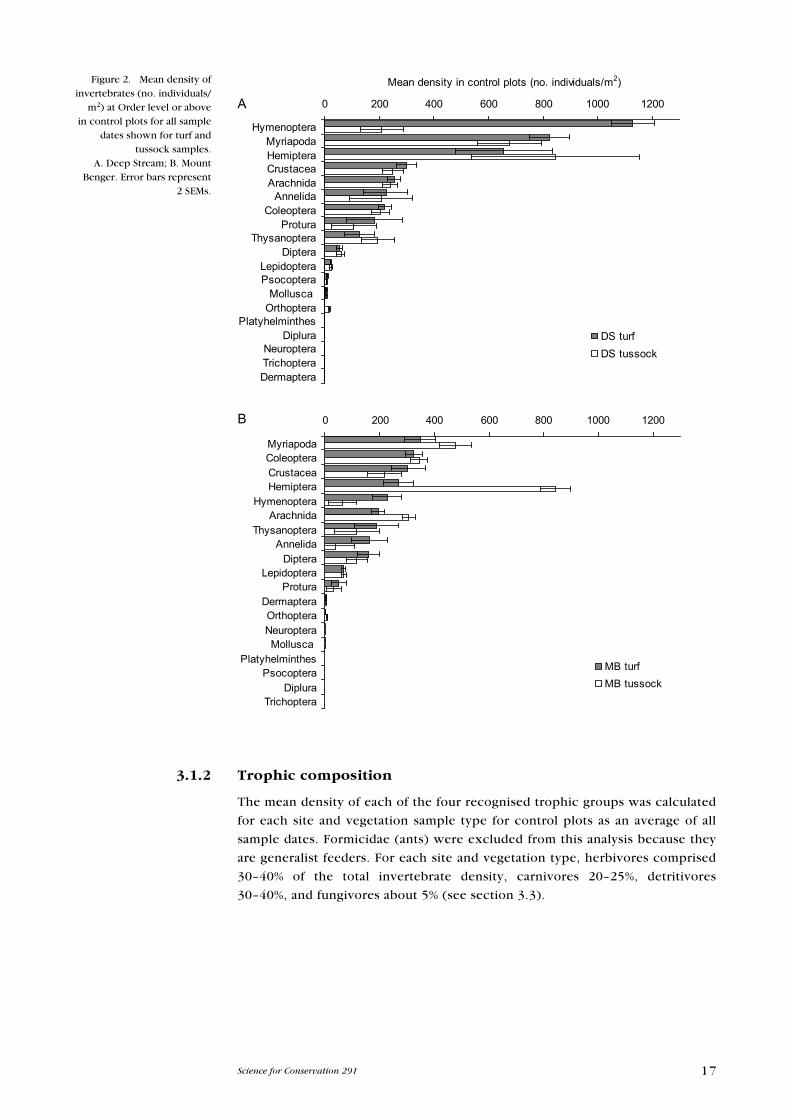
3.1.1 Taxonomic composition
At the higher taxonomic levels (i.e. order and above), the composition of the
communities at the two sites was similar, with the exception of Hymenoptera
(mainly ants), which were present at a higher density at DS than at MB (Fig. 2).
Hymenoptera occurred at a higher density than any other group at DS, with
their mean density in turf samples (averaged across all control plot samples
throughout the study) reaching > 1100 individuals/m2. This was almost 30% of
all the invertebrates present in the DS turf samples. At MB, the hymenopteran
population was ranked at the fifth highest density; the Myriapoda were recorded
at the highest density (348 individuals/m2), although densities here were lower
than at DS (Fig. 2).
At DS, turf and tussock samples contained similar densities of the different
invertebrate groups, with the exception of Hymenoptera, which were present
at a far greater density in the turf than the tussock samples. Myriapoda densities
were higher than other groups in tussock samples at DS. At MB, the greatest
difference between turf and tussock samples was in the density of Hemiptera;
the Pseudococcidae was by far the largest family in this group in terms of number
of individuals, and their density was higher in the tussock samples than in turf
samples.
Notes on a few of the taxa collected and their ecology are given in Appendix 3.
17Science for Conservation 291
3.1.2 Trophic composition
The mean density of each of the four recognised trophic groups was calculated
for each site and vegetation sample type for control plots as an average of all
sample dates. Formicidae (ants) were excluded from this analysis because they
are generalist feeders. For each site and vegetation type, herbivores comprised
30–40% of the total invertebrate density, carnivores 20–25%, detritivores
30–40%, and fungivores about 5% (see section 3.3).
Figure 2. Mean density of invertebrates (no. individuals/
m2) at Order level or above in control plots for all sample
dates shown for turf and tussock samples.
A. Deep Stream; B. Mount Benger. error bars represent
2 SeMs.
0 200 400 600 800 1000 1200
HymenopteraMyriapodaHemipteraCrustaceaArachnida
AnnelidaColeoptera
ProturaThysanoptera
DipteraLepidopteraPsocoptera
Mollusca Orthoptera
PlatyhelminthesDiplura
NeuropteraTrichopteraDermaptera
DS turf DS tussock
Mean density in control plots (no. individuals/m2)
A
0 200 400 600 800 1000 1200
MyriapodaColeopteraCrustaceaHemiptera
HymenopteraArachnida
ThysanopteraAnnelida
DipteraLepidoptera
ProturaDermapteraOrthopteraNeuropteraMollusca
PlatyhelminthesPsocoptera
DipluraTrichoptera
MB turfMB tussock
B
18 Barratt et al.—Impact of fire on tussock invertebrates
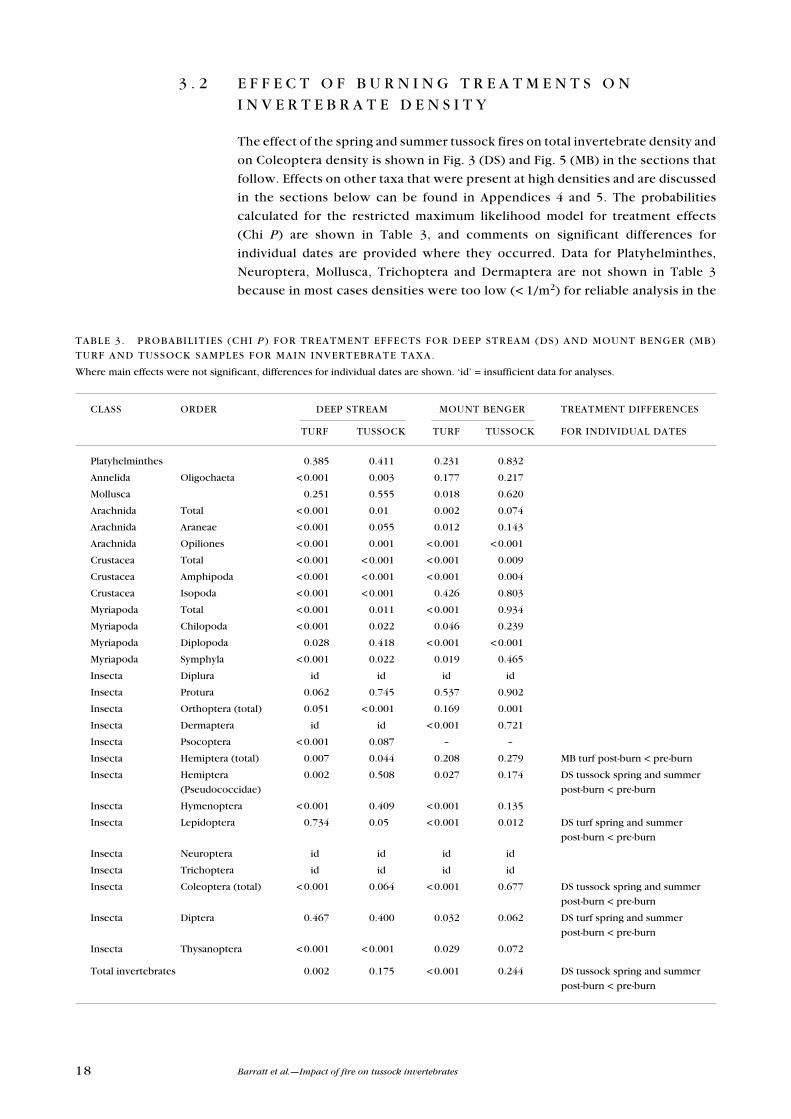
3 . 2 e F F e C T O F B u R N I N G T R e A T M e N T S O N I N v e R T e B R A T e D e N S I T Y
The effect of the spring and summer tussock fires on total invertebrate density and
on Coleoptera density is shown in Fig. 3 (DS) and Fig. 5 (MB) in the sections that
follow. effects on other taxa that were present at high densities and are discussed
in the sections below can be found in Appendices 4 and 5. The probabilities
calculated for the restricted maximum likelihood model for treatment effects
(Chi P) are shown in Table 3, and comments on significant differences for
individual dates are provided where they occurred. Data for Platyhelminthes,
Neuroptera, Mollusca, Trichoptera and Dermaptera are not shown in Table 3
because in most cases densities were too low (< 1/m2) for reliable analysis in the
CLASS ORDeR DeeP STReAM MOuNT BeNGeR TReATMeNT DIFFeReNCeS
TuRF TuSSOCK TuRF TuSSOCK FOR INDIvIDuAL DATeS
Platyhelminthes 0.385 0.411 0.231 0.832
Annelida Oligochaeta < 0.001 0.003 0.177 0.217
Mollusca 0.251 0.555 0.018 0.620
Arachnida Total < 0.001 0.01 0.002 0.074
Arachnida Araneae < 0.001 0.055 0.012 0.143
Arachnida Opiliones < 0.001 0.001 < 0.001 < 0.001
Crustacea Total < 0.001 < 0.001 < 0.001 0.009
Crustacea Amphipoda < 0.001 < 0.001 < 0.001 0.004
Crustacea Isopoda < 0.001 < 0.001 0.426 0.803
Myriapoda Total < 0.001 0.011 < 0.001 0.934
Myriapoda Chilopoda < 0.001 0.022 0.046 0.239
Myriapoda Diplopoda 0.028 0.418 < 0.001 < 0.001
Myriapoda Symphyla < 0.001 0.022 0.019 0.465
Insecta Diplura id id id id
Insecta Protura 0.062 0.745 0.537 0.902
Insecta Orthoptera (total) 0.051 < 0.001 0.169 0.001
Insecta Dermaptera id id < 0.001 0.721
Insecta Psocoptera < 0.001 0.087 – –
Insecta Hemiptera (total) 0.007 0.044 0.208 0.279 MB turf post-burn < pre-burn
Insecta Hemiptera 0.002 0.508 0.027 0.174 DS tussock spring and summer
(Pseudococcidae) post-burn < pre-burn
Insecta Hymenoptera < 0.001 0.409 < 0.001 0.135
Insecta Lepidoptera 0.734 0.05 < 0.001 0.012 DS turf spring and summer
post-burn < pre-burn
Insecta Neuroptera id id id id
Insecta Trichoptera id id id id
Insecta Coleoptera (total) < 0.001 0.064 < 0.001 0.677 DS tussock spring and summer
post-burn < pre-burn
Insecta Diptera 0.467 0.400 0.032 0.062 DS turf spring and summer
post-burn < pre-burn
Insecta Thysanoptera < 0.001 < 0.001 0.029 0.072
Total invertebrates 0.002 0.175 < 0.001 0.244 DS tussock spring and summer
post-burn < pre-burn
TABLe 3. PROBABILITIeS (CHI P ) FOR TReATMeNT eFFeCTS FOR DeeP STReAM (DS) AND MOuNT BeNGeR (MB)
TuRF AND TuSSOCK SAMPLeS FOR MAIN INveRTeBRATe TAxA.
Where main effects were not significant, differences for individual dates are shown. ‘id’ = insufficient data for analyses.
19Science for Conservation 291
study area in both turf and tussock samples. Table 4, which is presented at the
end of this section, summarises the findings for each invertebrate group reported
below.
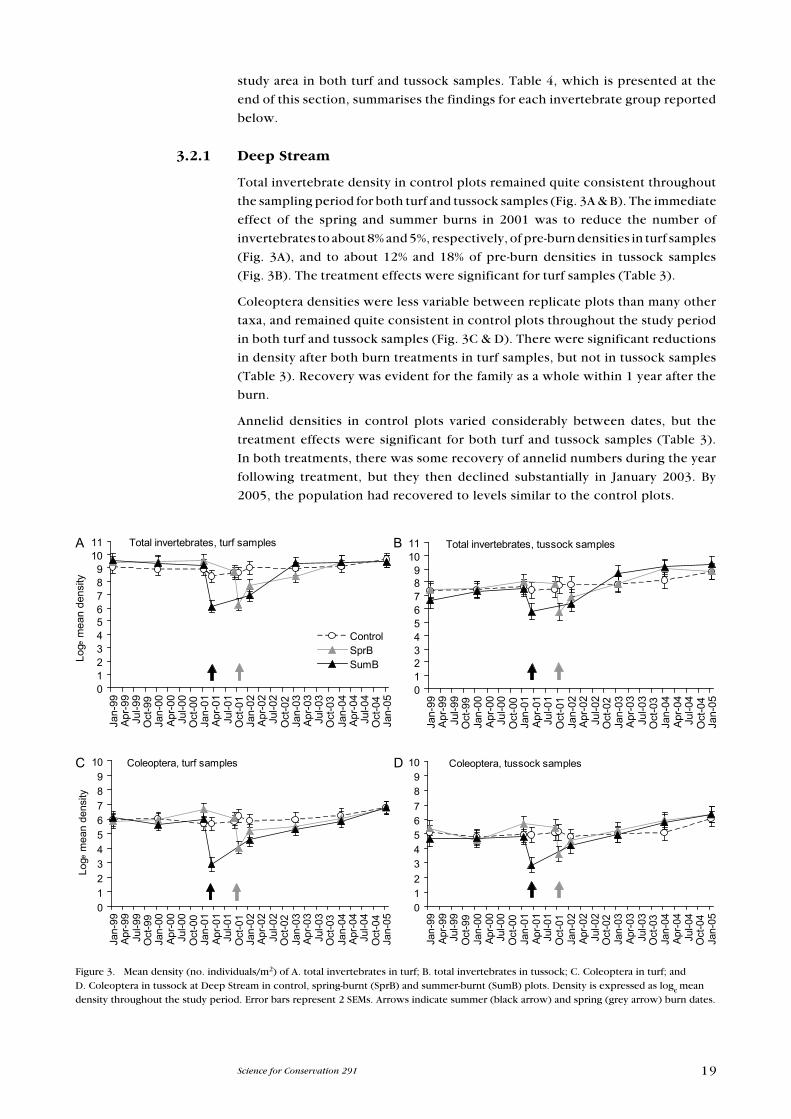
3.2.1 Deep Stream
Total invertebrate density in control plots remained quite consistent throughout
the sampling period for both turf and tussock samples (Fig. 3A & B). The immediate
effect of the spring and summer burns in 2001 was to reduce the number of
invertebrates to about 8% and 5%, respectively, of pre-burn densities in turf samples
(Fig. 3A), and to about 12% and 18% of pre-burn densities in tussock samples
(Fig. 3B). The treatment effects were significant for turf samples (Table 3).
Coleoptera densities were less variable between replicate plots than many other
taxa, and remained quite consistent in control plots throughout the study period
in both turf and tussock samples (Fig. 3C & D). There were significant reductions
in density after both burn treatments in turf samples, but not in tussock samples
(Table 3). Recovery was evident for the family as a whole within 1 year after the
burn.
Annelid densities in control plots varied considerably between dates, but the
treatment effects were significant for both turf and tussock samples (Table 3).
In both treatments, there was some recovery of annelid numbers during the year
following treatment, but they then declined substantially in January 2003. By
2005, the population had recovered to levels similar to the control plots.
Figure 3. Mean density (no. individuals/m2) of A. total invertebrates in turf; B. total invertebrates in tussock; C. Coleoptera in turf; and D. Coleoptera in tussock at Deep Stream in control, spring-burnt (SprB) and summer-burnt (SumB) plots. Density is expressed as loge mean density throughout the study period. error bars represent 2 SeMs. Arrows indicate summer (black arrow) and spring (grey arrow) burn dates.
0123456789
1011
Jan-
99A
pr-9
9Ju
l-99
Oct
-99
Jan-
00A
pr-0
0Ju
l-00
Oct
-00
Jan-
01A
pr-0
1Ju
l-01
Oct
-01
Jan-
02A
pr-0
2Ju
l-02
Oct
-02
Jan-
03A
pr-0
3Ju
l-03
Oct
-03
Jan-
04A
pr-0
4Ju
l-04
Oct
-04
Jan-
05
Total invertebrates, tussock samples
0123456789
10
Jan-
99Ap
r-99
Jul-9
9O
ct-9
9Ja
n-00
Apr-0
0Ju
l-00
Oct
-00
Jan-
01Ap
r-01
Jul-0
1O
ct-0
1Ja
n-02
Apr-0
2Ju
l-02
Oct
-02
Jan-
03Ap
r-03
Jul-0
3O
ct-0
3Ja
n-04
Apr-0
4Ju
l-04
Oct
-04
Jan-
05
Coleoptera, tussock samples
0123456789
10
Jan-
99A
pr-9
9Ju
l-99
Oct
-99
Jan-
00A
pr-0
0Ju
l-00
Oct
-00
Jan-
01A
pr-0
1Ju
l-01
Oct
-01
Jan-
02A
pr-0
2Ju
l-02
Oct
-02
Jan-
03A
pr-0
3Ju
l-03
Oct
-03
Jan-
04A
pr-0
4Ju
l-04
Oct
-04
Jan-
05
Coleoptera, turf samples
Loge
mea
n de
nsity
0123456789
1011
Jan-
99A
pr-9
9Ju
l-99
Oct
-99
Jan-
00A
pr-0
0Ju
l-00
Oct
-00
Jan-
01A
pr-0
1Ju
l-01
Oct
-01
Jan-
02A
pr-0
2Ju
l-02
Oct
-02
Jan-
03A
pr-0
3Ju
l-03
Oct
-03
Jan-
04A
pr-0
4Ju
l-04
Oct
-04
Jan-
05
ControlSprBSumB
Total invertebrates, turf samples
Loge
mea
n de
nsity
B
C D
A
20 Barratt et al.—Impact of fire on tussock invertebrates
Arachnid densities were reduced significantly in both turf and tussock samples
(Table 3). Burn treatments reduced density in turf samples for Araneae, and in
turf and tussock samples for Opiliones. Recovery of the Araneae appeared to
be more rapid than for the Opiliones. Opiliones densities became very low in
January 2003, but showed signs of recovery in the following years.
Crustacea were represented mainly by Amphipoda and Isopoda. Amphipoda
densities were dramatically reduced by the burning treatments in both turf and
tussock samples (Table 3). In the spring-burnt plots, there was no evidence
of recovery by the 2005 sample date. Control plot densities remained quite
consistent over the sampling period. Isopoda were also significantly reduced
in density by the burning treatments in turf and tussock samples and, like the
Amphipoda, the spring-burnt plot densities remained low to 2005.
Myriapoda were represented by Chilopoda, Diplopoda and Symphyla. Overall,
Myriapoda density was reduced significantly in turf and tussock samples at both
sites (Table 3), but this reduction was observed mainly during the 2–3 years
after the burns. Chilopoda were significantly reduced in density in both turf
and tussock samples for all treatments when sampled in 2003 and 2004, but
recovery was evident by 2005. Diplopoda densities were very variable between
the replicate plots, but there was a significant reduction in density in turf samples
immediately post-burn. Symphyla densities declined in turf samples in the
2–3 years post-burn.
Orthoptera were present at low density at DS, although higher densities were
observed in the tussock samples than in the turf samples. Densities in turf samples
were very variable, but in tussock samples the densities after the spring burn
remained very low compared with control plots and pre-burn densities.
Following burning, densities of Psocoptera (detritivores that did not occur at
MB) were significantly reduced in the turf samples (Table 3), where their density
was initially higher than in tussock. In both turf and tussock samples, densities
post-burn remained very low.
Hemiptera densities were dominated by Pseudococcidae. Numbers of individuals
in 0.1-m2 samples ranged from 0 to over 1000, which suggested that these are
very aggregated in the field. A significant reduction was found only in post-burn
turf samples (Table 3). Mean density was very variable even in control plots,
but both spring and summer burns reduced densities to low levels. There was
evidence of recovery by January 2003.
Hymenoptera densities were dominated by Formicidae. Densities were very
high and consistent in control turf samples for all sample dates, and there was a
significant treatment effect (Table 3). Hymenoptera density was lower and more
variable in tussock samples, and there were no significant treatment effects.
Lepidoptera, present mainly as larvae in samples, were significantly reduced in
density in tussock samples post-burn (Table 3), but populations had recovered
by 2003, and appeared to exceed densities in the control plots by 2004. This
increase was not significant, but occurred in both turf and tussock samples.
Diptera, present mainly as larvae in the samples, showed no significant treatment
effects (Table 3).
21Science for Conservation 291
Thysanoptera density was dramatically reduced after spring and summer
burns in both turf and tussock samples. However, for both vegetation types,
the densities in the summer-burnt plots recovered to densities that were
substantially higher than those in the control plots. For example, in the summer-
burnt plots, pre-burn density (January 2001) in turf samples was approximately
70 individuals/m2, which was reduced to less than 1 individual/m2 immediately
post-burn, but reached about 5000 individuals/m2 by January 2003. A similar
pattern was observed in tussock samples.
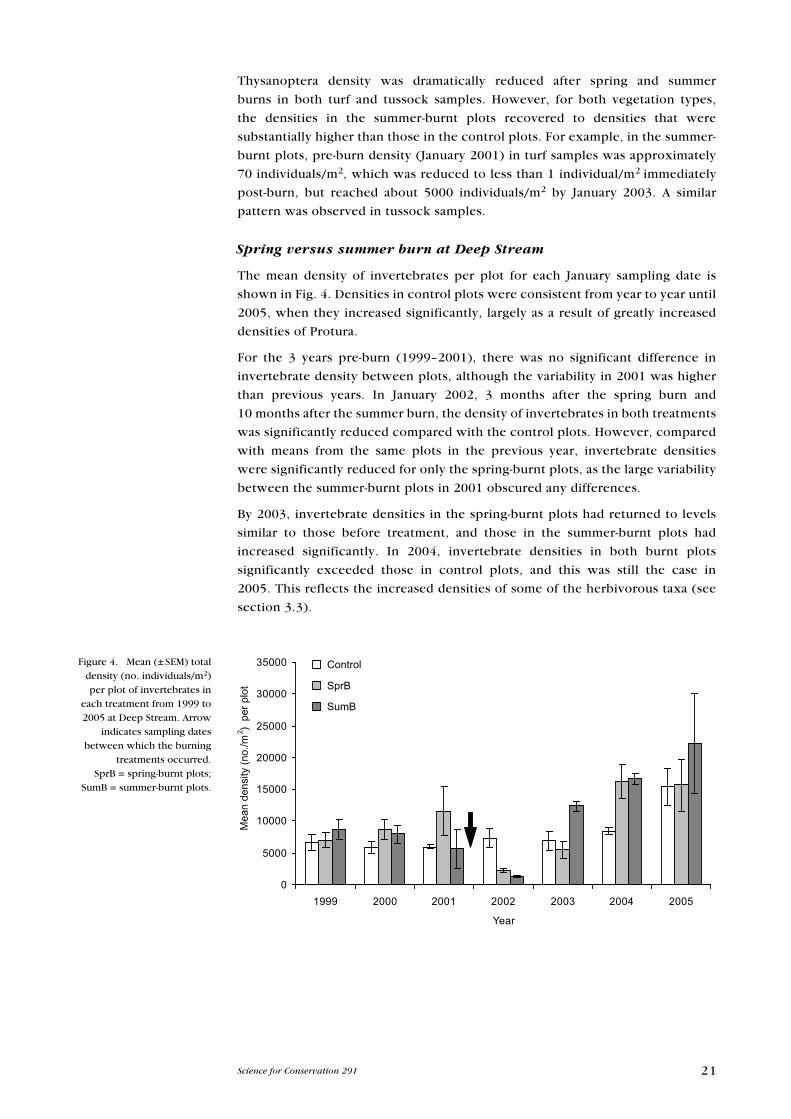
Spring versus summer burn at Deep Stream
The mean density of invertebrates per plot for each January sampling date is
shown in Fig. 4. Densities in control plots were consistent from year to year until
2005, when they increased significantly, largely as a result of greatly increased
densities of Protura.
For the 3 years pre-burn (1999–2001), there was no significant difference in
invertebrate density between plots, although the variability in 2001 was higher
than previous years. In January 2002, 3 months after the spring burn and
10 months after the summer burn, the density of invertebrates in both treatments
was significantly reduced compared with the control plots. However, compared
with means from the same plots in the previous year, invertebrate densities
were significantly reduced for only the spring-burnt plots, as the large variability
between the summer-burnt plots in 2001 obscured any differences.
By 2003, invertebrate densities in the spring-burnt plots had returned to levels
similar to those before treatment, and those in the summer-burnt plots had
increased significantly. In 2004, invertebrate densities in both burnt plots
significantly exceeded those in control plots, and this was still the case in
2005. This reflects the increased densities of some of the herbivorous taxa (see
section 3.3).
Figure 4. Mean (± SeM) total density (no. individuals/m2) per plot of invertebrates in
each treatment from 1999 to 2005 at Deep Stream. Arrow
indicates sampling dates between which the burning
treatments occurred. SprB = spring-burnt plots;
SumB = summer-burnt plots.
0
5000
10000
15000
20000
25000
30000
35000
1999 2000 2001 2002 2003 2004 2005
Year
CSprBSumB
Mea
n de
nsity
(no.
/m2 )
per p
lot
Control
SprB
SumB
22 Barratt et al.—Impact of fire on tussock invertebrates
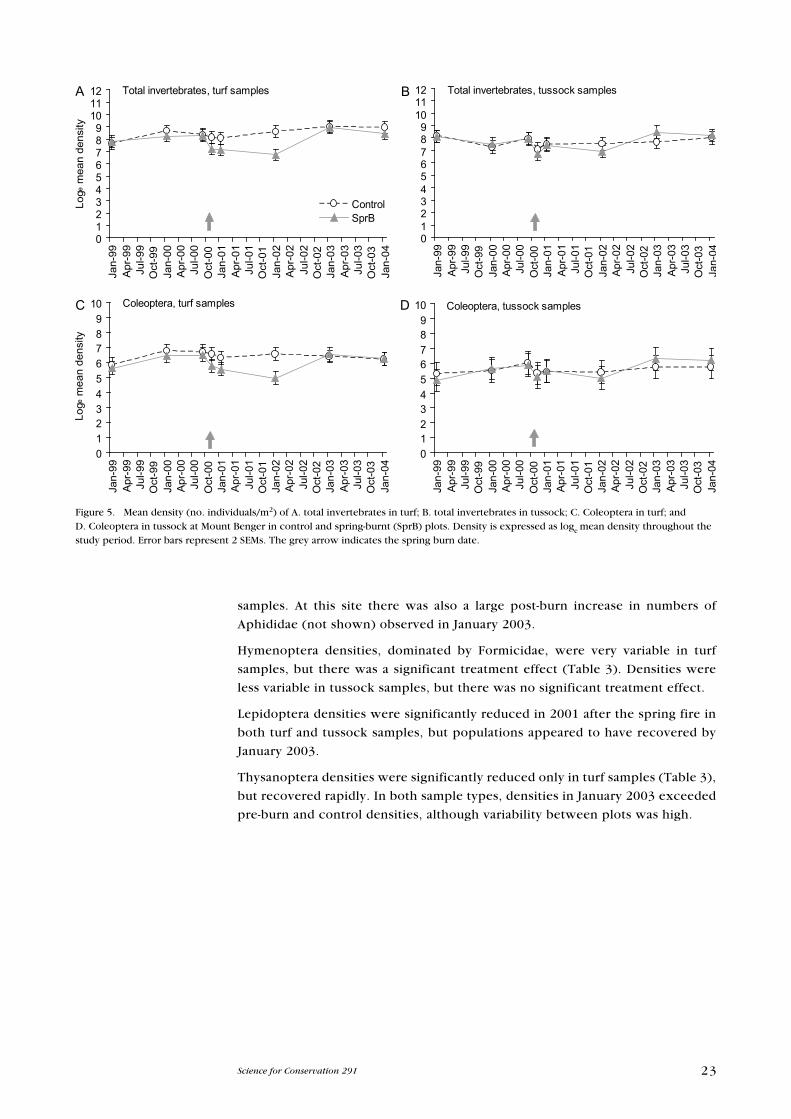
3.2.2 Mount Benger
As for DS, total invertebrate density in control plots at MB remained quite
consistent throughout the sampling period for both turf and tussock samples
(Fig. 5A & B). The immediate effect of the spring burn in 2000 was less pronounced
than at DS, although invertebrate density was still significantly reduced by 40%
and 19% of pre-burn densities in 2001 and 2002, respectively.
For total invertebrate density, the generalised linear model showed that there
was a significant interaction between treatment and vegetation type. The density
of invertebrates (c. 2000 individuals/m2 before the spring burn) was reduced to
about 400 individuals/m2 in January 2002, just over 1 year after the spring burn
(Fig. 5A). No such reduction was observed in the tussock samples (Fig. 5B).
Coleoptera densities were quite consistent between replicate control plots and
between dates throughout the study period (Fig. 5C & D). After the spring burn,
numbers were reduced significantly in turf samples (Fig. 5C), but there were no
significant changes in density in the tussock samples (Fig. 5D).
Annelid density was variable over the study period. There were no significant
effects of the spring fire treatment.
Total Arachnida were significantly reduced only in turf samples in January 2002.
Araneae densities showed a significant treatment effect only in turf samples
(Table 3), but the density of Opiliones was substantially reduced in both turf and
tussock samples (Table 3).
A significant treatment effect was found for total Crustacea in turf and tussock
samples (Table 3). The fauna was dominated by Amphipoda, which were
significantly reduced by the spring burn in both sample types in January 2002;
as at DS, there was no evidence of recovery of the population by the end of the
study. Isopoda at MB were not significantly affected by the burning treatment,
whereas they were at DS.
Total Myriapoda were significantly reduced in density by the spring burn,
particularly Diplopoda, which showed no sign of recovery by the end of the study
in either turf or tussock samples. Symphyla and Chilopoda showed significant
treatment effects in turf samples only (Table 3).
Orthoptera densities were significantly reduced in tussock samples from
immediately post-burn to the end of the study period. As at DS, this reduction
was mainly attributable to Blattidae densities being reduced to almost zero in
tussock samples after the burn.
Hemiptera densities were dominated by Pseudococcidae, as they were at DS.
However, at MB the spring burn reduced densities significantly only in turf
23Science for Conservation 291
Figure 5. Mean density (no. individuals/m2) of A. total invertebrates in turf; B. total invertebrates in tussock; C. Coleoptera in turf; and D. Coleoptera in tussock at Mount Benger in control and spring-burnt (SprB) plots. Density is expressed as loge mean density throughout the study period. error bars represent 2 SeMs. The grey arrow indicates the spring burn date.
0123456789
101112
Jan-
99A
pr-9
9Ju
l-99
Oct
-99
Jan-
00A
pr-0
0Ju
l-00
Oct
-00
Jan-
01A
pr-0
1Ju
l-01
Oct
-01
Jan-
02A
pr-0
2Ju
l-02
Oct
-02
Jan-
03A
pr-0
3Ju
l-03
Oct
-03
Jan-
04
ControlSprB
Total invertebrates, turf samplesLo
ge m
ean
dens
ity
0123456789
101112
Jan-
99A
pr-9
9Ju
l-99
Oct
-99
Jan-
00A
pr-0
0Ju
l-00
Oct
-00
Jan-
01A
pr-0
1Ju
l-01
Oct
-01
Jan-
02A
pr-0
2Ju
l-02
Oct
-02
Jan-
03A
pr-0
3Ju
l-03
Oct
-03
Jan-
04
Total invertebrates, tussock samples
0123456789
10
Jan-
99A
pr-9
9Ju
l-99
Oct
-99
Jan-
00A
pr-0
0Ju
l-00
Oct
-00
Jan-
01A
pr-0
1Ju
l-01
Oct
-01
Jan-
02A
pr-0
2Ju
l-02
Oct
-02
Jan-
03A
pr-0
3Ju
l-03
Oct
-03
Jan-
04
Coleoptera, turf samples
Loge
mea
n de
nsity
0123456789
10
Jan-
99A
pr-9
9Ju
l-99
Oct
-99
Jan-
00A
pr-0
0Ju
l-00
Oct
-00
Jan-
01A
pr-0
1Ju
l-01
Oct
-01
Jan-
02A
pr-0
2Ju
l-02
Oct
-02
Jan-
03A
pr-0
3Ju
l-03
Oct
-03
Jan-
04
Coleoptera, tussock samplesDC
A B
samples. At this site there was also a large post-burn increase in numbers of
Aphididae (not shown) observed in January 2003.
Hymenoptera densities, dominated by Formicidae, were very variable in turf
samples, but there was a significant treatment effect (Table 3). Densities were
less variable in tussock samples, but there was no significant treatment effect.
Lepidoptera densities were significantly reduced in 2001 after the spring fire in
both turf and tussock samples, but populations appeared to have recovered by
January 2003.
Thysanoptera densities were significantly reduced only in turf samples (Table 3),
but recovered rapidly. In both sample types, densities in January 2003 exceeded
pre-burn and control densities, although variability between plots was high.
24 Barratt et al.—Impact of fire on tussock invertebrates
ReSPONSe TAxA WHeRe APPLICABLe
No significant treatment effect Platyhelminthes Both sites and sample types
Protura Both sites and sample types
Coleoptera Both sites tussock
Pseudococcidae Both sites tussock
Hymenoptera Both sites tussock
Isopoda Both sites tussock
Orthoptera Both sites turf
Diptera DS both sample types
Mollusca DS both sample types
Araneae MB both sample types
Annelida MB both sample types
Density reduced but recovered Pseudococcidae Both sites and sample types
rapidly Coleoptera Both sites turf
Diptera DS
Density reduced but recovered Annelida DS turf
by Jan 2005 Isopoda DS turf
Chilopoda DS turf
Araneae DS turf
Symphyla DS turf
Lepidoptera MB
Density reduced and little if Amphipoda Both sites and sample types
any recovery by Jan 2005 Psocoptera DS turf
Hymenoptera DS turf
Orthoptera (Blattidae) DS spring burn and MB tussock
Diplopoda MB
Density reduced but then Thysanoptera DS in particular
‘rebounded’ Lepidoptera DS summer burn
Differences between sites Annelida Greater impact DS turf than MB turf
Myriopoda Greater impact DS turf than MB turf
Hemiptera Faster recovery MB than DS both
sample types
Coleoptera Greater impact DS than MB both
sample types
Differences between vegetation Myriopoda Main effects in turf
sample types Orthoptera (Blattidae) Main effects in tussock
Hymenoptera Main effects in turf
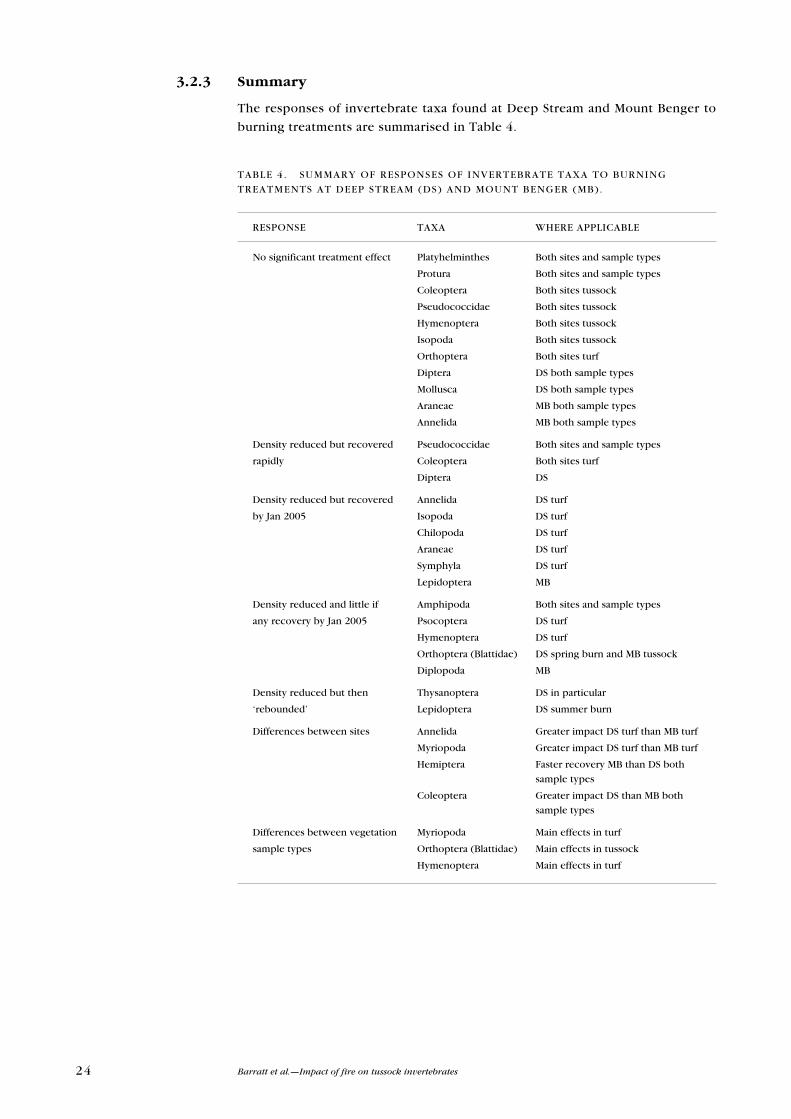
TABLe 4. SuMMARY OF ReSPONSeS OF INveRTeBRATe TAxA TO BuRNING
TReATMeNTS AT DeeP STReAM (DS) AND MOuNT BeNGeR (MB).
3.2.3 Summary
The responses of invertebrate taxa found at Deep Stream and Mount Benger to
burning treatments are summarised in Table 4.
25Science for Conservation 291
3 . 3 e F F e C T O F B u R N I N G T R e A T M e N T S O N C O M M u N I T Y T R O P H I C S T R u C T u R e
Short-term (2–3 months post-burn) and medium-term (36 months post-burn)
changes in the trophic group composition of the invertebrate fauna are discussed
below. The trophic structure of the invertebrate communities was similar for
the two sites and vegetation types pre-burn (Fig. 6A), with herbivores and
detritivores present at similar densities and comprising similar proportions of the
invertebrate fauna. Carnivores were slightly less well represented and fungivores
comprised a small proportion of the invertebrate fauna. However, as mentioned
previously, Collembola, which are primarily fungivores, have not been included
in this study.
3.3.1 2–3 months post-burn
Figure 6B suggests that 2–3 months post-burn, densities were reduced for all groups
and the proportional structure of the community had changed, particularly at DS.
At DS, the data indicate that the proportion of herbivores in the community
was reduced to about 10% of the total, whereas the proportion of detritivores
increased to 70% (turf) and 55% (tussock). A comparison of Fig. 6A and 6B suggests
that these proportional changes were attributable mainly to the substantial
decline in the density of herbivores (mainly Pseudococcidae, Curculionidae and
Thysanoptera) and a lesser decline in detritivore densities after burning.
At MB, the community trophic structure was little changed following burning,
except that fungivores were almost totally removed (Fig. 6B). This may have
mainly been due to reductions in the density of Protura in the spring-burnt
plots. unlike at DS, by the January following the spring burn, the density of
Pseudococcidae in the tussock plots at MB had already recovered almost to
pre-burn densities.
3.3.2 3 years post-burn
After 3 years, the picture in the burnt plots was even more different from the long-
term averages of the control plots, with much greater densities of herbivores,
largely resulting from the huge ‘rebound’ response of Pseudococcidae and other
Hemiptera, and Thysanoptera (Fig. 6C). At DS, the increase in the proportion
of carnivores in turf samples was a result mainly of the recovery of Araneae
(Appendix 4). At MB, the reappearance of fungivores was represented mainly by
Protura and Pauropoda (data not presented).
Figure 7 shows the mean densities of invertebrates in the major trophic groups
(excluding Hymenoptera) each year for the years preceding and following the
spring-burn treatments at DS and MB (Fig. 7A & C); and for the years preceding
and following the summer-burn treatment at DS (Fig. 7B). The figure shows that
the density of some of the functional groups was quite variable between years
before treatments were applied. For example, there were higher densities of
detritivores (mainly Annelida, Amphipoda and Diptera larvae) in turf (but not
tussock) at MB in January 2000 compared with 1999; conversely, there was a
greater density of herbivores in tussock at MB in January 1999 compared with
2000, almost entirely due to a greater density of Pseudococcidae. Generally
however, apart from these exceptions, the pre-treatment densities of each of the
trophic groups were quite similar.