Embed Size (px)
Citation preview
232 NEWZEALANDJOURNALOFECOLOGY,VOL.31,NO.2,2007
Rapidshort-tussockgrasslanddeclinewithandwithoutgrazing,Marlborough,NewZealand
AlanB.Rose1*andChrisM.Frampton21UplandResearch,NewRenwickRoad,RD2,Blenheim7272,NewZealand2StatistecolConsultants,45BeveridgeSt,CityCentral,Christchurch,NewZealand*Authorforcorrespondence(Email:[email protected])
Publishedon-line:3December2007
___________________________________________________________________________________________________________________________________
Abstract:Speciesabundance,speciesrichness,andgroundcoverweremeasuredover10yearsonninepairedgrazedandexclosureplotsinshort-tussockgrasslandintheearlystagesofinvasionbyHieraciumspecies.Withandwithoutgrazing, H. pilosellaandH. caespitosumincreasedmarkedlyandH. lepidulumincreasedlocally.Incontrast,50%of all other common species and species groups, and total, native, and exotic species richness declined significantly. ExclusionincreasedorhadnoeffectonratesofincreaseinHieraciumspeciesandratesofdeclineinshorttussocks,anddidnotreduceratesofdeclineinotherspecies.Exclusionhadnoeffectondeclineinnativespeciesrichness,butmainly accelerated declines in total and exotic richness. Declines in 13 key vegetation variables were significantly predictedbyincreaseinHieracium abundance,suggestingcompetitiveexclusion.Withorwithoutgrazing, Hieraciumspecieswillbecomemoredominantandotherspecieswillcontinuetodecline.Theeffectsoflargeherbivoresonplantspeciesdiversitycanoftenbepredictedfromsiteproductivity.Ourresultsindicatetheneedalsotoaccountforspeciesorigin,spatialscale,time,andexoticinvasion.___________________________________________________________________________________________________________________________________
Keywords:exclosures,herbivoreimpacts,Hieracium caespitosum, Hieracium lepidulum,Hieracium pilosella, plantinvasion,speciesrichness,vegetationchange
IntroductionNew Zealand’s tussock grasslands have been widelyaltered by 150 years of grazing by sheep, cattle, andferal mammals. Concerns over soil erosion promptedretirementofgrasslandfromgrazingbetweenthe1940sand1970s,whilelaterinitiativeshavebeenmorefocusedonprotectionof indigenousbiodiversity (Mark1993).In the lastdecade,over225000haof the2.2millionhectaresoftussockgrasslandinCrownPastoralLeaseshavebeenremovedfromgrazingorarebeingassessed(Land Information New Zealand, unpubl. data 2006).Suchgrasslandswillbemanagedformallyforprotectionofindigenousbiodiversity(Mark&McLennan2005).
Short-tussockgrasslanddominatedbyFestuca novae-zelandiae andPoa citaisoneofthemainvegetationtypescurrentlybeingretiredfromgrazing(Mark&McLennan2005).Occupyingc.1millionhectares,thesegrasslandsaretypicalofmontane–subalpinemountainslopes,valleyfloors and basins of the eastern South Island rain shadow, often where forest has been removed by Māori or European fires (McGlone 2001). These mainly seral grasslands, induced by fire and grazing, are compositionally unstable, as predicted for grasslands that evolved without largemammalianherbivores(Milchunasetal.1988),andpose
severeproblemsforconservation(Mark1993).‘Passive’managementthroughremovalofgrazingispresentlythemainconservationstrategy,butthelong-termeffectsongrasslandbiodiversityarehighlyuncertain.
Erratic rainfall can inhibit recovery (Allen et al.1995)andcolonisationofbaregroundisslowbecauseof frost heave and wind erosion (Whitehouse 1984).Exotic grasses or conifers may respond more rapidlyandprecludeslowergrowingnatives(Lord1990;Roseetal.2004;King&Wilson2006).Asgrazingpressuredeclines,formerlydominantnativewoodyspeciesandtalltussocks(Chionochloaspp.)begintorecoverandspread,butseedsourcesmayhavebeenlostoverextensiveareas(Rose&Platt1992;Leeetal.1993;Duncanetal.2001;Mark&Dickinson2003;Roseetal.2004).Ungrazedshort-tussockgrasslandwillstillbesubjectedtoongoinginvasionbyaggressiveandpotentiallydominantexoticweeds,particularlyHieracium pilosella (Roseetal.1995;Meurketal.2002;Walkeretal.2003b).
In thispaperweaddress twoissuesposingstrongchallenges to effective conservation and grazingmanagementofshort-tussockgrassland:compositionalinstabilityandhighsusceptibilitytoinvasionbyperennialexotics.Ifremovalofgrazingistobeusedasamanagementtool for protecting short-tussock grasslands it may be
New Zealand Journal of Ecology(2007)31(2): 232-244©NewZealandEcologicalSociety
Availableon-lineat:http://www.newzealandecology.org/nzje/
233ROSE,FRAMPTON:RAPIDSHORT-TUSSOCKGRASSLANDDECLINE
most successful where there are low populations ofinvasiveexoticssuchasHieracium pilosella.Wethereforecomparedtemporaltrendsover10yearsingrazedandungrazedshort-tussockgrasslandswith<5%Hieraciumcoveratthebeginningofthestudy.Weaskedtwomainquestions: does removal of grazing prompt vegetationrecoveryandinhibitfurtherinvasionbyHieraciumspecies;anddotemporal changesinspeciesrichnessandabundancereflect changes in Hieraciumabundance?
MethodsThestudyareaisinLimestoneStream,AwatereValley,inlandMarlborough(41°56'S,173°37'E),andisdescribedindetailbyRoseetal.(1998).Theareaissteep(20–40°)and underlain by Pallic, Brown, and Recent soils onstronglyinduratedsandstonesandsiltstones(limestoneisnotpresent).Annualrainfallisestimatedat760mm,withfrequentdryperiodsof>60days,especiallyoverthegrowingseason.Theshort-tussockgrasslands(Festuca novae-zelandiae,Poa cita)containawiderangeofexoticandnativeherbsandscatteredwoodyspecies.
The area ismanaged for extensive sheep farmingwithoutanyaddedfertiliseroroversownpasturespecies(Rose et al. 1998). Domestic animals, mainly merinosheep,havegrazedtheareaaspartofawidermanagementblockforc.150years,buttheexacthistoryofgrazingisnotrecorded.Until1974,theareawasgrazedallyearby700merinowethers.Sincethenthishasbeenreducedto100wethersfor4monthsinspringtoearlysummertopromotevegetationrecovery.Moststockareusuallyremovedoverwinter,dependingontheavailabilityoffeedonlowercountry.Presentstocknumbersaverage0.8–1.2stockunitsperhectareannually.Nodirectestimatesofgrazingweremadeduringthisstudy.
Feral animals have also had a significant impact on the vegetation, but numbers have declined sincethe 1960s because of hunting. Over the study periodtheseincludedlowpopulationsofgoats,pigsandhares.AlthoughintroducedrabbitpopulationshadreachedveryhighdensitiesintheupperAwaterebythe1880s,inthestudy area they have been confined to very low numbers foratleastthelastfourdecades(Roseetal.1998)andwesawonlyonerabbitduringthestudy.
In 1994 nine representative grassland sites wereselected between 780 and 1250 m a.s.l. on north-,south-, east-, and west-facing slopes, reflecting the important influences of elevation and potential solar radiation on composition (Table 1; Rose et al. 1998).Adjacentsiteswere200–500mapartandallhad<5%estimated cover of Hieracium pilosella, reflecting the earlystageofinvasioninthecatchment(Roseetal.1998).Less abundantH. caespitosum andH. lepidulumwerealsopresent.Ateachsite,a2525-mplotwasfencedtoexcludesheepandferalherbivores,andasimilar-sizedgrazedcontrolplotwas established invisually similarvegetationonthesamelandformandslopeposition.
The vegetation was measured in summer (mid-January to mid-March) from 1994 to 2004. At eachexclosureandcontrolplotweestablishedthreeparallel,permanent20-mtransects(5mapart),andthreepermanent5050-cmquadrats(atthecentreofeachtransect).Alongeach transect, 50 circular subplots of 15-cm diameterwere spaced at 40-cm intervals. Annually, Hieraciumcoverwasestimatedwithineachsubplotas0,<1,1–5,6–25,26–50,51–75,or76–100%usingreferencecards,andgroundcoverwasrecordedasvascularvegetation,bryophytes,lichen,litter,topsoil,subsoil,orrock,usingapointinterceptatthecentreofeachsubplot.At5-yearintervals,theshootfrequencyofallvascularspecieswasrecordedfromtheirpresenceineachsubplot.Foreach
Table 1.SitefactorsummaryforpairedcontrolandexclosureplotsatninesitesinAwatereValley,Marlborough,NewZealand,in1994.*P =0.05.___________________________________________________________________________________________________________________________________
Mean Range
Control Exclosure ___________________________________________________________________________________________________________________________________
Elevation(ma.s.l.) 1005 1003 795–1240Potentialsolarradiation(Langleysyr–1) 0.420 0.421* 0.203–0.597pH 5.78 5.83 5.30–6.40OrganicC(%) 2.29 2.05 1.24–4.92N(%) 0.17 0.16 0.10–0.34Ca(me%) 10.14 9.84 6.32–13.42Mg(me%) 2.59 2.42 1.37–3.81K(me%) 0.89 0.89 0.65–1.20Na(me%) 0.05 0.07 0.02–0.11Al (μg g–1) 0.20 0.24 0.00–0.82P (μg g–1) 14.50 14.30 6.54–27.19S (μg g–1) 2.02 2.29 0.77–7.87___________________________________________________________________________________________________________________________________
234 NEWZEALANDJOURNALOFECOLOGY,VOL.31,NO.2,2007
quadrat,thecoverofallvascularspeciesandgroundcoverwasestimatedannuallyintheaboveclasses.Quadratsweregriddedinto10×10-cmsquarestoaidestimation.Transectandquadratcoverestimateswereconvertedto%coverusingthemidpointsofthecoverclassesandsummarisedfor each species, for 10 species groups sufficiently large for analysisandrepresentingallspeciespresent,andforeachgroundcovercategory(Table2).Total,native,andexoticspeciesrichness(numberofvascularspeciespresent)werecalculatedannuallyperquadratand5-yearlypersubplot,transect(50subplots),andplot(3transects).
Sitefactorsrecordedforeachplotincludedelevation,slope,aspect,andpotentialsolarradiation(calculatedfrom
latitude,slope,andaspect;SOLRADsoftware,G.M.J.Hallpers.comm.,1996).In1994,10randomlylocatedsoilcores(0–10cm)weretakenfromeachplot,thenbulkedandanalysedforpH,totalorganicC,totalN,exchangeableCa,Mg,KandNa,Ca-Cl2extractableAl,OlsenP,andphosphate-extractableS(Blakemoreetal.1987).
RainfalldatawereavailablefromUpcot,5kmnorthofthestudyarea(NationalInstituteofWaterandAtmosphericResearch,unpubl.data,2004).The1994–1997samplingperiodrecordedaveragetoabove-averagerainfallandwasgenerallymoisterthan1998–2004.Forexample,inthe12monthsprecedingthe1998and2004samplesUpcotreceivedonly61%and66%ofnormalannual rainfall
Table 2. Changesinmean%quadratandtransect(t)coverofthemainvegetationcomponentsmeasuredannuallyonpairedcontrolandexclosureplotsatninesitesinAwatereValley,Marlborough,NewZealand,1994to2004.***P<0.001;**P<0.01;* P < 0.05; ns not significant. aIndicates treatment means significantly different in 2004 (P<0.05).Rain6=overalleffects of preceding 6-monthly rainfall. Overall temporal effects in parentheses are not significant when Rain6 is included inthemodel.___________________________________________________________________________________________________________________________________
Meanin1994 Meannetchange/10yr Stderrorofnetchange Overallnet Annualcomparisons Control Exclosure Control Exclosure Control Exclosure change/10yr Time Grazing Rain6 ×Time___________________________________________________________________________________________________________________________________
Exotic speciesTotalHieraciumspp. 4.7 3.5 +17.9 +26.3 3.94 4.74 *** *** ** nsTotalHieraciumspp.(t) 3.9 3.3a +12.8 +19.9** 3.28 2.58 *** *** ** *** H. pilosella 2.7 1.8 +14.6 +17.5 2.94 4.92 ** *** ns ns H. pilosella (t) 2.6 1.9 +10.3 +14.8 2.36 2.40 *** *** * *** H. caespitosum 0.7 0.5 +0.7 +4.3 1.25 1.73 * *** ** ns H. caespitosum(t) 0.6 0.6 +0.6 +2.3* 0.26 0.66 ** *** *** ** H. lepidulum 1.3 1.3 +2.6 +4.4 2.21 2.99 ns *** ns ns H. lepidulum(t) 0.3 0.7 +1.9 +2.9 1.73 2.33 ns *** ns nsNon-Hieraciumperennialherbs15.7 18.4a −10.0 −16.7 2.54 4.01 ** *** * *Grasses 11.9 13.2 −7.9 −11.8 2.27 3.33 ** *** ns * Anthoxanthum 6.5 8.9 −3.6 −7.9 1.57 2.59 ** *** ** ns odoratum Holcus lanatus 5.3 2.9 −5.0 −2.7 1.52 1.18 ** *** * nsForbs 3.8 5.2 −2.1 −4.9 1.13 1.32 ** *** *** ns Hypochaeris radicata 2.4 1.7 −1.9 −1.5 0.79 0.70 * *** ns nsAnnual/biennial herbs 2.4 1.3 −1.6 −1.0 0.66 0.33 ** (**) ns *
Native speciesAll perennial herbs 29.5 37.9 −8.0 −18.2 3.84 6.08 * *** ** *Tussocks 10.8 18.2* −1.7 −12.6* 3.10 3.77 * *** *** ns Festuca 7.6 11.0a 0.0 −7.5* 2.56 2.42 * *** *** ns novae-zelandiae Poa cita 3.2 7.2 −1.7 −5.1 0.91 2.10 * *** ns nsOther grasses 9.9 8.1 −1.0 +2.8 1.69 2.83 ns ns ns * Rytidosperma clavatum 9.0 6.2 −0.8 +3.5 1.58 2.73 ns ns ns nsForbs 8.8 11.6 −5.2 −8.4 2.42 1.87 ** *** ns * Acaena caesiiglauca 2.4 3.7 −2.1 −3.6 0.97 1.27 ** *** ns nsWoody perennials 4.9 2.4 −2.7 +2.2 1.58 2.18 ns ns * ns Ozothamnus leptophyllus 3.4 1.7 −2.2 +0.4 1.06 1.45 ns ns ns ns
Ground coverVascular vegetation 43.9 53.0 +1.9 −7.0 5.66 6.21 ns (*) ns ***Vascular vegetation (t) 41.3 46.4 +1.1 −3.7 5.10 3.08 ns (*) ns ***Litter 21.2 15.6a −4.3 +16.9** 3.32 3.18 * (**) *** ***Litter(t) 27.7 26.4 +3.6 +13.9* 5.37 2.10 * (**) ** ***Bareground 32.7 28.3a +5.5 −12.0 3.85 5.01 ns ns *** *Bareground(t) 30.7 26.4a +4.8 −12.3*** 2.76 2.11 ns ns *** ***_________________________________________________________________________________________________________________________

235ROSE,FRAMPTON:RAPIDSHORT-TUSSOCKGRASSLANDDECLINE
(respectively)andinthe3or6monthsprecedingthe1998,1999,2001and2004samplesitreceivedonly50–68%ofaverageforthestudyperiod(Fig.1).
AnalysisMixed-model analysis of variance (anova) was usedto analyse temporal changes between 1994 and 2004,with site (the paired exclosure and control plots) asa random factor and time and grazing treatment asfixed effects. We analysed changes in total, native, and exoticspeciesrichnessandallcover,groundcover,andfrequency components with >1% overall mean.Thesemodelstestedtheeffectsoftime,grazingtreatment,andappropriateinteractionterms,usingallannualor5-yearlymeasurementsoverthe10years.Forannuallymeasuredcover,groundcover,andspeciesrichnessvariables,thestrengthofrainfalleffectswasestimatedbyincludinginthemodelsthetotalrainfallforthe6monthsprecedingsampling (the approximate growing season). Becauseof thepaired-plotdesign,however, thekey interactionbetweentimeandgrazingtreatmentwasnotconfoundedbypossibletemporalvariationinrainfallorothersitefactors.Wealsoanalysednetchangesinmeancover,frequency,andspeciesrichnessoverthe10yearsusingmixed-modelanova, which tested the effects of time and grazingtreatmentandtheirinteractions.Theseanalysescomparedonly the initial (1994) and final (2004) measurements. Pairedt-tests were used to compare initial or final means forsiteandvegetationvariables.
Factorspotentiallyaffectingvegetationchangewereexaminedbycomparingnetchangesin20keyvegetation
variables with initial site factors and net changes inHieraciumcover.Allexclosureandcontrolplotswereused (n=18).Rainfall couldnotbe includedbecausevariationbetweenplotswasunknown.Dependentvariablesincludednetchangeinthecoverofmajorspeciesgroups,and total, native, and exotic species richness per plot,transect,quadrat,andsubplot.Forthequadrats,becausewemeasuredthecoverofallspecieswealsousednetchangeinShannon–Weinerdiversityindexasadependentvariable. Correlation coefficients were first calculated betweenallvariables,allowingforthepaired-plotdesign.Foreachofthe21dependentvariables,stepwisebackwardmixed-modelregressionswerethenusedtodeterminethemost significant independent predictors of change among allsitefactorsandHieraciumcovervariables thathadunivariate associations significant at P<0.1.
ResultsInitial composition and site factorsIn1994thevegetationwasdominatedbynativeperennialherbs(34%meantotalcover),mainlycomprisingFestuca novae-zelandiae and Poa cita tussocks, the sward-forming grass Rytidosperma clavatum, and the forbAcaenacaesiiglauca(Table2).Non-Hieraciumperennialexotic herbs (17% cover) mainly included the grassesAnthoxanthumodoratumandHolcuslanatusandtheforbHypochaerisradicata.Bareground(soil+rock)accountedforaboutone-thirdofthegroundcoverandmeantotalHieraciumcoverwas4%(mainlyH. pilosella).Only11specieswerepresentat>1%meanquadratcover(Table2),but46werepresentat>1%meantransectfrequency(Table3).Theexclosuresandcontrolswerewellmatched,with few significant differences in site and vegetation variables(pairedt-tests,P < 0.05;Tables1–4).
Changes in species cover and frequencyThe vegetation changed markedly inside and outsidetheexclosuresbetween1994and2004.Annualquadratcomparisonsshowedthat17ofthe21mainspeciesandspeciesgroupschangedinoverallmeancoverovertime(anova,P<0.05;Table2).Amongthese,16speciesandgroups showed a significant net change in cover over thefull10years(anova,P<0.05;Table2).Five-yearlytransect comparisons showed that 27 of the 46 mostfrequentspecieschangedinoverallmeanfrequency,with21species(46%)showinganetoverallchange(anova,P<0.05;Table3).Temporalpatternsofchangeincoverorfrequencyoftendifferedbetweentreatments(grazing×timeinteraction;Tables2,3).Overthefull10years,however, there were few significant differences in net changeorinmeancoverbetweentreatments,indicatingthattheresultingvegetationwassimilarinsideandoutsidetheexclosuresin2004.Forperennialspeciesandgroups,
Figure 1. Total rainfall at Upcot recording station,Marlborough, New Zealand, in the 12, 6 and 3 monthsprecedingeachsamplingyear(upper,middleandlowerlines,respectively).Horizontallinesrepresentthe12-monthlong-termaverageandthe6-and3-monthaveragesforthestudyperiod(1994-2004).
236 NEWZEALANDJOURNALOFECOLOGY,VOL.31,NO.2,2007
Table 3.Changesinmean%transectfrequencyofthemainspecies(measured5-yearly)onpairedcontrolandexclosureplotsatninesitesinAwatereValley,Marlborough,NewZealand,1994to2004.***P<0.001;** P<0.01;*P<0.05;nsnot significant.___________________________________________________________________________________________________________________________________
Meanin1994 Meannetchange/10yr Stderrorofnetchange Overallnet Five-yearlycomparisons Control Exclosure Control Exclosure Control Exclosure change/10yr Time Grazing×Time___________________________________________________________________________________________________________________________________
Exotic species Hieraciumspp. H. pilosella 13.6 10.2 +30.7 +47.8** 5.26 3.90 *** *** ** H. caespitosum 3.3 7.2 +4.6 +10.4 1.53 3.42 * *** ns H. lepidulum 5.3 7.9 +6.3 +5.9 4.70 3.16 ns ** nsNon-HieraciumperennialherbsGrasses Anthoxanthum odoratum 64.5 68.4 −13.2 −16.1 8.70 9.18 ** ** ns Holcus lanatus 36.0 36.1 −28.6 −31.6 5.19 6.72 ** *** ns Agrostis capillaris 2.2 5.6 +0.8 −0.9 2.14 2.73 ns ns ns Dactylis glomerata 4.0 5.0 −1.1 +1.0 0.90 1.61 ns ns nsForbs Hypochaeris radicata 19.3 24.7 −12.4 −18.8 4.64 3.69 ** *** ns Rumex acetosella 21.6 20.1 −11.6 −18.3 2.30 3.21 *** *** ns Trifolium repens 11.4 17.4* −8.0 −15.7** 3.16 4.80 * *** ns Cerastium fontanum 3.8 7.6* −2.3 −7.3* 2.43 3.49 ns ** ns Acaena agnipila 0.9 1.8 +2.9 +1.0 2.54 1.08 ns ns nsAnnual/biennialherbs Crepis capillaris 28.9 32.0 −23.7 −30.7 7.09 5.70 ** *** ns Trifolium arvensis 17.2 15.3 −4.1 −9.2 8.44 2.47 ns ns ns Trifolium dubium 4.4 5.8 −3.0 −5.2 1.40 1.57 ** *** ns Linaria arvensis 3.4 5.9 +6.7 −2.0 2.99 1.76 ns ns * Vicia sativa 3.5 3.5 −1.8 −1.7 1.74 0.73 ns ns ns Arenaria serpyllifolia 1.6 1.7 −0.4 −1.6 0.88 0.67 * * ns Torilis arvensis 1.9 3.3 −0.5 −2.8 1.00 1.67 ns * ns
Native speciesTussocks Festuca novae-zelandiae 26.7 31.1 −9.0 −10.3 3.75 3.45 ** *** ns Poa cita 19.4 20.2 −9.2 −15.2** 1.24 1.59 *** *** *Othergrasses Rytidosperma clavatum 29.2 40.4 +10.3 +3.0 5.74 2.93 ns ns ns Elymus solandri 16.6 20.4 −1.9 −7.0 2.41 3.39 ns ns ns Lachnagrostis lyallii 4.3 2.4 −2.9 −1.9 1.27 0.89 ns ** ns Poa colensoi 4.2 3.6 +0.1 −0.3 0.72 0.45 ns ns ns Dichelachne crinita 3.6 3.9 −1.2 −0.1 0.86 0.57 ns ns ns Deyeuxia avenoides 1.5 1.9 0.0 +2.8 0.9 1.12 * ns nsForbs Wahlenbergia 37.8 49.0 −15.8 −25.4 5.67 4.86 ** *** ns albomarginata Geranium sessiliflorum 34.6 31.1 −26.4 −25.7 5.66 3.81 *** *** ns Acaena caesiiglauca 28.2 31.1 −22.2 −27.2 4.06 5.08 *** *** ns Uncinia divaricata/ 11.9 12.4 −3.4 −5.8 1.11 2.11 ** ** ns Carex breviculmis Epilobium alsinoides 4.8 5.6 −4.0 −4.9 1.46 2.46 * *** ns Helichrysum spp. 2.6 6.6 −2.0 −5.9 1.39 5.84 ns ns ns Viola cunninghamii 2.4 4.0 −2.1 −2.7 2.07 1.51 ns * ns Raoulia subsericea 1.9 2.4 −1.3 −2.3 0.96 1.02 * ** ns Dichondra repens 1.4 1.5 −0.9 −0.9 0.50 0.43 ** * ns Gnaphalium audax 1.7 5.1 +0.2 −3.4 0.92 2.61 ns ns ns Pteridium esculentum 2.4 1.0 −1.2 +0.1 0.91 0.07 ns ns ns Luzula rufa 1.2 1.6 −0.1 −0.8 0.34 0.48 ns ns ns Raoulia australis 4.2 1.1 −2.4 −0.4 1.97 0.59 ns ns nsWoodyspecies Ozothamnus leptophyllus 11.5 10.2 −5.4 −3.2 2.23 2.87 ns ** ns Leucopogon fraseri 6.1 7.8 −2.1 −2.7 2.15 2.52 ns ns ns Vittadinia australis 4.8 8.5 −2.9 −7.4 0.83 2.62 * *** * Muehlenbeckiaspp. 1.6 3.0 +0.4 +1.8 0.56 1.38 ns ns ns Pimelia spp. 1.2 0.8 −0.1 +0.3 0.17 0.51 ns ns ns Coprosma propinqua 0.7 0.6 +1.2 +0.7 0.78 0.30 ns * ns_________________________________________________________________________________________________________________________
237ROSE,FRAMPTON:RAPIDSHORT-TUSSOCKGRASSLANDDECLINE
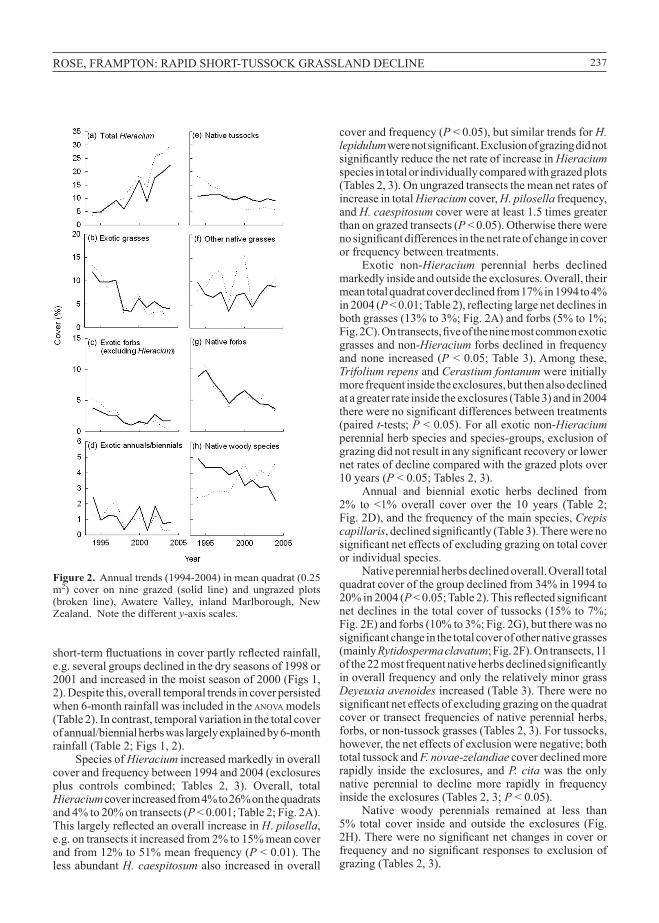
short-term fluctuations in cover partly reflected rainfall, e.g.severalgroupsdeclinedinthedryseasonsof1998or2001andincreasedinthemoistseasonof2000(Figs1,2).Despitethis,overalltemporaltrendsincoverpersistedwhen6-monthrainfallwasincludedintheanovamodels(Table2).Incontrast,temporalvariationinthetotalcoverofannual/biennialherbswaslargelyexplainedby6-monthrainfall(Table2;Figs1,2).
SpeciesofHieraciumincreasedmarkedlyinoverallcoverandfrequencybetween1994and2004(exclosuresplus controls combined; Tables 2, 3). Overall, totalHieracium coverincreasedfrom4%to26%onthequadratsand4%to20%ontransects(P<0.001;Table2;Fig.2A).This largely reflected an overall increase in H.pilosella, e.g. ontransectsitincreasedfrom2%to15%meancoverandfrom12%to51%meanfrequency(P<0.01).ThelessabundantH. caespitosum alsoincreasedinoverall
Figure 2. Annualtrends(1994-2004)inmeanquadrat(0.25m2) cover on nine grazed (solid line) and ungrazed plots(broken line), Awatere Valley, inland Marlborough, NewZealand.Notethedifferenty-axisscales.
coverandfrequency(P<0.05),butsimilartrendsforH. lepidulum were not significant. Exclusion of grazing did not significantly reduce the net rate of increase in Hieraciumspeciesintotalorindividuallycomparedwithgrazedplots(Tables2,3).OnungrazedtransectsthemeannetratesofincreaseintotalHieraciumcover,H. pilosellafrequency,andH. caespitosumcoverwereatleast1.5timesgreaterthanongrazedtransects(P<0.05).Otherwisetherewereno significant differences in the net rate of change in cover orfrequencybetweentreatments.
Exotic non-Hieracium perennial herbs declinedmarkedlyinsideandoutsidetheexclosures.Overall,theirmeantotalquadratcoverdeclinedfrom17%in1994to4%in2004(P < 0.01; Table 2), reflecting large net declines in bothgrasses(13%to3%;Fig.2A)andforbs(5%to1%;Fig. 2C). On transects, five of the nine most common exotic grassesandnon-Hieraciumforbsdeclinedinfrequencyandnone increased(P<0.05;Table3).Amongthese,Trifolium repensandCerastium fontanum wereinitiallymorefrequentinsidetheexclosures,butthenalsodeclinedatagreaterrateinsidetheexclosures(Table3)andin2004there were no significant differences between treatments (pairedt-tests;P<0.05).Forallexoticnon-Hieraciumperennialherbspeciesandspecies-groups,exclusionofgrazing did not result in any significant recovery or lower netratesofdeclinecomparedwiththegrazedplotsover10years(P<0.05;Tables2,3).
Annual and biennial exotic herbs declined from2% to <1% overall cover over the 10 years (Table 2;Fig.2D),andthefrequencyofthemainspecies,Crepis capillaris, declined significantly (Table 3). There were no significant net effects of excluding grazing on total cover orindividualspecies.
Nativeperennialherbsdeclinedoverall.Overalltotalquadratcoverofthegroupdeclinedfrom34%in1994to20%in2004(P < 0.05; Table 2). This reflected significant netdeclinesinthetotalcoveroftussocks(15%to7%;Fig.2E)andforbs(10%to3%;Fig.2G),buttherewasnosignificant change in the total cover of other native grasses (mainlyRytidosperma clavatum;Fig.2F).Ontransects,11of the 22 most frequent native herbs declined significantly inoverallfrequencyandonlytherelativelyminorgrassDeyeuxia avenoidesincreased(Table3).Therewerenosignificant net effects of excluding grazing on the quadrat coverortransectfrequenciesofnativeperennialherbs,forbs,ornon-tussockgrasses(Tables2,3).Fortussocks,however,theneteffectsofexclusionwerenegative;bothtotaltussockandF. novae-zelandiaecoverdeclinedmorerapidly inside theexclosures,andP. citawas theonlynative perennial to decline more rapidly in frequencyinsidetheexclosures(Tables2,3;P<0.05).
Native woody perennials remained at less than5% total cover inside andoutside the exclosures (Fig.2H). There were no significant net changes in cover or frequency and no significant responses to exclusion of grazing(Tables2,3).
238 NEWZEALANDJOURNALOFECOLOGY,VOL.31,NO.2,2007
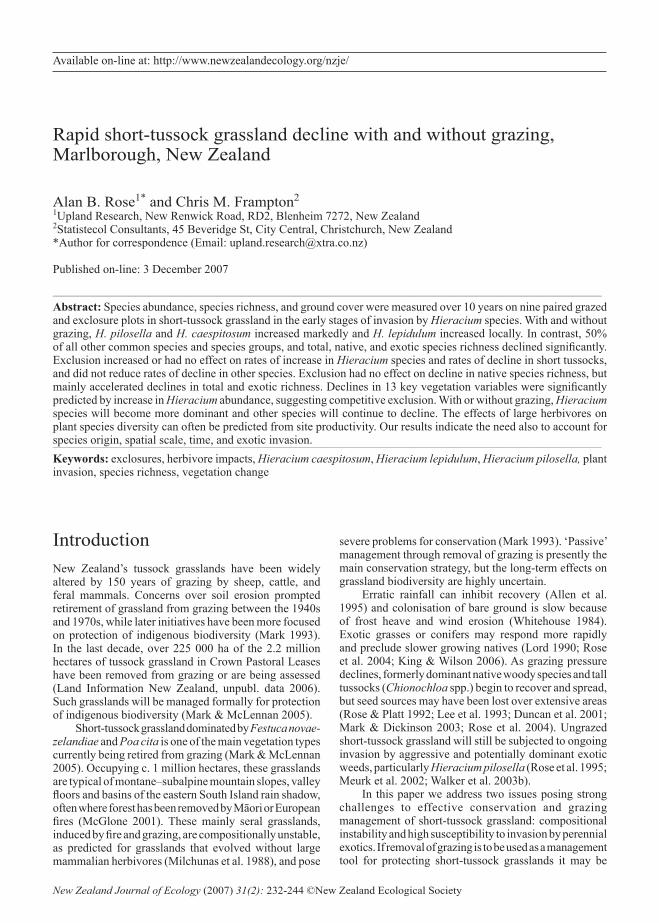
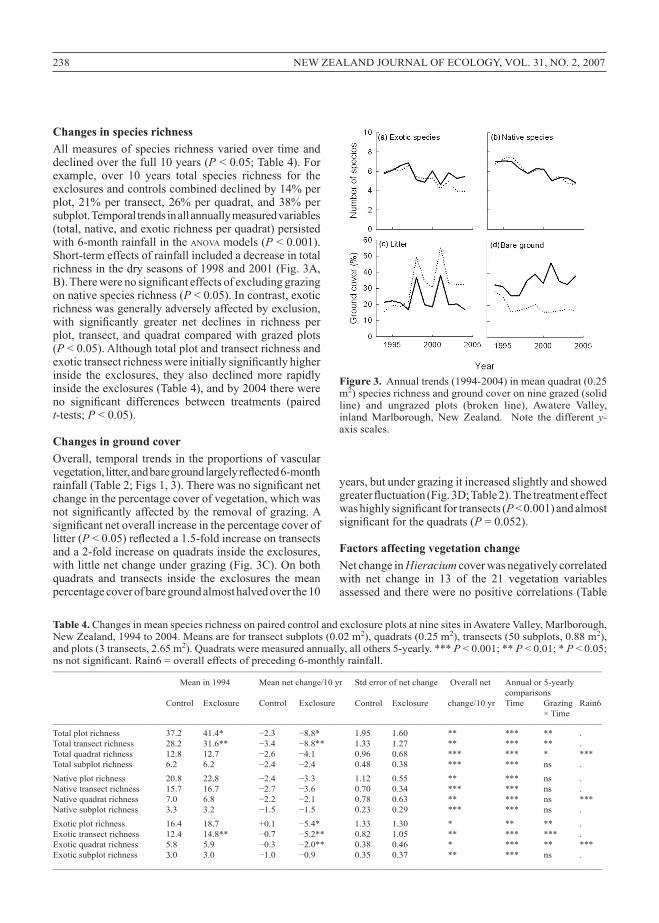
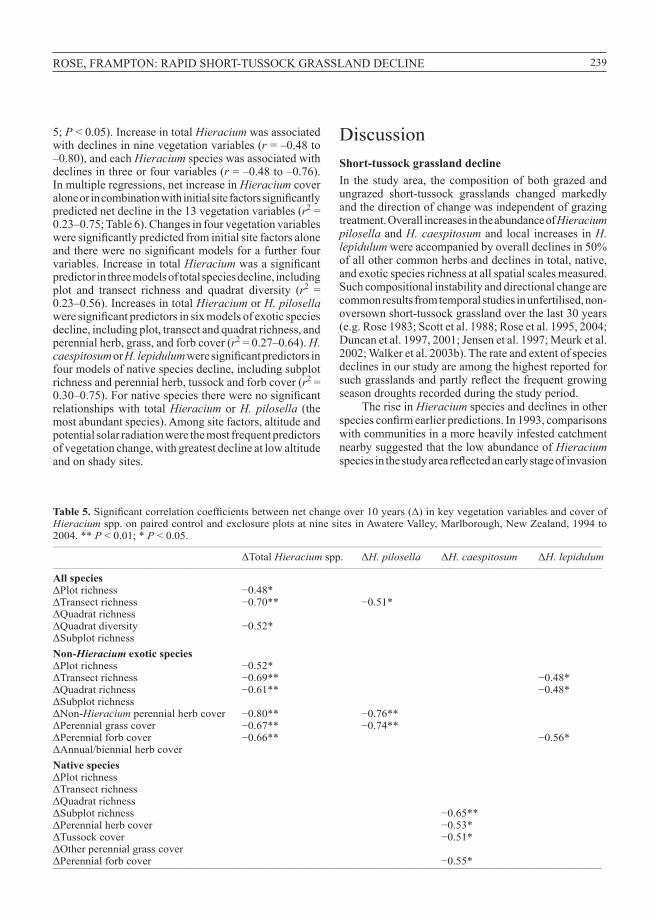
Changes in species richnessAllmeasuresof species richnessvariedover timeanddeclinedoverthefull10years(P<0.05;Table4).Forexample, over 10 years total species richness for theexclosuresandcontrolscombineddeclinedby14%perplot,21%per transect,26%perquadrat,and38%persubplot.Temporaltrendsinallannuallymeasuredvariables(total,native,andexoticrichnessperquadrat)persistedwith6-monthrainfallintheanovamodels(P<0.001).Short-termeffectsofrainfallincludedadecreaseintotalrichnessinthedryseasonsof1998and2001(Fig.3A,B). There were no significant effects of excluding grazing onnativespeciesrichness(P<0.05).Incontrast,exoticrichnesswasgenerallyadverselyaffectedbyexclusion,with significantly greater net declines in richness per plot, transect,andquadratcomparedwithgrazedplots(P<0.05).Althoughtotalplotandtransectrichnessandexotic transect richness were initially significantly higher inside the exclosures, they also declined more rapidlyinsidetheexclosures(Table4),andby2004therewereno significant differences between treatments (paired t-tests;P<0.05).
Changes in ground coverOverall, temporaltrendsintheproportionsofvascularvegetation, litter, and bare ground largely reflected 6-month rainfall (Table 2; Figs 1, 3). There was no significant net changeinthepercentagecoverofvegetation,whichwasnot significantly affected by the removal of grazing. A significant net overall increase in the percentage cover of litter(P < 0.05) reflected a 1.5-fold increase on transects anda2-foldincreaseonquadratsinsidetheexclosures,withlittlenetchangeundergrazing(Fig.3C).Onbothquadrats and transects inside the exclosures the meanpercentagecoverofbaregroundalmosthalvedoverthe10
years,butundergrazingitincreasedslightlyandshowedgreater fluctuation (Fig. 3D; Table 2). The treatment effect was highly significant for transects (P<0.001)andalmostsignificant for the quadrats (P=0.052).
Factors affecting vegetation changeNetchangeinHieraciumcoverwasnegativelycorrelatedwith net change in 13 of the 21 vegetation variablesassessedandtherewerenopositivecorrelations(Table
Table 4.ChangesinmeanspeciesrichnessonpairedcontrolandexclosureplotsatninesitesinAwatereValley,Marlborough,NewZealand,1994to2004.Meansarefortransectsubplots(0.02m2),quadrats(0.25m2),transects(50subplots,0.88m2),andplots(3transects,2.65m2).Quadratsweremeasuredannually,allothers5-yearly.***P<0.001;** P<0.01;* P<0.05;ns not significant. Rain6 = overall effects of preceding 6-monthly rainfall.___________________________________________________________________________________________________________________________________
Meanin1994 Meannetchange/10yr Stderrorofnetchange Overallnet Annualor5-yearly comparisons Control Exclosure Control Exclosure Control Exclosure change/10yr Time Grazing Rain6 ×Time___________________________________________________________________________________________________________________________________
Total plot richness 37.2 41.4* −2.3 −8.8* 1.95 1.60 ** *** ** .Total transect richness 28.2 31.6** −3.4 −8.8** 1.33 1.27 ** *** ** .Total quadrat richness 12.8 12.7 −2.6 −4.1 0.96 0.68 *** *** * ***Total subplot richness 6.2 6.2 −2.4 −2.4 0.48 0.38 *** *** ns .Native plot richness 20.8 22.8 −2.4 −3.3 1.12 0.55 ** *** ns .Native transect richness 15.7 16.7 −2.7 −3.6 0.70 0.34 *** *** ns .Native quadrat richness 7.0 6.8 −2.2 −2.1 0.78 0.63 ** *** ns ***Native subplot richness 3.3 3.2 −1.5 −1.5 0.23 0.29 *** *** ns .Exotic plot richness 16.4 18.7 +0.1 −5.4* 1.33 1.30 * ** ** .Exotic transect richness 12.4 14.8** −0.7 −5.2** 0.82 1.05 ** *** *** .Exotic quadrat richness 5.8 5.9 −0.3 −2.0** 0.38 0.46 * *** ** ***Exotic subplot richness 3.0 3.0 −1.0 −0.9 0.35 0.37 ** *** ns ._________________________________________________________________________________________________________________________
Figure 3. Annualtrends(1994-2004)inmeanquadrat(0.25m2)speciesrichnessandgroundcoveronninegrazed(solidline) and ungrazed plots (broken line), Awatere Valley,inland Marlborough, New Zealand. Note the different y-axisscales.
239ROSE,FRAMPTON:RAPIDSHORT-TUSSOCKGRASSLANDDECLINE
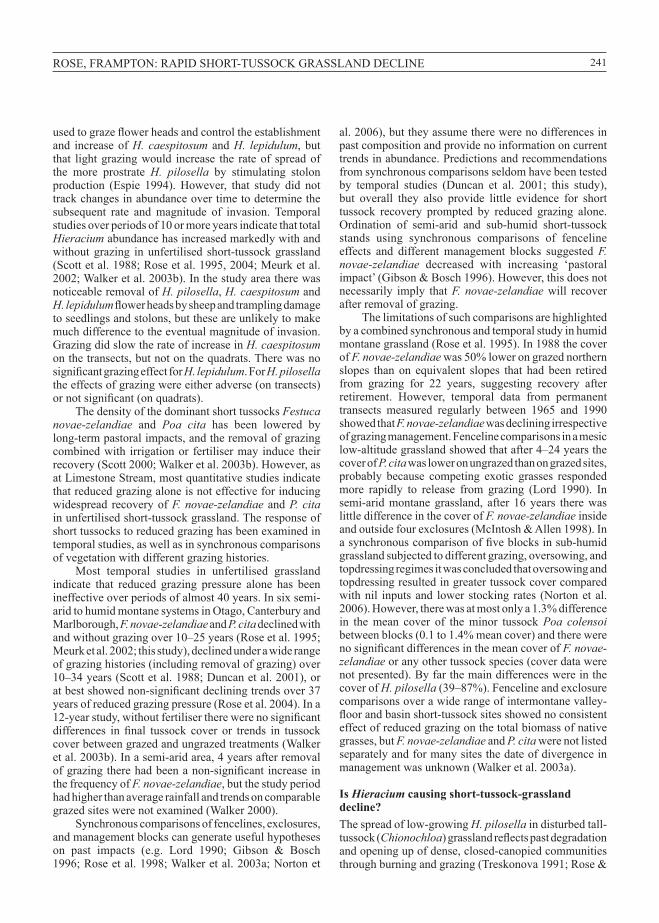
5;P<0.05).IncreaseintotalHieraciumwasassociatedwithdeclinesinninevegetationvariables(r=–0.48to–0.80),andeachHieraciumspecieswasassociatedwithdeclinesinthreeorfourvariables(r=–0.48to–0.76).Inmultipleregressions,netincreaseinHieraciumcoveralone or in combination with initial site factors significantly predictednetdeclineinthe13vegetationvariables(r2=0.23–0.75;Table6).Changesinfourvegetationvariableswere significantly predicted from initial site factors alone and there were no significant models for a further four variables.IncreaseintotalHieracium was a significant predictorinthreemodelsoftotalspeciesdecline,includingplot and transect richness and quadrat diversity (r2 =0.23–0.56).IncreasesintotalHieraciumorH. pilosellawere significant predictors in six models of exotic species decline,includingplot,transectandquadratrichness,andperennialherb,grass,andforbcover(r2=0.27–0.64).H. caespitosumorH. lepidulum were significant predictors in fourmodelsofnativespeciesdecline,includingsubplotrichnessandperennialherb,tussockandforbcover(r2=0.30–0.75). For native species there were no significant relationshipswith totalHieracium orH. pilosella (themostabundantspecies).Amongsitefactors,altitudeandpotentialsolarradiationwerethemostfrequentpredictorsofvegetationchange,withgreatestdeclineatlowaltitudeandonshadysites.
DiscussionShort-tussock grassland declineIn the studyarea, the compositionofbothgrazedandungrazed short-tussock grasslands changed markedlyandthedirectionofchangewasindependentofgrazingtreatment.OverallincreasesintheabundanceofHieracium pilosellaandH. caespitosum andlocal increases inH. lepidulumwereaccompaniedbyoveralldeclinesin50%ofallothercommonherbsanddeclinesintotal,native,andexoticspeciesrichnessatallspatialscalesmeasured.Suchcompositionalinstabilityanddirectionalchangearecommonresultsfromtemporalstudiesinunfertilised,non-oversownshort-tussockgrasslandoverthelast30years(e.g.Rose1983;Scottetal.1988;Roseetal.1995,2004;Duncanetal.1997,2001;Jensenetal.1997;Meurketal.2002;Walkeretal.2003b).Therateandextentofspeciesdeclinesinourstudyareamongthehighestreportedforsuch grasslands and partly reflect the frequent growing seasondroughtsrecordedduringthestudyperiod.
TheriseinHieraciumspeciesanddeclinesinotherspecies confirm earlier predictions. In 1993, comparisons withcommunitiesinamoreheavilyinfestedcatchmentnearbysuggestedthatthelowabundanceofHieracium species in the study area reflected an early stage of invasion
Table 5. Significant correlation coefficients between net change over 10 years (Δ) in key vegetation variables and cover of Hieraciumspp.onpairedcontrolandexclosureplotsatninesitesinAwatereValley,Marlborough,NewZealand,1994to2004.**P<0.01;* P<0.05.___________________________________________________________________________________________________________________________________
ΔTotal Hieracium spp. ΔH. pilosella ΔH. caespitosum ΔH. lepidulum___________________________________________________________________________________________________________________________________
All speciesΔPlot richness −0.48*ΔTransect richness −0.70** −0.51*ΔQuadrat richnessΔQuadrat diversity −0.52*ΔSubplot richnessNon-Hieracium exotic speciesΔPlot richness −0.52*ΔTransect richness −0.69** −0.48*ΔQuadrat richness −0.61** −0.48*ΔSubplot richnessΔNon-Hieracium perennial herb cover −0.80** −0.76**ΔPerennial grass cover −0.67** −0.74**ΔPerennial forb cover −0.66** −0.56*ΔAnnual/biennial herb coverNative speciesΔPlot richnessΔTransect richnessΔQuadrat richnessΔSubplot richness −0.65**ΔPerennial herb cover −0.53*ΔTussock cover −0.51*ΔOther perennial grass coverΔPerennial forb cover −0.55*___________________________________________________________________________________________________________________________________

240 NEWZEALANDJOURNALOFECOLOGY,VOL.31,NO.2,2007
ratherthaninherentlylowsusceptibilitytoinvasion(Roseetal.1998).In1995,Hieraciumseedlingswerewidespread(38seedlingsper100m2)despitelowcovervalues,andwere establishing among vegetation, litter, and baresoilinproportiontotheavailabilityofthesesubstrates– indicating none conferred significant resistance to invasion (Rose&Frampton1999).The large increasein Hieracium species (especially H. pilosella) since1994conformstothe‘grasslanddecline’model,whichintegrateslong-termpredisposingfactorsandshort-termtriggerfactorstopredictthelikelymagnitudeofinvasion(Rose et al. 1998). For Limestone Stream, suggestedpredisposingfactorsincludetheongoingrainofHieraciumpropagules from outside the catchment and increasingavailabilityfromwithin,combinedwitha longhistoryof anthropogenic disturbance, a stressful environmentcharacterisedbylowsoilfertilityandlowgrowing-seasonrainfall,andavegetationstructureandcompositionthatconferslittleresistancetoinvasionbecauseoflowstature,low canopy cover, low tussock density, shallow litterlayers, abundant safe sites for seedling establishment,andthepresenceofmanynativespeciesthatarepoorlyadaptedtograzingortrampling(Roseetal.1998;Rose&Frampton1999).TriggerfactorsthatprobablyacceleratedHieraciuminvasionandgrasslanddeclineinthepresent
studyincludethetwoverydryseasonsof1998and2001,whichhadobviousnegative impactson thevegetationbutfromwhichHieraciumspeciesrecoveredrapidlytocontinueincreasing.
Does removal of grazing induce recovery?The removal of grazing had few beneficial effects on indigenous biodiversity or pastoral production over10years.Therewerenoinstanceswhereitslowedtheincrease in Hieracium species or the declines in anyotherspecies.Withoutgrazing,theratesofincreaseinHieraciumspeciesandratesofdeclineinnativetussocks(Festuca novae-zelandiae,Poa cita)andexoticspeciesrichnessweregreaterthanorequaltograzedgrassland.The only potential benefits we found were a decline in bare groundandanincreaseinplantlitter(seealsoMcIntosh& Allen 1998), but these may have partly reflected greaterHieraciumincreaseandtussockdeathinsidetheexclosures.Anincreaseinlittercanalsohaveanegativeeffectonspeciesrichness,althoughthisismostmarkedinmoreproductivegrasslands(Tilman1993;Foster&Gross1998).
A comparisonof existingHieracium cover insideandoutsideexclosuresatseveralsitesintheearlystagesof invasion led to the conclusion that sheep could be
Table 6. Significant regression models using initial site factors and change in Hieracium cover topredictchanges in21key vegetation variables (Δ = net change over 10 yr) on paired control and exclosure plots at nine sites in Awatere Valley, Marlborough,NewZealand,1994to2004.Sitevariablesincludetopsoilsodium(Na),sulphur(S)andnitrogen(N),potentialsolarradiation(PSR),andaltitude(ALT).***P<0.001;**P<0.01;*P < 0.05; ns not significant.___________________________________________________________________________________________________________________________________
R2 P___________________________________________________________________________________________________________________________________
All speciesΔPlot richness = −0.38 − 0.32(ΔTotal Hieracium) 0.23 *ΔTransect richness = 3.00 – 0.31(ΔTotal Hieracium) − 64.58Na 0.56 **ΔQuadrat richness = −6.84 + 8.35PSR 0.27 *ΔQuadrat diversity = −1.96 − 0.02(ΔTotal Hieracium)+0.001ALT 0.41 **ΔSubplot richness - nsNon-Hieracium exotic speciesΔPlot richness = 1.67 − 0.27(ΔTotal Hieracium) 0.27 *ΔTransect richness = 3.35 − 0.23(ΔTotal Hieracium) − 49.95Na 0.61 ***ΔQuadrat richness = −0.33 − 0.08(ΔTotal Hieracium) 0.37 **ΔSubplot richness = −4.96 + 0.003ALT 0.32 *ΔNon-Hieracium perennial herb cover = 0.31 − 0.62(ΔTotal Hieracium) 0.64 ***ΔPerennial grass cover = −1.34 − 0.53(ΔH. pilosella) 0.54 ***ΔPerennial forb cover = 1.70 − 0.14(ΔTotal Hieracium) − 1.00S 0.58 ***ΔAnnual/biennial herb cover = −6.47 + 0.005ALT 0.37 **Native speciesΔPlot richness - nsΔTransect richness - nsΔQuadrat richness = −1.91 + 40.18Na − 16.76N 0.50 **ΔSubplot richness = −2.47 − 0.19(ΔH. caespitosum)+3.01PSR 0.75 ***ΔPerennial herb cover = −27.80 − 1.43(ΔH. caespitosum)+43.54PSR 0.47 **ΔTussock cover = −0.98 − 1.41(ΔH. caespitosum) − 0.75(ΔH. lepidulum) 0.50 **ΔOther perennial grass cover - nsΔPerennial forb cover = −4.93 − 0.75(ΔH. caespitosum) 0.30 *___________________________________________________________________________________________________________________________________
241ROSE,FRAMPTON:RAPIDSHORT-TUSSOCKGRASSLANDDECLINE
used to graze flower heads and control the establishment and increaseofH. caespitosum andH. lepidulum, butthat lightgrazingwould increase the rateof spreadofthe more prostrate H. pilosella by stimulating stolonproduction (Espie 1994). However, that study did nottrackchangesinabundanceovertimetodeterminethesubsequent rate and magnitude of invasion. Temporalstudiesoverperiodsof10ormoreyearsindicatethattotalHieraciumabundancehasincreasedmarkedlywithandwithoutgrazing inunfertilised short-tussockgrassland(Scottetal.1988;Roseetal.1995,2004;Meurketal.2002;Walkeretal.2003b).InthestudyareatherewasnoticeableremovalofH. pilosella,H. caespitosumandH. lepidulum flower heads by sheep and trampling damage toseedlingsandstolons,buttheseareunlikelytomakemuchdifferencetotheeventualmagnitudeofinvasion.GrazingdidslowtherateofincreaseinH. caespitosum onthetransects,butnotonthequadrats.Therewasnosignificant grazing effect for H. lepidulum.ForH. pilosella theeffectsofgrazingwereeitheradverse(ontransects)or not significant (on quadrats).
ThedensityofthedominantshorttussocksFestuca novae-zelandiae and Poa cita has been lowered bylong-termpastoralimpacts,andtheremovalofgrazingcombinedwith irrigationor fertilisermay induce theirrecovery(Scott2000;Walkeretal.2003b).However,asatLimestoneStream,mostquantitativestudiesindicatethatreducedgrazingaloneisnoteffectiveforinducingwidespread recoveryofF. novae-zelandiae andP. citainunfertilisedshort-tussockgrassland.Theresponseofshorttussockstoreducedgrazinghasbeenexaminedintemporalstudies,aswellasinsynchronouscomparisonsofvegetationwithdifferentgrazinghistories.
Most temporal studies in unfertilised grasslandindicate that reduced grazing pressure alone has beenineffectiveoverperiodsofalmost40years.Insixsemi-aridtohumidmontanesystemsinOtago,CanterburyandMarlborough,F.novae-zelandiaeandP. citadeclinedwithandwithoutgrazingover10–25years(Roseetal.1995;Meurketal.2002;thisstudy),declinedunderawiderangeofgrazinghistories(includingremovalofgrazing)over10–34years(Scottetal.1988;Duncanetal.2001),orat best showed non-significant declining trends over 37 yearsofreducedgrazingpressure(Roseetal.2004).Ina12-year study, without fertiliser there were no significant differences in final tussock cover or trends in tussock coverbetweengrazedandungrazedtreatments(Walkeretal.2003b).Inasemi-aridarea,4yearsafterremovalof grazing there had been a non-significant increase in thefrequencyofF. novae-zelandiae,butthestudyperiodhadhigherthanaveragerainfallandtrendsoncomparablegrazedsiteswerenotexamined(Walker2000).
Synchronouscomparisonsoffencelines,exclosures,andmanagementblockscangenerateusefulhypotheseson past impacts (e.g. Lord 1990; Gibson & Bosch1996;Roseetal.1998;Walkeretal.2003a;Nortonet
al.2006),buttheyassumetherewerenodifferencesinpastcompositionandprovidenoinformationoncurrenttrendsinabundance.Predictionsandrecommendationsfromsynchronouscomparisonsseldomhavebeentestedby temporal studies (Duncan et al. 2001; this study),but overall they also provide little evidence for shorttussock recovery prompted by reduced grazing alone.Ordination of semi-arid and sub-humid short-tussockstands using synchronous comparisons of fencelineeffects and different management blocks suggested F. novae-zelandiae decreased with increasing ‘pastoralimpact’(Gibson&Bosch1996).However,thisdoesnotnecessarily imply thatF. novae-zelandiaewill recoverafterremovalofgrazing.
Thelimitationsofsuchcomparisonsarehighlightedbyacombinedsynchronousandtemporalstudyinhumidmontanegrassland(Roseetal.1995).In1988thecoverofF. novae-zelandiaewas50%lowerongrazednorthernslopes than on equivalent slopes that had been retiredfrom grazing for 22 years, suggesting recovery afterretirement. However, temporal data from permanenttransects measured regularly between 1965 and 1990showedthatF. novae-zelandiaewasdecliningirrespectiveofgrazingmanagement.Fencelinecomparisonsinamesiclow-altitudegrasslandshowedthatafter4–24yearsthecoverofP. citawasloweronungrazedthanongrazedsites,probably because competing exotic grasses respondedmore rapidly to release from grazing (Lord 1990). Insemi-aridmontanegrassland, after 16years therewaslittledifferenceinthecoverofF. novae-zelandiaeinsideandoutsidefourexclosures(McIntosh&Allen1998).Ina synchronous comparison of five blocks in sub-humid grasslandsubjectedtodifferentgrazing,oversowing,andtopdressingregimesitwasconcludedthatoversowingandtopdressingresultedingreatertussockcovercomparedwithnil inputsand lowerstocking rates (Nortonetal.2006).However,therewasatmostonlya1.3%differencein the mean cover of the minor tussock Poa colensoibetweenblocks(0.1to1.4%meancover)andtherewereno significant differences in the mean cover of F. novae-zelandiaeoranyothertussockspecies(coverdatawerenotpresented).ByfarthemaindifferenceswereinthecoverofH. pilosella(39–87%).Fencelineandexclosurecomparisonsoverawiderangeofintermontanevalley-floor and basin short-tussock sites showed no consistent effectofreducedgrazingonthetotalbiomassofnativegrasses,butF. novae-zelandiaeandP. citawerenotlistedseparatelyandformanysitesthedateofdivergenceinmanagementwasunknown(Walkeretal.2003a).
Is Hieracium causing short-tussock-grassland decline?Thespreadoflow-growingH. pilosellaindisturbedtall-tussock(Chionochloa) grassland reflects past degradation andopeningupofdense,closed-canopiedcommunitiesthroughburningandgrazing(Treskonova1991;Rose&
242 NEWZEALANDJOURNALOFECOLOGY,VOL.31,NO.2,2007
Frampton1999).Afterremovalofdisturbance,talltussockscanrecoverandinhibitfurtherspreadofH. pilosellafor10–30 years (Meurk et al. 2002; Mark & Dickinson2003).ResistancetothemoreerectandshadetolerantH. lepidulumislesscertain(Rose&Frampton1999).Thepastoral conversionof closed tall-tussockgrassland tomoreopenshort-tussockgrasslandrepresentsathresholdininvasibility,andtherapidspreadofHieraciumspeciesin both grazed and ungrazed short-tussock grasslandsreflects their naturally low resistance to invasive plants (Roseetal.1998;Rose&Frampton1999).
Ourstudysupportstheinterpretationthatcompetitionfrom Hieracium species is a direct cause of furthervegetationdegradationandspeciesdeclinesinunfertilisedshort-tussock grassland. Hieracium invasion is notrestrictedtounvegetatedsubstrates.Hieraciumseedlingsestablishwithinalltypesofvegetationsubstratepresentandeventhephysiognomicallydominantshorttussockspose few barriers to establishment (Rose & Frampton1999). It is unlikely that further vegetative expansionor dense seedling establishment would not be directlyat the expense of that vegetation. Once dense patchesareestablished,H. pilosellacaneffectivelycapturesoilresources including moisture and mineral N, probablyoutcompetingresidentplantsandfurtherpromotingthespreadofHieracium(McIntosh&Allen1998;Scottetal.2001).Inthestudyarea,Hieraciumspeciesweretheonlyplantstoshowlargeincreasesinabundancewhilehalfofallotherspeciesdeclinedoverthe10yearstudyperiod. It is likely that the rapid rates of increase inHieraciumanddeclineinotherspecieswerepartlytheresultofdrought,butHieraciumspeciesrecoveredmorerapidlythanothers.
Quantitative correlations between the rise inHieracium and declines in other species have been difficult todemonstrate in individual temporalstudies(Duncanetal.2001;Walkeretal.2003b;Roseetal.2004),butacomparisonbetweenseveral studies showed that theproportion of decreasing species increased with theextentofinvasion(Roseetal.2004).Inthestudyarea,netdeclinesinkeyspeciescoverandrichnessvariableswere significantly predicted by the net increase in cover ofHieraciumspecies,regardlessofgrazingtreatment.
Effects of grazing on species diversityTheeffectsoflargeherbivoresonspeciesdiversityoftenfit within a site productivity framework. Effects are most intense inhigh-productivitygrasslands,wherereducedgrazing(includingexclusion)generallycausesadeclineinspeciesdiversity.Inunproductivegrasslands,reducedgrazing either promotes diversity or has little effect(Gibson&Kirkpatrick1989;Virtanenetal.2002;Bakkeret al. 2006). However, grazing effects are not alwaysas accuratelypredicted.Both thedirectionand rateofchangeinspeciesabundancescanvarywithproductivity(Pakeman2004)andtherelationshipbetweendiversity
and productivity can vary over time (Tilman 1993).Additionally,asimpleproductivityframeworkdoesnotreadilyaccountfordisplacementofspeciesbyinvadingexotics.Fortherelativelyunproductivegrasslandsofthestudyarea,theeffectsofexclusiononspeciesrichnessvariedwithspeciesoriginandspatialscale,andwealsosuggesttheymaybetimedependent.PartlyinresponsetoHieracium invasion, species richnesswasdecliningboth with and without grazing. As predicted by theproductivity framework, there were no significant effects of exclusion on the ongoing decline in native speciesrichness.Incontrast,however,exoticrichnessgenerallydeclinedmorerapidlyinresponsetoexclusionthanundergrazing.Additionally,theadverseeffectsofexclusionontotalandexoticrichnessweremorepronouncedforplotsandtransectsthanforthesmallerquadratsandsubplots.Over the first 10 years, exclusion has promoted decline in thenumberofdisturbance-adaptedexotics,butthispartlyreflects greater invasion by Hieraciumspecies.Overthenext10yearsthismaywellbefollowedbyamorerapiddeclineinnativerichness,especiallyifHieraciumspeciescontinuetobecomemoredominantinsidethanoutsidetheexclosures.
Future trends and managementTheabundancecurvesforHieraciumspeciesinthestudyareashownosignsoflevellingoffinthenearfutureandwewouldthereforeexpectfurtherdeclinesinawiderrangeofspecies.Theclearimplicationsofthisandallotherrecentstudiesoftemporalchangeinshort-tussockgrasslandarethat successful futuremanagement forconservationofindigenousbiodiversityor forpastoralproductionwillnotbeabletorelysolelyonremovalormanipulationofgrazingpressure,willneedtoreducetheabundanceofatleastonespeciesof Hieracium,andwillneedtobeableto drive vegetation change in an acceptable direction.Tomaintainshort-tussockgrassland,bothconservationand pastoral management will rely on the successfulestablishmentandspreadofHieraciumbiocontrolagents(Morin&Syrett1996;Syrettetal.1996).Inappropriateareas,conservationmanagementwillneedtoencouragesuccessiontocommunitiescapableofmoreeffectivelyresistingHieracium invasion,suchasnativeshrublandor forest. Continued pastoral production will rely onongoinginputsoffertiliserandoversowingwithexoticherbaceous species that can outcompete Hieracium athighersoilnutrientlevels.
AcknowledgementsThis study was funded by the Marlborough DistrictCouncil,theMarlboroughResearchCentreTrust,LandcareResearch,andtheHellabyIndigenousGrasslandsResearchTrust. We thank Kate Rose, Sarah Rose, Kevin Platt,Richard Hunter and others for assistance with fieldwork,
243ROSE,FRAMPTON:RAPIDSHORT-TUSSOCKGRASSLANDDECLINE
the Landcare Research analytical laboratory for soilanalyses,andthePittsFamilyforlogisticalsupport.ThanksalsotoRichardDuncan,AlanMark,ClaireNewell,andthe journal referees forhelpful commentson thedraftmanuscript.
ReferencesAllenRB,WilsonJB,MasonCR1995.Vegetationchange
followingexclusionofgrazinganimalsindepletedgrassland,CentralOtago,NewZealand.JournalofVegetationScience6:615–626.
BakkerES,RitchieME,OlffH,MilchunasDG,KnopsJMH 2006. Herbivore impact on grassland plantdiversity depends on habitat productivity andherbivoresize.EcologyLetters9:780–788.
BlakemoreLC,SearlePL,DalyBK1987.Methodsforchemical analysis of soils. NZ Soil Bureau Scientific Report80.LowerHutt,DSIR.103p.
DuncanRP,ColhounKM,ForanBD1997.ThedistributionandabundanceofHieraciumspecies(hawkweeds)inthedrygrasslandsofCanterburyandOtago.NewZealandJournalofEcology21:51–62.
Duncan RP, Webster RJ, Jensen CA 2001. DecliningplantspeciesrichnessinthetussockgrasslandsofCanterburyandOtago,SouthIsland,NewZealand.NewZealandJournalofEcology25(2):35–47.
EspiePR1994:Integratedpastoralmanagementstrategiesfor Hieracium control. Proceedings of the NewZealandGrasslandAssociation56:243–247.
Foster BL, Gross KL 1998. Species richness in asuccessionalgrassland:effectsofnitrogenenrichmentandplantlitter.Ecology79:2593–2602.
GibsonN,KirkpatrickJB1989.EffectsofthecessationofgrazingonthegrasslandsandgrassywoodlandsoftheCentralPlateau,Tasmania.AustralianJournalofBotany37:55–63.
GibsonRS,BoschOJH1996.IndicatorspeciesfortheinterpretationofvegetationconditionintheStBathansarea, Central Otago, New Zealand. New ZealandJournalofEcology20:163–172.
JensenCA,WebsterRJ,CarterD,TreskonovaM1997.Successionintussockgrasslands: implicationsforconservationmanagement.ScienceforConservation61.Wellington,DepartmentofConservation.43p.
KingWMCG,WilsonJB2006.Differentiationbetweennativeandexoticplantspeciesfromadrygrassland:fundamentalresponsestoresourceavailability,andgrowthrates.AustralEcology31:996–1004.
LeeWG,FennerM,DuncanRP1993.Patternofnaturalregeneration of narrow-leaved snow tussockChionochloa rigida ssp. rigida in Central Otago,NewZealand.NewZealandJournalofBotany31:117–125.
LordJM1990.ThemaintenanceofPoa citagrassland
by grazing. New Zealand Journal of Ecology 13:43–49.
MarkAF1993.IndigenousgrasslandsofNewZealand.In:CouplandRTed.EcosystemsoftheworldVolume8b.Naturalgrasslands–EasternHemisphere.Amsterdam,TheNetherlands,Elsevier.Pp.361–410.
Mark AF, Dickinson KJM 2003. Temporal responsesover 30 years to removal of grazing from a mid-altitudesnowtussockgrasslandreserve,LammerlawEcological Region, New Zealand. New ZealandJournalofBotany41:655–668.
MarkAF,McLennanB2005.TheconservationstatusofNewZealand’sindigenousgrasslands.NewZealandJournalofBotany43:245–270.
McGloneMS2001.TheoriginoftheindigenousgrasslandsofsoutheasternSouthIslandinrelationtopre-humanwoodyecosystems.NewZealandJournalofEcology25(1):1–15.
McIntosh PD,Allen RB 1998. Effect of exclosure onsoils, biomass, plant nutrients, andvegetation, onunfertilised steeplands, upper Waitaki District,SouthIsland,NewZealand.NewZealandJournalofEcology22:209–217.
MeurkCD,WalkerS,GibsonRS,EspieP2002.ChangesinvegetationstatesingrazedandungrazedMackenzieBasingrasslands,NewZealand,1990–2000.NewZealandJournalofEcology26:95–106.
Milchunas DG, Sala OE, Lauenroth WK 1988: Ageneralizedmodeloftheeffectsofgrazingbylargeherbivoresongrasslandcommunitystructure.TheAmericanNaturalist132:87–106.
MorinL,SyrettP1996.Prospectsforbiologicalcontrolof Hieracium pilosella with the rust Puccinia hieracii var. piloselloidarum in New Zealand. In:MoranVC, Hoffmann JH eds Proceedings of theIXInternationalSymposiumonBiologicalControlofWeeds.Stellenbosch,SouthAfrica,UniversityofCapeTown.Pp.199–204.
Norton DA, Espie PR, Murray W, Murray J 2006. Influence ofpastoralmanagementonplantbiodiversityinadepletedshorttussockgrassland,MackenzieBasin.NewZealandJournalofEcology30:335–344.
Pakeman RJ 2004. Consistency of plant species andtrait responses to grazing along a productivitygradient:amulti-siteanalysis.JournalofEcology92:893–905.
RoseAB 1983. Succession in fescue (Festuca novae-zelandiae) grasslands of the Harper–Avocacatchment, Canterbury, New Zealand. ForestResearchInstituteBulletin16.Christchurch,ForestResearchInstitute.35p.
Rose AB, Frampton CM 1999. Effects of micrositecharacteristicsonHieraciumseedlingestablishmentintall-andshort-tussockgrasslands,Marlborough,NewZealand.NewZealandJournalofBotany37:107–118.
244 NEWZEALANDJOURNALOFECOLOGY,VOL.31,NO.2,2007
RoseAB,PlattKH1992.Snowtussock(Chionochloa)population responses to removal of sheep andEuropean hares, Canterbury, New Zealand. NewZealandJournalofBotany30:373–382.
Rose AB, Platt KH, Frampton CM 1995. Vegetationchange over 25 years in a New Zealand short-tussock grassland: Effects of sheep grazing andexoticinvasions.NewZealandJournalofEcology19:163–174.
RoseAB,BasherLR,WiserSK,PlattKH,LynnIH1998.Factors predisposing short-tussock grasslands toHieraciuminvasioninMarlborough,NewZealand.NewZealandJournalofEcology22:121–140.
RoseAB, Suisted PA, Frampton CM 2004. Recovery,invasion,anddeclineover37yearsinaMarlboroughshort-tussockgrassland,NewZealand.NewZealandJournalofBotany42:77–87.
Scott D 2000. Fertiliser and grazing rejuvenation offescuetussockgrassland.NewZealandJournalofAgriculturalResearch43:481–490.
Scott D, Dick RD, Hunter GG 1988. Changes in thetussockgrasslandsinthecentralWaimakaririRiverbasin,Canterbury,NewZealand,1947–1981.NewZealandJournalofBotany26:197–222.
ScottNA,SaggarS,McIntoshPD2001.Biogeochemicalimpact of Hieracium invasion in New Zealand’sgrazedtussockgrasslands:sustainabilityimplications.EcologicalApplications11:1311–1322.
SyrettP,HarmanHM,GrosskopfG,SmithLA1996.InsectsforbiologicalcontrolofhieraciuminNewZealand:aprogressreport.In:MoranVC,HoffmannJHeds
ProceedingsoftheIXInternationalSymposiumonBiologicalControlofWeeds.Stellenbosch,SouthAfrica,UniversityofCapeTown.Pp.213–218.
Tilman D 1993. Species richness of experimentalproductivitygradients:howimportantiscolonizationlimitation?Ecology74:2179–2191.
TreskonovaM1991.ChangesinthestructureoftalltussockgrasslandsandinfestationbyspeciesofHieraciumintheMackenziecountry,NewZealand.NewZealandJournalofEcology15:65–78.
VirtanenR,EdwardsGR,CrawleyMJ2002.Reddeermanagement and vegetation on the Isle of Rum.JournalofAppliedEcology39:572–583.
WalkerS2000.Post-pastoralchangesincompositionandguildsinasemi-aridconservationarea,CentralOtago,NewZealand.NewZealandJournalofEcology24:123–137.
Walker S, Lee WG, Rogers GM 2003a. Post-pastoralsuccession in intermontane valleys and basins ofeastern South Island, New Zealand. Science forConservation 227. Wellington, Department ofConservation.75p.
Walker S, Wilson JB, Lee WG 2003b. Recovery ofshorttussockandwoodyspeciesguildsinungrazedFestuca novae-zelandiae short tussock grasslandwithfertiliserorirrigation.NewZealandJournalofEcology27:179–189.
WhitehouseIE1984.ErosionintheeasternSouthIslandhigh country—a changing perspective. Review,TussockGrasslandsandMountainLandsInstitute42:3–23.
EditorialBoardmember:GrantEdwards