Embed Size (px)
Citation preview
INTERNATIONAL JOURNAL OF RESEARCH IN BUSINESS AND SOCIAL SCIENCE 10(2)(2021) 238-250
* Corresponding author. ORCID ID: 0000-0002-9003-9552
© 2021by the authors. Hosting by SSBFNET. Peer review under responsibility of Center for Strategic Studies in Business and Finance.
https://doi.org/10.20525/ijrbs.v10i2.1065
Impact of consumer’s security, benefits and usefulness towards
cashless transaction within Malaysian university student Kawsar Ahmad (a) Md. Arifuzzaman(b)* Abdullah Al Mamun (c)
Junayed Md Khaled Bin Oalid(d)
(a)Department of Economics and Management Sciences, International Islamic University Malaysia, Jalan Gombak,53100 Kuala Lumpur, Malaysia (b)Graduate School of Management (GSM), International Islamic University Malaysia, Jalan Gombak, 53100 Kuala Lumpur, Malaysia (c,d)Department of Information and Communication Technology, International Islamic University Malaysia, Jalan Gombak, 53100 Kuala Lumpur,
Malaysia
A R T I C L E I N F O
Article history:
Received 15 February 2021
Received in rev. form 03 March 2021
Accepted 05 March 2021
Keywords:
Behaviors of people, Malaysia,
Cashless transactions, benefits,
security and usefulness.
JEL Classification:
M3, M31
A B S T R A C T
The main purpose of this study is to evaluate the correlation of perceived security, benefits, and usefulness that has been associate with the cashless transaction attitude. The chosen mode for this
research is a quantitative approach. This method is favored because of its simplicity and systematic approach, The primary data were collected by distributing the respondents' questionnaires, A self-
administered survey is a questionnaire that was developed exclusively for a respondent. This questionnaire is the most suitable approach for this research because respondents respond comfortably
and don't need to make appointments with respondents. However, This study involves 120 participants from several locations in Selangor University, DarulHikmah Library at IIUM in the Gombak area, and
Shah Alam area. In the part of the analysis , there is two measurementss that would be tasted in the context of demographic component and assess the relations between the structures and how
independent variables affect the dependent variable. On the other hand, the mode of analysis is descriptive statistics and multiple regressions. Also, Both the results are presented by using the
statistical tools which are IBM Social Science Statistical Package (SPSS) version 25.0. The findings indicate that the benefits perceived and the adoption of cashless transactions are linked positively and
are of perceived importance and acceptance. From the study, this paper discovered that perceived protection correlates negatively. For future research of this subject, a greater variety of independent
factors and more detailed models may have been used and further analyses required for the factor analysis. This can lead to further findings that will give the next generation a wider range of knowledge.
© 2021 by the authors. Licensee SSBFNET, Istanbul, Turkey. This article is an open access article distributed under the terms and conditions of the Creative Commons Attribution (CC BY) license
(http://creativecommons.org/licenses/by/4.0/).
Introduction
Cashless companies and technical advancement are growing worldwide famous (Fabris, 2019). In the absence of currency, cashless
payment refers to financial transactions in which customers conduct financial transactions, primarily by using cards or electronic
methods (Bilińska-Reformat & Kieżel, 2016). Many countries, such as the Netherlands, Germany, and mostly Scandinavia, have
been used even more intensively for cashless payment schemes (Krüger & Seitz, 2014; Sreenu, 2020). In 2018–2019 the volumes
for global transactions without cash increased by 14 percent to 708,5 billion, the fastest growth reported in the past decade, according
to the Global Payments Report (2020) and Global Trade (2020). Check use globally decreased by 13,4% and over the last 10 years,
there has been an interesting increase in the debit card–to credit card ratio from 59:41 to 90:10 (World Payments Report, 2018). The
global rise in Cashless Transactions (CAGR) between 2015 and 2020 is projected to reach 10.9 percent (World Payments Report
2020), while growth in emerging Asia is projected to rise by 30.9 percent (CAGR) as a result of digital disruption and digital financial
inclusion payments (Research&Market, 2020).
In Malaysia, e-money is mostly spent 58.4 (56.2%) times per person, followed by internet banking on average at 18.7 (18.0%) times
per person, according to Pikri (2019). Most high-value payments are made via internet banking. Many Malaysian consumers can
make transactions through online banking for their insurance, vehicle, and home. Negara Bank Malaysia (2019) has registered 10.3
million credit card owners in 2018, compared to 42.5 million holders of debit cards. Non-cash customers in 2018 grew by 32,4
Research in Business & Social Science
IJRBS VOL 10 NO 2 ISSN: 2147-4478
Available online at www.ssbfnet.com
Journal homepage: https://www.ssbfnet.com/ojs/index.php/ijrbs
Ahmad et al., International Journal of Research in Business & Social Science 10(2) (2021), 238-250
239
million compared with 35,7 million in 2014. (Bank Negara Malaysia, 2019). There is steady development in other non-cash ways
like ATM and e-banking. Mering (2019) estimated that in Malaysia 63% of customers are using debit card cashless payments, and
57% are using online banking, in particular for paying online and telephone bills.
There are several benefits for customers by using cashless payments. Payments without cash are easy and fast (Teo, Tan, Ooi, Hew,
&Yew,2015). Cashless transfers do not encourage robs and other cash offenses, unlike regular cash purchases (Armey, Lipow,
&Webb, 2014), so people carry less money while shopping. The research by (Thomas, Jain, and Angus 2013) in 33 countries all over
the world put Malaysia in a cashless group at the beginning five years ago. In Kenya, South Africa, the UAE, and Poland, however,
the same party shows high growth trajectories because of innovation in payment solutions and heavy credit and debt extension. Their
research showed that access to financial markets, macroeconomic and cultural considerations are the pre-requisites for customer
cashless preparation. Above these are some of the factors affecting consumer adoption of cashless payments that are explored in our
study.
The goal of this study is to demonstrate how people rely on the financial model of transactions and how certain factors influenced
non-cash transactions. Since Malaysia has many youthful people with a high spending potential. The cashless mode of payment is
one of Malaysia's most common medium of transactions, with e-payment in particular(Ramalingam, 2012). Nevertheless, it is
emphasized that Malaysia is not yet much interested in e-payment transactions, for instance. That is because of many issues including
an inadequate knowledge about the online payment system, internet, and a lack of trust in e-payment platforms (Lin & Luarn, 2005).
Certain consumers still use cash and checks because consumers still have concerns about the electronic payment system (Hataiseree,
2008). On the other hand, the e-wallet introduces new dangers in cyber protection as new technologies in the paying sector. When
transacting online purchases, consumers are vulnerable to threats. Hacking, ransomware, and physical attacks are among the risks.
According to the report, while e-Wallet technology in Korea with 100,000 readers and terminals at a commercial point of sale (POS)
and numerous e-Wallet software has been in operation for over two years, there is a big problem because consumers have no interest
in the use of this technology. Internet connectivity was a big barrier in Mumbai for users to accept e-Wallet because e-Wallet requires
internet access. The e-wallet availability depends on the Internet and smartphones, such as tablets or handheld telephones. If the
handset is battery-free or has internet access, users can not get to the e-wallet. Malaysia's central bank records (2009), because of
lack of training and understanding, consumers are reluctant to participate in cashless transactions. Several types of research have also
shown that privacy and faith are the reason not to be part of the cashless transaction. This study aims to (I) to evaluate the correlation
of perceived security with a cashless transaction attitude; (ii) to evaluate the correlation of perceived benefits with a cashless
transaction attitude, (iii) to evaluate the correlation of perceived usefulness with a cashless transaction attitude
The advancements in internet technology are the result of rapid technological progress in terms of data provision, saving time, and
minimizing workload. Currently, a majority of individuals use transaction systems which is technology-based to save time and reduce
the risk of carrying cash. Some individuals in Malaysia are currently engaged in cashless payments and this figure seems shortly to
increase massively. Non-cash payments have become a standard that companies should encourage and inspire the young generation,
in particular. There is already a couple of young adults using tablets, desktops, and smartphones in their everyday lives, thereby
growing the number of cashless transactions. This is why a cashless transaction implementation will lead in the future to a positive
result. Any use of technologies, however, needs numerous safety tools to protect a person from the theft of identity. This research
will help us better understand the factors influencing people towards using e-transactions. This could have an effect on the credibility
for e-payment and can be used as a young individual, the future consumer who will then become a preferred means of e-payment for
cash companies in Malaysia, as clearly set out in the economic area model 2011-2020(Central bank of Malaysia, 2012). In various
previous studies , the study was found to have been done worldwide on e-Wallet. E-Wallet consumers take the decision to use e-
Wallet as a means of payment for their electronic transfers into account multiple considerations. Though concluded that control and
protection are controllable, the need to increase efficiency, impact in society, and usefulness as factors for explaining the motivation
of Punjab in using e-Wallet was a requirement. The social effect and usefulness considerations are considered to impact users with
deals, conveniences, and cashback on the use of a digital wallet. Also, concluded that their study has only explored such e-Wallet
adaptation factors and proposed that additional aspects be applied to potential research models for further analysis. While in several
surveys, the utility was listed as one of the main factors for e-wallet usage, the research found that e-wallet use had little impact.
Perceived Security was described as the largest consideration and technological evidence was followed.
Literature Review
Theoretical Background, Empirical Review and Hypotheses Development
Perceived security
In accordance with Linck et al (2006), the perceived security shall be called the subjective value of electronic transactions decided
by the consumer. However the research has been acknowledged by Stroborn et al. (2004), in any e-transaction, an e-payment system
needs very strong protection. However, it is unlikely that customers would participate in purchases that do not attain a standard of
protection (Tsiakis & Sthephanides, 2005). That being said, sufficient safety information can influence the user's safety perceptions
(Mukharjee & Nath, 2003).In electronic transactions, the information on security policy announcements, data protection declarations,
and safety features should be comprehensive (Belanger, Hiller, & Smith, 2002). Many studies have indicated that the important
Ahmad et al., International Journal of Research in Business & Social Science 10(2) (2021), 238-250
240
portion of the electronic payment or transaction calls for significant authentications, amendments, and confirmations generally
referred to as data security and integrity under technical protection specifics(Tsiakis & Sthephanides, 2005; Linck & Pousttchi, 2006).
Both the e-transactions and processes shall be adequately secure to satisfy customers' security needs and standards. Clients' security
issues would impact electronic payment structure appropriation. The respondents also said that if they encountered any violation of
protection they would not use the online exchanges. In either case, particular consideration was given considerable importance to the
crucial relationship between protection and deliberate use of e-payment systems. This could conveniently allow customers to begin
exchanging electronic payment platforms by enhancing and creating managerial and safer protection within the system(Kurnia &
Benjamin, 2007). This is why safety is seen in the study of e-payment or transactions as being 8 very significant(Abrazhevich, E-
payment systems: issues of user acceptance, 2001).
H1: The security perceived positively affects the intention of people to embrace cashless transactions.
Perceived benefit
Non-cash payments or payment systems like e-payments are effective as they are not too expensive Chou et al (2004). Therefore, the
bank delivering such services provide customers with the Highest sum of Transactions amount. However, this is one of the benefits
of comparatively inexpensive online purchases (Gerrard & Cunninghamm, 2003; San-Martin & Lo´pezCatala´n, 2013). As
Eastin(2002) says, the four online e-commerce exercises, for example, in the field of shopping, Control of the account, donation, and
electric payment, found that the selected option would be affected by comfort and money related to gain in time fetched. Some main
e-payment issues include savings in times and prices, as well as the ability to spend, transport, and shop (Chakravorti, 2003).
H2: The benefit perceived is the purpose of individuals to embrace cashless transactions.
Perceived usefulness
Even during the decade, contactless card purchases in retail and other industry sectors became widely used. Retailers, in particular,
benefited greatly from quicker transactions, greater spending, and enhanced customer satisfaction, while consumers enjoy the ease
of use, speed, and increased security. TAM is the framework taken in this study (Davis, 1989; Davis et al., 1989) suggests that the
two key drivers of technology adoption are two special assumptions, perceived utility and Simple to use perceived. The TAM has
frequently been used to determine the plan to develop emerging technologies, like mobile payments. The technology acceptance
model and its derivatives propose that the decision to implement new technologies depends on perceived value and ease of use, and
additional factors such as subjective expectations and Perceived threats. Perceived usefulness means "to the extent that a person
assumes the efficiency of his work will be increased using a system. “Perceived usefulness factors include performance growth,
efficiency improvement, efficiency, ultimate utility, cost-saving, and improved work performance (Tomi Dahlberg, 2010).
The perceived usefulness is generally considered an invitation to use the technologies of knowledge and, specifically, the perceived
use of usefulness is defined as "the level of an individual who chooses to believe that by using a certain system would boost the
effectiveness of his/her job" (Davis, 1989). Previous studies have confirmed the effect of deliberate utilized in different IT
circumstances, particularly booking online (Kucukusta et al., 2015), cell phone WiFi technology (Kim and Garrison, 2009), e-
commerce (Hernandez et al., 2009), online banking and cell phone commerce (Chong et al., 2012). The present study demonstrates
how beneficial it is to assume that using a cash-based platform saves a lot of days and time rises the efficiency of the purchase
process. For example, (Prybutok, 2008) reinterpreted TAM into RFID technology with the perceived usefulness and perceived ease
of six uses. The results of its study showed that higher perceived comfort (the perceived efficiency and performance expectancy of
use) contributed to more RFID technology being adopted. The findings of (Ozturk, 2016), in line with actual and previous TAM
research, confirmed the greatest influence on intention of using perceptual ease of use and perceived use. The results indicated that
the predominant 10 factors are deciding the perceived usefulness and user-friendliness in evaluating customers' desire to utilize
cashless RFID payment systems. In addition to its convenience and protection, electronic payments as shown by researchers are
economically efficient and these opportunities will if massively increased, contribute greatly to a country's economic growth. “Digital
automated transactions are helping to expand bank deposits and increase funds ready for immediate loans – which is driving all
economic activity in general.
A crucial number of macro-economic advantages are brought by reliable, secure and efficient electronic payments"(Ajayi, 2014).In
the same topic by Hord (2005), for the customer, electronic payment is quite easy. In several situations, only the account details like
credit card details and shipping address require to be entered once. The data is then processed on the retailer's internet server in a
database. You sign in only with your user id and password when you come right back to the Web site. Accomplishing a payment is
just as easy as clicking the mouse: simply confirm your order and you are done (Hord, 2005). Many people have been told that
electronic cash is convenient, that it saves time on people and easy access, which means that money can be immediately accessible
for us without being transported whilst money exchanging is largely redundant. As the key advantages of cashless payments are
frequently listed, transaction speed and convenience are suggested to influence consumer perception that cashless payments are
useful(Chen, 2006).
H3: The desire of people to embrace non-cash transactions is influenced by perceived usefulness
Ahmad et al., International Journal of Research in Business & Social Science 10(2) (2021), 238-250
241
Acceptance
One of the fascinating challenges in modern banking is to switch to cashless payment. Cashless transactions can have benefits such
as growing 11 government revenue, accessibility, lowering prices, reducing corruption, drug trafficking, and financial fraud. Also,
keeping cash in circulation is very costly, and substantial resources, i.e. only about two hundred billion ($200) are needed in the
United States To maintain the circulation of paper money each year. Chief of the Solutions Aon Chance Financial Services Division,
John Brosnan, stated, " I predict that in the next 30 years, after centuries of printing and cashing banknotes, we will be cash-free and
digital "(“Capital & Economics,” n.d., In-Depth section, para. 2)." One of the greatest pros to get cashless is to improve the approach
we pay for stuff, says Alex Reichmann, CEO of the iTestCash.For example Apple or Samsung Pay on your mobile may sometimes
be used "(Nash, S, N. 2017). Also, Jack Forestall believed that in 2020 about 70 percent or 5 billion people will be linked to a cashless
transaction through smartphones. Progress would be a significant step towards a non-cash transaction in the implementation of these
online payment solutions.
Sweden is heading into a non-cash system, and Dr. Stephen Lesavich, 70-year-old is very happy to have a cash-free transaction
because Sweden does not charge any charges for electronic payments. Therefore, he is more willing to pay online than in cash. I
believe that when cash clears up and all these cash transactions we can even erase the imbalance. It's really difficult when you talk
about a non-cash economy, but first, we need to do something so it can be achieved in a non-cash trade. Following Sanga, B (2016),
In a day, Rome wasn't established 7 and there won't be a cashless society until good progress has been made. Surprisingly, in
developed nations, most of the cashless approaches are taken. The physical infrastructure of finance in Africa is not adequate for
people in rural areas; mobile payment is an easy choice for them. A few futurists expect that in the first quart of the following century
the developing world will be a cashless society 12 to answer the drug smuggling issue. Unlawful activity typically takes place in
currency. Dr. Lesavich, therefore, stated that online anonymity will be compromised because banks, issuers of cards, and the
government would identify what you're doing and where you're doing.
Cash will go down and the world will eventually shift in a cashless way Some people, however, assume that cashless payment is very
risky and will have a huge effect on them. Following, Online payment will make people feel really worried. Arman believes that
money is available anywhere, often works, never causes problems, private, easy, and anywhere is good. Security seems to be another
concern, and an attacker can easily interrupt several user-profiles and rob money. Reichmann also opined what would happen when
you're losing your phone or somebody else attempting to break into your account for digital payment. It is also difficult to equate the
security of your digital account to a large amount of cash. Technology is acceptable, but network communication is the big issue of
being cashless when technology is running. Any connection broken would be a tragedy and will affect the large numbers of people
in a non-cash society. Also, what if consumers cannot buy in emergencies? Dr. Stephen, however, opined what about those who are
potentially stuck in perpetual debt cycles due to high rates of interest, late fees, and other charges which they might dream of being
cashless? It is vital to be aware of how to use smartphones for payments before moving into a cashless transaction. Therefore, there
are different views among different people.
Relevant Theoretical Background
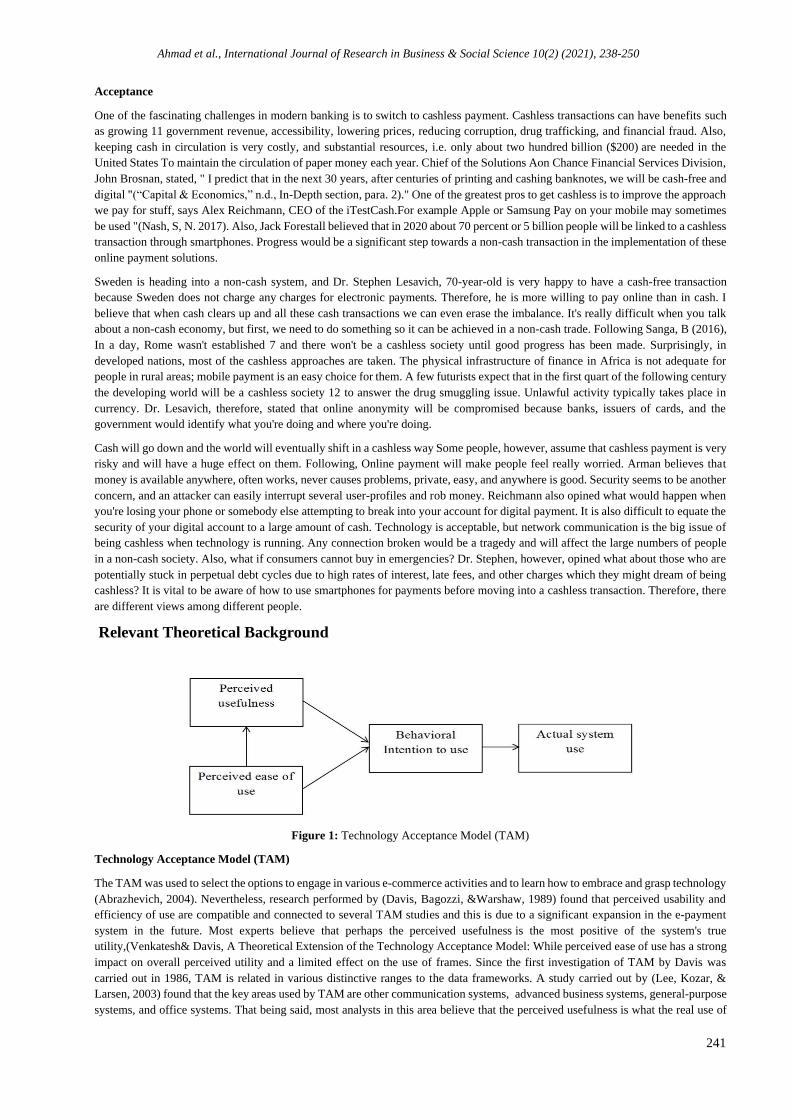
Figure 1: Technology Acceptance Model (TAM)
Technology Acceptance Model (TAM)
The TAM was used to select the options to engage in various e-commerce activities and to learn how to embrace and grasp technology
(Abrazhevich, 2004). Nevertheless, research performed by (Davis, Bagozzi, &Warshaw, 1989) found that perceived usability and
efficiency of use are compatible and connected to several TAM studies and this is due to a significant expansion in the e-payment
system in the future. Most experts believe that perhaps the perceived usefulness is the most positive of the system's true
utility,(Venkatesh& Davis, A Theoretical Extension of the Technology Acceptance Model: While perceived ease of use has a strong
impact on overall perceived utility and a limited effect on the use of frames. Since the first investigation of TAM by Davis was
carried out in 1986, TAM is related in various distinctive ranges to the data frameworks. A study carried out by (Lee, Kozar, &
Larsen, 2003) found that the key areas used by TAM are other communication systems, advanced business systems, general-purpose
systems, and office systems. That being said, most analysts in this area believe that the perceived usefulness is what the real use of
Ahmad et al., International Journal of Research in Business & Social Science 10(2) (2021), 238-250
242
the device is seen as. The ease of use, on the other hand, has a profound effect on the use of this system (Venkatesh, 2000).TAM is
better at describing what the behaviours is about using information systems than TRA (Theory of Reasoned Action) and TPB (Theory
of Planned Behaviours) (Mathieson, 1991). An accurate inspection structure is an important framework already proved by the TAM
model(King & He, 2006).
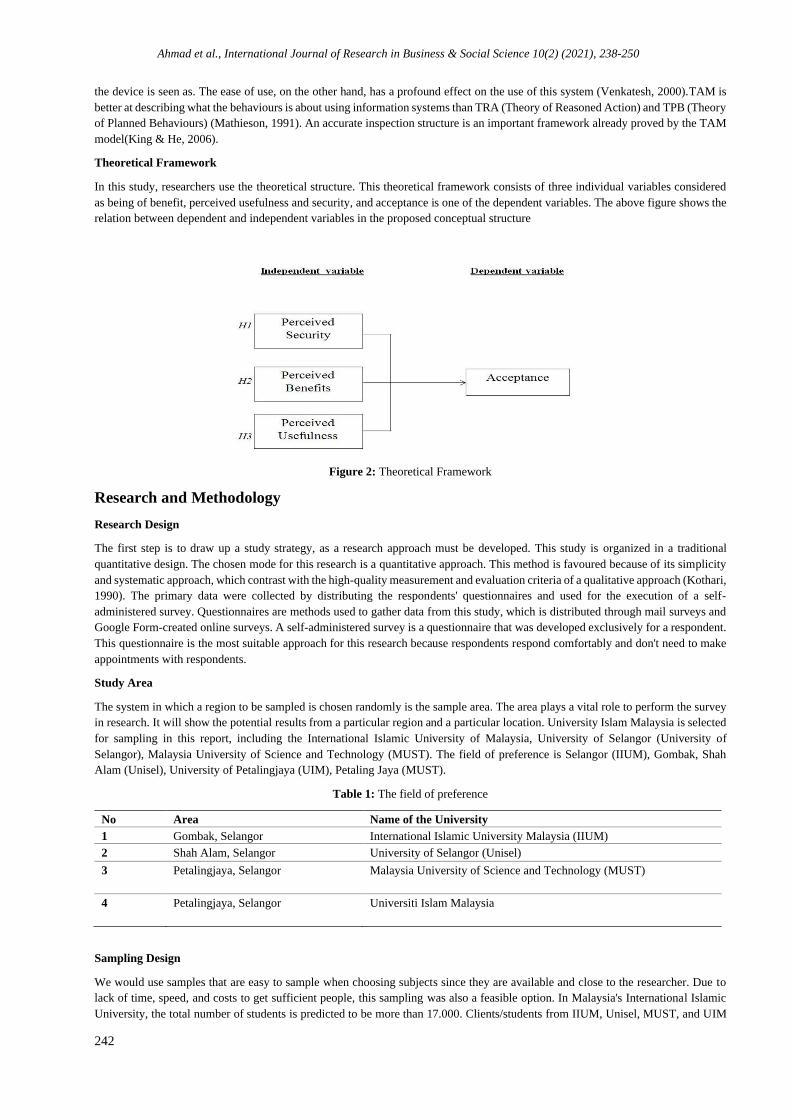
Theoretical Framework
In this study, researchers use the theoretical structure. This theoretical framework consists of three individual variables considered
as being of benefit, perceived usefulness and security, and acceptance is one of the dependent variables. The above figure shows the
relation between dependent and independent variables in the proposed conceptual structure
Figure 2: Theoretical Framework
Research and Methodology
Research Design
The first step is to draw up a study strategy, as a research approach must be developed. This study is organized in a traditional
quantitative design. The chosen mode for this research is a quantitative approach. This method is favoured because of its simplicity
and systematic approach, which contrast with the high-quality measurement and evaluation criteria of a qualitative approach (Kothari,
1990). The primary data were collected by distributing the respondents' questionnaires and used for the execution of a self-
administered survey. Questionnaires are methods used to gather data from this study, which is distributed through mail surveys and
Google Form-created online surveys. A self-administered survey is a questionnaire that was developed exclusively for a respondent.
This questionnaire is the most suitable approach for this research because respondents respond comfortably and don't need to make
appointments with respondents.
Study Area
The system in which a region to be sampled is chosen randomly is the sample area. The area plays a vital role to perform the survey
in research. It will show the potential results from a particular region and a particular location. University Islam Malaysia is selected
for sampling in this report, including the International Islamic University of Malaysia, University of Selangor (University of
Selangor), Malaysia University of Science and Technology (MUST). The field of preference is Selangor (IIUM), Gombak, Shah
Alam (Unisel), University of Petalingjaya (UIM), Petaling Jaya (MUST).
Table 1: The field of preference
No Area Name of the University
1 Gombak, Selangor International Islamic University Malaysia (IIUM)
2 Shah Alam, Selangor University of Selangor (Unisel)
3 Petalingjaya, Selangor Malaysia University of Science and Technology (MUST)
4 Petalingjaya, Selangor Universiti Islam Malaysia
Sampling Design
We would use samples that are easy to sample when choosing subjects since they are available and close to the researcher. Due to
lack of time, speed, and costs to get sufficient people, this sampling was also a feasible option. In Malaysia's International Islamic
University, the total number of students is predicted to be more than 17.000. Clients/students from IIUM, Unisel, MUST, and UIM
Ahmad et al., International Journal of Research in Business & Social Science 10(2) (2021), 238-250
243
with cashless purchases in various areas will be mainly used to perform this survey and 120 survey framework respondents will be
responsible for the survey.
Data analysis
According to James (2004), data processing should organize data, grouping it according to topics and themes into productive units.
In this analysis, the demographic component was evaluated in descriptive statistics. Frequencies have been calculated and reported
to indicate the samples taken the efficiency of the structures for Cronbach's Alpha has been calculated for each of the construction
for review. Multiple regressions were made to assess the extent of the relations between the structures and how independent variables
affect the dependent variable. Both results were carried out using the program known as IBM Social Science Statistical Package
(SPSS) version 25.0, with the main for data interpretation and formulation by questionnaires.
Results
The aim of this paper is to make the respondents aware of the situation. The sample features are especially critical in ensuring that
the right sets of people are involved. But this analysis is particularly necessary if quantitative techniques such as descriptive frequency
statistics are to be interpreted by the respondents.
Demographic Information
To explain the demographic diversity of their genders, age, Study levels, and nationality, descriptive demographic statistics with
frequencies, percentages, means, and standard differences were used. In the context of gender, the table reveals that most (27.5%) of
the participants represented 120 respondents, while the other participants represented 87 male participants (72.5%). We can see here
that these male participants are higher than females. On the other hand, age table indicate that between 20 and 25 years of age the
lowest members, 23 respondents (19.2 percent). Followed by a "26 and above" group of 97 participants (80.8 percent). Apart from
this two, there are two more segment has been identified which is study level and nationally . for the study levels ,it shows that
postgraduate students with 100 people participated the maximum (83.3 percent). Followed by participants who are studying at the
IIUM, 20 participants (16.7 percent). Last but not the least is nationality and in the case of nationality, there are very few international
students compare to iium in others university. therefore, less than foreign students participated in Malaysia. In Malaysia 19
respondents (15.8%) and in the IIUM 101 students are foreign (84.2 percent).
Table 2: Descriptive Statistics
Attributes Category Frequency %
Gender Male 87 72.5
Female 33 27.5
Age Between 20-25 23 19.2
26 and above 97 80.8
Level of study Undergraduate 20 16.7
Postgraduate 100 83.3
Nationality Malaysian 19 15.8
International 101 84.2
Data Collection and Descriptive statistics
Description statistics also describe the main features of information collection as a quantitative discipline (Mann, Prem S., 1995). It
aims to summarise a relativity survey rather than to expend details to investigate the population that should be the sample of data.
This means that descriptive statistics are not based purely on the probability theory (Dodge, Y., 2003). several of the methods that
are normally used for defining a collection of data include central tendency measures that include mean, median, and mode, and
variability or dispersion measures that include regular ( Also known as variance) minimum and maximum value variables.
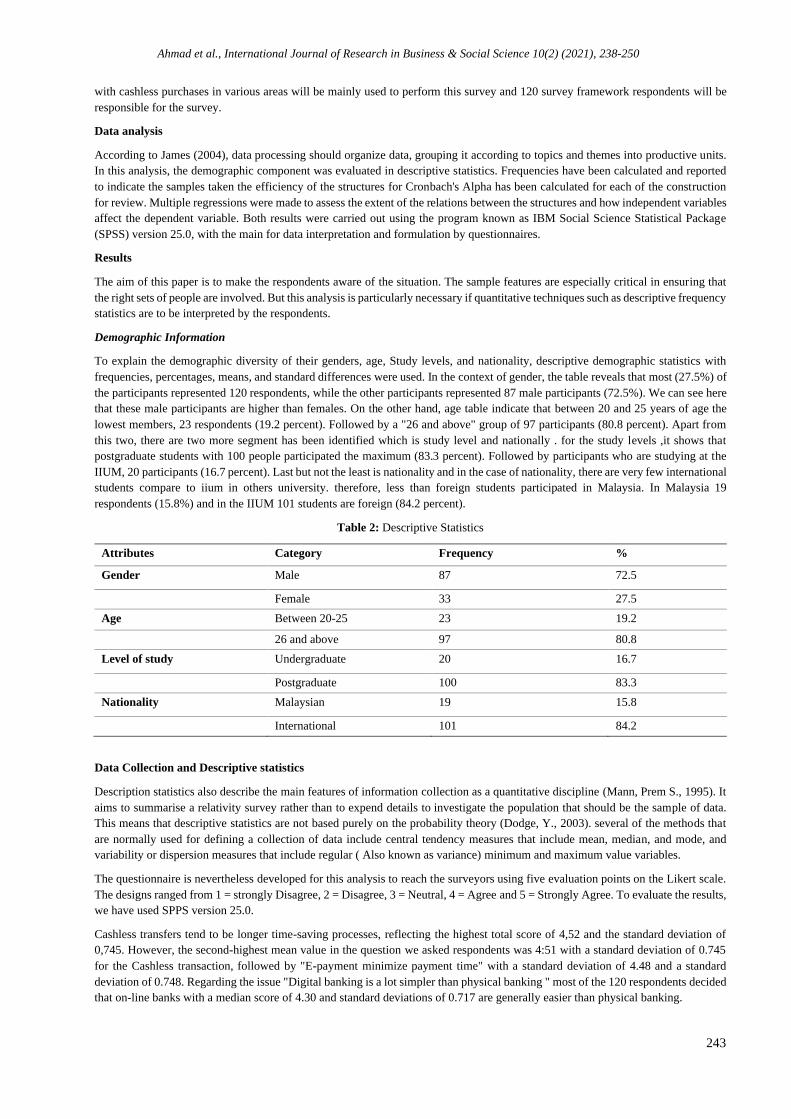
The questionnaire is nevertheless developed for this analysis to reach the surveyors using five evaluation points on the Likert scale.
The designs ranged from 1 = strongly Disagree, 2 = Disagree, 3 = Neutral, 4 = Agree and 5 = Strongly Agree. To evaluate the results,
we have used SPPS version 25.0.
Cashless transfers tend to be longer time-saving processes, reflecting the highest total score of 4,52 and the standard deviation of
0,745. However, the second-highest mean value in the question we asked respondents was 4:51 with a standard deviation of 0.745
for the Cashless transaction, followed by "E-payment minimize payment time" with a standard deviation of 4.48 and a standard
deviation of 0.748. Regarding the issue "Digital banking is a lot simpler than physical banking " most of the 120 respondents decided
that on-line banks with a median score of 4.30 and standard deviations of 0.717 are generally easier than physical banking.
Ahmad et al., International Journal of Research in Business & Social Science 10(2) (2021), 238-250
244
Table 3: Descriptive statistics
No Items N Mean Std. deviation
1 The most cashless payment provides adequate payment security
cashless payments ensure the ample protection of transaction
120 3.65 0.718
2 if the software is protected, I am willing to use e-payment 120 3.42 1.234
3 I will consider e-payment to be secure as if 3rd parties authentication is
checked.
120 3.97 0.829
4 In financial transactions, I remain uncertain about digital payment
limited costs.
120 4.04 0.974
5 cashless transaction encourages easiest operational activites 120 3.68 0.980
6 It helps to saves customer time as well. 120 4.51 0.745
7 The shop where cashless transactions are approved can easily be found. 120 3.64 1.083
8 Cashless transactions offer discounts and promotions. 120 3.82 1.037
9 E-wallet helps to change the way I looked for payment 120 3.36 1.165
10 E-paid eliminates the amount I currently spend. 120 4.84 0.744
11 E-paid helps me to settle on better payments 120 4.43 0.750
12 E-payment enables the comparison of goods between payment modes. 120 4.39 0.737
13 Transactions online are much better than traditional banks 120 4.30 0.717
14 Customers begin to purchase products and services online. 120 3.84 1.230
15 I embrace alternate cash payment mechanisms 120 4.26 0.704
16 The new transactional cashless mechanism has enabled our lives easier 120 4.52 0.745
Factor analysis
Factor analysis is a method used to simplify a wide variety of factors into fewer numbers. This procedure removes the highest
common variation and positions them in a common score from all variables. We will use this score to further evaluate it as an index
of all variables.
Kaiser-Meyer-Olkin (KMO) Measure of sampling adequacy
KMO tests the proportion of variation in the underlying factor variables which may be induced. KMO investigates whether there are
slight associations between variables. KMO value fundamental guidelines are:
• The poor are considered less than 0.05. •
• The average is between 0.5 and 0.6
• It is regarded to be appropriate between 0.6-0.7.
• Good is considered from 0.7-0.8.
• It is regarded as excellent above 0.
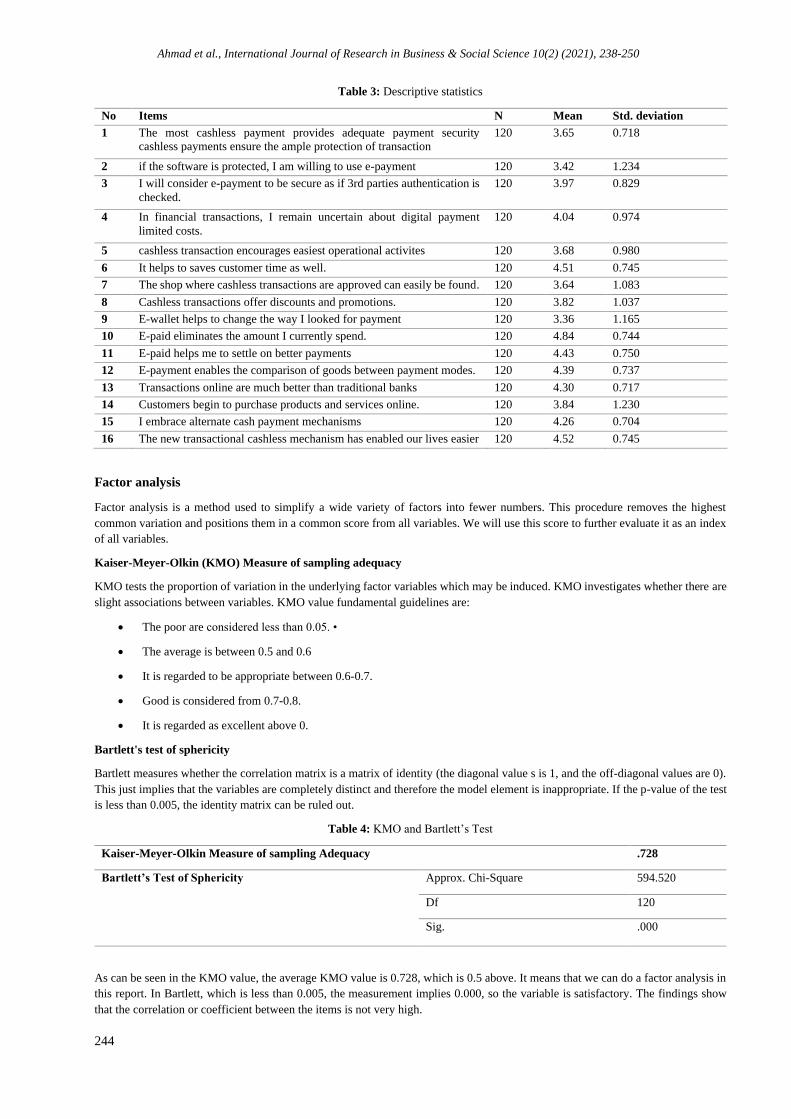
Bartlett's test of sphericity
Bartlett measures whether the correlation matrix is a matrix of identity (the diagonal value s is 1, and the off-diagonal values are 0).
This just implies that the variables are completely distinct and therefore the model element is inappropriate. If the p-value of the test
is less than 0.005, the identity matrix can be ruled out.
Table 4: KMO and Bartlett’s Test
Kaiser-Meyer-Olkin Measure of sampling Adequacy .728
Bartlett’s Test of Sphericity Approx. Chi-Square 594.520
Df 120
Sig. .000
As can be seen in the KMO value, the average KMO value is 0.728, which is 0.5 above. It means that we can do a factor analysis in
this report. In Bartlett, which is less than 0.005, the measurement implies 0.000, so the variable is satisfactory. The findings show
that the correlation or coefficient between the items is not very high.
Ahmad et al., International Journal of Research in Business & Social Science 10(2) (2021), 238-250
245
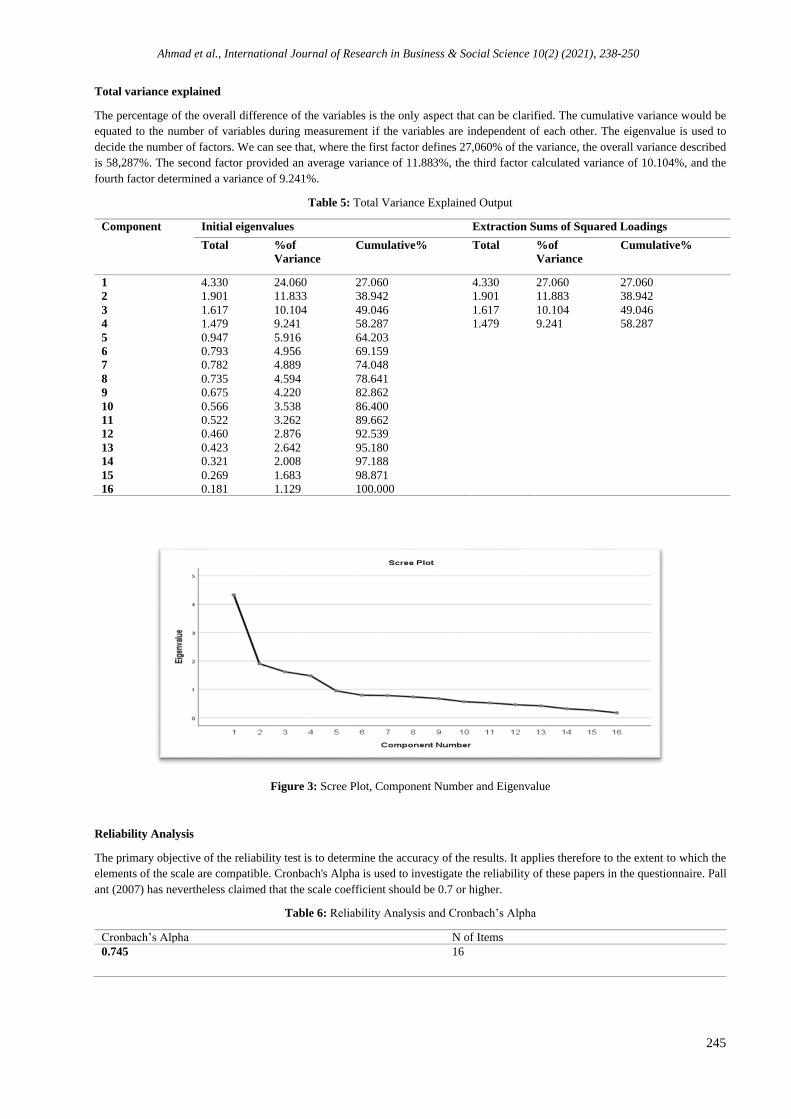
Total variance explained
The percentage of the overall difference of the variables is the only aspect that can be clarified. The cumulative variance would be
equated to the number of variables during measurement if the variables are independent of each other. The eigenvalue is used to
decide the number of factors. We can see that, where the first factor defines 27,060% of the variance, the overall variance described
is 58,287%. The second factor provided an average variance of 11.883%, the third factor calculated variance of 10.104%, and the
fourth factor determined a variance of 9.241%.
Table 5: Total Variance Explained Output
Component Initial eigenvalues Extraction Sums of Squared Loadings
Total %of
Variance
Cumulative% Total %of
Variance
Cumulative%
1
2
3
4
5
6
7
8
9
10
11
12
13
14
15
16
4.330
1.901
1.617
1.479
0.947
0.793
0.782
0.735
0.675
0.566
0.522
0.460
0.423
0.321
0.269
0.181
24.060
11.833
10.104
9.241
5.916
4.956
4.889
4.594
4.220
3.538
3.262
2.876
2.642
2.008
1.683
1.129
27.060
38.942
49.046
58.287
64.203
69.159
74.048
78.641
82.862
86.400
89.662
92.539
95.180
97.188
98.871
100.000
4.330
1.901
1.617
1.479
27.060
11.883
10.104
9.241
27.060
38.942
49.046
58.287
Figure 3: Scree Plot, Component Number and Eigenvalue
Reliability Analysis
The primary objective of the reliability test is to determine the accuracy of the results. It applies therefore to the extent to which the
elements of the scale are compatible. Cronbach's Alpha is used to investigate the reliability of these papers in the questionnaire. Pall
ant (2007) has nevertheless claimed that the scale coefficient should be 0.7 or higher.
Table 6: Reliability Analysis and Cronbach’s Alpha
Cronbach’s Alpha N of Items
0.745 16
Ahmad et al., International Journal of Research in Business & Social Science 10(2) (2021), 238-250
246
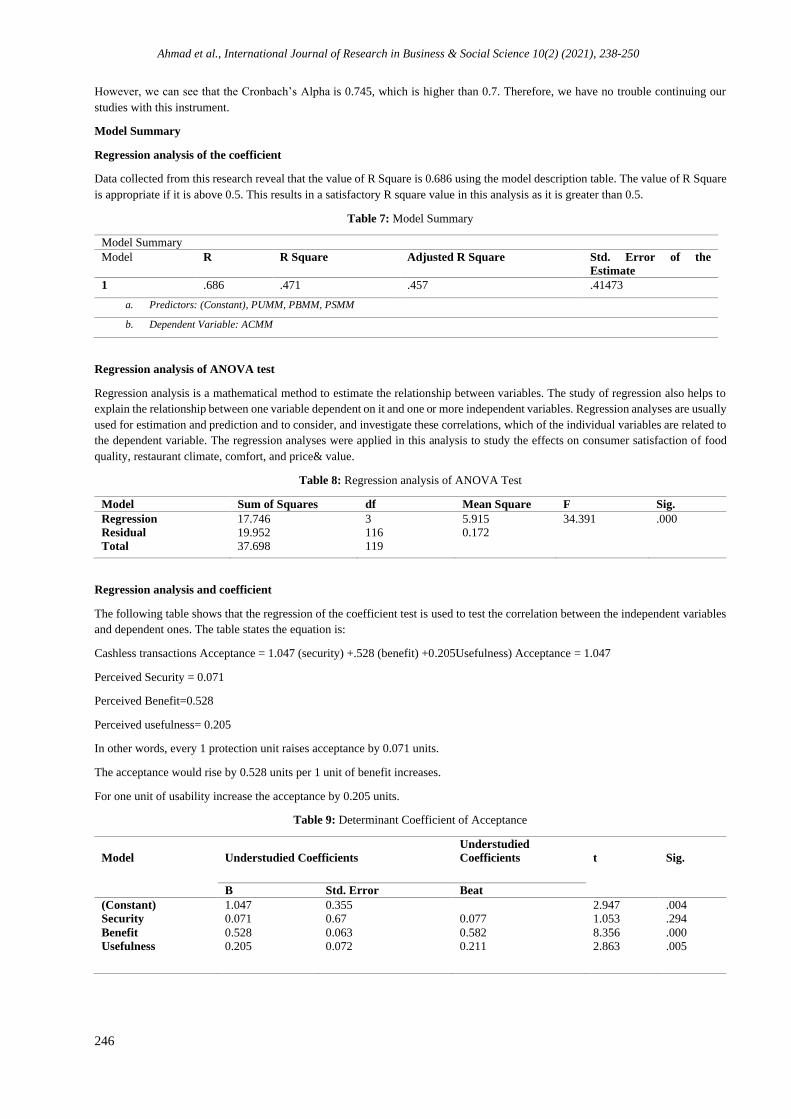
However, we can see that the Cronbach’s Alpha is 0.745, which is higher than 0.7. Therefore, we have no trouble continuing our
studies with this instrument.
Model Summary
Regression analysis of the coefficient
Data collected from this research reveal that the value of R Square is 0.686 using the model description table. The value of R Square
is appropriate if it is above 0.5. This results in a satisfactory R square value in this analysis as it is greater than 0.5.
Table 7: Model Summary
Model Summary
Model R R Square Adjusted R Square Std. Error of the
Estimate
1 .686 .471 .457 .41473
a. Predictors: (Constant), PUMM, PBMM, PSMM
b. Dependent Variable: ACMM
Regression analysis of ANOVA test
Regression analysis is a mathematical method to estimate the relationship between variables. The study of regression also helps to
explain the relationship between one variable dependent on it and one or more independent variables. Regression analyses are usually
used for estimation and prediction and to consider, and investigate these correlations, which of the individual variables are related to
the dependent variable. The regression analyses were applied in this analysis to study the effects on consumer satisfaction of food
quality, restaurant climate, comfort, and price& value.
Table 8: Regression analysis of ANOVA Test
Model Sum of Squares df Mean Square F Sig.
Regression
Residual
Total
17.746
19.952
37.698
3
116
119
5.915
0.172
34.391 .000
Regression analysis and coefficient
The following table shows that the regression of the coefficient test is used to test the correlation between the independent variables
and dependent ones. The table states the equation is:
Cashless transactions Acceptance = 1.047 (security) +.528 (benefit) +0.205Usefulness) Acceptance = 1.047
Perceived Security = 0.071
Perceived Benefit=0.528
Perceived usefulness= 0.205
In other words, every 1 protection unit raises acceptance by 0.071 units.
The acceptance would rise by 0.528 units per 1 unit of benefit increases.
For one unit of usability increase the acceptance by 0.205 units.
Table 9: Determinant Coefficient of Acceptance
Model
Understudied Coefficients
Understudied
Coefficients
t
Sig.
B Std. Error Beat
(Constant)
Security
Benefit
Usefulness
1.047
0.071
0.528
0.205
0.355
0.67
0.063
0.072
0.077
0.582
0.211
2.947
1.053
8.356
2.863
.004
.294
.000
.005
Ahmad et al., International Journal of Research in Business & Social Science 10(2) (2021), 238-250
247
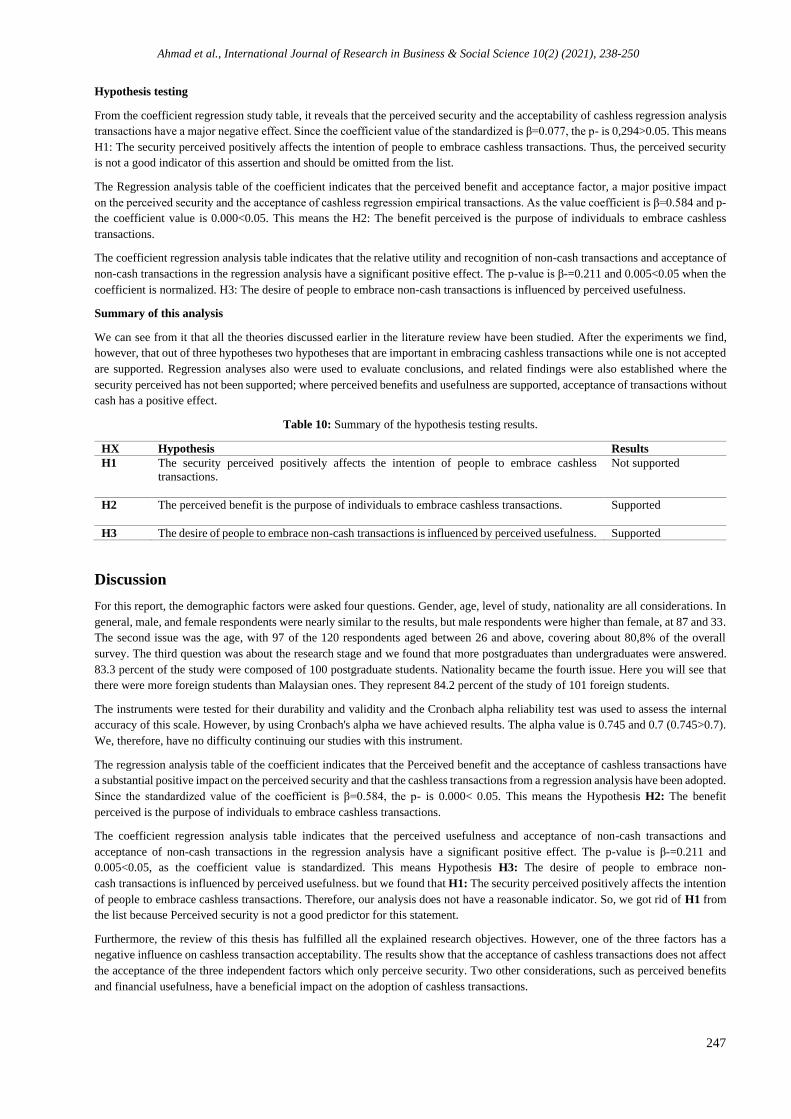
Hypothesis testing
From the coefficient regression study table, it reveals that the perceived security and the acceptability of cashless regression analysis
transactions have a major negative effect. Since the coefficient value of the standardized is β=0.077, the p- is 0,294>0.05. This means
H1: The security perceived positively affects the intention of people to embrace cashless transactions. Thus, the perceived security
is not a good indicator of this assertion and should be omitted from the list.
The Regression analysis table of the coefficient indicates that the perceived benefit and acceptance factor, a major positive impact
on the perceived security and the acceptance of cashless regression empirical transactions. As the value coefficient is β=0.584 and p-
the coefficient value is 0.000<0.05. This means the H2: The benefit perceived is the purpose of individuals to embrace cashless
transactions.
The coefficient regression analysis table indicates that the relative utility and recognition of non-cash transactions and acceptance of
non-cash transactions in the regression analysis have a significant positive effect. The p-value is β-=0.211 and 0.005<0.05 when the
coefficient is normalized. H3: The desire of people to embrace non-cash transactions is influenced by perceived usefulness.
Summary of this analysis
We can see from it that all the theories discussed earlier in the literature review have been studied. After the experiments we find,
however, that out of three hypotheses two hypotheses that are important in embracing cashless transactions while one is not accepted
are supported. Regression analyses also were used to evaluate conclusions, and related findings were also established where the
security perceived has not been supported; where perceived benefits and usefulness are supported, acceptance of transactions without
cash has a positive effect.
Table 10: Summary of the hypothesis testing results.
HX Hypothesis Results
H1 The security perceived positively affects the intention of people to embrace cashless
transactions.
Not supported
H2 The perceived benefit is the purpose of individuals to embrace cashless transactions.
Supported
H3 The desire of people to embrace non-cash transactions is influenced by perceived usefulness. Supported
Discussion
For this report, the demographic factors were asked four questions. Gender, age, level of study, nationality are all considerations. In
general, male, and female respondents were nearly similar to the results, but male respondents were higher than female, at 87 and 33.
The second issue was the age, with 97 of the 120 respondents aged between 26 and above, covering about 80,8% of the overall
survey. The third question was about the research stage and we found that more postgraduates than undergraduates were answered.
83.3 percent of the study were composed of 100 postgraduate students. Nationality became the fourth issue. Here you will see that
there were more foreign students than Malaysian ones. They represent 84.2 percent of the study of 101 foreign students.
The instruments were tested for their durability and validity and the Cronbach alpha reliability test was used to assess the internal
accuracy of this scale. However, by using Cronbach's alpha we have achieved results. The alpha value is 0.745 and 0.7 (0.745>0.7).
We, therefore, have no difficulty continuing our studies with this instrument.
The regression analysis table of the coefficient indicates that the Perceived benefit and the acceptance of cashless transactions have
a substantial positive impact on the perceived security and that the cashless transactions from a regression analysis have been adopted.
Since the standardized value of the coefficient is β=0.584, the p- is 0.000< 0.05. This means the Hypothesis H2: The benefit
perceived is the purpose of individuals to embrace cashless transactions.
The coefficient regression analysis table indicates that the perceived usefulness and acceptance of non-cash transactions and
acceptance of non-cash transactions in the regression analysis have a significant positive effect. The p-value is β-=0.211 and
0.005<0.05, as the coefficient value is standardized. This means Hypothesis H3: The desire of people to embrace non-
cash transactions is influenced by perceived usefulness. but we found that H1: The security perceived positively affects the intention
of people to embrace cashless transactions. Therefore, our analysis does not have a reasonable indicator. So, we got rid of H1 from
the list because Perceived security is not a good predictor for this statement.
Furthermore, the review of this thesis has fulfilled all the explained research objectives. However, one of the three factors has a
negative influence on cashless transaction acceptability. The results show that the acceptance of cashless transactions does not affect
the acceptance of the three independent factors which only perceive security. Two other considerations, such as perceived benefits
and financial usefulness, have a beneficial impact on the adoption of cashless transactions.
Ahmad et al., International Journal of Research in Business & Social Science 10(2) (2021), 238-250
248
Conclusions
While this analysis manages to predict a meaningful outcome, there are few drawbacks to be considered for prospective studies.
Since the sample for this study is not sufficiently different, it is restricted to the Malaysian population. To generalize the results of
the report, future studies should also suggest using a population from all states in Malaysia. To verify the translated questionnaire,
more studies could also consider carrying out the reliability test. We should ensure that the data reflect the principles they are to
calculate and that they do so accurately when employing statistical methods on the data. Validity and trustworthiness are not just an
easy job (Smith, 2003). It takes time, work, and experience to create valid and effective measuring instruments. Tools developed
already by other researchers are much easier to implement. For researchers, there have been several issues with interpreting measuring
devices, as in other cross-cultural studies. Because of cultural and linguistic variations, the questions or objects in the interpreted
instruments can have very different definitions and thus endanger the authenticity and efficiency of measures (Van der Vijyer, 2003).
But in the context of generalization , transaction being an big issue that associated with consumers' cashless payments are a crucial
and diverse field of research in finance. One needs to develop the theoretical achievements against the pragmatic nature of cashless
payments. It is necessary to attain new knowledge of descriptive and exploratory character since such knowledge can help explain
the studied phenomena. Additionally, this knowledge may help to formulate suggestions for business practice, as well as policy
formulation, in cashless transactions. Today, cashless payments have become one of the crucial components of the global economy
and it is perceived as an important determinant of economic expansion. To this end, this study intends to explore the success factors
affecting the adoption of cashless payments among consumers. Based on the research objective of this paper, we formulated the
following research question, what are the success factors affecting consumers' adoption of cashless payment? The main contribution
of this paper is to understand consumers' points of view in terms of their willingness to adopt cashless payments. Technology
providers tend to focus more on the system itself and inadvertently ignore consumers' preferences. In this study, a well-established
unified theory of acceptance and use of technology, the given model is used to capture the adoption of cashless payment among
Malaysian consumers. However, that adoption of cashless purchases was based on perceived benefit and usefulness. The perceived
security is not determined.
References
Abrazhevich, D. (2001). E-payment systems: issues of user acceptance. Stanford-Smith, B. and Chiozza, E. (Eds), E-Work and E-
Commerce, IOS Press, Amsterdam, 354-360.
Abrazhevich, D. (2004). Electronic payment system. Eindhoven University of Technology, 1206.
Ajayi. (2014). Effect of cashless monetary policy on Nigerian banking. International Journal of Business and Finance
Management Research.
Armey, L. E., Lipow, J., & Webb, N. J. (2014). The impact of electronic financial payments on crime. Information Economics and
Policy, 29, 46-57.
Bank Negara Malaysia (2019). Malaysia's payment statistics. Retrieved 10 July 2019, from
http://www.bnm.gov.my/index.php?ch=ps&pg=ps_stats&lang=en.
Belanger, F., Hiller, J., & Smith, W. (2002). Trustworthiness in electronic commerce: the role of privacy, security, and site
attributes. The Journal of Strategic Information Systems, 245270.
Bilińska-Reformat, K., & Kieżel, M. (2016). Retail Banks and Retail Chains Cooperation for the Promotion of the Cashless
Payments in Poland. In Proceedings of 15th International Marketing Trends Conference, Venice.
Central Bank of Malaysia. (2009). Payment and settlement systems report 2009. Retrieved from
http://www.bnm.gov.my/files/publication/fsps/en/2009/cp04.pdf.
Central bank of Malaysia. (2012). E-payments on the rise. Retrieved from
www.bnm.gov.my/index.php?ch¼ps_mep&pg¼ps_mep_rise&lang¼en.
Chakravorti, S. (2003). Theory of credit card networks: a survey of the literature. Retrieved from
http://papers.ssrn.com/sol3/papers.cfm?abstract_id=419944 (Google scholar).
Chen, L.-D. (2006). A Theoretical Model of Consumer Acceptance of mPayment. Americas Conference on Information Systems.
Chong, A. Y. L., Chan, F. T., & Ooi, K. B. (2012). Predicting consumer decisions to adopt mobile commerce: Cross country
empirical examination between China and Malaysia. Decision support systems, 53(1), 34-43.
Chou, Y., Lee, C., & Chung, J. (2004). Understanding M-commerce payment systems through the analytic hierarchy process.
Journal of Business Research, 1423-1430.
Cunningham, G. (2003, April). ‘UNEP Net Information Services for Watershed Management. In Presentation at the Symposium
on Improving Public Participation and Governance in International Watershed Management. Charlottesville, Virginia (pp.
18-19).
Davis, F., Bagozzi , R., &Warshaw, P. (1989). User acceptance of computer technology: a comparison of two theoretical models.
Management science, 35(8), 982-1003.
Davis. (1989). Perceived Usefulness, Perceived Ease of Use, and User Acceptance of Information. MIS Quarterly.
Eastin, M. (2002). Diffusion of e-commerce: an analysis of the adoption of four e-commerce activities. Telematics and informatics,
251-267.
Ahmad et al., International Journal of Research in Business & Social Science 10(2) (2021), 238-250
249
Fabris, N. (2019). Cashless Society–The Future of Money or a Utopia?. Journal of Central Banking Theory and Practice, 8(1), 53-
66.
Golobal Trade (2020). Toward a global cashless economy. Retrieved from https://www. globaltrademag.com/toward-a-global-
cashless-economy/.
Har Lee, C., Cyril Eze, U., &Oly Ndubisi, N. (2011). Analyzing key determinants of online repurchase intentions. Asia Pacific
Journal of Marketing and Logistics, 200-221.
Hataiseree, R. (2008). Development of E-payments and Challenges for Central Banks. Retrieved from
https://www.ecb.europa.eu/home/pdf/research/WP_2008_01.pdf?abb527a3021b00b0ba1 8fed884a7a818.
Hernández, J., & Marcotegui, B. (2009, September). Filtering of artifacts and pavement segmentation from mobile lidar data.
In ISPRS Workshop Laserscanning 2009.
Hord. (2005). Electronic payments. The Free Press. New York.
Kim, S., & Garrison, G. (2009). Investigating mobile wireless technology adoption: An extension of the technology acceptance
model. Information Systems Frontiers, 11(3), 323-333.
King, & He. (2006). A meta-analysis of the Technology Acceptance Mode. Information &Management, 740-755.
Kothari, C. (1990). Research Methodology: Methods and Techniques. New Age International Publishers, 1-414.
Krüger, M., & Seitz, F. (2014). Costs and benefits of cash and cashless payment instruments: overview and initial estimates. Study
commissioned by the Deutsche Bundesbank. Frankfurt.
Kucukusta, D., Law, R., Besbes, A., & Legohérel, P. (2015). Re-examining perceived usefulness and ease of use in online
booking. International Journal of Contemporary Hospitality Management.
Kurnia , S., & Benjamin , L. (2007). Exploring the reasons for a failure of electronic payment systems a case study of an Australian
company. Journal of Research and Practice in Information Technology, 34-67.
Lee, Y., Kozar, K., & Larsen, K. (2003). The technology acceptance model: past, present, and future. Communications of AIS,
2003(12), 752-780.
Lin, H., & Luarn , P. (2005). Toward an Understanding of the Behavioral Intention to Use Mobile Banking. Computer
inHumanBehaviour, 873-891.
Linck, K., & Pousttchi . (2006). Security issues in the mobile paymaent from customer viewpoint. MPRA, 1-12.
Mathieson, K. (1991). Comparing the Technology Acceptance Model with the Theory of Planned Behavior. Information Systems
Research, 173-191.
Mering, R. (2019). Survey: More Malaysians prefer cashless payment with debit cards, online banking. Retrieved 11 July 2019,
from https://www.malaymail.com/news/money/ 2019/01/17/survey-more-malaysians-prefer-cashless-payment-with-debit-
cards-onlinebank/ 1713682.
Ozturk, A. B. (2016). Customer acceptance of cashless payment systems in the hospitality industry. International Journal of
Contemporary Hospitality Management.
Pikri, E. (2019). How cashless is Malaysia right now? Retrieved 10 July 2019, from https:// fintechnews.my/19964/payments-
remittance-malaysia/cashless-malaysia-credit-debit card-e-wallet-money/.
Piyush, K. (2015). An Analysis of Growth Pattern Of Cashless Transaction System. International Journal of Research In Business
Management, 37-44.
Prybutok, H. a. (2008). Consumer acceptance of RFID technology: an exploratory study. EEE Transactions on Engineering
Management.
Ramalingam, K. (2012). Is Malaysia ready for greater adoption of e-payments? Retrieved from
http://www.theedgemarkets.com/article/malaysia-ready-greater-adoption-e-payments-1.
Research and Market (2020). Global cards & payments market insights, 2015–2019 & 2019–2023. Retrieved from
https://www.globenewswire.com/news-release/2020/04/ 16/2017151/0/en/Global-Cards-Payments-Market-Insights-2015-
2019-2019-2023.html.
San‐Martin, S., & López‐Catalán, B. (2013). How can a mobile vendor get satisfied customers?. Industrial Management & Data
Systems.
Sanga, B. R., Villavicencio, A. M., Padilla, V. S., Alvia, S. V., & Ponguillo, R. A. (2016). Software Defined Radio Applications
Using USB Receptors. In Proceedings of the World Congress on Engineering and Computer Science (Vol. 1).
Sreenu, N. (2020). Cashless Payment Policy and Its Effects on Economic Growth of India: An Exploratory Study. ACM
Transactions on Management Information Systems (TMIS), 11(3), 1-10.
Stoborn , K., Heitmann, A., &Leibold, K. (2004). Internet payments in Germany: a classificatory framework and empirical
evidence. Journal of Business Research, 14311437.
Teo, A. C., Tan, G. W. H., Ooi, K. B., Hew, T. S., & Yew, K. T. (2015). The effects of convenience and speed in m-
payment. Industrial Management & Data Systems.
Thomas, H. Jain, A., & Angus, M. (2013). Measuring Progress Toward a Cashless Society, MasterCard.
Tomi Dahlberg, N. M. (2010). Trust Enhanced Technology Acceptance Model. Swedish School of Economics.
Tsiakis, T., &Sthephanides, G. (2005). The concept of security and trust in e-payments. Computers and Security, 10-15.
Venkatesh, V. (2000). Determinants of perceived ease of use: Integrating control, intrinsic motivation and emotion into the
technology acceptance model. Information Systems Research, 11(4), 342.
Ahmad et al., International Journal of Research in Business & Social Science 10(2) (2021), 238-250
250
Venkatesh, V., & Davis, F. (2000). A Theoretical Extension of the Technology Acceptance Model: Four Longitudinal Field
Studies. Management Science 0025-, 186(119).
Word Payments Report (2018). Non-cash transaction analysis. Retrieved from https:// worldpaymentsreport.com/wp-
content/uploads/sites/5/2018/10/World-Payments- Report-2018.pdf (accessed: the 11th July, 2019).
World Payment Report (2020). Non-cash payments volume. Retrieved from https://worldpa y mentsreport.com/non-cash-
payments-volume-2/ (accessed: the 11 September, 2020).
Publisher’s Note: SSBFNET stays neutral with regard to jurisdictional claims in published maps and institutional affiliations.
© 2021 by the authors. Licensee SSBFNET, Istanbul, Turkey. This article is an open access article distributed under the terms and conditions of the
Creative Commons Attribution (CC BY) license (http://creativecommons.org/licenses/by/4.0/).
International Journal of Research in Business and Social Science (2147-4478) by SSBFNET is licensed under a Creative Commons Attribution 4.0
International License.