Embed Size (px)
Citation preview
1 /GE /
Impact of Combustion on Particulate Collection
Bob Taylor
May 2006
2 /GE /
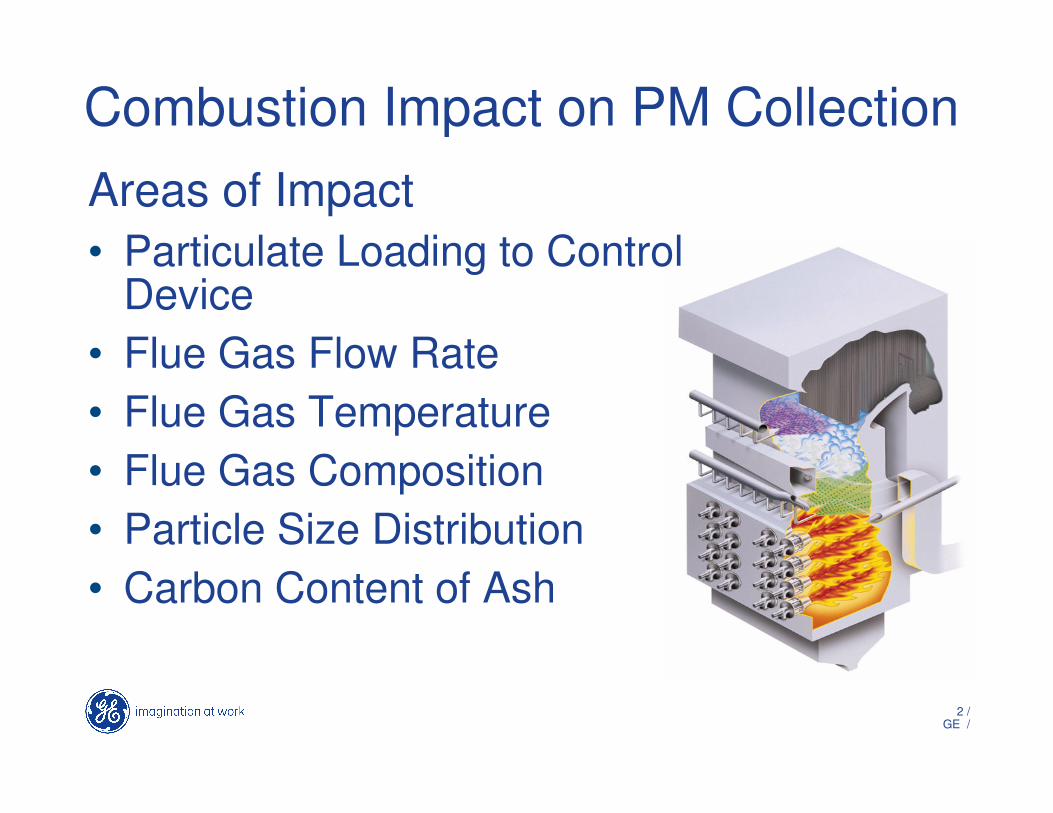
Combustion Impact on PM CollectionAreas of Impact• Particulate Loading to Control
Device• Flue Gas Flow Rate• Flue Gas Temperature• Flue Gas Composition• Particle Size Distribution• Carbon Content of Ash

3 /GE /
Particulate LoadingMost particulate is an inorganic constituent of the fuel. PM mass loading generally proportional to fuel firing rate.Fuel Flow rate controlled by:• Power requirements• Fuel characteristics• System Efficiencies
• Chemical to thermal energy conversion• Casing thermal losses• Stack sensible and latent heat loss• Steam turbine losses• Electrical generator losses
4 /GE /
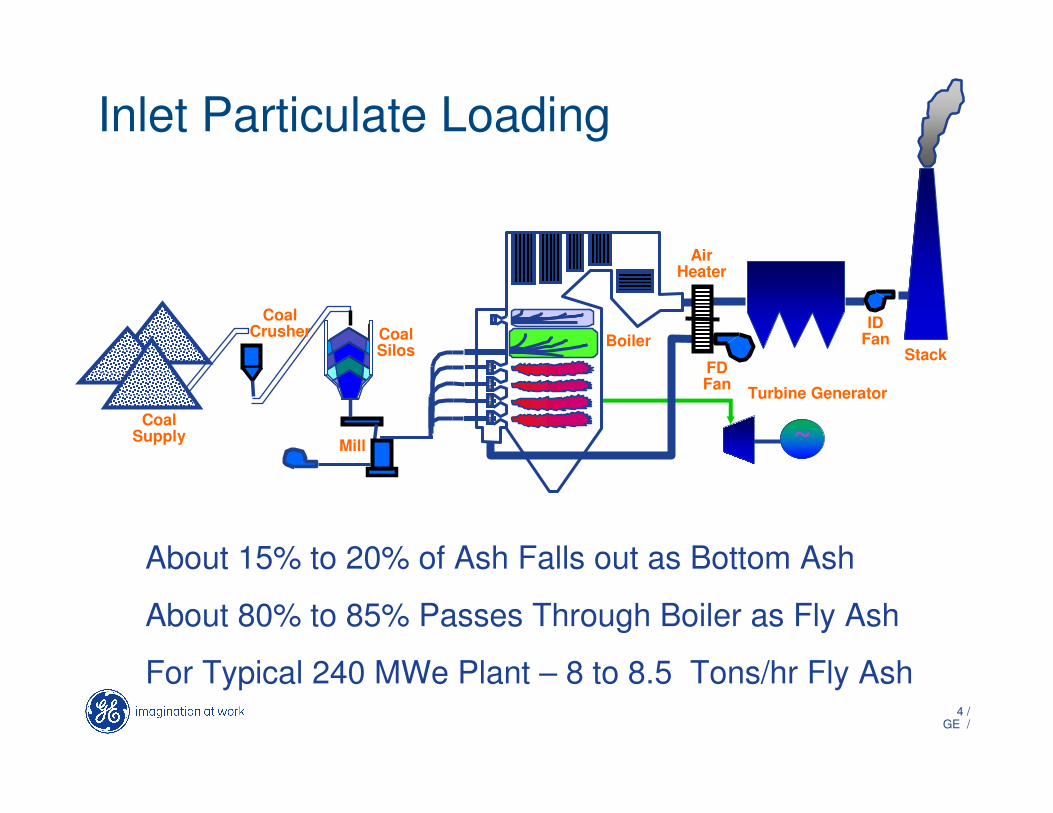
~CoalSupply
CoalCrusher
Mill
CoalSilos Boiler
AirHeater
Stack
IDFan
FDFan Turbine Generator
About 15% to 20% of Ash Falls out as Bottom Ash
About 80% to 85% Passes Through Boiler as Fly Ash
For Typical 240 MWe Plant – 8 to 8.5 Tons/hr Fly Ash
Inlet Particulate Loading

5 /GE /
Inlet Particulate LoadingPower Plant Efficiency
Overall efficiency for coal-fired utility ~ 35 to 40%
Heat Rate ~10,000 Btu/KwHr
Example 240 MWe Plant
Coal HHV - ~12,000 Btu/lb (from Proximate Analysis)
Fuel Use = 240,000Kw x10,000 Btu/KwHr/12,000 Btu/lb / 2000 lb/ton = 100 tons/hr
Coal Ash Content ~ 10%
PM = 100 tph coal x 10% Ash = 10 tph

6 /GE /
Impact of Increased Dust Burden
Electrostatic Precipitator
•Relatively constant efficiency
•Increased emissions
•Increased spark rate
•Constant pressure drop
•Need for increased rapping
Fabric Filter
•Constant emissions
•Increased pressure drop
•Need to reduce pulse cleaning interval
•Increased bag wear

7 /GE /
Flue Gas QuantityMost flue gas mass derived from combustion air and in- leakageStoichiometric air defined by fuel composition (Ultimate Analysis)Excess air required since fuel/air mixing less than perfectAir in-leakage accounts for significant increase in volume
0
100
200
300
400
500
600
0.5 3 7
Excess Oxygen -%
CO
and
NO
x P
PM
CO
NOx
8 /GE /
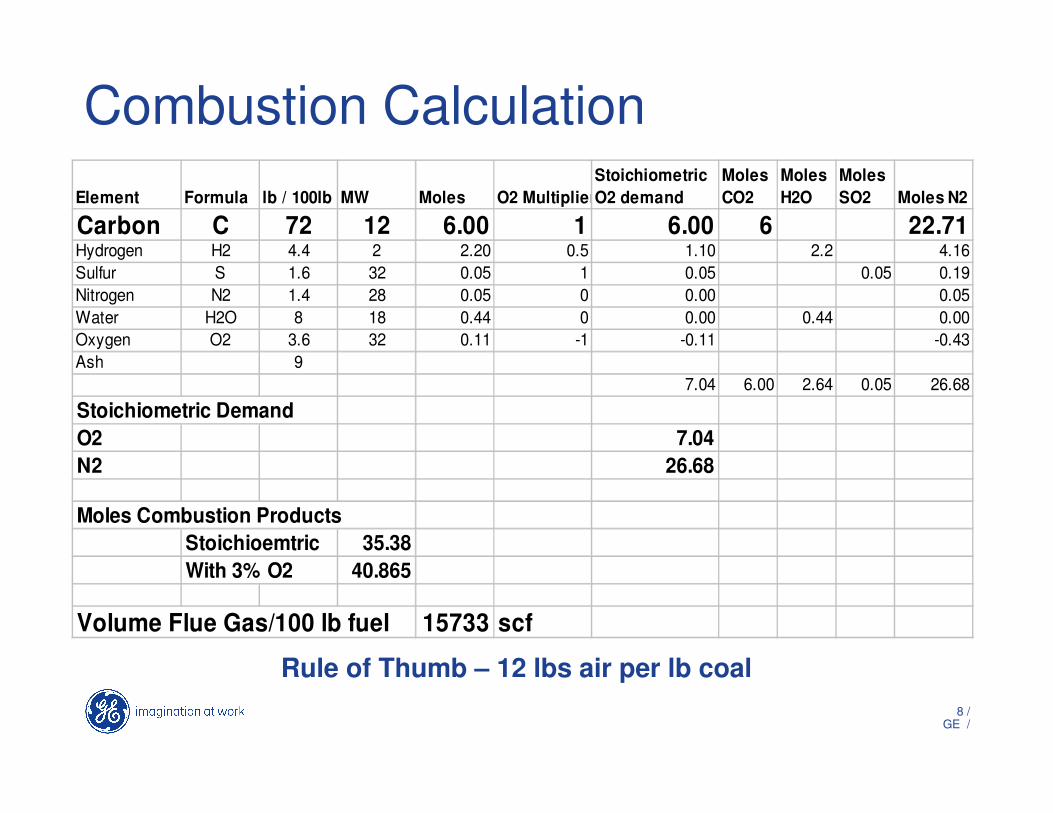
Combustion CalculationElement Formula lb / 100lb MW Moles O2 Multiplier
Stoichiometric O2 demand
Moles CO2
Moles H2O
Moles SO2 Moles N2
Carbon C 72 12 6.00 1 6.00 6 22.71Hydrogen H2 4.4 2 2.20 0.5 1.10 2.2 4.16Sulfur S 1.6 32 0.05 1 0.05 0.05 0.19Nitrogen N2 1.4 28 0.05 0 0.00 0.05Water H2O 8 18 0.44 0 0.00 0.44 0.00Oxygen O2 3.6 32 0.11 -1 -0.11 -0.43Ash 9
7.04 6.00 2.64 0.05 26.68
Stoichiometric DemandO2 7.04N2 26.68
Moles Combustion ProductsStoichioemtric 35.38With 3% O2 40.865
Volume Flue Gas/100 lb fuel 15733 scf
Rule of Thumb – 12 lbs air per lb coal
9 /GE /
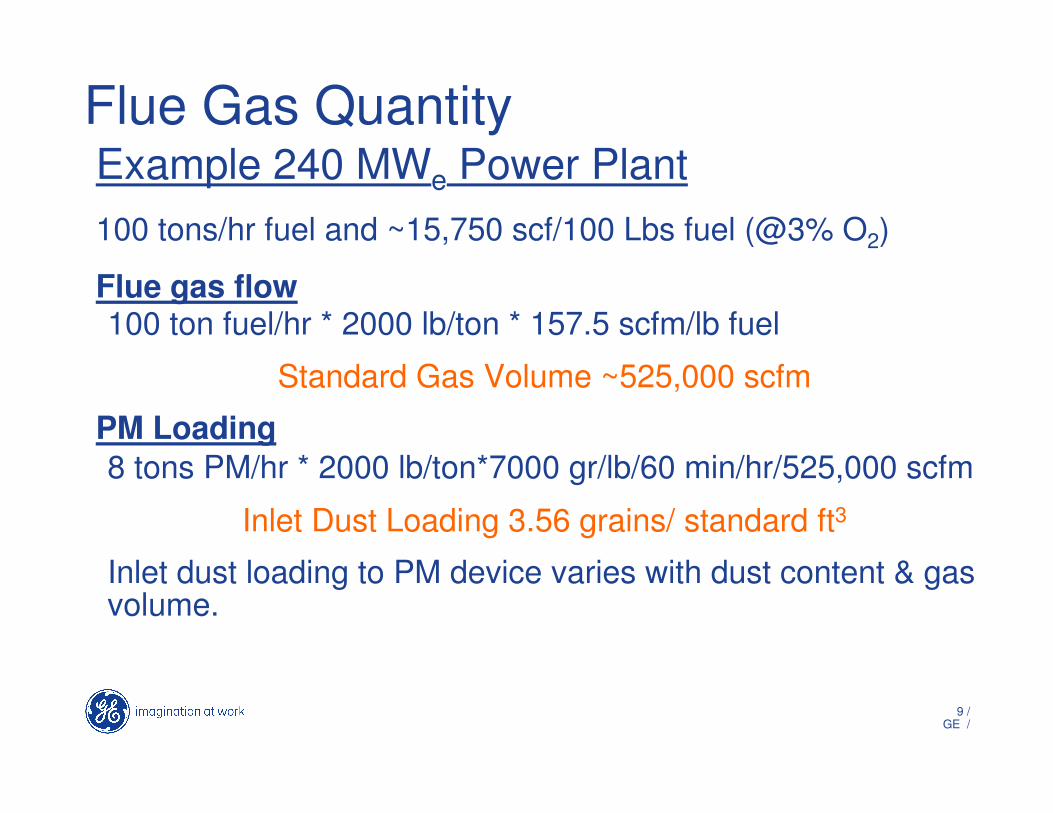
Flue Gas QuantityExample 240 MWe Power Plant100 tons/hr fuel and ~15,750 scf/100 Lbs fuel (@3% O2)
Flue gas flow100 ton fuel/hr * 2000 lb/ton * 157.5 scfm/lb fuel
Standard Gas Volume ~525,000 scfm
PM Loading8 tons PM/hr * 2000 lb/ton*7000 gr/lb/60 min/hr/525,000 scfm
Inlet Dust Loading 3.56 grains/ standard ft3
Inlet dust loading to PM device varies with dust content & gas volume.
10 /GE /
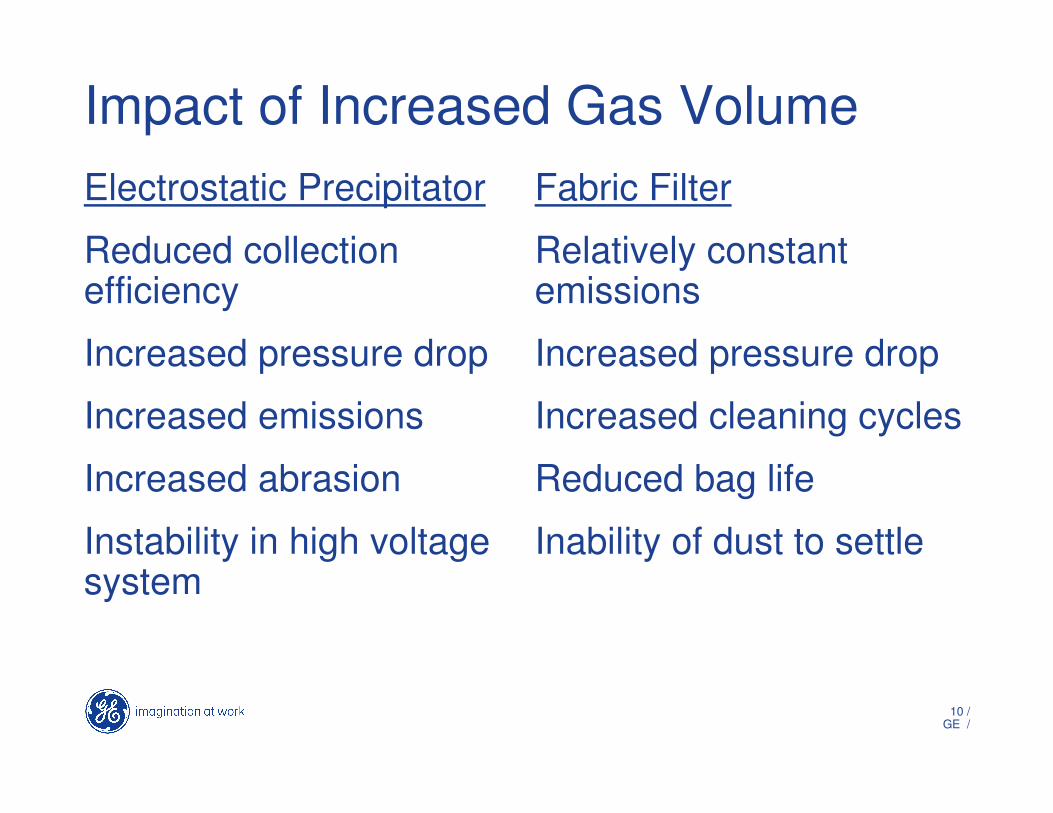
Impact of Increased Gas VolumeElectrostatic Precipitator
Reduced collection efficiency
Increased pressure drop
Increased emissions
Increased abrasion
Instability in high voltage system
Fabric Filter
Relatively constant emissions
Increased pressure drop
Increased cleaning cycles
Reduced bag life
Inability of dust to settle
11 /GE /
�����
� �����
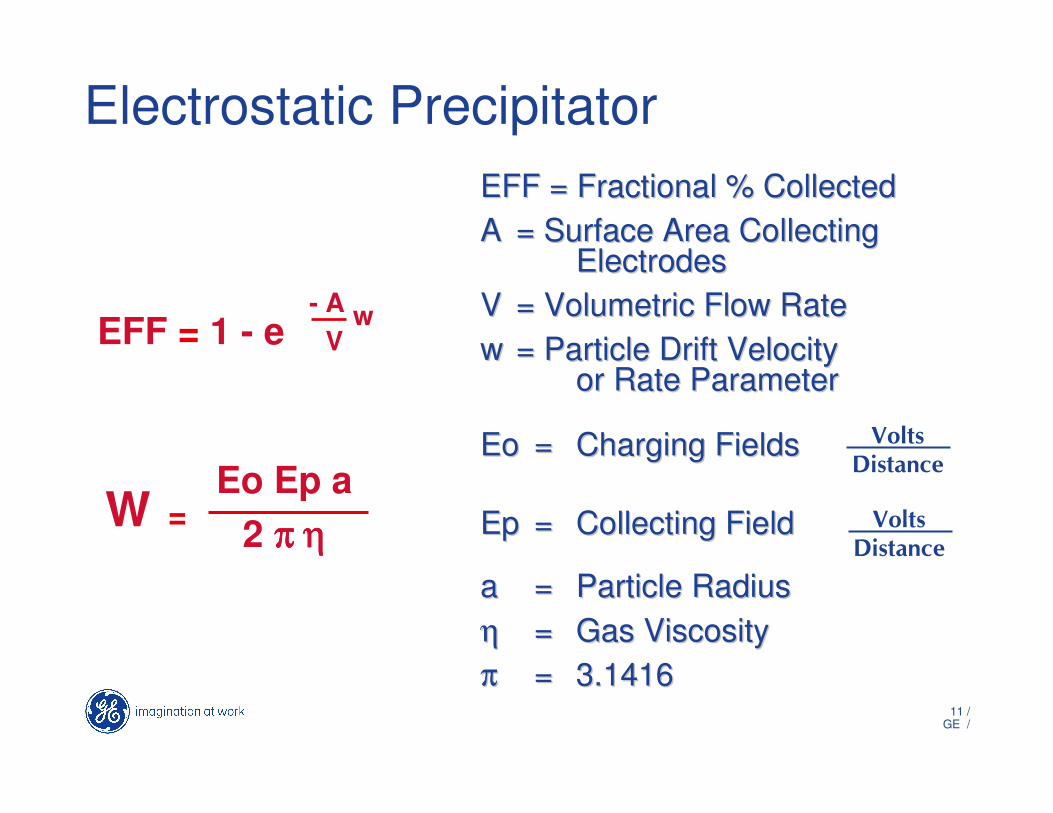
Electrostatic Precipitator EFF = Fractional % CollectedEFF = Fractional % CollectedAA = Surface Area Collecting = Surface Area Collecting
ElectrodesElectrodesVV = Volumetric Flow Rate= Volumetric Flow Rateww = Particle Drift Velocity = Particle Drift Velocity
or Rate Parameteror Rate Parameter
EoEo == Charging Fields Charging Fields
EpEp == Collecting FieldCollecting Field
aa == Particle RadiusParticle Radiusηη == Gas Viscosity Gas Viscosity ππ == 3.14163.1416
EFF = 1 - e- A
Vw
Eo Ep a2 π ηπ ηπ ηπ ηW = �����
� �����

12 /GE /
Electrostatic Precipitator
•ESP collection efficiency is exponentially related to gas volume
•A small change in gas volume results in a large reduction in PM efficiency.

13 /GE /
Fabric FilterAir to Cloth Ratio
•Air to cloth ratio = Total gas volume ACFM / Total filter area Ft2•Filter dia. X length x 3.1415 = Filter area•Total # Filters x Filter Area = Total Filter Area•Typical pulse jet air to cloth ratios for utility boilers 2.0 through 4.0 ft/min.
Air to Cloth Ratio•Air to cloth ratio = Total gas volume ACFM / Total filter area Ft2•Filter dia. X length x 3.1415 = Filter area•Total # Filters x Filter Area = Total Filter Area•Typical pulse jet air to cloth ratios for utility boilers 2.0 through 4.0 ft/min.
14 /GE /
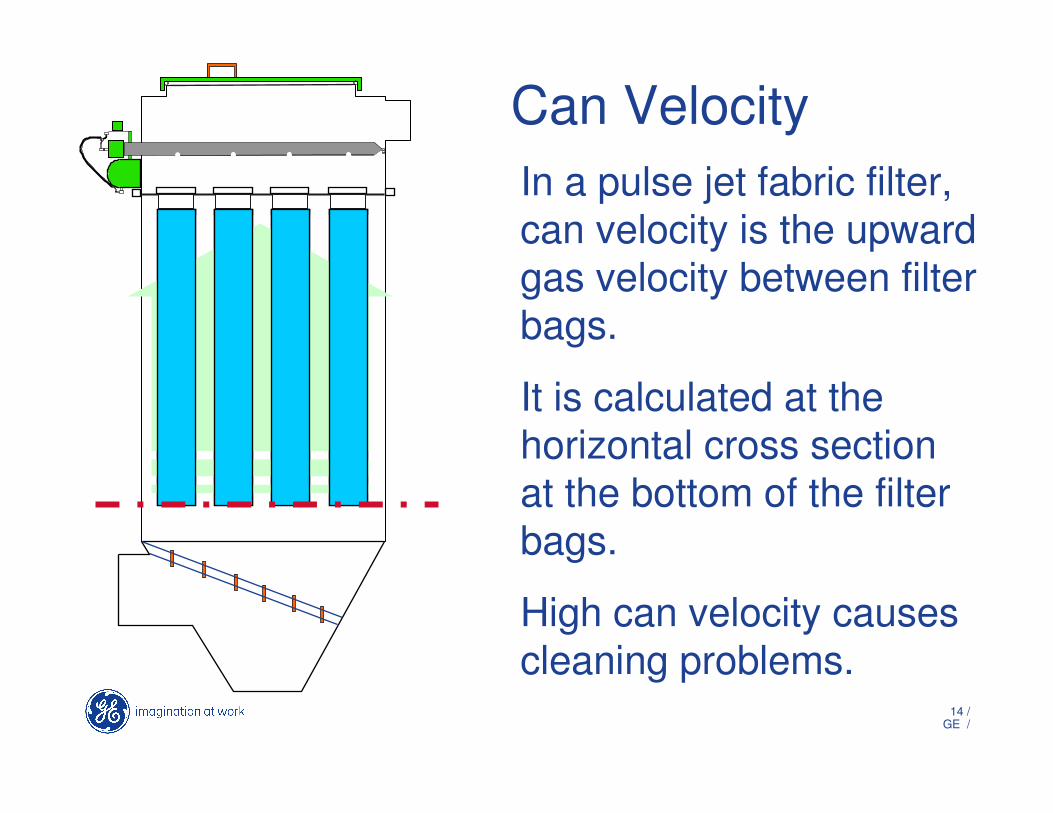
Can VelocityIn a pulse jet fabric filter, can velocity is the upward gas velocity between filter bags.
It is calculated at the horizontal cross section at the bottom of the filter bags.
High can velocity causes cleaning problems.
15 /GE /
Causes of Increased Gas volume
•Increased through put
•Reduced thermal efficiency
•Increased in-leakage
•Elevated operating temperature
•Changes in fuel characteristics.
16 /GE /
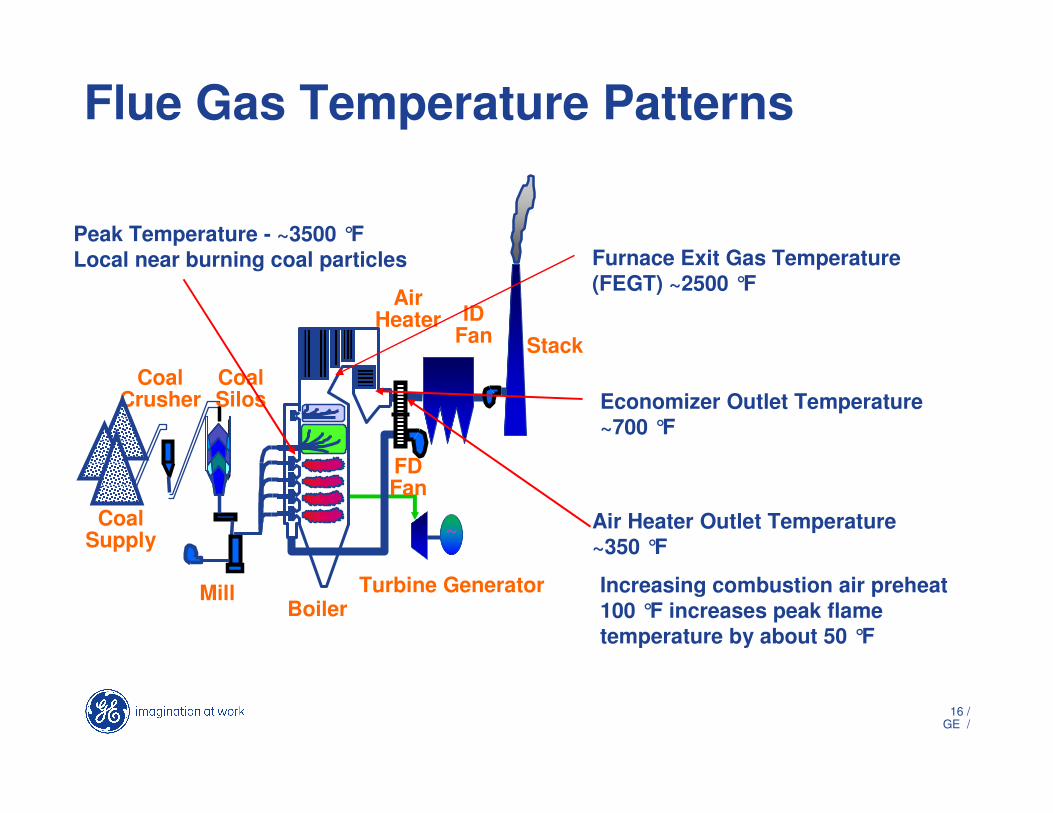
Flue Gas Temperature Patterns
~CoalSupply
CoalCrusher
Mill
CoalSilos
Boiler
AirHeater
StackID
Fan
FDFan
Turbine Generator
Peak Temperature - ~3500 °FLocal near burning coal particles Furnace Exit Gas Temperature
(FEGT) ~2500 °F
Economizer Outlet Temperature~700 °F
Air Heater Outlet Temperature~350 °F
Increasing combustion air preheat 100 °F increases peak flame temperature by about 50 °F

17 /GE /
Temperature Patterns
~CoalSupply
CoalCrusher
Mill
CoalSilos
Boiler
AirHeater
Stack
IDFan
FDFan
Turbine Generator
Changing air preheatPower Cycle efficiencySlagging in FurnaceAsh resisitivity in ESPFlue gas ACFM
SO3 Dew Point Temp.~235 to 300°F depending on moisture and SO3 level
Air Pre-heater CoilsUse of air pre-heaters in winter increases ESP inlet temperature
18 /GE /
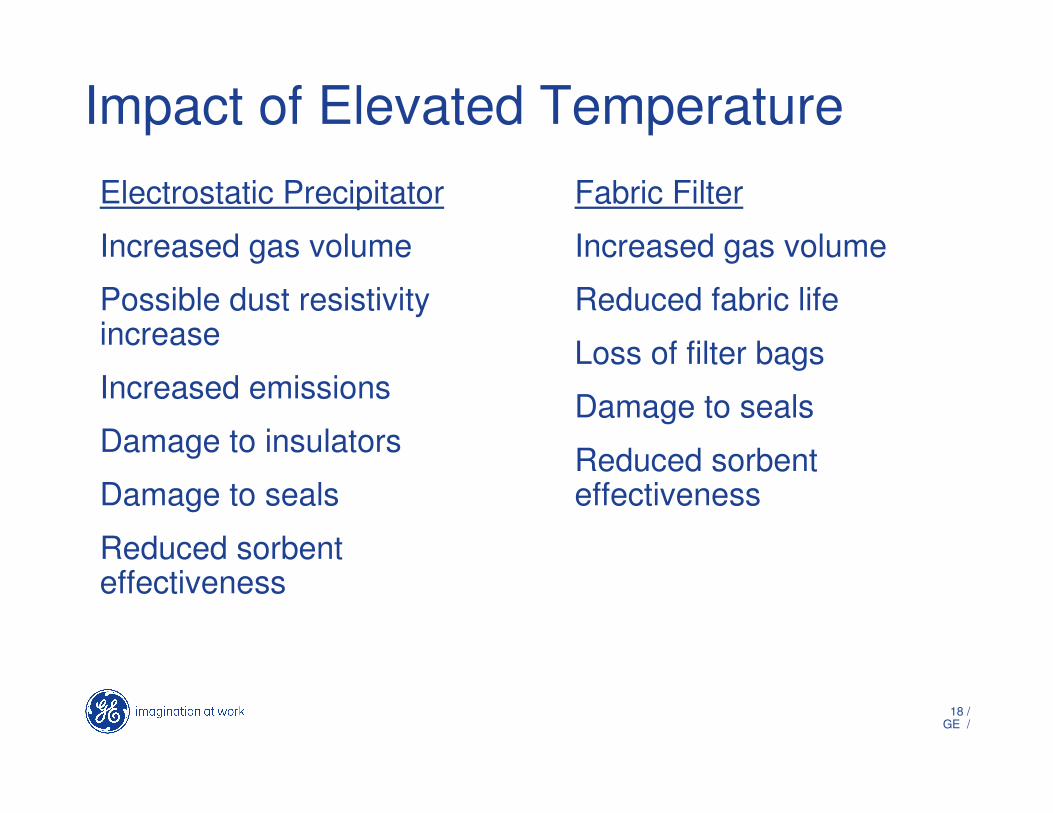
Impact of Elevated TemperatureElectrostatic Precipitator
Increased gas volume
Possible dust resistivityincrease
Increased emissions
Damage to insulators
Damage to seals
Reduced sorbenteffectiveness
Fabric Filter
Increased gas volume
Reduced fabric life
Loss of filter bags
Damage to seals
Reduced sorbenteffectiveness

19 /GE /
Flue Gas Composition
Flue Gas Species
Moles of Product
Concentration Wet
Concentration Dry
CO2 6 14.7% 15.7%H2O 2.64 6.5% 0.0%O2 1.15 2.8% 3.0%
SO2 0.05 1225 ppm 1308.22N2 31.02 75.9% 81.2%
Total - wet 40.86Total - dry 38.22
Based On Typical Ultimate Analysis

20 /GE /
Impact of Gas CompositionElectrostatic Precipitator
Increased moisture can benefit dust resistivity.
Increased acids can benefit dust resistivity
Excessive moisture or acids can degrade rapping and increase corrosion
Elevated CO possible explosion
Fabric Filter
Increased moisture can lead to bag blinding
Increased acids can degrade fabrics
Excessive oxygen can degrade some fabrics
Excessive moisture can degrade some fabrics.
Elevated CO possible explosion
21 /GE /
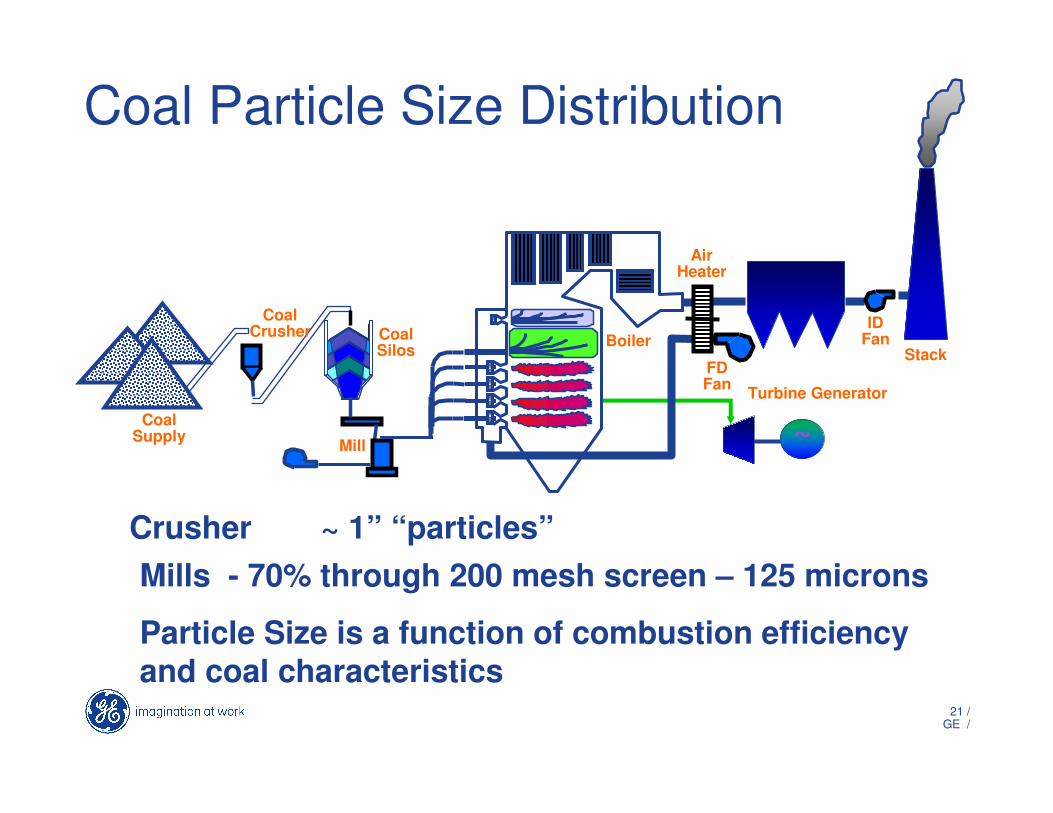
Coal Particle Size Distribution
~CoalSupply
CoalCrusher
Mill
CoalSilos Boiler
AirHeater
Stack
IDFan
FDFan Turbine Generator
Crusher ~ 1” “particles”Mills - 70% through 200 mesh screen – 125 microns
Particle Size is a function of combustion efficiency and coal characteristics
22 /GE /
Coal Particle Size DistributionProximate Analysis• Percent of coal that is volatile vs “fixed carbon”
Volatile Matter burns like a gas flame• Rapid oxidation but MAY form soot since there can be local
oxygen deficiency conditions• Creates fine dust
Fixed Carbon • Often referred to as “Char”• Burns by surface reaction - oxygen diffusion• End product is a burned out hulk of inorganic material• Lattice structure generally broken as they pass through
convective sections – coarse dust
23 /GE /
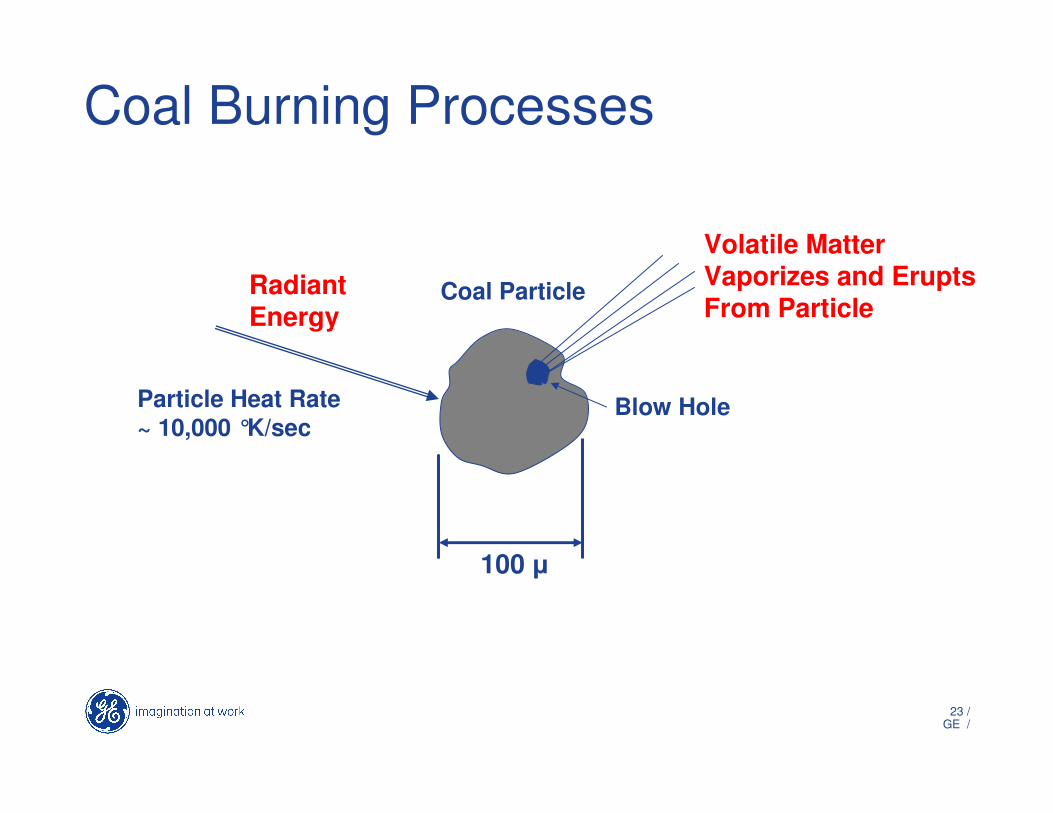
Coal Burning Processes
Coal Particle
100 �
Radiant Energy
Particle Heat Rate~ 10,000 °K/sec
Blow Hole
Volatile Matter Vaporizes and Erupts From Particle
24 /GE /
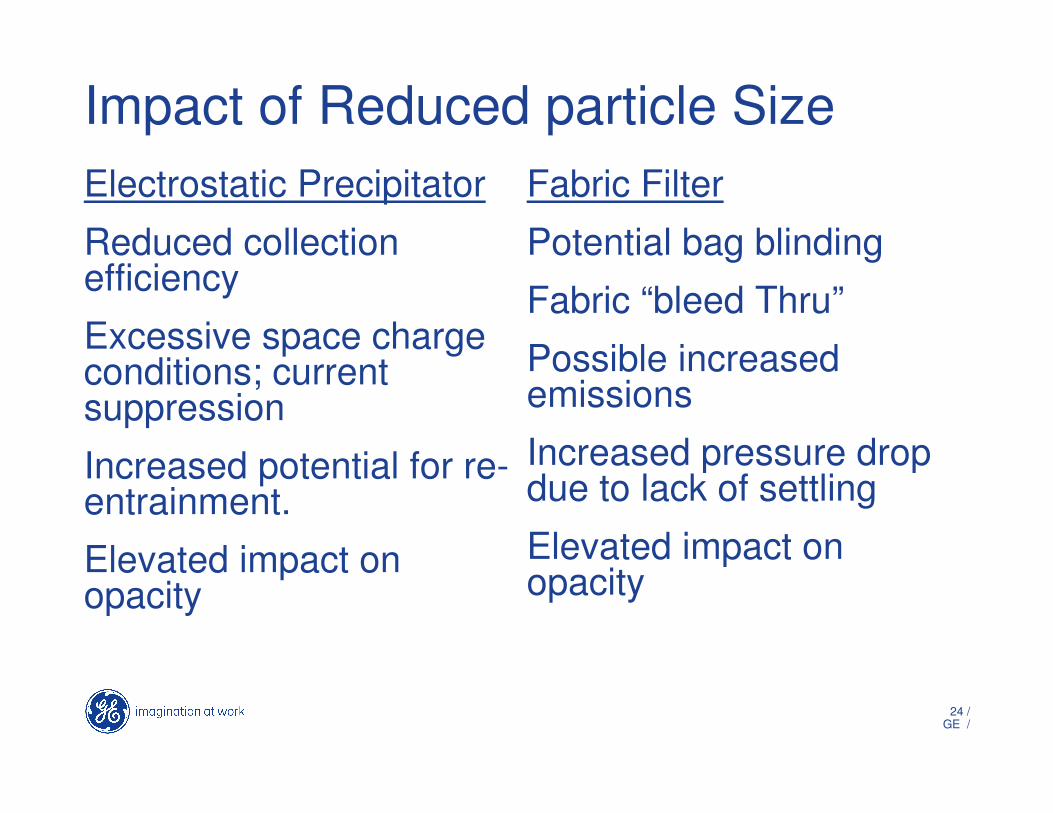
Impact of Reduced particle SizeElectrostatic Precipitator
Reduced collection efficiency
Excessive space charge conditions; current suppression
Increased potential for re-entrainment.
Elevated impact on opacity
Fabric Filter
Potential bag blinding
Fabric “bleed Thru”
Possible increased emissions
Increased pressure drop due to lack of settling
Elevated impact on opacity
25 /GE /
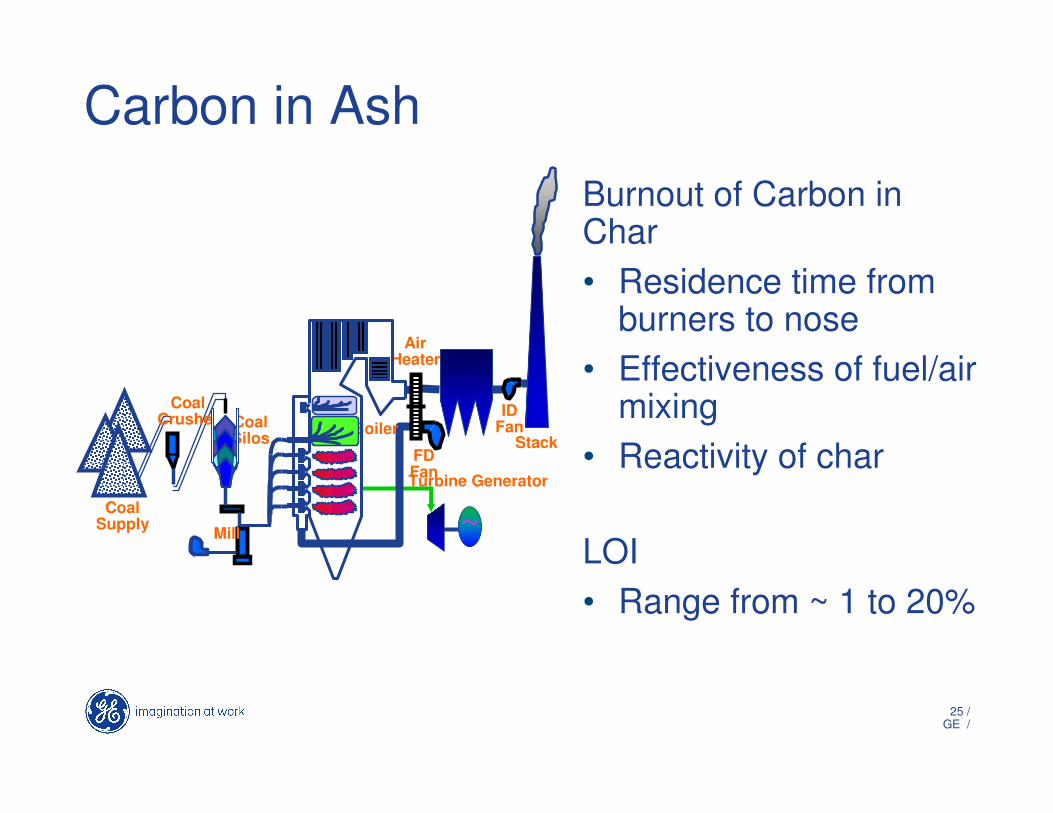
Carbon in AshBurnout of Carbon in Char• Residence time from
burners to nose• Effectiveness of fuel/air
mixing• Reactivity of char
LOI• Range from ~ 1 to 20%
~CoalSupply
CoalCrusher
Mill
CoalSilos Boiler
AirHeater
Stack
IDFan
FDFanTurbine Generator

26 /GE /
Carbon in Fly Ash
Carbon levels in fly ash can increase due to:•Low NOx burners
•Inadequate mixing of combustion air and fuel
•Staging of combustion air
•Change in coal grind

27 /GE /
Carbon in Fly Ash
Other Sources of Carbon in Fly Ash
•Incomplete combustion is not the only reason for carbon in ash.
•Mercury control strategies utilizing carbon based sorbents are another reason.
•Powdered activated carbon is injected into the gas stream ahead of the PM control device.
28 /GE /
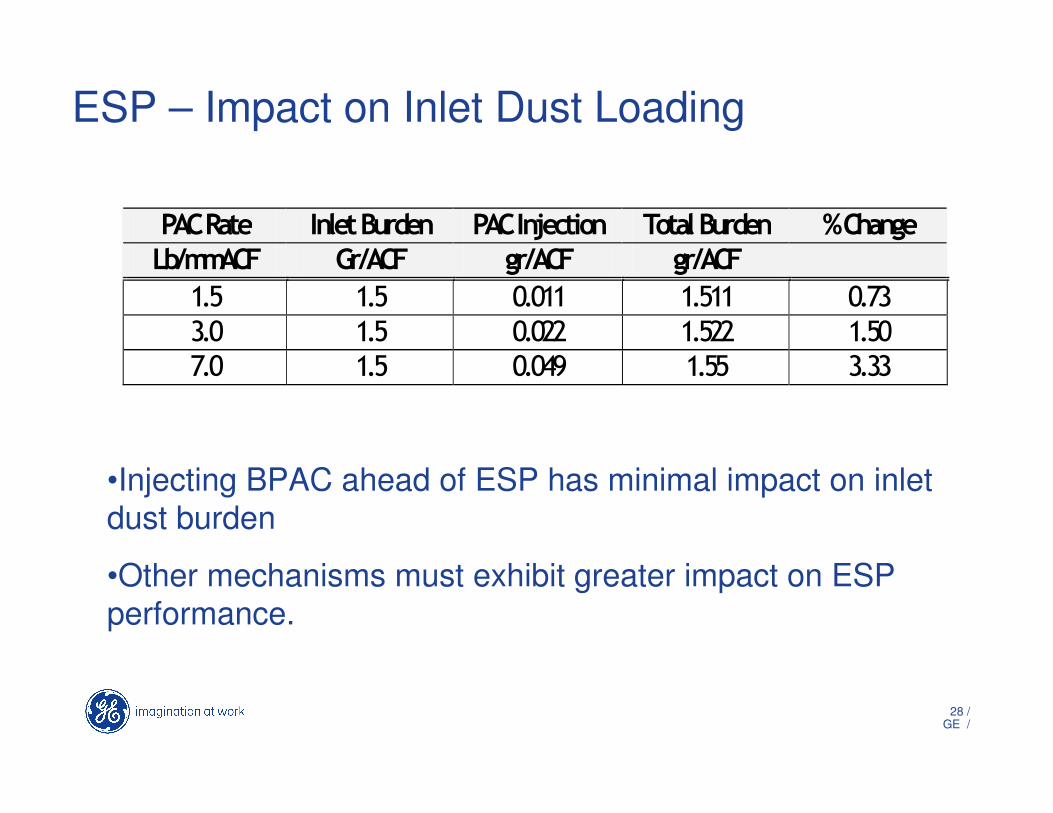
ESP – Impact on Inlet Dust Loading
��������� ����� ���� ����������� ������� ���� ��������
��������� ������� ������� ������� �
���� ���� ������ ������ �����
���� ���� ������ ������ �����
���� ���� ���� ����� �����
•Injecting BPAC ahead of ESP has minimal impact on inlet dust burden
•Other mechanisms must exhibit greater impact on ESP performance.
29 /GE /
ESP Performance & Sorbent Injection Rates
•An ESP is not as effective at removing carbon as compared to fly ash.
•Field testing indicates ESP emissions increase significantly when carbon based PAC is utilized.
•Carbon has lower reflectance when compared to fly ash. (Visible emissions)
•Field testing indicates carbon based PAC has minimal impact on emissions from Max-9.
30 /GE /
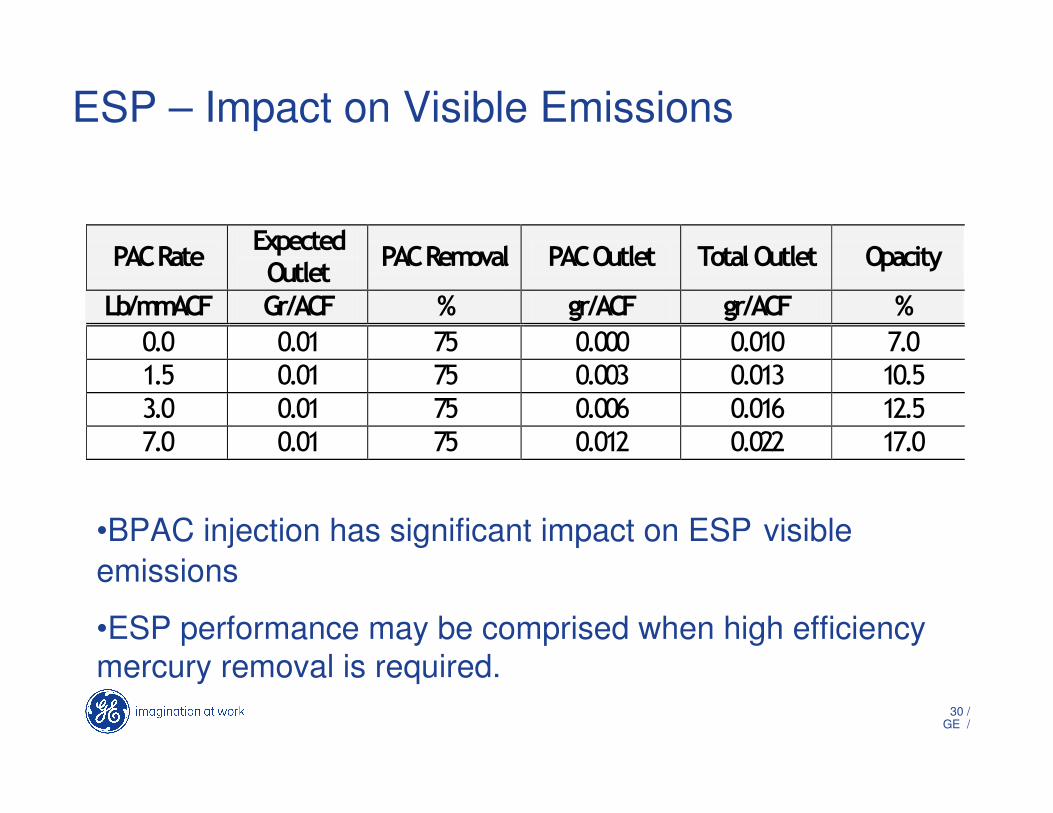
ESP – Impact on Visible Emissions
•BPAC injection has significant impact on ESP visible emissions
•ESP performance may be comprised when high efficiency mercury removal is required.
����������� ������! �����
��������"��� ����! ����� ������! ����� ! ����#�
��������� ������� �� ������� ������� ��
���� ����� ��� ������ ������ ����
���� ����� ��� ������ ������ �����
���� ����� ��� ������ ������ �����
���� ����� ��� ������ ������ �����

31 /GE /
ESP – Impact on Outlet Dust Emissions
•ESP emissions increase as inlet dust loading increases.
M ass Em issions vs In jection Rate
0
0.5
1
1.5
2
2.5
0 1 2 3 4 5 6 7 8
Sorbent in jection rate, lb /mm AC F
Out
let l
oad
ing,
g/d
m3
ESP mass emissions testing Max-9 mass emissions

32 /GE /
Impact of Elevated Carbon
Electrostatic Precipitator
Increased spark rate
Increased re-entrainment
Potential for insulator tracking
Potential for hopper fires
Inability to sell fly ash
Fabric Filter
Hydrocarbons can blind filter bags
Potential for hopper fires
Inability to sell fly ash
33 /GE /
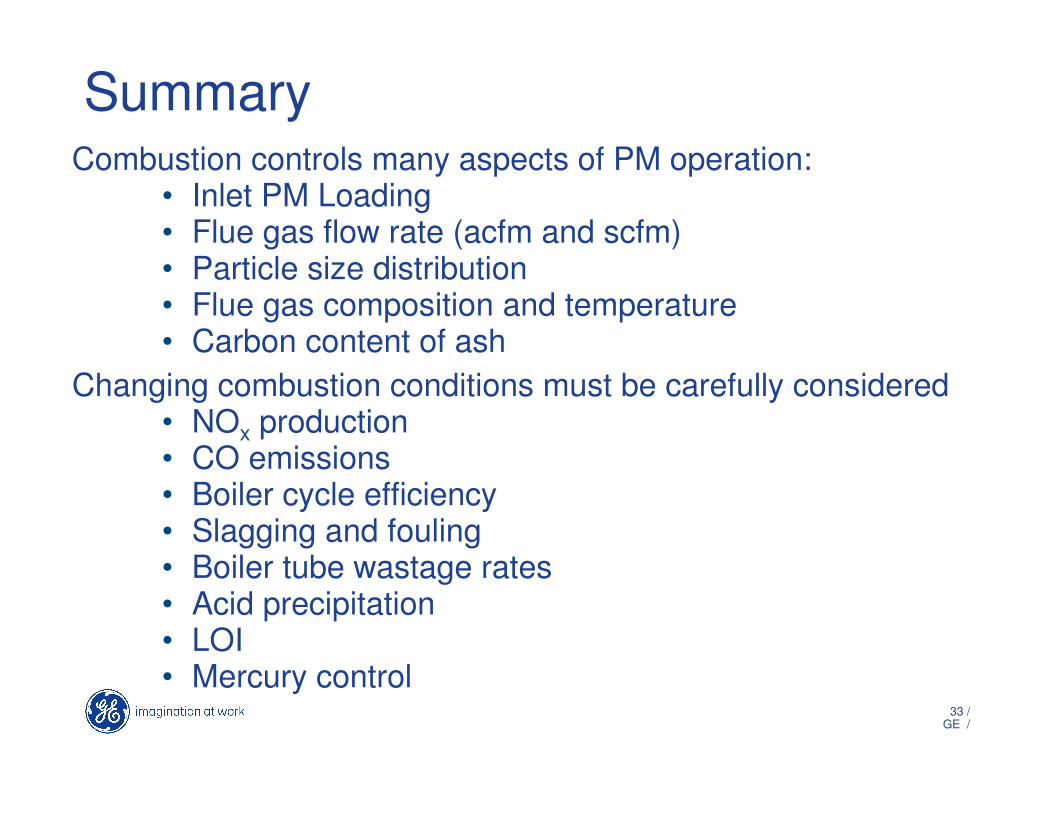
SummaryCombustion controls many aspects of PM operation:
• Inlet PM Loading• Flue gas flow rate (acfm and scfm)• Particle size distribution• Flue gas composition and temperature• Carbon content of ash
Changing combustion conditions must be carefully considered• NOx production• CO emissions• Boiler cycle efficiency• Slagging and fouling• Boiler tube wastage rates• Acid precipitation• LOI• Mercury control