Embed Size (px)
Citation preview
Research Journal Social Sciences Volume 5, No. 1, pp. 9–21
Impact of Climate Change on Wheat Productivity
in Pakistan: A District Level Analysis
MUNIR AHMAD, HASAN SIFTAIN and MUHAMMAD IQBAL*
This study analyses the impact of climate change on wheat productivity in Pakistan by
employing production function approach using districts level data for the period of 1981-
2010.The Fixed Effect (FE) estimations support the evidence that an increase of 10C in the
mean temperature during sowing time would reduce crop yield by 7.4 percent. The same rise
in mean temperature in January and February enhances wheat productivity to the tune of 6.2
percent. However, no significant impact of rise in temperature normals during the maturity
stage (March-April) was observed on wheat productivity. The deviations of mean temperature
from historic (long run) mean—weather shocks are found posing no threat to wheat
productivity during the period under study. Precipitation normals—during vegetative and
maturity stages and their deviations from historic mean (positive) exert a positive impact on
the wheat yield but the magnitude of the impact of incremental rains came out to be very low.
Keywords: Agriculture, Wheat Yield, Climate Change, Growth Stages, and
District Level Panel Data
1. INTRODUCTION
The ecology of Pakistan is suitable for growing a large variety of crops. Wheat, a
staple food, is one of the most important crops from national food security point of view
and is grown during the winter season (rabi) at more than 2/3rd of the farms and accounts
for about 1/3rd of the total cultivated area in the country. Thus, not only food security of
millions of farmers and landless rural inhabitants is dependent on wheat output levels but
also it is a major source of their livelihood.
Studies show that wheat crop is under climate change stress and the Green
Revolution technology potential has already been exploited in Pakistan—yield growth
rates declined from over 7.2 percent per annum in early 1970s to around 2 percent in
recent years. Sivakumar and Stefanski (2011) reported that an increase of 10C in
Munir Ahmad <[email protected]> is Joint Director, Hasan Siftain <[email protected]> was
Junior Researcher when this paper was written, Muhammad Iqbal is Chief of Research at the Pakistan Institute
of Development Economics (PIDE), Islamabad, Pakistan.
Authors’ Note: This paper was also presented at a seminar held on November 10, 2014 at the National
Agricultural Research Centre, Islamabad. The seminar was jointly organised by the Pakistan Institute of
Development Economics and Pakistan Agricultural Research Council, Islamabad. We are thankful to seminar
participants for their valuable comments. Financial support from IDRC is acknowledged with appreciation. We
are indebted to Dr Ghulam Rasul of Pakistan Meteorological Department for providing access to data on
climatic variables. The authors are thankful to M. Nawaz, Abdus Sattar, Jaffar Hussain and G. M. Chaudhry for
their support. Thanks are also due to Sajid Amin Javed for proof reading the manuscript.

Research Journal Social Sciences Volume 5, No. 1
10
temperature would reduce wheat yield by 5. 7 percent in Pakistan, while Leads (2009)
foresees over 40 percent decline in wheat yield by 2035.
Although, the impact analysis of climate change on agriculture attracted attention
of the scientific community very recently in Pakistan, fairly good number of empirical
studies are available in the literature which explore the relationship between climate
change and agricultural productivity in various regions and countries. However, results of
most of the studies are in disagreement. Various empirical studies found that climate
change is adversely affecting agricultural productivity and projected very alarming
situation during the days to come [Tubiello, et al. (1995); Mendelsohn and Dinar (1999);
Chang (2002); Tubiello, et al. (2002); Luo, et al. (2003); Ludwig and Asseng (2006);
Lobell, et al. (2007) and You, et al. (2009)]. On the other hand, studies like Magrin, et al.
(1998), Gbetibouo and Hassan (2005), Magrin, et al. (2005), and Lobell, et al. (2005)
found that climate change is rather beneficial for agricultural yields. A strand of literature
on the issue indicated that the climate change is not uniformly affecting agricultural
productivity in different countries and regions and that the impact varies within a country
[e.g. Kurukulasuriya and Ajwad (2004); Schlenker, et al. (2005) and NDRC (2007)].
The empirical studies conducted by using data from Pakistan are in no way more
conclusive than those undertaken elsewhere in the world. Shakoor, et al. (2011) reported that
rise in temperature affects agriculture adversely. Hanif, et al. (2009) concluded that the impact
of climate change is not uniform across seasons (Rabi and Kharif) in Punjab. Janjua, et al.
(2011) found no evidence of a significant impact of climate change on wheat production in
Pakistan whereas Ashfaq, et al. (2011) concluded that climatic variables play more dominant
role in explaining the variations in wheat productivity than the non-climatic variables.
Similarly, Siddiqui, et al. (2012) supported non-negative impact of climate change on wheat
production in Punjab. In another study regarding 13 Asian countries including Pakistan, Lea,
et al. (2012) found that higher temperature and precipitation during summer increases
agricultural production in tropical Asian countries, while warming up of fall season reduces
production—the net effect however is negative in Asia.
Some of these studies used either annual climate data [Shakoor, et al. (2011)] or
average of the growing season [Janjua, et al. (2011) and Hanif, et al. (2009)]. Most of
these studies missed non-climate variables—like agricultural inputs and technology,
considered only selected districts of Punjab, applied linear models—may not be suitable
for agricultural data, and used only the current values of climatic variables—capturing
only the weather variations/shocks, for estimating the impact of climate change on
agriculture. We believe that these studies may have either overestimated or
underestimated the climate impacts on agriculture.
Against this backdrop, the major objective of this study is to estimate the impact of
climate change on productivity of wheat in Pakistan. This study covers all the major
wheat producing districts existing as independent administrative units in 1980-81 and for
which the original meteorological data were available since early 1960s. Nonetheless,
these districts represent all cropping systems prevailing in the country fairly well. This
research also incorporates climate as well as non-climatic explanatory variables and
differentiates between the effects of climate change and weather shocks on wheat
productivity. More importantly, we have also tried to corroborate the results obtained
from quantitative analyses using district-level time-series data through field observations,
Munir Ahmad, Hasan Siftain and Muhammad Iqbal Impact of Climate Change on Wheat Productivity …….
11
opinions, and information gathered by a comprehensively conducted Rapid Rural
Appraisal in selected agro-ecologies/cropping systems of Pakistan. On these accounts, it
can safely be said that the present study contributes to the existing literature by enlarging
the scope of work and the nature of analysis.
The rest of the paper is organised in the following manner. The Introduction is
followed by Section 2 that deals with the data and empirical model. The results are
discussed in Section 3, and Section 4 concludes the paper.
2. THE DATA AND THE EMPIRICAL MODEL
2.1. The Data
This study uses data for 19 major wheat producing districts of Pakistan over the
period 1981-2010.1 The selection of district was based on three considerations namely;
(a) presence of meteorological observatory since early 1960s; (b) contribution of the
district to wheat production; and (c) the year of creation of the district2 (in 1980-81 or
earlier). Out of these selected districts, 13 are from Punjab, 3 from Sindh, 2 from Khyber
Pakhtunkhwa (KP) and 1 district is from Balochistan. The district level data regarding
crop yield, area and production were taken from Government of Pakistan, Statistics
Division, Federal Bureau of Statistics Pakistan (Economic Wing). District level off take
of fertiliser (NPK) nutrients) was taken from various issues of Provincial Development
Statistics and shares of fertiliser used for wheat crop were obtained from National
Fertiliser Development Centre (NFDC), Islamabad. The data on climatic variables were
obtained from the Pakistan Meteorological Department (PMD), Islamabad.
2.2. The Empirical Model
The previous empirical work that estimated impact of climate change on
agriculture can be divided into three categories based on the methodologies used—
production function analysis; Ricardian approach; and simulation models. Production
function analysis used by Callaway (1982), Decker, et al. (1986), and Adams, et al.
(1988) relied on experimental data/production to predict the impact of climate change on
agricultural crops. This approach takes an underlying production function and estimates
impacts by varying one or more input variables such as precipitation, temperature and
carbon dioxide levels. More recently, some studies have3 used simulation models like
CCSR, AOGCM, PCM, CCCma, CERES, and APSIM-Wheat.4 These studies predicted
1The list of these districts include Rawalpindi, Jhelum, Sargodha, Mianwali, Faisalabad, Sialkot,
Lahore, Multan, Muzaffargarh, D. G. Khan, Rajanpur, Bahawalpur, Bahawalnagar, Sukker, Nawabshah,
Hyderabad, Nasirabad, Peshawar and Mardan. 2Several new districts were created in Pakistan during the period 1981- 2010, the statistics regarding
these districts for the years prior to their creation were never worked out by the concerned quarters and
therefore are not reported. This left us with no choice but to merge the available data in parent districts. In
addition, this action also helped in balancing the panel 3For details see Tubiello, et al. (2002), Luo, et al. (2003), Luo, et al. (2005), Lobell, et al. (2005),
Magrin, et al. (2005), Lobell, et al. (2007), Ludwig, et al. (2009), and Lea, et al. (2012). 4The Centre for Climate Systems Research (CCSR), Atmosphere-Ocean General Circulation Model
(AOGCM), Parallel Climate Model (PCM), Canadian Centre for Climate Modelling and Analysis (CCCma),
Crop Estimation through Resource and Environment Synthesis (CERES), Agricultural Production Systems
IMulator (APSIM).
Research Journal Social Sciences Volume 5, No. 1
12
impact of climate change by assuming certain scenarios for temperature, precipitation and
CO2 changes in coming years. The crop simulation approach is an important technique to
look into the future changes in climate and their impacts on agriculture. However, it is
costly and difficult to implement in developing countries as argued by Kurukulasuriya
and Ajwad (2004). The negative impact of climate change predicted using these methods
is often exaggerated—since these approaches do not accommodate the crops substitutions
and adaptations to climate changes. EA(RA) can avoid these biases as it allows crop
substitutions and farm-level adaptations [Mendelsohn, et al. (1994)]. This method
analyses the impact of climate change on value of farmland or net rent instead of yield or
total production as is done in traditional approach. Various studies used this approach
including Mendelsohn, et al. (1994), Mendelsohn and Dinar (1999), Gbetibouo and
Hassan (2005), Deressa and Hassan (2009) and Shakoor, et al. (2011). Thus the RA
appeared to be the most suitable technique to evaluate the impact of climate change on
agriculture. However, this approach is also not without fundamental flaws, and has been
criticised on various grounds. The major shortcomings of its applications in developing
countries are the absence of proper documentation of agricultural farm values and the
existence of imperfect land markets [Gbetibouo and Hassan (2005); and Guiteras (2009)].
Other critics include: Cline (1996)—constant price assumption in RA biases the welfare
calculations; Quiggn and Horowitz (1999)— implicitly assuming zero adjustment cost
yields lower-bound estimates of the costs of climate change; Darwin (1999)—RA does
not take into account the water supply and its availability; and Gbetibouo and Hassan
(2005)—RA ignores the costs of adaptation.
Yit = e+ nCnorm+ v Cvar + s Csqr * (Ar)
* (Fr)
* e
* e
In the light of above discussion, this study employs production function approach.
General form of the production function can be written as;
Yit = f(Cnorm’ Cvar’ Csqr’ Ar, Fr, Tr) … … … … (2)
Where, Yit is wheat output per acre (yield) in district i in the year t and Cnorm, Cvar, and
Csqr are respectively vectors of climatic normals, variations of climatic variables form
normals, and squares of climatic normals. The variables Ar, Fr, and Tt respectively
denote area under wheat crop, fertiliser use per hectare, and time trend (to control the
impact of technological change overtime). All explanatory variables are also observed at
time t for district i. However, for simplicity we avoided the subscripts. The Cobb Douglas
functional form for the general wheat yield function given in Equation 1 can be rewritten
as;
lnYit = 0 + nCnorm + vCvar + sCsqr + a ln(Ar) + f ln(Fr) + gTt + it (3)
Where, 0 is constant and n, v, and s are vectors of unknown parameters to be
estimated that respectively relate to climatic normals, variations of climatic variables
from normals, and square terms (climatic variables). The parameters a, f, and g are
unknown coefficients associated with area under wheat, fertilizer use and the time trend
respectively. The it is usual error term with zero mean and 2 variance. After taking the
natural logarithm (ln) on both sides, the Equation 2 can be rewritten in following linear
form wheat growing season in Pakistan normally extends from November to end of April

Munir Ahmad, Hasan Siftain and Muhammad Iqbal Impact of Climate Change on Wheat Productivity …….
13
covering various crop growth stages (germination/tillering, vegetative growth/flowering,
and grain formation/maturing—hereafter referred as stage-1, stage-2, and stage-3).
Mostly, wheat crop passes through these growth stages respectively during the periods
November-December (ND), January-February (JF), and March-April (MA). We used
data for climatic variables (temperature and precipitation) for these three time periods and
estimated the following full version of Equation 3 written as:
lnYit = 0 + TND (TEMPND) + TJF (TEMPJF)
+ TMA (TEMPMA) + PND(PRECPND)
+ PJF (PRECPJF) + PMA(PRECPMA)
+ VTND (VTEMPND) + VTJF(VTEMPJF)
+ VTMA (VTEMPMA) + VPND(VPRECPND)
+ VPJF (VPRECPJF) + VPMA(VPRECPMA)
+ TND2 (TEMPND)2 + TMA2(TEMPMA)2
+ PND2 (PRECPND)2 + PJF2(PRECPJF)2
+ PMA2 (PRECPMA)2 + ar lnAr + f lnFr
+gTt + i i Di + uit … … … … … … (4)
Where, TEMP, PRECP, VTEMP, and VPRECP represent temperature normal,
precipitation normal, temperature variation, and precipitation variation respectively and
the subscripts of these variables denote the time period representing various growth
stages as defined above. Di represents the dummy variable for ith district. The climate
normal is defined as the average of about 30 years of weather indicators [Kurukulasuriya
and Ajwad (2004) and Gbetibouo and Hassan (2005)]. However, Chang (2002) used 20
years moving average in the analysis. Deschenes and Kolstad (2011) used five years
moving average. Because of non- availability of long enough climatic variables data, we
use 20 years moving average to represent climate normals. Different specifications for
the climatic variation variables are found in the literature. For example, Mendelsohn, et
al. (1999) took the difference between highest and lowest monthly precipitation and
temperature whereas Chang (2002) used the deviations of seasonal average temperature
and precipitation from their corresponding sample means. Following Chang (2002), we
took the difference between the average monthly temperature and precipitation from their
corresponding historic long-term means.5 Square of normal temperatures and
precipitations are also included in the equation to capture non-linearity of the impact of
climate [Mendelsohn and Dinar (1999); Chang (2002); Kurukulasuriya and Ajwad (2004)
and Gbetibouo and Hassan (2005)].
3. RESULTS AND DISCUSSION
It is believed that the temperature has increased the world over and precipitation
has generally declined and became more erratic. In order to have an idea about how these
climatic variables behaved over time during wheat growing season in selected districts of
Pakistan, we regressed 20 years moving average of precipitation and temperature on time
trend. The overall trends of temperature and precipitation normals are obtained using
5Considering growth rate of 0.02550C for November-December every year, the overall increase over
the last 30 years period for the same month would be 0.7650C.

Research Journal Social Sciences Volume 5, No. 1
14
fixed effects technique. The estimates of trends are presented in Table 1.The results
indicate that temperature has generally increased overtime during the November-
December (stage-1) with the exception of Sukkur and Mardan where it witnessed
declining trend. In most of the districts an increase in the mean temperature (or
insignificant change) was observed during the months of January-February (stage-2)
however a declining trend of mean temperature during the same months was observed in
Mardan, D.G. Khan, and Sukkur districts. The mean temperature at wheat growth stage-
3 (March-April) witnessed a slightly declining trend in majority of the districts in
southern and northern parts of the country whereas an increasing trend in temperature
prevailed in central districts of the Punjab during the same months. It can be concluded,
in terms of mean temperature during wheat crop season, that the districts of Sargodha,
Faisalabad, Multan, Sialkot, Lahore, and Bahawalnagar became warmer and districts of
Mardan and Sukkur became cooler during the study period.
Table 1
Trends of Temperature and Precipitation Normals (Slope Coefficient of Time )
Province District
Temperature Normals Precipitation Normals
Nov -Dec
(Sowing)
Jan-Feb
(Vegetative)
March -Apr
(Maturity)
Nov-Dec
(Sowing)
Jan-Feb
(Vegetative)
March-Apr
(Maturity)
Northern Punjab
Jhelum 0.0227 0.0313 -0.0104NS 0.2479 -0.0081NS 0.1275NS
Rawalpindi 0.0281 0.0132 -0.0424 0.2487 -0.0091NS 0.1316NS
Central Punjab
Sargodha 0.0290 0.0227 0.0218 0.0777 0.2456 -0.1053
Mianwali 0.0233 0.0093 -0.0006NS 0.1536 0.49821 0.1778
Faisalabad 0.0828 0.0174 0.0397 -0.0491 0.1108 0.0254NS
Punjab Sialkot 0.0229 0.0197 0.002 0.1094 -0.0646 -0.0707NS
Lahore 0.0501 0.0411 0.0309 -0.0821 -0.0864NS -3029
Southern Districts
Rajanpur 0.0220 -0.0049NS -0.0294 0.0481 0.3314 0.1411
Multan 0.0303 0.0257 0.0256 -0.082 0.0872 -0.1128
DG Khan 0.0141 -0.0059 -0.0323 -0.0809 0.0867 -0.1179
Bahawalpur 0.0536 0.00451NS -0.0073NS -0.0426 0.0375 0.0364NS
M Garh 0.0137 -0.0030NS -0.0310 -0.0820 0.0865 -0.1137
Bahawalnagar 0.0714 0.0779 0.1252 0.0474 0.3283 0.1391
Sukkur -0.0280 -0.0083 -0.0347 -0.0629 -0.0813 0.0192
Sindh Nawabshah 0.0276 0.0233 0.0062NS -0.0617 0.0597 0.0272
Hyderabad 0.0127 0.0071 -0.0119 -0.0295 0.095 0.0126
Balochistan Nasirabad 0.0311 -0.00324NS -0.0168 0.0354NS 0.0458 0.0261NS
Peshawar Valley Districts
KPK Peshawar 0.0113 0.0245 -0.0230 -0.0138NS 0.6301 0.0673NS
Mardan -0.0338 -0.0340 -0.0609 -0.3214 0.3659 -0.2383
Min growth -0.0338 -0.0340 -0.0609 -0.3214 -0.0813 -0.3029
Max growth 0.0828 0.0779 0.1252 0.2487 0.6301 1.1778
Average growth 0.0255 0.0136 -0.0026NS 0.0081NS 0.1452 0.0457
Proportion of +tive
deviations 0.64 0.58 0.58 0.31 0.47 0.41 NSStatistically non-significant temperature/precipitation growth rates.
Munir Ahmad, Hasan Siftain and Muhammad Iqbal Impact of Climate Change on Wheat Productivity …….
15
Overall, there was no significant change in occurrence of precipitation during the
wheat sowing period in selected districts. However, a declining trend in precipitation was
found in districts of Sindh and southern district of Punjab whereas incidence of
precipitation increased during Nov-Dec in the central and northern district of Punjab. The
precipitation during the stage-2 (Jan-Feb) increased almost in all districts except in
Sialkot and Sukkur districts. The incidence of precipitation during stage-3 (March-April)
kept an increasing trend in Sindh and in northern districts of Punjab while it declined in
other districts of Punjab except Mianwali, Ranjanpur and Bahawalnagar. The last row in
Table 1 shows that the overall proportions of hotter months (above the historic mean)
during three stages of growth are higher as compared to the cooler months (below the
historic mean), while the proportions of precipitation deviations that are above the
historic mean are lower than the negative deviations (below the historic mean).
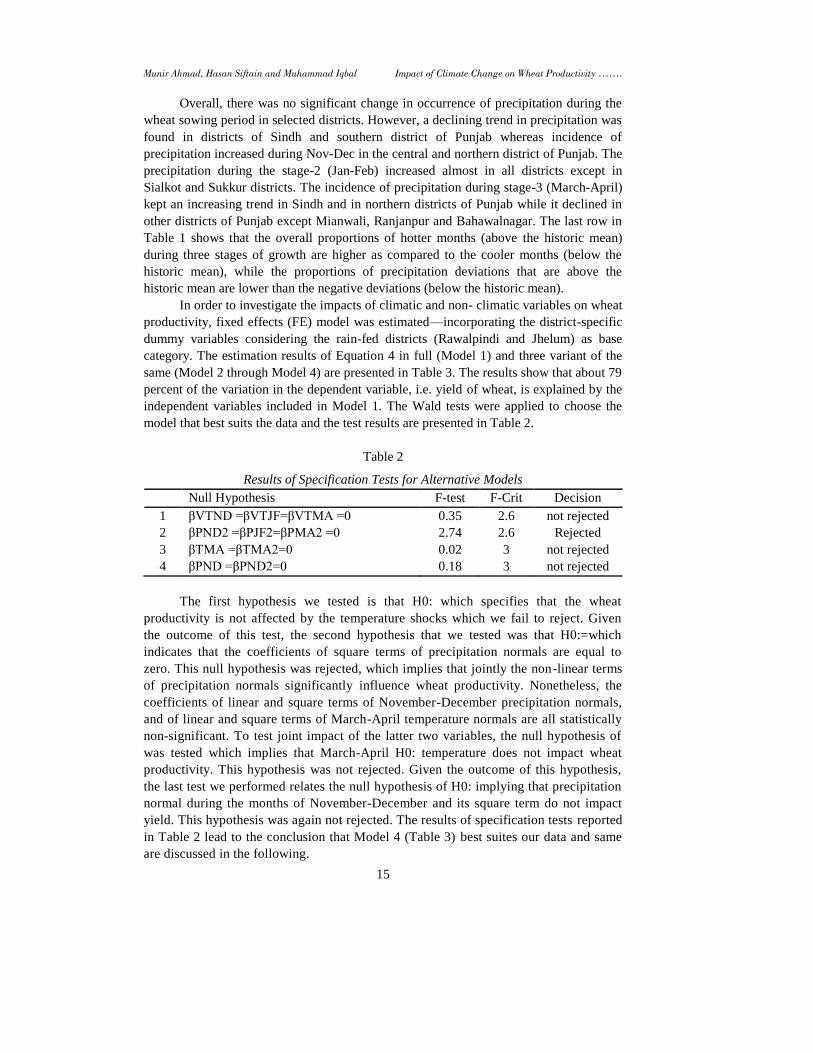
In order to investigate the impacts of climatic and non- climatic variables on wheat
productivity, fixed effects (FE) model was estimated—incorporating the district-specific
dummy variables considering the rain-fed districts (Rawalpindi and Jhelum) as base
category. The estimation results of Equation 4 in full (Model 1) and three variant of the
same (Model 2 through Model 4) are presented in Table 3. The results show that about 79
percent of the variation in the dependent variable, i.e. yield of wheat, is explained by the
independent variables included in Model 1. The Wald tests were applied to choose the
model that best suits the data and the test results are presented in Table 2.
Table 2
Results of Specification Tests for Alternative Models
Null Hypothesis F-test F-Crit Decision
1 βVTND =βVTJF=βVTMA =0 0.35 2.6 not rejected
2 βPND2 =βPJF2=βPMA2 =0 2.74 2.6 Rejected
3 βTMA =βTMA2=0 0.02 3 not rejected
4 βPND =βPND2=0 0.18 3 not rejected
The first hypothesis we tested is that H0: which specifies that the wheat
productivity is not affected by the temperature shocks which we fail to reject. Given
the outcome of this test, the second hypothesis that we tested was that H0:=which
indicates that the coefficients of square terms of precipitation normals are equal to
zero. This null hypothesis was rejected, which implies that jointly the non-linear terms
of precipitation normals significantly influence wheat productivity. Nonetheless, the
coefficients of linear and square terms of November-December precipitation normals,
and of linear and square terms of March-April temperature normals are all statistically
non-significant. To test joint impact of the latter two variables, the null hypothesis of
was tested which implies that March-April H0: temperature does not impact wheat
productivity. This hypothesis was not rejected. Given the outcome of this hypothesis,
the last test we performed relates the null hypothesis of H0: implying that precipitation
normal during the months of November-December and its square term do not impact
yield. This hypothesis was again not rejected. The results of specification tests reported
in Table 2 lead to the conclusion that Model 4 (Table 3) best suites our data and same
are discussed in the following.

Research Journal Social Sciences Volume 5, No. 1
16
The results of Model 4 demonstrate that all estimated coefficients of districts-
specific dummy variables are statistically significant and carry positive signs indicating
higher productivity in irrigated areas relative to the rain-fed districts—Rawalpindi and
Jhelum. The parameter estimates of non-climatic variables including area under wheat,
fertiliser and technology represented by time trend are all statistically significant and
carry positive signs. Two important conclusions emerge from these results: First is that
growing of wheat crop faces increasing returns to scale—that could mainly be due to
government interventions in wheat economy both in inputs and output markets which
induces greater specialisation in wheat production on the part of farmers; and the second
is that improvement in production technologies has played a significant role in enhancing
wheat yield in Pakistan.
The impact of temperature on wheat production depends strictly on location—
higher temperatures could have positive effect in the cooler and wetter regions, while it
influences the produce negatively in hotter and tropical regions [Ludwig and Asseng
(2006)]. In general higher temperature tends to have negative effect on wheat crop
because wheat is grown in the cold winter season. It germinates, matures and sets seed at
low temperatures. Rise in temperature during early stages may result in poor seed
emergence, less tillering, and thus low productivity etc. Since we were very much
constrained by the data and had to pool information from 19 districts of Pakistan for
which climatic related information were available for the study period, therefore, could
not run regressions separately for various regions/cropping systems.
The coefficient of the average temperature during the stage-1—November and
December, is statistically significant and carries a positive sign, while the coefficient of
its square term is negative and statistically significant. The impact coefficient of average
temperature during the months of November-December on wheat yield was evaluated at
the mean temperature that came out to be -0.0741—implying that 10C increase in
average temperature during the sowing stage would reduce the yield by 7.4 percent. The
estimated increase in temperature normal during the study period for the months of
November-December is projected to be 0.7650C.6 Therefore, the overall potential wheat
yields got depressed by 5.67 vii percent. This estimate is in close agreement with
Sivakumar and Stefanski (2011). They reported that an increase of 10C in mean
temperature would reduce the overall wheat yield by 5-7 percent in Pakistan.
The results of a Rapid Rural Appraisal (RRA) conducted in Punjab, Sindh and KP
provinces highlighted the facts that the farmers do perceive the long-term changes in
climate and their resulting adverse impacts on agriculture. This realisation induced the
wheat growers to ignore the recommendations of agricultural extension department that is
of completing the sowing of crop before 20th of November. The wheat sowing has
generally been delayed 2-3 weeks throughout the country to avoid higher temperature
level (above the normal) from mid-October to early-November [Ahmad, et al. (2013)].
Had this adaptation strategy of shifting the sowing time of wheat not been adopted, the
wheat yield losses in various areas of the country could have been much higher.
The coefficient of linear and square terms of temperature normal for January-
February period—the stage-2, are highly significant and carry negative and positive signs
6This is a simple calculation. If with 10C increase in temperature reduces yield by 7.4 percent, then
with 0.7650C rise in temperature would reduce yield of wheat by 5.67 percent (= 7.4*0.765).

Munir Ahmad, Hasan Siftain and Muhammad Iqbal Impact of Climate Change on Wheat Productivity …….
17
respectively. The coefficient at the mean temperature is calculated to be 0.0621 which
implies that 10C increase in average temperature during vegetative growth period would
encourage wheat yield by 6.4 percent. The temperature during this stage has however
shown an increase of 0.4080C which helped raise wheat yield by an amount of 2.53
percent during the study period. survey has highlighted the fact that the temperature has
generally increased and frost incidence has declined in most areas of Pakistan during the
vegetative growth stage (January-February). However, the rise and fall in temperature
have become very uncertain over time—in certain areas frost may occurs in late winter
months, i.e. February, impacting the wheat yield adversely [Ahmad, et al. (2013)].
Therefore, warming weather during the vegetative growth helped enhance wheat yield in
cold areas.
We found no significant impact of temperature normal during the stage-3 (March-
April). The growth in average temperature normal during this stage was observed to be
negative and was statistically non-significant with a wide variation from district to
district. On the whole, the non-significance of the impact of temperature could have been
mainly due to the non-rising temperature trend—that might have actually helped sustain
the duration of crop stand in the field and avoided yield losses. Conversely, if the
temperature during March-April had been on the rise as witnessed during the sowing
stage (November- December)—that persuaded the farmers to delay wheat sowing time as
strategy, would have had shorten the growing season considerably causing a further loss
of 6-11 percent in yield [Ali (2011)].
Impact of higher precipitation on wheat production also depends strictly on
geographical area. In general, higher precipitation in arid and semi-arid regions affects
wheat production positively. However, in regions with already high rainfall, more
precipitation can reduce wheat production by nutrient leaching and water logging
[Ludwig and Asseng (2006)]. Further, prolonged wet conditions during vegetative growth
period increase the risk of yellow rust incidence in wheat crop [ICARDA (2011)]. Our
results have shown that the parameter estimates of linear and squared terms of
November-December precipitation were statistically non-significant—so has been the
rate of growth in precipitation for the same months. The response coefficients at mean
levels of rain fall for the remaining two stages of growth are computed as 0.00004 and
0.00673 implying that 10mm increase in precipitation normal during the vegetative
growth and maturity stages would increase wheat yield by 0.004 and 0.67 percent,
respectively. The parameter estimate for the maturity stage precipitation was found to be
0.0067 indicating 0.067 percent increase in yield with 10mm greater precipitation.
Variations on temperature and precipitation from the long term trend have also been used
to examine the impacts of climatic shocks. As mentioned before, the collective impact of
temperature variations on yield turned out to be statistically non-significant. The
precipitation variation variables (relating stage-1 through stage-3) were included in the
model. The results show that the coefficients of deviations from the long-term mean
precipitation during the first and second stages of wheat growth are statistically
significant and carry positive signs implying that the weather shocks have influenced
wheat productivity positively—the positive impacts may be due to the fact that most of
the deviations from the historic mean precipitation are positive (see Table 1). However,
the variations variable relating to the wheat growth stage-3 shows statistically non-
significant impact on wheat yield.

Research Journal Social Sciences Volume 5, No. 1
18
4. CONCLUSION AND POLICY IMPLICATION
The study shows that climate change is affecting the wheat productivity
significantly in Pakistan and that the impact varies across growth stages of the crop. The
increase in long-run mean temperature during germination and tillering stage effects
wheat yields adversely. The results show that an increase of 10C in the mean temperature
during this stage would reduce crop yield by 7.4 percent. The results of the RRA
conducted by the authors highlighted the fact that the farmers do perceive the long-term
changes in climate and its adverse impacts on agriculture. This realisation led the farmers
to delay wheat sowing 2-3 weeks throughout the country to avoid higher temperature
level (above the normal) from mid-October to early-November. Had this adaptation
strategy of shifting the sowing time of wheat not been adopted, the wheat yield losses in
various areas of the country could have been much higher.
Such an increase in temperature during vegetative growth stage enhances wheat
productivity especially in cold regions of the country whereas no evidence of any
significant effect on crop yield was found for the increase in temperature during maturity
stage. The 10C rise in mean temperature during vegetative growth enhances wheat
productivity to the tune of 6.4 percent. Due to changing climate pattern, the rise and fall
in temperature have become very uncertain over time. The frost occurs even in February
in certain areas impacting the wheat yield adversely. Therefore, warming weather during
the vegetative growth helped enhance wheat yield in cold areas. No significant impact of
rise in temperature normals during wheat maturity stage was observed on wheat
productivity. The non-significance of the impact of temperature could have been mainly
due to the non-rising temperature trend during this period—that might have actually
helped sustain the duration of crop stand in the field and avoided yield losses. The
deviations of mean temperature from historic (long run) mean—weather shocks, had also
posed no threat to wheat productivity during the period under study.
Precipitation normals—during vegetative and maturity stages and their deviations
from historic mean (positive) have impacted the wheat yield positively—but the
magnitude of the impact of incremental rains came out to be very low.
The results of this study have certain important policy implications. First, the
effect of climate change (normal and variations) on wheat yield should be given due
consideration in more resilient to climate change. Second, there should be sufficient
expenditure on agriculture research and development for improving varieties of wheat
crop which should be resilient to climate change i.e. high yielding, tolerant to heat and
water stresses, and less prone to viral attack. Third, since climate change is not uniformly
affecting all parts of Pakistan so there is need to have more localised adaptation policy in
order to tackle climate change instead of one common national level policy framework.
REFERENCES
Adams, Richard M., A. McCarl Bruce, J. Dudek Daniel, and J. David Glyer (1988)
Implications of Global Climate Change for Western Agriculture. Western Journal of
Agricultural Economics 13:2, 348–356.
Ahmad, M., M. Iqbal, and M. A. Khan (2013) Climate Change, Agriculture and Food
Security in Pakistan: Adaptation Options and Strategies. Pakistan Institute of
Development Economics, Islamabad. (Climate Change Brief).

Munir Ahmad, Hasan Siftain and Muhammad Iqbal Impact of Climate Change on Wheat Productivity …….
19
Ahmad, Munir and Azkar Ahmad (1998) An Analysis of the Sources of Wheat Output
Growth in the Barani Area of the Punjab. The Pakistan Development Review 37:3,
231–249.
Ali, G. (2011) Climate Change Concerns and Emerging Challenges for Water and Food
Security of Pakistan. Presentation made at ge, Food and Water 25 February, 2011,
Colombo, Sri Lanka. http:// www.slideshare.net/globalwaterpartnership/ 8-g-ali-gwp-
iwmi-ws
Ashfaq, Muhammad, Farhad Zulfiqar, Irsa Sarwar, M. Abdul Quddus, and Irfan Ahmad
Baig (2011) Impact of Climate Change on Wheat Productivity in Mixed Cropping
System of Punjab. Soil and Environment 30:2, 110–114.
Callaway, John M. (1982) An Analysis of Methods and Models for Assessing the Direct
and Indirect Economic Impacts of CO2 Induced Environmental Changes in the
Agricultural Sector of the US Economy. Pacific Northwest Laboratory.
Chang, Ching‐Cheng (2002) The Potential Impact of Climate Change on Taiwan s
Agriculture. Agricultural Economics 27:1, 51–64.
China, I. (2007) China s National Climate Change Programme. People’s Republic of
China: National Development and Reform Commission. http://en.ndrc.gov.cn/
newsrelease/
Cline, William R. (1996) The Impact of Global Warming of Agriculture: Comment. The
American Economic Review 86:5, 1309–1311.
Darwin, Roy (1999) Impact of Global Warming of Agriculture: A Ricardian Analysis:
Comment. American Economic Review 89:4, 1049–1052.
Decker, W. L., V. K. Jones, and R. Achutuni (1986) Impact of Climate Change from
Increased Atmospheric Carbon Dioxide on American Agriculture. Washington, DC:
US Department of Energy.
Deressa, Temesgen Tadesse, and Rashid M. Hassan (2009) Economic Impact of Climate
Change on Crop Production in Ethiopia: Evidence from Cross-Section Measures.
Journal of African Economies 18:4, 529–554.
Deschenes, Olivier and Charles Kolstad (2011) Economic Impacts of Climate Change on
California Agriculture. Climatic Change 109:1, 365–386.
Gbetibouo, Glwadys Aymone and R. M. Hassan (2005) Measuring the Economic Impact
of Climate Change on Major South African Field Crops: A Ricardian Approach.
Global and Planetary Change 47:2, 143–152.
Guiteras, Raymond (2009) The Impact of Climate Change on Indian Agriculture.
Department of Economics, University of Maryland, College Park, Maryland.
(Manuscript).
Hanif, Uzma, Shabib Haider Syed, Rafique Ahmad, Kauser Abdullah Malik, and
Muhammad Nasir (2010) Economic Impact of Climate Change on the Agricultural
Sector of Punjab [with Comments]. The Pakistan Development Review 49:4, 771–
798.
Hausman, Jerry A. (1978) Specification Test sin Econometrics. Econometrica: Journal of
the Econometric Society 52:5, 1251–1271.
ICARDA (2011) Strategies to Reduce the Emerging Wheat Stripe Rust Disease.
International Centre for Agricultural Research in the Dry Areas.
Research Journal Social Sciences Volume 5, No. 1
20
Janjua, Pervez Zamurrad, Ghulam Samad, Nazakat Ullah Khan, and Muhammad Nasir
(2010) Impact of Climate Change on Wheat Production: A Case Study of Pakistan
[with Comments]. The Pakistan Development Review 49:4, 799–822.
Kurukulasuriya, Pradeep, and Mohamed Ihsan Ajwad (2004) Ricardian Study of
Srilankan Farmers. Cross-sectional Analyses of Climate Change Impacts: (World
Bank Policy Research Working Papers 3350).
Lea, Jaehyuk, Denis Nadolnyak, and Valentina Hartarska (2012) Impact of Climate
Change on Agricultural Production Asia Countries: Evidence from Panel Study.
Selected paper presented all the Southern Agricultural Economics Association,
Annual Meeting, Birmingham, Al, Feb. 4-7, 2012.
Lead, Pakistan (2009) Changing Climate: Exploring Adaptation Strategies for Pakistan.
Second National Training Session—Cohort 13, January 12-16, 2009—LEAD House,
Islamabad.
Lobell, David B. and Christopher B. Field (2007) Global Scale Climate Crop Yield
Relationships and the Impacts of Recent Warming. Environmental Research Letters
2:1, 014–002.
Lobell, David B., J. Ivan Ortiz-Monasterio, Gregory P. Asner, Pamela A. Matson,
Rosamond L. Naylor and Walter P. Falcon (2005) Analysis of Wheat Yield and
Climatic Trends in Mexico. Field Crops Research 94:2, 250–256.
Ludwig, Fulco and Senthold Asseng (2006) Climate Change Impacts on Wheat
Production in a Mediterranean Environment in Western Australia. Agricultural
Systems 90:1, 159–179.
Ludwig, Fulco, Stephen P. Milroy, and Senthold Asseng (2009) Impacts of Recent
Climate Change on Wheat Production Systems in Western Australia. Climatic
Change 92:3-4, 495–517.
Luo, Qunying, Martin A. J. Williams, William Bellotti, and Brett Bryan (2003)
Quantitative and Visual Assessments of Climate hange Impact son South Australian
Wheat Production. Agricultural Systems 77:3, 173–186.
Luo, Qunying, William Bellotti, Martin Williams, and Brett Bryan (2005) Potential
Impact of Climate Change on Wheat Yield in South Australia. Agricultural and
Forest Meteorology 132:3, 273–285.
Magrin, G. O., R. A. M. I. Travasso, G. Rodriguez, D. Boull´on, M. S. Solman (1998)
Vulnerabilidad y Mitigaci´on relacionada con el Impacto del Cambio Global sobre. In
V. Barros, J. A. Hoffmann, and W. M. Vargas (eds.) Proyectode Estudiosobreel
Cambio Clim´ atico en Argentina, proyecto ARG/95/G/31- PNUD-SECYT, p. 290.
Magrin, Graciela O., María I. Travasso, and Gabriel R. Rodríguez (2005) Changes in
Climate and Crop Production during the 20th Century in Argentina. Climatic Change
72:1-2, 229–249.
Mendelsohn, Robert and Ariel Dinar (1999) Climate Change, Agriculture, and
Developing Countries: Does Adaptation Matter? The World Bank Research Observer
14:2, 277–293.
Mendelsohn, Robert, William D. Nordhaus, and Daigee Shaw (1994) The Impact of
Global Warming on Agriculture: A Ricardian Analysis. The American Economic
Review 84:4, 753–771.

Munir Ahmad, Hasan Siftain and Muhammad Iqbal Impact of Climate Change on Wheat Productivity …….
21
Mendelsohn, Robert, William D. Nordhaus, and Daigee Shaw (1999) The Impacts of
Climate Variation on US Agriculture. In R. Mendelsohn and J. E. Neumann (eds.)
(2004). The Impact of Climate Change on the United States Economy. Cambridge
University Press.
Quiggin, John C. and John K. Horowitz (1999) The Impact of Global Warming on
Agriculture: A Ricardian Analysis- Comment. American Economic Review 89:4,
1044–1045.
Schlenker, Wolfram, W. Michael Hanemann, and Anthony C. Fisher (2007) Water
Availability, Degree Days, and the Potential Impact of Climate Change on Irrigated
Agriculture in California. Climatic Change 81:1, 19–38.
Schlenker, Wolfram, W. Michael Hanemann, and Anthony C. Fisher (2005) Will U.S.
Accounting for Irrigation in The Hedonic Approach. American Economic Review
95:1, 395–406.
Shakoor, Usman, Abdul Saboor, Ikram Ali, and A. Q. Mohsin (2011) Impact of Climate
Change on Agriculture: Empirical Evidence from Arid Region. Pakistan Journal of
Agricultural Science 48:4, 327–333.
Siddiqui, Rehana, Ghulam Samad, Muhammad Nasir, and Hafiz Hanzla Jalil (2012) The
Impact of Climate Change on Major Agricultural Crops: Evidence from Punjab,
Pakistan. The Pakistan Development Review 51:4, 261–276.
Sivakumar, Mannava V. K. and Robert Stefanski (2011) Climate Change in South Asia.
In Climate Change and Food Security in South Asia, pp. 13-30. Springer Netherlands.
Tubiello, F. N., C. Rosenzweig, R. A. Goldberg, S. Jagtap, and J. W. Jones (2002) Effects
of Climate Change on US Crop Production: Simulation Results using Two Different
GCM Scenarios. Part I: Wheat, Potato, Maize, and Citrus. Climate Research 20:3,
259–270.
Tubiello, Francesco N., Cynthia Rosenzweig, and Tyler Volk (1995) Interactions of CO2,
Temperature and Management Practices: Simulations with a Modified Version of
CERES- Wheat. Agricultural Systems 49:2, 135–152.
You, Liangzhi, Mark W. Rosegrant, Stanley Wood, and Dongsheng Sun (2009) Impact of
Growing Season Temperature on Wheat Productivity in China. Agricultural and
Forest Meteorology 149:6, 1009–1014.