Embed Size (px)
Citation preview
Impact of a Lisbon-type tsunami on the U.K. coastline and the
implications for tsunami propagation over broad continental shelves
K. J. Horsburgh,1 C. Wilson,1 B. J. Baptie,2 A. Cooper,3 D. Cresswell,3 R. M. W. Musson,2
L. Ottemoller,2 S. Richardson,3 and S. L. Sargeant2
Received 29 June 2007; revised 24 September 2007; accepted 15 November 2007; published 9 April 2008.
[1] We investigate the propagation of tsunamis toward the European shelf break, using sixdifferent initial conditions (based on the 1755 Lisbon earthquake), in order to assess thehazard to this region. Only one of our source models, an assumed earthquake magnitude of8.7 Mw with a zonal fault orientation, resulted in significant wave heights at the U.K.coastline. Because of wave spreading, only a fraction of the tsunami energy from such anevent reaches the northwest European shelf, which itself provides a further bufferthrough reflection and frictional dissipation. However, we found significant localreamplification due to wave interactions and resonance on the continental shelf. Themaximum elevations obtained were comparable to severe winter storm conditions, butwith extreme local variability in the tsunami amplitude. Our results suggest that the impactof any repeat of this event would be very sensitive to the precise location and orientationof the source deformation, as well as by complex topographic interactions on the shelf.The uncertainties arising from the combination of source orientation and bathymetricinteraction suggest that any assessment of risk, for places where tsunamis are likely,should consider a large ensemble of initial conditions.
Citation: Horsburgh, K. J., C. Wilson, B. J. Baptie, A. Cooper, D. Cresswell, R. M. W. Musson, L. Ottemoller, S. Richardson, and
S. L. Sargeant (2008), Impact of a Lisbon-type tsunami on the U.K. coastline and the implications for tsunami propagation over broad
continental shelves, J. Geophys. Res., 113, C04007, doi:10.1029/2007JC004425.
1. Introduction
[2] The 26 December 2004 Sumatra-Andaman earth-quake (9.0–9.3 Mw) and the resultant tsunami was one ofthe worst modern, natural disasters. It prompted govern-ments and international agencies to reevaluate the likeli-hood, and consequences, of similar events occurringelsewhere [Kanamori, 2006]. The risk to the United King-dom (and more generally to coasts surrounding the north-west European seaboard) was assessed in a study [Kerridgeet al., 2005] that concluded the probability of any suchevent is very low. However, there is historical and geolog-ical evidence of tsunamis reaching northern Europeanshores [e.g., Smith et al., 2004; Dawson et al., 2000] sothe possibility of future events affecting low-lying popula-tions in this region cannot be dismissed. This paper inves-tigates the hazard to the United Kingdom associated with atsunami similar to that generated by the Lisbon 1755earthquake. We consider the effects of topographic steeringfor this scenario, the regions of energy dissipation, and theimplications for tsunamis on broad shelves elsewhere.[3] We select the Azores-Gibraltar fault zone (AGFZ) as
the source region, since this was the source of the tsunami in
1755 which (along with the earthquake) destroyed the cityof Lisbon [see, e.g., Baptista et al., 1998a]. It was also thesource of the well-documented 1969 (7.9 Mw) earthquake[Fukao, 1973]; small-amplitude (0.2 m) waves with tsunamiperiodicities were recorded at Newlyn, United Kingdom,following that event [Dawson et al., 2000]. Similar waveswere recorded at Newlyn after earthquakes west of Portugalin 1941 (8.2 Ms), and 1975 (7.9 Ms). Kerridge et al. [2005]concluded that this region is the most probable source for amajor North Atlantic tsunami. There is, of course, geolog-ical evidence of a major tsunami impacting the northerncoastline of the United Kingdom following the Storregasubmarine landslide approximately 8000 years ago [e.g.,Bondevik et al., 1997; Smith et al., 2004], but it is widelythought that the marine deposition required for any repeatoccurrence could only accrue during a glacial period [Riseet al., 2005].[4] Following the Lisbon earthquake of 1 November
1755 there were reports of tsunami waves as high as 10 malong the coasts of Portugal, Spain, and Morocco [Baptistaet al., 1998a] and there is one account of 3 m wavesreaching Cornwall in the United Kingdom [Borlase,1755]. Although the historical data is summarized byBaptista et al. [1998a], locating the epicenter of the 1755earthquake is difficult. Conflicting information regardingthe distribution of intensities, origin time, and tsunamiarrivals [Johnston, 1996; Mendes et al., 1999], and thediffuse distribution of earthquakes along this part of theAGFZ [Zitellini et al., 2001], lead to large uncertainties, and
JOURNAL OF GEOPHYSICAL RESEARCH, VOL. 113, C04007, doi:10.1029/2007JC004425, 2008ClickHere
for
FullArticle
1Proudman Oceanographic Laboratory, Liverpool, UK.2British Geological Survey, Edinburgh, UK.3HR Wallingford, Wallingford, UK.
Published in 2008 by the American Geophysical Union.
C04007 1 of 15

the range of possible epicenters spans around 500 km (seeFigure 1b). Modeling of both the tsunami [Baptista et al.,1998b] and earthquake intensity [Johnston, 1996] has beenused to estimate the location and the size of the source.Detailed geophysical surveying in the eastern section of theAGFZ has taken place [Zitellini et al., 1999, 2001], but nosingle location has been implicated. This is not surprisingsince even for the better observed 28 February 1969tsunami, neither direct numerical simulation [Gjevik et al.,1997] or adjoint methods using observations [Pires andMiranda, 2001] were able to determine unique sourceparameters.[5] Since the exact source of the 1755 earthquake remains
unknown we consider three possible fault orientations andlocations, which we discuss in section 2. Source dimensionsand average slip are derived from realistic assumptions ofthe earthquake magnitude and empirical relationships forthe source scaling of intraplate earthquakes. We do notconsider the subduction model of Gutscher [2004] sincethere is significant evidence against subduction [e.g., Stichet al., 2005]. Composite source models [e.g., Vilanova etal., 2003] are also excluded. It is not the intention of thispaper to explore the relative merits of the various postulatedsources for the 1755 tsunami; rather, we use the historicalinformation as a first-order check on model performance inorder to explore the hazards and oceanographic implicationsassociated with this scenario.
2. Source Strength and Location
[6] Estimates of the magnitude of the 1755 earthquakegenerally vary between 8.5 and 9.0 Mw. Johnston [1996]used isoseismals to determine the moment magnitude,finding a best fit of 8.7 ± 0.39 Mw. In this study we selectlower and upper estimates as 8.3 and 8.7 Mw, respectively,on the basis of Abe [1979]. We assume that the 1755earthquake ruptured the entire seismogenic zone (between60 km depth and the surface). With a fault dip of about 50�[Fukao, 1973] this means that a realistic fault width is60 km/(sin 50�), or about 75 km. We assume an intraplatetectonic setting [Johnston, 1996] and propose three plausi-ble models for fault orientations and locations. Scalingrelationships for intraplate earthquakes imply larger slipcompared to interplate earthquakes of the same dimensions[Scholz et al., 1986; Scholz, 2002]. The models aredescribed below and their physical source dimensions aregiven in Table 1. The various locations can be found inFigure 1a.[7] Model A has the same epicenter as the 1969 earth-
quake in the Horseshoe Abyssal Plain, to the southeast ofthe Gorringe Bank [Fukao, 1973]. The origin of thisearthquake is reasonably well understood. It has a thrustmechanism on a fault plane that dips to the north and is
related to the tectonic uplift of the Gorringe Bank. The faultorientation is favorable to compression in northwest-southeastdirection. The model provides a good fit for the macro-seismic data; the Horseshoe Fault is an active tectonicfeature; and there is significant seismic activity in this area.However, Baptista et al. [1998b] suggest that sourcesanalogous to the 1969 earthquake do not reproduce theobserved distribution of wave heights and traveltimes alongthe Iberian coast for the 1755 event.[8] Model B is an earthquake north of the Gorringe Bank
as suggested by Johnston [1996], occurring on a thrust faultthat dips to the south and is related to the tectonic uplift ofthe bank. This is similar to the top hat model of Gjevik et al.[1997], which assumes uplift of the Gorringe Bank ridge asa source although there is evidence (N. Zitellini, unpub-lished data, 2005) to suggest that it is inactive. As a faultplane solution we used the south dipping auxiliary plane ofthe Fukao [1973] model for the 1969 event. Model C isequivalent to the N160 model of Baptista et al. [1998b].The source location is closer to the Iberian shore than eitherof the other models, between the Gorringe Bank and theedge of the continental shelf west of Cape San Vicente. Theearthquake occurs on a thrust fault dipping to the northeast.Baptista et al. [1998b] found that this model producedtsunami arrival times that better matched the historicalreports. However, the underlying tectonics of such a modelare less well defined. The inclusion of this model allowed usto examine the effect of source orientation on tsunamiwaves reaching the coastlines of the United Kingdom,Ireland, and northwest Europe.[9] In each case, the sea bed displacement due to an
inclined, rectangular fault was calculated using the well-known analytical expressions of Okada [1985]. Theseformulae assume the Earth to be a homogeneous elastic half-space and require the source parameters given in Table 1.We have assumed the worst case of complete crustal rupture:solutions with a specified focal depth would give smallerdisplacements. The sea floor deformations obtained weremapped directly onto the sea surface as shown in Figure 2.There are deficiencies in this assumption, as pointed out byGjevik et al. [1997] who employed a nonhydrostatic modeland showed that in certain circumstances the maximumsurface elevation can be 30% less than the displacement atthe sea bed. Neither can the surface deformation contain thediscontinuity that is present at the precise line of a fault. Ourmodeling scheme introduced the deformation as a seasurface elevation and, in practice, the discontinuity wasslightly smoothed because of regridding.
3. Numerical Modeling
[10] The models described in this section are nonlinear,shallow water (NLSW) models which are a routine and
Figure 1. (a) Bathymetry (m) used in numerical model simulations. Key locations are annotated as follows: GS (GobanSpur), GR (Galician Rise), F (Figuera), SV (San Vincente), GB (Gorringe Bank), C (Cadiz), HAP (Horseshoe AbyssalPlain), and M (Madeira). Also shown is the region covered by the Telemac model (dashed), the region of the seafloorperturbations described later in the text (solid, red), and two regions used for energy diagnostics (solid, blue and green).(b) Map of the Azores-Gibraltar Fault Zone, east of the Madeira Tore rise, with annotated faults. Red circles denoteearthquake epicenters, including various epicenters proposed for the 1755 earthquake: Ma: Machado [1966]; Mi: Milne[cited by Johnston, 1996]; Mo: Moreira [1989]; Re: Reid [1914]; Zi: Zitellini et al. [1999]. Earthquake epicenters from theBGS World Seismicity Database [Henni et al., 1998] are also plotted.
C04007 HORSBURGH ET AL.: LISBON-TYPE TSUNAMI IMPACT ON THE UK
2 of 15
C04007

Figure 1
C04007 HORSBURGH ET AL.: LISBON-TYPE TSUNAMI IMPACT ON THE UK
3 of 15
C04007

Table 1. Models of Fault Location and Orientation and Physical Source Dimensionsa
Model A Model B Model C
Fault plane Strike/dip/rake 235/52/73 81/41/110 340/45/90Fault center 36.01�N, 10.57�W
Southeast of Gorringe Bank37.00�N, 11.50�W
North of Gorringe Bank37.00�N, 9.75�W
Southwest of LisbonSource model A1 A2 B1 B2 C1 C2Magnitude 8.3 Mw 8.7 Mw 8.3 Mw 8.7 Mw 8.3 Mw 8.7 MwLength (km) 105 210 105 210 105 210Width (km) 75 75 75 75 75 75Mean slip (m) 6.8 13.6 6.8 13.6 6.8 13.6Seismic moment, M0 (Nm) 3.5 � 1021 1.4 � 1022 3.5 � 1021 1.4 � 1022 3.5 � 1021 1.4 � 1022
aCalculations assume the shear modulus, m = 6.5 � 1011 dyn cm�2 [Johnston, 1996], and the scaling factor for intraplateearthquakes, a = 6.5 � 10�5 [Scholz, 2002].
Figure 2. Tsunamigenic seafloor movement scenarios (m), used to perturb the sea surface of the modelsimulations. Scenarios A, B, and C explore different epicenter locations and fault orientations in theOkada [1985] model. Group 1 (left) corresponds to a magnitude of 8.3 Mw, and group 2 (right)corresponds to 8.7 Mw.
C04007 HORSBURGH ET AL.: LISBON-TYPE TSUNAMI IMPACT ON THE UK
4 of 15
C04007

appropriate choice for tsunami propagation modeling awayfrom the immediate source, so long as the wavelength isproperly discretized [Shuto, 1991]. The widely used MOSTmodel [Titov and Gonzalez, 1997] is of this type. Recentcomparisons of model predictions with reliable coastalobservations in the Sea of Japan [Choi et al., 2003] alsoshow that nested, finite difference, NLSW models producedaccurate simulations of coastal inundation and runup. Foroptimum discretization, in this study we nested an unstruc-tured finite element model within a wide domain finitedifference model.
3.1. Finite Difference Modeling
[11] In order to best represent the tsunamis at their origin,as well as their subsequent evolution across the EuropeanShelf, we extended the U.K. operational storm surge model[Flather, 2000] to cover the region 20�W to 13�E, 30�N to60�N. The model solves the two-dimensional shallow waterequations in finite difference form in spherical coordinates,with a quadratic formulation for stress at the sea bed andradiation conditions at the open lateral boundaries. Theresolution used here was 1/30� latitude by 1/20� longitude,resulting in an approximately 3.5 km horizontal grid thatprovides effective discretization and avoids numerical dis-persion [Shuto, 1991; Kowalik, 2001]. The model integra-tions ran at a time step of 10 s for 12 h, by which time thewave train had passed the United Kingdom. Elevations andvelocity fields were archived every minute for subsequentdiagnostics. As well as examining maximum elevations andtsunami arrival times we studied wave energetics, makingthe connection between the genesis region and the subse-quent modification of the wave as it propagates.
3.2. Energetics
[12] We derive an energy equation from the shallow watergoverning equations in spherical coordinates. The continu-ity and momentum equations used in the model can befound in the work of Flather [1976] and are writtenconcisely below. For completeness we retained the Coriolisand advective terms possessed by the model, although it iswell known that these terms are negligible for tsunamis.Similarly, the tan 8 term arises from the transformation tospherical coordinates; it is numerically insignificant and isincluded only for mathematical exactness.
@h@t
þrS � Huð Þ ¼ 0 ð1Þ
@u
@tþ u � rSuþ f þ u
Rtanf
� �k � u ¼ �grShþ
gHujuj þ Ar2
Su
ð2Þ
where h is the elevation of the sea surface; rS � V = 1R cos8
(@Vc
@c + @@8 (V8 cos 8)) defines the horizontal divergence
operator in spherical coordinates for a vector, V; H = h + his the total depth of water; u is the horizontal velocity field;R is the radius of the Earth; f is the Coriolis parameter;rS C =( 1R cos 8
@C@c,
1R@C@8) defines the gradient operator for a scalar, C;
c is eastward longitude, 8 is northward latitude; k is the unitradial vector; g is the acceleration due to gravity; g is a
coefficient of bottom friction, with a value of 0.0025; andA(H) is a depth-dependent horizontal eddy viscosity. In thisstudy, where unresolved eddy motions are not relevant, therole of the final term in equation (2) is simply to suppressnumerical noise at smaller scales.[13] The energy equation is found by taking the scalar
product of (2) with u. After some manipulation, this givesthe flux form of the energy equation:
@E
@tþrS � FE ¼ rgjuj3 þ r uHð Þ � Ar2
Su ð3Þ
where r is density, E = r(HK + 12gh2) is the total energy per
unit horizontal area; K = 12juj2 is the kinetic energy density;
and FE = ruH(K + gh) is the total energy flux per unitlength normal to the flux. Although we have derived theexpression from the governing equations, the energy fluxterm, FE, is identical to the time-mean form arising fromlinear theory that has been widely used in the study of tidalenergy fluxes [e.g., Davies and Kwong, 2000]. We find thattime integrals of FE have only a very small contributionfrom the kinetic energy component, of the order 1% (inagreement with shallow water theory). The first term on theright-hand side of equation (3) represents dissipation frombottom friction, which we show is small but not insignif-icant in shallow water. The viscosity term (which arisesfrom the parameterization of Reynolds stresses in theequations) was 5 orders of magnitude smaller than the mainterms and is not considered further.[14] Equation (3) states that the rate of change of total
energy per unit horizontal area depends on the divergence ofthe energy flux as well as dissipation from frictionalprocesses. The energy flux itself would reveal the transferof energy from one place to another, but not necessarilywhether the energy changes locally. It is only when this fluxdiverges, for instance, when the flow interacts with topog-raphy, that the total energy changes locally. It is possible toshow that the energy flux divergence can be split into oneterm containing the divergence of advected energy andanother containing the local gradient in bathymetry.[15] We inserted the six different source models shown in
Figure 2 into the finite difference model and denoted theseRuns A1–C2. Each of these is a gridded version of theanalytical solution [Okada, 1985] of the seafloor distur-bance, and they explore the variation of epicenter, faultorientation, and earthquake magnitude. The simulationsincluded tides inherently, but tidal signals were removedfrom the following results. We found the dynamical inter-action between tides and tsunamis to be insignificant. Thestate of the tide is obviously crucial when determining thetotal water level at coastal locations but, for the purposes ofrisk assessment, tide and tsunami can be superimposed.Each scenario was also simulated with the finite elementmodel, but only Run B2 is shown.
3.3. Finite Element Modeling
[16] To simulate the tsunami propagation to the shorelineit was necessary to develop a finer grid model of the UnitedKingdom and Irish coasts. The waves simulated here hadtypical periods of approximately 20 min, and it was bene-ficial to use a variable grid model, allowing the number ofcells per wavelength to remain approximately constant. This
C04007 HORSBURGH ET AL.: LISBON-TYPE TSUNAMI IMPACT ON THE UK
5 of 15
C04007

variable mesh was generated using the TELEMAC-2Dhydrodynamic model [Galland et al., 1991; Hervouet,2000a]. This model has been extensively validated for tides[Malcherek, 2000; Sauvaget et al., 2000; Jones and Davies,2005] and wind-induced response [Jones and Davies, 2006]in shallow shelf seas. Its capacity to simulate runup well isaided by a wetting-drying scheme that performs well at thefinest resolution [Jones and Davies, 2006]. In dam breaktests the inundating flood wave celerity is accurate to 3%[Hervouet, 2000b], and numerical dispersion is minimal,even for highly distorted tidal estuaries [Malcherek, 2000].[17] The model mesh was set up using the spherical
coordinates option and, for consistency, the TELEMAC-2D runs used the same bathymetric data as the wide domainmodel. The inner domain was nested in the region indicated
by the dashed line in Figure 1 and contained 46,000 nodesand 88,000 elements whose mesh size varied from 10 km atthe outer boundary to less than 1 km near to the UnitedKingdom and Irish coasts. Radiation boundary conditionswere imposed on all open boundaries (to allow any outwardlydirected energy to leave the domain); the incident tsunamiwas imposed as a time series of elevations and depth-averaged currents from the outer model at the southern andwestern boundaries. The simulation ran for 12 h after theinitial disturbance, and bed friction was represented as aNikuradse roughness length [e.g., Soulsby, 1998] of 0.01 m.
4. Results
[18] The contours of arrival time and maximum elevationobtained at each cell are shown in Figure 3 for the six runs,
Figure 3. Maximum sea surface elevation during the first 12 h (shaded, m) and arrival time ofmaximum for the first 6 h (contours, 0.5 h contour interval) corresponding to the seafloor perturbationsA1–C2.
C04007 HORSBURGH ET AL.: LISBON-TYPE TSUNAMI IMPACT ON THE UK
6 of 15
C04007
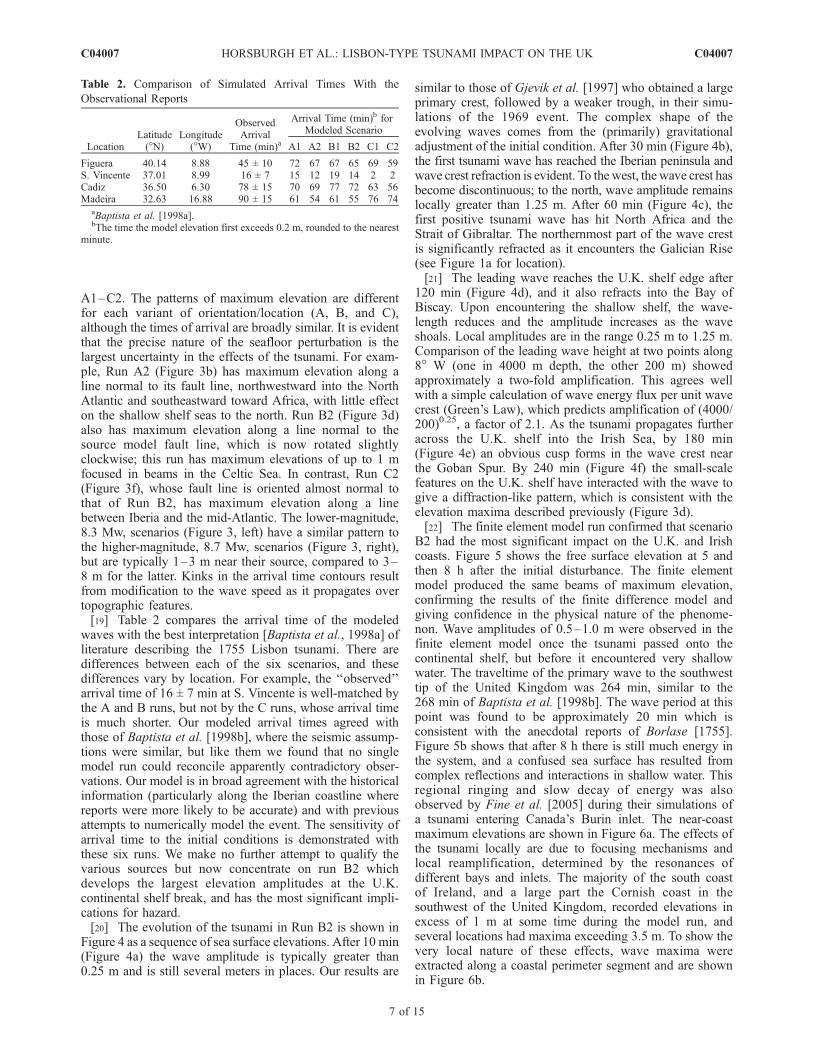
A1–C2. The patterns of maximum elevation are differentfor each variant of orientation/location (A, B, and C),although the times of arrival are broadly similar. It is evidentthat the precise nature of the seafloor perturbation is thelargest uncertainty in the effects of the tsunami. For exam-ple, Run A2 (Figure 3b) has maximum elevation along aline normal to its fault line, northwestward into the NorthAtlantic and southeastward toward Africa, with little effecton the shallow shelf seas to the north. Run B2 (Figure 3d)also has maximum elevation along a line normal to thesource model fault line, which is now rotated slightlyclockwise; this run has maximum elevations of up to 1 mfocused in beams in the Celtic Sea. In contrast, Run C2(Figure 3f), whose fault line is oriented almost normal tothat of Run B2, has maximum elevation along a linebetween Iberia and the mid-Atlantic. The lower-magnitude,8.3 Mw, scenarios (Figure 3, left) have a similar pattern tothe higher-magnitude, 8.7 Mw, scenarios (Figure 3, right),but are typically 1–3 m near their source, compared to 3–8 m for the latter. Kinks in the arrival time contours resultfrom modification to the wave speed as it propagates overtopographic features.[19] Table 2 compares the arrival time of the modeled
waves with the best interpretation [Baptista et al., 1998a] ofliterature describing the 1755 Lisbon tsunami. There aredifferences between each of the six scenarios, and thesedifferences vary by location. For example, the ‘‘observed’’arrival time of 16 ± 7 min at S. Vincente is well-matched bythe A and B runs, but not by the C runs, whose arrival timeis much shorter. Our modeled arrival times agreed withthose of Baptista et al. [1998b], where the seismic assump-tions were similar, but like them we found that no singlemodel run could reconcile apparently contradictory obser-vations. Our model is in broad agreement with the historicalinformation (particularly along the Iberian coastline wherereports were more likely to be accurate) and with previousattempts to numerically model the event. The sensitivity ofarrival time to the initial conditions is demonstrated withthese six runs. We make no further attempt to qualify thevarious sources but now concentrate on run B2 whichdevelops the largest elevation amplitudes at the U.K.continental shelf break, and has the most significant impli-cations for hazard.[20] The evolution of the tsunami in Run B2 is shown in
Figure 4 as a sequence of sea surface elevations. After 10 min(Figure 4a) the wave amplitude is typically greater than0.25 m and is still several meters in places. Our results are
similar to those of Gjevik et al. [1997] who obtained a largeprimary crest, followed by a weaker trough, in their simu-lations of the 1969 event. The complex shape of theevolving waves comes from the (primarily) gravitationaladjustment of the initial condition. After 30 min (Figure 4b),the first tsunami wave has reached the Iberian peninsula andwave crest refraction is evident. To the west, the wave crest hasbecome discontinuous; to the north, wave amplitude remainslocally greater than 1.25 m. After 60 min (Figure 4c), thefirst positive tsunami wave has hit North Africa and theStrait of Gibraltar. The northernmost part of the wave crestis significantly refracted as it encounters the Galician Rise(see Figure 1a for location).[21] The leading wave reaches the U.K. shelf edge after
120 min (Figure 4d), and it also refracts into the Bay ofBiscay. Upon encountering the shallow shelf, the wave-length reduces and the amplitude increases as the waveshoals. Local amplitudes are in the range 0.25 m to 1.25 m.Comparison of the leading wave height at two points along8� W (one in 4000 m depth, the other 200 m) showedapproximately a two-fold amplification. This agrees wellwith a simple calculation of wave energy flux per unit wavecrest (Green’s Law), which predicts amplification of (4000/200)0.25, a factor of 2.1. As the tsunami propagates furtheracross the U.K. shelf into the Irish Sea, by 180 min(Figure 4e) an obvious cusp forms in the wave crest nearthe Goban Spur. By 240 min (Figure 4f) the small-scalefeatures on the U.K. shelf have interacted with the wave togive a diffraction-like pattern, which is consistent with theelevation maxima described previously (Figure 3d).[22] The finite element model run confirmed that scenario
B2 had the most significant impact on the U.K. and Irishcoasts. Figure 5 shows the free surface elevation at 5 andthen 8 h after the initial disturbance. The finite elementmodel produced the same beams of maximum elevation,confirming the results of the finite difference model andgiving confidence in the physical nature of the phenome-non. Wave amplitudes of 0.5–1.0 m were observed in thefinite element model once the tsunami passed onto thecontinental shelf, but before it encountered very shallowwater. The traveltime of the primary wave to the southwesttip of the United Kingdom was 264 min, similar to the268 min of Baptista et al. [1998b]. The wave period at thispoint was found to be approximately 20 min which isconsistent with the anecdotal reports of Borlase [1755].Figure 5b shows that after 8 h there is still much energy inthe system, and a confused sea surface has resulted fromcomplex reflections and interactions in shallow water. Thisregional ringing and slow decay of energy was alsoobserved by Fine et al. [2005] during their simulations ofa tsunami entering Canada’s Burin inlet. The near-coastmaximum elevations are shown in Figure 6a. The effects ofthe tsunami locally are due to focusing mechanisms andlocal reamplification, determined by the resonances ofdifferent bays and inlets. The majority of the south coastof Ireland, and a large part the Cornish coast in thesouthwest of the United Kingdom, recorded elevations inexcess of 1 m at some time during the model run, andseveral locations had maxima exceeding 3.5 m. To show thevery local nature of these effects, wave maxima wereextracted along a coastal perimeter segment and are shownin Figure 6b.
Table 2. Comparison of Simulated Arrival Times With the
Observational Reports
LocationLatitude(�N)
Longitude(�W)
ObservedArrival
Time (min)a
Arrival Time (min)b forModeled Scenario
A1 A2 B1 B2 C1 C2
Figuera 40.14 8.88 45 ± 10 72 67 67 65 69 59S. Vincente 37.01 8.99 16 ± 7 15 12 19 14 2 2Cadiz 36.50 6.30 78 ± 15 70 69 77 72 63 56Madeira 32.63 16.88 90 ± 15 61 54 61 55 76 74
aBaptista et al. [1998a].bThe time the model elevation first exceeds 0.2 m, rounded to the nearest
minute.
C04007 HORSBURGH ET AL.: LISBON-TYPE TSUNAMI IMPACT ON THE UK
7 of 15
C04007

[23] To examine the degree to which the shelf breakfeatures were responsible for the beams of maximumelevation, the shelf edge bathymetry was smoothed in thealong-slope direction, while maintaining its across-slopeprofile to avoid changing any shoaling effects (Figure 7a).As can be seen in Figure 4c, the tsunami also interacts withthe larger-scale (order 200 km) bathymetric feature of theGalician Rise, therefore we also synthesized a bathymetrywith the Galician Rise removed for depths less than 4200 m(Figure 7b). These two sensitivity experiments complementeach other in that different length scales were considered,and the bathymetric adjustments were applied in regions ofcontrasting depth. The run with smoothed shelf edgebathymetry no longer has beams of high maximum eleva-tion (Figure 8a), but instead the maximum elevationdecreases uniformly as the wave passes over the continentalshelf, until reamplification occurs in the very nearshore.
Also note the uniformity of the arrival time contours on theshelf, because the tsunami now approaches as a plane wave.There is a separate beam of maximum elevation originatingfrom the Goban Spur, where constructive interferencebetween the two wavefronts still occurs. Figure 8b showsthe maximum elevations from the computation with theGalician Rise removed. There is now a region of substan-tially increased maximum elevation, typically 0.7 m to 1 m,compared to the results in Figure 3d. This increased waveheight eventually impacts on the U.K. shelf, amplifying thepattern of beams seen in the original run.[24] The maximum elevation is a useful diagnostic for
studying the potential impacts of the tsunami, but does notcontain detailed information about the path or transforma-tion of the wave. The time-mean energy flux, however,shows how the energy spreads from the tsunamigenic regionand is guided through the system. For periodic processes it
Figure 4. Sequence of snapshots of sea surface elevation (m) for Run B2: (a) 10 min; (b) 30 min;(c) 60 min; (d) 120 min; (e) 180 min; (f) 240 min.
C04007 HORSBURGH ET AL.: LISBON-TYPE TSUNAMI IMPACT ON THE UK
8 of 15
C04007

is usual to average equation (3) over at least one waveperiod; in the case of a tsunami propagating over a largedistance the time bounds are not easily defined so we choseto average over 4 h, by which time the primary wave trainhas passed the U.K. shelf break. For Run B2 (Figure 9a)there was an asymmetrical energy flux in directions normalto the fault line and thence northwestward into the NorthAtlantic: a path with deeper bathymetry and fewer sea-mounts. Also, there was intensification of the energy fluxover the Galician Rise and over the continental shelf in theCeltic Sea. This shows how the bathymetry acts as awaveguide, and also the energetic consequences resultingfrom interference due to shelf edge irregularities. As can beseen from equation (3), energy evolution at a point iscontrolled by the convergence of energy flux and dissipa-tion (in shallow water). Figures 9b and 9c show how overthe continental shelf, but away from the near-coast regions,the convergence term dominates the balance, with thefrictional dissipation being an order of magnitude smaller.[25] The time-averaged convergence of energy flux is an
excellent indicator of those regions most important for trans-formations to the tsunami. The convergence (Figure 9b)is negative in the genesis region, where the time-meanpotential energy has been reduced. There is positive con-vergence of energy flux along the axis normal to the faultline, which is consistent with the snapshots in Figure 4,where one can see the wavefront propagate in this direction.Away from the genesis region, there are finer-scale featuresin the energy flux convergence pattern, near Madeira, and
on the U.K. continental shelf. Here, the patterns of positiveand negative flux convergence are aligned in the samedirection as the beams of maximum elevation. The sameinterference pattern is seen in the frictional dissipation(Figure 9c) which is relatively large on the shelf breakcompared to elsewhere. To compare the temporal flux ofenergy at the shelf break with that closer to the shoreline,Figure 9d shows time series of the total energy per unit areaaveraged over the blue box (shelf break) and green box(inshore) marked on Figure 1a. The energy plot for thenearshore (green line) shows a factor of 2 amplification dueto focusing effects, persists for several hours, and exhibitsmultiple peaks due to interference.[26] For the run with a smoothed shelf edge the removal
of topographic irregularities altered the interference patternseen in the standard run, replacing it with a region of moreuniform energy flux as shown in Figure 10a. Most of theenergy flux convergence (Figure 10b) is now concentratedon the shelf edge without the multiple features seen in thestandard run. It is important to note that even when thetopographic irregularities are removed, the areas of maxi-mum wave modification and energy dissipation are stillsome distance offshore. This is in contrast to the Iberianpeninsula where the absence of a broad shelf means thatmodification is confined to a narrow coastal strip. In thisway the wider continental shelf to the north provides ameasure of protection by ensuring that significant energytransformations occur before the tsunami reaches the coast.Figure 10d shows that the energy flux time series across thetwo indicator regions is little altered when the shelf break issmoothed. The small-scale bathymetry may affect the pat-tern of interactions (Figure 10a) but it does not have anysignificant impact on the average shoreward energy transfer.[27] Figure 11 illustrates the energy diagnostics when the
Galician Rise was artificially removed. There is a reductionin flux magnitude where the Galician Rise once was,implying a focusing role for this feature in the standardrun. The path of the energy flux is now more northwardtoward the U.K. shelf where the beams of energy flux(Figure 11a) have higher values than the previous runs(Figures 9a and 10a). This was confirmed by the energytime series (Figure 11d) where the peak energy arriving inthe Bristol Channel increased by 20%, although paradoxi-cally the flux of energy across the shelf break box wasreduced. The Galician Rise therefore appears to protect theU.K. coastline from this scenario of tsunami impact in acomplex way, through changing the flux convergencepattern in such a way that wave energy is more focusedover that part of the shelf capable of reflecting and dissi-pating energy more efficiently.
5. Discussion
[28] We have examined six initial condition scenarios oftsunamis emanating from the Azores-Gibraltar Fault Zoneand moving toward the northwest European continentalshelf. The scenarios were guided by our best knowledgeof the Lisbon tsunami of 1 November 1755, but the primeintention of this study was to explore the consequences andimpacts in this region of such an event. As has been foundpreviously [e.g., Baptista et al., 1998b; Mader, 2001],modeling historical tsunami events is difficult as there is
Figure 5. Surface elevation (m) in the inner finite elementmodel, (a) 5 h and (b) 8 h after the disturbance for Run B2.
C04007 HORSBURGH ET AL.: LISBON-TYPE TSUNAMI IMPACT ON THE UK
9 of 15
C04007

usually a lack of trustworthy observations against which toverify. Our simulations illustrated several important aspectsof interaction between a Lisbon-type tsunami and thetopography of the northern European seaboard. We foundthat the impact of a 1755 type tsunami on northwestEuropean shelf seas would be very sensitive to the location,orientation and magnitude of the initial seafloor deforma-tion, with only one of our source models (B2) having anynotable consequences. It is well known [e.g., Titov et al.,2001] that the faulting location and the magnitude andextent of the seafloor displacement are the most importantsource parameters for determining the scale of far fieldeffects. The subsequent wave evolution in our simulationswas also sensitive to bathymetry, as has been shownpreviously by ray tracing studies [e.g., Satake, 1988] andby numerical modeling [e.g., Titov et al., 2005]. In theirglobal simulation of the 26 December 2004 Sumatra tsuna-mi, Titov et al. [2005] found that wave directionality for thatevent was primarily controlled by source characteristics inthe near field, and by topographic steering in the far field(where considerable amplification along ocean ridges wasevident). Our results suggest that, for some events at least,there are scales at which these two primary controlling factorsinteract. The snapshots of surface elevation (Figure 4e)
show that the primary wave refracts around the GobanSpur, after which the two wavefronts interact with smallertopographic features producing beams of intensified eleva-tion and wave energy flux on the U.K. shelf. These beamswere present in both the finite difference and the higher-resolution finite element models.[29] The maximum elevations obtained were approxi-
mately 3.5 m along the Cornish coast, but in the majorityof places, maximum elevation was less than 1 m. Theseelevations are comparable to winter storm surge conditions,but unlike surge conditions there is extreme variability inthe tsunami wave height from one location to another.Extreme sea levels resulting from this simulation (whichrepresents the likely worst case for the United Kingdom),combined with both mean high-water spring (MHWS) andmean high-water neap (MHWN) tides, were calculated andcompared with the 1:100 return level produced by Dixonand Tawn [1997]. The maximum elevations exceeded the1:100 year extreme sea level only at three locations on theCornish peninsula, and then only during MHWS tides.Elsewhere (and everywhere under MHWN conditions) thetsunami produced elevations similar to, or lower than, thepredicted 1:100 year extreme sea level. The typical recur-rence period for Lisbon style intraplate earthquakes is in the
Figure 6. Maximum elevation (m) in the inner finite element model, (a) the region around Cornwall,SW England and (b) along the Cornish coast, with numbered points as shown in Figure 6a indicatingdistance along coast (upper abscissa label) and model node number (lower abscissa label).
C04007 HORSBURGH ET AL.: LISBON-TYPE TSUNAMI IMPACT ON THE UK
10 of 15
C04007

range 1,000–10,000 years [Gracia et al., 2003; Scholz etal., 1986]. The modeling supports the conclusion ofKerridge et al. [2005] that there is very low risk to theUnited Kingdom and northern Europe. Tsunami impactupon the Bristol Channel (a region of extremely high tides)was reduced since bathymetry-driven refraction directs anytsunami toward the north coast of Cornwall.[30] In an experiment that smoothed the topographic
irregularities at the shelf edge (Figure 8a) the multiplebeams of high elevation disappeared, although a singlebeam still emanated from the Goban Spur. It seems reason-able to conclude that the former arose as a result ofconvergence and divergence over the many canyons knownto exist in the shelf edge at this location. The amplificationthat remains with the smoothed bathymetry is probably dueto interaction of the primary wave and a refracted wave atthe sharp corner of the Goban Spur. In an independentexperiment (Figure 8b), the topography of the Galician Riseabove 4200 m was removed, allowing a more direct routefor wave energy toward the European continental shelf. Thiscaused an increase in the amplitude of the beams yet,paradoxically, reduced the energy flux over that part ofthe shelf facing the primary wave (Figure 11d). A possibleexplanation is that in the absence of the Galician Rise,
waves take a more direct route toward the Goban Spurwhere refraction redirects energy into the Celtic Sea. In anycase, through complex interactions, the Galician Riseappears to shield the U.K. coastline from any tsunami onthis trajectory. Gjevik et al. [1997] noted a similar effect dueto the Gorringe Bank in their model of the 28 February 1969tsunami, with a source south of the Horseshoe AbyssalPlain.[31] For this particular event it appears that the wide
European continental shelf provides a degree of protectionto the coastline by reflecting and dissipating tsunami energy.The fact that frictional dissipation is an order of magnitudeless than energy flux convergence at the shelf break(Figures 9–11c) implies that reflection and scattering aremore important than frictional dissipation here. In contrast,on the Iberian peninsula (which has only a narrow shelf),energy transformations do not occur until waves are very
Figure 7. Modified bathymetry (m) for sensitivity experi-ments. (a) Smoothed version of the U.K. shelf edge,designed to have a constant along-slope profile with similaracross-slope gradient to the real slope; (b) normalbathymetry but with the Galician Rise removed, withdepths less than 4200 m being set to 4200 m in that vicinity.Key locations are annotated as for Figure 1.
Figure 8. Maximum sea surface elevation during the first12 h (shaded, m) and arrival time of maximum for the first6 h (contours, 0.5 h contour interval) for sensitivityexperiments based on scenario B2. (a) With smoothedU.K. shelf edge bathymetry; (b) normal bathymetry but withGalician Rise removed.
C04007 HORSBURGH ET AL.: LISBON-TYPE TSUNAMI IMPACT ON THE UK
11 of 15
C04007

close to the coastline, producing more severe impacts; alongthe Iberian and African coastlines the frictional dissipationterm is far higher than elsewhere and is confined to a narrowcoastal strip. The shallow water on broad shelves alsoreduces the tsunami phase speed, on the one hand givingmore lead time for tsunami warning, but also potentiallyallowing the wavelength to match critical topographic scalesand give rise to amplifying interactions. Our results showsignificant local reamplification due to shoaling and reso-nance. There is still much energy in the Celtic Sea after 8 h,as seen in Figure 5b, and this slow decay of energy isconsistent with other studies: Fine et al. [2005] stated thatlocal differences in Q-factor and wave period are topo-graphically induced, and Titov et al. [2005] also notedprolonged ringing after multiple topographic interactions.Our results (Figure 6) illustrate a high degree of variabilityin maximumwave amplitude around that part of the coastlinemost affected by the waves. Calculations of the Q-factor,based on time series for locations 5 and 7 in Figure 6a,and using the methodology of Kulikov et al. [1996], gavevalues of 13. This is indicative of a strong resonant responseon the shelf, and although we see high variability in waveamplitude, the decay characteristics are more spatiallyuniform, suggesting that the ringing is set up over the widershelf rather than in specific localities. Our energy time seriesare consistent with this, showing the area-mean energy
density in the selected nearshore region (the green line inFigures 9–11d) to decay fairly slowly. This pattern of decaywas insensitive to the bathymetric experiments we per-formed and instead reflects the resonant behavior of thedesignated area. Our results illustrate how, in subtle ways,bathymetric features have the potential to both increase anddecrease the hazard resulting from tsunamis.[32] NLSW models are generally considered to be a
suitable choice for propagating tsunamis of seismic origin,where the sea surface deformation responds almost instan-taneously to seafloor movement and frequency dispersioncan be ignored in the generation region. They are notsuitable for shorter-wavelength tsunamis (e.g., those gener-ated by submarine landslides), where dispersive effects arerequired and Boussinesq equation models are more accurate[Lynett and Liu, 2002]. Frequency dispersion can also beimportant when tsunamis propagate over long distances.The 26 December 2004 Sumatra tsunami generated a wealthof observational evidence and prompted a reevaluation ofmodeling techniques. Wavelet analysis on altimetry data[Kulikov, 2006] showed that the high-frequency compo-nents of the tsunami, with approximately 10 km wave-length, were distinctly dispersive. This suggests thatfrequency dispersion may be a necessary ingredient ofnumerical models used for the transoceanic propagation oftsunamis [Grilli et al., 2006]. Highly nonlinear Boussinesq-
Figure 9. Energy diagnostics for the B2 run. (a) Time-mean of magnitude (shaded, 103 Wm�1) anddirection (unit vectors) of the depth-integrated energy flux, FE; (b) time-mean of convergence of thedepth-integrated energy flux, �rS � FE (shaded, 10�5 Wm�2); (c) time-mean of depth-integratedfrictional dissipation of energy through bottom drag, �rgjuj3 (shaded, 10�5 Wm�2); (d) time series ofthe area-mean of total energy per unit horizontal area, E (103 Jm�2), for the regions shown by blue andgreen rectangles in Figure 1a.
C04007 HORSBURGH ET AL.: LISBON-TYPE TSUNAMI IMPACT ON THE UK
12 of 15
C04007

Figure 11. Time-mean energy diagnostics for the B2 run, with normal bathymetry but with GalicianRise removed, as shown in Figure 7b. Caption as for Figure 9.
Figure 10. Energy diagnostics for the B2 run, with smoothed U.K. shelf edge bathymetry as shown inFigure 7a. Caption as for Figure 9.
C04007 HORSBURGH ET AL.: LISBON-TYPE TSUNAMI IMPACT ON THE UK
13 of 15
C04007

type models [e.g., Wei et al., 1995] are now capable ofsimulating frequency dispersion faithfully in intermediatedepths. With a suitable treatment of the moving shorelineboundary [e.g., Lynett et al., 2002] these models produceaccurate wave runup when compared to analytical andexperimental solutions. Ioualalen et al. [2007] have recentlyused the FUNWAVE model [Chen et al., 2000] to simulaterunup in Thailand following the 26 December 2004 tsunamiand achieved excellent agreement with 58 sets of observa-tions. The advantage of this approach is that a single modelwith the most appropriate physics can be used to simulatetsunami behavior from source to beach.[33] This study reinforces the scale of the inherent uncer-
tainties when attempting to model tsunami risk in regionswhere the consequences of tsunamigenic earthquakes aremore likely to be felt. Although the physics of theseuncertainties are well known, they must be correctlyaccounted for in a sufficiently large ensemble if maximumbenefit is to be gained from tsunami modeling. Indeed, inour study, because of the subsequent interaction withbathymetry it may be that only very small changes in thesource model fault orientations could have yielded signifi-cantly different results. The choice of (time integrated)energy flux divergence as a diagnostic variable is seen tobe useful when identifying regions of significant wavetransformation. The divergence of energy flux can revealregions of transformation that are not apparent when look-ing at energy flux itself. This could be useful, for instance,when comparing various model runs in risk assessmentstudies.
[34] Acknowledgments. This work was funded by the U.K. Depart-ment of Environment Food and Rural Affairs (Defra) and by the EU 6thFramework TRANSFER project. We thank two anonymous referees forsome very helpful comments.
ReferencesAbe, K. (1979), Size of great earthquakes of 1837–1974 inferred fromtsunami data, J. Geophys. Res., 84, 1561–1568.
Baptista, M. A., S. Heitor, J. M. Miranda, P. M. A. Miranda, and L. MendesVictor (1998a), The 1755 Lisbon tsunami: Evaluation of the tsunamiparameters, J. Geodyn., 25, 143–157.
Baptista, M. A., P. M. A. Miranda, J. M. Miranda, and L. Mendes Victor(1998b), Constrains on the source of the 1755 Lisbon tsunami inferredfrom numerical modelling of historical data on the source of the 1755Lisbon tsunami, J. Geodyn., 25, 159–174.
Bondevik, S., J. I. Svendsen, G. Johnsen, J. Mangerud, and P. E. Kaland(1997), The Storegga tsunami along the Norwegian coast, its age and run-up, Boreas, 26, 29–53.
Borlase, W. (1755), Letter to the Rev. Charles Lytteton, Phil. Trans. R. Soc.London, 49, 373–378.
Chen, Q., J. T. Kirby, R. A. Dalrymple, A. B. Kennedy, and A. Chawla(2000), Boussinesq modeling of wave transformation, breaking, and run-up. II: 2D, J. Waterway Port Coast. Ocean Eng., 126(1), 48–56.
Choi, B. H., E. Pelinovsky, S. J. Hong, and S. B. Woo (2003), Computationof tsunamis in the East (Japan) Sea using dynamically interfaced nestedmodel, Pure Appl. Geophys., 160, 1383–1414.
Davies, A. M., and S. C. M. Kwong (2000), Tidal energy fluxes anddissipation on the European continental shelf, J. Geophys. Res.,105(C3), 21,969–21,989.
Dawson, A. G., R. M. W. Musson, I. D. L. Foster, and D. Brunsden (2000),Abnormal historic sea-surface fluctuations, SW England, Mar. Geol.,170, 59–68.
Dixon, M. J., and J. A. Tawn (1997), Spatial analyses for the UK coast,Internal Doc., 112, 217 pp., Proudman Oceanogr. Lab., Liverpool, UK.
Fine, I. V., A. B. Rabinovich, B. D. Bornhold, and R. E. Thomson (2005),The Grand Banks landslide-generated tsunami of November 18, 1929:Preliminary analysis and numerical modeling, Mar. Geol., 215, 45–57.
Flather, R. A. (1976), A tidal model of the north-west European continentalshelf, Mem. Soc. R. Sci. Liege, 6, 141–164.
Flather, R. A. (2000), Existing operational oceanography, Coastal Eng., 41,13–40.
Fukao, Y. (1973), Thrust faulting at a lithospheric plate boundary: ThePortugal earthquake of 1969, Earth Planet. Sci. Lett., 18, 205–216.
Galland, J. C., N. Goutal, and J. M. Hervouet (1991), TELEMAC: A newnumerical model for solving shallow-water equations, Adv. Water Re-sour., 14, 138–148.
Gjevik, B., G. Pederson, E. Dybesland, C. B. Harbitz, P. M. A. Miranda,M. A. Baptista, L. Mendes-Victor, P. Heinrich, R. Roche, and M. Guesmia(1997), Modeling tsunamis from earthquake sources near GorringeBank southwest of Portugal, J. Geophys. Res., 102(C13), 27,931–27,949.
Gracia, E., J. Danobeita, J. Verges, and the PARSIFAL team (2003), Map-ping active faults offshore Portugal (36�N–38�N): implications for seis-mic hazard assessment along the southwest Iberia margin, Geology, 31,83–86.
Grilli, S. T., A. M. Baptista, M. Ioualalen, J. Asavanant, J. T. Kirby, F. Shi,and Y. L. Zhang (2006), Effects of frequency dispersion on tsunamipropagation and coastal impact, Geophys. Res. Abstr., 8, 09021.
Gutscher, M. A. (2004), What caused the Great Lisbon earthquake?,Science, 305, 1247–1248.
Henni, P. H. O., C. J. Fyfe, and P. C. Marrow (1998), The BGS WorldSeismicity Database, Brit. Geol. Surv. Tech. Rep. WL/98/13, internaldocument, 12 pp., Brit. Geol. Surv., Edinburgh.
Hervouet, J.-M. (2000a), TELEMAC modelling system: An overview,Hydrol. Proc., 14, 2209–2210.
Hervouet, J. M. (2000b), A high resolution 2-D dam-break model usingparallelization, Hydrol. Proc., 14, 2211–2230.
Ioualalen, M., J. A. Asavanant, N. Kaewbanjak, S. T. Grilli, J. T. Kirby, andP. Watts (2007), Modeling of the 26th December 2004 Indian Oceantsunami: Case study of impact in Thailand, J. Geophys. Res., 112,C07024, doi:10.1029/2006JC003850.
Johnston, A. C. (1996), Seismic moment assessment of earthquakes instable continental regions: III. New Madrid 1811–1812, Charleston1886 and Lisbon 1755, Geophys. J. Int., 126, 314–344.
Jones, J. E., and A. M. Davies (2005), An intercomparison between finitedifference and finite element (TELEMAC) approaches to modelling westcoast of Britain tides, Ocean Dyn., 55, 178–198.
Jones, J. E., and A. M. Davies (2006), Application of a finite element model(TELEMAC) to computing the wind induced response of the Irish Sea,Cont. Shelf Res., 26, 1519–1541.
Kanamori, H. (2006), Lessons from the 2004 Sumatra-Andaman earth-quake, Phil. Trans. R. Soc. A, 364, 1927–1945.
Kerridge, D., et al. (2005), The threat posed by tsunami to the UK, studycommissioned by Defra Flood Management Division, 165 pp., Dept. forEnviron. Food and Rural Affairs, London.
Kowalik, Z. (2001), Basic relations between tsunami calculation and theirphysics, Sci. Tsunami Hazards, 5(2), 77–84.
Kulikov, E. A. (2006), Dispersion of the Sumatra tsunami waves in theIndian Ocean detected by satellite altimetry, Russ. J. Earth Sci., 8,ES4004, doi:10.2205/2006ES000214.
Kulikov, E. A., A. B. Rabinovich, R. E. Thomson, and B. D. Bornhold(1996), The landslide tsunami of November 3 1994, Skagaway Harbor,Alaska, J. Geophys. Res., 101(C3), 6609–6615.
Lynett, P. J., and P.L.-F. Liu (2002), A numerical study of submarine-landslide-generated waves and runup, Proc. R. Soc. London, Ser. A.,458, 2885–2910.
Lynett, P. J., T. R. Wu, and P. L.-F. Liu (2002), Modelling wave runup withdepth-integrated equations, Coastal Eng., 46(2), 89–107.
Machado, F. (1966), Contribuicao para o estudo do terramoto de 1 deNovembro de 1755, Rev. Faculdade Cienc. Lisboa, 14, 19–31.
Mader, C. L. (2001), Modeling the 1755 Lisbon tsunami, Sci. TsunamiHazards, 19, 93–98.
Malcherek, A. (2000), Application of TELEMAC-2D in a narrow estuarinetributary, Hydrol. Proc., 14, 2293–2300.
Mendes, V. L., M. A. Baptista, J. M. Miranda, and P. M. A. Miranda (1999),Can hydrodynamic modelling of tsunami contribute to seismic riskassessment?, Phys. Chem. Earth A, 24, 139–144.
Moreira, V. S. (1989), Seismicity of the Portuguese continental margin, inEarthquakes at North Atlantic Passive Margins Neotectonic and Postgla-cial Rebound, edited by S. Gregersen and P. W. Basham, Kluwer, Mass.
Okada, Y. (1985), Surface deformation due to shear and tensile faults in ahalf-space, Bull. Seismol. Soc. Am., 75, 1135–1154.
Pires, C., and P. M. A. Miranda (2001), Tsunami waveform inversion byadjoint methods, J. Geophys. Res., 106(C9), 19,773–19,796.
Reid, H. F. (1914), The Lisbon earthquake of November 1 1755, Bull.Seismol. Soc. Am., 4, 53–80.
Rise, L., D. Ottesen, K. Berg, and E. Lundin (2005), Large-scale develop-ment of the mid-Norwegian margin during the last 3 million years, Mar.Pet. Geol., 22, 33–44.
C04007 HORSBURGH ET AL.: LISBON-TYPE TSUNAMI IMPACT ON THE UK
14 of 15
C04007

Satake, K. (1988), Effects of bathymetry on tsunami propagation: Applica-tion of ray tracing to tsunamis, Pure Appl. Geophys., 126, 27–36.
Sauvaget, P., E. David, and C. G. Soares (2000), Modelling tidal currentson the coast of Portugal, Coastal Eng., 40(4), 393–409.
Scholz, C. H. (2002), The Mechanics of Earthquake Faulting, 2nd ed., 496pp., Cambridge Univ. Press, Cambridge, UK.
Scholz, C. H., C. A. Aviles, and S. G. Wesnousky (1986), Scaling differ-ences between large interplate and intraplate earthquakes, Bull. Seismol.Soc. Am., 76, 65–70.
Shuto, N. (1991), Numerical simulation of tsunamis: Its present and nearfuture, Natural Hazards, 4, 171–191.
Smith, D. E., et al. (2004), The Holocene Storegga slide in the UnitedKingdom, Quat. Sci. Rev., 23, 2291–2321.
Soulsby, R. (1998), Dynamics of Marine Sands, 272 pp., Thomas Telford,London.
Stich, D., F. L. de Mancilla, and J. Morales (2005), Crust-mantle couplingin the Gulf of Cadiz (SW-Iberia), Geophys. Res. Lett., 32, L13306,doi:10.1029/2005GL023098.
Titov, V. V., and F. I. Gonzalez (1997), Implementation and testing of theMethod of Splitting Tsunami (MOST) model, NOAA Tech. Mem., ERLPMEL-112, 11 pp., NOAA Pac. Mar. Environ. Lab., Seattle, Wash.
Titov, V. V., H. O. Mofjeld, F. I. Gonzalez, and J. C. Newman (2001),Offshore forecasting of Alaskan tsunamis in Hawaii, in Tsunami
Research at the End of a Critical Decade, edited by G. T. Hebenstreit,pp. 75–90, Kluwer Acad., Amsterdam.
Titov, V. V., A. B. Rabinovich, H. O. Mofjeld, R. E. Thomson, and F. I.Gonzalez (2005), The global reach of the 26 December 2004 Sumatratsunami, Science, 309, 2045–2048.
Vilanova, S. P., C. F. Nunes, and F. B. D. J.Fonseca (2003), Lisbon 1755A case of triggered onshore rupture?, Bull. Seismol. Soc. Am., 93, 2056–2068.
Wei, G., J. T. Kirby, S. T. Grilli, and R. Subramanya (1995), A fully non-linear Boussinesq model for surface waves: I. Highly nonlinear, unsteadywaves, J. Fluid Mech., 294, 71–92.
Zitellini, N., F. Chierici, R. Sartori, and L. Torelli (1999), The tectonicsource of the 1755 earthquake and tsunami, Ann. Geofis., 42, 49–55.
Zitellini, N., et al. (2001), Source of the 1755 Lisbon earthquake andtsunami investigated, EOS Trans. AGU, 82, 290–291.
�����������������������B. J. Baptie, R. M. W. Musson, L. Ottemoller, and S. L. Sargeant, British
Geological Survey, Edinburgh EH9 3LA, UK.A. Cooper, D. Cresswell, and S. Richardson, HR Wallingford, Wall-
ingford OX10 8BA, UK.K. J. Horsburgh and C. Wilson, Proudman Oceanographic Laboratory,
Liverpool L3 5DA, UK.
C04007 HORSBURGH ET AL.: LISBON-TYPE TSUNAMI IMPACT ON THE UK
15 of 15
C04007