Embed Size (px)
Citation preview
Impact factor: 0.3397/ICV: 4.10 153
Chetan et al. / Pharma Science Monitor 5(2), Sup-1, Apr-Jun 2014, 153-179
Pharma Science Monitor 5(2), Sup-1, Apr-Jun 2014
FORMULATION, EVALUATION AND OPTIMIZATION OF PRESS COATED
PULSATILE TABLET OF ZALTOPROFEN FOR THE TREATMENT OF
RHEUMATOID ARTHRITIS
Chetan G Kukadiya*, Kesha Desai, S. M. Vijayendra Swamy
Bhagwan Mahavir College of Pharmacy, Nr. Ashirwad Villa, New City Light Road, B/H Heena Bunglow’s, Vesu, Bharthana, Surat-395017
ABSTRACT The aim of the present study was to formulate, evaluate and optimize press coated pulsatile tablet of Zaltoprofen for the treatment of rheumatoid arthritis. The drug delivery system is based on the concept of chronotherapeutics. Dosage form provide delayed release up to 5 hour and after completion of lag time up to 5 hour dosage form provides burst release of drug therefore highest blood level of the drug coincide with peak pain and stiffness. Formulation comprising a core containing active ingredient, surrounded by the coating layer containing enteric pH dependent polymer eudragit L 100 and Ethyl cellulose. Core tablet was prepared by direct compression using crospovidone as a superdisintegrant and microcrystalline cellulose as a diluent. Core tablet was compression coated with barrier layer containing eudragit L 100 and ethyl cellulose using direct compression method. A 32 full factorial design was used to optimize barrier layer. The optimized check point formulation A1 was selected from overlay plot using Design expert 9.0. The press coated tablet with weight ratio of ethyl cellulose: eudragit L 100 76.48: 23.52 (%) with coating weight 356 mg is most satisfactory to provide desired pulsatile delivery of Zaltoprofen for effective treatment of rheumatoid arthritis. KEYWORDS: Zaltoprofen, Rheumatoid arthritis, Chronotherapy, Pulsatile release, Press coated tablet, Crospovidone, Eudragit L 100, Ethyl cellulose, Lag time. INTRODUCTION
For the treatment of various diseases oral route is the most preferred route and conventional
dosage forms are widely used for treatment. In conventional therapy drug is released
immediately after medication. So, the drug concentration in the plasma is raised and sometimes it
is more than the toxic level. The target of drug discovery is to obtain maximum drug efficacy and
minimum side effect. Although sustained and constant release systems have been developed
biological systems are not so responsive to these release systems. Several controlled release
preparation present numerous problems such as resistance and drug tolerance, and activation of
the physiological system due to long term constant drug concentrations in the blood and tissues.
The diseases currently targeted for chronopharmaceutical formulations are those for which have
PHARMA SCIENCE MONITOR
AN INTERNATIONAL JOURNAL OF PHARMACEUTICAL SCIENCES
Journal home page: http://www.pharmasm.com
Impact factor: 0.3397/ICV: 4.10 154
Chetan et al. / Pharma Science Monitor 5(2), Sup-1, Apr-Jun 2014, 153-179
enough scientific backgrounds to justify their Chronopharmaceutical drug delivery compared to
the conventional drug administration approach. These include asthma, arthritis, duodenal ulcer,
cancer, diabetes, cardiovascular diseases, hypercholesterolemia, ulcer and neurological diseases.
The efficacy and side effect of many drugs vary depending on dosing time associated with
circadian rhythms of biochemical, physiological, and behavioral processes under the control of
circadian clock. It has been found out that circadian rhythm is useful for the treatment of various
pathophysiological conditions of human body. Rheumatoid arthritis (RA) is a chronic disease
that causes pain, stiffness, swelling and limited motion and function of many joints. The stiffness
seen in active RA is most often worst in the morning. These Symptoms closely follows the
circadian rhythms and mainly result of imbalance between anti-inflammatory effects of cortisol
and pro-inflammatory effect of melatonin (MLT) in RA during night and early morning.
Moreover, typical circadian rhythm of melatonin exhibits a maximum at 3.00 AM. The pulsatile
drug delivery system (PDDS) is intended to deliver a rapid, or transient, and quantified
medication release after a predetermined off-release period (lag time) . PDDS can deliver the
correct amount of medication at the desired location at the optimal time for maximum effect
against disease, thereby enhancing therapeutic efficacy and improving patient compliance.
Zaltoprofen is a novel NSAIDS with powerful anti inflammatory and analgesic effects on
inflammatory pain. Zaltoprofen is a drug with high efficacy contributing to the improvement of
daily activities in patient of chronic rheumatoid arthritis. Press coating is a novel, simple and less
time consuming technique of coating thereby Press coating technique is suitable to formulate
pulsatile release tablet. This system can be administered at night (before sleep) and gives drug
release in early morning that would be a promising chronopharmaceutic system1-8
MATERIALS AND METHODS
Materials: Materials used in the present investigation were obtained from the following sources:
Zaltoprofen was obtained from ZCL chemical, Mumbai. Crospovidone, Microcrystalline
cellulose, Eudragit L 100, Etheyl cellulose, Talc, Magnesium stearate were obtained from the
chemdyes corporation, Ahmedabad.
Methods:
1. Preformulation study
1.1) Organoleptic evaluation9
The color, odor, and taste of the drug were characterized and recorded using descriptive
terminology.
Impact factor: 0.3397/ICV: 4.10 155
Chetan et al. / Pharma Science Monitor 5(2), Sup-1, Apr-Jun 2014, 153-179
1.2) Drug excipients compatibility study
The drug excipients interaction studies were carried out using Fourier Transform Infrared
Spectrophotometer (FTIR).
1.3) Solubility study of Zaltoprofen10
Solubility of Zaltoprofen in phosphate buffer pH 7.4, pH 6.8 and in 0.1N HCL pH 1.2 was
determined by equilibrium solubility method. Sufficient excess amount of Zaltoprofen was added
to 5 ml stoppered glass vials containing pH 7.4, pH 6.8 and pH 1.2 buffer solutions separately.
The vials were shaken reciprocally for 72 h on mechanical shaker to reach equilibrium at R.T.
The solutions were transferred into tubes and centrifuged for 30 min at 2500 rpm. Solutions were
filtered using whatmann filter paper and the filtrate was analyzed for drug content by UV visible
spectrophotometer at 340nm and 338 nm after appropriate dilutions. The study was performed in
triplicate.
2. Preparation of press coated pulsatile tablet of zaltoprofen11
Two steps are involved in preparation of press coated pulsatile tablet of zaltoprofen:
2.1) Preparation of core tablet of zaltoprofen
The core tablets of Zaltoprofen were prepared by direct compression method. As shown in
below table. Core tablets of Zaltoprofen were prepared by using fixed concentration of
superdisintegrant crospovidone and diluent i.e. microcrystalline cellulose. Calculated quantities
of Zaltoprofen, super disintegrants, and diluents were accurately weighed and blended in a
mortar. All ingredients were passed through sieve no. 60 # and throughly mixed. Then the talc
and magnesium stearate were added to the mixture. The mixture was compressed into tablet on a
rotary tablet punching machine using 8 mm punch.
Table 1: Composition of core tablet
Ingredients Zaltoprofen Crospovidone Microcrystalline
cellulose
Magnesium
stearate
Talc
Quantity
(mg)
80 5 70 2 1
2.2) Preparation of Zaltoprofen press-coated tablet
The press-coated tablets of Zaltoprofen were prepared by direct compression method.
Calculated quantities of ethyl cellulose and eudragit L 100 were accurately weighed and blended
in a mortar. All ingredients were passed through sieve no. 60 # and thoroughly mixed. Then this
coating material was used as barrier layer to prepare press-coated tablet. Half the quantity of the
Impact factor: 0.3397/ICV: 4.10 156
Chetan et al. / Pharma Science Monitor 5(2), Sup-1, Apr-Jun 2014, 153-179
coating material was placed in the die cavity; the core tablet was carefully positioned in the
center of the die cavity and was filled with other half of the coating material. The coating
material was compressed using 12 mm punch on a rotary tablet compression machine.
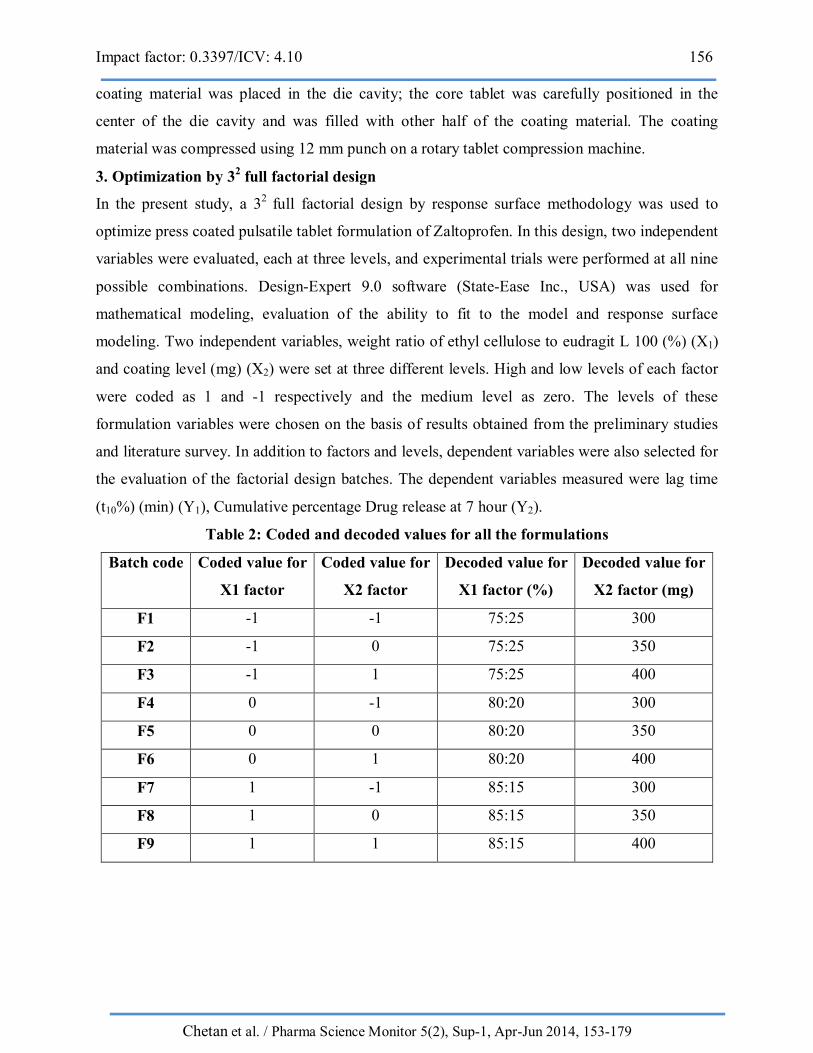
3. Optimization by 32 full factorial design
In the present study, a 32 full factorial design by response surface methodology was used to
optimize press coated pulsatile tablet formulation of Zaltoprofen. In this design, two independent
variables were evaluated, each at three levels, and experimental trials were performed at all nine
possible combinations. Design-Expert 9.0 software (State-Ease Inc., USA) was used for
mathematical modeling, evaluation of the ability to fit to the model and response surface
modeling. Two independent variables, weight ratio of ethyl cellulose to eudragit L 100 (%) (X1)
and coating level (mg) (X2) were set at three different levels. High and low levels of each factor
were coded as 1 and -1 respectively and the medium level as zero. The levels of these
formulation variables were chosen on the basis of results obtained from the preliminary studies
and literature survey. In addition to factors and levels, dependent variables were also selected for
the evaluation of the factorial design batches. The dependent variables measured were lag time
(t10%) (min) (Y1), Cumulative percentage Drug release at 7 hour (Y2).
Table 2: Coded and decoded values for all the formulations
Batch code Coded value for
X1 factor
Coded value for
X2 factor
Decoded value for
X1 factor (%)
Decoded value for
X2 factor (mg)
F1 -1 -1 75:25 300
F2 -1 0 75:25 350
F3 -1 1 75:25 400
F4 0 -1 80:20 300
F5 0 0 80:20 350
F6 0 1 80:20 400
F7 1 -1 85:15 300
F8 1 0 85:15 350
F9 1 1 85:15 400
Impact factor: 0.3397/ICV: 4.10 157
Chetan et al. / Pharma Science Monitor 5(2), Sup-1, Apr-Jun 2014, 153-179
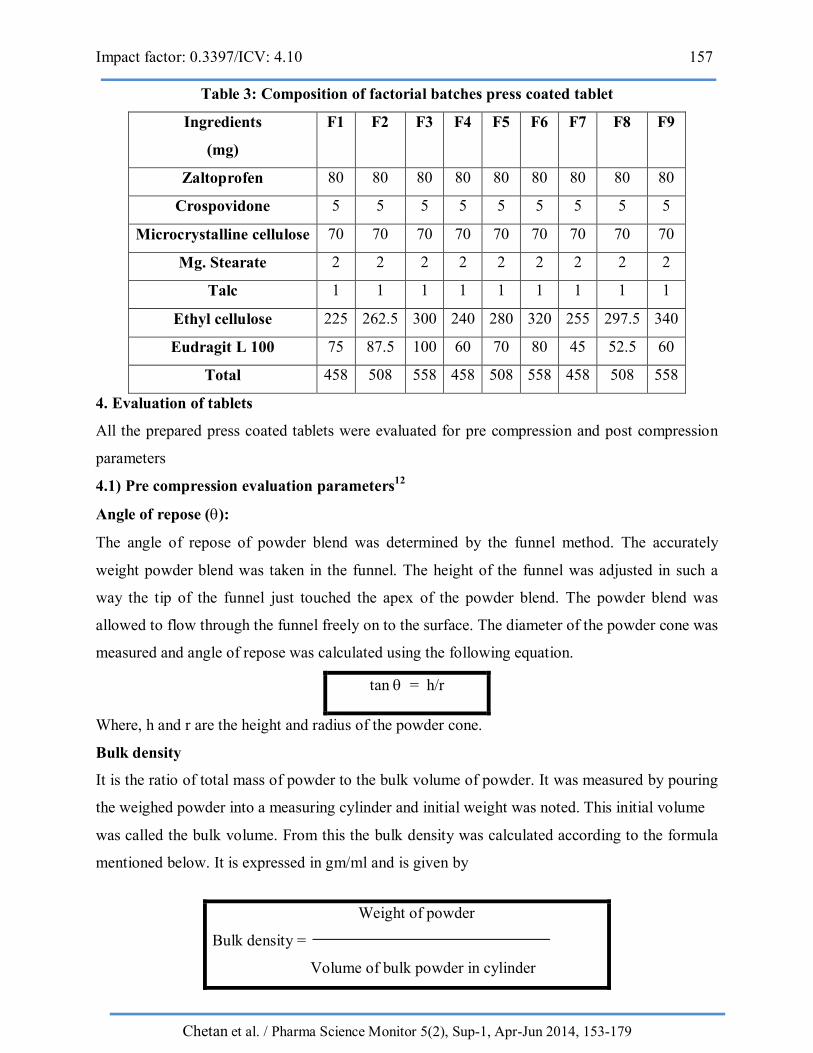
Table 3: Composition of factorial batches press coated tablet
Ingredients
(mg)
F1 F2 F3 F4 F5 F6 F7 F8 F9
Zaltoprofen 80 80 80 80 80 80 80 80 80
Crospovidone 5 5 5 5 5 5 5 5 5
Microcrystalline cellulose 70 70 70 70 70 70 70 70 70
Mg. Stearate 2 2 2 2 2 2 2 2 2
Talc 1 1 1 1 1 1 1 1 1
Ethyl cellulose 225 262.5 300 240 280 320 255 297.5 340
Eudragit L 100 75 87.5 100 60 70 80 45 52.5 60
Total 458 508 558 458 508 558 458 508 558
4. Evaluation of tablets
All the prepared press coated tablets were evaluated for pre compression and post compression
parameters
4.1) Pre compression evaluation parameters12
Angle of repose ():
The angle of repose of powder blend was determined by the funnel method. The accurately
weight powder blend was taken in the funnel. The height of the funnel was adjusted in such a
way the tip of the funnel just touched the apex of the powder blend. The powder blend was
allowed to flow through the funnel freely on to the surface. The diameter of the powder cone was
measured and angle of repose was calculated using the following equation.
tan = h/r
Where, h and r are the height and radius of the powder cone.
Bulk density
It is the ratio of total mass of powder to the bulk volume of powder. It was measured by pouring
the weighed powder into a measuring cylinder and initial weight was noted. This initial volume
was called the bulk volume. From this the bulk density was calculated according to the formula
mentioned below. It is expressed in gm/ml and is given by
Weight of powder
Bulk density =
Volume of bulk powder in cylinder
Impact factor: 0.3397/ICV: 4.10 158
Chetan et al. / Pharma Science Monitor 5(2), Sup-1, Apr-Jun 2014, 153-179
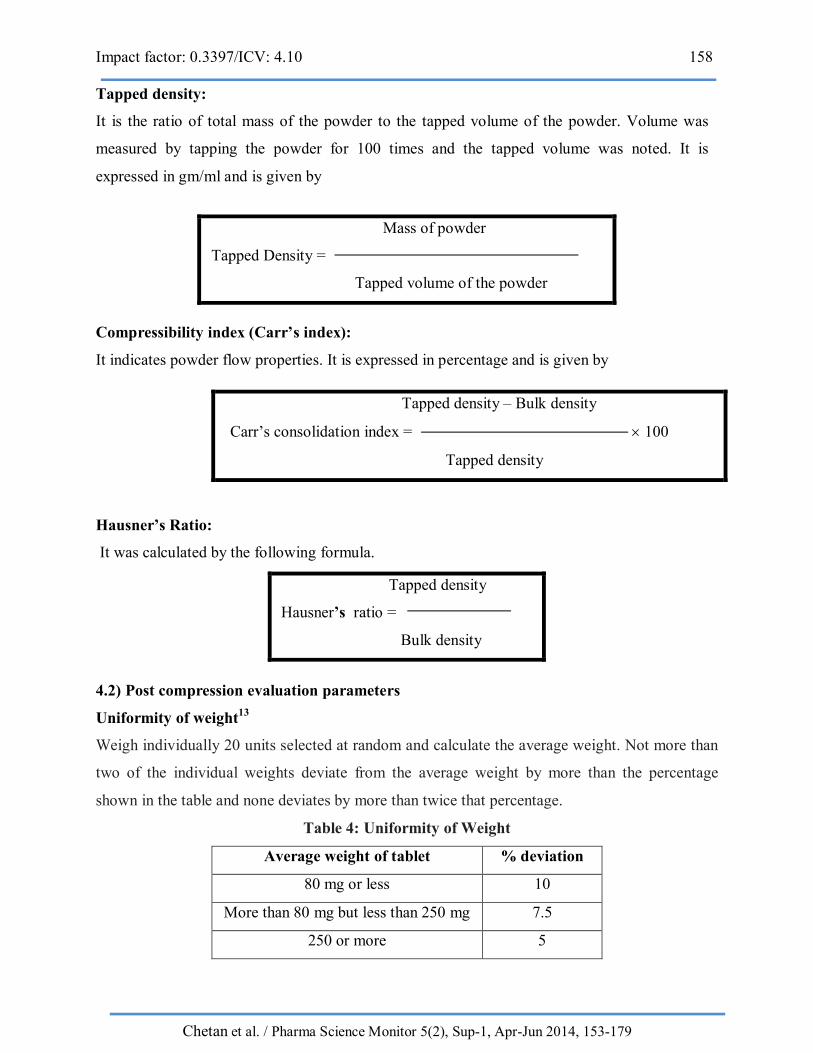
Tapped density:
It is the ratio of total mass of the powder to the tapped volume of the powder. Volume was
measured by tapping the powder for 100 times and the tapped volume was noted. It is
expressed in gm/ml and is given by
Compressibility index (Carr’s index):
It indicates powder flow properties. It is expressed in percentage and is given by
Hausner’s Ratio:
It was calculated by the following formula.
4.2) Post compression evaluation parameters
Uniformity of weight13
Weigh individually 20 units selected at random and calculate the average weight. Not more than
two of the individual weights deviate from the average weight by more than the percentage
shown in the table and none deviates by more than twice that percentage.
Table 4: Uniformity of Weight
Average weight of tablet % deviation
80 mg or less 10
More than 80 mg but less than 250 mg 7.5
250 or more 5
Mass of powder
Tapped Density =
Tapped volume of the powder
Tapped density – Bulk density
Carr’s consolidation index = 100
Tapped density
Tapped density
Hausner’s ratio =
Bulk density
Impact factor: 0.3397/ICV: 4.10 159
Chetan et al. / Pharma Science Monitor 5(2), Sup-1, Apr-Jun 2014, 153-179
Thickness and diameter11
Thickness and diameter of tablets was determined using vernier caliper. Three tablets were
evaluated and an average value was calculated. The thickness and diameter were measured in
mm.
Hardness test11
Hardness was measured using Monsanto hardness tester. The force required to break the tablet is
recorded. The hardness of tablets of each batch was measured in kg/cm2
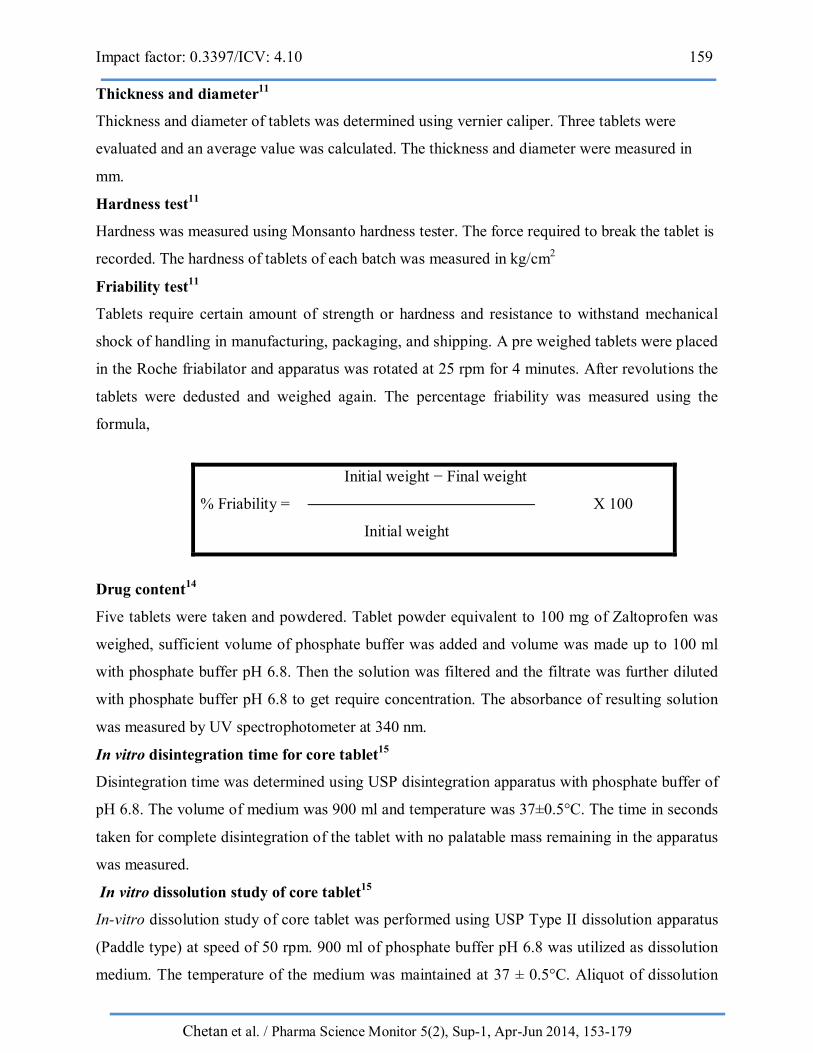
Friability test11
Tablets require certain amount of strength or hardness and resistance to withstand mechanical
shock of handling in manufacturing, packaging, and shipping. A pre weighed tablets were placed
in the Roche friabilator and apparatus was rotated at 25 rpm for 4 minutes. After revolutions the
tablets were dedusted and weighed again. The percentage friability was measured using the
formula,
Drug content14
Five tablets were taken and powdered. Tablet powder equivalent to 100 mg of Zaltoprofen was
weighed, sufficient volume of phosphate buffer was added and volume was made up to 100 ml
with phosphate buffer pH 6.8. Then the solution was filtered and the filtrate was further diluted
with phosphate buffer pH 6.8 to get require concentration. The absorbance of resulting solution
was measured by UV spectrophotometer at 340 nm.
In vitro disintegration time for core tablet15
Disintegration time was determined using USP disintegration apparatus with phosphate buffer of
pH 6.8. The volume of medium was 900 ml and temperature was 37±0.5°C. The time in seconds
taken for complete disintegration of the tablet with no palatable mass remaining in the apparatus
was measured.
In vitro dissolution study of core tablet15
In-vitro dissolution study of core tablet was performed using USP Type II dissolution apparatus
(Paddle type) at speed of 50 rpm. 900 ml of phosphate buffer pH 6.8 was utilized as dissolution
medium. The temperature of the medium was maintained at 37 ± 0.5°C. Aliquot of dissolution
Initial weight − Final weight
% Friability = X 100
Initial weight
Impact factor: 0.3397/ICV: 4.10 160
Chetan et al. / Pharma Science Monitor 5(2), Sup-1, Apr-Jun 2014, 153-179
medium 5 ml were withdrawn at specific time intervals (5, 10, 15, 20, 30, 45, 60 & 90 min) and
filtered each with whatman filter paper. Equal amount of fresh dissolution medium was replaced
immediately after each withdrawal. The amount of drug present in each sample was determined
by UV-Visible spectrophotometer at 340 nm.
In vitro dissolution study of press coated tablet15, 16
The in-vitro drug release studies of press-coated tablets of prepared formulations were carried
out using USP dissolution test apparatus type-II (Paddle type) using 900 ml of 0.1N HCL for 2
hrs and then replaced with phosphate buffer pH 6.8 at speed of 50 rpm at 37 ± 0.5 ºC and the
aliquot of dissolution medium 5 ml were withdrawn at specific time intervals and filtered each
with whatman filter paper. Equal amount of fresh dissolution medium was replaced immediately
after each withdrawal. The absorbance of the resulting solution was measured at the 338nm
(0.1N HCL pH 1.2) and 340nm (phosphate buffer 6.8 pH) using UV spectrophotometer.
5. Statistical analysis and validation of design
Statistical analysis and validation of model were performed using design expert 9.0 software
(Stat-Ease Inc., USA). The responses were analyzed using ANOVA, the individual response
parameters were evaluated using F test and polynomial equation was generated for each response
using multiple linear regression analysis. Counter plot and 3D surface plot were constructed
using design expert software. By utilizing design expert software, one final formulation
corresponding to the predicted optimum polymer ratio and coating level were prepared to
determine the validity of the model generated. Afterward, the observed experimental data of the
response properties were quantitatively compared with those of the predicted values.
6. Stability study of optimized formulation
Accelerated stability study of optimized press coated pulsatile tablets was performed as per the
ICH guideline Q1C. Optimized PCPT of Zaltoprofen was wrapped in aluminum foil and stored
in stability chamber at 40 ± 2 °C/ 75 ± 5 % RH for a period of 1 month. After a period of one
month tablets were withdrawn from chamber and evaluated for uniformity of weight, friability,
hardness, drug content and in vitro drug release study.
RESULT AND DISCUSSION
1. Preformulation study
1.1) Organoleptic evaluation: The color, odor, and taste of the drug were characterized and
recorded using descriptive terminology; the results were shown in the below table 5.
Impact factor: 0.3397/ICV: 4.10 161
Chetan et al. / Pharma Science Monitor 5(2), Sup-1, Apr-Jun 2014, 153-179
Table 5: Organoleptic evaluation
Properties Results
Description Crystalline
Taste Bitter
Odor Odorless
Color White to light yellow
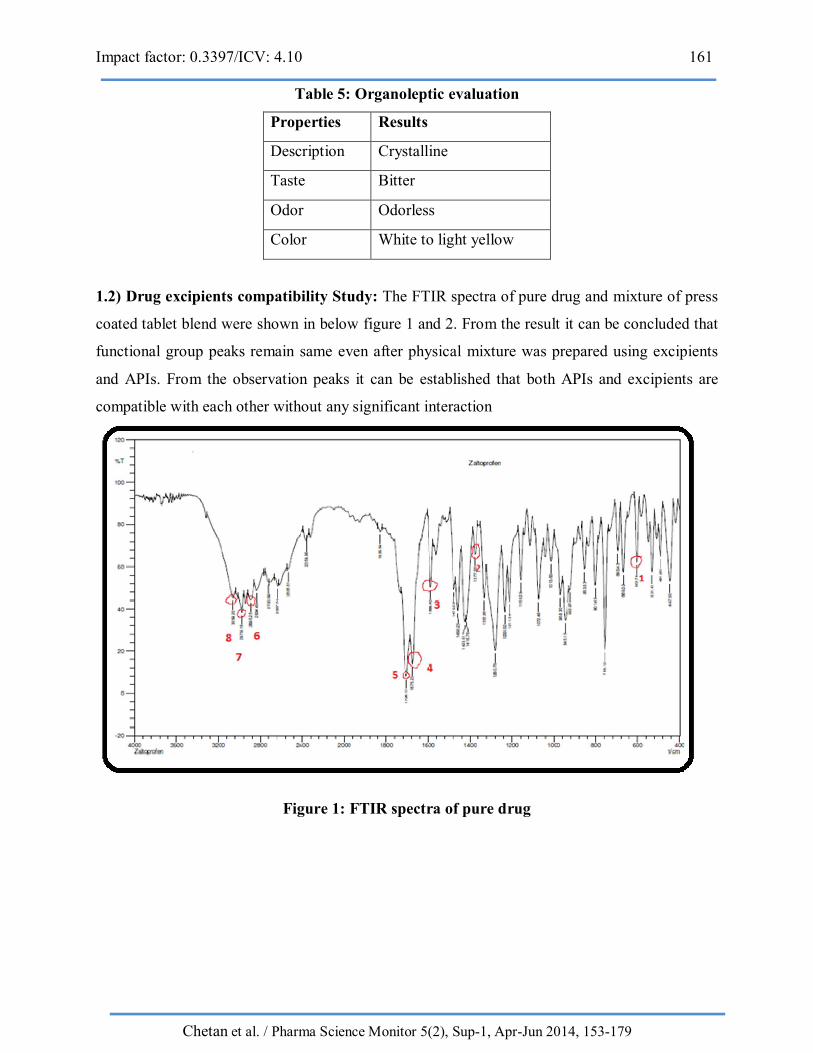
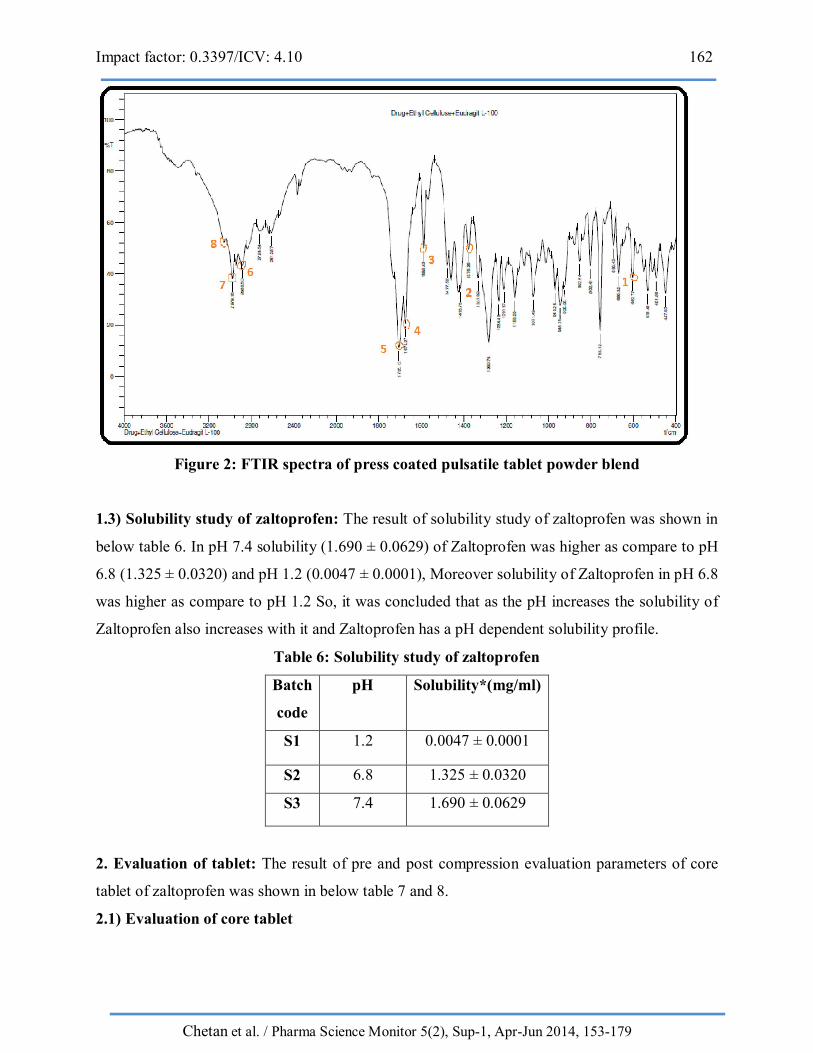
1.2) Drug excipients compatibility Study: The FTIR spectra of pure drug and mixture of press
coated tablet blend were shown in below figure 1 and 2. From the result it can be concluded that
functional group peaks remain same even after physical mixture was prepared using excipients
and APIs. From the observation peaks it can be established that both APIs and excipients are
compatible with each other without any significant interaction
Figure 1: FTIR spectra of pure drug
Impact factor: 0.3397/ICV: 4.10 162
Chetan et al. / Pharma Science Monitor 5(2), Sup-1, Apr-Jun 2014, 153-179
Figure 2: FTIR spectra of press coated pulsatile tablet powder blend
1.3) Solubility study of zaltoprofen: The result of solubility study of zaltoprofen was shown in
below table 6. In pH 7.4 solubility (1.690 ± 0.0629) of Zaltoprofen was higher as compare to pH
6.8 (1.325 ± 0.0320) and pH 1.2 (0.0047 ± 0.0001), Moreover solubility of Zaltoprofen in pH 6.8
was higher as compare to pH 1.2 So, it was concluded that as the pH increases the solubility of
Zaltoprofen also increases with it and Zaltoprofen has a pH dependent solubility profile.
Table 6: Solubility study of zaltoprofen
Batch
code
pH Solubility*(mg/ml)
S1 1.2 0.0047 ± 0.0001
S2 6.8 1.325 ± 0.0320
S3 7.4 1.690 ± 0.0629
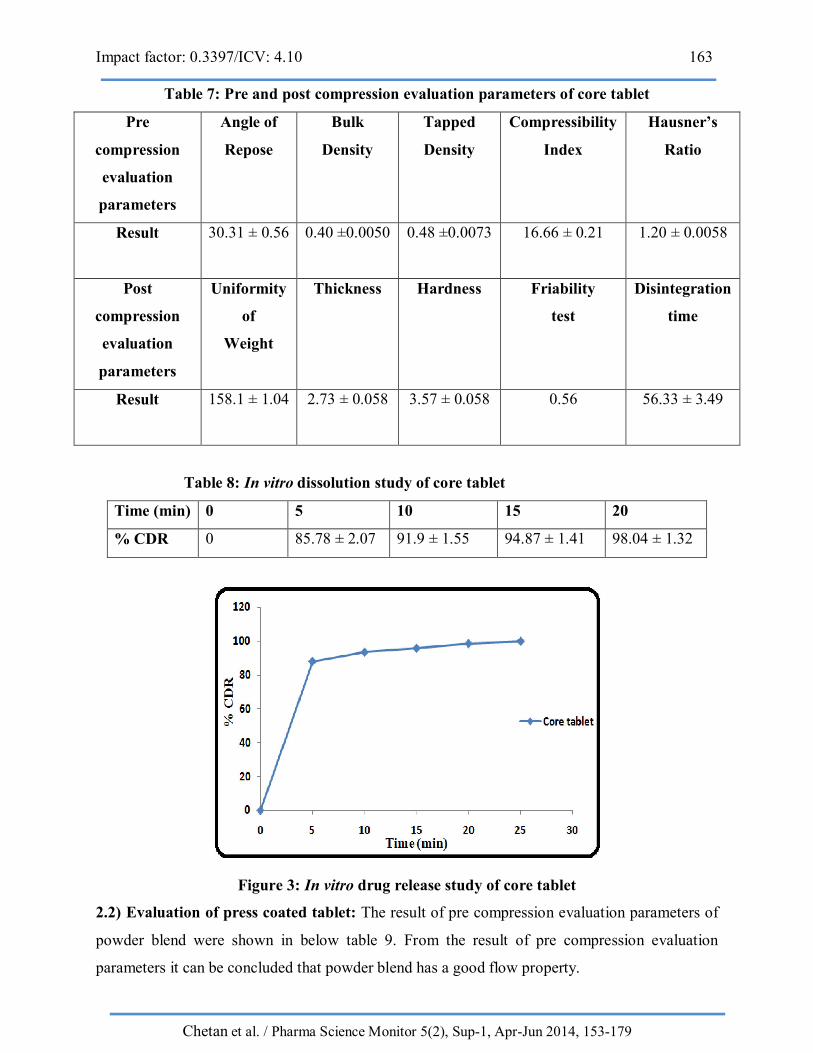
2. Evaluation of tablet: The result of pre and post compression evaluation parameters of core
tablet of zaltoprofen was shown in below table 7 and 8.
2.1) Evaluation of core tablet
Impact factor: 0.3397/ICV: 4.10 163
Chetan et al. / Pharma Science Monitor 5(2), Sup-1, Apr-Jun 2014, 153-179
Table 7: Pre and post compression evaluation parameters of core tablet
Pre
compression
evaluation
parameters
Angle of
Repose
Bulk
Density
Tapped
Density
Compressibility
Index
Hausner’s
Ratio
Result 30.31 ± 0.56 0.40 ±0.0050
0.48 ±0.0073
16.66 ± 0.21 1.20 ± 0.0058
Post
compression
evaluation
parameters
Uniformity
of
Weight
Thickness Hardness Friability
test
Disintegration
time
Result 158.1 ± 1.04
2.73 ± 0.058
3.57 ± 0.058
0.56
56.33 ± 3.49
Table 8: In vitro dissolution study of core tablet
Time (min) 0 5 10 15 20
% CDR 0 85.78 ± 2.07 91.9 ± 1.55 94.87 ± 1.41 98.04 ± 1.32
Figure 3: In vitro drug release study of core tablet
2.2) Evaluation of press coated tablet: The result of pre compression evaluation parameters of
powder blend were shown in below table 9. From the result of pre compression evaluation
parameters it can be concluded that powder blend has a good flow property.
Impact factor: 0.3397/ICV: 4.10 164
Chetan et al. / Pharma Science Monitor 5(2), Sup-1, Apr-Jun 2014, 153-179
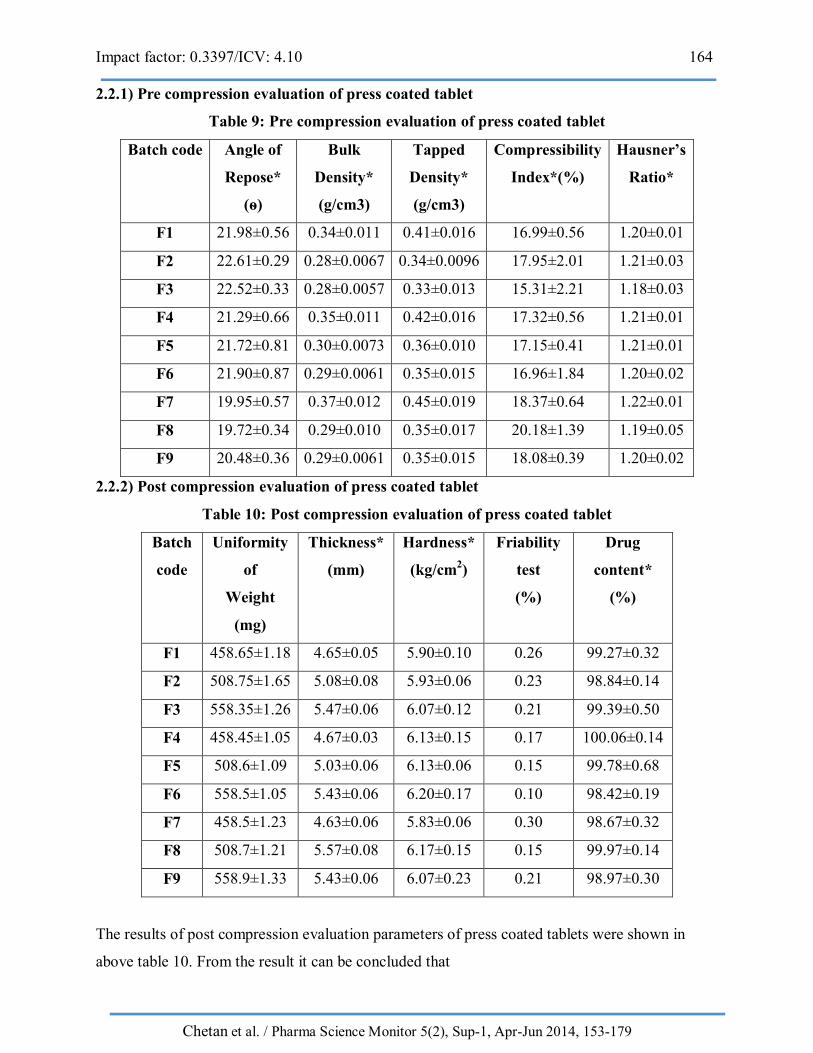
2.2.1) Pre compression evaluation of press coated tablet
Table 9: Pre compression evaluation of press coated tablet
Batch code Angle of
Repose*
(ѳ)
Bulk
Density*
(g/cm3)
Tapped
Density*
(g/cm3)
Compressibility
Index*(%)
Hausner’s
Ratio*
F1 21.98±0.56 0.34±0.011 0.41±0.016 16.99±0.56 1.20±0.01
F2 22.61±0.29 0.28±0.0067 0.34±0.0096 17.95±2.01 1.21±0.03
F3 22.52±0.33 0.28±0.0057 0.33±0.013 15.31±2.21 1.18±0.03
F4 21.29±0.66 0.35±0.011 0.42±0.016 17.32±0.56 1.21±0.01
F5 21.72±0.81 0.30±0.0073 0.36±0.010 17.15±0.41 1.21±0.01
F6 21.90±0.87 0.29±0.0061 0.35±0.015 16.96±1.84 1.20±0.02
F7 19.95±0.57 0.37±0.012 0.45±0.019 18.37±0.64 1.22±0.01
F8 19.72±0.34 0.29±0.010 0.35±0.017 20.18±1.39 1.19±0.05
F9 20.48±0.36 0.29±0.0061 0.35±0.015 18.08±0.39 1.20±0.02
2.2.2) Post compression evaluation of press coated tablet
Table 10: Post compression evaluation of press coated tablet
Batch
code
Uniformity
of
Weight
(mg)
Thickness*
(mm)
Hardness*
(kg/cm2)
Friability
test
(%)
Drug
content*
(%)
F1 458.65±1.18 4.65±0.05 5.90±0.10 0.26 99.27±0.32
F2 508.75±1.65 5.08±0.08 5.93±0.06 0.23 98.84±0.14
F3 558.35±1.26 5.47±0.06 6.07±0.12 0.21 99.39±0.50
F4 458.45±1.05 4.67±0.03 6.13±0.15 0.17 100.06±0.14
F5 508.6±1.09 5.03±0.06 6.13±0.06 0.15 99.78±0.68
F6 558.5±1.05 5.43±0.06 6.20±0.17 0.10 98.42±0.19
F7 458.5±1.23 4.63±0.06 5.83±0.06 0.30 98.67±0.32
F8 508.7±1.21 5.57±0.08 6.17±0.15 0.15 99.97±0.14
F9 558.9±1.33 5.43±0.06 6.07±0.23 0.21 98.97±0.30
The results of post compression evaluation parameters of press coated tablets were shown in
above table 10. From the result it can be concluded that
Impact factor: 0.3397/ICV: 4.10 165
Chetan et al. / Pharma Science Monitor 5(2), Sup-1, Apr-Jun 2014, 153-179
Weight variation:
Deviation in weight of factorial batches tablets are within the limit described in table 4 indicated
that there was no significant weight variation in the prepared press coated tablets. Hence, all the
tablets formulations passed the weight variation test.
Thickness:
Thickness of tablet was found to be in the range from 4.63 ± 0.06 to 5.57 ± 0.08
Hardness:
Hardness of all formulation prepared by direct compression was found to be 5.83 ± 0.06 to 6.20
± 0.17 kg/cm2.
Friability:
The percentage friability was less than 1% in all the formulations, indicating that the friability is
within the prescribed limits. The results of friability indicates that the tablet posses good
mechanical strength.
Drug content:
Drug content in press coated tablets was found to be in the range of 98.42 ±0.19 to 100.06±0.14
that is within the acceptable limit.
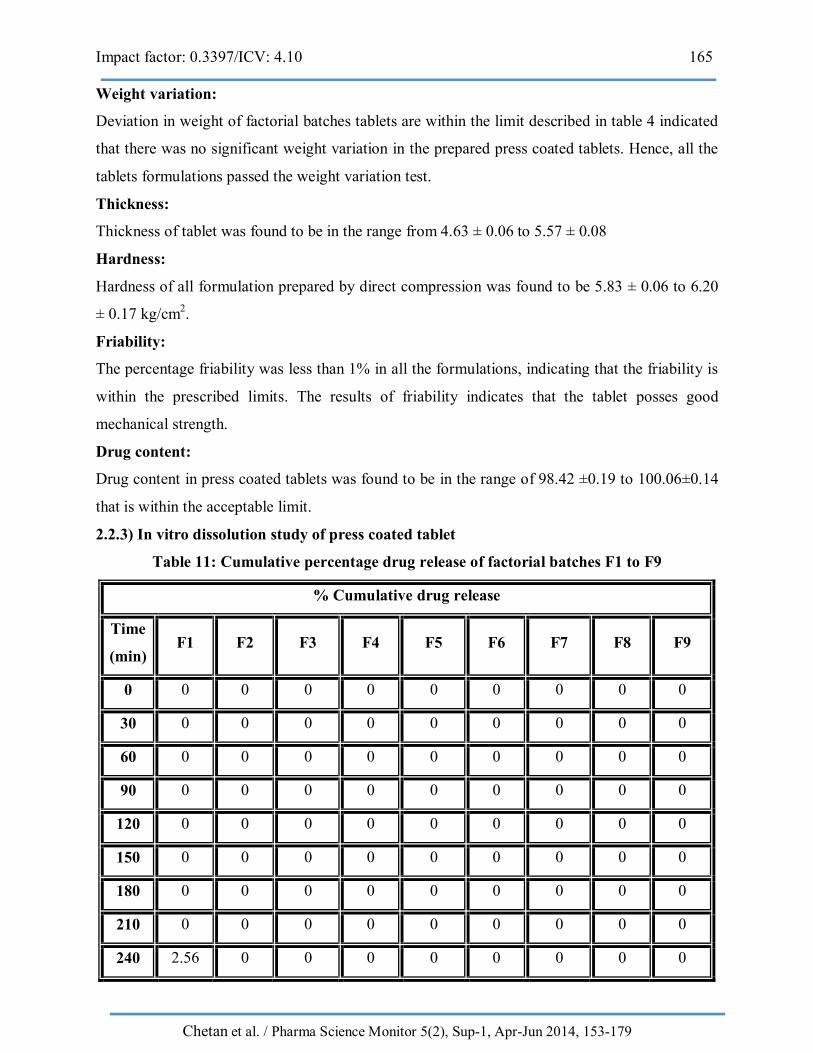
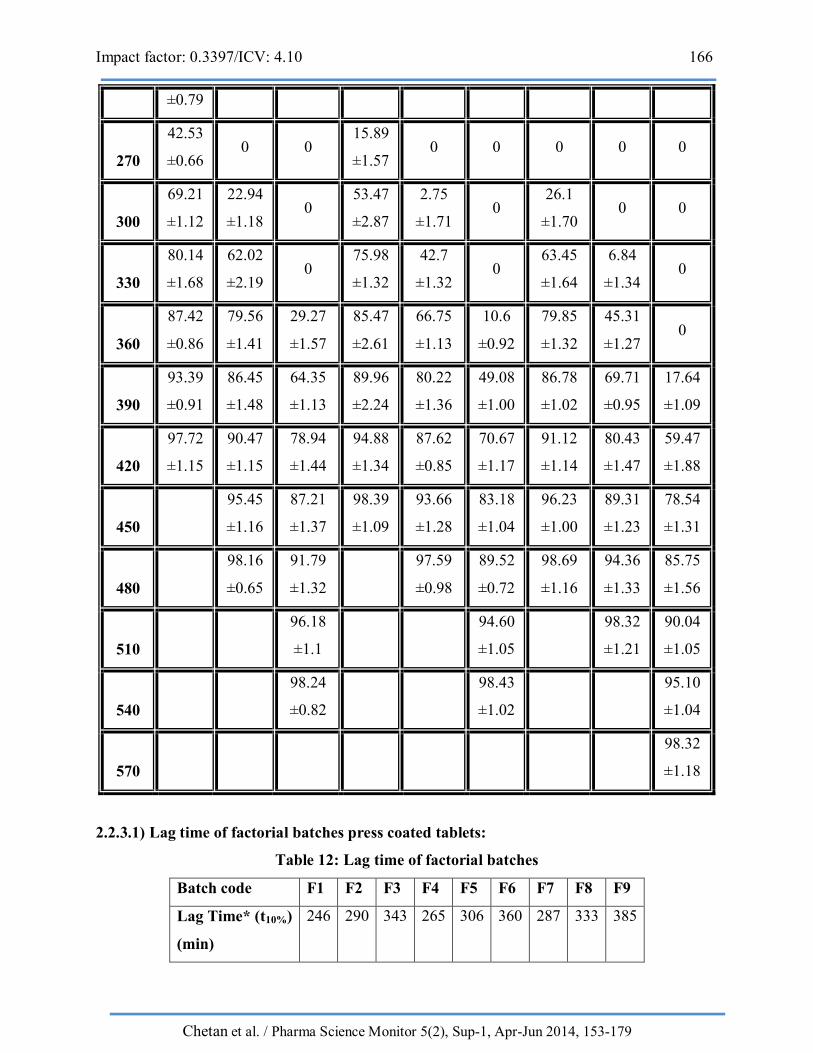
2.2.3) In vitro dissolution study of press coated tablet
Table 11: Cumulative percentage drug release of factorial batches F1 to F9
% Cumulative drug release
Time
(min) F1 F2 F3 F4 F5 F6 F7 F8 F9
0 0 0 0 0 0 0 0 0 0
30 0 0 0 0 0 0 0 0 0
60 0 0 0 0 0 0 0 0 0
90 0 0 0 0 0 0 0 0 0
120 0 0 0 0 0 0 0 0 0
150 0 0 0 0 0 0 0 0 0
180 0 0 0 0 0 0 0 0 0
210 0 0 0 0 0 0 0 0 0
240 2.56 0 0 0 0 0 0 0 0
Impact factor: 0.3397/ICV: 4.10 166
Chetan et al. / Pharma Science Monitor 5(2), Sup-1, Apr-Jun 2014, 153-179
±0.79
270
42.53
±0.66 0 0
15.89
±1.57 0 0 0 0 0
300
69.21
±1.12
22.94
±1.18 0
53.47
±2.87
2.75
±1.71 0
26.1
±1.70 0 0
330
80.14
±1.68
62.02
±2.19 0
75.98
±1.32
42.7
±1.32 0
63.45
±1.64
6.84
±1.34 0
360
87.42
±0.86
79.56
±1.41
29.27
±1.57
85.47
±2.61
66.75
±1.13
10.6
±0.92
79.85
±1.32
45.31
±1.27 0
390
93.39
±0.91
86.45
±1.48
64.35
±1.13
89.96
±2.24
80.22
±1.36
49.08
±1.00
86.78
±1.02
69.71
±0.95
17.64
±1.09
420
97.72
±1.15
90.47
±1.15
78.94
±1.44
94.88
±1.34
87.62
±0.85
70.67
±1.17
91.12
±1.14
80.43
±1.47
59.47
±1.88
450
95.45
±1.16
87.21
±1.37
98.39
±1.09
93.66
±1.28
83.18
±1.04
96.23
±1.00
89.31
±1.23
78.54
±1.31
480
98.16
±0.65
91.79
±1.32
97.59
±0.98
89.52
±0.72
98.69
±1.16
94.36
±1.33
85.75
±1.56
510
96.18
±1.1
94.60
±1.05
98.32
±1.21
90.04
±1.05
540
98.24
±0.82
98.43
±1.02
95.10
±1.04
570
98.32
±1.18
2.2.3.1) Lag time of factorial batches press coated tablets:
Table 12: Lag time of factorial batches
Batch code F1 F2 F3 F4 F5 F6 F7 F8 F9
Lag Time* (t10%)
(min)
246
290
343
265
306
360
287
333
385
Impact factor: 0.3397/ICV: 4.10 167
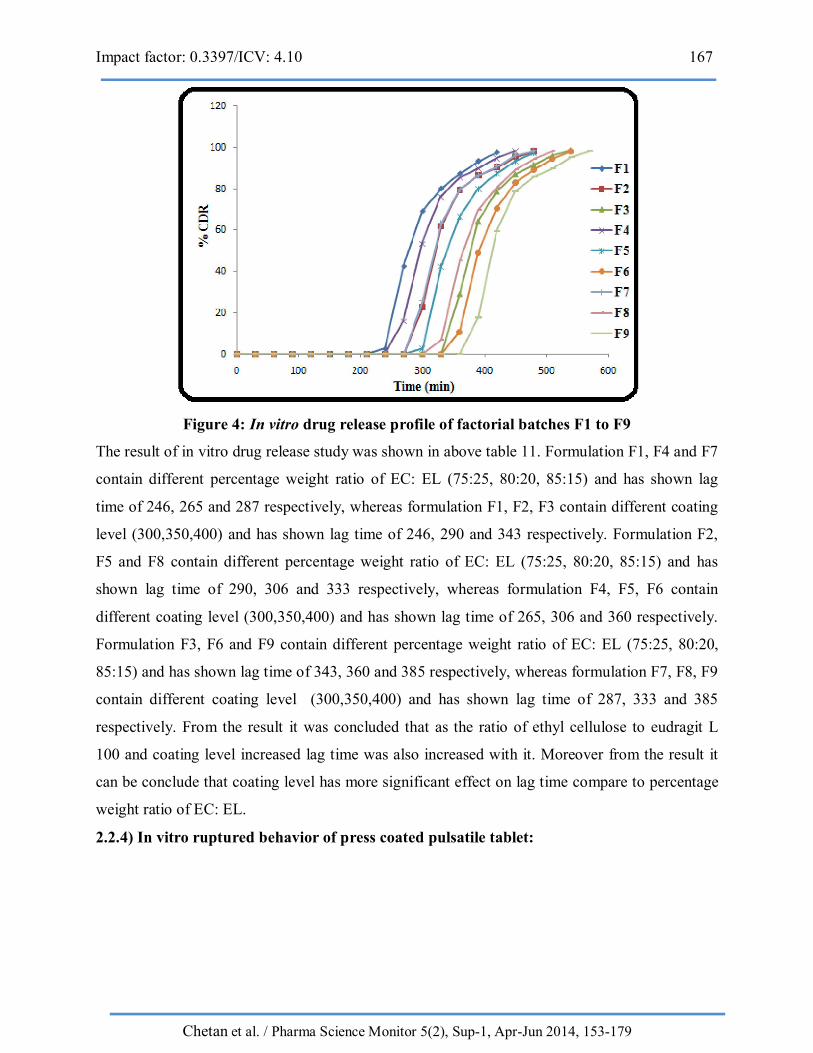
Chetan et al. / Pharma Science Monitor 5(2), Sup-1, Apr-Jun 2014, 153-179
Figure 4: In vitro drug release profile of factorial batches F1 to F9
The result of in vitro drug release study was shown in above table 11. Formulation F1, F4 and F7
contain different percentage weight ratio of EC: EL (75:25, 80:20, 85:15) and has shown lag
time of 246, 265 and 287 respectively, whereas formulation F1, F2, F3 contain different coating
level (300,350,400) and has shown lag time of 246, 290 and 343 respectively. Formulation F2,
F5 and F8 contain different percentage weight ratio of EC: EL (75:25, 80:20, 85:15) and has
shown lag time of 290, 306 and 333 respectively, whereas formulation F4, F5, F6 contain
different coating level (300,350,400) and has shown lag time of 265, 306 and 360 respectively.
Formulation F3, F6 and F9 contain different percentage weight ratio of EC: EL (75:25, 80:20,
85:15) and has shown lag time of 343, 360 and 385 respectively, whereas formulation F7, F8, F9
contain different coating level (300,350,400) and has shown lag time of 287, 333 and 385
respectively. From the result it was concluded that as the ratio of ethyl cellulose to eudragit L
100 and coating level increased lag time was also increased with it. Moreover from the result it
can be conclude that coating level has more significant effect on lag time compare to percentage
weight ratio of EC: EL.
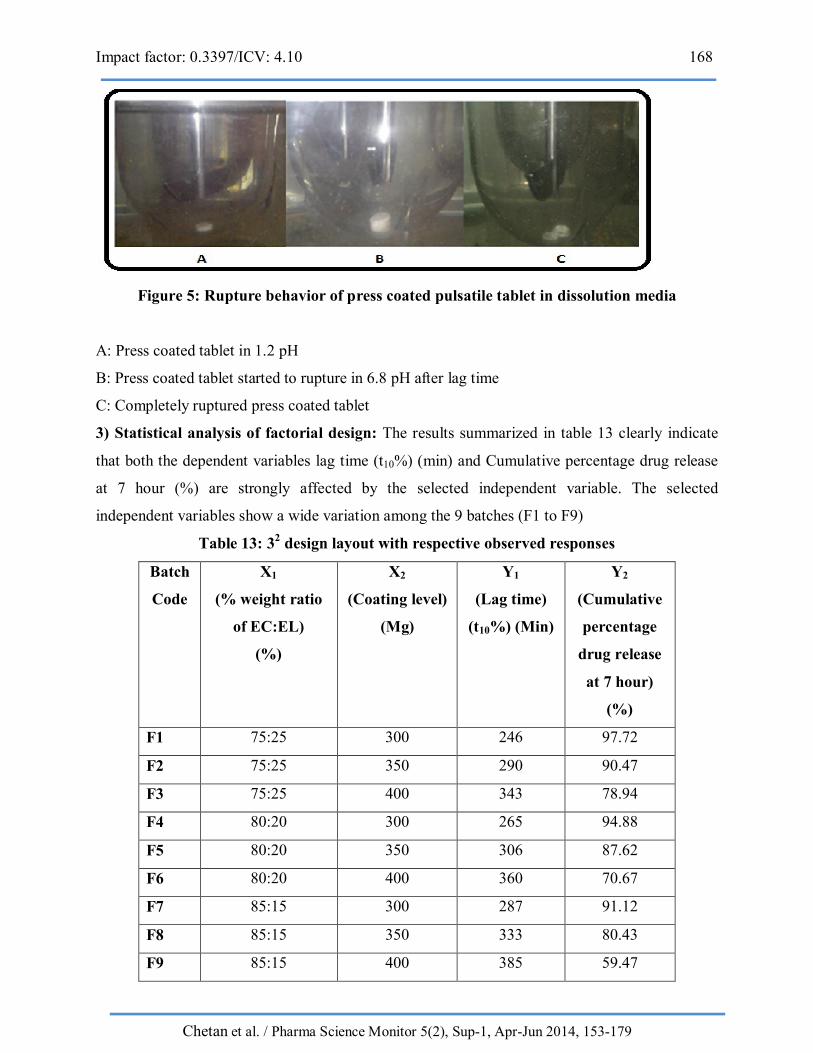
2.2.4) In vitro ruptured behavior of press coated pulsatile tablet:
Impact factor: 0.3397/ICV: 4.10 168
Chetan et al. / Pharma Science Monitor 5(2), Sup-1, Apr-Jun 2014, 153-179
Figure 5: Rupture behavior of press coated pulsatile tablet in dissolution media
A: Press coated tablet in 1.2 pH
B: Press coated tablet started to rupture in 6.8 pH after lag time
C: Completely ruptured press coated tablet
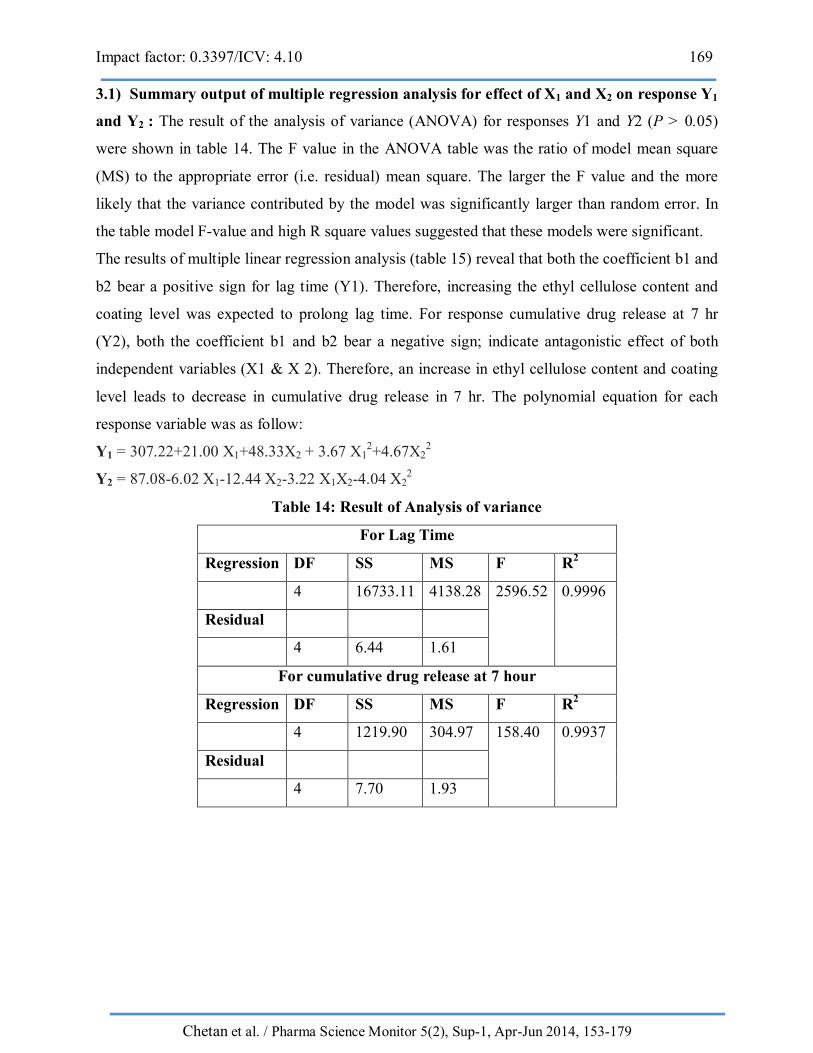
3) Statistical analysis of factorial design: The results summarized in table 13 clearly indicate
that both the dependent variables lag time (t10%) (min) and Cumulative percentage drug release
at 7 hour (%) are strongly affected by the selected independent variable. The selected
independent variables show a wide variation among the 9 batches (F1 to F9)
Table 13: 32 design layout with respective observed responses
Batch
Code
X1
(% weight ratio
of EC:EL)
(%)
X2
(Coating level)
(Mg)
Y1
(Lag time)
(t10%) (Min)
Y2
(Cumulative
percentage
drug release
at 7 hour)
(%)
F1 75:25 300 246 97.72
F2 75:25 350 290 90.47
F3 75:25 400 343 78.94
F4 80:20 300 265 94.88
F5 80:20 350 306 87.62
F6 80:20 400 360 70.67
F7 85:15 300 287 91.12
F8 85:15 350 333 80.43
F9 85:15 400 385 59.47
Impact factor: 0.3397/ICV: 4.10 169
Chetan et al. / Pharma Science Monitor 5(2), Sup-1, Apr-Jun 2014, 153-179
3.1) Summary output of multiple regression analysis for effect of X1 and X2 on response Y1
and Y2 : The result of the analysis of variance (ANOVA) for responses Y1 and Y2 (P > 0.05)
were shown in table 14. The F value in the ANOVA table was the ratio of model mean square
(MS) to the appropriate error (i.e. residual) mean square. The larger the F value and the more
likely that the variance contributed by the model was significantly larger than random error. In
the table model F-value and high R square values suggested that these models were significant.
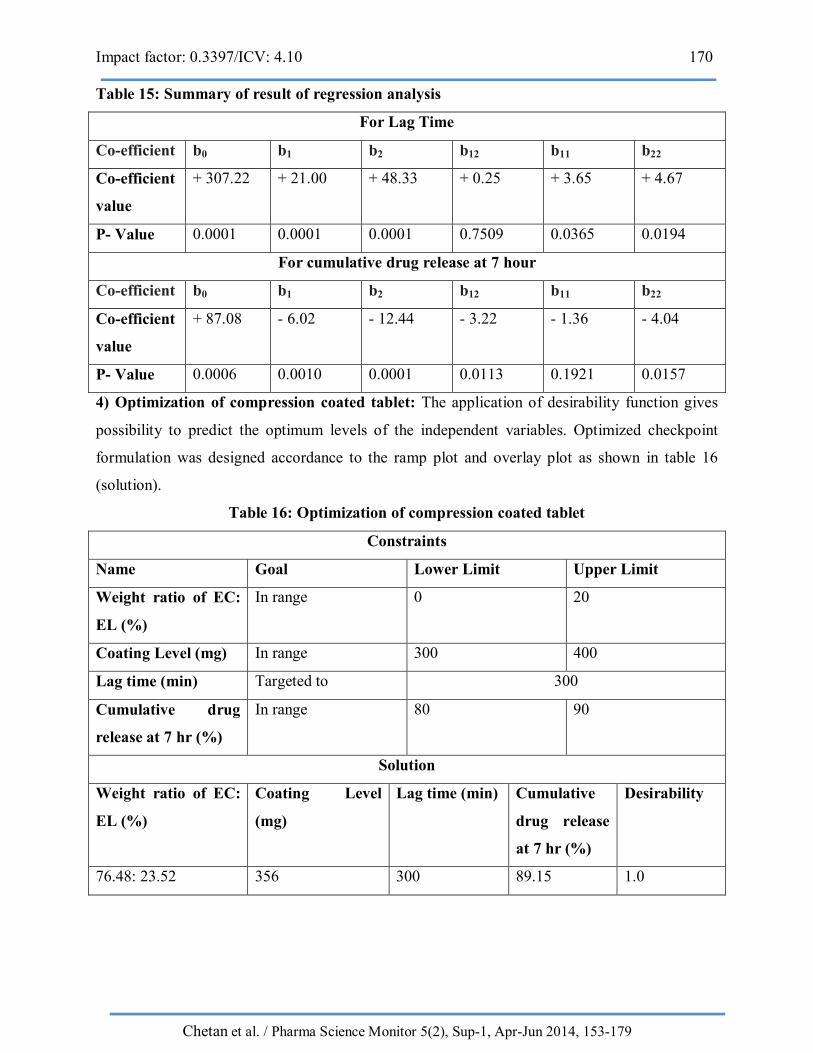
The results of multiple linear regression analysis (table 15) reveal that both the coefficient b1 and
b2 bear a positive sign for lag time (Y1). Therefore, increasing the ethyl cellulose content and
coating level was expected to prolong lag time. For response cumulative drug release at 7 hr
(Y2), both the coefficient b1 and b2 bear a negative sign; indicate antagonistic effect of both
independent variables (X1 & X 2). Therefore, an increase in ethyl cellulose content and coating
level leads to decrease in cumulative drug release in 7 hr. The polynomial equation for each
response variable was as follow:
Y1 = 307.22+21.00 X1+48.33X2 + 3.67 X12+4.67X2
2
Y2 = 87.08-6.02 X1-12.44 X2-3.22 X1X2-4.04 X22
Table 14: Result of Analysis of variance
For Lag Time
Regression DF SS MS F R2
4 16733.11 4138.28 2596.52 0.9996
Residual
4 6.44 1.61
For cumulative drug release at 7 hour
Regression DF SS MS F R2
4 1219.90 304.97 158.40 0.9937
Residual
4 7.70 1.93
Impact factor: 0.3397/ICV: 4.10 170
Chetan et al. / Pharma Science Monitor 5(2), Sup-1, Apr-Jun 2014, 153-179
Table 15: Summary of result of regression analysis
For Lag Time
Co-efficient b0 b1 b2 b12 b11 b22
Co-efficient
value
+ 307.22 + 21.00 + 48.33 + 0.25 + 3.65 + 4.67
P- Value 0.0001 0.0001 0.0001 0.7509 0.0365 0.0194
For cumulative drug release at 7 hour
Co-efficient b0 b1 b2 b12 b11 b22
Co-efficient
value
+ 87.08 - 6.02 - 12.44 - 3.22 - 1.36 - 4.04
P- Value 0.0006 0.0010 0.0001 0.0113 0.1921 0.0157
4) Optimization of compression coated tablet: The application of desirability function gives
possibility to predict the optimum levels of the independent variables. Optimized checkpoint
formulation was designed accordance to the ramp plot and overlay plot as shown in table 16
(solution).
Table 16: Optimization of compression coated tablet
Constraints
Name Goal Lower Limit Upper Limit
Weight ratio of EC:
EL (%)
In range 0 20
Coating Level (mg) In range 300 400
Lag time (min) Targeted to 300
Cumulative drug
release at 7 hr (%)
In range 80 90
Solution
Weight ratio of EC:
EL (%)
Coating Level
(mg)
Lag time (min) Cumulative
drug release
at 7 hr (%)
Desirability
76.48: 23.52 356 300 89.15 1.0
Impact factor: 0.3397/ICV: 4.10 171
Chetan et al. / Pharma Science Monitor 5(2), Sup-1, Apr-Jun 2014, 153-179
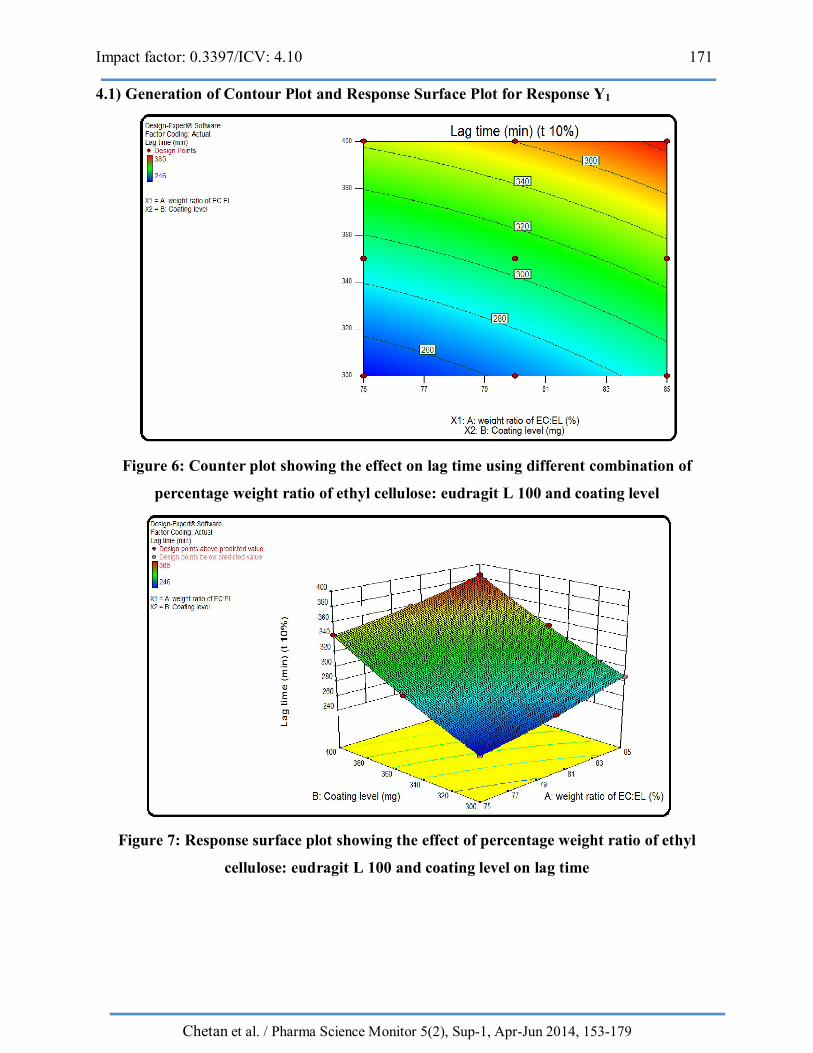
4.1) Generation of Contour Plot and Response Surface Plot for Response Y1
Figure 6: Counter plot showing the effect on lag time using different combination of
percentage weight ratio of ethyl cellulose: eudragit L 100 and coating level
Figure 7: Response surface plot showing the effect of percentage weight ratio of ethyl
cellulose: eudragit L 100 and coating level on lag time
Impact factor: 0.3397/ICV: 4.10 172
Chetan et al. / Pharma Science Monitor 5(2), Sup-1, Apr-Jun 2014, 153-179
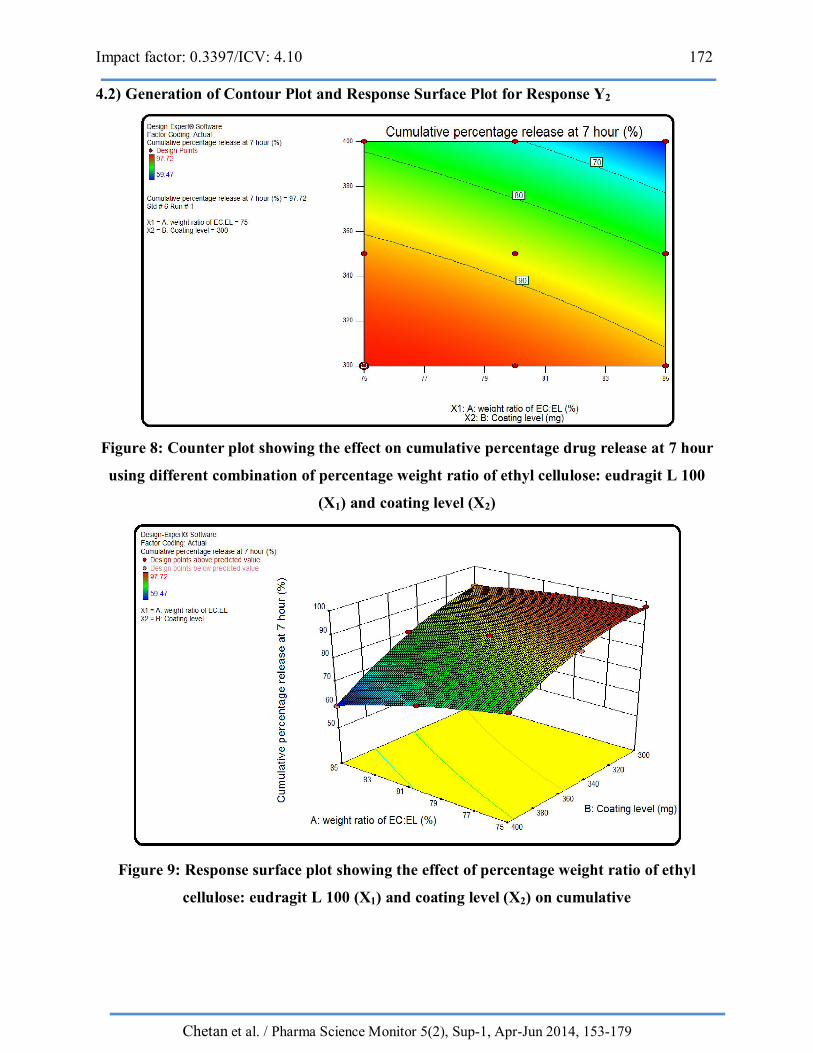
4.2) Generation of Contour Plot and Response Surface Plot for Response Y2
Figure 8: Counter plot showing the effect on cumulative percentage drug release at 7 hour
using different combination of percentage weight ratio of ethyl cellulose: eudragit L 100
(X1) and coating level (X2)
Figure 9: Response surface plot showing the effect of percentage weight ratio of ethyl
cellulose: eudragit L 100 (X1) and coating level (X2) on cumulative
Impact factor: 0.3397/ICV: 4.10 173
Chetan et al. / Pharma Science Monitor 5(2), Sup-1, Apr-Jun 2014, 153-179
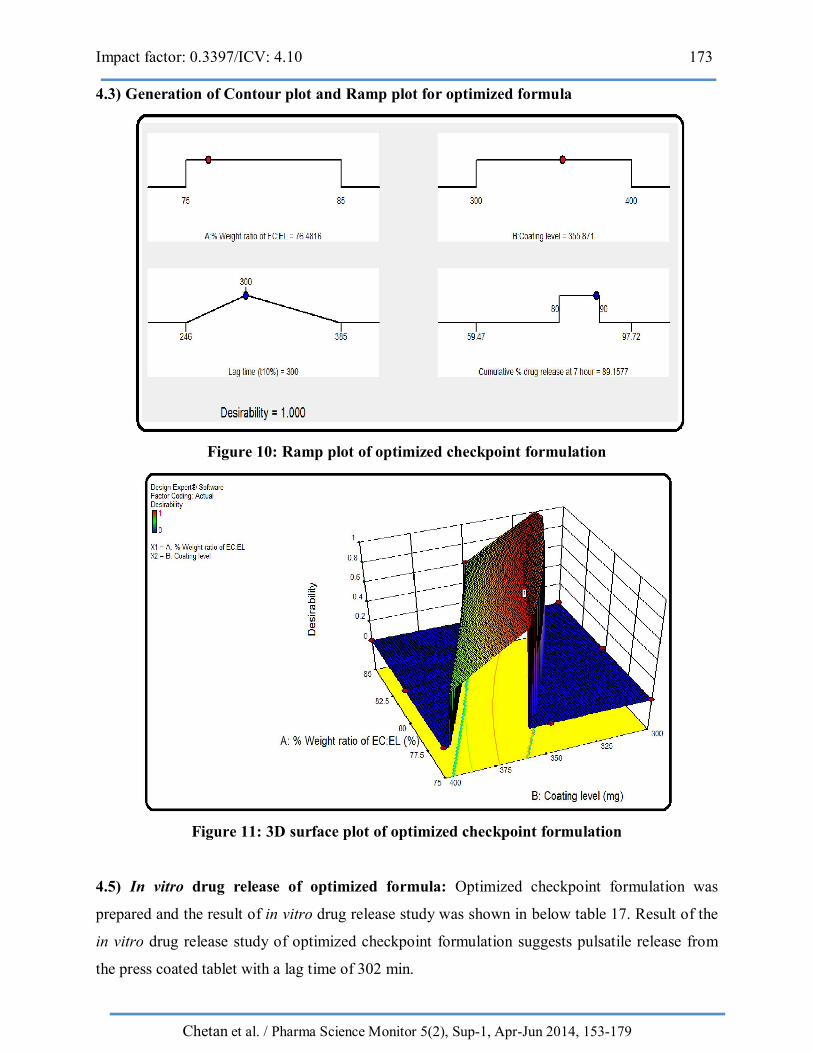
4.3) Generation of Contour plot and Ramp plot for optimized formula
Figure 10: Ramp plot of optimized checkpoint formulation
Figure 11: 3D surface plot of optimized checkpoint formulation
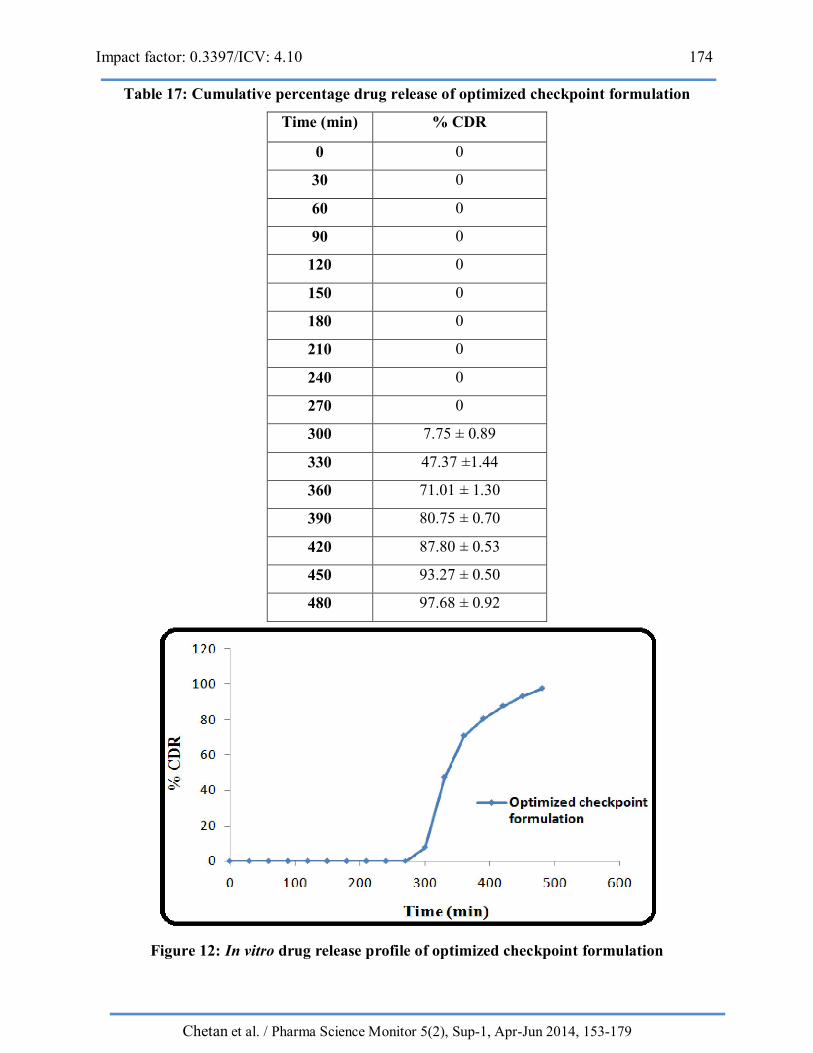
4.5) In vitro drug release of optimized formula: Optimized checkpoint formulation was
prepared and the result of in vitro drug release study was shown in below table 17. Result of the
in vitro drug release study of optimized checkpoint formulation suggests pulsatile release from
the press coated tablet with a lag time of 302 min.
Impact factor: 0.3397/ICV: 4.10 174
Chetan et al. / Pharma Science Monitor 5(2), Sup-1, Apr-Jun 2014, 153-179
Table 17: Cumulative percentage drug release of optimized checkpoint formulation
Time (min) % CDR
0 0
30 0
60 0
90 0
120 0
150 0
180 0
210 0
240 0
270 0
300 7.75 ± 0.89
330 47.37 ±1.44
360 71.01 ± 1.30
390 80.75 ± 0.70
420 87.80 ± 0.53
450 93.27 ± 0.50
480 97.68 ± 0.92
Figure 12: In vitro drug release profile of optimized checkpoint formulation
Impact factor: 0.3397/ICV: 4.10 175
Chetan et al. / Pharma Science Monitor 5(2), Sup-1, Apr-Jun 2014, 153-179
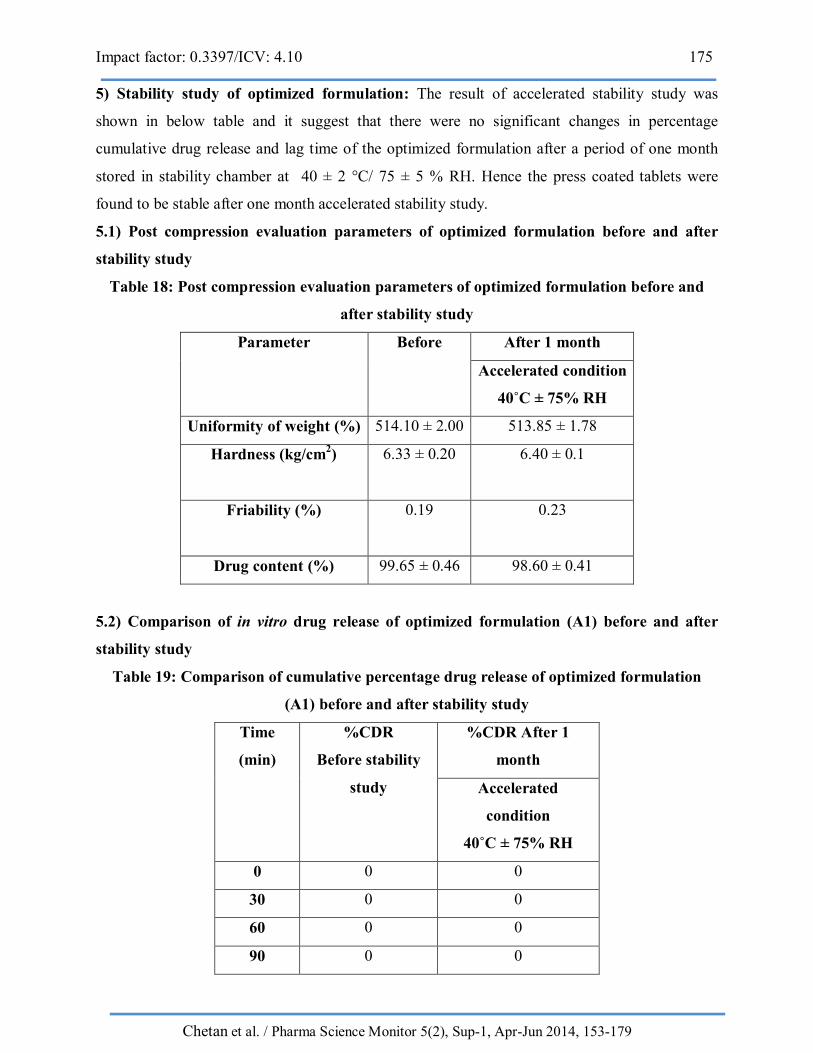
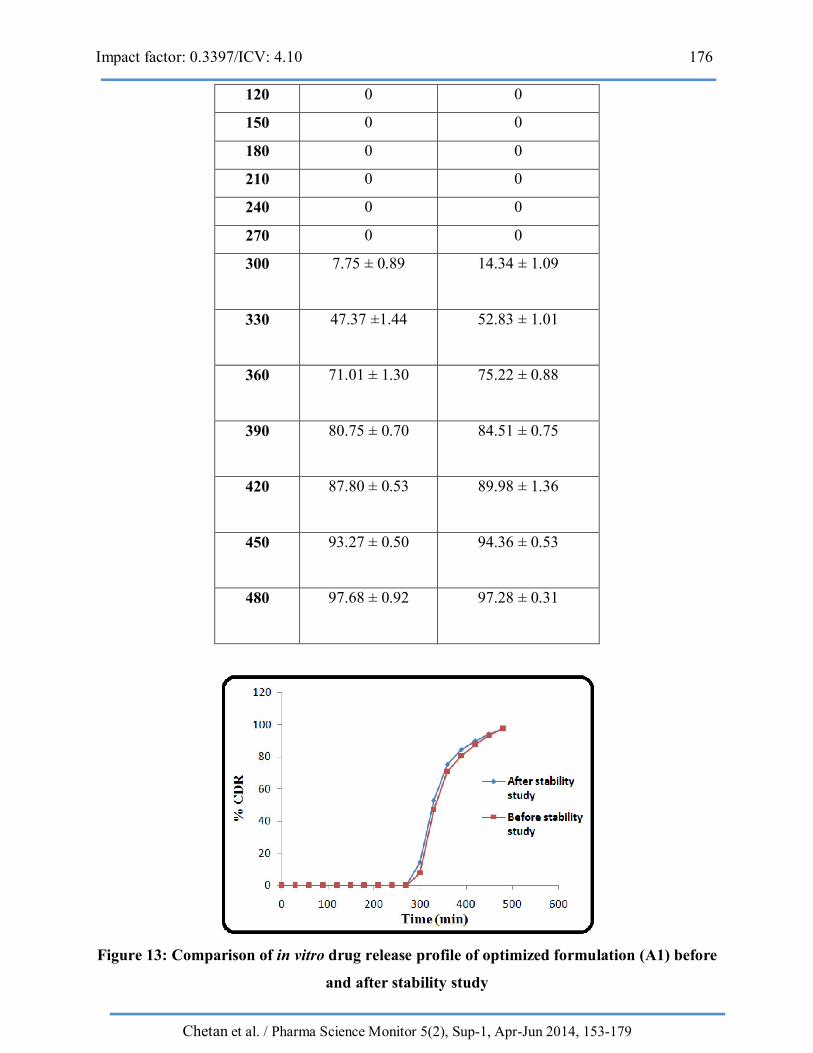
5) Stability study of optimized formulation: The result of accelerated stability study was
shown in below table and it suggest that there were no significant changes in percentage
cumulative drug release and lag time of the optimized formulation after a period of one month
stored in stability chamber at 40 ± 2 °C/ 75 ± 5 % RH. Hence the press coated tablets were
found to be stable after one month accelerated stability study.
5.1) Post compression evaluation parameters of optimized formulation before and after
stability study
Table 18: Post compression evaluation parameters of optimized formulation before and
after stability study
Parameter Before After 1 month
Accelerated condition
40˚C ± 75% RH
Uniformity of weight (%) 514.10 ± 2.00 513.85 ± 1.78
Hardness (kg/cm2)
6.33 ± 0.20 6.40 ± 0.1
Friability (%)
0.19 0.23
Drug content (%) 99.65 ± 0.46 98.60 ± 0.41
5.2) Comparison of in vitro drug release of optimized formulation (A1) before and after
stability study
Table 19: Comparison of cumulative percentage drug release of optimized formulation
(A1) before and after stability study
Time
(min)
%CDR
Before stability
study
%CDR After 1
month
Accelerated
condition
40˚C ± 75% RH
0 0 0
30 0 0
60 0 0
90 0 0
Impact factor: 0.3397/ICV: 4.10 176
Chetan et al. / Pharma Science Monitor 5(2), Sup-1, Apr-Jun 2014, 153-179
120 0 0
150 0 0
180 0 0
210 0 0
240 0 0
270 0 0
300 7.75 ± 0.89 14.34 ± 1.09
330 47.37 ±1.44 52.83 ± 1.01
360 71.01 ± 1.30 75.22 ± 0.88
390 80.75 ± 0.70 84.51 ± 0.75
420 87.80 ± 0.53 89.98 ± 1.36
450 93.27 ± 0.50 94.36 ± 0.53
480 97.68 ± 0.92 97.28 ± 0.31
Figure 13: Comparison of in vitro drug release profile of optimized formulation (A1) before
and after stability study
Impact factor: 0.3397/ICV: 4.10 177
Chetan et al. / Pharma Science Monitor 5(2), Sup-1, Apr-Jun 2014, 153-179
CONCLUSION
The present investigation was aimed to develop press coated pulsatile tablet (PCPT) of
Zaltoprofen for the treatment of rheumatoid arthritis. The result of FTIR analysis confirmed
presence of Zaltoprofen and showed compatibility between drug and polymer without any
significant interaction. Solubility study of Zaltoprofen was carried out by equilibrium solubility
method. The result of solubility study suggested that Zaltoprofen is a drug with pH dependent
solubility profile. Zaltoprofen pulsatile release tablets were prepared by compression coating
technique. Initially core tablets were prepared by direct compression, tablets were found
satisfactory in terms of hardness, thickness, uniformity of weight, drug content, disintegration
time and in vitro drug release study. Press coated pulsatile tablet was optimized using 32 full
factorial design. Percentage weight ratio of ethyl cellulose: eudragit L 100 (X1) and coating level
(X2) were selected as an independent variable. Lag time (Y1 = t10%) and cumulative percentage
drug release at 7 hour (Y2) were selected as a dependent variable. All the factorial batches press
coated tablets were prepared by direct compression method and tablets were evaluated for
uniformity of weight, hardness, thickness, drug content, friability and in vitro drug release study.
From the result of in vitro drug release study it can be concluded that as the concentration of
ethyl cellulose to eudragit L 100 (%) and coating level (mg) increased lag time increased and
cumulative percentage drug release at 7 hour decreased. Optimized check point formulation was
design according to the result of overlay plot and desirability function and characterized under
same condition as outlined for factorial batches. The results of stability study of optimized batch
were confirmed good compatibility and stability with selected excipients. In conclusion, the
novel PCPT developed for Zaltoprofen could be a promising chronomodulated therapeutic
system for the relief of morning pain and stiffness in patients with rheumatoid arthritis.
REFERENCES
1. Asim Sattwa Mandal, Biswas Nikhil, Kazi Masud Karim: Drug delivery system based on
chronobiology. Journal of Controlled Release. 2010; 147: 314-325.
2. Shan-Yang Lin and Yoshiaki Kawashima: Current status and approaches to developing
press-coated chronodelivery drug systems. Journal of Controlled Release. 2012; 157:
331-356.
3. Walter grassi, Rossella De Angelis, Gianni Lamanna, Claudio Cervini: The clinical
features of rheumatoid arthritis. European Journal of Radiology 1998; 27: 18-S24.
Impact factor: 0.3397/ICV: 4.10 178
Chetan et al. / Pharma Science Monitor 5(2), Sup-1, Apr-Jun 2014, 153-179
4. Georges J.M. Maestroni, Daniel P. Cardinali, Ana I. Esquifino, S.R. Pandi-Perumal: Does
melatonin play a disease promoting role in rheumatoid arthritis. Journal of
Neuroimmunology 2005; 158: 106-111.
5. Nils Gunnar Arvidson, Bjorn Gudbjornsson, Lena Elfman, Ann-christine Ryden, Thomas
H Totterman: Circadian rhythm of serum interleukin-6 in rheumatoid arthritis. Annal of
Rheumatic Diseases 1994; 53: 521-524.
6. Maurizio cutolo, Rainer H Straub, Frank Buttgereit: Circadian rhythms of nocturnal
hormones in rheumatoid arthritis: translation from bench to bedside. Annal of Rheumatic
Disease 2008; 67: 905-908.
7. Maurizio Cutolo, Rainer H. Straub: Circadian rhythms in arthritis: hormonal effects on
the immune/inflammatory reaction. Autoimmunity reviews. 2008; 7: 223-228.
8. Cutoloa M, B. Villaggio, K.Otsa, O. Aakre, A. Sulli, Seriolo B: Altered circadian
rhythms in rheumatoid arthritis patients play a role in the disease’s symptoms.
Autoimmunity Reviews. 2005; 4: 497– 502.
9. Sivakranth. M, Althaf A, Rajasekhar S: Formulation and evaluation of oral fast
dissolving tablets of sildenafil citrarte. International Journal of pharmacy and
Pharmaceutical Science 2011; 2: 112-121.
10. Soliman M sara, Malak N, Gazayerly O, Rehim A: Formulation of microemulsion gel
system for transdermal delivery of celecoxib: In vitro permeation, anti-inflammatory
activity and skin irritation tests. Drug Discoveries & Therapeutics. 2010, 4, 459-471.
11. Mayee Rv, Shinde PV: Development and evaluation of press coated tablet by using
rupturable material (Ec) combined with erodible material (Klucel Exf) of aceclofenac.
International Journal of Pharmacy 2012; 2: 380-385.
12. Dr.G.K.Jani and S.G.Jani: Pharmaceutical engineering II. B.S.Prakashan, 2011.
13. Indian Pharmacopoeia, The Indian Pharmacopoeia Commission, Ghaziabad, 6th Edn,
2010, Volume 1, pp 192
14. Sarfaraz M, Prasad Y, Reddy S.R, Doddayya H, Udupi R.H: Development and evaluation
of press coated time-release tablet of nifedipin. Asian Journal of Pharmaceutical
Research 2011; 1: 58-63.
15. Janugade B.U, Patil S, Patil V, Lade P: Formulation and evaluation of press-coated
montelukast sodium tablets for pulsatile drug delivery system. International Journal of
ChemTech Research 2009; 1: 690-691.
Impact factor: 0.3397/ICV: 4.10 179
Chetan et al. / Pharma Science Monitor 5(2), Sup-1, Apr-Jun 2014, 153-179
16. Dr. S.S. Khadabadi, Chishti NH, Khan Farhan, Tadvee Akeel: Formulation and
evaluation of press coated tablet of ketoprofen – A chronotherapeutic approach.
International Journal of Pharmacy and Pharmaceutical Sciences 2013; 5: 733-738.
For Correspondence Chetan G. Kukadiya Email: [email protected]