Embed Size (px)
Citation preview

7/29/2019 Impact Assessment of Predicted Sea Level Rise and Storm Surge on Coastal Embankments of Some Selected Pold…
http://slidepdf.com/reader/full/impact-assessment-of-predicted-sea-level-rise-and-storm-surge-on-coastal-embankments 1/123
IMPACT ASSESS
STORM SURGE
SELECTED PO
DEPARTME
BANGLADESH UNI
- 1 -
ENT OF PREDICTED SEA LEVEL
ON COASTAL EMBANKMENTS O
DERS USING MATHEMATICAL
AHSAN AZHAR SHOPAN
T OF WATER RESOURCES ENGINEERI
VERSITY OF ENGINEERING AND TECH
DHAKA
FEBRUARY, 2011
ISE AND
SOME
ODEL
G
NOLOGY
7/29/2019 Impact Assessment of Predicted Sea Level Rise and Storm Surge on Coastal Embankments of Some Selected Pold…
http://slidepdf.com/reader/full/impact-assessment-of-predicted-sea-level-rise-and-storm-surge-on-coastal-embankments 2/123
I
DECLARATION
I, do, hereby, declare that the research work reported in this thesis has been performed
by the author under the supervision of Dr. M. Mirjahan Miah, Professor, Department
of Water Resources Engineering, Bangladesh University of Engineering and
Technology. Neither this thesis nor any part of it has been submitted or is
concurrently submitted elsewhere for any purpose. To the best use of my knowledge
and competence the thesis contains no material previously published partially or in
full or written by any other person except when due references are made in the text of
the thesis.
February, 2011
Signature of the Supervisor Signature of the Author
_______________________ _______________________
Prof. Dr. M. Mirjahan Miah Ahsan Azhar Shopan

7/29/2019 Impact Assessment of Predicted Sea Level Rise and Storm Surge on Coastal Embankments of Some Selected Pold…
http://slidepdf.com/reader/full/impact-assessment-of-predicted-sea-level-rise-and-storm-surge-on-coastal-embankments 3/123
II
ACKNOWLEDGEMENT
The author wishes to express his deepest gratitude to the almighty Allah for special
blessings leading to the writing of this thesis work. The author would like to express
his profound gratitude and indebtness to his superviser Dr. M. Mirjahan Miah,
Professor, Department of Water Resources Engineering, BUET, Dhaka for his
untiring encouragement, generous support, valuable advice and constant guidance and
inspiration at every stage of the work. The study would have been difficult to
comprehend as well as to achieve without his guidance.
The author is grateful to Professor Dr. M. A. Matin, Head, Department of Water
Resources Engineering, BUET for necessary help of the thesis work.
The author is indebted to Md. Mobassarul Hasan, Associate Specialist and Ms.
Farhana Akhter Kamal, Junior Specialist, Institute of Water Modelling (IWM), Dhaka
for their kind co-operation to provide necessary data for this thesis work.
The author is grateful to Md. Nasiruddin, Sub-Divisional Engineer and Mir Shahinur
Rahman, Sectional Officer, BWDB, Satkhira Zone to for their kind co-operation
during the field visit.
The author would like to specially thank Tonmoy Sarker and Md. Rakibul Hassan
Khan for their kind and valuable help in the operation of HEC-RAS model.
Finally the author gratefully acknowledges the help, encouragement and co-operation
received from his family and friends.

7/29/2019 Impact Assessment of Predicted Sea Level Rise and Storm Surge on Coastal Embankments of Some Selected Pold…
http://slidepdf.com/reader/full/impact-assessment-of-predicted-sea-level-rise-and-storm-surge-on-coastal-embankments 4/123
III
ABSTRACT
Polder no. 15, 7/1 and 7/2 are situated in Shyamnagar thana, Satkhira in SW zone of
Bangaldesh. The embankments of these polders have been overtopped and breached
during cyclonic storm surge Aila on May 25, 2009.
The present study assesses the performance of the embankments of these polders
during cyclone Aila and the adequacy of the existing embankment height against the
simultaneous impact of sea level rise and storm surge using mathematical model.
Data has been collected from different secondary sources. Embankment data has been
collected from BWDB, Satkhira Zone. Bathymetry data and water level and discharge
data has been collected from IWM. Other data used in this study hs been collected
from other different sources.
In this study the performance of coastal embankments of polder no. 15, 7/1 and 7/2
during the cyclone Aila has been assessed through field visit. It has been found that
these embankments constructed during the 1960s have now been unable to protect the
polders from the impact of storm surge. Climate change and associated sea level rise
will make the embankments more inadequate to resist storm surges.
From mathematical modeling it has been found that embankment height of the polders
selected for this study are not sufficient to resist the simultaneous impact of SLR and
cyclonic storm surge associated with high tide. In this study SIDR has been selected
as cyclonic storm as it is the most devastating than other historical cyclonic storm and
also because the original wind speed of SIDR (225 kmph) corresponds to that of a
cyclone with a return period of 20 years (223 kmph).
According to the 4th IPCC Report if temperature is increased by 4oC wind speed will
be increased by 10%. Thus considering temperature would increase by 4oC in the year
2100 the wind speed of cyclone SIDR has been considered as 248 kmph in
mathematical modeling. The cyclone has been considered to travel along the track of
AILA with 1.5 m SLR at high tide.

7/29/2019 Impact Assessment of Predicted Sea Level Rise and Storm Surge on Coastal Embankments of Some Selected Pold…
http://slidepdf.com/reader/full/impact-assessment-of-predicted-sea-level-rise-and-storm-surge-on-coastal-embankments 5/123
IV
In case of polder no. 15 surge height has been found to be 4.36 m above the crest level
of existing embankment where as in polder no. 7/1 it would be 4.42 m and in polder
no. 7/2 it would be 4.55 m. So it is essential to raise the embankment height with
proper redesign to protect the people and their livelihood inside the polders.
Finally the crest level for the selected polders has been calculated. In case of polder
no. 15 crest level is 9.64 mPWD. Again in case of polder no. 7/1 crest level is 9.8
mPWD and in case of polder no. 7/2 crest level is 9.93 mPWD. In all cases the
suggested crest level is much higher than the existing one and all the suggested height
are for the year 2100 considering 1.5 m sea level rise and normal high tide.
It is extremely important to reconsider the existing coastal infrastructure based on this
and redesign existing coastal embankments to rehabilitate these structures and make it
climate resilient. The risk of sea level rise and cyclonic storm surge are to be
considered for future planning and design of coastal structure. Proper adaptation
measures both structural and non-structural are to be planned in order to find a climate
resilient coastal environment for coastal people and their livelihood security.

7/29/2019 Impact Assessment of Predicted Sea Level Rise and Storm Surge on Coastal Embankments of Some Selected Pold…
http://slidepdf.com/reader/full/impact-assessment-of-predicted-sea-level-rise-and-storm-surge-on-coastal-embankments 6/123
V
Table of Contents
Page No.
Declaration I
Acknowledgement II
Abstract III
Table of Contents V
List of Figures VII
List of Tables X
Abbreviations XI
Chapter 1: Introduction
1.1. General
1.2. Background
1.3. Objectives of the Study
1
4
4
Chapter 2: Literature Review
2.1 General
2.2 Climate Change and Sea Level Rise
2.3 Tropical Cyclones and Storm Surges in Bangladesh
2.4 Coastal Embankment Related Studies
5
5
10
19
Chapter 3: Study Area
3.1 Study Area3.2 Polder 15
3.3 Polder 7/1
3.4 Polder 7/2
2122
24
26

7/29/2019 Impact Assessment of Predicted Sea Level Rise and Storm Surge on Coastal Embankments of Some Selected Pold…
http://slidepdf.com/reader/full/impact-assessment-of-predicted-sea-level-rise-and-storm-surge-on-coastal-embankments 7/123
VI
Chapter 4: Description of Models
4.1 General
4.2 HEC-RAS
4.3 MIKE-21
29
29
38
Chapter 5: Methodology
5.1 Data Collection
5.2 Field Visit
5.3 HEC-RAS 1D Hydrodynamic Modeling
48
51
52
Chapter 6: Results and Discussion
6.1 Performance of coastal embankments of the selected polders during
cyclone AILA
6.2 Adequacy of the existing embankment height
62
70
Chapter 7: Conclusions and Recommendations
7.1 Conclusions
7.2 Recommendations
81
82
References 83
Appendix-A: Streamline Co-ordinates 88
Appendix-B: Cross-Section Data 94
Appendix-C: Flow Hydrographs and Stage Hydrographs 109

7/29/2019 Impact Assessment of Predicted Sea Level Rise and Storm Surge on Coastal Embankments of Some Selected Pold…
http://slidepdf.com/reader/full/impact-assessment-of-predicted-sea-level-rise-and-storm-surge-on-coastal-embankments 8/123
VII
List of Figures
Figure 1.1: Potential impact of sea level rise on Bangladesh 1
Figure 1.2: Coastal Zone of Bangladesh 2
Figure 1.3: Coastal Zone of Bangladesh with polders 3
Figure 2.1: Causes of sea level rise 5
Figure 2.2: Tracks of cyclones 12
Figure 2.3: Number of cyclonic storms landed on Bangladesh coast in
different decades
13
Figure 2.4: Monthly variation of Cyclone during 1960-2007 13
Figure 2.5: Yearly variation of wind speed 14
Figure 2.6: Yearly variation of surge height 14
Figure 2.7: Satellite Image of Cyclone Aila 15
Figure 2.8: Track of Cyclone Aila 16
Figure 3.1: Location of the Study Area on Polder Map 21
Figure 3.2: Typical cross-section of the embankment of Polder 15 22
Figure 3.3: Index Map of Polder 15 23
Figure 3.4: Typical cross-section of the embankment of Polder 7/1 24
Figure 3.5: Index Map of Polder 7/1 25
Figure 3.6: Typical cross-section of the embankment of Polder 7/2 26
Figure 3.7: Index Map of Polder 7/2 27
Figure 3.8: Study Area on Google Earth 28
Figure 4.1: Schematic channel cross-section 31
Figure 4.2: Different Components of HEC-RAS 33
Figure 4.3: Model domain of three nested model 41
Figure 4.4: Calibration against discharge data at North Hatiya during 2006 45
Figure 4.5: Calibration against water level data at Charchenga during 2006 45
Figure 4.6: Validation against discharge data at West Shahbazpur Channel
during December 2007
46
Figure 4.7: Validation against Discharge data at East Shahbazpur Channel
during December 2007
46
Figure 4.8: South-West Region Model 47

7/29/2019 Impact Assessment of Predicted Sea Level Rise and Storm Surge on Coastal Embankments of Some Selected Pold…
http://slidepdf.com/reader/full/impact-assessment-of-predicted-sea-level-rise-and-storm-surge-on-coastal-embankments 9/123
VIII
Figure 5.1: Shape file of river reaches surrounding the study area 50
Figure 5.2: Point theme of study reach 50
Figure 5.3: Attribute table of point theme of study reach 51
Figure 5.4: Steps of HEC-RAS 1D Hydrodynamic Modeling 52
Figure 5.5: Entering streamline co-ordinates 53
Figure 5.6: Editing junction data 54
Figure 5.7: Schematized river system 54
Figure 5.8: Entering cross-section data 55
Figure 5.9: Interpolating cross-section data 56
Figure 5.10: View on Geometric Data Editor after interpolating cross-section
data
56
Figure 5.11: Calibration against water level during 2009 57
Figure 5.12: Different steps of entering boundary conditions and initial flows 58
Figure 5.13: Locations of application of boundary conditions 59
Figure 5.14: Performing Unsteady Flow Simulation 60
Figure 6.1: Illustration of damages to Polder no. 15 due to cyclone AILA 64
Figure 6.2: Illustration of damages to Polder no. 7/1 due to cyclone AILA 65
Figure 6.3: Illustration of damages to Polder no. 7/2 due to cyclone AILA 66
Figure 6.4: Images from the study area during field visit 67
Figure 6.5: Stage Hydrograph at a cross-section around Polder 15 duringSIDR along the track of AILA with 1.5 m SLR and at high tide
71
Figure 6.6: Maximum water level at a cross-section around Polder 15 during
SIDR along the track of AILA with 1.5 m SLR and at high tide
72
Figure 6.7: Detailed output table at a cross-section around Polder 15 during
SIDR along the track of AILA with 1.5 m SLR and at high tide
73
Figure 6.8: Stage Hydrograph at a cross-section around Polder 7/1 during
SIDR along the track of AILA with 1.5 m SLR and at high tide
74
Figure 6.9: Maximum water level at a cross-section around Polder 7/1 during
SIDR along the track of AILA with 1.5 m SLR and at high tide
75
Figure 6.10: Detailed output table at a cross-section around Polder 7/1 during
SIDR along the track of AILA with 1.5 m SLR and at high tide
76
Figure 6.11: Stage Hydrograph at a cross-section around Polder 7/2 during
SIDR along the track of AILA with 1.5 m SLR and at high tide
77

7/29/2019 Impact Assessment of Predicted Sea Level Rise and Storm Surge on Coastal Embankments of Some Selected Pold…
http://slidepdf.com/reader/full/impact-assessment-of-predicted-sea-level-rise-and-storm-surge-on-coastal-embankments 10/123
IX
Figure 6.12: Maximum water level at a cross-section around Polder 7/2 during
SIDR along the track of AILA with 1.5 m SLR and at high tide
78
Figure 6.13: Detailed output table at a cross-section around Polder 7/2 during
SIDR along the track of AILA with 1.5 m SLR and at high tide
79

7/29/2019 Impact Assessment of Predicted Sea Level Rise and Storm Surge on Coastal Embankments of Some Selected Pold…
http://slidepdf.com/reader/full/impact-assessment-of-predicted-sea-level-rise-and-storm-surge-on-coastal-embankments 11/123
X
List of Tables
Table 2.1: Change in MSL in different tidal water level stations 7
Table 2.2: Trend of tidal level in three coastal stations of Bangladesh 8
Table 2.3: List of most vulnerable countries to cyclone 10
Table 2.4: List of major cyclones from 1960 to 2007 11
Table 2.5: Monthly variation of cyclone from the year 1960 to 2007 14
Table 2.6: Damages to Infrastructure by Cyclone Aila 16
Table 2.7: Cyclone Wind Speeds 17
Table 2.8: Design Surge Heights 17
Table 2.9: Embankments under CEP 20
Table 4.1: Model grid specification 42
Table 4.2: Relative grid positions 42
Table 4.3: Land-water data used for generating the bathymetry 42
Table 4.4: Manning number distribution 43
Table 4.5: Tidal constituents for Vishakhapatnam and Gwa Bay 44
Table 5.1: Survey period of collected cross-section data 48
Table 5.2: Scenario for model simulation 57
Table 6.1: Damages to the selected polders due to cyclone Aila 62
Table 6.2: Maximum water level around individual polders 70
Table 6.3: Design crest level of the embankments of selected polders 80

7/29/2019 Impact Assessment of Predicted Sea Level Rise and Storm Surge on Coastal Embankments of Some Selected Pold…
http://slidepdf.com/reader/full/impact-assessment-of-predicted-sea-level-rise-and-storm-surge-on-coastal-embankments 12/123
XI
Abbreviations
BBS Bangladesh Bureau of Statistics
BMD Bangladesh Meteorological Department
BoB Bay of Bengal
BoBM Bay of Bengal Model
BUET Bangladesh University of Engineering and Technology
BWDB Bangladesh Water Development Board
CEGIS Center for Environmental and Geographic Information Services
CEP Coastal Embankment Project
CERP Coastal Embankment Rehabilitation Project
CPP Coastal Protection Project
CZPo Coastal Zone Policy
DMB Disaster Management Bureau
EPWAPDA East Pakistan Water and Power Development Authority
FAP Flood Action Plan
HEC-RAS Hydrologic Engineering Center-River Analysis System
IPCC Intergovernmental Panel on Climate Change
IUCN International Union for Conservation of Nature
IWM Institute of Water Modelling
JTWC Joint Typhoon Warning Center
MSL Mean Sea Level
NAPA National Adaptation Program of Action
OECD Organization for Economic Co-operation and Development
PWD Public Work Datum
RSMC Regional Specialized Meteorological Center
SLR Sea Level Rise
SMRC SAARC Meteorogical Research Centre
SWMC Surface Water Modelling CenterUNDP United Nations Development Programme
UNEP United Nations Environment Programme
WARPO Water Resources Planning Organization
WMO World Meteorological Organization

7/29/2019 Impact Assessment of Predicted Sea Level Rise and Storm Surge on Coastal Embankments of Some Selected Pold…
http://slidepdf.com/reader/full/impact-assessment-of-predicted-sea-level-rise-and-storm-surge-on-coastal-embankments 13/123
1
CHAPTER 1
INTRODUCTION
1.1 General
Climate change is an important issue nowadays. Due to various human activities,
carbon dioxide (CO2) and other greenhouse gases are accumulated in the earth’s
atmosphere. The ultimate result is global warming, i.e. climate change. Rising
temperature in the atmosphere causes sea level rise. Sea level rise affects low lying
coastal areas and deltas of the world. Bangladesh is highly vulnerable to sea level rise,
as it is a densely populated low-lying coastal country of extremely gentle slope
comprising broad and narrow ridges and depressions (Brammer et al., 1993). The
World Bank (2000) estimates a 10 cm, 25 cm and 1 m rise in sea level by 2020, 2050
and 2100 respectively. This rise would inundate 2%, 4% and 17.5% of the total land
mass of the country. Milliman et al. (1989) reported a sea level rise in Bangladesh of
1.0 cm per year. According to the Synthesis Report of Copenhagen Summit on March
2009 maximum sea level rise (SLR) will be 0.5-1.5 m by the year 2100. Figure 1.1
illustrates the potential impact of 1.0 m and 1.5 m sea level rise on Bangladesh.
Figure: Potential Impact of Sea Level Rise on Bangladesh
Land submerged -22,000 sq. km.
People affected-18 million
1.5 meter sea level rise
BAY OF
BENGAL
Actual sea levelLand submerged -17,000 sq. km.
People affected-15 million
BAY OF
BENGAL1 meter sea level rise
Land submerged – 17,000 sq. km.People affected – 15 million
1.5 meter sea level rise
Land submerged – 22,000 sq. km.
People affected – 18 million
Figure 1.1: Potential impact of sea level rise on Bangladesh
1 meter sea level rise

7/29/2019 Impact Assessment of Predicted Sea Level Rise and Storm Surge on Coastal Embankments of Some Selected Pold…
http://slidepdf.com/reader/full/impact-assessment-of-predicted-sea-level-rise-and-storm-surge-on-coastal-embankments 14/123
2
The southern part of Bangladesh is connected to the Bay of Bengal through a 710 km
of coastline (CZPo, 2005). The coastal area of Bangladesh consists of 19 districts
comprising 147 upazilas (CZPo, 2005). Total area of the coastal zone is 47,201 sq. km
which is 32 % of the total landmass of the country (Islam, 2004, p. xvii). A total of 48
upazilas in 12 districts that are exposed to the sea and/or lower estuaries are defined
as the exposed coast and the remaining 99 upazilas of the coastal districts are termed
as interior coast. The total population living in the coastal zone is 35.1 million, i.e. 28
% of the total population of the country (BBS, 2003). Population density in the
exposed coast is 482 persons per sq km as opposed to 1,012 for the interior coast.
Average population density of the zone is 743 per sq km, compared with the national
average of 839.
Figure 1.2: Coastal Zone of Bangladesh (Source: Islam, 2004)
The coastal region is marked by morphological dynamic river network, sandy beaches
and estuarine system. The interaction of huge fresh water and sediment load coming
from the upstream and saline waterfront penetrating inland from the sea are the main
features of the coastal area. . Almost one third of the landmass lies within the 4 m
contour line. These vast areas of low-lying land are threatened by different levels of
sea level rise.

7/29/2019 Impact Assessment of Predicted Sea Level Rise and Storm Surge on Coastal Embankments of Some Selected Pold…
http://slidepdf.com/reader/full/impact-assessment-of-predicted-sea-level-rise-and-storm-surge-on-coastal-embankments 15/123
There are approximately
12,80,479 ha of land are
2001). Polders are low-l
that forms an artificial h
water other than through
from the mid-sixties to
Development Board (B
Development Authority
flooding and saline wa
without any consideratio
the normal tide only but
of all these polders vari
coastal embankment is a
Figure 1.3: Coa
3
123 polders in the coastal area. These polders
a under 11 coastal districts comprising 58 upa
ing tract of land enclosed by embankments kn
drological entity meaning it has no connectio
manually operated devices. These polders wer
he mid seventies of the 20th
century by Bang
DB) and its predecessor, East Pakistan Wat
(EPWAPDA) to protect the land from tidal
ter intrusion in order to increase agricultur
of safety against cyclonic surges. These polde
cannot resist storm surge height. Height of the
es between 3 m to 7 m (IWM, 2005). The t
out 5017 km (BWDB 2001).
tal Zone of Bangladesh with polders (Source: I
re protecting
zilas (BWDB,
own as dikes
with outside
e constructed
ladesh Water
r and Power
and monsoon
l production
rs can protect
embankment
tal length of
M)

7/29/2019 Impact Assessment of Predicted Sea Level Rise and Storm Surge on Coastal Embankments of Some Selected Pold…
http://slidepdf.com/reader/full/impact-assessment-of-predicted-sea-level-rise-and-storm-surge-on-coastal-embankments 16/123
4
1.2 Background
Bangladesh is widely recognized to be one of the most vulnerable countries of the
world to climate change and associated sea level rise. The country also experiences
frequent natural disasters such as tropical cyclones, storm surges and floods, which
cause loss of life, damage to infrastructure and economic assets. One of the most
devastating cyclones that recently hit Bangladesh is AILA. Cyclone AILA hit the
south-western coast of Bangladesh on May 25, 2009. A storm surge of 3 m (10 ft)
impacted western regions of Bangladesh, submerging numerous villages. Several
rivers broke through embankments, causing widespread inland flooding
(www.wikipedia.com). Torrential rains from AILA resulted in at least 190 fatalities
from flooding ( DMB, 2009).
According to IPCC’s Fourth Assessment Report (IPCC, 2007) the frequency and
intensity of such severe cyclones will increase by the year 2100 due to climate
change. Moreover, IWM and CEGIS (2007) have studied that about 13 polders will
be overtopped by the year 2080 due to sea level rise. Damages by cyclone AILA
indicates to the fact that the embankments of the polders which are designed to protect
the polders from tidal flooding only require design modification to protect the polders
from the effect of sea level rise and cyclonic storm surges.
This study will assess the susceptibility of the country’s coastal infrastructure to the
effects of sea level rise and cyclonic storm surges. Mathematical model will be
applied to assess the impact of sea level rise with cyclonic storm surge on coastal
embankments of some selected polders. Focus will be on the embankment height.
1.3 Objectives of the study
The objectives of the study have been described as follows:
• To assess the performance of coastal embankments of some selected polders
during cyclone AILA.
• To assess the adequacy of existing embankment height of selected polders
against the simultaneous impact of predicted sea level rise and storm surge
using mathematical model.
• To propose modification of crest level of the coastal embankments.

7/29/2019 Impact Assessment of Predicted Sea Level Rise and Storm Surge on Coastal Embankments of Some Selected Pold…
http://slidepdf.com/reader/full/impact-assessment-of-predicted-sea-level-rise-and-storm-surge-on-coastal-embankments 17/123
5
CHAPTER 2
LITERATURE REVIEW
2.1 General
The coastal region of Bangladesh is prone to multi-hazard threats such as cyclones,
storm surges, floods, earthquakes, tsunamis, and above all, climate change.
Bangladesh has been also identified as one amongst 27 countries, which are the most
vulnerable to the impacts of global warming induced accelerated sea level rise.
Several studies have been carried out all over the world to see the impact of climate
change, sea level rise and climate change induced cyclonic surge in the near future
and the possible adaptations against it. In this chapter some previous studies have
been reviewed which are related to the present study.
2.2 Climate Change and Sea Level Rise
The dominant factor for climate change is the increase in concentration of various
gases (CO2, CH4, N2O etc.) in the atmosphere. Rising temperature expands the ocean
volume in two ways. Firstly, it melts the mass volume of ice in the polar region and
secondly, it causes thermal expansion of the oceans. The human factor mainly
responsible for global warming and sea level rise is the burning of fossil fuels.
Deforestation is another human activity, responsible for decreasing the CO2 sink.
Figure 2.1: Causes of sea level rise (Source: IPCC, 2001)

7/29/2019 Impact Assessment of Predicted Sea Level Rise and Storm Surge on Coastal Embankments of Some Selected Pold…
http://slidepdf.com/reader/full/impact-assessment-of-predicted-sea-level-rise-and-storm-surge-on-coastal-embankments 18/123
6
The Intergovernmental Panel on Climate Change (IPCC)’s periodic assessments of
the causes, impacts and possible response strategies to climate change are the most
comprehensive and up-to-date reports available on this subject. IPCC, established
under World Meteorological Organization (WMO) and United Nations Environment
Program (UNEP), has published four assessment reports till now (2010) namely the
First Assessment Report (FAR, 1990), the Second Assessment Report (SAR, 1995),
the Third Assessment Report (TAR, 2001) and the Fourth Assessment Report (AR4,
2007).
In the First Assessment Report, IPCC estimated that global temperature would
increase by 1oC by the year 2050 and 2
oC by the year 2100 and sea level rise would
be 107 cm by the year 2100 considering the year 1990 as baseline (IPCC, 1990).
In the Second Assessment Report, it is projected that the average surface temperature
would increase by 1oC to 3.5
oC and the sea level would rise by 15 to 95 cm
respectively over the period 1990 to 2100 (IPCC, 1995).
In the Third Assessment Report, the average surface temperature is projected to
increase by 1.4oC to 5.8
oC over the period 1990 to 2100 and the sea level is projected
to rise by 9 to 88 cm over the same period (IPCC, 2001). National Adaptation
Program of Action (NAPA, 2005) has predicted the sea level rise for Bangladesh
based on IPCC’s Third Assessment Report (TAR, 2001) and stated that SLR for the
year 2030, 2050 and 2100 would be 14 cm, 32 cm and 88 cm respectively with
respect to the year 1990.
In the Fourth Assessment Report, it has been projected that global sea level rise and
temperature increase between 2090 and 2100 would be 18 to 59 cm and 1.1oC to
6.4oC respectively with respect to the year 1980-1999. The report has also shown that
the frequency and intensity of severe storm, rainfall intensity and drought will
increase dramatically (IPCC, 2007).
Again, according to the Synthesis Report of Copenhagen Summit on March 2009
maximum sea level rise will be 0.5-1.5 m by the year 2100 (Richardson et al, 2009).

7/29/2019 Impact Assessment of Predicted Sea Level Rise and Storm Surge on Coastal Embankments of Some Selected Pold…
http://slidepdf.com/reader/full/impact-assessment-of-predicted-sea-level-rise-and-storm-surge-on-coastal-embankments 19/123
7
2.2.1 Global Sea Level Rise
Global sea level has risen by 10 to 25 cm over the past 100 years and much of the rise
may be related to the increase in global mean temperature (IPCC, 2007). A study by
Church et al. (2004) found a sea level rise of 1.8±0.3 mm per year over a 51 year
period (1950-2000). Church & White (2006) estimated a sea level rise from January
1870 to December 2004 of 195 mm, a 20th century rate of sea level rise of 1.7±0.3
mm per year and a significant acceleration of sea level rise of 0.013±0.006 mm per
year. With this constant rate of acceleration, sea level rise from 1990 to 2100 would
range from 280 to 340 mm.
2.2.2 Sea Level Rise in Bangladesh
Matin (2008) in his report published for IUCN analyzed water level data of 13 coastal
stations of BWDB covering the whole coastal area from west to east using the
measured data of last 21 years to observe the sea level rise trend. Change of MSL for
all stations has been presented in Table 2.1. It has been found that 9 out of 13 stations
show increasing tendency of MSL. So it is an indication of sea level rise in the coastal
area of Bangladesh.
Table 2.1: Change in MSL in different tidal water level stations
River Station ID Station Change of MSL (mm/yr)
Ichamati (Western border) SW130 Kaikhali 10.50
Pussur SW244 Mongla 10.90
Alipur Khal Doratana SW1 Bagerhat 6.20
Baleswa SW107.2 Rayenda 3.70
Bishkhali SW39 Patharghata 15.70
Buriswar SW20 Amtali 4.5
Lower Meghna SW279 Tajumuddin 30.00
Hatiya SW321 Hatiya -1.80
Feni SW87 Sonapur 49.80
Sangu SW248 Dohazari -2.10
Matamuhuri SW204 Chiringa 20.70
Kutubdia Channel SW176 Lemsikhali -8.20
Moheskhali Channel SW200 Saflapur -6.20

7/29/2019 Impact Assessment of Predicted Sea Level Rise and Storm Surge on Coastal Embankments of Some Selected Pold…
http://slidepdf.com/reader/full/impact-assessment-of-predicted-sea-level-rise-and-storm-surge-on-coastal-embankments 20/123
8
Singh et al. (2000) analyzed the tidal level in Hiron Point, Char Changa and Cox’s
Bazar based on the tidal gauge record of the period 1977-1998. All three stations
showed increasing tendency of tidal level. Table 2.2 represents the trend of tidal
levels in these stations.
Table 2.2: Trend of tidal level in three coastal stations of Bangladesh
Tidal
Station
Region Latitude
(N)
Longitude
(E)
Datum
(m)
Trend
(mm/yr)
Hiron Point Western 21o48’ 89
o28’ 3.784 4.0
Char Changa Central 22o08’ 91
o06’ 4.996 6.0
Cox’s Bazar Eastern 21o26’ 91
o59’ 4.836 7.8
(Source: Singh et al., 2000, SMRC Report No. 3)
Two estimates for potential future sea level rise in Bangladesh prior to the projection
of NAPA (2005) are 0.3-1.5 m and 0.3-0.5 m for the year 2050 considering the year
1990 as baseline. Besides ice melting and thermal expansion, area specific land
subsidence and uplifting is a contributory factor to the sea level rise in Bangladesh.
The Ganges and the Brahmaputra deliver approximately 1.6 billion tons of sediment
annually to the face of Bangladesh (Broadus, 1993). These sediments compensate for
the natural compaction and subsidence of the delta and keep its size relatively stable.
Sediment replenishment is considered to balance the subsidence of the delta that
results in a net sea level rise (Agrawala et al., 2003, p. 15).
Studies from OECD (2003) shows that, due to a rise of 100 cm in the sea level,
Bangladesh would face a catastrophic situation, including permanent inundation of
about 15-18% of its low-lying coastal areas, loss of different species in the
Sundarbans, displacements of over 10 million people, loss of vulnerable agricultural
land and extension of salinity intrusion further inland. Hasan (2008) (Ref. no. 15) in
his study estimated that due to 27 cm sea level rise brackish water area will be
increased by 6% and due to 62 cm sea level rise, brackish water area will be increased
by 9%. It is also estimated that for the base condition (2005), about 6.0 million people
are already exposed to high salinity (>5 ppt), which will be increased to 13.6 million
by the year 2050 and 14.8 million by the year 2080.

7/29/2019 Impact Assessment of Predicted Sea Level Rise and Storm Surge on Coastal Embankments of Some Selected Pold…
http://slidepdf.com/reader/full/impact-assessment-of-predicted-sea-level-rise-and-storm-surge-on-coastal-embankments 21/123
9
BUET (2008) carried out project on preparation of Look–up Table and generation of
PRECIS scenarios for Bangladesh. In this study a regional climate modeling system
called PRECIS (Providing Regional Climate for Impact Studies) is used to generate
projection for rainfall and temperature using SAES A2 emission scenario. Projected
annual rainfall obtained are 6.93, 6.84 and 7.17 mm/d in 2030, 2050 and 2070
respectively whereas the baseline (1961-1990) rainfall is 6.78 mm/d. The important
notice is that in Bangladesh monsoon and post monsoon rainfall will increase whereas
dry season rainfall will be remaining closer to historical amount. Monthly average
maximum temperature will change from -1.2 to +4.7oC in 2030, from -1.2 to +2.5
oC
in 2050 and from -1.20 to +3.0oC in 2070. On the other hand monthly average
minimum temperature will increase in all period and vary from 0.3 to 2.4oC in 2030.
A Look–up Table has been prepared to obtain the project rainfall and temperature
(maximum and minimum), firstly in reference to the observed data during baseline
period 1961-1990. Using the prepared Look-up table PRECIS generated scenarios
was validated for 1989, 1990, 2000 and 2001. Validation was found significant at
99% level. Through validation a projection factor for each parameter is obtained
which is employed in preparing projected rainfall and temperature.
IWM (2005) has made a detailed impact assessment of sea level rise on inundation,
drainage congestion, salinity intrusion and change of surge height in the coastal zone
of Bangladesh. The potential effect of climate change were studied for different sea
level rise i.e. 14 cm, 32 cm and 88 cm for the projected years 2030, 2050 and 2100.
Mathematical models of the Bay of Bengal have been used to transfer the sea level
rise in the deep sea along the southwest region river and Meghna Estuary. The study
shows that about 11% more area (4107 km) will be inundated due to 88 cm sea level
rise in addition to the existing (year 2000) inundation area under the same upstream
flow. The 5 ppt saline front moves landward remarkably for sea level rise of 88 cm.
About 84% of the Sundarbans area becomes deeply inundated due to 32 cm sea level
rise and for 88 cm sea level rise Sundarbans will be completely lost. Due to 32 cm sea
level rise surge height increase in the range of 5% to 15% in the eastern coast. It also
observes that 10% increase in wind speed of 1991 cyclone along with 32 cm sea level
rise would produce 7.8 m to 9.5 m high storm near Kutubdia- Cox’s Bazar coast.

7/29/2019 Impact Assessment of Predicted Sea Level Rise and Storm Surge on Coastal Embankments of Some Selected Pold…
http://slidepdf.com/reader/full/impact-assessment-of-predicted-sea-level-rise-and-storm-surge-on-coastal-embankments 22/123
10
2.3 Tropical Cyclones and Storm Surges in Bangladesh
The coastal area of Bangladesh is always vulnerable to cyclone-induced storm surge.
There are mainly three reasons behind it. The first one is that the continental shelf is
long and shallow and the funnel shape of the coast tends to concentrate and amplify
the surge in the northern part of the Bay. Secondly the coastal zone is low-lying with
62% of the land have an elevation of up to 3 meters and 86% up to 5 meters from the
mean sea level (IWM, 2009). The third reason is that the coastal area is densely
populated (Total Population: 35.1 million, Average population density: 743 per sq
km; Source: BBS, 2003). UNDP has identified Bangladesh to be the most vulnerable
country in the world to tropical cyclones.
Table 2.3: List of most vulnerable countries to cyclone
Rank Country Deaths/100000 people exposed to cyclone
1 Bangladesh 32.1
2 India 20.2
3 Philippines 8.3
4 Honduras 7.3
5 Vietnam 5.5
6 China 2.8
(Source: UNDP, 2004)
About one-tenth of the global total cyclones forming in different regions of the tropics
occur in the Bay of Bengal. About one-sixth of the tropical storms generated in the
Bay of Bengal usually hit the Bangladesh coast. Historical record shows that more
than 15 severe cyclones are generated in the Bay of Bengal in every ten years. During
1960-2007 about 18 severe cyclones hit the coast of Bangladesh (IWM, 2009). During
the period 1582 to 1997 there were 82 cyclones that devastated the coastline of
Bangladesh (Jacobson et al. 2006). These cyclones originated mainly in Indian Ocean
or Bay of Bengal generally form in the months just before and after the monsoon and
typically move to north to northeastern direction towards the land (SMRC, 1998). It is
seen that the eastern coast experiences maximum inundation between 4-6 m and
western coast experiences inundation within the range of 3-5 m (IWM, 2009).

7/29/2019 Impact Assessment of Predicted Sea Level Rise and Storm Surge on Coastal Embankments of Some Selected Pold…
http://slidepdf.com/reader/full/impact-assessment-of-predicted-sea-level-rise-and-storm-surge-on-coastal-embankments 23/123
11
Table 2.4 represents the cyclones and associated maximum wind speeds and surge
heights since 1960. Figure 2.2 illustrates the tracks of the cyclones.
Table 2.4: List of major cyclones from 1960 to 2007
Year Time Storm surge (m) Wind (kmph) Zone
1960 9-Oct 6 129 Meghna estuary
1960 30-Oct 4.2 210 Chittagong coast
1961 9-May 9 145 Meghna estuary
1961 27-May 7 145 Chittagong-Noakhali coast
1962 26-Oct 5.8 200 Feni-Chittagong Coast
1963 28-May 5 203 Noakhali-Cox's Bazar Coast
1963 5-Jun 3.1 135 Sunderban
1963 25-Oct 2.2 105 Teknaf
1965 10-May 4 161 Barisal-Chittagong coast
1965 31-May 7.1 162 Chittagong Coast
1965 14-Dec 4 210 Cox's Bazar-Teknaf coast
1966 10-Oct 7 145 Chittagong and Sandwip
1967 11-Oct 3 160 Sunderban-Noakhali coast
1967 23-Oct 2 130 Chittagong-Cox's Bazar coast
1970 5-May 2.3 148 Chittagong-Teknaf coast
1970 12-Nov 9 222 Khulna-Chittagong coast
1971 16-Nov 1 110 Sunderban coast
1973 29-Nov 3.5 165 Chittagong coast1973 9-Dec 7.5 122 Sundarban-Patuakhali coast
1974 28-Nov 5 161
Cox's Bazar-Chittagong-
offshore
1983 9-Nov 3 136 Chittagong-Teknaf coast
1985 25-May 4.5 154 Noakhali-Cox's Bazar coast
1988 29-Nov 3.5 160 Sundarban
1990 18-Dec 2 115 Cox's Bazar coast
1991 29-Apr 7.5 225 Patuakhali-Cox's Bazar coast
1991 May 1.9 90
Cox's Bazar-Chittagong-
offshore1994 April 4 210 Cox's Bazar
1997 May 3 220 Chittagong-Cox's Bazar coast
1997 Sep 3 150 Chittagong-Cox's Bazar coast
1998 Nov 2.4 100 Khulna, Barishal & Patuakhali
2007 15-Nov 8 225 Khulna, Barishal & Patuakhali
(Source: BMD)

7/29/2019 Impact Assessment of Predicted Sea Level Rise and Storm Surge on Coastal Embankments of Some Selected Pold…
http://slidepdf.com/reader/full/impact-assessment-of-predicted-sea-level-rise-and-storm-surge-on-coastal-embankments 24/123
12
Figure 2.2: Tracks of cyclones (Source: CEGIS)

7/29/2019 Impact Assessment of Predicted Sea Level Rise and Storm Surge on Coastal Embankments of Some Selected Pold…
http://slidepdf.com/reader/full/impact-assessment-of-predicted-sea-level-rise-and-storm-surge-on-coastal-embankments 25/123
13
A decade wise and month wise distribution of cyclones are presented in Figure 2.3
and Figure 2.4 respectively. These figures illustrate that 1960s decade can be
recognized for receiving maximum number of cyclones in the Bay of Bengal and that
pre-monsoon and post-monsoon cyclones are in appearance.
Figure 2.3: Number of cyclonic storms landed on Bangladesh coast in different
decades (Source: BMD)
Figure 2.4: Monthly variation of cyclone during 1960-2007(Source: BMD)
Monthly Variation of Cyclone(1990-2000)Jan
Feb
Mar
Apr
May
Jun
Jul
Aug
Sep
Oct
Nov
Dec
Monthly Variation of Cyclone (1960-2007)

7/29/2019 Impact Assessment of Predicted Sea Level Rise and Storm Surge on Coastal Embankments of Some Selected Pold…
http://slidepdf.com/reader/full/impact-assessment-of-predicted-sea-level-rise-and-storm-surge-on-coastal-embankments 26/123
14
Table 2.5 represents the monthly variation in number of cyclones to hit the
Bangladesh coast from the year 1960 to 2007.
Table 2.5: Monthly variation of cyclone from the year 1960 to 2007
Month Jan Feb Mar Apr May Jun Jul Aug Sep Oct Nov Dec
Cyclone(s) 0 0 0 2 9 1 0 0 1 7 8 3
(Source: BMD)
A yearly variation of wind speed and surge height of cyclones to hit the coast of
Bangladesh during the period 1960-2007 are presented in Figure 2.5 and Figure 2.6
respectively.
Figure 2.5: Yearly variation of wind speed (Source: BMD)
Figure 2.6: Yearly variation of surge height (Source: BMD)
Yearly Variation of Surge Height
0
1
2345
678
910
1 9 6 0
1 9 6 1
1 9 6 2
1 9 6 3
1 9 6 5
1 9 6 5
1 9 6 7
1 9 6 9
1 9 7 0
1 9 7 3
1 9 7 4
1 9 8 5
1 9 9 0
1 9 9 2
1 9 9 7
1 9 9 8
Year
S u r g e H e i g h t ( m )
Yearly Variation of Wind Speed
0
50
100
150
200
250
1950 1960 1970 1980 1990 2000 2010
Year
Wind
Speed
(km/h)

7/29/2019 Impact Assessment of Predicted Sea Level Rise and Storm Surge on Coastal Embankments of Some Selected Pold…
http://slidepdf.com/reader/full/impact-assessment-of-predicted-sea-level-rise-and-storm-surge-on-coastal-embankments 27/123
15
2.3.1 Cyclone AILA
Cyclone AILA (RSMC Designation: BOB02, JTWC Designation: 02B) is one of the
historical tropical cyclones to hit the coast of Bangladesh. It was the second tropical
cyclone to form within the Northern Indian Ocean during 2009. The disturbance that
was to become Cyclone AILA formed on 21 May 2009 about 950 kilometers (590
miles) to the south of Kolkata, India. Over the next couple of days the disturbance
slowly developed before a Tropical Cyclone Formation Alert was issued by JTWC
early on 23 May 2009 and being designated as a depression by RSMC New Delhi as
Depression BOB 02. Depression BOB02 continued to intensify slowly until early the
next day when it was upgraded to a Deep Depression by RSMC New Delhi, and
designated as Tropical Cyclone 02B by the JTWC. Later that day, RSMC New Delhi
reported that the deep depression had intensified into a Cyclonic storm and had been
named as AILA whilst located about 350 kilometers (220 miles) to the southeast of
Sagar Island. AILA became a severe cyclonic storm at 12 pm local time on May 25
and made landfall at its peak intensity between 2 pm and 3 pm on that day. Highest
wind speed of Cyclone AILA was 120 km/hr (1-minute sustained) and lowest
pressure was 96.8 kPa. (www.wikipedia.org). Figure 2.7 and Figure 2.8 represent the
satellite image and the track of Cyclone Aila respectively.
Figure 2.7: Satellite Image of Cyclone AILA (Source: Wikipedia)

7/29/2019 Impact Assessment of Predicted Sea Level Rise and Storm Surge on Coastal Embankments of Some Selected Pold…
http://slidepdf.com/reader/full/impact-assessment-of-predicted-sea-level-rise-and-storm-surge-on-coastal-embankments 28/123
Figure 2.8
More than 400,000 peop
severe flooding in coas
completely submerged i
infrastructure by Cyclon
Table 2.6: Damages to In
Road (km)
Full Parti
2233 6621
(Source: DMB, 2009)
16
: Track of Cyclone AILA (Source: Wikipedia)
le were reportedly isolated and at least 190 pe
al regions of Bangladesh. Numerous village
n floodwaters or destroyed. A summary of
AILA has been presented in Table 2.6.
frastructure by Cyclone AILA
Embankment (km) Bridg
l
1742.53
ple killed by
were either
damages to
/Culvert
157

7/29/2019 Impact Assessment of Predicted Sea Level Rise and Storm Surge on Coastal Embankments of Some Selected Pold…
http://slidepdf.com/reader/full/impact-assessment-of-predicted-sea-level-rise-and-storm-surge-on-coastal-embankments 29/123
17
2.3.2 Past Studies on Tropical Cyclone and Storm Surges
The "Multipurpose Cyclone Shelter Programme" (MCSP) made a very thorough
analysis of various aspects of the generation of cyclone surges and its penetration in-
land, and introduced a number of important statistical considerations to take into
account when studying surge heights for engineering purposes. Ultimately it was
decided to base the design surge heights on an empirical formula by Reid that relates
surge height to the cyclone wind speed and the length of the continental shelf. The
yearly maximum wind speed (anywhere in the Bay) was analyzed statistically using
Reid's formula resulting in a relationship between return period and wind speed as
showed in Table 2.7.
Table 2.7: Cyclone Wind Speeds
Return Period
(years)5 10 20 25 50 100
Wind Speed (km/h) 165 195 223 233 261 289
(Source: BMD)
The High Risk Area (HRA) was defined as any area having experienced flooding of
one meter or more. The design flood depth within the area was subsequently
determined by linear interpolation between the one meter on the landward boundary
and the height of the surge plus spring tide at the coast are shown in Table 2.3.
Table 2.8: Design Surge Heights
Return Period 20 50 100
Wind Speed (m/s) 223 261 289
Region Surge Height (m) Length of shelf (km)
Teknaf-Cox's Bazar 2.7 3.7 4.5 140Cox's Bazar-Chittagong 4.3 5.8 7 230
Chittagong-Bhola 4.8 6.5 7.8 260
Bhola-Barguna 3.8 5.1 6.2 200
Barguna-Khulna 3.1 4.3 5.2 160
(Source: Banglapedia)

7/29/2019 Impact Assessment of Predicted Sea Level Rise and Storm Surge on Coastal Embankments of Some Selected Pold…
http://slidepdf.com/reader/full/impact-assessment-of-predicted-sea-level-rise-and-storm-surge-on-coastal-embankments 30/123
18
Shahadat (2000) used a numerical 2-dimensional hydrodynamic model to simulate
1876 cyclonic surge. “Bakerganj cyclone”, which crossed the outskirts of the then
Bakerganj area in Bangladesh on November 1, 1876, has been classified as greatest
natural catastrophe ever experienced in Bangladesh. The maximum surge residual,
obtained from the model, is close to the recorded information of BMD. The
sensitivity analyses for four different conditions prove that during cyclone time,
wind speed determine the surge height while cyclonic pressure is far less important.
Ali (1997) in his study studied the interaction among river discharge, storm surges
and tides in the Meghna river estuary in Bangladesh using a two-dimensional
vertically integrated numerical model of the northern Bay of Bengal. River discharge
and tidal flow across the river mouth act both positively and negatively depending on
the tidal phase, positively during high tide and negatively during low tide. This is also
true for the combination of all three forces .On the other hand, in the most of the
crisis, river discharge acts in opposition to the storm surge. Under certain conditions
and on rare occasions thy acts positively. The interactions between river discharge
and storm surge, depend on their relative magnitudes. In respect of total elevation in
the estuarial region, river discharge tends to increase the surge height. However, away
from estuary, the effect of river discharge is hardly discernible.
As-Salek (2001) in his study found that in general the tide-surge interaction in the
Meghna estuary shows a progressive wave nature of the local tide. If the peak of the
maximum surge coincides with the tidal peak near the landfall, the surge propagates
toward the north faster than when the surge peak coincides with the tidal trough.
Cyclone that make landfall before the arrival of the tidal peak produce higher but
shorter duration surges than those that make landfall after the arrival of the tidal peak.
If the rainfall time of the cyclone is kept fixed, the surge peaks are found to arrive
earlier with the increase in the propagation speed of the cyclone and with the decrease
of radius of the maximum cyclone wind. The arrival time of maximum peak surge in
the northernmost estuary may be delayed by about 3-4 hr the arrival time in the
southern landfall point.

7/29/2019 Impact Assessment of Predicted Sea Level Rise and Storm Surge on Coastal Embankments of Some Selected Pold…
http://slidepdf.com/reader/full/impact-assessment-of-predicted-sea-level-rise-and-storm-surge-on-coastal-embankments 31/123
19
Hasan and Navera (2009) estimated the potential impacts of climate change induced
cyclonic storm surge on selected islands of Bangladesh namely Sandwip and Hatiya.
The study estimates that SIDR is the most devastating cyclone considering wind
speed. It also shows that the wind speed is increasing gradually from historical wind
speed data. Two different local models were made for two islands and SIDR track
considering high tide was used to assess the impact on those islands. Again three
different tracks were taken for these two islands one is to the north, one is to the
middle and one is to the south. It was found that if the cyclone crosses to the north of
island it creates most devastation. Model result shows that if SIDR type cyclone
comes with SLR 0.59 m and 1.0 m during high tide maximum surge height will be 6.5
m and 6.82 m for Sandwip Island and 9.2 m and 9.5 m for Hatiya Island respectively.
According to the 4th
IPCC report, if temperature is increased by 4oC wind speed will
be increased by 10%. If the same cyclone comes with 10% increased wind speed
during high tide with 59 cm SLR then surge height may increase by 0.9 m for both the
islands. Adaptation measures such as mangrove afforestation, cyclone shelter and
embankment height were also analyzed in this study. From the model result it has
been found that mangrove afforestation of 400 m and 600 m width will reduce surge
height by 15 cm and 20 cm where as it reduces current speed to one-third.
2.4 Coastal Embankment Related Studies
In 1960, the then East Pakistan Water and power Development Board (EPWAPDA)
launched a project named `Coastal Embankment Project' to increase crop production
through protection of agricultural lands from saline water inundation during normal
high tides. This project covered 13765 sq. km area of which 71% were agricultural
lands. The project extended from the Haribhanga River near India border to the border
Makam south tip of Bangladesh stretching along the 710 km shoreline.
Three types of embankments exist in the coastal area of Bangladesh. Larger
embankments are situated along the sides of Bay of Bengal and major rivers where
high waves and current are expected. Interior embankments are along the bank of
rivers where moderate waves and current persist. Marginal embankments are provided
along the bank of small rivers and streams of minor waves and current.

7/29/2019 Impact Assessment of Predicted Sea Level Rise and Storm Surge on Coastal Embankments of Some Selected Pold…
http://slidepdf.com/reader/full/impact-assessment-of-predicted-sea-level-rise-and-storm-surge-on-coastal-embankments 32/123
20
The embankments have dimensional variations in height, width, slopes, according to
their purposes. For the selection of embankment height, annual maximum water levels
between 1960 and 1968 were analyzed, and a 20 year return period maximum water
level during monsoon was used.
Table 2.9: Embankments under CEP
Embankment
Type
Sea side
slope
Country
Side slope
Crest
Width
(m)
Crest
Level (m)
Set back
distance
(m)
Sea dike 1: 7 1:2 4.27 x + 1.52 76
Interior dike 1 : 3 1:2 4.27 x + 0.91 53
Mar inal dike 1:2 1:2 2.44 x + 1.52 38
x is the design flood level(Source: BWDB)
Materials from borrow-pits along the sides of the embankments were used for
embankment construction. Sands and organic materials were avoided. A blanket of
cohesive earth over the embankment was provided to encourage good Turfing and to
prevent surface erosion where the embankment materials are not of good condition.
The inner slopes and crest levels of all types of embankments were protected from
erosion, due to rainfall, with the use of grass mat. Depending on the purpose, there is
a variation in the sea or river facing slope protection work from wave and current
erosion.
CPP-II (1992) proposed for repair and rehabilitation of the sea facing embankment of
23 selected polders and also proposed for redesign of those embankments considering
possible overtopping by a 20 year return period cyclonic storm. Second Coastal
Embankment Rehabilitation Project (BWDB, 2001) prepared a development for the
entire Coastal Embankment System and a prioritized 5-year investment programme
and also prepared detailed design for a number of polders. The performance of the
existing coastal polders against storm surge was assessed through hydraulic modeling
study. Foreshore bathymetry has also been generated for Sitakundu area based on the
two dimensional BoBM results under this project. Under this project, approximately
5000 km length of coastal embankments was surveyed.

7/29/2019 Impact Assessment of Predicted Sea Level Rise and Storm Surge on Coastal Embankments of Some Selected Pold…
http://slidepdf.com/reader/full/impact-assessment-of-predicted-sea-level-rise-and-storm-surge-on-coastal-embankments 33/123
21
CHAPTER 3
STUDY AREA
3.1 Study Area
In this study, three polders situated in Satkhira district at the western coast of
Bangladesh have been selected as study area. These are Polder no. 15, 7/1 and 7/2. All
of these polders have been damaged more or less during the cyclone AILA on 25
May, 2009. These polders are home to about 250,000 people. Shrimp culture is
currently the third most important source of foreign exchanges for Bangladesh. The
Embankments constructed around these polders individually are mostly earthen
embankments made of silty clay or loamy clay which is the general soil type of the
western coastal region of Bangladesh. Figure 3.1 represents the location of the study
area on polder map.
Figure 3.1: Location of the Study Area on Polder Map (Source: IWM)

7/29/2019 Impact Assessment of Predicted Sea Level Rise and Storm Surge on Coastal Embankments of Some Selected Pold…
http://slidepdf.com/reader/full/impact-assessment-of-predicted-sea-level-rise-and-storm-surge-on-coastal-embankments 34/123
3.2 Polder 15
• Location: Union-Gab
Thana-Shy
District-Sat
• Population: 40000 (a
• Gross protected area:
• Embankment Type: I
• Embankment length:
• Regulator(s): 5
• Flushing Inlet: 0
• Drainage Channel: 1
Typical cross-section of t
in Figure 3.2.
1.45 mPWD
Figure 3.2: Ty
22
ura,
mnagar,
khira.
prox.)
3441 ha
nterior Dyke
27.34 km
.5 km
• Embankment Cross-section
o Design crest level: 4.
o Crest width: 4.27 m (
o Riverside Slope: 1:3
o Countryside Slope: 1
o Mean Riverside Gro
1.45 m PWD
o Mean Countryside
1.0 m PWD
(So
he embankment of Polder 15 has been illustrate
1.
ical cross-section of the embankment of Polder
eatures:
27 mPWD.
14 ft )
:2
nd Level:
round Level:
urce: BWDB)
d with details
mPWD
15

7/29/2019 Impact Assessment of Predicted Sea Level Rise and Storm Surge on Coastal Embankments of Some Selected Pold…
http://slidepdf.com/reader/full/impact-assessment-of-predicted-sea-level-rise-and-storm-surge-on-coastal-embankments 35/123
The index map of Polde
seen that Polder 15 is su
Arpangasia.
Figure 3.3: In
23
r 15 has been presented in Figure 3.3. From t
rrounded by several rivers such as Kholpetua,
dex Map of Polder 15 (Source: BWDB, Satkhir
e figure it is
Kobadak and
)

7/29/2019 Impact Assessment of Predicted Sea Level Rise and Storm Surge on Coastal Embankments of Some Selected Pold…
http://slidepdf.com/reader/full/impact-assessment-of-predicted-sea-level-rise-and-storm-surge-on-coastal-embankments 36/123
3.3 Polder 7/1
• Location: Union-Pad
Thana-Shy
District-Sat
• Population: 30000 (a
• Gross protected area:
• Embankment Type: I
• Embankment length:
• Regulator(s): 9
• Flushing Inlet: 0
• Drainage Channel: 2
Typical cross-section of
details in Figure 3.4.
1.65 mPWD
Figure 3.4: Ty
24
apukur,
mnagar,
khira.
prox.)
3887 ha
nterior Dyke
34.21 km
.5 km
• Embankment Cross-sec
Features:
o Design crest level:
o Crest width: 4.27 m
o Riverside Slope: 1:3
o Countryside Slope:
o Mean Riverside Gro
1.65 mPWD
o Mean Countryside
1.1 mPWD
(So
the embankment of Polder 7/1 has been ill
1.
ical cross-section of the embankment of Polder
ion
.27 mPWD
(14 ft )
1:2
und Level:
round Level:
urce: BWDB)
ustrated with
1 mPWD
7/1
7/29/2019 Impact Assessment of Predicted Sea Level Rise and Storm Surge on Coastal Embankments of Some Selected Pold…
http://slidepdf.com/reader/full/impact-assessment-of-predicted-sea-level-rise-and-storm-surge-on-coastal-embankments 37/123
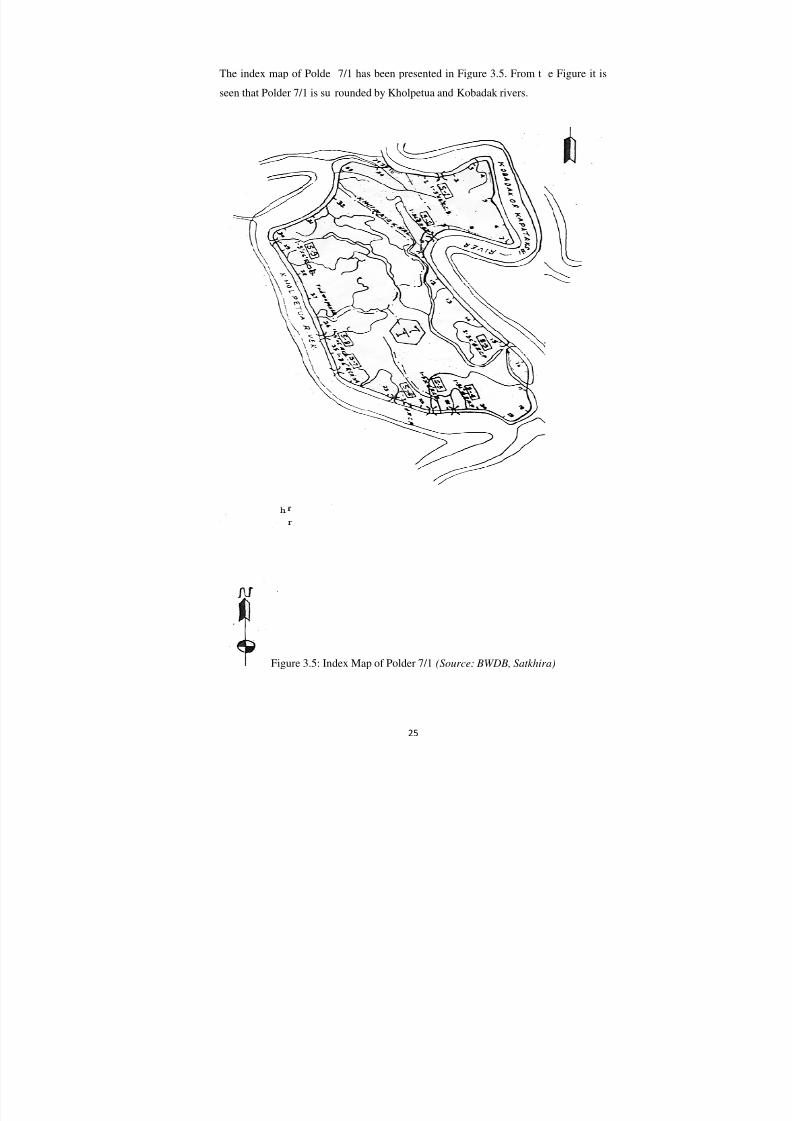
The index map of Polde
seen that Polder 7/1 is su
Figure 3.5: In
25
7/1 has been presented in Figure 3.5. From t
rounded by Kholpetua and Kobadak rivers.
dex Map of Polder 7/1 (Source: BWDB, Satkhir
e Figure it is
a)

7/29/2019 Impact Assessment of Predicted Sea Level Rise and Storm Surge on Coastal Embankments of Some Selected Pold…
http://slidepdf.com/reader/full/impact-assessment-of-predicted-sea-level-rise-and-storm-surge-on-coastal-embankments 38/123
3.4 Polder 7/2
• Location: Union-Prot
Thana-Ass
District-Sat
• Population: 125000 (
• Gross Protected Area
• Embankment Type: I
• Embankment Length:
• Regulator(s): 16
• Flushing Inlet: 0
• Drainage Channel: 4
Typical cross-section of
details in Figure 3.6.
1.8 mPWD
Figure 3.6: Ty
26
apnogor,
sunia,
khira.
pprox.)
: 10486 ha
nterior Dyke
59.59 km
.1 km
• Embankment Cross-Sect
Features:
o Design Crest Level:
o Crest Width: 4.27 m
o River-side Slope: 1:3
o Country-side Slope:
o Mean River-side Gro
1.8 mPWD
o Mean Country-side
1.2 mPWD
(So
the embankment of Polder 7/2 has been ill
1.
ical cross-section of the embankment of polder
ion
.27 mPWD.
(14 ft )
1:2
und Level:
round Level:
urce: BWDB)
ustrated with
mPWD
7/2

7/29/2019 Impact Assessment of Predicted Sea Level Rise and Storm Surge on Coastal Embankments of Some Selected Pold…
http://slidepdf.com/reader/full/impact-assessment-of-predicted-sea-level-rise-and-storm-surge-on-coastal-embankments 39/123
The index map of Polde
seen that Polder 7/2 is su
Figure 3.7: In
27
7/2 has been presented in Figure 3.7. From t
rounded by Morirchap, Kholpetua and Kobada
dex Map of Polder 7/2 (Source: BWDB, Satkhir
e figure it is
rivers.
a)

7/29/2019 Impact Assessment of Predicted Sea Level Rise and Storm Surge on Coastal Embankments of Some Selected Pold…
http://slidepdf.com/reader/full/impact-assessment-of-predicted-sea-level-rise-and-storm-surge-on-coastal-embankments 40/123
28
A satellite image of the study area collected from Google Earth has been presented in
Figure 3.8. The area within the red box shows the location of the study area in the
image.
Figure 3.8: Study Area on Google Earth
7/2
7/1
15

7/29/2019 Impact Assessment of Predicted Sea Level Rise and Storm Surge on Coastal Embankments of Some Selected Pold…
http://slidepdf.com/reader/full/impact-assessment-of-predicted-sea-level-rise-and-storm-surge-on-coastal-embankments 41/123
29
CHAPTER 4
DESCRIPTION OF MODELS
4.1 General
The mathematical or numerical models used in this study have been discussed in this
chapter. A mathematical 1-dimensional model named HEC-RAS has been primarily
used for simulation in this study. Values to be used as boundary conditions in HEC-
RAS for simulation of the scenario considered in this study has been obtained from a
numerical 2-dimensional model named MIKE-21. The simulation of MIKE-21 model
has been performed by IWM (Institute of Water Modelling). Description of HEC-
RAS has been adapted from HEC-RAS 4.0 Manual (2009), Sarker (2009) and Khan
(2009) and descriptions of MIKE-21 and BoBM have been adapted from Hasan
(2008) (Ref. no. 33).
4.2 HEC-RAS
HEC-RAS is a computer program that models the hydraulics of water flow through
natural rivers and other channels developed by Hydrologic Engineering Centre, US
army corps of engineers. The model is originally developed for 1D open channel
hydrodynamic analysis. It can simulate both steady and unsteady flows and includeselaborate treatment for complex channel cross-sections and structures like bridges,
culverts and dams. HEC-RAS is an integrated system of software, designed for
interactive use in a multi-tasking environment. The system is comprised of a graphical
user interface (GUI), separate analysis components, data storage and management
capabilities, graphics and reporting facilities. The HEC-RAS system contains four
one-dimensional river analysis components for:
1. Steady flow water surface profile computations
2. Unsteady flow simulation
3. Movable boundary sediment transport computations; and
4. Water quality analysis

7/29/2019 Impact Assessment of Predicted Sea Level Rise and Storm Surge on Coastal Embankments of Some Selected Pold…
http://slidepdf.com/reader/full/impact-assessment-of-predicted-sea-level-rise-and-storm-surge-on-coastal-embankments 42/123
4.2.1 Governing Equati
HEC-RAS uses the dyna
of the continuity and mo
equations for sediment
Preissmann four-point
sectional geometry and n
Saint-Venant Equation:
The continuity equation
The dynamic or moment
Where,
A = the cross-sectional ar
h = depth of flow at the s
z = elevation of surface a
v = mean velocity at the
Q = discharge at the secti
b = width of the top of th
x = position of the sectio
t = time
g = acceleration due to gr
ρ = mass density of the fl
30
ns in HEC-RAS
ic wave theory of the Saint-Venant equations
entum equation to describe flow movement an
ransport modeling. The flow is also solved
cheme, with elaborate considerations of co
merous types of hydraulic structures.
ൌ 0 ……………………….
m equation
ൌ ሺ െ ሻ ……………………….
ea of the section
ction
bove the datum at the section
ection
on
section
measured from the upstream end
avity
uid
which consist
d equilibrium
by using the
mplex cross-
.Equation 4.1
.Equation 4.2
7/29/2019 Impact Assessment of Predicted Sea Level Rise and Storm Surge on Coastal Embankments of Some Selected Pold…
http://slidepdf.com/reader/full/impact-assessment-of-predicted-sea-level-rise-and-storm-surge-on-coastal-embankments 43/123
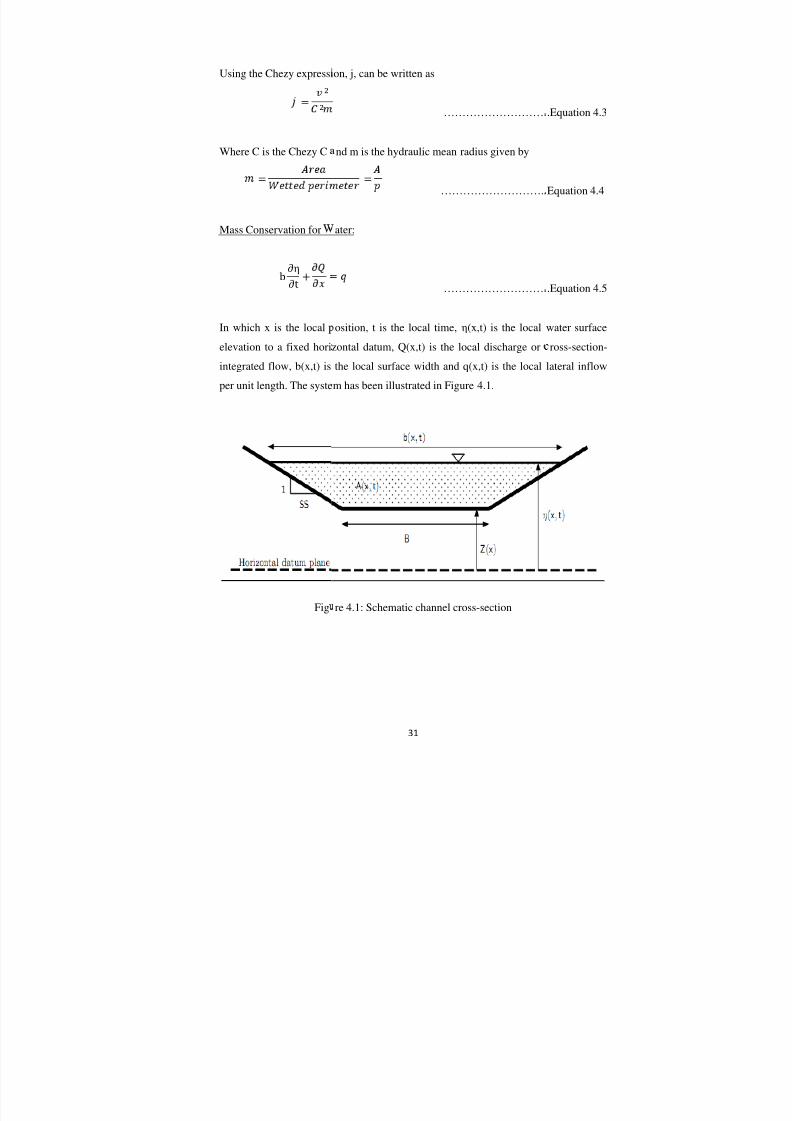
Using the Chezy expressi
ൌଶ
ଶ
Where C is the Chezy C
ൌ
Mass Conservation for
b∂η
∂t
In which x is the local
elevation to a fixed hori
integrated flow, b(x,t) is
per unit length. The syste
Fig
31
on, j, can be written as
……………………….
nd m is the hydraulic mean radius given by
ൌ ………………………..
ater:
……………………….
osition, t is the local time, η(x,t) is the local
zontal datum, Q(x,t) is the local discharge or
the local surface width and q(x,t) is the local
m has been illustrated in Figure 4.1.
re 4.1: Schematic channel cross-section
.Equation 4.3
Equation 4.4
.Equation 4.5
water surface
ross-section-
lateral inflow

7/29/2019 Impact Assessment of Predicted Sea Level Rise and Storm Surge on Coastal Embankments of Some Selected Pold…
http://slidepdf.com/reader/full/impact-assessment-of-predicted-sea-level-rise-and-storm-surge-on-coastal-embankments 44/123
Momentum Conservatio
ଶ
ൌ െ
Where, g is the gravitatio
P(x,t) is the local wetted
friction model, either
In which f, C and n ar
respectively. R = A/P is t
4.2.2 Components of H
HECRAS consists of 13
a. Geometric data edito
b.
Steady flow datac. Steady flow analysis
d. Unsteady flow data
e. Unsteady flow analys
f. Quasi Unsteady flow
g. Sediment Data
h. Sediment analysis
i. Hydraulic design fun
j. Water Quality Data
k. Water Quality analys
l. Printing and Viewing
m. Help
32
for Water:
െ
……………………….
nal accelelaration, A(x,t) is the local flow cross
erimeter. The boundary shear (x,t) is estimat
……………………….
the Darcy-Wiesbach, Chezy and Manning fr
he local hydraulic radius.
CRAS
ollowing components:
is
data
tions
is
results
.Equation 4.6
-section and
ed from a
.Equation 4.7
iction factors

7/29/2019 Impact Assessment of Predicted Sea Level Rise and Storm Surge on Coastal Embankments of Some Selected Pold…
http://slidepdf.com/reader/full/impact-assessment-of-predicted-sea-level-rise-and-storm-surge-on-coastal-embankments 45/123
Different components of
Figure 4.2: Diff
33
HEC-RAS have been shown in Figure 4.2.
rent Components of HEC-RAS (HEC-RAS Ma
ual)
7/29/2019 Impact Assessment of Predicted Sea Level Rise and Storm Surge on Coastal Embankments of Some Selected Pold…
http://slidepdf.com/reader/full/impact-assessment-of-predicted-sea-level-rise-and-storm-surge-on-coastal-embankments 46/123
34
4.2.3 Overview of Program Capabilities
HEC-RAS is designed to perform one-dimensional hydraulic calculations for a full
network of natural and constructed channels. The following is a description of the
major capabilities of HEC-RAS.
User Interface
The user interacts with HEC-RAS through a graphical user interface (GUI). The main
focus in the design of the interface was to make it easy to use the software, while still
maintaining a high level of efficiency for the user. The interface provides for the
following functions:
o File management
o Data entry and editing
o River analysis
o Tabulation and graphical displays of input and output data
o Reporting facilities
o On-line help
River Analysis Components
Steady Flow Water Surface Profiles
This component of the modeling system is intended for calculating water surface
profiles for steady gradually varied flow. The system can handle a full network of
channels, a dendritic system, or a single river reach. The steady flow component is
capable of modeling subcritical, supercritical and mixed flow regime water surface
profiles.
The basic computational procedure is based on the solution of the one-dimensional
energy equation. Energy losses are evaluated by friction (Manning’s equation) and
contraction/expansion (coefficient multiplied by the change in velocity head). The
momentum equation is utilized in situations where the water surface profile is rapidly
varied. These situations include mixed flow regime calculations (i.e., hydraulic
jumps), hydraulics of bridges and evaluating profiles at river confluences (stream
junctions).

7/29/2019 Impact Assessment of Predicted Sea Level Rise and Storm Surge on Coastal Embankments of Some Selected Pold…
http://slidepdf.com/reader/full/impact-assessment-of-predicted-sea-level-rise-and-storm-surge-on-coastal-embankments 47/123
35
The effects of various obstructions such as bridges, culverts, dams, weirs and other
structures in the flood plain may be considered in the computations. The steady flow
system is designed for application in flood plain management and flood insurance
studies to evaluate floodway encroachments. Also, capabilities are available for
assessing the change in water surface profiles due to channel modifications and
levees.
Special features of the steady flow component include:
o Multiple plan analyses
o Multiple profile computations
o Multiple bridge and/or culvert opening analysis
o Bridge scour analysis
o Split flow optimization; and
o Stable channel design and analysis
Unsteady Flow Simulation
This component of the HEC-RAS modeling system is capable of simulating one-
dimensional unsteady flow through a full network of open channels. The unsteady
flow equation solver was adapted from Dr. Robert L. Baraku’s UNET model. The
unsteady flow component was developed primarily for subcritical flow regime
calculations. However, with the release of version 3.1, the model can now perform
mixed flow regime (subcritical, supercritical, hydraulic jumps and draw downs)
calculations in the unsteady flow computations module.
The hydraulic calculations for cross-sections, bridges, culverts and other hydraulic
structures that were developed for the steady flow component were incorporated into
the unsteady flow module.
Special features of the unsteady flow component include:
o Dam break analysis
o Levee breaching and overtopping
o Pumping stations
o Navigation dam operations; and
o Pressurized pipe systems

7/29/2019 Impact Assessment of Predicted Sea Level Rise and Storm Surge on Coastal Embankments of Some Selected Pold…
http://slidepdf.com/reader/full/impact-assessment-of-predicted-sea-level-rise-and-storm-surge-on-coastal-embankments 48/123
36
Sediment Transport/Movable Boundary Computations
This component of the modeling system is intended for the simulation of one-
dimensional sediment transport/movable boundary calculations resulting from scour
and deposition over moderate time periods (typically years, although applications to
single flood events are possible).
The sediment transport potential is computed by grain size fraction, thereby allowing
the simulation of hydraulic sorting and armoring. Major features include the ability o
model a full network of streams, channel dredging, various levee and encroachment
alternatives, and the use of several different equations for the computation of
sediment transport.
The model is designed to simulate long-term trends of scour and deposition in a
stream channel that might result from modifying the frequency and duration of the
water discharge and stage, or modifying the channel geometry. This system can be
used to:
o Evaluate deposition in reservoirs
o Design channel contractions required to maintain navigation depths
o Predict the influence of dredging on the rate of deposition
o Estimate maximum possible scour during large flood events; and
o Evaluate sedimentation in fixed channels
Water Quality Analysis
This component of the modeling system is intended to allow the user to perform
riverine water quality analyses. The current version of HEC-RAS can perform
detailed temperature analysis and transport of a limited number of water quality
constituents (Algae, Dissolved Oxygen, Carbonaceuos Biological Oxygen Demand,
Dissolved Organic Phosphorus, Dissolved Ammonium Nitrate, Dissolved Nitrite
Nitrogen and Dissolved Organic Nitrogen).

7/29/2019 Impact Assessment of Predicted Sea Level Rise and Storm Surge on Coastal Embankments of Some Selected Pold…
http://slidepdf.com/reader/full/impact-assessment-of-predicted-sea-level-rise-and-storm-surge-on-coastal-embankments 49/123
37
Data Storage and Management
Data storage is accomplished through the use of “flat” files (ASCII and binary). User
input data are stored in fat files under separate categories of project, plan, geometry,
steady flow, unsteady flow, quasi steady flow, sediment flow and water quality
information. Output data is predominantly stored in separate binary files. Data can be
transferred between HEC-RAS and other programs by utilizing the HEC-DSS.
Data management is accomplished through the user interface. The modeler is
requested to enter a single filename for the project being developed. Once the project
filename is entered, all other files are automatically created and named by the
interface needed. The interface provides for renaming, moving and deletion of files on
a project-by-project basis.
Graphics and Reporting
Graphics include X-Y plots of the river system schematic, cross-sections, profiles,
rating curves, hydrographs and many other hydraulic variables. A three-dimensional
plot of multiple cross-sections is also provided. Tabular output is available. Users can
select from pre-defined tables or develop their own customized tables. All graphical
and tabular output can be displayed on the screen, sent directly o a printer (or plotter),
or passed through the Windows Clipboard to other software, such as a word-processor
or spreadsheet.
How to perform an analysis
o Starting a New Project
o Entering Geometric Data
o Entering Steady Flow Data
o Performing the Hydraulic Calculations
o Viewing Results
o Printing Graphics and Tables
o Exiting the Program

7/29/2019 Impact Assessment of Predicted Sea Level Rise and Storm Surge on Coastal Embankments of Some Selected Pold…
http://slidepdf.com/reader/full/impact-assessment-of-predicted-sea-level-rise-and-storm-surge-on-coastal-embankments 50/123
38
Performing a Steady Flow Analysis
o Entering and Editing Steady Flow Data
o Performing Steady Flow Calculations
Performing an Unsteady Flow Analysis
o Entering and Editing Unsteady Flow Data
o Performing Unsteady Flow Calculations
o Calibration of Unsteady Flow Models
o Model Accuracy, Stability and Sensitivity
Viewing Results
The current version of the program allows the user to view cross sections, water
surface profiles, general profiles, rating curves, hydrographs, X-Y-Z perspective plots,
detailed tabular output at a single location and summary tabular output at many cross
sections. Users also have the ability to develop their own output tables.
Contents
o Cross Sections, Profiles and Rating Curves
o X-Y-Z Perspective Plots
o Tabular Output
o Viewing Results From the River System Schematic
o Stage and Flow Hydrographs
o Viewing Computational Level Output for Unsteady Flow
o Viewing Ice Information
o Viewing Data Contained in an HEC-DSS File
o Exporting Results to HEC-DSS
4.3 MIKE-21
MIKE-21 is a numerical 2-dimensional model developed by DHI Water and
Environment. MIKE-21 has a number of modules for different purpose and each
module has different sets of equations. To provide the boundary conditions to be used
in simulation for the scenario considered in this study, hydrodynamic and cyclone
module of MIKE-21 have been used by IWM. The governing equations for these
modules have been described in the next section.

7/29/2019 Impact Assessment of Predicted Sea Level Rise and Storm Surge on Coastal Embankments of Some Selected Pold…
http://slidepdf.com/reader/full/impact-assessment-of-predicted-sea-level-rise-and-storm-surge-on-coastal-embankments 51/123
39
4.3.1 Governing Equations in Hydrodynamic Module
The governing equations used in MIKE-21 in solving hydraulic problems in coastal
areas are:
Conservation of Mass Equation:
0=∂
∂+
∂
∂+
∂
∂
y
q
x
p
t
ε
……………..Equation 4.8
Conservation of Momentum Equation:
The momentum equation in the x-direction is given by:
01
2 2
22
2
=∂
∂+−Ω−
∂
∂−
++
∂
∂+
∂
∂
+∂
∂
+∂
∂
x
phWW C q
y
h p
h
q p f
xgh
y
h pq
x
h p
t
p a
xw
a xy
ρ ρ
ρ τ
ρ
ε
….……………Equation 4.9
The momentum equation in the y-direction is given by:
01
2 2
22
2
=∂
∂+−Ω+
∂
∂−
++
∂
∂+
∂
∂
+∂
∂
+∂
∂
y
phWW C p
x
hq
h
q p f
ygh
x
h pq
y
hq
t
q a
yw
a yx
ρ ρ
ρ τ
ρ
ε
...……………Equation 4.10
Where, p and q flux in x and y directions respectively (m
3 /s/m).
t time (s), x and y (m) are Cartesian Co –ordinate (s).
h water depth (m).
g acceleration due to gravity (9.81 m2 /s) .
ε sea surface elevation (m).
ρ w & ρ a air and water density respectively (kg /m3),
C w wind friction factor = 0.0008 + 0.000065W in accordance with
Wu (1982).
W wind speed (m/s).
Ω Coriolis parameter
Pa atmospheric pressure (kg/m/s2).

7/29/2019 Impact Assessment of Predicted Sea Level Rise and Storm Surge on Coastal Embankments of Some Selected Pold…
http://slidepdf.com/reader/full/impact-assessment-of-predicted-sea-level-rise-and-storm-surge-on-coastal-embankments 52/123
40
4.3.2 Governing Equations in Cyclone Module
The Cyclone module of MIKE-21 has been used to generate the pressure and wind
distributions all over the Bay of Bengal. Cyclone Model is normally described by
relatively few parameters relate to pressure field, which is imposed to the water
surface and a wind field which is acting as a drag force on the water body through a
wind shear stress description. The wind fields consist of a rotational and a
translational component.
At a distance R from the centre of the cyclone the rotational wind speed V r is given as
))1(7exp()( 7
mm
mr R
R
R
RV V −= for R< Rm ............................... Equation 4.11
))1(exp( mmr R
R
C V V −= for R> Rm ............................... Equation 4.12
Where R and Rm are in km and C is given as
05.00025.0 +=m
RC ............................... Equation 4.13
C determines the shape of wind distribution for R> Rm.
And translational component V t is given as
)cos(5.0 θ −−= f t V V ............................... Equation 4.14
Where, θ is the angle between the radial arm and the line of maximum winds. The
total wind speed is t r V V V +=
And finally, the pressure at particular location is given as
)exp()( R
RPPPP m
cnc−−+= ............................... Equation 4.15
Where, P is pressure at radius R, Pc is central pressure, Pn is neutral pressure.

7/29/2019 Impact Assessment of Predicted Sea Level Rise and Storm Surge on Coastal Embankments of Some Selected Pold…
http://slidepdf.com/reader/full/impact-assessment-of-predicted-sea-level-rise-and-storm-surge-on-coastal-embankments 53/123
41
Two different hydrodynamic models have been used by IWM for the study. Brief
descriptions of the models have been given in the next section.
4.3.3 The Bay of Bengal Model
A Bay of Bengal Model (BoBM) has been used to simulate the cyclonic events foreach scenario considered in the study. Water levels obtained for each scenario at the
mouth of selected rivers downstream to the study area are then used as downstream
boundary conditions in the other MIKE-21 based hydrodynamic model, South-West
Region Model. BoBM is a 2D one layer MIKE-21 based hydrodynamic model. The
model covers the northern part of the Bay of Bengal from latitude 17000
/ 00
// to the
coast of Bangladesh. The total model has been updated up to 2008.
Size of the model (Model Grid)
The base model is a three way nested model and the resolutions are 5400 m, 1800 m
and 600 m. The Meghna Estuary is resolved on a 600 m grid. Extent of models has
been shown in the Figure 4.3 and information on the grid is given in Table 4.1 and
Table 4.2.
Figure 4.3: Model domain of three nested model (Source: IWM )
India
Vishakhapatnam Gwa Bay
ChandpurIndia
India
Bay of Bengal
Coarse Model
Intermediate Model
Fine Model

7/29/2019 Impact Assessment of Predicted Sea Level Rise and Storm Surge on Coastal Embankments of Some Selected Pold…
http://slidepdf.com/reader/full/impact-assessment-of-predicted-sea-level-rise-and-storm-surge-on-coastal-embankments 54/123
42
Table 4.1: Model grid specification
Model Origin
(degree)
Grid Spacing
(m)Grid Numbers
Length and
Width
Coarse grid Lon = 84.64
Lat = 18.91
Dx = 5400
Dy = 5400
180×93 972km ×
502km
Intermediate
grid
Lon = 86.75
Lat = 20.81
Dx = 1800
Dy = 1800
321×156 578km ×
281km
Fine grid Lon = 89.9712
Lat = 21.3393
Dx = 600
Dy = 600
396×357 238km ×
214km
Table 4.2: Relative grid positions
Model In Fine Grid In Intermediate Grid In Coarse Grid
Coarse grid - - (0,0)
Intermediate grid - (0,0) (42,38)
Fine grid (0,0) (174,31) (100,48)
Bathymetry Generation
Bathymetry is the bottom topography of a river or a sea. As the model area is a huge
one, it is not possible to survey all the area at a time. To make the bathymetry, bed
level data has been collected from different sources of different time. Table 4.3 shows
the source of bed level data utilized for generation of bathymetry of the model.
Table 4.3: Land-water data used for generating the bathymetry
Model
component
Type of Data
Bathymetry Source Land Source Land-water
boundary
Coarse grid Admiralty
maps
CSPS - - Admiralty maps
Intermediate
grid
Admiralty
maps
CSPS - - Admiralty maps

7/29/2019 Impact Assessment of Predicted Sea Level Rise and Storm Surge on Coastal Embankments of Some Selected Pold…
http://slidepdf.com/reader/full/impact-assessment-of-predicted-sea-level-rise-and-storm-surge-on-coastal-embankments 55/123
43
Model
component
Type of Data
Bathymetry Bathymetry Bathymetry
Fine grid Admiralty
maps
FAP 5B
Survey (1997)
MES II survey
(1998, 99)
BIWTA maps
MES I
MES I
MES II
MES II
DEM (1952-
64)
FINMAP
(1990)
KJDRP
(1997)
CSPS
CSPS
IWM
LANDSAT
1996
LANDSAT
1998
In addition polder levels and alignment surveyed under 2nd
CERP have been used.
Bed Resistance
In shallow areas bed friction is important and can effectively be used to adjust the
amplitude of tides. Bed friction is defined by the Manning number, M (m1/3
/s). The
map of the Manning used during the calibration period has been shown in Table 4.4.
Table 4.4: Manning number distribution
Areas with depths Manning Number
Less than –1000 60
-1000 to –200 70
-200 to –50 80
-50 to –20 90
-20 to –3 100
-3 to –1 90
-1 to 1 80
Greater than 1 25

7/29/2019 Impact Assessment of Predicted Sea Level Rise and Storm Surge on Coastal Embankments of Some Selected Pold…
http://slidepdf.com/reader/full/impact-assessment-of-predicted-sea-level-rise-and-storm-surge-on-coastal-embankments 56/123
44
Eddy Viscosity
The eddy viscosity E has been specified in the model as a time-varying function of the
local gradients in the velocity field. This formulation is based on the so-called
Smagorinsky concept, which yields:
∂
∂+
∂
∂+
∂
∂+
∂
∂∆=
y
V
x
U
y
U
x
U C E
s2
12
22
In the model only the value of Cs has to be specified and the recommended value is
0.2 to 1.0. In this research work 0.3 has been used.
Boundary Generation
The model has a wide, deep and open ocean boundary in the south situated along the
line extending from Vishakhapatnam in India to Gwa Bay in Myanmar (Figure 4.3).
Predictions on water levels have been made for these two extreme points along this
boundary based on tidal constituents. The water level along the open boundary was
obtained by interpolating the two predicted water levels. Tidal constituents that were
used to predict water level for these two stations have been shown in the Table 4.5.
Table 4.5 Tidal constituents for Vishakhapatnam and Gwa Bay
Tidal
constituents
Vishakhapatnam Gwa Bay
Phase
(Degree)
Magnitude
(m)
Phase
(Degree)
Magnitude
(m)
M2 239 0.48 266 0.69
S2 274 0.21 304 0.32
K1 336 0.11 330 0.14
O1 320 0.04 338 0.05
f 4 - - 180 0.193
(Source: Admiralty Tide Table)
To the north the model has a narrow, shallow, open boundary in the Meghna River.
The boundary is located at Chandpur and observed water level at Chandpur has been
used as north boundary of the model.

7/29/2019 Impact Assessment of Predicted Sea Level Rise and Storm Surge on Coastal Embankments of Some Selected Pold…
http://slidepdf.com/reader/full/impact-assessment-of-predicted-sea-level-rise-and-storm-surge-on-coastal-embankments 57/123
45
Calibration and Validation of Bay of Bengal model
The existing BoBM model has been calibrated and validated against the measured
water level and discharge data. The model has been calibrated against water level at
Charchenga and discharge at North Hatiya during 2006. Calibration plots have been
shown in the Figure 4.4 and Figure 4.5.
Figure 4.4: Calibration against discharge data at North Hatiya during 2006
Figure 4.5: Calibration against water level data at Charchenga during 2006
Location of water level
Measured
Discharge Location
Measured
Simulated
Simulated

7/29/2019 Impact Assessment of Predicted Sea Level Rise and Storm Surge on Coastal Embankments of Some Selected Pold…
http://slidepdf.com/reader/full/impact-assessment-of-predicted-sea-level-rise-and-storm-surge-on-coastal-embankments 58/123
46
The model has been validated against discharge at West Shahbazpur Channel and at
East Shahbazpur Channel during December 2007. The validation plots have been
shown in the Figure 4.6 and Figure 4.7.
Figure 4.6: Validation against discharge data at West Shahbazpur Channel during
December 2007
Figure 4.7: Validation against Discharge data at East Shahbazpur Channel duringDecember 2007
Discharge Location
Measured
Discharge Location
Measured
Simulated
Simulated

7/29/2019 Impact Assessment of Predicted Sea Level Rise and Storm Surge on Coastal Embankments of Some Selected Pold…
http://slidepdf.com/reader/full/impact-assessment-of-predicted-sea-level-rise-and-storm-surge-on-coastal-embankments 59/123
4.3.2 The South-West R
The South-West Region
and downstream bounda
each scenario under cons
based hydrodynamic mo
Model at the mouth of th
as downstream boundar
Model. Normal discharg
as upstream boundary
South-West Region Mod
Figure 4.
47
egion Model
Model has been used in this study to obtain
y conditions to be used in HEC-RAS for the
ideration of the study. The model is a 2D one la
del. The water levels obtained from the simul
e selected rivers downstream to the study area
conditions in the simulation of the South-
s at the upstream locations of the model area h
onditions for simulation. Figure 4.8 present
l.
8: South-West Region Model (Source: IWM)
oth upstream
simulation of
yer MIKE-21
ation of BoB
as been used
West Region
ve been used
the map of

7/29/2019 Impact Assessment of Predicted Sea Level Rise and Storm Surge on Coastal Embankments of Some Selected Pold…
http://slidepdf.com/reader/full/impact-assessment-of-predicted-sea-level-rise-and-storm-surge-on-coastal-embankments 60/123
48
CHAPTER 5
METHODOLOGY
5.1 Data Collection
In this study geometric data such as cross-sections and hydrometric data such as
discharge and water level have been collected from IWM. A shape file of the major
rivers of Bangladesh has been collected from the Department of Water Resources
Engineering, BUET in order to generate the streamline co-ordinates required for the
schematization of river system surrounding the study area in the HEC-RAS based
numerical modeling. A brief description of all the data used in this study is presented
in the following section.
5.1.1 Geometric Data
Cross-section data of rivers surrounding the study area such as Kobadak, Kholpetua,
and Morirchap reaches as well as cross-section data of other rivers that are connected
to the rivers surrounding the study area such as Betna, Galghasia, Kalagachi and
Arpangasia have been collected from IWM. These data include bank to bank width
during the high tide and elevation in meter with respect to PWD datum. Plot of the
cross section data have been provided in Appendix-B. The survey period of collected
cross-section data has been presented in Table 5.1.
Table 5.1: Survey period of collected cross-section data
River Survey Period Survey Organization
Kobadak 2003 IWM
Kholpetua 1990-1992 SWMC
Galghasia 1990-1992 SWMC
Morirchap 1998 SWMC
Betna 1998 SWMC
Arpangasia 2000 SWMC
Kalagachi 2000 SWMC

7/29/2019 Impact Assessment of Predicted Sea Level Rise and Storm Surge on Coastal Embankments of Some Selected Pold…
http://slidepdf.com/reader/full/impact-assessment-of-predicted-sea-level-rise-and-storm-surge-on-coastal-embankments 61/123
49
5.1.2 Discharge and Water Level Data
Discharge and water level data have been collected from IWM which are generated
specially for this study. These data are generated using two 2-D hydrodynamic
models based on MIKE-21 named as the Bay of Bengal Model and the South-West
Region Model. The discharge data of Kobadak, Betna and Galghasia and the water
level data of Arpangasia River near the Kobadak-Kholpetua-Arpangasia junction,
Kalagachi River near the Kholpetua-Kalagachi junction and Morirchap River near
Morirchap-Kholpetua junction have been used as boundary conditions. Both the
discharge data and water level data began from May 24, 2009 at 9.00 am to May 26,
2009 at 9.00 am and include reading at an interval of 30 minutes. Plotting of
discharge data (flow hydrograph) and water level data (stage hydrograph) have been
provided in Appendix-C.
5.1.3 Generation of Streamline Co-ordinates
Since the co-ordinates of the river streamline were not available so it has been
generated. A shape file of the major rivers of Bangladesh has been opened in
ArcView GIS 3.3 and then zoomed up to the study area of this study. The river
reaches surrounding the study area such as Kobadak, Kholpetua, Morirchap, Betna,
Galghasia, Kalagachi and Arpangasia have been selected using select feature tool and
a new shape file has been created. Thus the shape file of river reaches surrounding the
study area has been obtained. A new point theme has been created and points have
been drawn over a river streamline in the new shape file by selecting point from
toolbar. All the points have been selected using select feature tool. The co-ordinates
(based on Bangladesh Transverse Mercator (BTM) projection) will be font in the
attributed table of the point theme file. New point themes have been created again and
the process has been repeated for each individual river reaches of the new shape file.
The co-ordinates then have been exported to an excel file. Co-ordinates of the river
reaches have been provided in Appendix-A.
The shape file of river reaches surrounding the study area has been presented in
Figure 5.1. Figure 5.2 and Figure 5.3 represent examples of point theme of study
reach and attribute table of point theme of study reach.
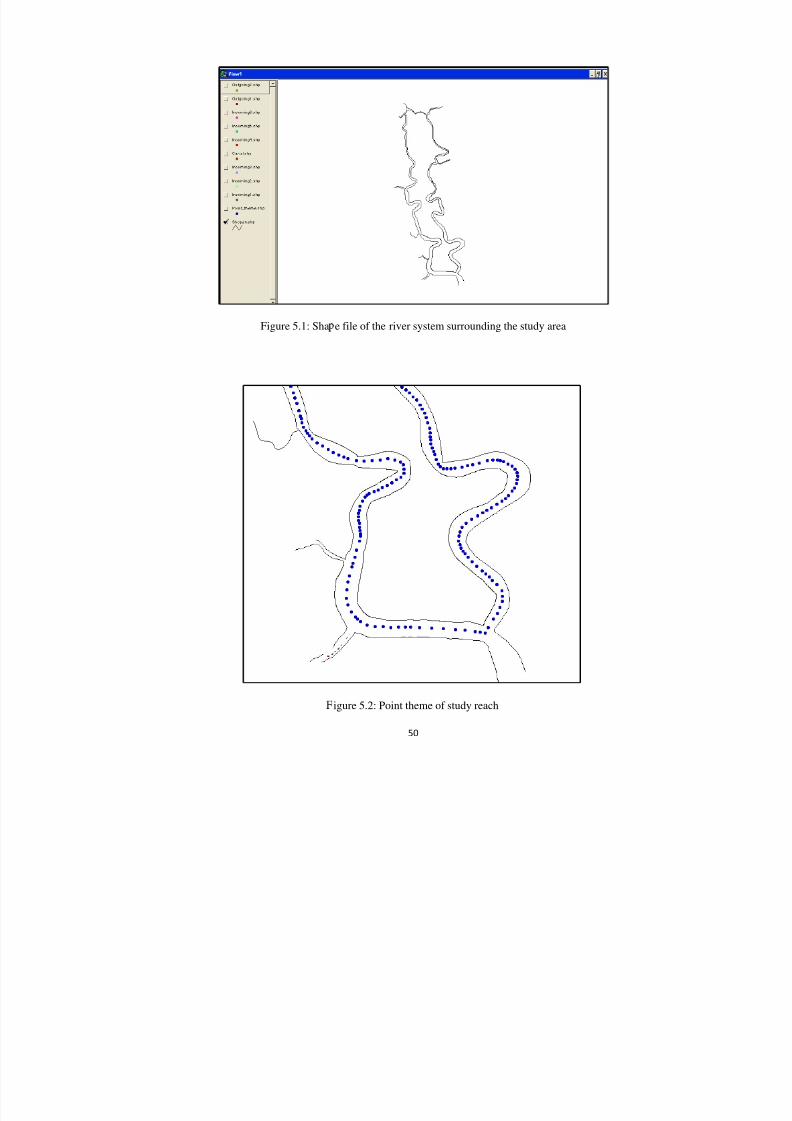
7/29/2019 Impact Assessment of Predicted Sea Level Rise and Storm Surge on Coastal Embankments of Some Selected Pold…
http://slidepdf.com/reader/full/impact-assessment-of-predicted-sea-level-rise-and-storm-surge-on-coastal-embankments 62/123
Figure 5.1: Sha
50
e file of the river system surrounding the study
igure 5.2: Point theme of study reach
area

7/29/2019 Impact Assessment of Predicted Sea Level Rise and Storm Surge on Coastal Embankments of Some Selected Pold…
http://slidepdf.com/reader/full/impact-assessment-of-predicted-sea-level-rise-and-storm-surge-on-coastal-embankments 63/123
Figure 5.3
5.2 Field Visit
A field visit was cond
embankments of the sel
AILA and to observe t
damages to the polders d
Satkhira BWDB staffs an
field visit. These are:
1. Observation of th
The existing condition of
breaches were observed.
2. Group discussion
A group discussion with
real situation in the selec
height above the emban
AILA situation.
3. Interview with Sa
Further information on d
the causes of failure o
BWDB, Satkhira zone.
51
: Attribute table of point theme of study reach
cted in June, 2010 to assess the performan
ected polders (Polder no. 15, 7/1 and 7/2) d
e existing condition of the embankments. In
ue to cyclone AILA was gathered from the loc
d field engineers. Three main steps were follo
existing condition of the embankments of sele
the embankments such as crest level, crest wid
with the local people.
the local people was held in order to be acquai
ed polders during cyclone AILA such as the es
ment crest level and area of inundation as wel
tkhira BWDB engineers.
amages to the polders due to cyclone AILA an
the embankments were collected from the
e of coastal
ring cyclone
formation on
al people and
ed during the
cted polders.
th, slopes and
nted with the
timated surge
l as the post-
opinions on
engineers of

7/29/2019 Impact Assessment of Predicted Sea Level Rise and Storm Surge on Coastal Embankments of Some Selected Pold…
http://slidepdf.com/reader/full/impact-assessment-of-predicted-sea-level-rise-and-storm-surge-on-coastal-embankments 64/123
52
5.3 HEC-RAS 1D Hydrodynamic Modeling
After collecting and generating all the necessary data a 1D Hydrodynamic Model has
been developed using HEC-RAS. The steps of HEC-RAS 1D Hydrodynamic
Modeling is shown as a flow chart in Figure 5.4.
Figure 5.4: Steps of HEC-RAS 1D Hydrodynamic Modeling
Model Output and Result Analysis
Fix the Simulation Period and
Run the Hydrodynamic Model
(Unsteady Flow Simulation)
Entering and Interpolating Cross-Section Data
Schematization of River System
(Kobadak-Morirchap-Khalpetua River System)
and Editing the Junction Data
Entering Boundary Conditions and Initial Flow data
(Flow Hydrographs at upstream boundaries and
Stage Hydrographs at downstream boundaries)

7/29/2019 Impact Assessment of Predicted Sea Level Rise and Storm Surge on Coastal Embankments of Some Selected Pold…
http://slidepdf.com/reader/full/impact-assessment-of-predicted-sea-level-rise-and-storm-surge-on-coastal-embankments 65/123
5.3.1 Schematization of
Schematization of river
Khalpetua River Syste
through Reach Invert L
junctions have been co
Morirchap Junction, M
and Kobadak-Khalpetua
data or negligible poten
connected to the river s
represent examples of e
respectively. The Sche
presented in Figure 5.7.
Fig
53
River System
system surrounding the study area (Kobada
) has been done by entering the streamline
ine Tables under GIS Tools in Geometric D
nsidered. These are Kobadak-Morirchap Jun
rirchap-Khalpetua Junction, Galghasia-Khalp
Arpangasia Junction. Due to unavailability of
ial to affect the model result, other river rea
ystem has not been considered. Figure 5.5 a
tering streamline co-ordinates and editing of
atized river system surrounding the study a
re 5.5: Entering streamline co-ordinates
k-Morirchap-
co-ordinates
ata Editor. 5
ction, Betna-
tua Junction
cross-section
ches actually
d Figure 5.6
junction data
rea has been

7/29/2019 Impact Assessment of Predicted Sea Level Rise and Storm Surge on Coastal Embankments of Some Selected Pold…
http://slidepdf.com/reader/full/impact-assessment-of-predicted-sea-level-rise-and-storm-surge-on-coastal-embankments 66/123
54
Figure 5.6: Editing junction data
igure 5.7: Schematized river system

7/29/2019 Impact Assessment of Predicted Sea Level Rise and Storm Surge on Coastal Embankments of Some Selected Pold…
http://slidepdf.com/reader/full/impact-assessment-of-predicted-sea-level-rise-and-storm-surge-on-coastal-embankments 67/123
55
5.3.2 Entering and Interpolating Cross-Section Data
The cross-section station, elevation, downstream reach lengths (left bank, right bank
and channel chainage), manning’s n values, main channel bank stations and
contraction or expansion co-efficient have been entered within Geometric Data
Editor. Cross-sections’ numbers are ordered from downstream to upstream within a
reach. In a particular cross-section data, elevation has been given with respect to
PWD datum in meter, manning’s n values has been considered 0.21~0.51 and
contraction and expansion co-efficient have been considered as .01 and .03
respectively. The cross-section data have been interpolated at an interval of 200 m
through XS Interpolation under Tools in Geometric Data Editor. Figure 5.8 and
Figure 5.9 represent examples of entering and interpolating cross-section data. The
view on Geometric Data Editor after interpolation has been presented in Figure 5.10.
Figure 5.8: Entering cross-section data

7/29/2019 Impact Assessment of Predicted Sea Level Rise and Storm Surge on Coastal Embankments of Some Selected Pold…
http://slidepdf.com/reader/full/impact-assessment-of-predicted-sea-level-rise-and-storm-surge-on-coastal-embankments 68/123
Fig
Figure 5.10: View on Ge
56
re 5.9: Interpolating cross-section data
metric Data Editor after interpolating cross-se tion data

7/29/2019 Impact Assessment of Predicted Sea Level Rise and Storm Surge on Coastal Embankments of Some Selected Pold…
http://slidepdf.com/reader/full/impact-assessment-of-predicted-sea-level-rise-and-storm-surge-on-coastal-embankments 69/123
57
5.3.3 Calibration of the Model
The model has been calibrated against the measured water level at Kobadak during
2009. Calibration plot has been shown in figure 5.11.
Figure 5.11: Calibration against water level at Kobadak during 2009
5.3.4 Development of Scenario
The scenario for this study has been developed considering a cyclonic event with the
magnitudes of cyclone SIDR along the track of cyclone AILA, maximum predicted
sea level rise (1.5 m) by the year 2100 according to the Copenhagen Summit, March
2009 and high tide. The wind speed of cyclone SIDR has been originally estimated as
225 kmph which is equivalent to that of a cyclone with a return period of 20 years.
But according to the 4th
IPCC Report if temperature is increased by 2oC wind speed
will be increased by 5% and if temperature is increased by 4oC wind speed will be
increased by 10%. Thus considering temperature would increase by 4oC in the year
2100 the wind speed of cyclone SIDR has been considered as 248 kmph in the
simulation of MIKE-21 based BoB Model by IWM for this study. The option has
been furnished in table 5.2.
Table 5.2: Scenario for model simulation
Scenario
Track of AILA + SIDR + 1.5 m SLR + High Tide
-2
-1
0
1
2
3
4
5/23/2009 19:125/24/2009 0:005/24/2009 4:485/24/2009 9:365/24/2009 14:245/24/2009 19:125/25/2009 0:00
Measured
Simulated W a t e r L e v e l m P W D
Time
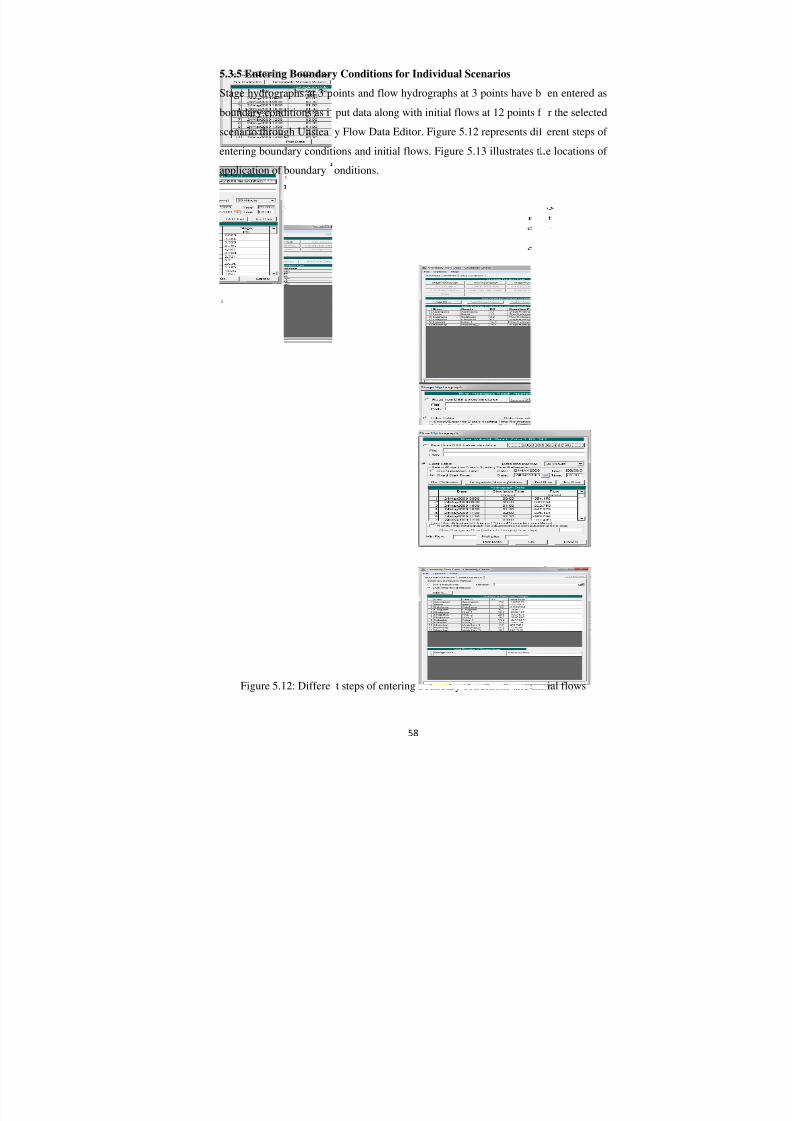
7/29/2019 Impact Assessment of Predicted Sea Level Rise and Storm Surge on Coastal Embankments of Some Selected Pold…
http://slidepdf.com/reader/full/impact-assessment-of-predicted-sea-level-rise-and-storm-surge-on-coastal-embankments 70/123
5.3.5 Entering Boundar
Stage hydrographs at 3 p
boundary conditions as i
scenario through Unstea
entering boundary condit
application of boundary
Figure 5.12: Differe
58
y Conditions for Individual Scenarios
oints and flow hydrographs at 3 points have b
put data along with initial flows at 12 points f
y Flow Data Editor. Figure 5.12 represents dif
ions and initial flows. Figure 5.13 illustrates th
onditions.
t steps of entering boundary conditions and init
en entered as
r the selected
erent steps of
e locations of
ial flows

7/29/2019 Impact Assessment of Predicted Sea Level Rise and Storm Surge on Coastal Embankments of Some Selected Pold…
http://slidepdf.com/reader/full/impact-assessment-of-predicted-sea-level-rise-and-storm-surge-on-coastal-embankments 71/123
Figure 5.13:
Flow Hydrograph
Flow Hydrograph
Stage Hydrograph
Stage Hydrograph
59
Locations of application of boundary condition
Flow
Stage
s
ydrograph
ydrograph

7/29/2019 Impact Assessment of Predicted Sea Level Rise and Storm Surge on Coastal Embankments of Some Selected Pold…
http://slidepdf.com/reader/full/impact-assessment-of-predicted-sea-level-rise-and-storm-surge-on-coastal-embankments 72/123
60
5.3.6 Performing Unsteady Flow Simulation
After entering boundary conditions and initial flows for a particular scenario,
unsteady flow simulation has been performed for 48-hr simulation period starting
from 24 May 2009 at 09:00 AM to 26 May 2009 at 09:00 AM. Instruction of the
programs to run has been provided. The programs were Geometry Preprocessor,
Unsteady Flow Simulation and Post Processor. All time intervals under Computation
Settings have been set to 1 hour. Then the Compute button has been clicked to run the
model. Figure 5.13 represents an example of performing unsteady flow simulation.
Figure 5.14: Performing Unsteady Flow Simulation

7/29/2019 Impact Assessment of Predicted Sea Level Rise and Storm Surge on Coastal Embankments of Some Selected Pold…
http://slidepdf.com/reader/full/impact-assessment-of-predicted-sea-level-rise-and-storm-surge-on-coastal-embankments 73/123
61
5.3.7 Model Output and Result Analysis
After the computation the HEC-RAS model provided output as stage hydrograph,
water surface profile and detail output table at individual cross-sections. The result
has been analyzed to obtain the maximum water surface elevation around any
individual polder for a particular scenario that has been then compared with the
embankment crest level of that particular polder to assess the adequacy of the existing
embankment height. In case of finding inadequacy of the existing embankment
height, modification of crest level of the embankment of the polder has been proposed
by adding free board as recommended by BWDB under CEP.

7/29/2019 Impact Assessment of Predicted Sea Level Rise and Storm Surge on Coastal Embankments of Some Selected Pold…
http://slidepdf.com/reader/full/impact-assessment-of-predicted-sea-level-rise-and-storm-surge-on-coastal-embankments 74/123
62
CHAPTER 6
RESULTS AND DISCUSSION
6.1 Performance of embankments of the selected polders during cyclone AILA
During the field visit the existing condition of the embankments of the selected
polders was found to very poor. In many parts of the embankments the crest width has
been decreased to about 1 m only instead of 4.27 m. The riverside slopes of the
embankments were out of proper shape due to severe erosion as well due to the
impact of cyclone AILA. The country side slopes were rather in better shape. The
height of the embankments has been proved to be inadequate to resist storm surges
like AILA as shown in Table 6.1. The area of inundation indicates to the inadequateheight of the existing embankments and the number of breaches proves the weakness
of the embankments to resist storm surge and to survive high velocity flow.
Table 6.1: Damages to the selected polders due to cyclone Aila
Polder
No.
Area
Inundated
Breach
Points
Regulator(s)
Damaged
Estimated Surge Height Above
Embankment Crest Level
15 100% 10 1 1.5 m
7/1 70% 5 0 1.0 m
7/2 20% 2 1 0.0-1.0 m
Some of the breaches in the embankments have been repaired shortly after the
cyclone Aila. In other cases ring embankments were constructed around the breaches
inward the country side of the breached embankments. The ring embankments were
typically built with the crest level at 4.27 mPWD, crest width of 2.5 m and a slope of
1:2 on both sides of the embankment.

7/29/2019 Impact Assessment of Predicted Sea Level Rise and Storm Surge on Coastal Embankments of Some Selected Pold…
http://slidepdf.com/reader/full/impact-assessment-of-predicted-sea-level-rise-and-storm-surge-on-coastal-embankments 75/123
63
According to the engineers of BWDB, Satkhira Zone, such damages to the polders
during cyclone AILA occurred due to the following reasons:
• AILA took place during high tide. This made the overtopping easier and
overtopping caused the breaching of the embankments.
• The embankments were never built to protect the polder against storm surges.
These polders can protect the normal tide only.
• The total length of the embankment of a polder should be re-sectioned in
every 4 years. But very few parts of the embankments were re-sectioned since
2000.
• The workmanship during earlier re-sectioning works might have not beendone properly.
• Numerous boring of pipes through the embankments for shrimp culture caused
undermining and erosion of the embankments.
Again according to the Satkhira BWDB engineers an overall design modification of
the embankments of the polders considering climate change and sea level rise in
future is very necessary and should be implemented as soon as possible. These
embankments have been constructed during the 1960s which served at a highly
satisfactory level for many years but recent climate change conditions and sea level
rise have made these embankments inadequate to protect the polders from storm
surges. It has been recommended by the engineers that the height of the embankments
should be raised by atleast a meter and the crest width should be doubled.
Figure 6.1, Figure 6.2, and Figure 6.3 illustrate the breach points of the embankments
and area of inundation of individual polders due to cyclone AILA. From the figures it
has been found that the eastern side of the polders experienced more damages than the
western side. Images from the study area taken during field visit have been presented
in figure 6.4.

7/29/2019 Impact Assessment of Predicted Sea Level Rise and Storm Surge on Coastal Embankments of Some Selected Pold…
http://slidepdf.com/reader/full/impact-assessment-of-predicted-sea-level-rise-and-storm-surge-on-coastal-embankments 76/123
64
Figure 6.1: Illustration of damages to Polder no. 15 due to cyclone AILA
Breach Point of Embankment
Inundated Area

7/29/2019 Impact Assessment of Predicted Sea Level Rise and Storm Surge on Coastal Embankments of Some Selected Pold…
http://slidepdf.com/reader/full/impact-assessment-of-predicted-sea-level-rise-and-storm-surge-on-coastal-embankments 77/123
Figure 6.2: Illustra
Breach Point
Inundated Are
65
ion of damages to Polder no. 7/1 due to cyclon
f Embankment
a
AILA

7/29/2019 Impact Assessment of Predicted Sea Level Rise and Storm Surge on Coastal Embankments of Some Selected Pold…
http://slidepdf.com/reader/full/impact-assessment-of-predicted-sea-level-rise-and-storm-surge-on-coastal-embankments 78/123
Figure 6.3: Illustra
66
ion of damages to Polder no. 7/2 due to cyclon
Breach Point of
Inundated Area
AILA
Embankment

7/29/2019 Impact Assessment of Predicted Sea Level Rise and Storm Surge on Coastal Embankments of Some Selected Pold…
http://slidepdf.com/reader/full/impact-assessment-of-predicted-sea-level-rise-and-storm-surge-on-coastal-embankments 79/123
67
Damaged Embankment
amaged Permanent Protection Work

7/29/2019 Impact Assessment of Predicted Sea Level Rise and Storm Surge on Coastal Embankments of Some Selected Pold…
http://slidepdf.com/reader/full/impact-assessment-of-predicted-sea-level-rise-and-storm-surge-on-coastal-embankments 80/123
68
Embankment Repairing Work
Re-sectioned Embankment

7/29/2019 Impact Assessment of Predicted Sea Level Rise and Storm Surge on Coastal Embankments of Some Selected Pold…
http://slidepdf.com/reader/full/impact-assessment-of-predicted-sea-level-rise-and-storm-surge-on-coastal-embankments 81/123
Figure 6.
69
Temporary Protection Work
Damaged Ring Embankment
: Images from the study area during field visit

7/29/2019 Impact Assessment of Predicted Sea Level Rise and Storm Surge on Coastal Embankments of Some Selected Pold…
http://slidepdf.com/reader/full/impact-assessment-of-predicted-sea-level-rise-and-storm-surge-on-coastal-embankments 82/123
70
6.2 Adequacy of the existing embankment height
The adequacy of the existing embankment height of the selected polders has been
assessed by analyzing the results of the HEC-RAS based 1-D hydrodynamic
modeling. Maximum water level found from model output around individual polders
for the scenario considered in this study has been presented in Table 6.2.
Table 6.2: Maximum water level around individual polders
Scenario Track of AILA + SIDR + 1.5 m SLR + High Tide
Polder no. Maximum Water Level
(mPWD)
Embankment Crest Level
(mPWD)
Remarks
15 8.63 4.27 Inadequate
7/1 8.69 4.27 Inadequate
7/2 8.82 4.27 Inadequate
From Table 6.2 it has been found that embankments of all the three polders will be
overtopped for the considered scenario and thus the embankment height of each of the
selected polders are inadequate against the scenario considering simultaneous impact
of predicted sea level rise and storm surge at high tide.
Figure 6.5, Figure 6.6 and Figure 6.7 present the Stage Hydrograph, maximum water
level and detailed output table at a cross-section respectively around Polder 15 due to
SIDR along the track of AILA at high tide with 1.5 m SLR.
Figure 6.8, Figure 6.9 and Figure 6.10 present the Stage Hydrograph, maximum water
level and detailed output table at a cross-section respectively around Polder 7/1 due to
SIDR along the track of AILA at high tide with 1.5 m SLR.
Figure 6.11, Figure 6.12 and Figure 6.13 present the Stage Hydrograph, maximum
water level and detailed output table at a cross-section respectively around Polder 7/2
due to SIDR along the track of AILA at high tide with 1.5 m SLR.

7/29/2019 Impact Assessment of Predicted Sea Level Rise and Storm Surge on Coastal Embankments of Some Selected Pold…
http://slidepdf.com/reader/full/impact-assessment-of-predicted-sea-level-rise-and-storm-surge-on-coastal-embankments 83/123
Figure 6.5: Stage Hydrograph at a cross-s
71
ction around Polder 15 during SIDR along the track of AILA wit

7/29/2019 Impact Assessment of Predicted Sea Level Rise and Storm Surge on Coastal Embankments of Some Selected Pold…
http://slidepdf.com/reader/full/impact-assessment-of-predicted-sea-level-rise-and-storm-surge-on-coastal-embankments 84/123
72
Figure 6.6: Maximum water level at a cross-section around Polder 15 during SIDR along the track of AILA w

7/29/2019 Impact Assessment of Predicted Sea Level Rise and Storm Surge on Coastal Embankments of Some Selected Pold…
http://slidepdf.com/reader/full/impact-assessment-of-predicted-sea-level-rise-and-storm-surge-on-coastal-embankments 85/123
73
Figure 6.7: Detailed output table at a cross-section around Polder 15 during SIDR along the track of AILA wi

7/29/2019 Impact Assessment of Predicted Sea Level Rise and Storm Surge on Coastal Embankments of Some Selected Pold…
http://slidepdf.com/reader/full/impact-assessment-of-predicted-sea-level-rise-and-storm-surge-on-coastal-embankments 86/123
Figure 6.8: Stage Hydrograph at a cross-se
74
ction around Polder 7/1 during SIDR along the track of AILA wit

7/29/2019 Impact Assessment of Predicted Sea Level Rise and Storm Surge on Coastal Embankments of Some Selected Pold…
http://slidepdf.com/reader/full/impact-assessment-of-predicted-sea-level-rise-and-storm-surge-on-coastal-embankments 87/123
75
Figure 6.9: Maximum water level at a cross-section around Polder 7/1 during SIDR along the track of AILA w

7/29/2019 Impact Assessment of Predicted Sea Level Rise and Storm Surge on Coastal Embankments of Some Selected Pold…
http://slidepdf.com/reader/full/impact-assessment-of-predicted-sea-level-rise-and-storm-surge-on-coastal-embankments 88/123
76
Figure 6.10: Detailed output table at a cross-section around Polder 7/1 during SIDR along the track of AILA w

7/29/2019 Impact Assessment of Predicted Sea Level Rise and Storm Surge on Coastal Embankments of Some Selected Pold…
http://slidepdf.com/reader/full/impact-assessment-of-predicted-sea-level-rise-and-storm-surge-on-coastal-embankments 89/123
77
Figure 6.11: Stage Hydrograph at a cross-section around Polder 7/2 during SIDR along the track of AILA wi

7/29/2019 Impact Assessment of Predicted Sea Level Rise and Storm Surge on Coastal Embankments of Some Selected Pold…
http://slidepdf.com/reader/full/impact-assessment-of-predicted-sea-level-rise-and-storm-surge-on-coastal-embankments 90/123
78
Figure 6.12: Maximum water level at a cross-section around Polder 7/2 during SIDR along the track of AILA w
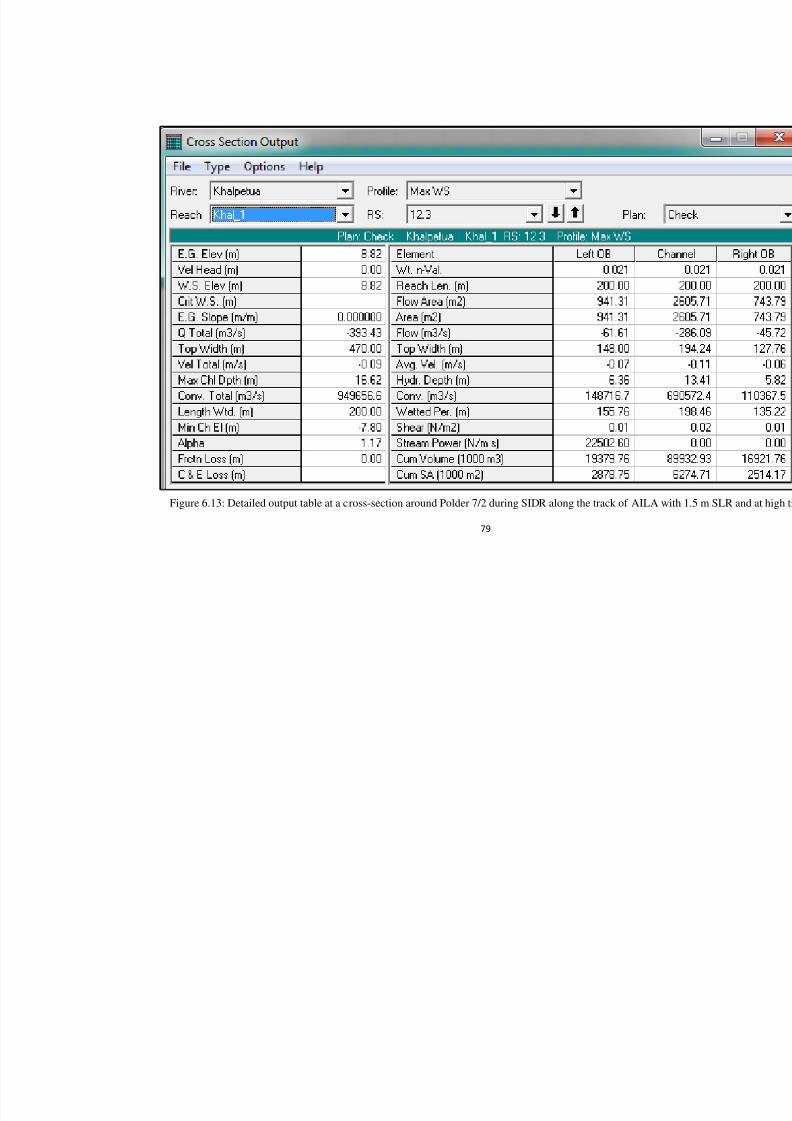
7/29/2019 Impact Assessment of Predicted Sea Level Rise and Storm Surge on Coastal Embankments of Some Selected Pold…
http://slidepdf.com/reader/full/impact-assessment-of-predicted-sea-level-rise-and-storm-surge-on-coastal-embankments 91/123
79
Figure 6.13: Detailed output table at a cross-section around Polder 7/2 during SIDR along the track of AILA w

7/29/2019 Impact Assessment of Predicted Sea Level Rise and Storm Surge on Coastal Embankments of Some Selected Pold…
http://slidepdf.com/reader/full/impact-assessment-of-predicted-sea-level-rise-and-storm-surge-on-coastal-embankments 92/123
80
The criteria for fixing the crest level of an interior dyke is as followed:
Design crest level of dyke = Design water level + Free board
The design water level corresponding to 20 years return period has been calculated
from the model. According to the Table 2.9 a free board of 0.91 m should be provided
for an interior dyke. As all the embankments considered in this study are interior
dykes the design crest level of the embankments of the selected polders should be as
presented in Table 6.3.
Table 6.3: Design crest level of the embankments of selected polders
Polder No. Design Water Level
(mPWD)
Free Board
(m)
Design Crest Level
(mPWD)
15 8.63 0.91 9.54
7/1 8.69 0.91 9.60
7/2 8.82 0.91 9.73

7/29/2019 Impact Assessment of Predicted Sea Level Rise and Storm Surge on Coastal Embankments of Some Selected Pold…
http://slidepdf.com/reader/full/impact-assessment-of-predicted-sea-level-rise-and-storm-surge-on-coastal-embankments 93/123
81
CHAPTER 7
CONCLUSIONS AND RECOMMENDATIONS
7.1 Conclusions
The coastal zone of Bangladesh is very much vulnerable to cyclonic storm surge
because of geographical setting and sea level rise due to global warming will be the
additional threat to this area. According to 4th
IPCC report both intensity and
frequency of storm surge will be increased in the Bay of Bengal in the coming future.
Considering all of these, Bangladesh coastal area will be under severe threat if no
remedial measures are taken immediately.
In this study the performance of coastal embankments of polder no. 15, 7/1 and 7/2
during the cyclone Aila has been assessed through field visit. It has been found that
these embankments constructed during the 1960s have now been unable to protect the
polders from the impact of storm surge. Climate change and associated sea level rise
will make the embankments more inadequate to resist storm surges.
From mathematical modeling it has been found that embankment height of the polders
selected for this study are not sufficient to resist the simultaneous impact of SLR and
cyclonic storm surge associated with high tide. In this study SIDR has been selected
as cyclonic storm as it is the most devastating than other historical cyclonic storm and
also because the original wind speed of SIDR (225 kmph) corresponds to that of a
cyclone with a return period of 20 years (223 kmph).
According to the 4th
IPCC Report if temperature is increased by 4oC wind speed will
be increased by 10%. Thus considering temperature would increase by 4o
C in the year
2100 the wind speed of cyclone SIDR has been considered as 248 kmph in
mathematical modeling. The cyclone has been considered to travel along the track of
AILA with 1.5 m SLR at high tide.

7/29/2019 Impact Assessment of Predicted Sea Level Rise and Storm Surge on Coastal Embankments of Some Selected Pold…
http://slidepdf.com/reader/full/impact-assessment-of-predicted-sea-level-rise-and-storm-surge-on-coastal-embankments 94/123
82
In case of polder no. 15 surge height has been found to be 4.36 m above the crest level
of existing embankment where as in polder no. 7/1 it would be 4.42 m and in polder
no. 7/2 it would be 4.55 m. So it is essential to raise the embankment height with
proper redesign to protect the people and their livelihood inside the polders.
Finally the crest level for the selected polders has been calculated. In case of polder
no. 15 crest level is 9.64 mPWD. Again in case of polder no. 7/1 crest level is 9.8
mPWD and in case of polder no. 7/2 crest level is 9.93 mPWD. In all cases the
suggested crest level is much higher than the existing one and all the suggested height
are for the year 2100 considering 1.5 m sea level rise and normal high tide.
It is extremely important to reconsider the existing coastal infrastructure based on this
and redesign existing coastal embankments to rehabilitate these structures and make it
climate resilient. The risk of sea level rise and cyclonic storm surge are to be
considered for future planning and design of coastal structure. Proper adaptation
measures both structural and non-structural are to be planned in order to find a climate
resilient coastal environment for coastal people and their livelihood security.
7.2 Recommendations
Similar studies can be carried out in the other polders of the coastal zone and the
results can be compared with the results of this research work.
Only the extreme climate change scenario has been considered in this study. Inclusion
of more scenarios will enhance the quality of the study.
Change in bathymetry by the year 2100 has not been considered in this study.
Analysis based on change in bathymetry by the selected year will provide more
accurate results.
Bathymetry data of 1990-2003 has been used in this study. Inclusion of more recent
bathymetry will improve the reliability of the model results of the present study.

7/29/2019 Impact Assessment of Predicted Sea Level Rise and Storm Surge on Coastal Embankments of Some Selected Pold…
http://slidepdf.com/reader/full/impact-assessment-of-predicted-sea-level-rise-and-storm-surge-on-coastal-embankments 95/123
83
REFERENCES
1. Agrawala, S., Ota, T., Ahmed, A.U., Smoth, J., Aalst, M.V., 2003,
“Development and Climate Change in Bangladesh: Focus on Coastal Flooding
and the Sundarbans”, Organization for Economic Co-operation and
Development (OECD), Paris.
2. Ali A., Rahman, H. and Chowdhury, S.S.H., 1997, “River Discharge, Storm
Surges and Tidal Interactions in the Meghna River Mouth in Bangladesh”,
MAUSAM, 48, 4.
3. As–Salek J.A. and Yasuda T., 2001, “Tide–Surge Interaction in the Meghna
Estuary: Most Severe Condition”, Journal of Physical Oceanography, Volume31, pp. 3059-3072.
4. BBS, 2003, “Statistical Yearbook of Bangladesh”, Bangladesh Bureau of
Statistics (BBS), Government of the People’s Republic of Bangladesh, Dhaka.
5. Brammer, H., Asaduzzaman M. & Sultana, P., 1993, “Effects of Climate and
Sea-level Changes on the Natural Resources of Bangladesh”, Briefing
Document No. 3, Bangladesh Unnyan Parishad (BUP), Dhaka.
6. Broadus, J.M., 1993, “Possible Impacts of, and Adjustment to, Sea Level Rise:
The Cases of Bangladesh and Egypt”, Cambridge University Press,
Cambridge.
7. BUET, 2008, “Preparation of Look–up Table and Generation of PRECIS
Scenarios for Bangladesh”, submitted to Climate Change Cell, Department of
Environment, Government of the People’s Republic of Bangladesh, Dhaka.
8. BWDB, 2001, “2nd
Coastal Embankment Rehabilitation Project”, Hydraulic
modeling study, prepared by IWM and DHI for Bangladesh Water
Development Board, Government of the People’s Republic of Bangladesh,
Dhaka.

7/29/2019 Impact Assessment of Predicted Sea Level Rise and Storm Surge on Coastal Embankments of Some Selected Pold…
http://slidepdf.com/reader/full/impact-assessment-of-predicted-sea-level-rise-and-storm-surge-on-coastal-embankments 96/123
84
9. Church, J.A., White, N.J., 2006, “A 20th Century Acceleration in Global Sea
Level Rise”, Geophysical Research Letters 33 (1), L01602.
10. Church, J.A., White, N.J., Coleman, R., Lambek, K., Mitrovica J.X., 2004,
“Estimates of the Regional Distribution of Sea Level Rise over the 1950–2000
Period”, Journal of Climate 17 (13), pp. 2609–2625.
11. CPP II, 1992: “Cyclone Protection Project, Feasibility and Design Studies”,
FAP7, Bangladesh Water Development Board, Government of the People’s
Republic of Bangladesh, Dhaka.
12. CZPo, 2005. “Coastal Zone Policy”, Ministry of Water Resources,
Government of the People’s Republic of Bangladesh, Dhaka.
13. DMB, 2009, “Summary of Cyclonic Storm AILA”, Disaster Management
Bureau, 10 June 2009, Dhaka, Bangladesh.
14. Hasan, M.M. and Navera, U.K., 2010, “Vulnerability of Coastal Islands and
Adaptation Measures for Cyclonic Storm Surge and Climate Change in the
Coastal Area of Bangladesh”, International Climate Change Adaptation
Conference, June 2010, Queensland, Australia.
15. Hasan, M.M., Khan, Z. H., Mohal, N. and Rahman, N., 2008, “Impact
assessment of Sea Level Rise on Coastal Flooding and Livelihood”,
Proceeding of the Third South Asia Water Research Conference, 24-26 May
2008, Dhaka, Bangladesh, pp. 163-174.
16. IPCC, 1990, “Summary for Policymakers”, A Report by Working Group 1 of
the Intergovernmental Panel on Climate Change (IPCC).
17. IPCC, 1995, “Summary for Policymakers”, A Report by Working Group 1 of
the Intergovernmental Panel on Climate Change (IPCC).

7/29/2019 Impact Assessment of Predicted Sea Level Rise and Storm Surge on Coastal Embankments of Some Selected Pold…
http://slidepdf.com/reader/full/impact-assessment-of-predicted-sea-level-rise-and-storm-surge-on-coastal-embankments 97/123
85
18. IPCC, 2001, “Summary for Policymakers”, Contribution of Working Group I
to the Third Assessment Report of the Intergovernmental Panel on Climate
Change (IPCC), Cambridge University Press, Cambridge.
19. IPCC, 2007, “Climate Change 2007: The Physical Science Basis, Summary
for Policymakers”, 10th Session of Working Group I of the IPCC, February
2007, Paris.
20. Islam, M.R. (ed.), 2004, “Where Land Meets the Sea: A Profile of the Coastal
Zone of Bangladesh”, The University Press Ltd., Dhaka.
21. IWM, 2005, “Impact Assessment of Climate Change zone of Bangladesh”,
submitted to WARPO, Government of the People’s Republic of Bangladesh,
Dhaka.
22. IWM, 2009, “Preparation of Inundation Map Considering the Decay Factors
for Landuse, Geomorphology and Slope”, submitted to Comprehensive
Disaster Management Programme, Ministry of Food and Disaster
Management, Government of the People’s Republic of Bangladesh, Dhaka.
23. Jackobsen, F., Azam, M.H., Ahmed, M.M.Z. and Kabir, M.M., (2006),
“Cyclone Storm Surge Levels along the Bangladeshi Coastline in 1876 and
1960-2000”, Coastal Engineering Journal, Volume 48, No.3.
24. Matin, M.A., 2008, “Risk Assessment and Evaluation of probability of
Extreme Hydrological Event: Case study from Noakhali Sadar and
Subarnochar Upazilas”, IUCN Bangladesh, Country office, Dhaka,
Bangladesh, pp. viii+76.
25. Milliman, J.D., Broadus, J.M., Gable, F., 1989, “Environmental and Economic
Implications of Rising Sea Level and Subsidence Deltas: The Nile and Bengal
Examples”, AMBIO 18, pp. 340–345.

7/29/2019 Impact Assessment of Predicted Sea Level Rise and Storm Surge on Coastal Embankments of Some Selected Pold…
http://slidepdf.com/reader/full/impact-assessment-of-predicted-sea-level-rise-and-storm-surge-on-coastal-embankments 98/123
86
26. NAPA, 2005, “Draft National Adaptation of Action”, Government of the
People’s Republic of Bangladesh, Dhaka.
27. OECD, 2003, “Development and Climate Change in Bangladesh: Focus on
Coastal Flooding and the Sundarbans “. Published by OECD.
28. Shahadat, F., Ahmed, M.M.Z., B.C. and Jakobsen, F., 2000 “Numerical
Investment of 1876 Cyclone Surge”, Disaster: Issues and Gender Perspective,
23-24 June, Dhaka.
29. Singh, O. P., Khan, T. M. A. and Rahman, M. S., 2000, “The vulnerability
assessment of SAARC coastal region due to sea level rise: Bangladesh case”,
SMRC Report No. 3, SAARC Meteorological Research Centre, Dhaka,
Bangladesh.
30. SMRC, 1998, “The Impact of Tropical of Cyclone on the Coastal Regions of
SAARC Countries and Their Influence in the Region”, SAARC
Meteorological Research Center Report No.1.
31. UNDP, 2004, “A Global Report: Reducing Disaster Risk: A Challenge for
Development”.
32. World Bank, 2000, “Bangladesh: Climate Change & Sustainable
Development, Report”, No. 21104 BD, Dhaka.
33. Hasan, M.M., 2008, “Impact of Sea Level Rise and Cyclonic Surge on
Selected Coastal Islands of Bangladesh”, M.Sc. Engineering thesis by Md.
Mobassarul Hasan, Department of Water Resources Engineering, BUET,
Dhaka, Bangladesh.
34. Khan, M.R.H., 2009, “Floodplain Inundation Mapping of Kaliganga-
Dhaleswari River Basin”, B.Sc. Engineering thesis by Md. Rakibul Hassan
Khan, Department of Water Resources Engineering, BUET, Dhaka,
Bangladesh.

7/29/2019 Impact Assessment of Predicted Sea Level Rise and Storm Surge on Coastal Embankments of Some Selected Pold…
http://slidepdf.com/reader/full/impact-assessment-of-predicted-sea-level-rise-and-storm-surge-on-coastal-embankments 99/123
87
35. Sarker, T, 2009, “Effect of River Contraction on Siltation Rate of Mongla Port
Using HECRAS”, B.Sc. Engineering thesis by Tonmoy Sarker, Department of
Water Resources Engineering, BUET, Dhaka, Bangladesh.
36. HEC-RAS 4.0 Manual, 2009 (www.hec.usace.army.mil/software/hec-ras).
37. Google Earth.

7/29/2019 Impact Assessment of Predicted Sea Level Rise and Storm Surge on Coastal Embankments of Some Selected Pold…
http://slidepdf.com/reader/full/impact-assessment-of-predicted-sea-level-rise-and-storm-surge-on-coastal-embankments 100/123
88
Appendix-A
Streamline Co-ordinates

7/29/2019 Impact Assessment of Predicted Sea Level Rise and Storm Surge on Coastal Embankments of Some Selected Pold…
http://slidepdf.com/reader/full/impact-assessment-of-predicted-sea-level-rise-and-storm-surge-on-coastal-embankments 101/123
89
Co-ordinates of Kholpetua River
X_COORD Y_COORD X_COORD Y_COORD X_COORD Y_COORD
416640.04964 494424.77869 416852.51691 488208.74907 418633.97325 482096.22914
416667.28903 494310.37324 416841.62115 487898.21998 418557.70295 482014.51096
416754.45509 494103.35385 416836.17327 487571.34726 418437.84962 481911.00127416819.82964 493912.67809 416830.72539 487304.40120 418323.44416 481840.17884
416885.20418 493672.97143 416836.17327 487162.75636 418214.48659 481747.56491
416917.89145 493422.36901 416841.62115 487037.45514 418089.18538 481644.05521
416917.89145 493422.36901 416868.86054 486901.25818 418012.91508 481529.64976
416912.44357 493220.79749 416906.99570 486748.71757 417974.77993 481431.58794
416928.78721 493024.67386 416972.37024 486585.28121 417942.09265 481175.53764
416928.78721 492883.02901 417032.29691 486449.08424 417936.64477 480990.30976
416917.89145 492648.77023 417086.77569 486334.67879 417931.19690 480772.39462
416890.65206 492523.46902 417108.56721 486242.06485 417909.40538 480581.71886
416885.20418 492381.82417 417130.35872 486127.65940 417871.27023 480401.93886
416874.30842 492256.52296 417119.46297 486007.80607 417822.23932 480189.47159
416868.86054 492136.66963 417103.11933 485882.50486 417800.44781 480004.24372
416830.72539 492027.71205 417086.77569 485773.54728 417784.10417 479846.25523
416721.76782 491902.41084 417059.53630 485610.11092 417794.99993 479710.05826
416580.12297 491766.21387 417064.98418 485517.49698 417833.13508 479595.65281
416443.92600 491608.22539 417184.83751 485332.26910 417903.95750 479486.69524
416340.41631 491455.68479 417304.69084 485201.52002 418023.81083 479350.49827
416269.59389 491335.83146 417348.27387 485108.90608 418209.03871 479203.40554
416204.21934 491243.21752 417380.96114 484929.12608 418475.98477 479050.86494
416149.74055 491145.15570 417402.75266 484787.48123 418770.17022 478920.11585
416117.05328 491025.30237 417429.99205 484651.28426 419015.32476 478805.71040416127.94904 490900.00116 417473.57508 484449.71275 419222.34415 478642.27404
416187.87570 490791.04358 417506.26236 484362.54669 419282.27082 478538.76434
416302.28116 490698.42965 417615.21993 484231.79760 419298.61445 478386.22374
416531.09206 490518.64965 417713.28175 484139.18366 419255.03142 478260.92252
416759.90297 490371.55692 417794.99993 484046.56973 419173.31324 478130.17344
416950.57873 490240.80783 417909.40538 483932.16427 419042.56415 478026.66374
417010.50539 490137.29814 418105.52901 483746.93640 418857.33628 477868.67526
417015.95327 490050.13208 418279.86113 483567.15640 418655.76477 477710.68677
416999.60963 489919.38299 418443.29750 483398.27216 418421.50598 477552.69829
416950.57873 489679.67632 418590.39022 483256.62731 418241.72598 477449.18860
416857.96479 489412.73027 418786.51385 483060.50368 417958.43629 477340.23102
416787.14236 489194.81512 418819.20113 482978.78550 417745.96902 477280.30435
416765.35085 489025.93088 418830.09688 482837.14065 417549.84539 477225.82557
416776.24661 488873.39027 418835.54476 482717.28732 417348.27387 477144.10739
416803.48600 488699.05815 418835.54476 482613.77762 417184.83751 477051.49345
416830.72539 488573.75694 418813.75325 482455.78914 417070.43206 476942.53587
416852.51691 488464.79937 418764.72234 482319.59217 416999.60963 476817.23466
416874.30842 488350.39392 418721.13931 482210.63460 416923.33933 476670.14194

7/29/2019 Impact Assessment of Predicted Sea Level Rise and Storm Surge on Coastal Embankments of Some Selected Pold…
http://slidepdf.com/reader/full/impact-assessment-of-predicted-sea-level-rise-and-storm-surge-on-coastal-embankments 102/123
90
X_COORD Y_COORD X_COORD Y_COORD X_COORD Y_COORD
416852.51691 476512.15345 418939.05446 470029.17778 424092.74773 463524.41058
417549.84539 477225.82557 419031.66840 469876.63717 423874.83258 463420.90089
417348.27387 477144.10739 419107.93870 469756.78384 423673.26107 463317.39119
417184.83751 477051.49345 419173.31324 469631.48263 423493.48107 463241.12089
417070.43206 476942.53587 419211.44840 469468.04627 423259.22229 463137.61119416999.60963 476817.23466 419331.30173 469032.21597 423155.71259 463072.23665
416923.33933 476670.14194 419429.36354 468639.96870 423073.99441 462968.72695
416852.51691 476512.15345 419478.39445 468394.81416 422954.14108 462783.49908
416879.75630 476272.44679 419532.87324 468274.96083 422839.73562 462565.58393
416956.02660 475831.16861 419609.14354 468116.97235 422801.60047 462369.46029
417059.53630 475324.51589 419723.54899 467817.33902 422763.46532 462233.26333
417130.35872 474817.86317 419805.26718 467583.08023 422752.56956 462064.37909
417163.04600 474327.55409 419886.98536 467327.02993 422763.46532 461906.39060
417190.28539 473957.09833 419985.04717 466989.26145 422796.15259 461753.85000
417222.97266 473793.66197 420066.76535 466733.21115 422807.04835 461579.51788
417321.03448 473564.85107 420094.00475 466613.35782 422834.28774 461437.87303
417495.36660 473401.41471 420137.58778 466428.12994 422850.63138 461268.98879
417745.96902 473297.90501 420208.41020 466232.00631 422845.18350 461165.47910
418007.46720 473276.11349 420306.47202 466046.77843 422796.15259 460931.22031
418296.20477 473314.24865 420382.74232 465932.37298 422676.29926 460506.28577
418623.07749 473412.31046 420475.35626 465812.51965 422589.13320 460195.75668
418917.26294 473526.71592 420600.65747 465681.77056 422489.44305 459895.21807
419178.76112 473657.46500 420824.02050 465501.99056 422452.93623 459743.58275
419434.81142 473728.28743 421085.51868 465349.44995 422338.53078 459324.09609
419908.77687 473744.63106 421357.91261 465186.01359 422262.26048 459029.91064
420072.21323 473657.46500 421581.27564 465049.81663 422213.22957 458670.35064420251.99323 473352.38380 421837.32594 464929.96329 422196.88593 458272.65550
420202.96232 472992.82380 422066.13685 464826.45360 422267.70836 457973.02217
420066.76535 472660.50320 422256.81260 464766.52693 422436.59260 457646.14944
419914.22475 472437.14017 422665.40350 464668.46511 422610.92472 457411.89066
419652.72657 472175.64199 423014.06774 464646.67360 422710.25190 457306.38341
419358.54112 471979.51836 423389.97137 464668.46511 422856.07926 457210.31915
419091.59506 471821.52988 423760.42713 464701.15239 423155.71259 457046.88278
418846.44052 471636.30200 424114.53924 464755.63117 425187.77135 456937.92521
418628.52537 471434.73049 424446.85985 464695.70451 425596.36226 456921.58157
418590.39022 471309.42928 424708.35802 464608.53845 426168.38952 456883.44642
418546.80719 471129.64928 424844.55499 464477.78936 426696.83376 456861.65491
418508.67204 470988.00443 424871.79439 464281.66573 427263.41315 456818.07188
418530.46355 470840.91171 424871.79439 464080.09421 427726.48284 456790.83248
418650.31689 470601.20504 424724.70166 463905.76209 428178.65677 456725.45794
418753.82658 470394.18565 424517.68227 463775.01300 428412.91556 456709.11430
418851.88840 470181.71838 424316.11076 463633.36816 428663.51798 456665.53127

7/29/2019 Impact Assessment of Predicted Sea Level Rise and Storm Surge on Coastal Embankments of Some Selected Pold…
http://slidepdf.com/reader/full/impact-assessment-of-predicted-sea-level-rise-and-storm-surge-on-coastal-embankments 103/123
91
Co-ordinates of Kobadak River
X_COORD Y_COORD X_COORD Y_COORD X_COORD Y_COORD
428663.51798 456665.53127 429709.51069 464515.92451 423640.57380 469566.10809
428794.26707 456921.58157 429513.38706 464613.98633 423455.34592 469778.57536
429028.52585 457319.27672 429355.39857 464673.91299 423275.56592 470029.17778429213.75373 457586.22278 429213.75373 464701.15239 423172.05623 470247.09293
429339.05494 457853.16883 429012.18221 464695.70451 423166.60835 470519.48686
429453.46039 458147.35429 428739.78828 464663.01724 423188.39986 470710.16262
429453.46039 458370.71731 428380.22828 464564.95542 423226.53501 470862.70322
429426.22100 458626.76761 428058.80344 464494.13300 423362.73198 471015.24383
429197.41009 458910.05731 427829.99253 464445.10209 423537.06410 471102.40988
428995.83858 459106.18094 427568.49435 464368.83179 423765.87501 471080.61837
428837.85010 459264.16942 427252.51739 464319.80088 423967.44652 471026.13958
428668.96586 459405.81427 427056.39375 464292.56148 424179.91379 470955.31716
428516.42525 459542.01124 426882.06163 464287.11360 424419.62045 470879.04686
428260.37495 459754.47851 426713.17739 464292.56148 424621.19197 470791.88080
428037.01192 459977.84154 426571.53255 464379.72754 424784.62833 470710.16262
427846.33617 460195.75668 426462.57497 464510.47663 424926.27317 470666.57959
427726.48284 460337.40153 426386.30467 464717.49602 425111.50105 470622.99656
427628.42102 460468.15062 426310.03437 464946.30693 425274.93741 470672.02747
427535.80708 460609.79547 426250.10770 465098.84753 425416.58226 470759.19353
427481.32829 460778.67971 426195.62892 465251.38814 425536.43559 470873.59898
427410.50587 460936.66819 426130.25437 465458.40753 425569.12286 471075.17049
427426.84951 461165.47910 426119.35861 465627.29177 425547.33135 471353.01231
427475.88042 461361.60273 426103.01498 465779.83237 425492.85256 471576.37533
427573.94223 461579.51788 426097.56710 465970.50813 425427.47802 471826.97775427759.17011 461764.74576 426070.32771 466166.63176 425334.86408 472077.58018
428031.56404 461955.42151 425977.71377 466444.47358 425269.48953 472279.15169
428293.06222 462102.51424 425912.33922 466662.38873 425209.56287 472464.37957
428543.66464 462255.05484 425836.06892 466874.85600 425106.05317 472753.11714
428734.34040 462374.90817 425727.11135 467060.08387 425002.54348 472992.82380
428946.80767 462489.31363 425618.15377 467261.65539 424942.61681 473287.00925
429202.85797 462658.19787 425465.61317 467479.57053 424888.13802 473581.19470
429420.77312 462794.39483 425296.72893 467637.55902 424860.89863 473831.79712
429589.65736 462919.69605 425127.84469 467811.89114 424855.45075 474049.71227
429747.64584 463055.89301 424969.85620 467953.53598 424866.34651 474224.04439
429911.08220 463257.46453 424790.07621 468089.73295 424741.04530 474311.21045
430025.48766 463410.00513 424653.87924 468264.06507 424539.47378 474431.06378
430101.75796 463611.57664 424523.13015 468389.36628 424359.69379 474496.43833
430145.34099 463775.01300 424392.38106 468574.59416 424179.91379 474518.22984
430167.13250 463933.00149 424218.04894 468732.58264 423945.65500 474447.40742
430139.89311 464107.33361 424076.40409 468955.94567 423793.11440 474392.92863
430036.38341 464281.66573 423940.20713 469179.30870 423596.99077 474256.73166
429905.63433 464406.96694 423793.11440 469375.43233 423395.41925 474125.98258

7/29/2019 Impact Assessment of Predicted Sea Level Rise and Storm Surge on Coastal Embankments of Some Selected Pold…
http://slidepdf.com/reader/full/impact-assessment-of-predicted-sea-level-rise-and-storm-surge-on-coastal-embankments 104/123
92
X_COORD Y_COORD X_COORD Y_COORD X_COORD Y_COORD
423123.02532 473984.33773 422638.16411 482085.33339 425563.67498 486231.16909
422926.90168 473869.93228 422752.56956 482335.93581 425351.20771 486329.23091
422779.80896 473826.34925 422850.63138 482488.47641 425165.97984 486410.94909
422621.82047 473771.87046 423019.51562 482608.32974 424969.85620 486509.01091
422393.00957 473777.31834 423221.08713 482646.46490 424768.28469 486623.41636422218.67745 473842.69288 423406.31501 482641.01702 424588.50469 486726.92606
422104.27200 473973.44197 423640.57380 482624.67338 424414.17257 486852.22727
422000.76230 474125.98258 423847.59319 482624.67338 424228.94470 486966.63272
421968.07503 474376.58500 424027.37318 482722.73520 424136.33076 487091.93393
422055.24109 474676.21833 424076.40409 482815.34914 424021.92531 487228.13090
422213.22957 474888.68560 424098.19561 482929.75459 423891.17622 487402.46302
422409.35320 475024.88256 424087.29985 483055.05580 423793.11440 487527.76423
422616.37260 475193.76680 424021.92531 483196.70065 423700.50046 487702.09635
422790.70471 475286.38074 423940.20713 483371.03277 423591.54289 487865.53271
423008.61986 475449.81710 423863.93682 483572.60428 423488.03319 488072.55210
423204.74350 475591.46195 423825.80167 483725.14488 423417.21077 488246.88422
423444.45016 475765.79407 423793.11440 483915.82064 423357.28410 488470.24725
423602.43864 475940.12619 423782.21864 484084.70488 423286.46168 488682.71452
423716.84410 476141.69770 423853.04107 484210.00609 423231.98289 488900.62967
423809.45804 476365.06073 423940.20713 484346.20306 423204.74350 489096.75330
423863.93682 476642.90254 424136.33076 484444.26487 423188.39986 489271.08542
423836.69743 477007.91042 424316.11076 484520.53518 423177.50410 489489.00057
423793.11440 477263.96072 424550.36954 484569.56608 423182.95198 489739.60299
423700.50046 477503.66738 424751.94105 484585.90972 423204.74350 490039.23632
423575.19925 477716.13465 424980.75196 484645.83639 423182.95198 490311.63026
423406.31501 477917.70617 425236.80226 484678.52366 423193.84774 490605.81571
423286.46168 478064.79889 425471.06105 484738.45032 423172.05623 490998.06298
423090.33804 478260.92252 425754.35074 484809.27275 423112.12956 491275.90479
422937.79744 478451.59828 425955.92225 484869.19941 423019.51562 491640.91266
422801.60047 478642.27404 426168.38952 484934.57396 422932.34956 491847.93206
422676.29926 478865.63706 426375.40891 485016.29214 422812.49623 492060.39933
422556.44593 479094.44797 426522.50164 485098.01032 422649.05987 492245.62720
422409.35320 479366.84190 426626.01133 485174.28062 422442.04048 492447.19871
422305.84351 479628.34008 426696.83376 485266.89456 422311.29139 492588.84356
422224.12533 479895.28614 426734.96891 485381.30001 422169.64654 492752.27992
422180.54230 480162.23220 426740.41679 485512.04910 422038.89745 492921.16416422169.64654 480538.13583 426702.28164 485648.24607 421940.83563 493030.12174
422213.22957 480837.76916 426571.53255 485773.54728 421848.22170 493215.34961
422289.49987 481088.37158 426418.99194 485866.16122 421793.74291 493373.33810
422322.18714 481317.18249 426168.38952 485964.22304 421761.05564 493580.35749
422393.00957 481507.85824 425961.37013 486051.38910 421750.15988 493711.10658
422491.07139 481753.01278 425776.14225 486127.65940 421744.71200 493858.19930

7/29/2019 Impact Assessment of Predicted Sea Level Rise and Storm Surge on Coastal Embankments of Some Selected Pold…
http://slidepdf.com/reader/full/impact-assessment-of-predicted-sea-level-rise-and-storm-surge-on-coastal-embankments 105/123
93
X_COORD Y_COORD X_COORD Y_COORD Galghasia River
421722.92049 493988.94839 417942.09265 495367.26171
421830.50343 494042.57696 417784.10417 495405.39686 X_COORD Y_COORD
421917.66949 494107.95150 417631.56357 495421.74050 416852.51691 476512.15345
422010.28342 494222.35696 417457.23145 495448.97989 416613.10788 476659.37902
422097.44948 494325.86665 417315.58660 495432.63625 416471.46304 476741.09720422211.85494 494565.57332 --- --- 416302.57880 476822.81539
422277.22948 494761.69695 416640.04964 494424.77869 416122.79880 476915.42932
422353.49978 494946.92483 416565.33007 494425.36458 415943.01880 476986.25175
422418.87433 495110.36119 416512.33311 494416.99664 415763.23880 477062.52205
422495.14463 495252.00603 416464.91477 494389.10350 415594.35456 477122.44871
422571.41493 495350.06785 416423.07506 494361.21036 415436.36608 477182.37538
416370.07810 494313.79202 415283.82548 477231.40629
416305.92388 494258.00574 415169.42002 477258.64568
Morirchap River 416252.92691 494213.37672
416188.77269 494143.64387
X_COORD Y_COORD 416119.03985 494079.48965 Kalagachi River
421722.92049 493988.94839 416068.83220 494023.70338
421586.72352 494136.04112 416015.83523 493959.54916 X_COORD Y_COORD
421406.94352 494299.47748 415979.57415 493906.55219 422710.25190 457306.38341
421199.92413 494446.57021 422383.05368 456825.20955
421047.38352 494533.73627 422277.19543 456642.36348
420922.08231 494593.66293 Betna River 422161.71370 456478.76436
420780.43747 494659.03748 422036.60849 456334.41220
420633.34474 494718.96414 X_COORD Y_COORD 421911.50329 456151.56613
420486.25202 494757.09929 416926.93889 496037.42381 421786.39808 455987.96702
420311.91990 494784.33869 416983.59683 495980.76587 421642.04592 455833.99138420159.37929 494784.33869 417031.53817 495928.46624 421507.31724 455718.50966
420017.73445 494757.09929 417075.12120 495880.52491 421343.71813 455631.89836
419870.64172 494735.30778 417118.70423 495797.71715
419712.65324 494675.38111 417166.64556 495701.83448
419521.97748 494571.87142 417218.94519 495605.95182 Arpangasia River
419413.01991 494522.84051 417262.52822 495514.42746
419293.16658 494452.01808 417315.58660 495432.63625 X_COORD Y_COORD
419200.55264 494419.33081 417173.94175 495274.64777 428663.51798 456665.53127
419097.04294 494424.77869 417032.29691 495040.38899 428936.64172 456459.51741
418971.74173 494457.46596 416917.89145 494866.05687 429100.24083 456257.42439
418873.67991 494555.52778 416814.38176 494697.17263 429254.21647 456055.33136
418742.93082 494675.38111 416710.87206 494555.52778 429427.43906 455853.23834
418606.73386 494838.81747 416640.04964 494424.77869 429542.92079 455651.14532
418492.32840 494975.01444 429648.77904 455410.55838
418399.71447 495111.21141 429735.39033 455198.84188
418268.96538 495236.51262 429802.75467 454996.74886
418110.97689 495301.88716

7/29/2019 Impact Assessment of Predicted Sea Level Rise and Storm Surge on Coastal Embankments of Some Selected Pold…
http://slidepdf.com/reader/full/impact-assessment-of-predicted-sea-level-rise-and-storm-surge-on-coastal-embankments 106/123
94
Appendix-B
Cross-Section Data

7/29/2019 Impact Assessment of Predicted Sea Level Rise and Storm Surge on Coastal Embankments of Some Selected Pold…
http://slidepdf.com/reader/full/impact-assessment-of-predicted-sea-level-rise-and-storm-surge-on-coastal-embankments 107/123
95
Cross-Section: Kholpetua 0.00
Cross-Section: Kholpetua 8500.00

7/29/2019 Impact Assessment of Predicted Sea Level Rise and Storm Surge on Coastal Embankments of Some Selected Pold…
http://slidepdf.com/reader/full/impact-assessment-of-predicted-sea-level-rise-and-storm-surge-on-coastal-embankments 108/123
96
ross-Section: Kholpetua 21000.00
ross-Section: Kholpetua 21010.00

7/29/2019 Impact Assessment of Predicted Sea Level Rise and Storm Surge on Coastal Embankments of Some Selected Pold…
http://slidepdf.com/reader/full/impact-assessment-of-predicted-sea-level-rise-and-storm-surge-on-coastal-embankments 109/123
97
ross-Section: Kholpetua 38000.00
ross-Section: Kholpetua 41000.00

7/29/2019 Impact Assessment of Predicted Sea Level Rise and Storm Surge on Coastal Embankments of Some Selected Pold…
http://slidepdf.com/reader/full/impact-assessment-of-predicted-sea-level-rise-and-storm-surge-on-coastal-embankments 110/123
98
ross-Section: Kholpetua 46000.00
ross-Section: Kholpetua 49500.00

7/29/2019 Impact Assessment of Predicted Sea Level Rise and Storm Surge on Coastal Embankments of Some Selected Pold…
http://slidepdf.com/reader/full/impact-assessment-of-predicted-sea-level-rise-and-storm-surge-on-coastal-embankments 111/123
99
ross-Section: Kholpetua 555000.00
ross-Section: Kobadak 189000.00

7/29/2019 Impact Assessment of Predicted Sea Level Rise and Storm Surge on Coastal Embankments of Some Selected Pold…
http://slidepdf.com/reader/full/impact-assessment-of-predicted-sea-level-rise-and-storm-surge-on-coastal-embankments 112/123
100
ross-Section: Kobadak 190000.00
ross-Section: Kobadak 204000.00

7/29/2019 Impact Assessment of Predicted Sea Level Rise and Storm Surge on Coastal Embankments of Some Selected Pold…
http://slidepdf.com/reader/full/impact-assessment-of-predicted-sea-level-rise-and-storm-surge-on-coastal-embankments 113/123
101
ross-Section: Kobadak 204010.00
ross-Section: Kobadak 207500.00

7/29/2019 Impact Assessment of Predicted Sea Level Rise and Storm Surge on Coastal Embankments of Some Selected Pold…
http://slidepdf.com/reader/full/impact-assessment-of-predicted-sea-level-rise-and-storm-surge-on-coastal-embankments 114/123
102
ross-Section: Kobadak 211500.00
ross-Section: Kobadak 225000.00

7/29/2019 Impact Assessment of Predicted Sea Level Rise and Storm Surge on Coastal Embankments of Some Selected Pold…
http://slidepdf.com/reader/full/impact-assessment-of-predicted-sea-level-rise-and-storm-surge-on-coastal-embankments 115/123
103
ross-Section: Kobadak 244000.00
ross-Section: Kobadak 246000.00

7/29/2019 Impact Assessment of Predicted Sea Level Rise and Storm Surge on Coastal Embankments of Some Selected Pold…
http://slidepdf.com/reader/full/impact-assessment-of-predicted-sea-level-rise-and-storm-surge-on-coastal-embankments 116/123
104
Cross-Section: Morirchap 0.00
ross-Section: Morirchap 5000.00

7/29/2019 Impact Assessment of Predicted Sea Level Rise and Storm Surge on Coastal Embankments of Some Selected Pold…
http://slidepdf.com/reader/full/impact-assessment-of-predicted-sea-level-rise-and-storm-surge-on-coastal-embankments 117/123
105
ross-Section: Morirchap 7000.00
Cross-Section: Betna 86750.00

7/29/2019 Impact Assessment of Predicted Sea Level Rise and Storm Surge on Coastal Embankments of Some Selected Pold…
http://slidepdf.com/reader/full/impact-assessment-of-predicted-sea-level-rise-and-storm-surge-on-coastal-embankments 118/123
106
Cross-Section: Betna 90500.00
Cross-Section: Betna 91500.00

7/29/2019 Impact Assessment of Predicted Sea Level Rise and Storm Surge on Coastal Embankments of Some Selected Pold…
http://slidepdf.com/reader/full/impact-assessment-of-predicted-sea-level-rise-and-storm-surge-on-coastal-embankments 119/123
107
ross-Section: Galghasia 20500.00
Cross-Section: Arpangasia 0.00

7/29/2019 Impact Assessment of Predicted Sea Level Rise and Storm Surge on Coastal Embankments of Some Selected Pold…
http://slidepdf.com/reader/full/impact-assessment-of-predicted-sea-level-rise-and-storm-surge-on-coastal-embankments 120/123
108
Arpangasia 2400.00
Cross-Section: Kalagachi 0.00

7/29/2019 Impact Assessment of Predicted Sea Level Rise and Storm Surge on Coastal Embankments of Some Selected Pold…
http://slidepdf.com/reader/full/impact-assessment-of-predicted-sea-level-rise-and-storm-surge-on-coastal-embankments 121/123
109
Appendix-C
Flow Hydrographs and Stage Hydrographs

7/29/2019 Impact Assessment of Predicted Sea Level Rise and Storm Surge on Coastal Embankments of Some Selected Pold…
http://slidepdf.com/reader/full/impact-assessment-of-predicted-sea-level-rise-and-storm-surge-on-coastal-embankments 122/123
Flo
Flo
Fl
St
110
Hydrograph at Galghasia 15625.00
Hydrograph at Kobadak 185755.00
ow Hydrograph at Betna 867500.00
ge Hydropgraph at Arpangasia 0.00

7/29/2019 Impact Assessment of Predicted Sea Level Rise and Storm Surge on Coastal Embankments of Some Selected Pold…
http://slidepdf.com/reader/full/impact-assessment-of-predicted-sea-level-rise-and-storm-surge-on-coastal-embankments 123/123
Stage Hydrograph at Kalagachi 0.00