Embed Size (px)
Citation preview
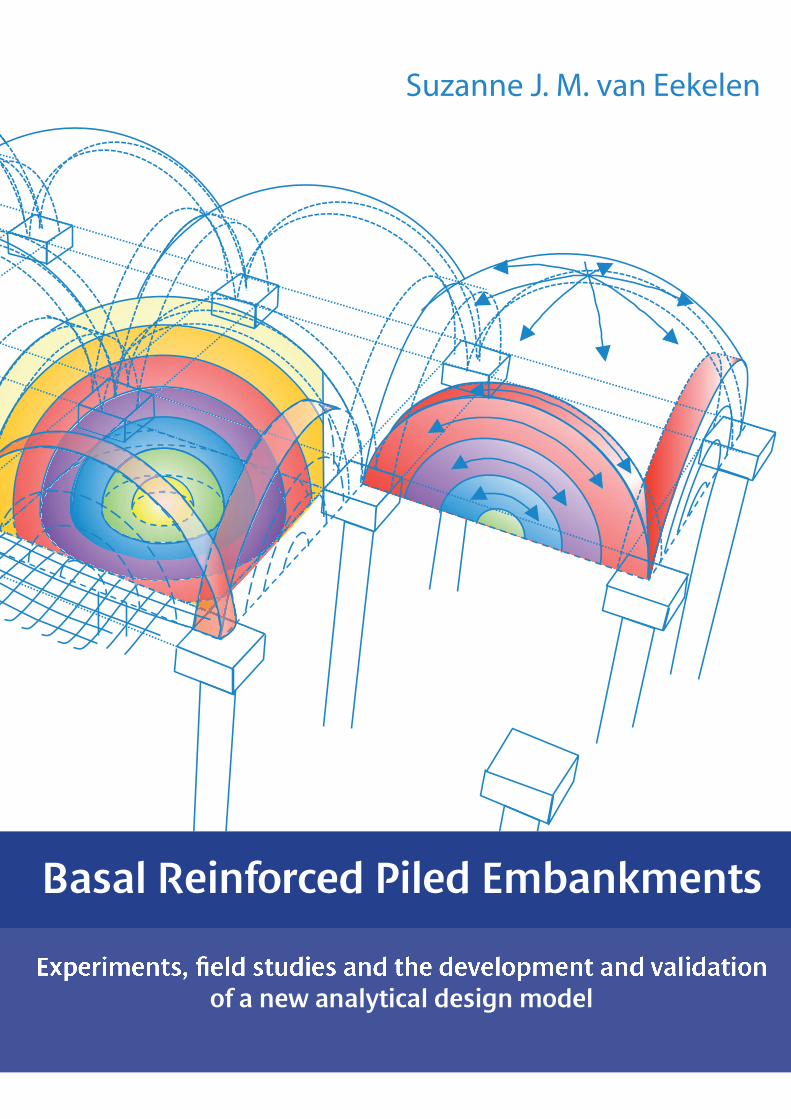


Basal Reinforced Piled EmbankmentsExperiments, field studies and the development and validation
of a new analytical design model


Basal Reinforced Piled EmbankmentsExperiments, field studies and the development and validation
of a new analytical design model
Proefschriftter verkrijging van de graad van doctoraan de Technische Universiteit Delft,
op gezag van de Rector Magnificus, prof.ir. K.C.A.M. Luyben,voorzitter van het College voor Promoties,
in het openbaar te verdedigen opwoensdag 1 juli 2015 om 15:00 uur
door Suzanne Julie Marie VAN EEKELEN
civiel-technisch ingenieurgeboren te Nottingham, Groot-Brittannië
This dissertation has been approved by the promotors:Prof. ir. A.F. van TolProf. dr. ir. A. Bezuijen
Composition of the doctoral committee:Rector MagnificusProf. ir. A.F. van TolProf. dr. ir. A. Bezuijen
Independent members:Prof. dr. C. JommiC.R. LawsonProf. dr. J. HanProf. dr. D. DiasProf. dr.-ing. C. MoormanProf. dr. M.A. Hicks
TU Delft, chairTU Delft, promotorUniversity of Ghent, Belgium, promotor
Civil Engineering, TU DelftTenCate, MalaysiaUniversity of Kansas, USAl'Université Grenoble-Alpes, FranceUniversität Stuttgart, GermanyCivil Engineering, TU Delft, substitutemember
Cover: StudioWat, Eric LoosCover illustration: Suzanne van Eekelen
© 2015 Suzanne J.M. van Eekelen
All rights reserved. No part of this book may be reproduced, stored in a retrievalsystem, or transmitted, in any form or by any means, without prior writtenpermission from the author. Reuse of the knowledge and information in thispublication is welcomed on the understanding that due credit is given to the source.However, the author cannot be held responsible for any consequences resultingfrom such use.
ISBN 978-94-6203-825-7 (print)ISBN 978-94-6203-826-4 (electronic version)
Printed by:CPI – Koninklijke Wörmann, Zutphen, Netherlands

AcknowledgementsI thought I would never start on a doctorate. The prospect of the combination withfamily life was not an appealing one. However, Professor Frits van Tolunexpectedly asked me to take the plunge. I hesitated for two months beforedeciding to take up the challenge. And I have never regretted my decision. On thecontrary, I have immensely enjoyed everything: cooperating closely with mysupervisors, colleagues and many others, and the time I had to concentrate on onesubject, analysing data and writing papers. I also liked the travel and giving thepresentations, reviewing engineering designs and research papers, being involvedin numerous discussions with all kinds of people or groups, and working in theCUR committee on a design guideline for piled embankments. And so I amgrateful to Frits van Tol for his encouragement, and not least because I enjoyedworking with him so much, particularly during the past year, as we started workingtogether more closely.
The end result would never have been the same without the day-to-day supervisionfrom my colleague Adam Bezuijen, who is also a Professor at the University ofGhent. He made a substantial contribution to the research, and to my development.I enjoyed working with him immensely: he is a kind person, a visionary coach anda master in data interpretation. He invested a great deal of time in my doctorate.I am also very grateful to my employer, Deltares, for giving me the opportunity towrite this thesis and I thank them for their trust and support.
Luck was on my side: I was able to conduct experiments in the Deltares laboratory.My colleagues there are highly professional, and I could trust them completely tocarry out correctly the measurements I asked for, including the detailed design, theconstruction of the test set-up and the correct calibration of transducers. I wouldtherefore like to express my gratitude to Jack van der Vegt, Willem van Pernis,Rob Zwaan, Ruud van den Berg and Paul Schaminee, also for their collegiality andthe creative approach to solving any problems that arose. The high quality of theirwork was undoubtedly one reason why the resulting paper – Chapter 2 – washonoured with the 2012 Best Paper Award by the journal Geotextiles andGeomembranes. Delft Cluster and Deltares financed the development and themobilisation of the test set-up for the experiment series, for which I am grateful.The granular material was delivered free of charge by Eerland BouwstoffenManagement.
Another piece of luck was the involvement of several manufacturers. I am gratefulfor the financial support of manufacturers Huesker, Naue and TenCate for myentire study of piled embankments. Their willingness to engage in fruitful debate

Basal Reinforced Piled Embankments
vi
has been extremely valuable. In particular, Lars Vollmert (a fellow member of theCUR committee), Hartmut Hangen, Dimiter Alexiew, Alain Nancey and DickJanse contributed to long discussion meetings. The test series resulted from closecooperation with TenCate, Huesker, Naue and Tensar. I appreciate their financialsupport and the fruitful discussions we had. I am also grateful for additional data,analysis and discussions about the Hamburg case to Lars Vollmert (Naue), andabout the Houten case, the N210 case and several other cases to Piet van Duijnen(Huesker).
I also benefited from my membership of the CUR committee ‘Piled EmbankmentsDesign Guideline’. The frequent discussions with the members of this group werevery inspiring and all of them contributed valuable comments. In particular, Pietvan Duijnen, Marijn Brugman, Marco Peters, Lars Vollmert and Martin de Kantcontributed to the result. Martin de Kant (Royal Haskoning, Netherlands) and Pietvan Duijnen (who was working at Movares at the time) also conducted the finiteelement calculations discussed in the appendix to this thesis.
This thesis is based in part on three large-scale field tests: the Kyoto Road(Appendix A), the motorway exit near Woerden (Chapters 5.3.3 and 5.4.3) and therailway in Houten (Chapters 5.3.4 and 5.4.4). The Kyoto Road project wassupported by Delft Cluster, Deltares, Van Biezen Heipalen, Kantakun andHuesker. The monitoring in the Houten railway was made possible, supported andcarried out by Movares, de Bataafse Alliantie (ProRail, Mobilis, CFE and KWSInfra), Huesker, Voorbij Funderingstechniek, CRUX Engineering and Deltares.The monitoring in the Woerden project was supported and carried out by the Dutchresearch programme GeoImpuls, the Province of Utrecht, the Dutch Ministry ofPublic works, KWS Infra, Huesker, Movares and Deltares. The support of thesecompanies has been greatly appreciated. Alexander Bakker of KNMI kindly playedan advisory role in the interpretation of these three field studies, supplying andinterpreting the climate data.
It was Meindert Van’s idea to look at the topic of piled embankments and to askme to get involved. Hans Sellmeijer, a colleague with great applied mathematicsskills, helped me through the final steps in the mathematical elaborations for theCA model. Flávio and Cláudia Montez and Cristina Schmidt of Huesker Brazilorganised a very nice seminar in São Paulo and invited me to give a presentation.The large numbers of participating experts resulted in very useful comments duringthe discussion session. It was there that Claudio Casarin (Arcadis Brazil) providedme with the first basic ideas that underlie the CA model.
Three Master’s students contributed to the study. The first was Herman-JaapLodder (2010), who helped with the first model experiments. He also developed

Acknowledgements
vii
the new calculation rule for subsoil support and received the IGS Student Awardfor the Netherlands in 2012 for his Master’s work. Theresa Liere - den Boogert(Den Boogert, 2011) simulated the experiments with Plaxis 3D tunnel andvalidated the analytical model for the load-deflection behaviour (step 2). She alsocarried out large-scale triaxial tests in the laboratory of Delft University ofTechnology on the fill of the crushed recycled construction material used in themodel experiments. Finally, Tara van der Peet (2014) validated the new analyticalmodel for calculation step 1, the Concentric Arches model with Plaxis 3D. Shewrote a paper on the basis of her Master’s thesis that was awarded the best paperprize at the Young Member Session at the 10th IGS conference in Berlin in 2014(Van der Peet and Van Eekelen, 2014). It was a pleasure to work with Herman-Jaap, Theresa and Tara.
I very much appreciated the corrections, suggestions and discussions with thelinguist Pete Thomas. It was a joy to work with him. I am also grateful to myfather, Hans van Eekelen, and Arjan Venmans for going through the manuscript,making suggestions, dotting the i’s and crossing the t's.
Combining this study with a family life turned out to be straightforward on apractical level. I was actually at home more often to write and so I was able tolisten to my children’s stories when they got home from school. I am enormouslygrateful to my parents, my husband Maarten and my children Gerrit, Roel and Idafor their support over the years.

SummaryA basal reinforced piled embankment consists of a reinforced embankment ona pile foundation. The reinforcement consists of one or more horizontal layers ofgeosynthetic reinforcement (GR) installed at the base of the embankment.The design of the GR is the subject of this thesis.
A basal reinforced piled embankment can be used for the construction of a road ora railway when a traditional construction method would require too muchconstruction time, affect vulnerable objects nearby or give too much residualsettlement, making frequent maintenance necessary.
The GR strain needs to be calculated to design the GR. Multiplying this GR strainby the GR stiffness gives the tensile force, which needs to be smaller than the long-term GR tensile strength. The GR strain is calculated in two steps. Calculationstep 1 divides the load – the weight of the embankment fill, road construction andtraffic load – into two load parts. One part (load part A) is transferred to the pilesdirectly. This part is relatively large because a load tends to be transferred to thestiffer parts of a construction. This mechanism is known as ‘arching’. The second,residual load part (B+C) rests on the GR (B) and the underlying subsoil (C).
Calculation step 2 determines the GR strain on the basis of the result of step 1.Only the GR strips between each pair of adjacent piles are considered: they areloaded by B+C and may or may not be supported by the subsoil. The GR strain canbe calculated if the distribution of load part B+C on the GR strip, the amount ofsubsoil support and the GR stiffness are known. An implicit result of thiscalculation step is the further division of load part B+C into parts B and C.
Several methods for the GR design are available, all with their own models forcalculation steps 1 and 2. The methods give results that differ immensely. TheDutch CUR226 (2010) and the German EBGEO (2010) adopted Zaeske’s method(2001). However, measurements that were published later (Van Duijnen et al.,2010; Van Eekelen et al., 2015a) showed that this method could be calculatingmuch higher GR strains than those measured in practice, leading to heavier andmore expensive designs than necessary.
The objective of the present study was to establish a clearer picture of loaddistribution in a basal reinforced piled embankment and, on that basis, to developand validate an analytical design model for the geosynthetic reinforcement in apiled embankment. The results were described in five papers published in theinternational scientific journal ‘Geotextiles and Geomembranes’. Those journal
Basal Reinforced Piled Embankments
x
papers can be found in Chapters 2, 3, 4, 5 and Appendix A of this thesis(Van Eekelen et al., 2012a, 2012b, 2013, 2015a and 2011 respectively).
Chapter 2 presents a series of twelve 3D experiments that were carried out at theDeltares laboratory. The scaled model tests were carried out under high surchargeloads to achieve stress situations comparable with those in practice. A uniquefeature of these tests was that load parts A, B and C could be measured separately,making it possible to compare the measurements with calculation steps 1 and 2separately.
In these tests (static load, laboratory scale), smooth relationships were obtainedbetween the net load on the fill (surcharge load minus subsoil support) and severalmeasured parameters such as load distribution and deformation. Consolidation ofthe subsoil resulted in an increase in arching (more A) and more tensile force in theGR (more B and more GR strain). The measured response to consolidationdepends on the fill’s friction angle. A higher friction angle results in more archingduring consolidation.
One of the major conclusions based on the test series was that the load on a GRstrip is approximately distributed as an inverse triangle, with the lowest pressure inthe centre and higher pressure close to the piles. This conclusion was the basis forthe remainder of this doctorate study and the development of the new calculationmodel.
Chapter 3 considers calculation step 2. This chapter starts by comparing themeasurements in the experiments with the calculation results of step 2 of theZaeske (2001) model, which uses a triangular load distribution on the GR strip andconsiders the support of the subsoil underneath the GR strip only. It was found thatZaeske’s model calculates GR strains that are larger than the measured GR strains(approximately a factor of two for GR strains larger than 1%).
Chapter 3 continues with the suggestion of two modifications to Zaeske’s step 2.Firstly, the load distribution is changed from a triangular to an inverse triangularload distribution. Secondly, the subsoil support is extended from the support by thesubsoil underneath the GR strip to the subsoil underneath the entire GR betweenthe piles. The new step 2 model with these modifications produces a much betterfit with field measurements than Zaeske’s model.
Chapter 4 considers calculation step 1, the arching. Additional tests wereconducted for this purpose, varying factors such as the fill height. This chaptergives an overview of the existing arching models and introduces a new model. ThisConcentric Arches model (CA model) is an adaptation and extension of the models

Summary
xi
of Hewlett and Randolph (1988), and Zaeske (2001), which have been adopted inseveral European design guidelines.
Some countries use piled embankments without GR. Introducing GR changes theload distribution considerably. A major part of the load is then exerted on the pilesand the residual load is mainly exerted on the GR strips between the piles, with theload being distributed approximately as an inverse triangle.
Chapter 4 explains the development of the load distribution as a result ofcontinuing GR deflection; new small arches grow within the older larger ones.Smaller arches exert less load on their subsurface. This idea is related to theconcentric arches of the new model, which gives an almost perfect description ofthe observed load distribution in the limit state situation. Furthermore, the newmodel describes the influence of the fill strength and embankment height correctly.
Chapter 5 compares the existing, and the newly introduced, design models withmeasurements from seven full-scale projects and four series of scaled modelexperiments. Two of these seven field projects were conducted in the Netherlandsand they were carried out in part for this doctorate research. One of the fourexperimental series – the one presented in Chapters 2 and 4 – was conductedspecifically for the present research. The other measurements were reported earlierin the literature.
The calculations were carried out using mean, best-guess values for the materialproperties. The calculation results from the CA model match the measurementsmuch better than the results of the arching models of Hewlett and Randolph(1988), and of Zaeske (2001). The results of the CA model are also the closestmatch with the results of the 3D numerical calculations, as described in Van derPeet and Van Eekelen (2014). These authors also show that the new CA modelresponds better to changes in the fill friction angle than any of the other modelsconsidered.
When there is no subsoil support, or almost no subsoil support, the inversetriangular load distribution on the GR strips between adjacent piles gives the bestmatch with the measurements. When there is significant subsoil support, the loaddistribution is approximately uniform. This difference between the situation withor without subsoil support is understandable when one considers that most load isattracted to the construction parts that move least. In the cases with limited subsoilsupport, the load distribution that gives the minimum GR strain should be used tofind the best match with the measurements.

Basal Reinforced Piled Embankments
xii
The GR strain calculated with Zaeske’s model is on average 2.46 times themeasured GR strain. The GR strain calculated with the new model is on average1.06 times the measured GR strain. The calculated GR strain is therefore almost aperfect match with the measured GR strain. The new Dutch CUR226 (2015) hastherefore adopted the model proposed in this thesis.

SamenvattingPaalmatrassen gewapend met geokunststofExperimenten, monitoring in praktijkprojecten en de ontwikkeling en validatie van een nieuw analytisch ontwerpmodel
Een paalmatras bestaat uit een fundering van palen met daarop paaldeksels endaarboven een gewapende aardebaan. De wapening van de aardebaan wordtonderin de aardebaan aangebracht en bestaat uit een of meer horizontale lagengeokunststof (GR, een afkorting van ‘geosynthetic reinforcement’). Het ontwerpvan de geokunststof is het onderwerp van dit proefschrift.
Een paalmatras kan worden toegepast bij de aanleg van een weg of een spoorwegop slappe grond als een traditionele oplossing te veel bouwtijd vraagt, of kwetsbareobjecten in de omgeving zal beschadigen door verticale of horizontalegrondvervormingen, of als er teveel restzetting wordt verwacht die frequentonderhoud noodzakelijk maakt.
Voor het ontwerpen van de GR moet de te verwachten GR rek worden berekend.Dit gebeurt in twee rekenstappen. Rekenstap 1 splitst de belasting, die bestaat uithet gewicht van de aardebaan, de wegconstructie en het verkeer, in twee delen. Hetene deel (deel A) gaat rechtstreeks naar de palen. Dit deel is relatief groot. Datkomt doordat objecten die relatief stijf zijn, relatief veel belasting naar zich toetrekken. Dit verschijnsel heet boogwerking. De resterende belasting (B+C) rust opde GR (B) en de onderliggende grond (C).
Rekenstap 2 beschouwt alleen de GR strip tussen twee belendende palen. Hetbelastingsdeel B+C wordt verondersteld in zijn geheel op deze strip te rusten. Destrip wordt vaak ook ondersteund door de grond onder de strip. De GR rek kanworden berekend als een drietal zaken bekend zijn: hoe het belastingsdeel B+C isverdeeld over de strip, de mate waarin de ondergrond de GR ondersteunt en deGR-stijfheid. Een impliciet resultaat van deze berekening is dat het belastingsdeelB+C verder wordt opgesplitst in de delen B en C.
Er zijn verschillende ontwerpmethoden beschikbaar voor het ontwerp van de GR.Deze hebben ieder hun eigen modellen voor rekenstappen 1 en 2. De diversemethoden geven flink verschillende resultaten. De Nederlandse ontwerprichtlijnCUR226 (2010) gebruikte het model van Zaeske (2001). Dit was overgenomen vande Duitse EBGEO (2010). Er waren echter aanwijzingen dat dit model in bepaaldegevallen een veel hogere GR rek geeft dan in de praktijk werd gemeten. Dit kanleiden tot zwaardere en dus duurdere ontwerpen dan nodig.
Basal Reinforced Piled Embankments
xiv
Het doel van dit onderzoek was om meer inzicht te krijgen in debelastingsverdeling in een met geokunststof gewapend paalmatras en op basisdaarvan een analytisch ontwerpmodel te ontwikkelen en valideren voor degeokunststof wapening. De resultaten van dit onderzoek zijn beschreven in eenvijftal artikelen in het internationale wetenschappelijke tijdschrift ‘Geotextiles andGeomembranes’. Deze artikelen zijn in dit proefschrift opgenomen inachtereenvolgens hoofdstukken 2, 3, 4, 5 en appendix A (respectievelijk VanEekelen et al., 2012a, 2012b, 2013, 2015a en 2011).
Hoofdstuk 2 presenteert een serie van twaalf 3D proeven die zijn uitgevoerd in hetDeltares laboratorium. De schaalproeven werden uitgevoerd met hogebovenbelastingen, zodat de spanningen in de aardebaan vergelijkbaar zijn met diein de praktijk. Het unieke van deze proeven is dat de belastingsdelen A, B en Capart konden worden gemeten. Daardoor is het mogelijk om rekenstappen 1 en 2ieder apart te vergelijken met de meetresultaten.
De proeven lieten een duidelijke relatie zien tussen de netto belasting op deaardebaan (bovenbelasting minus ondersteuning) en verschillende parameters,zoals de belastingsverdeling en de vervorming. Zo werd aangetoond datconsolidatie van de ondergrond een verhoging geeft van de boogwerking (meer A)en de trekkracht in de GR (meer B, meer GR rek). De respons op consolidatie isafhankelijk van de sterkte-eigenschappen van de aardebaan; een hogerewrijvingshoek geeft meer boogwerkingstoename bij consolidatie van deondergrond.
De belasting op de GR strippen tussen belendende palen is duidelijk hoger dan opde GR tussen de strippen in. Een van de belangrijkste conclusies van deproevenserie is dat de verdeling van de belasting op die GR strippen bij benaderingde vorm heeft van een omgekeerde driehoek; de laagste druk in het midden, eenhogere druk bij de palen. Deze conclusie vormde de basis voor de rest van hetonderzoek en de ontwikkeling van het nieuw rekenmodel.
Hoofdstuk 3 gaat in op rekenstap 2. Het hoofdstuk vergelijkt de meetresultatenvan de proeven met de resultaten van rekenstap 2 van het model van Zaeske(2001). Hierin is de belastingsverdeling driehoekig: de hoogste druk in het midden,een lagere druk bij de palen. Bovendien wordt alleen gerekend met deondersteuning van de ondergrond onder de GR strip. Het blijkt dat als de gemetenGR rek groter is dan 1%, dan is de berekende rek nog eens ongeveer twee maal zogroot.Twee aanpassingen van het oude stap 2 - rekenmodel worden voorgesteld. Teneerste een omgekeerde driehoekige belastingsverdeling en ten tweede hetuitbreiden van de ondergrondondersteuning; niet alleen de ondergrond onder de
Samenvatting
xv
GR strip, maar alle ondergrond onder de GR wordt meegerekend. De resultatenvan dit nieuwe rekenmodel voor stap 2 komen aanzienlijk beter overeen met demetingen.
Hoofdstuk 4 gaat in op rekenstap 1, de boogwerking. Voor dit deel van hetonderzoek zijn speciaal nog zes extra laboratorium proeven uitgevoerd, waarbijondermeer de aardebaandikte werd gevarieerd. Dit hoofdstuk geeft een overzichtvan beschikbare boogwerkingsmodellen en introduceert vervolgens een nieuwmodel. Dit model, het Concentric Arches model (CA model), is een aanpassing eneen uitbreiding van de modellen van Hewlett en Randolph (1988) en Zaeske(2001), die zijn opgenomen in diverse Europese ontwerprichtlijnen.
Aardebanen op palen worden in sommige landen ook wel toegepast zonder GR, ditproefschrift gaat echter alleen over aardebanen op palen met GR: paalmatrassen.De toevoeging van een GR verandert de belastingsverdeling ingrijpend. De meestebelasting gaat dan rechtstreeks naar de palen, het resterende deel gaat grotendeelsnaar de GR strippen tussen belendende palen. De belastingsverdeling op diestrippen heeft bij benadering de vorm van een omgekeerde driehoek. Hoofdstuk 4geeft een verklaring voor het ontstaan van deze belastingsverdeling; tijdens hetsteeds verder doorhangen van de GR vormen zich binnen de bestaande bogensteeds nieuwe, kleinere boogjes. Een kleinere boog levert minder belasting af opzijn ondergrond. Dit is gerelateerd aan de concentrische bogen in het nieuwemodel, dat een bijna perfecte beschrijving geeft van de geobserveerdebelastingsverdeling voor de eindsituatie waar de ondergrond is weggezakt. Hetnieuwe model beschrijft bovendien de invloed van de sterkte van hetaardebaanmateriaal en de hoogte van de aardebaan op correcte wijze.
Hoofdstuk 5 vergelijkt de oude en nieuwe ontwerpmodellen met metingen inzeven praktijkprojecten en een viertal proevenseries. Twee van deze zevenpraktijkprojecten zijn Nederlands en mede uitgevoerd in het kader van ditpromotie-onderzoek. Eén van de vier proevenseries is uitgevoerd voor ditpromotie-onderzoek en beschreven in hoofdstukken 2 en 4. De andere metingenkomen uit de literatuur.
De vergelijkende berekeningen zijn uitgevoerd met verwachtingswaarden voor demateriaalparameters. De rekenresultaten van het CA model blijken beter overeen tekomen met de metingen dan de resultaten van de modellen van Hewlett enRandolph (1988) en Zaeske (2001). De resultaten van het CA model komen ookbeter overeen met 3D numerieke berekeningen beschreven in Van der Peet en VanEekelen (2014), waarbij bovendien wordt aangetoond dat het nieuwe model beterreageert op veranderingen in de wrijvingshoek van de aardebaan dan de oudemodellen.
Basal Reinforced Piled Embankments
xvi
Als er geen of heel weinig ondergrondondersteuning is, geeft de omgekeerdedriehoekige belastingsverdeling de beste overeenkomst met de metingen. Als erechter wel een aanzienlijke ondersteuning is van de ondergrond, dan is debelastingsverdeling bij benadering uniform. Dit onderscheid tussen de situatie metof zonder ondergrond is begrijpelijk vanuit de filosofie dat de constructiedelen diehet minst verplaatsen de meeste belasting naar zich toe trekken. Als er heel weinigondersteuning van de ondergrond is, dan kan het beste worden gerekend met debelastingsverdeling die de minste GR rek geeft: de uniforme of de omgekeerdedriehoek.
De GR rek die wordt berekend met het oude model van Zaeske (2001), dat isopgenomen in EBGEO (2010) en CUR226 (2010) is gemiddeld 2.46 keer zo grootals de gemeten rek. De GR rek berekend met het nieuwe model is gemiddeld 1.06keer de gemeten rek. De berekende en de gemeten rek komen dus vrijwel overeen.De nieuwe CUR226 (2015) bevat daarom het model dat wordt voorgesteld in ditproefschrift.
Table of Contents
Acknowledgements v
Summary ix
Samenvatting xiii
Table of Contents xvii
Nomenclature xxi
1 Introduction 11.1 Basal reinforced piled embankments: foundations for roads or railways on soft soil 21.2 Design of a piled embankment 51.3 Scope, objective and research question of this thesis 71.4 Activities undertaken 81.5 Thesis outline 8
2 Model Experiments on Piled Embankments 112.1 Introduction 122.2 Definition of load distribution 142.3 Test set-up and testing programme 15
2.3.1 Test set-up 152.3.2 Measurements 162.3.3 Testing programme and materials 192.3.4 Test procedure, definition of net load 192.3.5 Limitations 20
2.4 Typical results 212.4.1 Arching 212.4.2 Localisation of GR strain 232.4.3 Distribution of the vertical line load on the GR tensile strips 25
2.5 Analysis of influencing factors 272.5.1 Embankment fill 272.5.2 Geogrid or geotextile 282.5.3 Single GR layer consisting of one biaxial or two uniaxial grids 282.5.4 Stiffness of GR 302.5.5 Two layers of reinforcement 322.5.6 Differences between types of GR 352.5.7 Angle of arching 35
2.6 Conclusions 36
3 Load-deflection Behaviour of the Geosynthetic Reinforcement (step 2) 393.1 Introduction 403.2 EBGEO: the two calculation steps 43
3.2.1 Calculation step 1: arching 433.2.2 Calculation step 2: membrane behaviour 44
3.3 Comparison of EBGEO and measurements 463.3.1 Calculation step 1: arching 463.3.2 Calculation step 2: membrane behaviour 48
Basal Reinforced Piled Embankments
xviii
3.3.3 Conclusions: step 1+2 483.4 Suggestions for improving step 2 of the analytical model 49
3.4.1 Subsoil support 493.4.2 Load on GR strip 503.4.3 GR strain on pile caps 523.4.4 Results of modifications: step 2 calculation 53
3.5 Comparing the influence of fill, GR, and the use of double-layered systems inmeasurements and calculations 54
3.5.1 Friction angle of the fill: step 1 calculations 543.5.2 Stiffness of the GR 553.5.3 One or two GR layers 57
3.6 Conclusions 583.6.1 Step 1 583.6.2 Step 2 59
Appendix 3.A Procedure for analytical calculations to compare with experimental results 60Appendix 3.B Derivation of the step 2 equations for inverse triangle load distribution 62
4 An Analytical Model for Arching in Piled Embankments (step 1) 694.1 Introduction 704.2 Additional laboratory tests 74
4.2.1 Measurements of steps 1 and step 2 separately 744.2.2 Description tests 744.2.3 Results of the additional tests 78
4.3 Observations of arching in experiments, field tests and numerical calculations 794.3.1 Measuring arching 794.3.2 Comparison of predictions and measurements of arching A 794.3.3 Impact of fill height 804.3.4 Load distribution on the GR; influence of using GR 814.3.5 Influence of subsoil consolidation or GR deflection and fill properties 834.3.6 Summary of Chapter 4.3 84
4.4 A new equilibrium model: the Concentric Arches model 844.4.1 Introduction 844.4.2 Development of concentric arches 854.4.3 2D Concentric Arches 894.4.4 3D concentric hemispheres 914.4.5 Concentric Arches model: combination of 2D arches and 3D hemispheres 924.4.6 Line-shaped foundations 96
4.5 Comparison with laboratory experiments, field tests and numerical calculations 964.5.1 Introduction 964.5.2 Arching A 974.5.3 The influence of fill height 994.5.4 Load distribution on GR 1004.5.5 Ground pressure versus depth 1014.5.6 Parameter study 101
4.6 Conclusions 103Appendix 4.A. Derivation of the equations of the Concentric Arches model 105Appendix 4.B. Calculation examples 123
Table of Contents
xix
5 Validation of Analytical Models for the Design of Basal Reinforced PiledEmbankments 129
5.1 Introduction 1305.2 Description of the considered analytical models 133
5.2.1 Step 1: arching 1335.2.2 Step 2: load-deflection behaviour 1355.2.3 Validation of arching, load distribution and subsoil support 136
5.3 Case study descriptions 1365.3.1 Introduction 1365.3.2 Full-scale test in Rio de Janeiro 1385.3.3 Full-scale case in Woerden 1405.3.4 Full-scale case in Houten 1425.3.5 Large-scale French experiments 1445.3.6 Finnish full-scale test and 2D FDM calculations 1465.3.7 The Krimpenerwaard N210 piled embankment 1485.3.8 Hamburg full-scale test 1505.3.9 Sloan’s large-scale experiments (2011) 1525.3.10 Oh and Shin's scaled tests (2007) 1545.3.11 German laboratory scaled experiments 1565.3.12 Dutch laboratory scaled experiments 158
5.4 Comparison of measurements with analytical models 1615.4.1 Analytical calculations 1615.4.2 Full-scale test in Rio de Janeiro 1625.4.3 Full-scale case in Woerden 1645.4.4 Full-scale case in Houten 1665.4.5 Large-scale French experiments 1675.4.6 Finnish full-scale test and 2D FDM calculations 1695.4.7 The Krimpenerwaard N210 piled embankment 1705.4.8 Hamburg full-scale test 1715.4.9 Sloan’s large-scale experiments (2011) 1725.4.10 Oh and Shin’s scaled tests (2007) 1735.4.11 German laboratory scaled experiments 1745.4.12 Dutch laboratory scaled experiments 175
5.5 Discussion 1765.6 Dutch design guideline CUR226 (2015) 1795.7 Conclusions 179Appendix 5.A Step 2 equations for uniform and inverse-triangular load distribution 181
6 Discussion 1856.1 Introduction 1856.2 How is the vertical load distributed on the basal reinforcement of a piledembankment? 186
6.2.1 Load distribution dependent on stiffness behaviour 1866.2.2 Are scaled experiments sufficiently accurate to analyse basal reinforced piledembankments? 1906.2.3 Pile spacing limitations 191
6.3 How can the load distribution be explained and how can it be described with ananalytical arching model? 192
6.3.1 Arching in a basal reinforced piled embankment 1926.3.2 Partial arching 193
Basal Reinforced Piled Embankments
xx
6.3.3 Arch shapes 1946.3.4 Combination of 3D hemispheres and 2D arches 195
6.4 Which design method fits best with observations and measurements of arching A andGR strains in field monitoring projects and experiments? 196
6.4.1 Combining the CA model and the inverse triangular and uniformly distributedload distribution 1966.4.2 Nonsquare rectangular pile arrangements 1976.4.3 Alternative load distributions on the GR strips 2016.4.4 Safety analysis 201
7 Conclusions 2037.1 Introduction 2037.2 GR design in two steps 2037.3 Measuring technique in piled embankments 2047.4 Observations in experiments, field tests and numerical analysis 205
7.4.1 Arching 2057.4.2 Load and strain distribution 2057.4.3 Factors of influence 206
7.5 New analytical model for calculating the maximum GR strain 2087.5.1 Calculation step 1: analytical model for arching 2087.5.2 Calculation step 2: load-deflection behaviour 2097.5.3 Factors of influence 210
7.6 Validation of analytical models 2117.7 Recommendations for future research 213
7.7.1 Horizontal load on the GR 2137.7.2 Subsoil support 2137.7.3 Traffic load 2137.7.4 Water 2147.7.5 Other fill types 214
Appendices 217
A. Analysis and Modification of the British Standard BS8006 for the Design of PiledEmbankments 219
A. 1 Introduction 220A. 2 British Standard BS8006 for the design of reinforcement in piled embankments 221A. 3 Proposal for improving the BS8006 232A. 4 Summary plane strain, BS8006 and Modified BS8006 237A. 5 Comparison with finite element calculations. 238A. 6 Comparison with field test measurements 242A. 7 Conclusions 248Appendix A.A Differential equation for step 4: from line load to tensile force 249Appendix A.B. Different interpretations of BS8006 from literature 253
B. Design Graphs for Calculation Step 2 257
Publications 261
References 265
Curriculum Vitae 273
Nomenclature
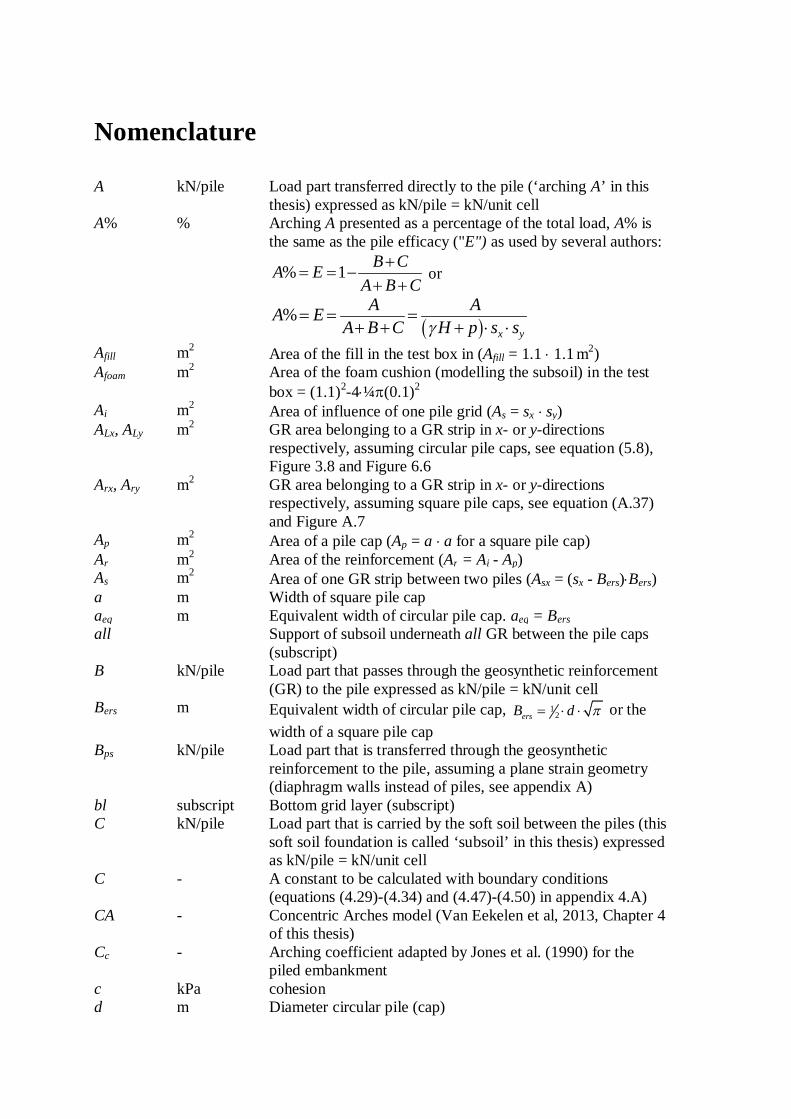
A kN/pile Load part transferred directly to the pile (‘arching A’ in thisthesis) expressed as kN/pile = kN/unit cell
A% % Arching A presented as a percentage of the total load, A% isthe same as the pile efficacy ("E") as used by several authors:
% 1 B CA EA B C
or
%x y
A AA EA B C H p s s
Afill m2 Area of the fill in the test box in (Afill = 1.1 1.1 m2)Afoam m2 Area of the foam cushion (modelling the subsoil) in the test
box = (1.1)2-4 ¼ (0.1)2
Ai m2 Area of influence of one pile grid (As = sx sy)ALx, ALy m2 GR area belonging to a GR strip in x- or y-directions
respectively, assuming circular pile caps, see equation (5.8),Figure 3.8 and Figure 6.6
Arx, Ary m2 GR area belonging to a GR strip in x- or y-directionsrespectively, assuming square pile caps, see equation (A.37)and Figure A.7
Ap m2 Area of a pile cap (Ap = a a for a square pile cap)Ar m2 Area of the reinforcement (Ar = Ai - Ap)As m2 Area of one GR strip between two piles (Asx = (sx - Bers) Bers)a m Width of square pile capaeq m Equivalent width of circular pile cap. aeq = Bersall Support of subsoil underneath all GR between the pile caps
(subscript)B kN/pile Load part that passes through the geosynthetic reinforcement
(GR) to the pile expressed as kN/pile = kN/unit cellBers m Equivalent width of circular pile cap, 1
2ersB d or thewidth of a square pile cap
Bps kN/pile Load part that is transferred through the geosyntheticreinforcement to the pile, assuming a plane strain geometry(diaphragm walls instead of piles, see appendix A)
bl subscript Bottom grid layer (subscript)C kN/pile Load part that is carried by the soft soil between the piles (this
soft soil foundation is called ‘subsoil’ in this thesis) expressedas kN/pile = kN/unit cell
C - A constant to be calculated with boundary conditions(equations (4.29)-(4.34) and (4.47)-(4.50) in appendix 4.A)
CA - Concentric Arches model (Van Eekelen et al, 2013, Chapter 4of this thesis)
Cc - Arching coefficient adapted by Jones et al. (1990) for thepiled embankment
c kPa cohesiond m Diameter circular pile (cap)

Basal Reinforced Piled Embankments
xxii
deq m Equivalent diameter of square pile cap.DEM Discrete Element MethodE or Ep - (kN/kN) Pile efficacy or pile efficiency, the same as A%,
A%=totwCBE 1 , in BS8006 C = 0 kN/pile, thus 1
tot
BEw
E kPa Young’s modulusF kN ForceF1, F2 - Calculation factors (see equations (3.7) for EBGEO and (3.11)
for ‘modified subsoil1’)f m Maximum deflection of the reinforcement in the centre
between two pile capsFDM Finite Difference MethodFEM Finite Element MethodGR - Geosynthetic reinforcementh or H m Height of the fill above bottom layer of GR, or height of fill
above a pipe (Figure 4.12)hg m Arch height of Zaeske’s model (2001), hg = s/2 for h s/2 or
hg = h for h , s/2Hg2D m Height of the largest of the 2D arches of the new Concentric
Arches model, see equations (4.2) and (4.13), Figure 4.10 andFigure 4.12. Hxg2D refers to the height of a 2D arch that isoriented along the x-axis, as indicated in Figure 4.12. Hyg2Drefers to the height of a 2D arch that is oriented along the y-axis.
Hg3D m Height of the largest 3D hemisphere of the new ConcentricArches model, see equation (4.4) and Figure 4.10
hg m Arch height in EBGEO, hg = sd/2 for h sd/2 or hg = hfor h < sd/2
HR Model of Hewlett & Randolph (1988)inv Inverse triangular load distribution (see Figure 5.3c)
(subscript)Jx, Jy kN/m Tensile stiffness of the GR parallel to the x-axis or parallel to
the y-axis.J2% kN/m Tensile stiffness of the GR at a GR strain of 2%K kN/m3 Calculation value for subgrade reaction (see equation (3.10))
used to account for ‘all subsoil’ (Chapter 5.4.1) which isreferred to as ‘modified subsoil’ in Chapter 3.
Kcrit -Critical principal stress ratio 2 'tan 45
2o
critK
k or ks kN/m3 Subgrade reactionKp - Passive or critical earth pressure coefficientKv m/s Vertical permeabilityL, Lx, Ly m The clear distance between adjacent pile caps (Lx = sx - aeq
and Ly = sy - aeq)
1 Chapter 3 uses the term “modified subsoil”, which is referred to as “all subsoil” in Chapter 5.
Nomenclature
xxiii
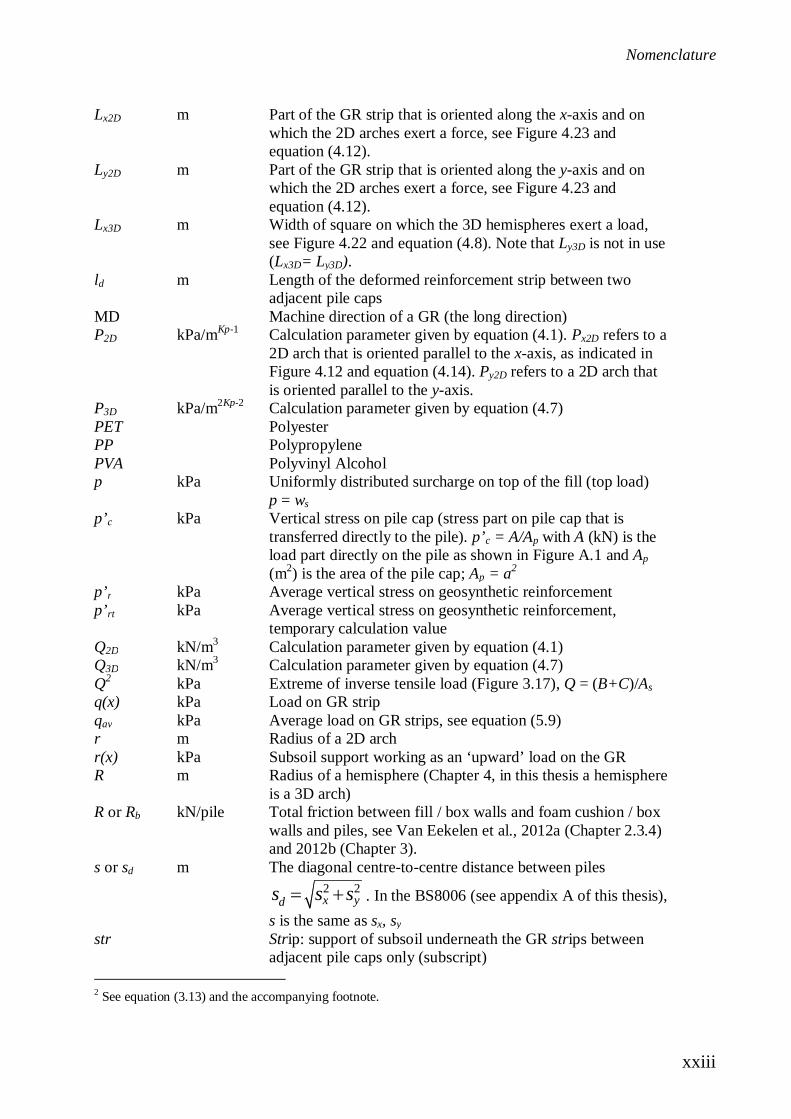
Lx2D m Part of the GR strip that is oriented along the x-axis and onwhich the 2D arches exert a force, see Figure 4.23 andequation (4.12).
Ly2D m Part of the GR strip that is oriented along the y-axis and onwhich the 2D arches exert a force, see Figure 4.23 andequation (4.12).
Lx3D m Width of square on which the 3D hemispheres exert a load,see Figure 4.22 and equation (4.8). Note that Ly3D is not in use(Lx3D= Ly3D).
ld m Length of the deformed reinforcement strip between twoadjacent pile caps
MD Machine direction of a GR (the long direction)P2D kPa/mKp-1 Calculation parameter given by equation (4.1). Px2D refers to a
2D arch that is oriented parallel to the x-axis, as indicated inFigure 4.12 and equation (4.14). Py2D refers to a 2D arch thatis oriented parallel to the y-axis.
P3D kPa/m2Kp-2 Calculation parameter given by equation (4.7)PET PolyesterPP PolypropylenePVA Polyvinyl Alcoholp kPa Uniformly distributed surcharge on top of the fill (top load)
p = wsp’c kPa Vertical stress on pile cap (stress part on pile cap that is
transferred directly to the pile). p’c = A/Ap with A (kN) is theload part directly on the pile as shown in Figure A.1 and Ap(m2) is the area of the pile cap; Ap = a2
p’r kPa Average vertical stress on geosynthetic reinforcementp’rt kPa Average vertical stress on geosynthetic reinforcement,
temporary calculation valueQ2D kN/m3 Calculation parameter given by equation (4.1)Q3D kN/m3 Calculation parameter given by equation (4.7)Q2 kPa Extreme of inverse tensile load (Figure 3.17), Q = (B+C)/Asq(x) kPa Load on GR stripqav kPa Average load on GR strips, see equation (5.9)r m Radius of a 2D archr(x) kPa Subsoil support working as an ‘upward’ load on the GRR m Radius of a hemisphere (Chapter 4, in this thesis a hemisphere
is a 3D arch)R or Rb kN/pile Total friction between fill / box walls and foam cushion / box
walls and piles, see Van Eekelen et al., 2012a (Chapter 2.3.4)and 2012b (Chapter 3).
s or sd m The diagonal centre-to-centre distance between piles2 2x yds s s . In the BS8006 (see appendix A of this thesis),
s is the same as sx, systr Strip: support of subsoil underneath the GR strips between
adjacent pile caps only (subscript)
2 See equation (3.13) and the accompanying footnote.
Basal Reinforced Piled Embankments
xxiv
sx, sy m Centre-to-centre pile distance parallel to the x-axis or parallelto the y- axis.
T or Trp kN/m Tensile force in GR stripT kN Tensile force in GR strip, width of load strip is zero (used in
appendix A (BS8006))TH kN/m Horizontal component of TTH kN Horizontal component of the tensile force T in the GR strip,
width of load strip is zero (used in appendix A (BS8006))TV kN Vertical component of Tt m Thickness of a soft soil layer underneath the embankmenttl subscript Top grid layer (subscript)total subscript Entire reinforcement layer (i.e. two grid layers plus the
granular layer between the grid layers) (subscript)tri Triangular load distribution (see Figure 5.3a) (subscript)uni Uniform load distribution (see Figure 5.3b) (subscript)W % Water contentWn kN/pile Net load (= Ws – C – Rb)Ws kN/pile Total surcharge load on a unit area Ws = p sx syws or p kPa Uniformly distributed surcharge on top of the fill (top load)
ws = pWT kN/m Equally-distributed vertical (line) load acting on the
reinforcement strip between adjacent pile caps, BS8006property (appendix A)
wtot kN/pile Total load of traffic and soil weight in one s·s area, pHs2 ,BS8006 property (appendix A, where s = sy = sy)
X - Grouped variable (see equation (A.11))XMD Direction perpendicular to the machine direction of a GRZ Multi-scale arching model of Zaeske (2001)z m Distance along the vertical axis as indicated in, for example,
Figure 4.3.z or z(x) m GR vertical deflection (or eps) - GR strain
(Chapter 2: if the GR strain was measured rather thancalculated, it was measured with strain cables as described inChapter 2.3.2)
s(or s eps)
(In Chapter 2: GR strain measured with a traditional straingauge as described in Chapter 2.3.2)
deg Internal friction anglekN/m3 Fill unit weight
1, 2, 3 - Constants used by Zaeske (2001), see equation (3.2)r kPa Radial stress in a 2D archR kPa Radial stress in a 3D hemisphere’v kPa Average vertical stress at the level of the bottom GR layerv;p kPa Vertical stress on pile (cap), see equation (3.1)v;r kPa Vertical stress on the GR between the pile caps
kPa Tangential stress in 2D arch or 3D hemisphere- Constant used by EBGEO, see equation (3.2)deg Dilation angle

Nomenclature
xxv
600/50 kN/m andkN/m
Indicates the strength of geosynthetic reinforcement layer.The first value (600 kN/m in this case) gives the characteristicshort-term tensile strength in machine direction (MD) and thesecond value (50 kN/m in this case) gives the characteristicshort-term tensile strength in the direction perpendicular to themachine direction (XMD).

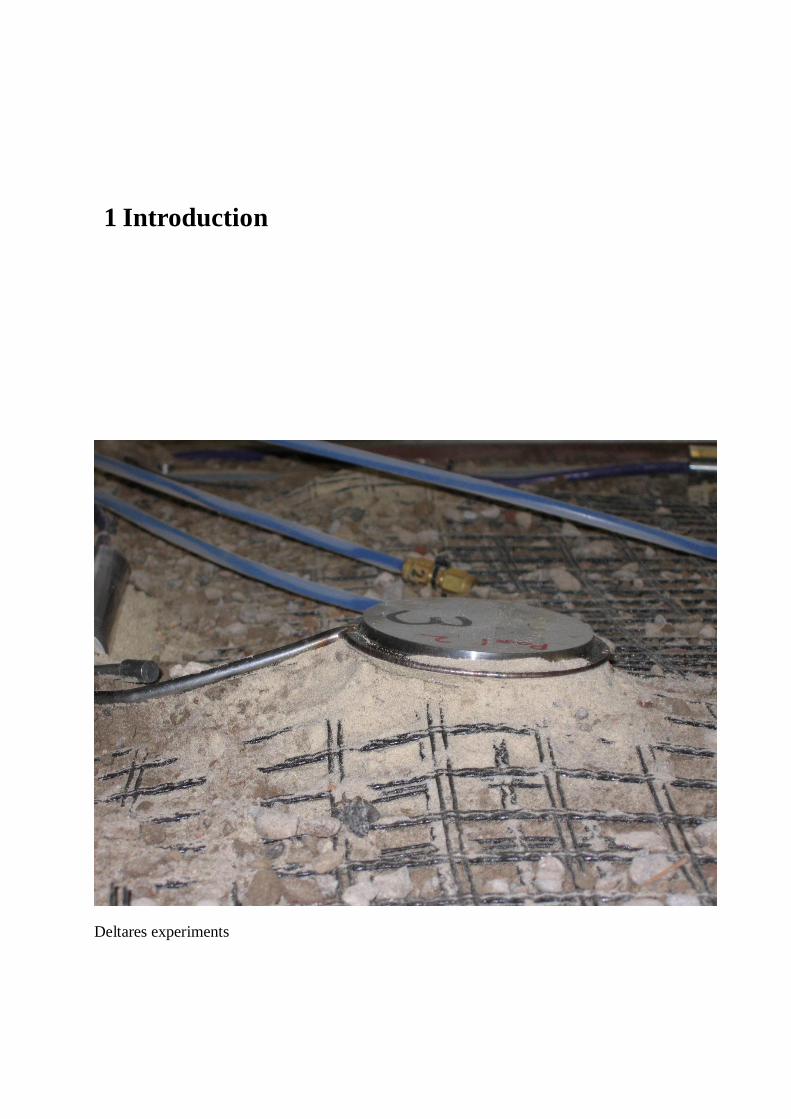
1 Introduction
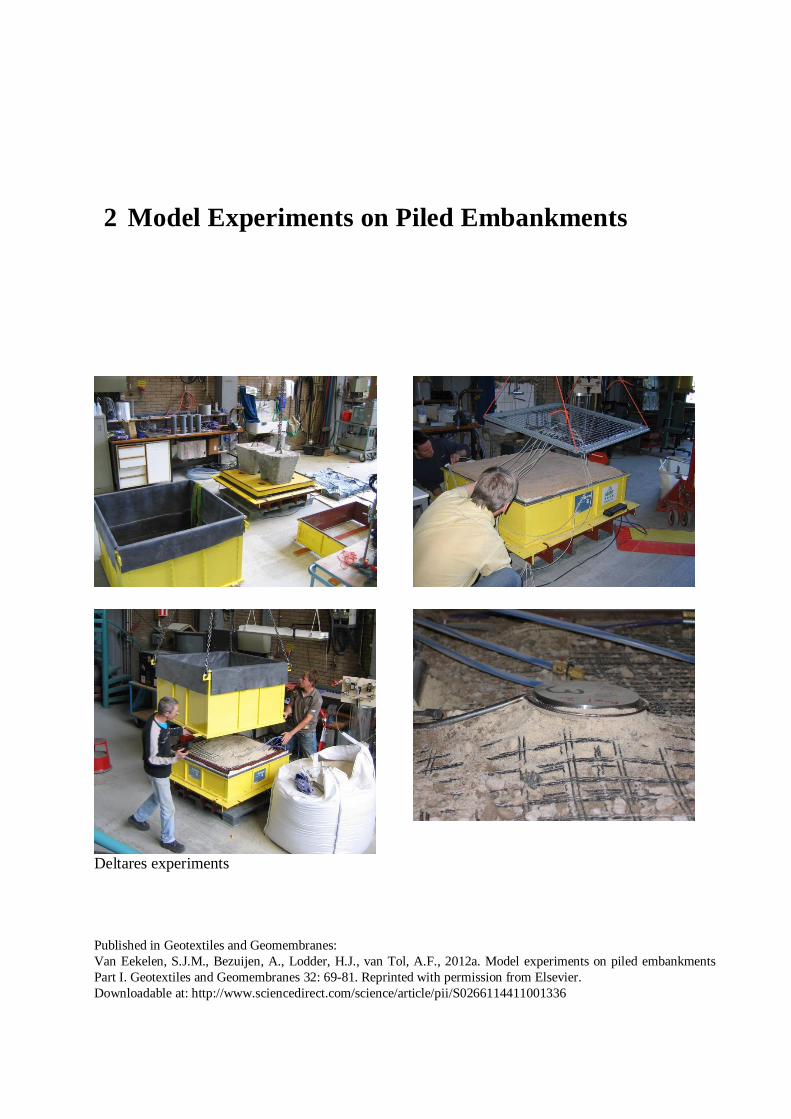
Deltares experiments
Basal Reinforced Piled Embankments
2
1.1 Basal reinforced piled embankments: foundations for roads orrailways on soft soil
A piled embankment consists of an embankment on a pile foundation. In a basalreinforced piled embankment, the embankment is reinforced at its base with ageosynthetic reinforcement (GR).
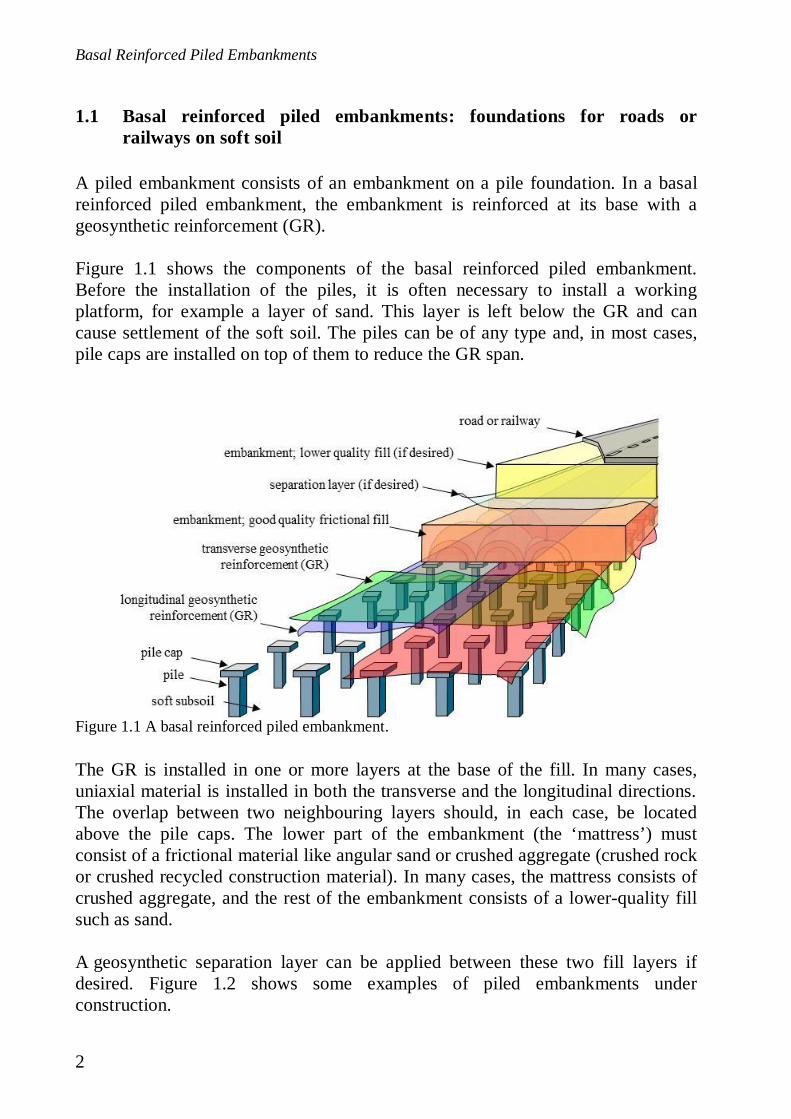
Figure 1.1 shows the components of the basal reinforced piled embankment.Before the installation of the piles, it is often necessary to install a workingplatform, for example a layer of sand. This layer is left below the GR and cancause settlement of the soft soil. The piles can be of any type and, in most cases,pile caps are installed on top of them to reduce the GR span.
Figure 1.1 A basal reinforced piled embankment.
The GR is installed in one or more layers at the base of the fill. In many cases,uniaxial material is installed in both the transverse and the longitudinal directions.The overlap between two neighbouring layers should, in each case, be locatedabove the pile caps. The lower part of the embankment (the ‘mattress’) mustconsist of a frictional material like angular sand or crushed aggregate (crushed rockor crushed recycled construction material). In many cases, the mattress consists ofcrushed aggregate, and the rest of the embankment consists of a lower-quality fillsuch as sand.
A geosynthetic separation layer can be applied between these two fill layers ifdesired. Figure 1.2 shows some examples of piled embankments underconstruction.

1 Introduction
3
a. b.
c. d.
e. f.
Figure 1.2 Basal reinforced piled embankments under construction. (a) Krimpenerwaard N210(Ballast Nedam, Huesker, Fugro, Movares), (b) A-15 MAVA project, source: Royal TenCate,contractor: A-Lanes (c) Piled embankment for an abutment necessary for the widening of the A2near Beesd, the Netherlands (Voorbij Funderingstechniek, Heijmans, CRUX Engineering,Huesker and Deltares), (d) Houten railway (Movares, de Bataafse Alliantie, (ProRail, Mobilis,CFE en KWS Infra), Huesker, Voorbij Funderingstechniek, CRUX Engineering and Deltares),(e) Krimpenerwaard N210 (Ballast Nedam, Huesker, Fugro, Movares), (f) Hamburg (Naue).
Basal Reinforced Piled Embankments
4
As can be seen in Figure 1.1, arching occurs in the embankment. This arching isthe mechanism by which stiffer construction elements attract a large proportion ofthe load and this is the basis for the GR design. A major part of the load istransferred to the pile caps directly due to this arching. Another part of the load istransferred to the pile caps via tensile forces in the GR. The piles and their pilecaps further transfer the load to the firm substratum, and there is therefore little orno load on the soft subsoil between the piles. Some settlement of the subsoil anddeformation of the GR is necessary to develop the arching in the embankment.
Piled embankments are built for roads, railways, parking areas or industrial storageareas, usually in locations with soft soil. Building such constructions in soft soilareas is often problematic. Traditionally, a granular fill is placed directly on thesoft subsoil, which needs a lot of time to consolidate and compact, and largeresidual or differential settlement or instabilities are a risk. Four types of solutionsare in use to reduce construction time, settlement and risks:
- Acceleration of consolidation with the installation of vertical drainage,frequently in combination with a temporary surcharge load to reduce post-construction settlement.
- Replacement of the soft layers, which is only feasible when the soft soillayer is relatively thin.
- Using lightweight construction material such as expanded polystyrene foam.- Leading the load directly to the firm substratum by using a pile foundation.
A concrete slab, or an embankment with or without a basal reinforcement,can be positioned on top of the piles. An embankment is usually cheaperthan a concrete slab, but a slab needs less height.
These techniques all have their own advantages and they are in widespread use.Traditionally, the first option has been used most widely. A piled embankment canbe a useful option when this traditional construction method leads to problems,such as too much residual settlement given the available construction time and/orgiven the subsoil. The traditional approach would then require more frequentmaintenance and it may be preferable or cheaper to avoid this.
Another potential reason to opt for a piled embankment is the presence of objectsthat are sensitive to horizontal ground movement such as sensitive foundations,existing roads, railways, tubes or pipes. Finally, piled embankments can be usefulif the available construction time is limited: piled embankments can be builtquickly because it is not necessary to wait for the consolidation of the soft subsoil.
In delta areas, the subsoil often consists of a thick layer of soft clay or peat. Theundrained shear strength in these areas is typically 10 – 25 kPa or even less.

1 Introduction
5
In many cases, the settlement of the subsoil due to the weight of the workingplatform below the GR will exceed the deformation of the GR. This leaves a gapbetween the mattress and the subsoil between the piles. This does not constitute aproblem as long as it is taken into consideration in the design.
Piled embankments can be applied with or without GR. GR increases the archingmechanism, and helps to transfer part of the load to the piles. The presence of softclay and peat layers indicates that GR is needed in the base of the embankment.This is, for example, the case in the Netherlands. In some other countries likeFrance, by contrast, piled embankments are frequently built without GR. In thesecases, the soil between the piles is usually sand, which is stiff enough to carry amajor part of the load. Even then it may still be worth considering GR: it mayreduce costs since the pile spacing can be increased.
Load distributions in piled embankments with or without basal reinforcementdiffer, as will be seen in this thesis. The design method should therefore bedifferent as well. This thesis looks only at basal reinforced piled embankments, inother words piled embankments with GR in the base.
1.2 Design of a piled embankment
Several countries have issued design guidelines for basal reinforced piledembankments. Researchers (listed in Chapters 3 and 4) are still working onimprovements to analytical design methods. Europe alone already has six differentguidelines: the Dutch CUR 226 (2010, updated in 2015), the German EBGEO(2010), the British Standard BS8006 (1995, updated in 2010), the FinnishLiikennevirasto (2012), the Nordic Guidelines of Reinforced Soils and Fills (2004)and the French ASIRI (2012).
These guidelines usually state geometry requirements such as the minimumembankment height or the minimum pile cap size in relation to the pile spacing andthey also give requirements for the fill properties. The pile diameter, pile lengthand the size and reinforcement of the pile caps have to be designed in accordancewith local geotechnical standards and these design regulations are not given in theguidelines listed above.
The design code and guidelines mentioned relate mostly to the GR design, whichneeds to be done analytically. Numerical methods are used widely to determinedeformations and pile bending moments but they are generally not allowed in GRdesign since these methods tend to underpredict the GR strain, as shown by forexample Farag (2008). This seems to be specifically the case for situations with
Basal Reinforced Piled Embankments
6
subsoil support of the kind discussed by Van der Peet and Van Eekelen (2014).The design guidelines and this thesis therefore focus on analytical GR designmodels.
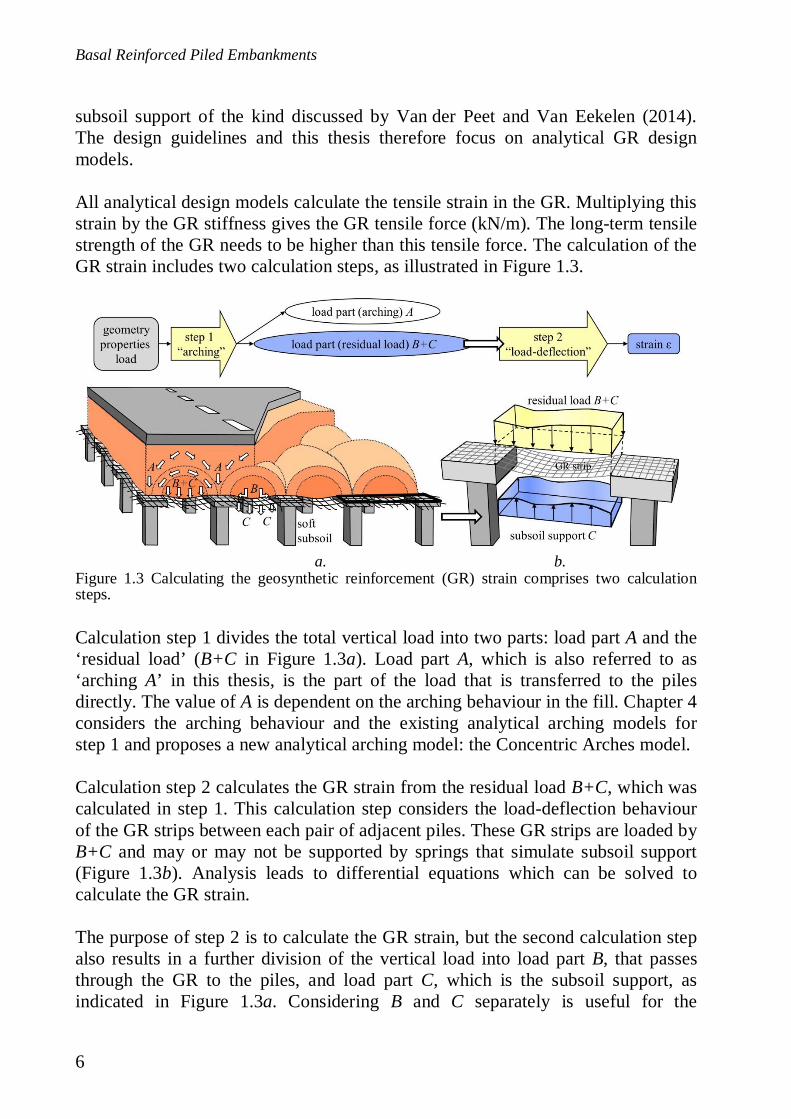
All analytical design models calculate the tensile strain in the GR. Multiplying thisstrain by the GR stiffness gives the GR tensile force (kN/m). The long-term tensilestrength of the GR needs to be higher than this tensile force. The calculation of theGR strain includes two calculation steps, as illustrated in Figure 1.3.
a. b.
Calculation step 1 divides the total vertical load into two parts: load part A and the‘residual load’ (B+C in Figure 1.3a). Load part A, which is also referred to as‘arching A’ in this thesis, is the part of the load that is transferred to the pilesdirectly. The value of A is dependent on the arching behaviour in the fill. Chapter 4considers the arching behaviour and the existing analytical arching models forstep 1 and proposes a new analytical arching model: the Concentric Arches model.
Calculation step 2 calculates the GR strain from the residual load B+C, which wascalculated in step 1. This calculation step considers the load-deflection behaviourof the GR strips between each pair of adjacent piles. These GR strips are loaded byB+C and may or may not be supported by springs that simulate subsoil support(Figure 1.3b). Analysis leads to differential equations which can be solved tocalculate the GR strain.
The purpose of step 2 is to calculate the GR strain, but the second calculation stepalso results in a further division of the vertical load into load part B, that passesthrough the GR to the piles, and load part C, which is the subsoil support, asindicated in Figure 1.3a. Considering B and C separately is useful for the
Figure 1.3 Calculating the geosynthetic reinforcement (GR) strain comprises two calculationsteps.
1 Introduction
7
validation of design models but, for design purposes, only the calculated GR strainis of importance.
Chapter 3 of this thesis considers calculation step 2 and proposes a newdistribution for the residual load B+C on the GR strip. Chapter 5 extends the step 2model proposed in Chapter 3 to make it more generally applicable.
To validate calculation steps 1 and 2 separately, arching A needs to be measured.This had, somewhat surprisingly, never been done before and the decision toconduct these measurements in the course of this research therefore represented amajor step forward.
Most analytical calculation methods account for the traffic load by introducing avertical, uniformly distributed surcharge load. CUR (2015) gives a guideline fordetermining this design load on the basis of standard truck passages. Thisconversion from truck axle load to uniformly distributed surcharge load, as well asthe influence of cyclic loading and lateral loading, are outside the scope of thisthesis.
Several methods for the GR design are available, all with their own models forcalculation steps 1 and 2. The methods give results that differ immensely. TheDutch CUR226 (2010) and the German EBGEO (2010) adopted Zaeske’s method(2001). Measurements that were published later in, for example, Van Duijnen et al.(2010), Van Eekelen et al. (2015a), showed that this method, as well as othermethods adopted in the European guidelines mentioned, could be calculating muchhigher GR strains than those measured in practice, leading to heavier and moreexpensive designs than necessary. The research presented in this thesis began inresponse to this shortcoming.
1.3 Scope, objective and research question of this thesis
The research focused on the two calculation steps that analytically determine theGR strain that results from the dead embankment weight and traffic weight in abasal reinforced piled embankment.
The objective was to further our understanding of the load distribution in a basalreinforced piled embankment and, on that basis, to develop and validate ananalytical design model for geosynthetic reinforcement in a piled embankment.However, a radical departure from existing European design models was felt to beundesirable.
Basal Reinforced Piled Embankments
8
The main research question for this research was: how can we predict the GRstrains in a basal reinforced piled embankment? The research questions are:
- How is the vertical load distributed on the basal reinforcement of a piledembankment?
- How can this load distribution be explained and how can it be describedwith an analytical arching model?
- Which design method fits best with observations and measured arching Aand GR strains in field monitoring projects and experiments?
1.4 Activities undertaken
Two series of a total of nineteen 3D scaled model experiments were conducted inthe Deltares laboratory (Chapter 2 and Chapter 4.2). These experiments guided thethinking that led to the new analytical design model (Chapters 3, 4 and 5.5).
The theory was implemented in three field studies in the Netherlands: the trial“Kyoto Road” project in Giessenburg, (presented in Appendix A), a railway inHouten (Chapters 4.5, 5.3.4 and 5.4.4) and a motorway exit in Woerden (Chapters4.5, 5.3.3 and 5.4.3). The existing and newly proposed analytical design modelswere validated with measurements in eleven field studies and model test series(Chapter 5).
Two Master’s students numerically validated the newly proposed analytical model,using the finite element method (FEM), which was reported in Den Boogert(2011), Den Boogert et al. (2012a and b), Van der Peet (2014) and Van der Peetand Van Eekelen (2014).
1.5 Thesis outline
Chapter 2 (Van Eekelen et al., 2012a) describes the first series of modelexperiments undertaken in the Deltares laboratory. The experiments show howarching depends on several features and how the GR deforms. The net loaddistribution on the GR can be derived from the results of these experiments. On thebasis of the experiments, it is concluded that the load on the GR is concentrated onthe strips between each pair of adjacent piles and that the load is larger at locationscloser to the pile caps. The net load distribution on these GR strips is anapproximate inverse triangle.
1 Introduction
9
Chapter 3 (Van Eekelen et al., 2012b) considers calculation step 2. The chapteranalyses the results of the experiments and introduces an analytical model forstep 2, the load-deflection behaviour. The newly presented model includes theinverse-triangular load distribution and a new subsoil support model.
Chapter 4 (Van Eekelen et al., 2013) focuses on calculation step 1. The chapterpresents the second series of model experiments, discusses the results from theseexperiments and from other research projects presented in the literature, looks atexisting analytical arching models and introduces a new model for arching: theConcentric Arches model. This model provides an explanation for the findings inChapters 2 and 3.
Chapter 5 (Van Eekelen et al., 2015a) presents GR strains measured in seven fieldmonitoring projects and four series of experiments. Eight of these eleven projectswere taken from the literature. The chapter shows that the newly presentedanalytical models give GR strains that match the measured GR strains much betterthan the values resulting from the existing models.
Chapter 6 discusses the results and Chapter 7 presents conclusions andrecommendations.
Finally, Appendix A (Van Eekelen et al., 2011a) describes the basics of piledembankment design. The appendix analyses the design model adopted in BS8006(2010) and proposes an improvement to that model. A field study, the Kyoto Road,was undertaken and the measurements were compared with both versions of theBS8006 model.
Chapters 2, 3, 4, 5 and appendix A have been published previously in theinternational journal Geotextiles and Geomembranes and so these chapters can beread separately. Accordingly, some explanations appear more than once. Minorchanges were made in the text to correct small mistakes in the equations orlanguage. Some footnotes have been added to clarify differences in notation andthe relationship between the papers.
Chapter 4.4.5 gives the equations for the new step 1 model and Appendix 5.Agives the equations for step 2. Appendix 4.B gives calculation examples for bothcalculation steps.

2 Model Experiments on Piled Embankments
Deltares experiments
Published in Geotextiles and Geomembranes:Van Eekelen, S.J.M., Bezuijen, A., Lodder, H.J., van Tol, A.F., 2012a. Model experiments on piled embankmentsPart I. Geotextiles and Geomembranes 32: 69-81. Reprinted with permission from Elsevier.Downloadable at: http://www.sciencedirect.com/science/article/pii/S0266114411001336

Basal Reinforced Piled Embankments
12
Abstract
A series of twelve 3D laboratory model tests was performed on piledembankments. In this first part of a two-part study, the measured load distribution,deformation, and strains are presented and analysed. In the second part (Chapter 3),the measurements are compared with calculations using EBGEO (2010), andsuggestions are given for improvements to the calculation model.
In the test series, the vertical load parts on the piles, on the geosyntheticreinforcement (GR), and on the subsoil could be measured separately. This makesit possible to compare the test results with the separate parts of the analyticalmodels. For the test conditions (static load, laboratory scale), smooth relationshipswere obtained between the net load on the fill (top load on fill minus subsoilsupport) and several measured parameters, such as load distribution anddeformation. Consolidation of the subsoil resulted in an increase of the loadtransferred through the GR, and also an increase of arching. The measuredresponse to consolidation depends on the fill’s friction angle. A higher frictionangle gives more arching during consolidation.
Loading on the geosynthetic reinforcement is concentrated on the strips lyingabove and between adjacent piles (the “GR strips”). The line load on a GR striphas the distribution of an inverse triangle, although the load may be even moreconcentrated around the pile caps than this indicates. This follows from themeasured shape of the deformed GR.
A geogrid gives negligible differences in comparison with a geotextile. Nodifference is found between the use of a single biaxial grid layer and two uniaxialgrid layers positioned directly on top of each other. Only limited differences werefound between a situation with one grid layer, and one where two grid layers wereused with a granular material in between.
2.1 Introduction
In 2010, new or updated design guidelines for piled embankments were publishedin the Netherlands, Germany, and the United Kingdom (respectively CUR226(2010, in Dutch), described in English in Van Eekelen et al., (2010b); EBGEO(2010); and BS8006-1 (2010)). In the Netherlands, this was the first result of anongoing research and development programme, which includes laboratory andfield tests aimed at improving understanding of the arching mechanism,investigating the factors of influence, and further optimisation of the Dutch CURDesign Guideline.
2 Model Experiments on Piled Embankments
13
This paper presents and analyses the results of a series of laboratory model tests.Several researchers have carried out experimental research on piled embankmentsin the past. As with most of the earlier research, this paper focuses on a situationwith a vertical load only i.e. without a slope that results in horizontal loads.
The majority of researchers used a fill of dry or moist sand, except for Horgan andSarsby (2002) who applied an additional 10 mm gravel in their ‘trap door’ tests.Jenck et al. (2009) used a mix of steel rods measuring 3, 4 and 5 mm in diameterand 60 mm in length. The model is therefore two-dimensional. However, agranular fill must be used to model the three-dimensional interaction between ageogrid and granular material.
Several researchers simply took away subsoil support during the test, either via a‘trap door’ (Horgan and Sarsby, 2002) or by removal (Le Hello, 2007). Mostothers forced compression of the subsoil by applying peat (Zaeske, 2001; Heitz,2006; and later Farag, 2008), rubber foam (the 2D tests of Jenck et al., 2009, Lowet al, 1994 and Van Eekelen et al., 2003), or rubber foam chips (Hewlett andRandolph, 1988). Ellis and Aslam (2009a and 2009b) varied the stiffness of thesubsoil by applying two grades of EPS in their centrifuge tests. Chen et al. (2008)modelled the consolidation of the subsoil in their 2D tests by permitting water toflow out gradually from water bags. No researchers chose to control and measurethe subsoil support, and only a few (such as Zaeske, 2001, Heitz, 2006, Le Hello,2007 and Chen et al., 2008) included geosynthetic reinforcement (GR).
Many researchers observed arching through a glass wall (such as Hewlett andRandolph, 1988; Low et al., 1994; Chen et al, 2008, Jenck et al., 2009; and Ellisand Aslam, 2009a and 2009b), and some measured vertical deflection. The strainsof the geosynthetic reinforcement were usually not measured, with the exception ofZaeske (2001) and Heitz (2006). The forces on or below the piles were oftenmeasured (Low et al., 1994; Zaeske, 2001; Heitz, 2006; Farag, 2008; Chen et al.,2008a and Ellis and Aslam, 2009a and 2009b), and sometimes the pressures withinthe fill (Zaeske, 2001; and Heitz, 2006). All researchers found arching. Someproved that the arch was virtually resistant to some cyclic load if sufficientreinforcement was used (for example Hewlett & Randolph, 1988, and Heitz, 2006).
The distribution of the load over the subsoil, the reinforcement, and the piles wasnot measured separately in the tests mentioned above. In the test series described inthis paper, these load parts could be measured separately. This made it possible tocompare the measurement results with the separate parts of the analytical models,as presented in the second part of this study (Van Eekelen et al., 2012b, seeChapter 3 of this thesis). The two main questions are: (1) how is the load
Basal Reinforced Piled Embankments
14
distribution influenced by an increase in top load, and by subsoil support andsubsoil consolidation? (2) how do certain factors, such as fill material orreinforcement type, influence this load distribution? To answer these questions,it must be possible to control the subsoil support and to use realistic granularmaterial in combination with several types of geosynthetics.
This paper describes a series of 12 model tests that were performed on piledembankments. The tests are similar to those reported by Zaeske (2001) and Heitz(2006), which form the basis of the German standard, EBGEO. This set-up waschosen because the size of Zaeske’s 3D test set-up was suitable for carrying outseveral tests.
The measured load distribution, deformation, and GR strains were presented andanalysed in this first part of a two-part study. The results are used to discussseveral influencing factors, such as the properties or specifications of the fill,subsoil, or reinforcement.The second paper in this study compares these measurements with analyticalcalculations using EBGEO (2010). Possible improvements to the analytical modelare also suggested. The results are used to discuss several influencing factors.
2.2 Definition of load distribution
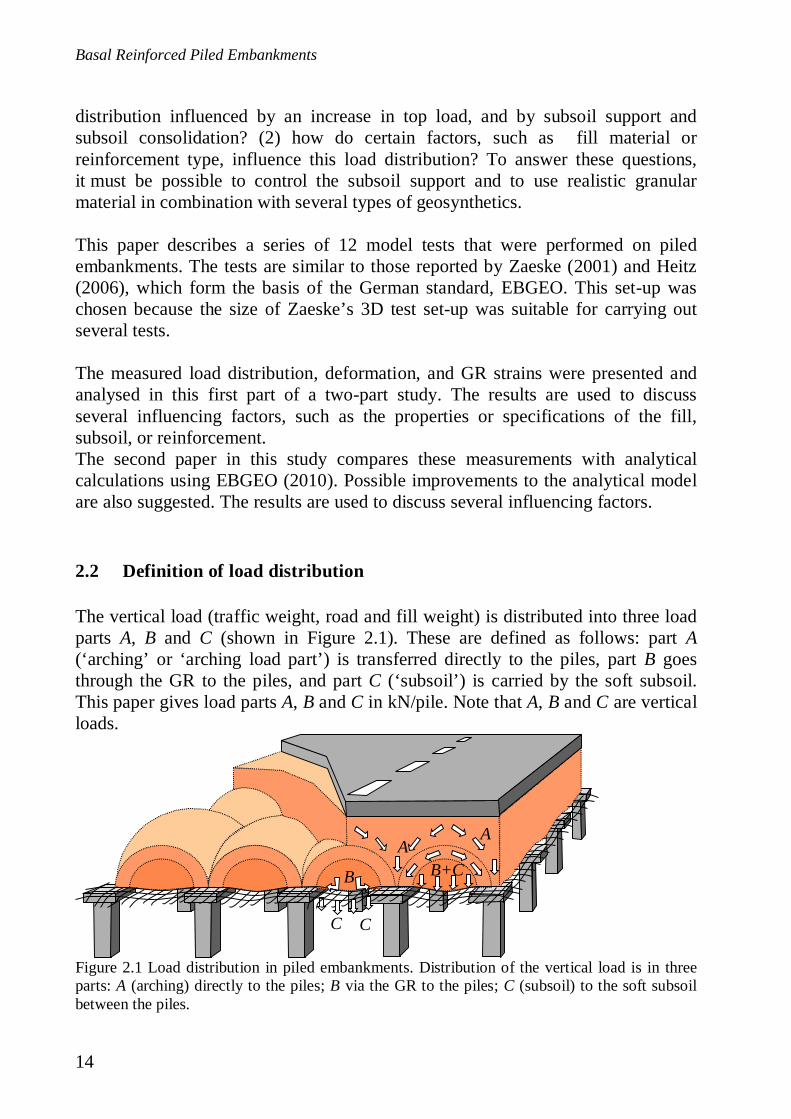
The vertical load (traffic weight, road and fill weight) is distributed into three loadparts A, B and C (shown in Figure 2.1). These are defined as follows: part A(‘arching’ or ‘arching load part’) is transferred directly to the piles, part B goesthrough the GR to the piles, and part C (‘subsoil’) is carried by the soft subsoil.This paper gives load parts A, B and C in kN/pile. Note that A, B and C are verticalloads.
B
AA
CC
B+C
Figure 2.1 Load distribution in piled embankments. Distribution of the vertical load is in threeparts: A (arching) directly to the piles; B via the GR to the piles; C (subsoil) to the soft subsoilbetween the piles.
2 Model Experiments on Piled Embankments
15
2.3 Test set-up and testing programme
2.3.1 Test set-up
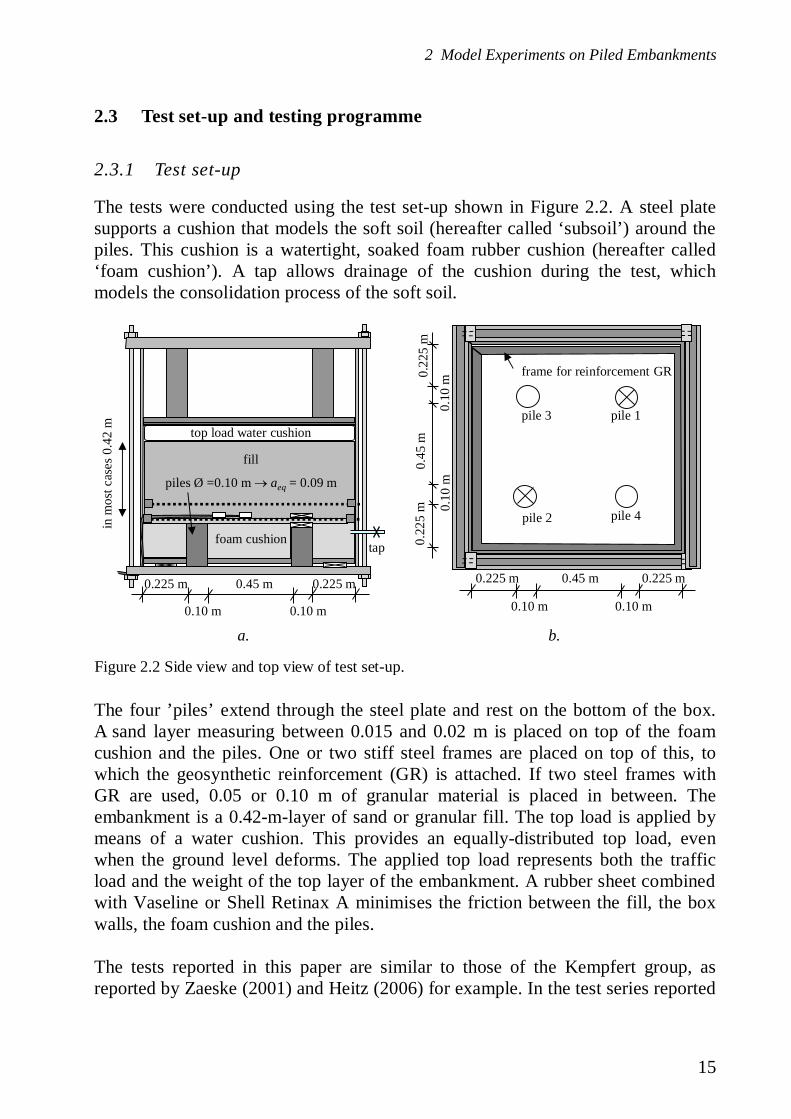
The tests were conducted using the test set-up shown in Figure 2.2. A steel platesupports a cushion that models the soft soil (hereafter called ‘subsoil’) around thepiles. This cushion is a watertight, soaked foam rubber cushion (hereafter called‘foam cushion’). A tap allows drainage of the cushion during the test, whichmodels the consolidation process of the soft soil.
a. b.
The four ’piles’ extend through the steel plate and rest on the bottom of the box.A sand layer measuring between 0.015 and 0.02 m is placed on top of the foamcushion and the piles. One or two stiff steel frames are placed on top of this, towhich the geosynthetic reinforcement (GR) is attached. If two steel frames withGR are used, 0.05 or 0.10 m of granular material is placed in between. Theembankment is a 0.42-m-layer of sand or granular fill. The top load is applied bymeans of a water cushion. This provides an equally-distributed top load, evenwhen the ground level deforms. The applied top load represents both the trafficload and the weight of the top layer of the embankment. A rubber sheet combinedwith Vaseline or Shell Retinax A minimises the friction between the fill, the boxwalls, the foam cushion and the piles.
The tests reported in this paper are similar to those of the Kempfert group, asreported by Zaeske (2001) and Heitz (2006) for example. In the test series reported
inm
ostc
ases
0.42
m
foam cushion
piles Ø =0.10 m aeq = 0.09 m
fill
top load water cushion
0.45 m0.225 m
0.10 m 0.10 m
0.225 m
tap
0.45
m0.
225
m 0.10
m0.
10m0.
225
mpile 3 pile 1
pile 4
frame for reinforcement GR
0.45 m0.225 m
0.10 m 0.10 m
0.225 m
pile 2
Figure 2.2 Side view and top view of test set-up.

Basal Reinforced Piled Embankments
16
here, however, the fill was granular material instead of sand, the subsoil supportwas controlled by means of the foam cushion, and the load distribution wasmeasured differently. This allowed the influence of subsoil loading on the loadparameters A and B to be tested. Another difference was that load parts A, B and Ccould be measured separately.
2.3.2 Measurements
The general measurement set-up is presented in Figure 2.3, although the number oftransducers and their exact location differ for each test. In addition to what isshown in Figure 2.3, the pressure in both cushions, and the amount of waterdrained from the foam cushion are also measured.
Load parts A and B were measured using total pressure cells with a diameter equalto the pile diameter of 0.1 m. In all tests, two total pressure cells measured A + B.They were located below the reinforcement, on top of the piles.
a. cross-section b. top view
c. detail: test with one GR layer d. detail: test with two GR layers
pile
Abl
Abl +Bbl
Atl+BtlAtl
23
45
z1z2
z3
pile 4
1
z5z6
pile 2
pile 1C3
C2
6
pile 3
C1
C4
A
A +Bpile
strain transducer
settlement transducer ztotal pressure cell
z2blz3bl
z2tlz6tl
foamcushion
Cx Cy
fill
pile
x
pile
y
top cushion
Figure 2.3 Nomenclature of measurements: ‘tl’ indicates ‘top grid layer’, and ‘bl’ indicates‘bottom grid layer’.
2 Model Experiments on Piled Embankments
17
For measuring load part B, two types of tests are distinguished: tests with only onereinforcement layer in one frame (hereafter called ‘single-layered tests’), and testswith two reinforcement layers in two frames (hereafter called ‘double-layeredtests’).
In the single-layered tests (see Figure 2.3c), load part A was measured by totalpressure cells positioned above a pile and on top of the GR. Load part B was foundby subtraction i.e. B = (A+B) - A. Where loads were measured at two locations, theaverage is given in the results.
In the double-layered tests (see Figure 2.3d), two total pressure cells below thebottom GR layer measured load parts Abl and Bbl together. The locations of someadditional pressure cells varied between the positions given in Figure 2.3. Threetypes of ‘load part B’ were distinguished: Btotal = (Abl+Bbl) - Atl, Bbl = (Abl+Bbl) - Abland Btl = (Atl+Btl) - Atl. Load part C was determined by measuring the pressure inthe foam cushion.
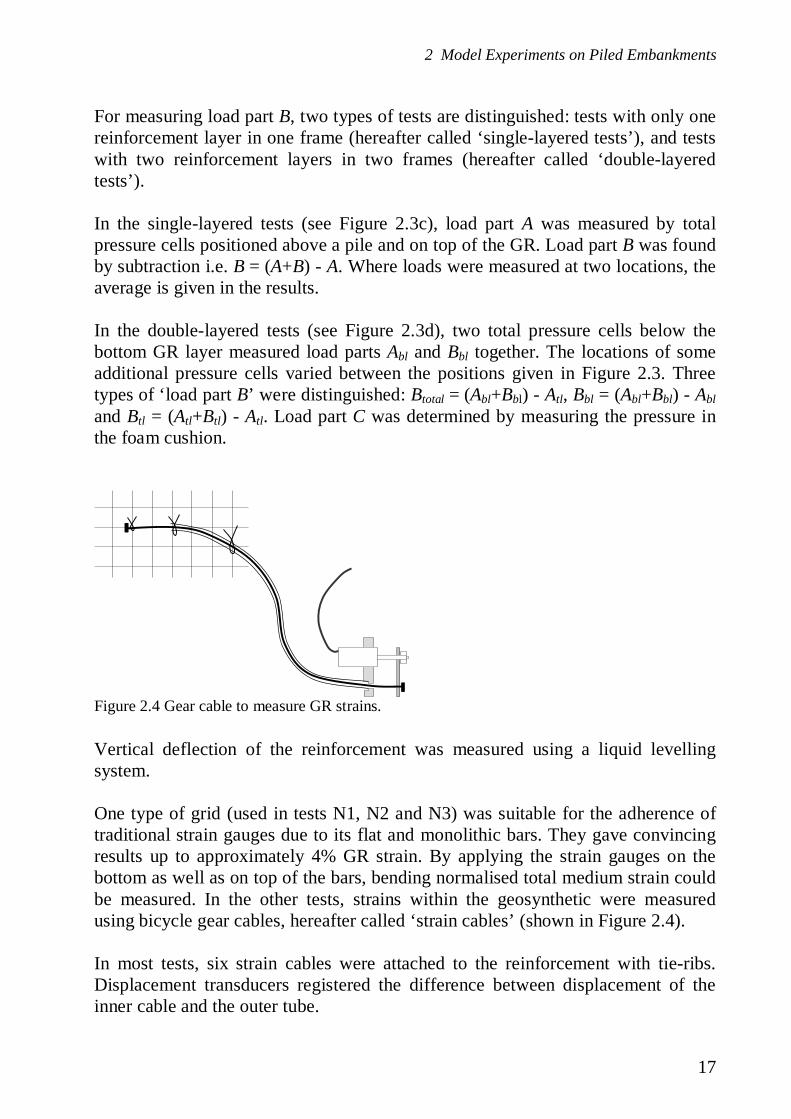
Vertical deflection of the reinforcement was measured using a liquid levellingsystem.
One type of grid (used in tests N1, N2 and N3) was suitable for the adherence oftraditional strain gauges due to its flat and monolithic bars. They gave convincingresults up to approximately 4% GR strain. By applying the strain gauges on thebottom as well as on top of the bars, bending normalised total medium strain couldbe measured. In the other tests, strains within the geosynthetic were measuredusing bicycle gear cables, hereafter called ‘strain cables’ (shown in Figure 2.4).
In most tests, six strain cables were attached to the reinforcement with tie-ribs.Displacement transducers registered the difference between displacement of theinner cable and the outer tube.
Figure 2.4 Gear cable to measure GR strains.
Basal Reinforced Piled Embankments
18
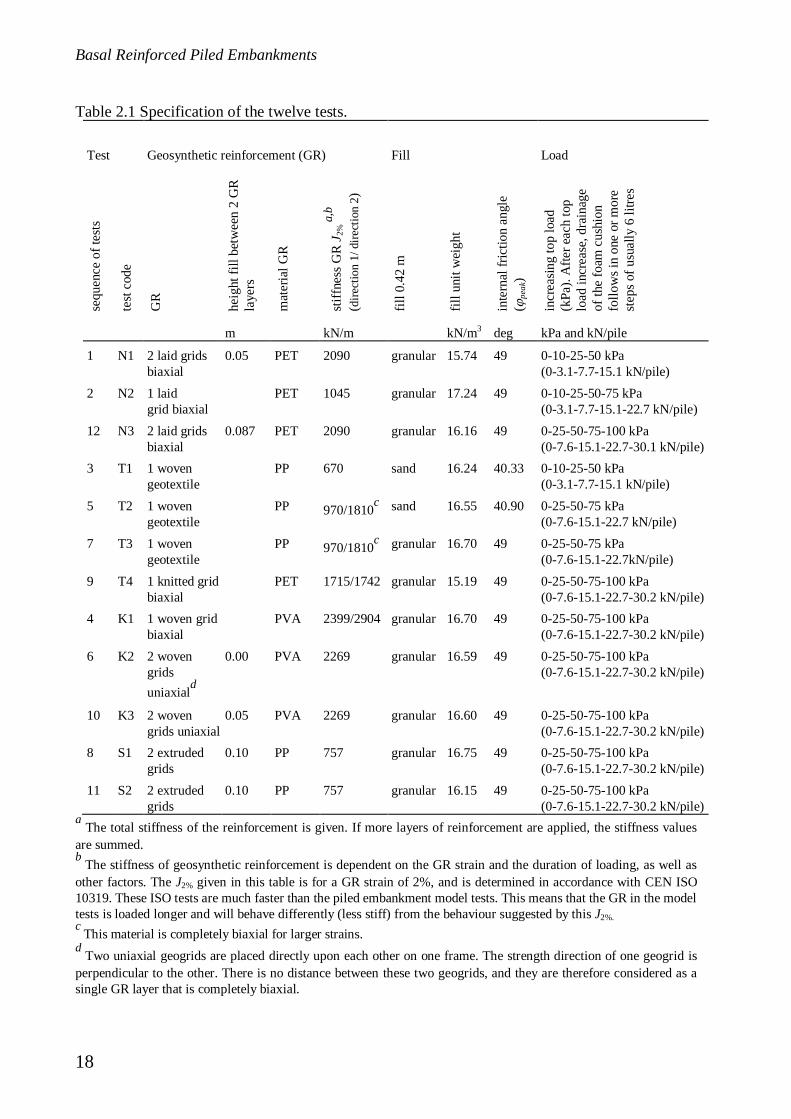
Table 2.1 Specification of the twelve tests.
Test Geosynthetic reinforcement (GR) Fill Load
sequ
ence
ofte
sts
test
code
GR
heig
htfil
lbet
wee
n2
GR
laye
rs
mat
eria
lGR
stiff
ness
GR
J 2%
a,b
(dire
ctio
n1/
dire
ctio
n2)
fill0
.42
m
fillu
nitw
eigh
t
inte
rnal
frict
ion
angl
e(
peak
)
incr
easin
gto
plo
ad(k
Pa).
Afte
reac
hto
plo
adin
crea
se,d
rain
age
ofth
efo
amcu
shio
nfo
llow
sin
one
orm
ore
step
sofu
sual
ly6
litre
s
m kN/m kN/m3 deg kPa and kN/pile
1 N1 2 laid gridsbiaxial
0.05 PET 2090 granular 15.74 49 0-10-25-50 kPa(0-3.1-7.7-15.1 kN/pile)
2 N2 1 laidgrid biaxial
PET 1045 granular 17.24 49 0-10-25-50-75 kPa(0-3.1-7.7-15.1-22.7 kN/pile)
12 N3 2 laid gridsbiaxial
0.087 PET 2090 granular 16.16 49 0-25-50-75-100 kPa(0-7.6-15.1-22.7-30.1 kN/pile)
3 T1 1 wovengeotextile
PP 670 sand 16.24 40.33 0-10-25-50 kPa(0-3.1-7.7-15.1 kN/pile)
5 T2 1 wovengeotextile
PP 970/1810c sand 16.55 40.90 0-25-50-75 kPa(0-7.6-15.1-22.7 kN/pile)
7 T3 1 wovengeotextile
PP 970/1810c granular 16.70 49 0-25-50-75 kPa(0-7.6-15.1-22.7kN/pile)
9 T4 1 knitted gridbiaxial
PET 1715/1742 granular 15.19 49 0-25-50-75-100 kPa(0-7.6-15.1-22.7-30.2 kN/pile)
4 K1 1 woven gridbiaxial
PVA 2399/2904 granular 16.70 49 0-25-50-75-100 kPa(0-7.6-15.1-22.7-30.2 kN/pile)
6 K2 2 wovengridsuniaxiald
0.00 PVA 2269 granular 16.59 49 0-25-50-75-100 kPa(0-7.6-15.1-22.7-30.2 kN/pile)
10 K3 2 wovengrids uniaxial
0.05 PVA 2269 granular 16.60 49 0-25-50-75-100 kPa(0-7.6-15.1-22.7-30.2 kN/pile)
8 S1 2 extrudedgrids
0.10 PP 757 granular 16.75 49 0-25-50-75-100 kPa(0-7.6-15.1-22.7-30.2 kN/pile)
11 S2 2 extrudedgrids
0.10 PP 757 granular 16.15 49 0-25-50-75-100 kPa(0-7.6-15.1-22.7-30.2 kN/pile)
a The total stiffness of the reinforcement is given. If more layers of reinforcement are applied, the stiffness valuesare summed.b The stiffness of geosynthetic reinforcement is dependent on the GR strain and the duration of loading, as well asother factors. The J2% given in this table is for a GR strain of 2%, and is determined in accordance with CEN ISO10319. These ISO tests are much faster than the piled embankment model tests. This means that the GR in the modeltests is loaded longer and will behave differently (less stiff) from the behaviour suggested by this J2%.c This material is completely biaxial for larger strains.d Two uniaxial geogrids are placed directly upon each other on one frame. The strength direction of one geogrid isperpendicular to the other. There is no distance between these two geogrids, and they are therefore considered as asingle GR layer that is completely biaxial.
2 Model Experiments on Piled Embankments
19
Results appeared to depend on fixation of the outer gear cable over the whole ofthe GR and pre-stress in the cable. The results from the strain cables wereconsistent, but were too high in the first tests. In addition, GR strains measuredlocally were strongly dependent on the exact location of the strain cable or straingauge. For both these reasons, the results of the strain cables were only consideredqualitatively throughout the tests. Most ‘measured GR strains’ presented in thispaper were calculated using the measured deflection of the GR, as described inChapter 2.4.3.
2.3.3 Testing programme and materials
Table 2.1 lists the tests that were conducted and specifies the GR used in each test.This paper focuses on the results from some of these tests. Two tests, namelyT1 and T2, were carried out with a fill of Itterbeck sand (125-250 m). The peakfriction angle is determined using a triaxial test. For the densities in T1 and T2, thepeak friction angle peak is respectively 40.3o and 40.9o.
The other tests were carried out using a well-graded granular material (crushedrecycled construction material, 0 – 16.5 mm). The average unit weight is16.38 kN/m3 (see Table 2.1). Den Boogert (2011) carried out displacement-controlled (2 mm/min) triaxial tests on three 300 mm 600 mm samples (diameterheight). The unit weight of the samples was respectively 16.48, 16.47 and16.36 kN/m3, which is in the same range as the unit weight of models in the piledembankment tests. A vacuum pressure of respectively 16 kPa, 55 kPa and 90 kPawas applied as the confining pressure. Radial and axial displacements weremeasured at 1/3 and 2/3 of the sample height. Den Boogert determined the stiffnessand strength parameters from the triaxial test results in accordance withBS1377 (1990). A peak friction angle peak of 49.0o and a dilation angle of 9.0o
were found. The friction angle of the granular fill is approximately 8.5 degreeshigher than the friction angle of the sand.
2.3.4 Test procedure, definition of net load
After the fill was in place, the following steps were carried out in each test:(1) drainage of the foam cushion (modelling subsoil consolidation); (2) the firstincrease in top load, see Table 2.1; (3) one or more subsequent drainage steps;(4) second top load increase; (5) one or more drainage steps; (6) third top loadincrease; (7) one or more drainage steps; continuing until the maximum top loadhad been reached and the subsequent drainage steps were completed.
Basal Reinforced Piled Embankments
20
In some tests, vacuum pressure was then applied to the foam cushion below theGR to suck it away from the GR, until the resulting load part C had been reducedto zero. The test procedure represents a stepwise increase in load, and subsequentconsolidation of the subsoil underneath the piled embankment. After each drainagestep or top load increase, the system was allowed to stabilise for several hours orsometimes throughout the night, until the measurements became stable. This wasnecessary so that the foam cushion had time to consolidate.
Many results will be presented as a function of the net load Wn. Net load is definedas follows:
n sW W C R (2.1)
where Wn is the net load in kN/pile, Ws is the surcharge on top of the fill (top load)in kN/pile, C is the subsoil support (kN/pile), and R is the total friction between filland box walls, and between foam cushion and box walls and piles. R is measuredas follows:
0.25 ( )sfillR A H w A B C (2.2)
where Afill is the area of the fill = (1.1)2 m2, is the fill unit weight in kN/m3, H isthe height of the fill above the bottom layer of the GR in m, ws is the surcharge ontop of the fill in kPa, and A, B and C in kN/pile are explained in Chapter 2.2. Theembankment pressure is the only factor that drives drainage of the foam cushion,except in the last vacuum step. Six litres were drained from the foam cushionduring most of the drainage steps.
2.3.5 Limitations
The research programme has the following limitations:(1) The test set-up aims to investigate the distribution of vertical loads within areinforced embankment supported by stiff elements. Horizontal loads, for examplespreading forces, are outside the scope of this research. (2) Dynamic effects fallbeyond the scope of this research. (3) Each test is carried out within a time-frameof one week. The consolidation process is accelerated in the test series. Other time-dependent effects, such as creep, differ from those seen in the field. These effectsare not taken into account in this study. (4) The results and conclusions of this testseries are therefore only applicable for this type of geometry and a relatively thinembankment.

2 Model Experiments on Piled Embankments
21
The stresses in the model tests presented are not scaled, but are the same as in theprototype. Consequently, the shear modulus of the fill in the model is the same asin the prototype. This approach was chosen to avoid complications due to stress-dependent behaviour of the fill. This is possible because the weight of the fill isnegligible in comparison with the applied surcharge load. This means thatlength (m), stiffness (kN/m) and tensile strength (kN/m) are scaled down by 1 : x,and area (m2) and force (kN) are scaled down by 1 : x2. When compared to Dutchpiled embankments, the model tests are on a scale between 1:1.6 and 1:4.5.However, it should be noted that it is not necessary to use these scaling rules whencomparing the results of the model tests with the results of calculations. If thecalculation model is correct, it is expected to work for both prototype and modeldimensions.
2.4 Typical results
This chapter presents typical results of the test series, mainly illustrated using theresults from a representative test with a single reinforcement layer, namely test K2.Following on from the general conclusions given in this chapter, Chapter 2.5discusses several factors that influence the behaviour of the reinforced piledembankment using results from the other tests.
2.4.1 Arching
Figure 2.5 shows the measured load distribution of test K2. Figure 2.6 shows thecorresponding measured vertical deflection of the GR. It appears that the measuredload parts A and B, both in kN/pile as well as GR vertical deflection, follow asmoothly ascending curve when plotted against net load Wn.
Le Hello (2007) constructed a relatively thin fill before completely removing thesubsoil, then increasing the fill height by 50%. The central graph in Figure 2.6 isbased on Figure 3.6 in his thesis. It shows a comparable ‘smooth’ increase ofvertical deflection, confirming the findings in Figure 2.5 and Figure 2.6.An important finding is that measurements plotted against the net load Wn givemeaningful results. This means that the surcharge load on the fill (for the stressesused) is not important, but that it is the net load on the fill and the GR thatdetermines its behaviour. This is different from results obtained using calculationmodels, as will be discussed in Van Eekelen et al., 2012b, see Chapter 3 of thisthesis.Figure 2.5 also shows the parameters A and B as a percentage of the total measuredload (A% and B%). The two types of loading can now easily be distinguished:(1) top load increase and (2) consolidation of the subsoil.
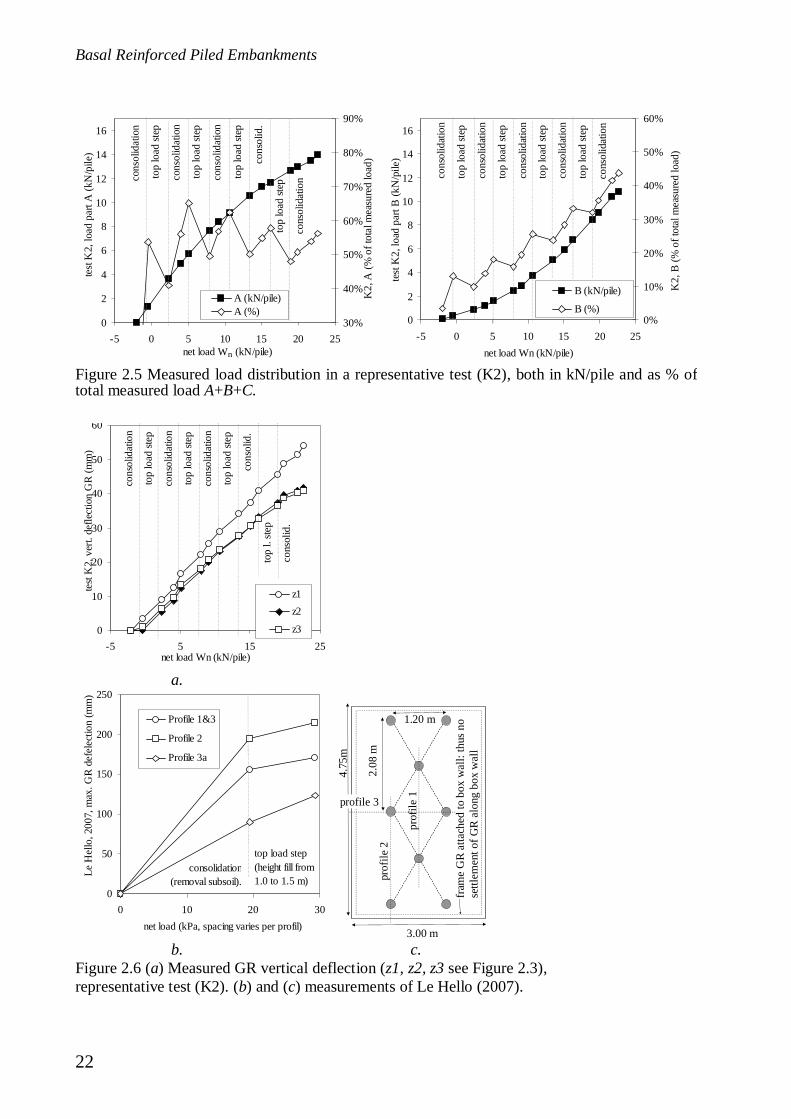
Basal Reinforced Piled Embankments
22
a.
b. c.
0
2
4
6
8
10
12
14
16
-5 0 5 10 15 20 25net load Wn (kN/pile)
test
K2,
load
part
A(k
N/p
ile).
30%
40%
50%
60%
70%
80%
90%
K2,
A(%
ofto
talm
easu
red
load
).
A (kN/pile)A (%)
cons
olid
atio
n
top
load
step
cons
olid
.
top
load
stepco
nsol
idat
ion
top
load
step
cons
olid
atio
n
top
load
step
cons
olid
atio
n
0
2
4
6
8
10
12
14
16
-5 0 5 10 15 20 25net load Wn (kN/pile)
test
K2,
load
part
B(k
N/p
ile)
.
0%
10%
20%
30%
40%
50%
60%
K2,
B(%
ofto
talm
easu
red
load
).
B (kN/pile)
B (%)
cons
olid
atio
n
top
load
step
cons
olid
atio
n
top
load
step
cons
olid
atio
n
top
load
step
cons
olid
atio
n
top
load
step
cons
olid
atio
n
0
10
20
30
40
50
60
-5 5 15 25net load Wn (kN/pile)
test
K2,
vert.
defle
ctio
nG
R(m
m)
.
z1z2
z3
cons
olid
atio
n
top
load
step
cons
olid
.
top
l.ste
p
cons
olid
atio
n
top
load
step
cons
olid
atio
n
top
load
step
cons
olid
.
0
50
100
150
200
250
0 10 20 30net load (kPa, spacing varies per profil)
LeH
ello
,200
7,m
ax.G
Rde
fele
ctio
n(m
m)
.
Profile 1&3
Profile 2
Profile 3a
top load step(height fill from1.0 to 1.5 m)
consolidation(removal subsoil).
1.20 m
3.00 m
2.08
m
4.75
m
prof
ile1
prof
ile2
profile 3
fram
eG
Rat
tach
edto
box
wal
l:th
usno
settl
emen
tofG
Ral
ong
box
wal
l
Figure 2.5 Measured load distribution in a representative test (K2), both in kN/pile and as % oftotal measured load A+B+C.
Figure 2.6 (a) Measured GR vertical deflection (z1, z2, z3 see Figure 2.3),representative test (K2). (b) and (c) measurements of Le Hello (2007).
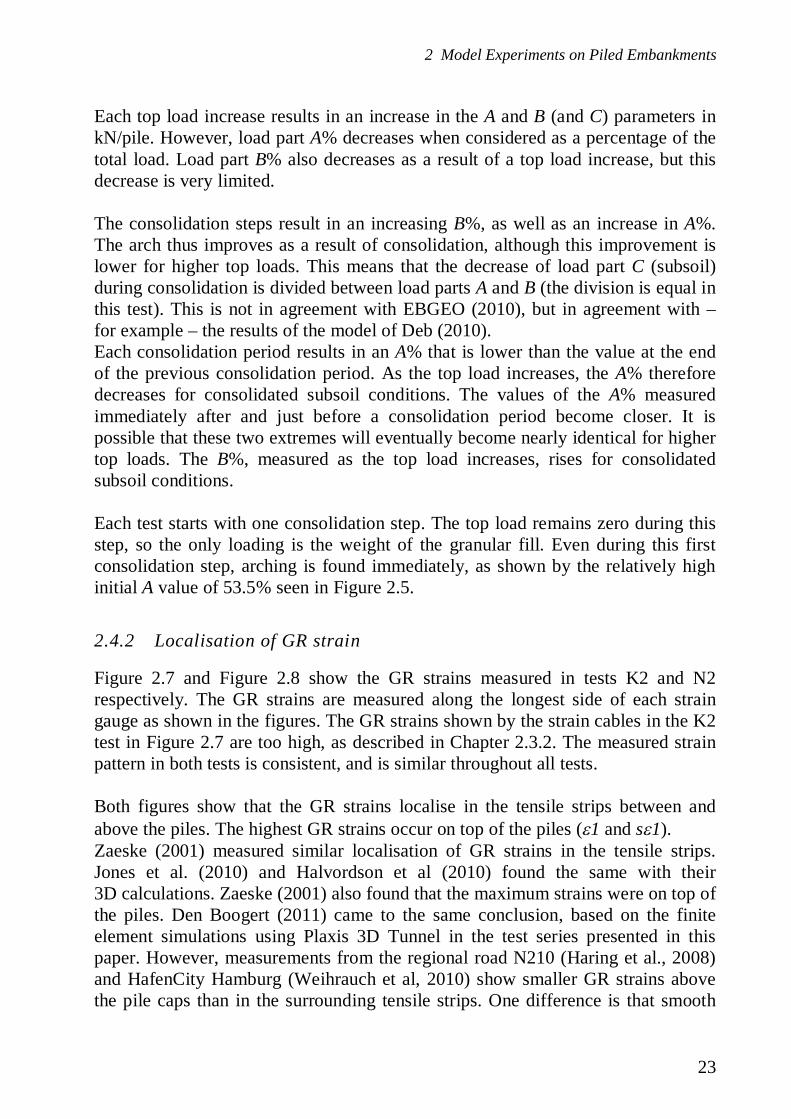
2 Model Experiments on Piled Embankments
23
Each top load increase results in an increase in the A and B (and C) parameters inkN/pile. However, load part A% decreases when considered as a percentage of thetotal load. Load part B% also decreases as a result of a top load increase, but thisdecrease is very limited.
The consolidation steps result in an increasing B%, as well as an increase in A%.The arch thus improves as a result of consolidation, although this improvement islower for higher top loads. This means that the decrease of load part C (subsoil)during consolidation is divided between load parts A and B (the division is equal inthis test). This is not in agreement with EBGEO (2010), but in agreement with –for example – the results of the model of Deb (2010).Each consolidation period results in an A% that is lower than the value at the endof the previous consolidation period. As the top load increases, the A% thereforedecreases for consolidated subsoil conditions. The values of the A% measuredimmediately after and just before a consolidation period become closer. It ispossible that these two extremes will eventually become nearly identical for highertop loads. The B%, measured as the top load increases, rises for consolidatedsubsoil conditions.
Each test starts with one consolidation step. The top load remains zero during thisstep, so the only loading is the weight of the granular fill. Even during this firstconsolidation step, arching is found immediately, as shown by the relatively highinitial A value of 53.5% seen in Figure 2.5.
2.4.2 Localisation of GR strain
Figure 2.7 and Figure 2.8 show the GR strains measured in tests K2 and N2respectively. The GR strains are measured along the longest side of each straingauge as shown in the figures. The GR strains shown by the strain cables in the K2test in Figure 2.7 are too high, as described in Chapter 2.3.2. The measured strainpattern in both tests is consistent, and is similar throughout all tests.
Both figures show that the GR strains localise in the tensile strips between andabove the piles. The highest GR strains occur on top of the piles ( 1 and s 1).Zaeske (2001) measured similar localisation of GR strains in the tensile strips.Jones et al. (2010) and Halvordson et al (2010) found the same with their3D calculations. Zaeske (2001) also found that the maximum strains were on top ofthe piles. Den Boogert (2011) came to the same conclusion, based on the finiteelement simulations using Plaxis 3D Tunnel in the test series presented in thispaper. However, measurements from the regional road N210 (Haring et al., 2008)and HafenCity Hamburg (Weihrauch et al, 2010) show smaller GR strains abovethe pile caps than in the surrounding tensile strips. One difference is that smooth
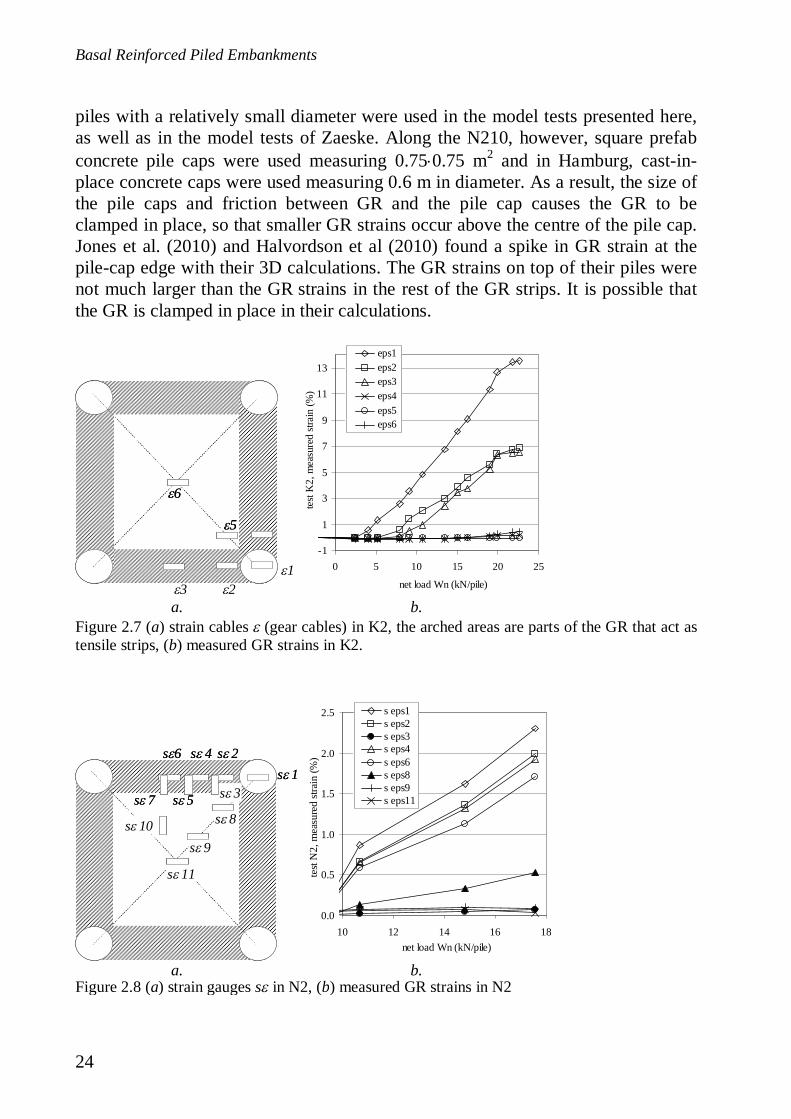
Basal Reinforced Piled Embankments
24
piles with a relatively small diameter were used in the model tests presented here,as well as in the model tests of Zaeske. Along the N210, however, square prefabconcrete pile caps were used measuring 0.75 0.75 m2 and in Hamburg, cast-in-place concrete caps were used measuring 0.6 m in diameter. As a result, the size ofthe pile caps and friction between GR and the pile cap causes the GR to beclamped in place, so that smaller GR strains occur above the centre of the pile cap.Jones et al. (2010) and Halvordson et al (2010) found a spike in GR strain at thepile-cap edge with their 3D calculations. The GR strains on top of their piles werenot much larger than the GR strains in the rest of the GR strips. It is possible thatthe GR is clamped in place in their calculations.
a. b.
a. b.
123
45
6
5
6
-1
1
3
5
7
9
11
13
0 5 10 15 20 25
net load Wn (kN/pile)
test
K2,
mea
sure
dstr
ain
(%).
eps1eps2eps3eps4eps5eps6
s 1s 2s 6
s 11
s 4
s 9
s 8s 7 s 5 s 3
s 10
s 1s 2s 6
s 11
s 4
s 9
s 8s 7 s 5 s 3
s 10
0.0
0.5
1.0
1.5
2.0
2.5
10 12 14 16 18net load Wn (kN/pile) .
test
N2,
mea
sure
dstr
ain
(%).
s eps1s eps2s eps3s eps4s eps6s eps8s eps9s eps11
Figure 2.7 (a) strain cables (gear cables) in K2, the arched areas are parts of the GR that act astensile strips, (b) measured GR strains in K2.
Figure 2.8 (a) strain gauges s in N2, (b) measured GR strains in N2
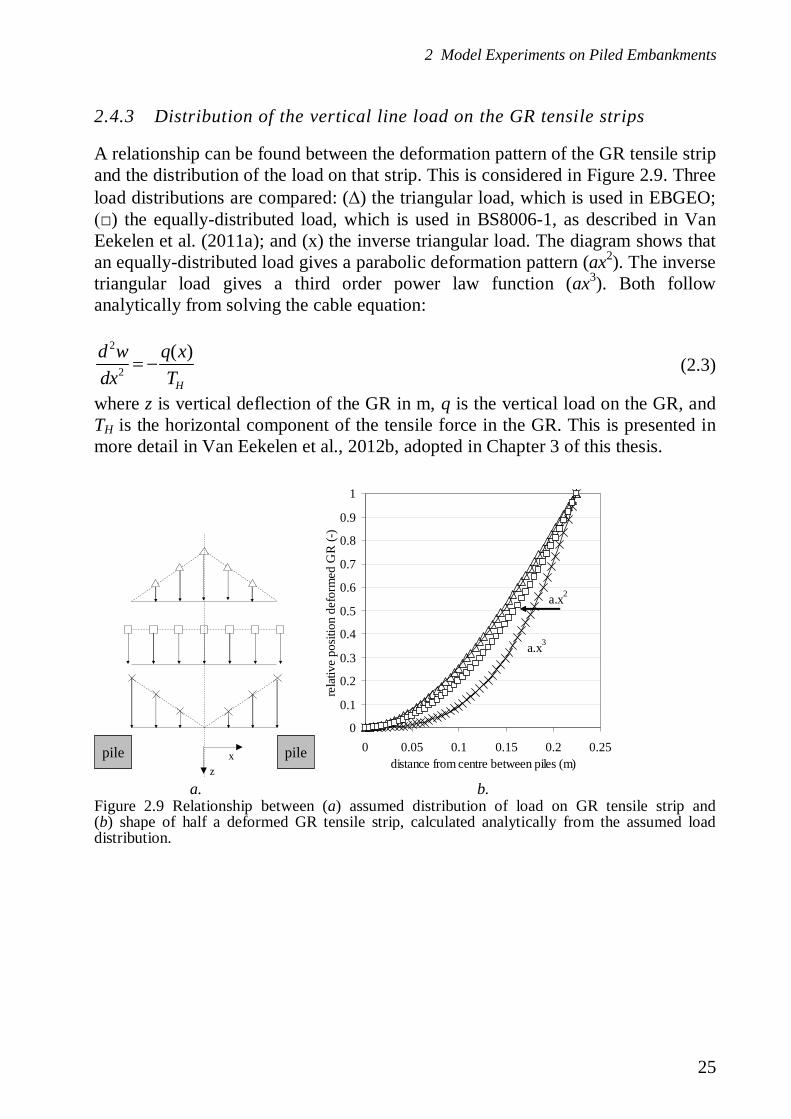
2 Model Experiments on Piled Embankments
25
2.4.3 Distribution of the vertical line load on the GR tensile strips
A relationship can be found between the deformation pattern of the GR tensile stripand the distribution of the load on that strip. This is considered in Figure 2.9. Threeload distributions are compared: ( ) the triangular load, which is used in EBGEO;
) the equally-distributed load, which is used in BS8006-1, as described in VanEekelen et al. (2011a); and (x) the inverse triangular load. The diagram shows thatan equally-distributed load gives a parabolic deformation pattern (ax2). The inversetriangular load gives a third order power law function (ax3). Both followanalytically from solving the cable equation:
2
2
( )
H
d w q xdx T
(2.3)
where z is vertical deflection of the GR in m, q is the vertical load on the GR, andTH is the horizontal component of the tensile force in the GR. This is presented inmore detail in Van Eekelen et al., 2012b, adopted in Chapter 3 of this thesis.
a. b.
pile pilexz
0
0.1
0.2
0.3
0.4
0.5
0.6
0.7
0.8
0.9
1
0 0.05 0.1 0.15 0.2 0.25distance from centre between piles (m)
rela
tive
posit
ion
defo
rmed
GR
(-).
a.x3
a.x2
Figure 2.9 Relationship between (a) assumed distribution of load on GR tensile strip and(b) shape of half a deformed GR tensile strip, calculated analytically from the assumed loaddistribution.

Basal Reinforced Piled Embankments
26
Figure 2.10 shows the GR vertical deflection measured with a top load of22.7 kN/pile for the tests K2 and T3, with subsoil support C = 1.8 and 0.8 kN/pilerespectively. It should be noted that the exact locations (Figure 2.3) of themeasurements vary per test. The figure shows z2 and z3, and a vertical deflectioncurve that follows a third order power law (ax3), assuming that z2 lies on the curve.The figure shows that the shape of the deformed GR follows a power law of thethird order, or even a higher order. The deformed GR does not follow a power lawin any of the tests that is lower than the third order. This proves that the load on theGR strip is at least the same as in the inverse triangle shown in Figure 2.9. Thisconclusion is also confirmed in further measurements (including phases withoutsubsoil support), as presented in Van Eekelen et al. (2011b). The analyticalelaboration of this new model is presented in Van Eekelen et al (2012b, adopted inChapter 3 of this thesis).
The load may even be more concentrated around the pile caps than the inversetriangular distribution indicates. A possible reason is found when the fill settlementaround the pile is compared to the situation when a pile is pushed into the soil.This will also result in localisation of stresses in the area just around the pile.
The load distribution is of importance for loading on the GR, and thus for theGR design. For this geometry, the same total load with the inverse triangular loadgives a tensile force (and thus GR strain) in the geosynthetic that is only 75% ofthe tensile force for the triangular load. For the maximum vertical deflection, thisratio is 70%.
-50
-45
-40
-35
-30
-25
-20
-15
-10
-5
0
0 5 10 15 20 25distance from centre between piles (mm)
GR
defle
ctio
n(m
m)t
oplo
ad22
.7kN
/pile
.
3rd order power law ax3T3 measured3rd order power law ax3K2 measured
pile
approachshape 1/2deformedGR strip
Figure 2.10 Comparison of measured vertical deflection (separate black dots) with third orderpower law function, which closely matches the shape of the deformed GR strip; measuredvertical deflection for top load p = 22.7 kN/pile and subsoil C = 2.4 kN/pile.
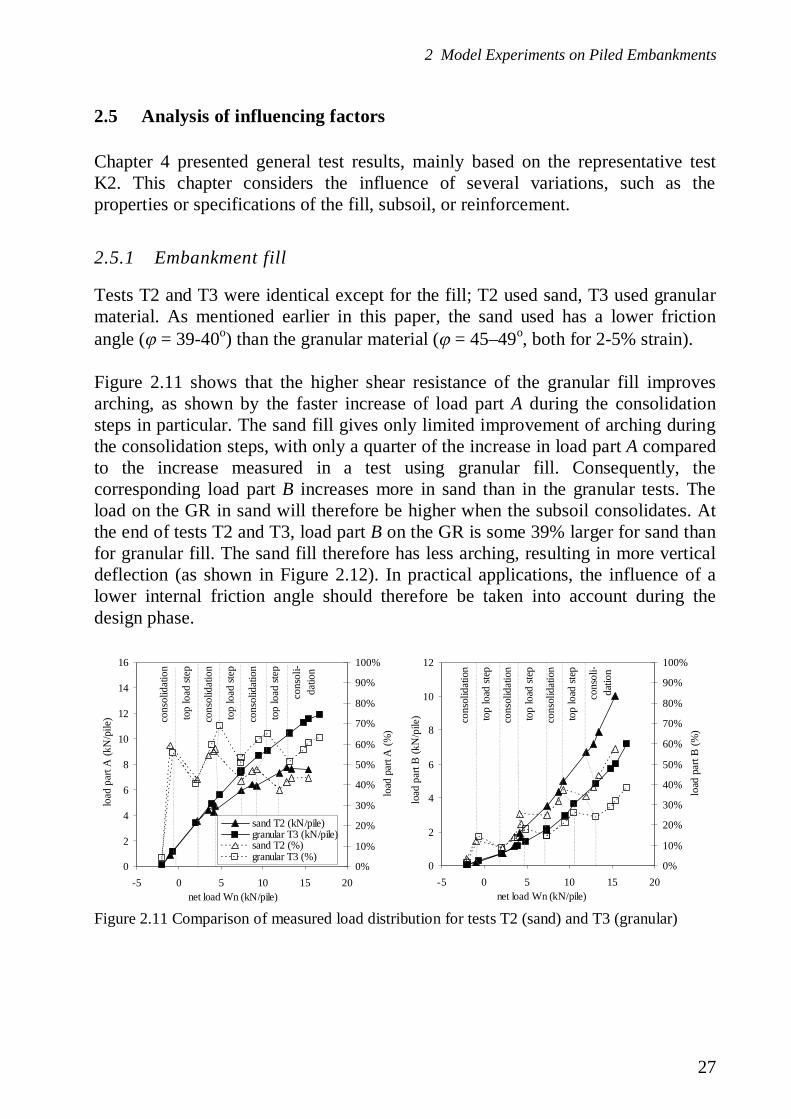
2 Model Experiments on Piled Embankments
27
2.5 Analysis of influencing factors
Chapter 4 presented general test results, mainly based on the representative testK2. This chapter considers the influence of several variations, such as theproperties or specifications of the fill, subsoil, or reinforcement.
2.5.1 Embankment fill
Tests T2 and T3 were identical except for the fill; T2 used sand, T3 used granularmaterial. As mentioned earlier in this paper, the sand used has a lower frictionangle ( = 39-40o) than the granular material ( = 45–49o, both for 2-5% strain).
Figure 2.11 shows that the higher shear resistance of the granular fill improvesarching, as shown by the faster increase of load part A during the consolidationsteps in particular. The sand fill gives only limited improvement of arching duringthe consolidation steps, with only a quarter of the increase in load part A comparedto the increase measured in a test using granular fill. Consequently, thecorresponding load part B increases more in sand than in the granular tests. Theload on the GR in sand will therefore be higher when the subsoil consolidates. Atthe end of tests T2 and T3, load part B on the GR is some 39% larger for sand thanfor granular fill. The sand fill therefore has less arching, resulting in more verticaldeflection (as shown in Figure 2.12). In practical applications, the influence of alower internal friction angle should therefore be taken into account during thedesign phase.
0
2
4
6
8
10
12
14
16
-5 0 5 10 15 20net load Wn (kN/pile)
load
part
A(k
N/p
ile)
.
0%
10%
20%
30%
40%
50%
60%
70%
80%
90%
100%
load
part
A(%
)
sand T2 (kN/pile)granular T3 (kN/pile)sand T2 (%)granular T3 (%)
cons
olid
atio
n.
top
load
step
cons
oli-
datio
n
top
load
step
top
load
step
cons
olid
atio
n.
cons
olid
atio
n.
0
2
4
6
8
10
12
-5 0 5 10 15 20net load Wn (kN/pile)
load
part
B(k
N/p
ile)
.
0%
10%
20%
30%
40%
50%
60%
70%
80%
90%
100%
load
part
B(%
)
cons
olid
atio
n.
top
load
step
cons
oli-
datio
n
top
load
step
top
load
step
cons
olid
atio
n.
cons
olid
atio
n.
Figure 2.11 Comparison of measured load distribution for tests T2 (sand) and T3 (granular)

Basal Reinforced Piled Embankments
28
a. b.
2.5.2 Geogrid or geotextile
Test T4 is identical to T3, except that a geogrid is used instead of a geotextile, andthe maximum top load in T4 is higher. The stiffness behaviour of the two materialsis more or less the same (see Table 2.1). It is generally expected that the grains ofthe granular material become trapped in the gaps of the geogrid, so improving thearching mechanism of the system.
Figure 2.12 shows that the differences between the use of the geogrid and thegeotextile are negligible, and are far less than the differences demonstratedbetween sand and granular fill (see Figure 2.11). Thus, the concept of trappinggrains within the geogrid gaps either does not occur in these tests or (if it does)does not lead to any observable benefits over surface friction alone.
2.5.3 Single GR layer consisting of one biaxial or two uniaxial grids
Most design methods assume a geosynthetic reinforcement design consisting ofone biaxial layer. However, the width limitation of rolls of geosyntheticreinforcements means that it would not be possible to guarantee the strength in thecross direction of the roll. Therefore, two layers of uniaxial material are normallyused instead of a single biaxial layer. These two uniaxial layers are placedperpendicular to, and directly on top of each other.
0
2
4
6
8
10
12
14
16
-5 5 15 25net load Wn (kN/pile)
load
parts
Aan
dB
(kN
/pile
).
geogrid T4 A
geogrid T4 B
geotextile T3 Ageotextile T3 B
A
B
cons
olid
atio
n.
cons
olid
atio
n.to
plo
adste
p
top
load
step
cons
olid
..
cons
olid
atio
n.to
plo
adste
p
top
load
step
cons
olid
atio
n.
0
10
20
30
40
50
-5 0 5 10 15 20
net load Wn (kN/pile)
GR
defle
ctio
nz1
(mm
).
T4 geogrid granular z1T3 geotextile granular z1T2 geotextile sand z1
Figure 2.12 (a) comparison of measured load distribution for geotextile (T3) and geogrid (T4);(b) measured vertical deflection z1 for T2 (sand, geotextile), T3 (granular, geotextile) andT4 (granular, geogrid).
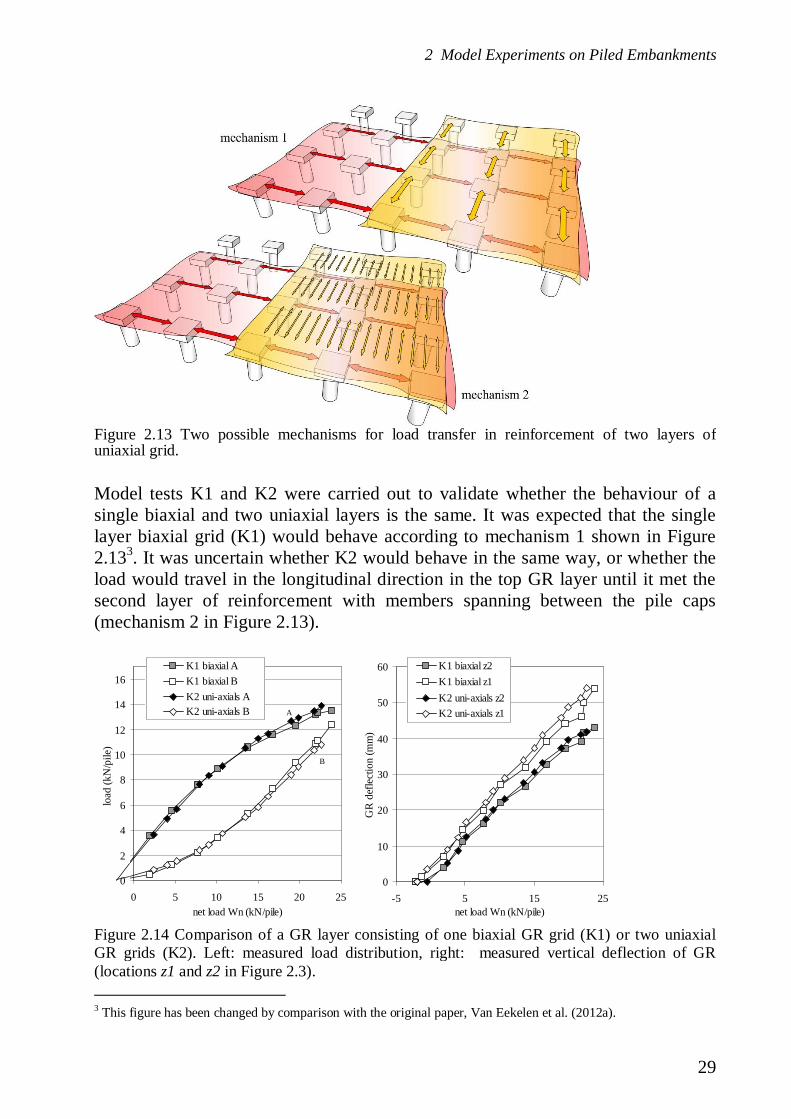
2 Model Experiments on Piled Embankments
29
Model tests K1 and K2 were carried out to validate whether the behaviour of asingle biaxial and two uniaxial layers is the same. It was expected that the singlelayer biaxial grid (K1) would behave according to mechanism 1 shown in Figure2.133. It was uncertain whether K2 would behave in the same way, or whether theload would travel in the longitudinal direction in the top GR layer until it met thesecond layer of reinforcement with members spanning between the pile caps(mechanism 2 in Figure 2.13).
3 This figure has been changed by comparison with the original paper, Van Eekelen et al. (2012a).
0
2
4
6
8
10
12
14
16
0 5 10 15 20 25net load Wn (kN/pile)
load
(kN
/pile
).
K1 biaxial AK1 biaxial BK2 uni-axials AK2 uni-axials B
B
A
0
10
20
30
40
50
60
-5 5 15 25net load Wn (kN/pile)
GR
defle
ctio
n(m
m).
K1 biaxial z2K1 biaxial z1K2 uni-axials z2K2 uni-axials z1
Figure 2.13 Two possible mechanisms for load transfer in reinforcement of two layers ofuniaxial grid.
Figure 2.14 Comparison of a GR layer consisting of one biaxial GR grid (K1) or two uniaxialGR grids (K2). Left: measured load distribution, right: measured vertical deflection of GR(locations z1 and z2 in Figure 2.3).

Basal Reinforced Piled Embankments
30
Figure 2.14 show that both tests behave the same, and Figure 2.7 shows thatmechanism 1 occurs in test K2. The load travels in both directions, mainly alongthe strips between adjacent pile caps, as shown by mechanism 1 in Figure 2.13.Differences between the two tests (a higher load part B in the final phase of testK1) must be due to differences in friction between the box and fill, as the top load,load parts A and C (and vertical deflection of the GR) are nearly the same.
2.5.4 Stiffness of GR4
a. b.
c. d.Figure 2.15 Vertical GR deflection and arching in relation to GR stiffness J for tests with agranular fill.
4 This chapter has been extended by comparison with the original paper, Van Eekelen et al. (2012a).
0
5
10
15
20
25
30
35
40
45
50
55
0 5 10 15 20 25
GR
defle
ctio
nz2
(mm
).
net load Wn (kN/pile)
0
5
10
15
20
25
30
35
40
45
50
55
0 2 4 6 8 10 12
GR
defle
ctio
nz2
(mm
).
load part B (kN/pile)
J2%=1045 kN/m; N2
J2%=970/1810 kN/m; T3
J2%=1715/1742 kN/m; T4
J2%=2269 kN/m; K2
J2%=2399/2904 kN/m; K1
0
2
4
6
8
10
12
14
16
0 5 10 15 20 25
Arc
hing
(load
part
A)(
kN/p
ile)
.
net load Wn (kN/pile)
0
2
4
6
8
10
12
14
16
0 10 20 30 40 50
Arc
hing
(load
part
A)(
kN/p
ile)
.
GR deflection z2 (mm)

2 Model Experiments on Piled Embankments
31
Figure 2.15 and Figure 2.16 consider the dependency of GR stiffness J in single-layered tests for granular and sand fills respectively.Figure 2.15a and b show the influence of J in granular fills. The figures showclearly that the stiffer the GR, the less vertical deflection there is. This is due to thefact that there is less GR strain.
a b
c dFigure 2.16 Vertical GR deflection and arching in relation to GR stiffness and fill type. The GRstiffness in test T1 is so low that the behaviour in test T1 resembles the situation without GR.
Figure 2.16a and b show a similar picture for sand fills and include one granularfill test, T3, for comparison purposes. Test T1, in which the GR stiffness was thelowest in the entire test series, shows ongoing GR deflection, with no increase inthe net load Wn: the GR was so flexible that it followed the subsoil deformationand it was not possible to reduce subsoil support C to zero by draining the foamcushion. Nor did the application of vacuum pressure to the foam cushion help to
0
5
10
15
20
25
30
35
40
45
50
55
0 5 10 15 20 25
GR
defle
ctio
nz2
(mm
).
net load Wn (kN/pile)
influenceGR
stiffnessinfluence
fill:sand orgranular
0
5
10
15
20
25
30
35
40
45
50
55
0 2 4 6 8 10 12
GR
defle
ctio
nz2
(mm
).
load part B (kN/pile)
J2%=670 kN/m; T1 sandJ2%=970/1810 kN/m; T2 sandJ2%=970/1810 kN/m; T3 granular
0
2
4
6
8
10
12
14
16
0 5 10 15 20 25
Arc
hing
(load
part
A)(
kN/p
ile)
.
net load Wn (kN/pile)
0
2
4
6
8
10
12
14
16
0 10 20 30 40 50
Arc
hing
(load
part
A)(
kN/p
ile)
.
GR deflection z2 (mm)
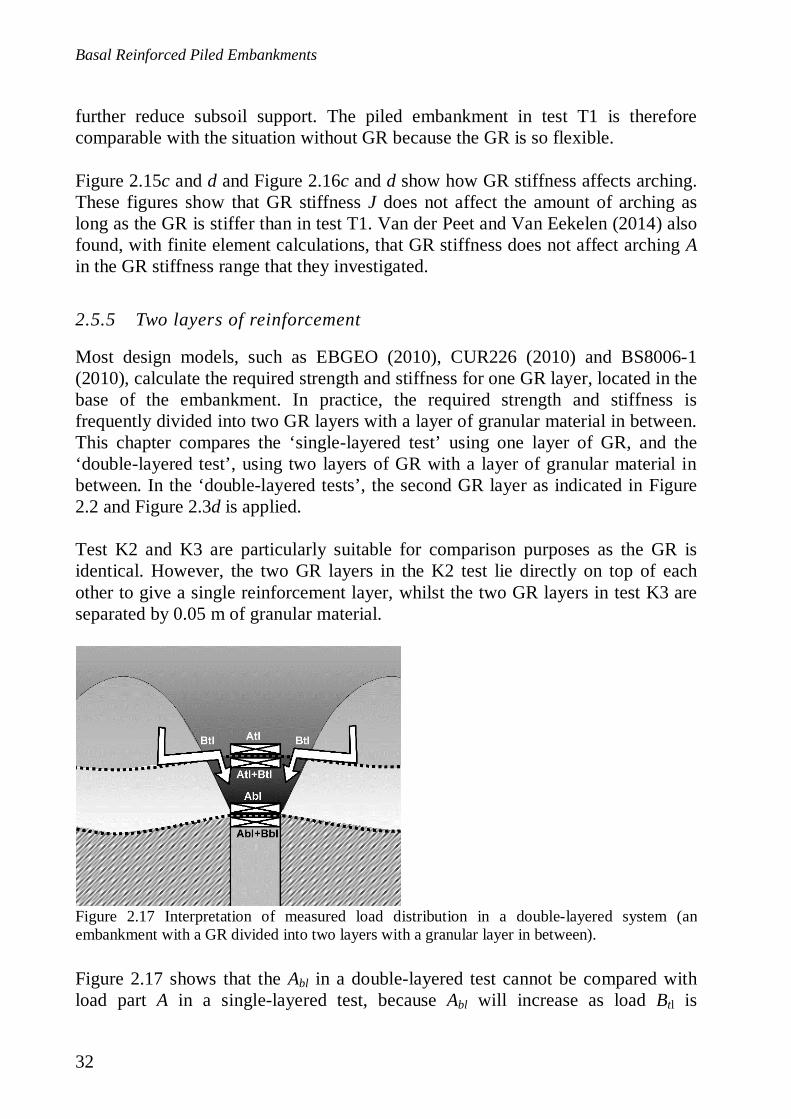
Basal Reinforced Piled Embankments
32
further reduce subsoil support. The piled embankment in test T1 is thereforecomparable with the situation without GR because the GR is so flexible.
Figure 2.15c and d and Figure 2.16c and d show how GR stiffness affects arching.These figures show that GR stiffness J does not affect the amount of arching aslong as the GR is stiffer than in test T1. Van der Peet and Van Eekelen (2014) alsofound, with finite element calculations, that GR stiffness does not affect arching Ain the GR stiffness range that they investigated.
2.5.5 Two layers of reinforcement
Most design models, such as EBGEO (2010), CUR226 (2010) and BS8006-1(2010), calculate the required strength and stiffness for one GR layer, located in thebase of the embankment. In practice, the required strength and stiffness isfrequently divided into two GR layers with a layer of granular material in between.This chapter compares the ‘single-layered test’ using one layer of GR, and the‘double-layered test’, using two layers of GR with a layer of granular material inbetween. In the ‘double-layered tests’, the second GR layer as indicated in Figure2.2 and Figure 2.3d is applied.
Test K2 and K3 are particularly suitable for comparison purposes as the GR isidentical. However, the two GR layers in the K2 test lie directly on top of eachother to give a single reinforcement layer, whilst the two GR layers in test K3 areseparated by 0.05 m of granular material.
Figure 2.17 shows that the Abl in a double-layered test cannot be compared withload part A in a single-layered test, because Abl will increase as load Btl is
Figure 2.17 Interpretation of measured load distribution in a double-layered system (anembankment with a GR divided into two layers with a granular layer in between).
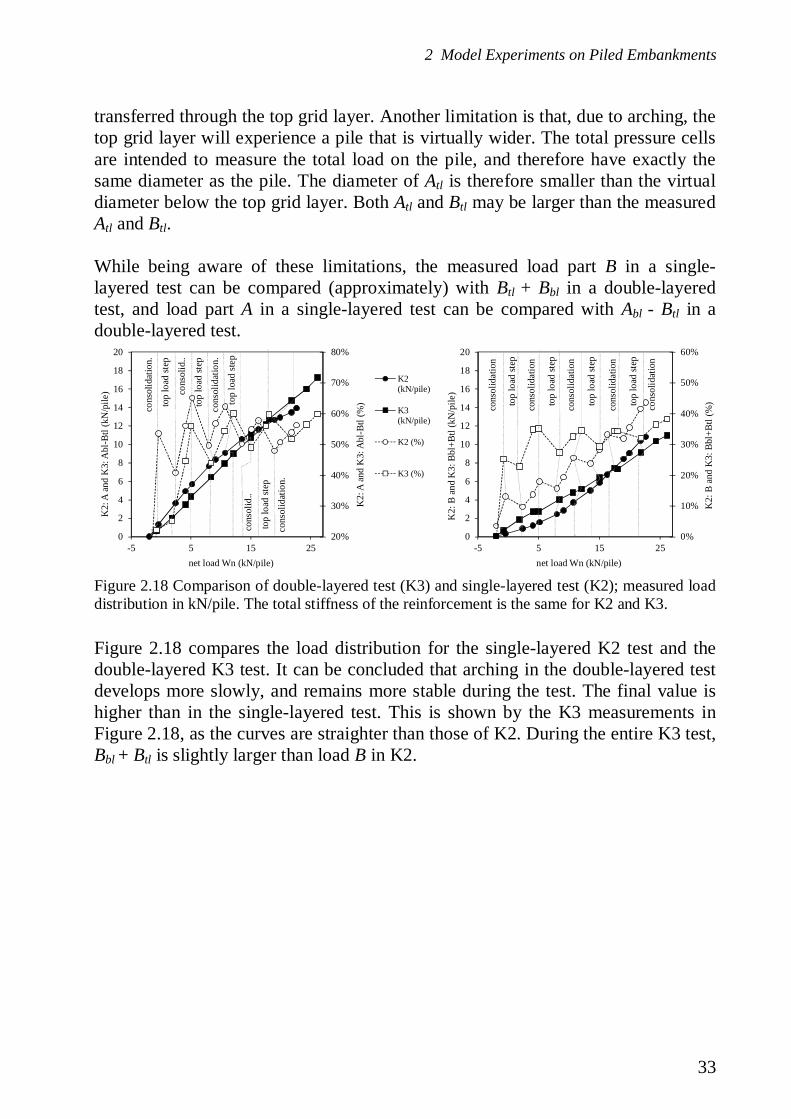
2 Model Experiments on Piled Embankments
33
transferred through the top grid layer. Another limitation is that, due to arching, thetop grid layer will experience a pile that is virtually wider. The total pressure cellsare intended to measure the total load on the pile, and therefore have exactly thesame diameter as the pile. The diameter of Atl is therefore smaller than the virtualdiameter below the top grid layer. Both Atl and Btl may be larger than the measuredAtl and Btl.
While being aware of these limitations, the measured load part B in a single-layered test can be compared (approximately) with Btl + Bbl in a double-layeredtest, and load part A in a single-layered test can be compared with Abl - Btl in adouble-layered test.
Figure 2.18 compares the load distribution for the single-layered K2 test and thedouble-layered K3 test. It can be concluded that arching in the double-layered testdevelops more slowly, and remains more stable during the test. The final value ishigher than in the single-layered test. This is shown by the K3 measurements inFigure 2.18, as the curves are straighter than those of K2. During the entire K3 test,Bbl + Btl is slightly larger than load B in K2.
20%
30%
40%
50%
60%
70%
80%
0
2
4
6
8
10
12
14
16
18
20
-5 5 15 25
K2:
Aan
dK
3:A
bl-B
tl(%
).
K2:
Aan
dK
3:A
bl-B
tl(k
N/p
ile)
.
net load Wn (kN/pile)
K2(kN/pile)
K3(kN/pile)
K2 (%)
K3 (%)
cons
olid
..
cons
olid
atio
n.
top
load
step
cons
olid
..
cons
olid
atio
n.
top
load
step
top
load
step
cons
olid
atio
n.
top
load
step
0%
10%
20%
30%
40%
50%
60%
0
2
4
6
8
10
12
14
16
18
20
-5 5 15 25
K2:
Ban
dK
3:B
bl+B
tl(%
).
K2:
Ban
dK
3:B
bl+B
tl(k
N/p
ile)
.
net load Wn (kN/pile)
cons
olid
atio
n.
cons
olid
atio
n.
top
load
step
cons
olid
atio
n.
cons
olid
atio
n.
top
load
step
top
load
step
cons
olid
atio
n.
top
load
step
Figure 2.18 Comparison of double-layered test (K3) and single-layered test (K2); measured loaddistribution in kN/pile. The total stiffness of the reinforcement is the same for K2 and K3.
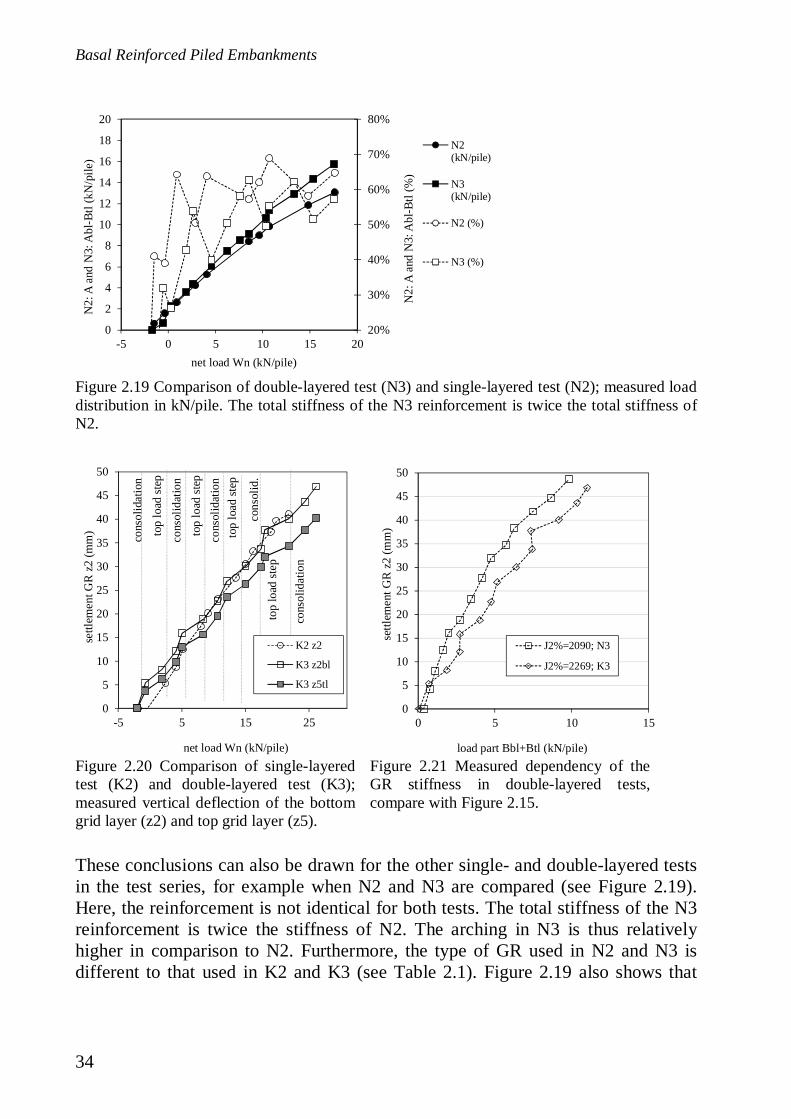
Basal Reinforced Piled Embankments
34
Figure 2.19 Comparison of double-layered test (N3) and single-layered test (N2); measured loaddistribution in kN/pile. The total stiffness of the N3 reinforcement is twice the total stiffness ofN2.
These conclusions can also be drawn for the other single- and double-layered testsin the test series, for example when N2 and N3 are compared (see Figure 2.19).Here, the reinforcement is not identical for both tests. The total stiffness of the N3reinforcement is twice the stiffness of N2. The arching in N3 is thus relativelyhigher in comparison to N2. Furthermore, the type of GR used in N2 and N3 isdifferent to that used in K2 and K3 (see Table 2.1). Figure 2.19 also shows that
20%
30%
40%
50%
60%
70%
80%
0
2
4
6
8
10
12
14
16
18
20
-5 0 5 10 15 20
N2:
Aan
dN
3:A
bl-B
tl(%
).
N2:
Aan
dN
3:A
bl-B
tl(k
N/p
ile)
.
net load Wn (kN/pile)
N2(kN/pile)
N3(kN/pile)
N2 (%)
N3 (%)
0
5
10
15
20
25
30
35
40
45
50
-5 5 15 25
settl
emen
tGR
z2(m
m)
.
net load Wn (kN/pile)
K2 z2
K3 z2bl
K3 z5tl
top
load
step
cons
olid
atio
n.
cons
olid
atio
n.to
plo
adst
ep
cons
olid
..
cons
olid
atio
n.
top
load
step
cons
olid
atio
n.
top
load
step
0
5
10
15
20
25
30
35
40
45
50
0 5 10 15
settl
emen
tGR
z2(m
m)
load part Bbl+Btl (kN/pile)
J2%=2090; N3
J2%=2269; K3
Figure 2.20 Comparison of single-layeredtest (K2) and double-layered test (K3);measured vertical deflection of the bottomgrid layer (z2) and top grid layer (z5).
Figure 2.21 Measured dependency of theGR stiffness in double-layered tests,compare with Figure 2.15.
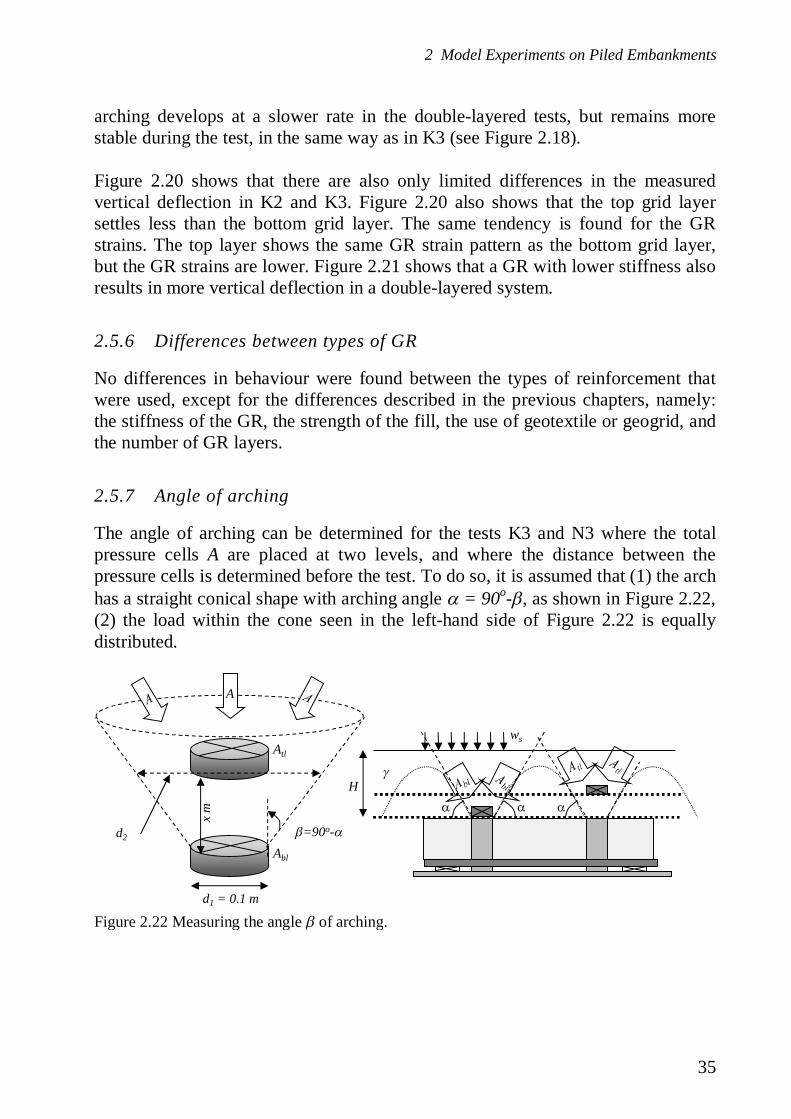
2 Model Experiments on Piled Embankments
35
arching develops at a slower rate in the double-layered tests, but remains morestable during the test, in the same way as in K3 (see Figure 2.18).
Figure 2.20 shows that there are also only limited differences in the measuredvertical deflection in K2 and K3. Figure 2.20 also shows that the top grid layersettles less than the bottom grid layer. The same tendency is found for the GRstrains. The top layer shows the same GR strain pattern as the bottom grid layer,but the GR strains are lower. Figure 2.21 shows that a GR with lower stiffness alsoresults in more vertical deflection in a double-layered system.
2.5.6 Differences between types of GR
No differences in behaviour were found between the types of reinforcement thatwere used, except for the differences described in the previous chapters, namely:the stiffness of the GR, the strength of the fill, the use of geotextile or geogrid, andthe number of GR layers.
2.5.7 Angle of arching
The angle of arching can be determined for the tests K3 and N3 where the totalpressure cells A are placed at two levels, and where the distance between thepressure cells is determined before the test. To do so, it is assumed that (1) the archhas a straight conical shape with arching angle = 90o- , as shown in Figure 2.22,(2) the load within the cone seen in the left-hand side of Figure 2.22 is equallydistributed.
d1 = 0.1 m
xm
A
Atl
Abl
d2 =90o-
ws
H
Figure 2.22 Measuring the angle of arching.
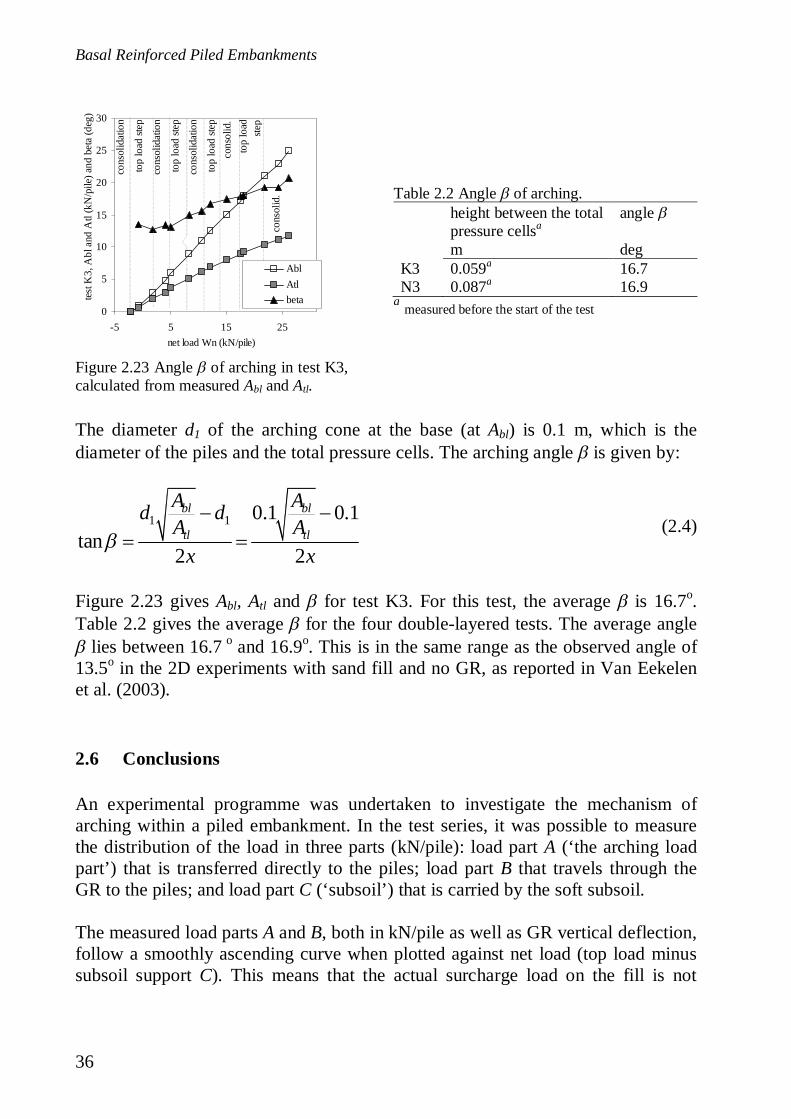
Basal Reinforced Piled Embankments
36
Figure 2.23 Angle of arching in test K3,calculated from measured Abl and Atl.
Table 2.2 Angle of arching.height between the totalpressure cellsa
angle
m degK3 0.059a 16.7N3 0.087a 16.9
a measured before the start of the test
The diameter d1 of the arching cone at the base (at Abl) is 0.1 m, which is thediameter of the piles and the total pressure cells. The arching angle is given by:
1 1 0.1 0.1tan
2 2
bl bl
tl tl
A Ad dA A
x x(2.4)
Figure 2.23 gives Abl, Atl and for test K3. For this test, the average is 16.7o.Table 2.2 gives the average for the four double-layered tests. The average angle
lies between 16.7 o and 16.9o. This is in the same range as the observed angle of13.5o in the 2D experiments with sand fill and no GR, as reported in Van Eekelenet al. (2003).
2.6 Conclusions
An experimental programme was undertaken to investigate the mechanism ofarching within a piled embankment. In the test series, it was possible to measurethe distribution of the load in three parts (kN/pile): load part A (‘the arching loadpart’) that is transferred directly to the piles; load part B that travels through theGR to the piles; and load part C (‘subsoil’) that is carried by the soft subsoil.
The measured load parts A and B, both in kN/pile as well as GR vertical deflection,follow a smoothly ascending curve when plotted against net load (top load minussubsoil support C). This means that the actual surcharge load on the fill is not
0
5
10
15
20
25
30
-5 5 15 25net load Wn (kN/pile)
test
K3,
Abl
and
Atl
(kN
/pile
)and
beta
(deg
).
AblAtlbeta
cons
olid
atio
n.
cons
olid
..
cons
olid
atio
n.
cons
olid
atio
n.
top
load
step
top
load
step
top
load
step
cons
olid
..
top
load
step
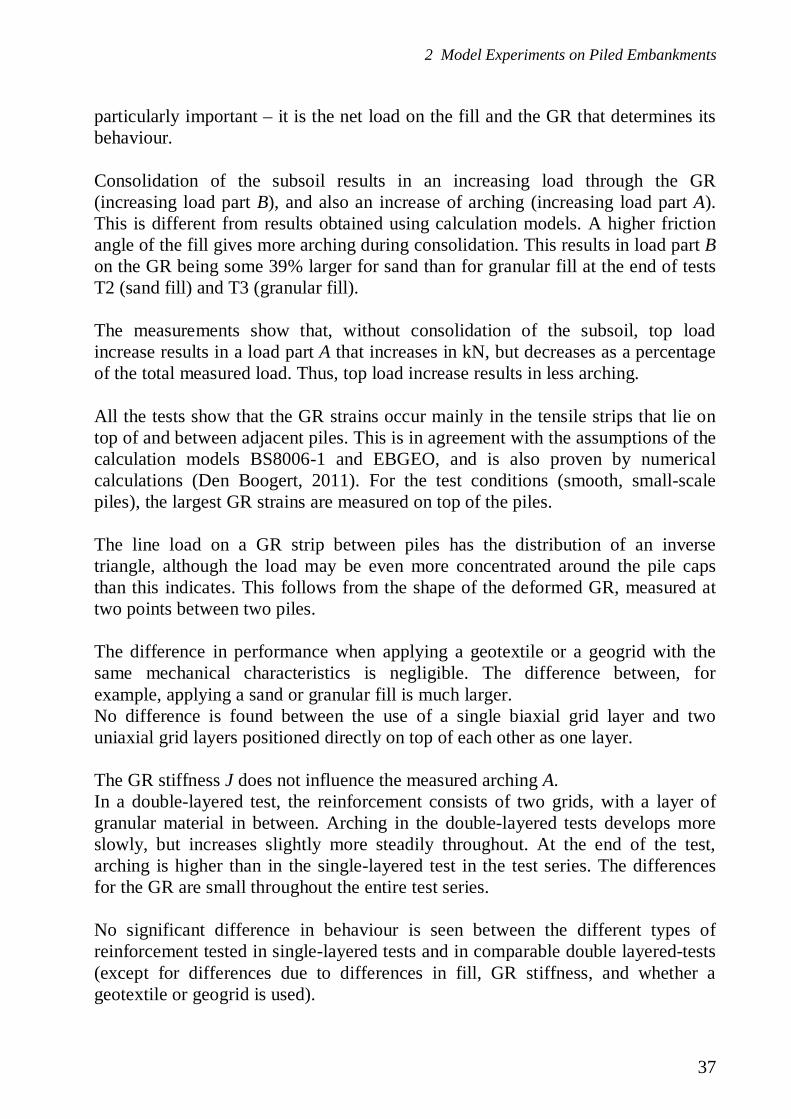
2 Model Experiments on Piled Embankments
37
particularly important – it is the net load on the fill and the GR that determines itsbehaviour.
Consolidation of the subsoil results in an increasing load through the GR(increasing load part B), and also an increase of arching (increasing load part A).This is different from results obtained using calculation models. A higher frictionangle of the fill gives more arching during consolidation. This results in load part Bon the GR being some 39% larger for sand than for granular fill at the end of testsT2 (sand fill) and T3 (granular fill).
The measurements show that, without consolidation of the subsoil, top loadincrease results in a load part A that increases in kN, but decreases as a percentageof the total measured load. Thus, top load increase results in less arching.
All the tests show that the GR strains occur mainly in the tensile strips that lie ontop of and between adjacent piles. This is in agreement with the assumptions of thecalculation models BS8006-1 and EBGEO, and is also proven by numericalcalculations (Den Boogert, 2011). For the test conditions (smooth, small-scalepiles), the largest GR strains are measured on top of the piles.
The line load on a GR strip between piles has the distribution of an inversetriangle, although the load may be even more concentrated around the pile capsthan this indicates. This follows from the shape of the deformed GR, measured attwo points between two piles.
The difference in performance when applying a geotextile or a geogrid with thesame mechanical characteristics is negligible. The difference between, forexample, applying a sand or granular fill is much larger.No difference is found between the use of a single biaxial grid layer and twouniaxial grid layers positioned directly on top of each other as one layer.
The GR stiffness J does not influence the measured arching A.In a double-layered test, the reinforcement consists of two grids, with a layer ofgranular material in between. Arching in the double-layered tests develops moreslowly, but increases slightly more steadily throughout. At the end of the test,arching is higher than in the single-layered test in the test series. The differencesfor the GR are small throughout the entire test series.
No significant difference in behaviour is seen between the different types ofreinforcement tested in single-layered tests and in comparable double layered-tests(except for differences due to differences in fill, GR stiffness, and whether ageotextile or geogrid is used).

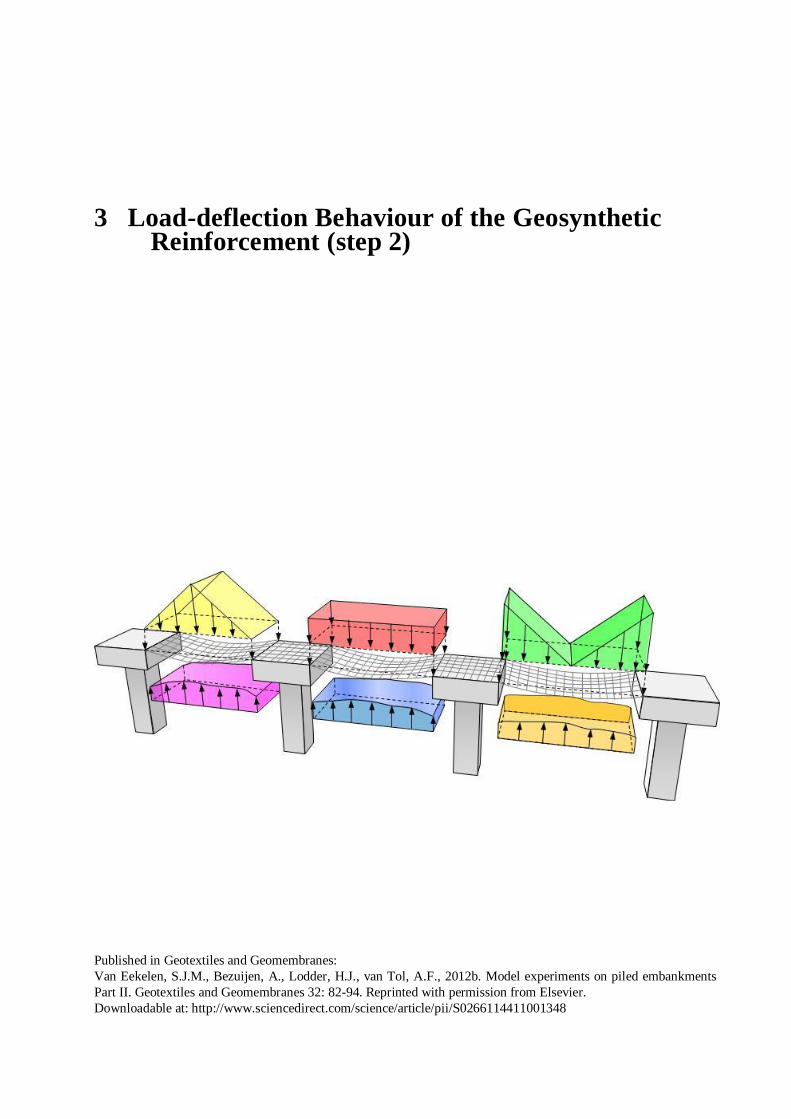
3 Load-deflection Behaviour of the GeosyntheticReinforcement (step 2)
Published in Geotextiles and Geomembranes:Van Eekelen, S.J.M., Bezuijen, A., Lodder, H.J., van Tol, A.F., 2012b. Model experiments on piled embankmentsPart II. Geotextiles and Geomembranes 32: 82-94. Reprinted with permission from Elsevier.Downloadable at: http://www.sciencedirect.com/science/article/pii/S0266114411001348

Basal Reinforced Piled Embankments
40
Abstract
This two-part study concerns a series of twelve 3D laboratory model tests on piledembankments. In the first part (Chapter 2), the measured load distribution,deformation, and strains were presented and analysed. In this second part, themeasurements are compared with calculations made using the EBGEO (2010) andCUR (2010) analytical model, hereafter called ‘EBGEO’. Possible improvementsto the analytical model are also suggested, and the resultant calculations arecompared with the measurement results.
EBGEO calculations consist of two steps: (step 1) load distribution in the fill i.e.arching behaviour, and (step 2) the load-deflection behaviour of the geosyntheticreinforcement (GR). For the test conditions (static load, laboratory scale), it wasfound that the GR strains calculated using EBGEO are larger than the measuredGR strains (approximately a factor of two for GR strains larger than 1%).The EBGEO calculations are therefore too conservative. The following reasonswere found. In step 1, the response of arching to subsoil consolidation in theexperiments is different from that assumed in EBGEO. In step 2, the distribution ofloading on the ‘GR strips’ lying between adjacent piles is quite different from thatassumed by EBGEO, and EBGEO only takes part of the subsoil support intoaccount. Modifications are suggested for the second calculation step. It is shownthat this modified step 2 model results in significantly closer agreement with thetest measurements.
3.1 Introduction
The first part (Van Eekelen et al., 2012a, Chapter 2 of this thesis) of this two-partstudy presented and analysed the measured load distribution, deformation, andstrains in a series of 12 model laboratory model tests on piled embankments. Inthis second part of the study, the measurements are compared with calculationsusing EBGEO (2010). EBGEO (2010) as well as CUR 226 (2010) adopted theanalytical model of Zaeske (2001), hereafter called ‘EBGEO’. The EBGEO modeldescribes (step 1) the arching behaviour in the fill and (step 2) the load-deflectionbehaviour of the geosynthetic reinforcement (GR), see Figure 3.1. These two stepswill be summarised and compared with the test measurements, and modificationsfor step 2 are suggested.
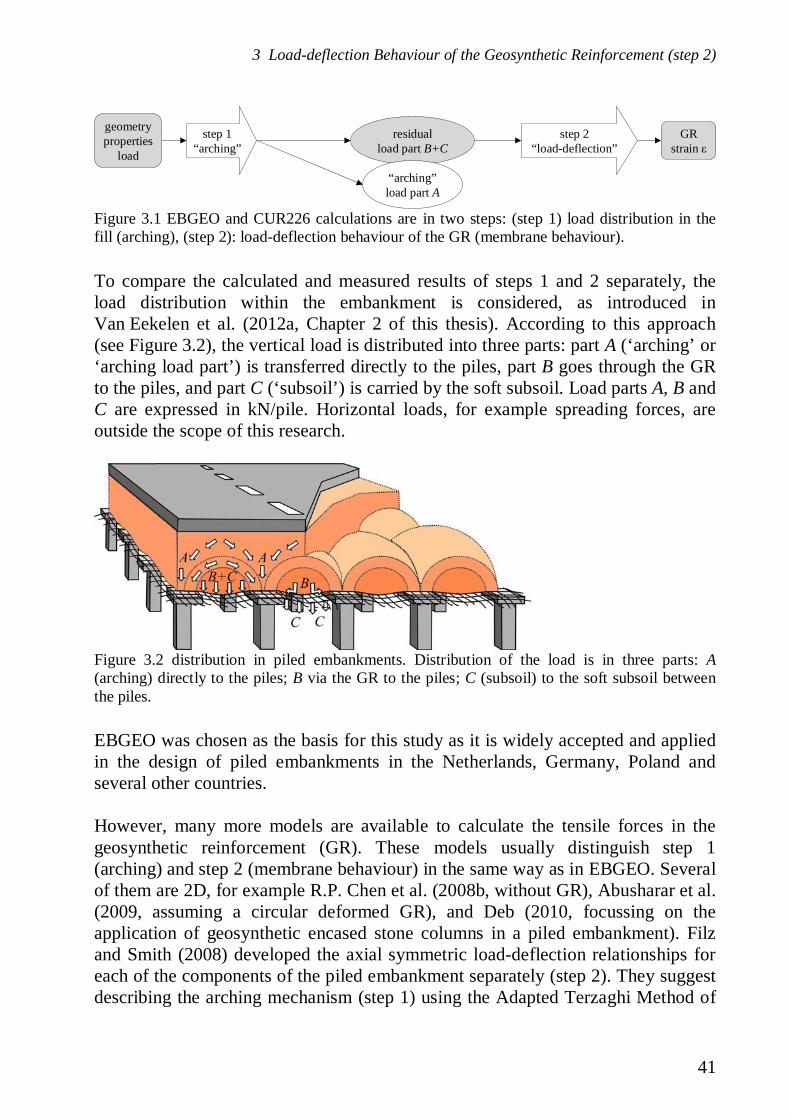
3 Load-deflection Behaviour of the Geosynthetic Reinforcement (step 2)
41
Figure 3.1 EBGEO and CUR226 calculations are in two steps: (step 1) load distribution in thefill (arching), (step 2): load-deflection behaviour of the GR (membrane behaviour).
To compare the calculated and measured results of steps 1 and 2 separately, theload distribution within the embankment is considered, as introduced inVan Eekelen et al. (2012a, Chapter 2 of this thesis). According to this approach(see Figure 3.2), the vertical load is distributed into three parts: part A (‘arching’ or‘arching load part’) is transferred directly to the piles, part B goes through the GRto the piles, and part C (‘subsoil’) is carried by the soft subsoil. Load parts A, B andC are expressed in kN/pile. Horizontal loads, for example spreading forces, areoutside the scope of this research.
EBGEO was chosen as the basis for this study as it is widely accepted and appliedin the design of piled embankments in the Netherlands, Germany, Poland andseveral other countries.
However, many more models are available to calculate the tensile forces in thegeosynthetic reinforcement (GR). These models usually distinguish step 1(arching) and step 2 (membrane behaviour) in the same way as in EBGEO. Severalof them are 2D, for example R.P. Chen et al. (2008b, without GR), Abusharar et al.(2009, assuming a circular deformed GR), and Deb (2010, focussing on theapplication of geosynthetic encased stone columns in a piled embankment). Filzand Smith (2008) developed the axial symmetric load-deflection relationships foreach of the components of the piled embankment separately (step 2). They suggestdescribing the arching mechanism (step 1) using the Adapted Terzaghi Method of
geometryproperties
load
GRstrain
step 1“arching”
residualload part B+C
step 2“load-deflection”
“arching”load part A
Figure 3.2 distribution in piled embankments. Distribution of the load is in three parts: A(arching) directly to the piles; B via the GR to the piles; C (subsoil) to the soft subsoil betweenthe piles.
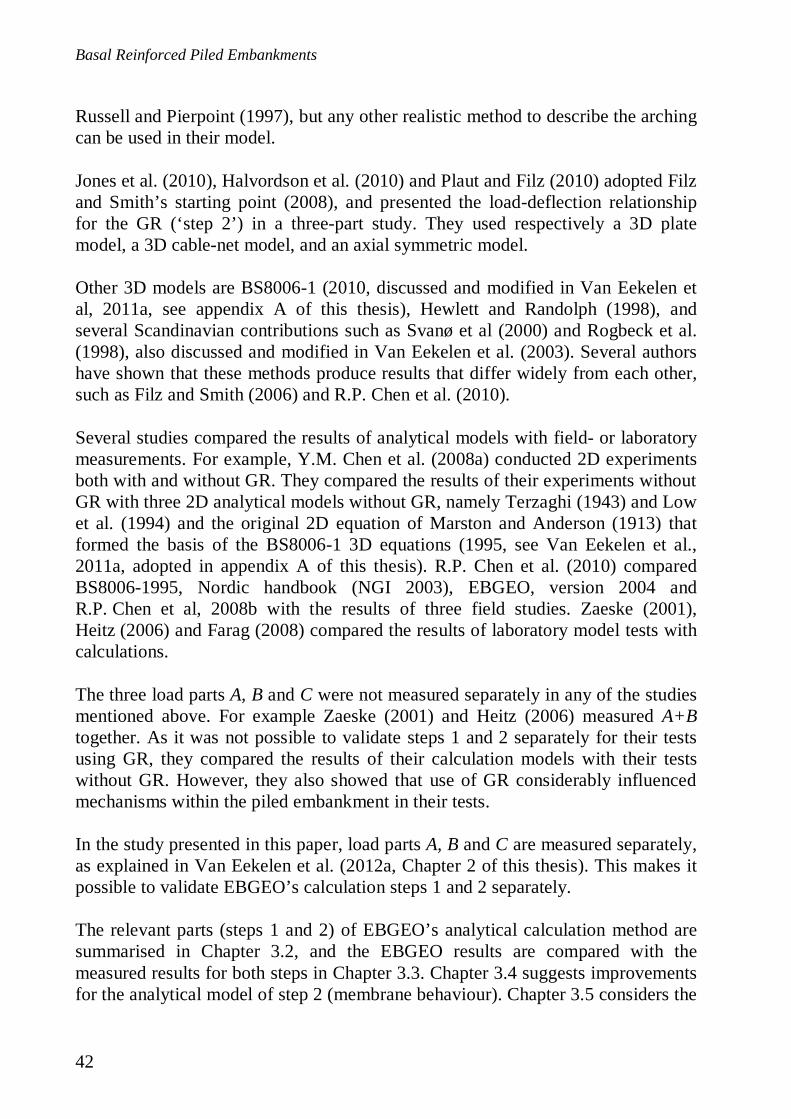
Basal Reinforced Piled Embankments
42
Russell and Pierpoint (1997), but any other realistic method to describe the archingcan be used in their model.
Jones et al. (2010), Halvordson et al. (2010) and Plaut and Filz (2010) adopted Filzand Smith’s starting point (2008), and presented the load-deflection relationshipfor the GR (‘step 2’) in a three-part study. They used respectively a 3D platemodel, a 3D cable-net model, and an axial symmetric model.
Other 3D models are BS8006-1 (2010, discussed and modified in Van Eekelen etal, 2011a, see appendix A of this thesis), Hewlett and Randolph (1998), andseveral Scandinavian contributions such as Svanø et al (2000) and Rogbeck et al.(1998), also discussed and modified in Van Eekelen et al. (2003). Several authorshave shown that these methods produce results that differ widely from each other,such as Filz and Smith (2006) and R.P. Chen et al. (2010).
Several studies compared the results of analytical models with field- or laboratorymeasurements. For example, Y.M. Chen et al. (2008a) conducted 2D experimentsboth with and without GR. They compared the results of their experiments withoutGR with three 2D analytical models without GR, namely Terzaghi (1943) and Lowet al. (1994) and the original 2D equation of Marston and Anderson (1913) thatformed the basis of the BS8006-1 3D equations (1995, see Van Eekelen et al.,2011a, adopted in appendix A of this thesis). R.P. Chen et al. (2010) comparedBS8006-1995, Nordic handbook (NGI 2003), EBGEO, version 2004 andR.P. Chen et al, 2008b with the results of three field studies. Zaeske (2001),Heitz (2006) and Farag (2008) compared the results of laboratory model tests withcalculations.
The three load parts A, B and C were not measured separately in any of the studiesmentioned above. For example Zaeske (2001) and Heitz (2006) measured A+Btogether. As it was not possible to validate steps 1 and 2 separately for their testsusing GR, they compared the results of their calculation models with their testswithout GR. However, they also showed that use of GR considerably influencedmechanisms within the piled embankment in their tests.
In the study presented in this paper, load parts A, B and C are measured separately,as explained in Van Eekelen et al. (2012a, Chapter 2 of this thesis). This makes itpossible to validate EBGEO’s calculation steps 1 and 2 separately.
The relevant parts (steps 1 and 2) of EBGEO’s analytical calculation method aresummarised in Chapter 3.2, and the EBGEO results are compared with themeasured results for both steps in Chapter 3.3. Chapter 3.4 suggests improvementsfor the analytical model of step 2 (membrane behaviour). Chapter 3.5 considers the

3 Load-deflection Behaviour of the Geosynthetic Reinforcement (step 2)
43
influence of the fill’s friction angle, the GR stiffness, and the application of one ortwo GR layers in both the measurements and the calculations (Chapter 3.5). In thislast chapter, the modifications suggested for step 2 are applied.
3.2 EBGEO: the two calculation steps
Both the German EBGEO (2010) and the Dutch CUR 226 (2010) adopted themodel developed by Zaeske (2001), hereafter called ‘EBGEO’. EBGEO uses twocalculation steps (see Figure 3.1): (step 1) arching and (step 2) the load-deflectionbehaviour of the GR, or the ‘membrane step’.
3.2.1 Calculation step 1: arching
For this ‘arching step’, Zaeske used a 3D-arching model to divide the total loadinto two parts: (1) part A and (2) part B+C:
; ; ;i
p v p p s v r v rp
AA A A h wA
(3.1)
;
21 2
21 2 2
1 1 24
r v r
g
sr g
g g
B C A
h hwA hh h h
(3.2)
where:
2 'tan 452
ocritK
2
1critd Ks2
1 81 ds
2 2
2 222
s d s ds
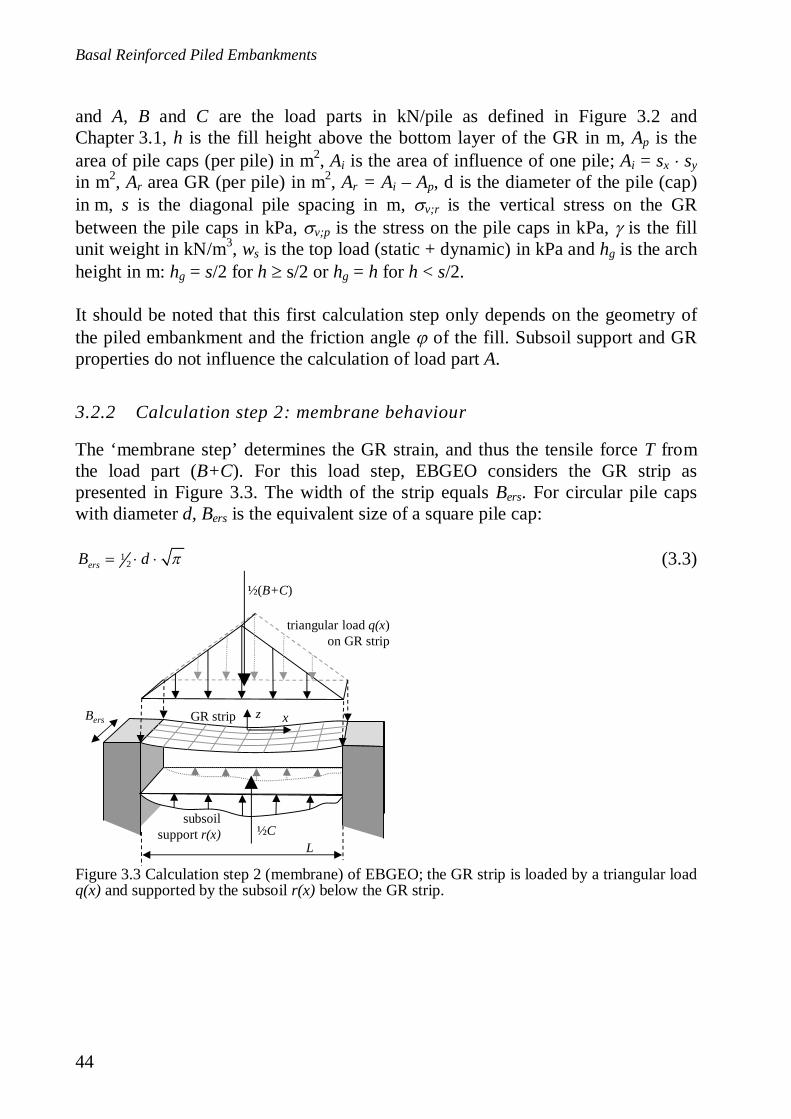
Basal Reinforced Piled Embankments
44
and A, B and C are the load parts in kN/pile as defined in Figure 3.2 andChapter 3.1, h is the fill height above the bottom layer of the GR in m, Ap is thearea of pile caps (per pile) in m2, Ai is the area of influence of one pile; Ai = sx syin m2, Ar area GR (per pile) in m2, Ar = Ai – Ap, d is the diameter of the pile (cap)in m, s is the diagonal pile spacing in m, v;r is the vertical stress on the GRbetween the pile caps in kPa, v;p is the stress on the pile caps in kPa, is the fillunit weight in kN/m3, ws is the top load (static + dynamic) in kPa and hg is the archheight in m: hg = s/2 for h s/2 or hg = h for h < s/2.
It should be noted that this first calculation step only depends on the geometry ofthe piled embankment and the friction angle of the fill. Subsoil support and GRproperties do not influence the calculation of load part A.
3.2.2 Calculation step 2: membrane behaviour
The ‘membrane step’ determines the GR strain, and thus the tensile force T fromthe load part (B+C). For this load step, EBGEO considers the GR strip aspresented in Figure 3.3. The width of the strip equals Bers. For circular pile capswith diameter d, Bers is the equivalent size of a square pile cap:
12ersB d (3.3)
Figure 3.3 Calculation step 2 (membrane) of EBGEO; the GR strip is loaded by a triangular loadq(x) and supported by the subsoil r(x) below the GR strip.
Bers
triangular load q(x)on GR strip
L
xz
½(B+C)
GR strip
½Csubsoil
support r(x)

3 Load-deflection Behaviour of the Geosynthetic Reinforcement (step 2)
45
The length of the GR strip equals Lx,y = sx,y – Bers. The GR strip is loaded by atriangular load q(x) in kPa (see Figure 3.3), with (assuming that sx=sy) 5:
12( ) ( )s averageA q x B C (3.4)
where As = Lx,y Bers is the area of GR strip. The strip is supported by the subsoilbelow the GR strip. The subsoil is modelled as an elastic spring with a constantmodulus of subgrade reaction ks in kN/m3. The subsoil support results in an‘upward load’ r(x) in kPa:
r x K z x (3.5)
with z(x) the vertical deflection of the GR strip. In this paper, the calculation valuefor the subgrade reaction K is introduced. In accordance with EBGEO, it followsthat K = ks. K is considered more specifically in Chapter 4.1. The GR verticaldeflection due to the loading situation, illustrated in Figure 3.3, can be describedwith the following differential equation (see appendix 3.B):
2
2( ) ( ) ( ) ( )
H H
d z q x r x q x K z xdx T T (3.6)
where TH is the horizontal component of the tensile force in the GR (kN/m) andq(x) is the triangular load given in Figure 3.3 in kPa.
Zaeske (2010) solved this differential equation and presented the results in thegraph shown in Figure 3.4. It should be noted that the vertical axis shows theaverage GR strain, and not the maximum GR strain. This is a misprint in EBGEO,as shown by Lodder (2010). Heitz (2006) expresses this graph in several high orderpolynomial equations. The calculation factors F1 and F2 in Figure 3.4 are definedas follows (assuming sx = sy):
212 ,
1 2
/EBGEO: x yers K LB C B
F FJ J
(3.7)
where J is the stiffness of the GR (usually determined from the isochronic curvesof the specific GR), and L the distance between the piles, as indicated inFigure 3.3.
5 EBGEO distributes B+C to the GR strips in the x- and y-directions relative to the diamond areas in equation (5.8).If sx = sy, equation (3.4) is true and gives the same result as equation (5.9) for the CA model presented in Chapters 4and 5. If sx sy, the EBGEO load on the GR strips in the x- and y-directions differ slightly. The differences are muchsmaller than in the case of the CA model (equation (5.9)).

Basal Reinforced Piled Embankments
46
Finally, the tensile force T is determined as follows:
T J (3.8)
Figure 3.4 Design graph of EBGEO; average GR strain between the pile caps. Source: EBGEO(2010), graph 9.16a.
a This graph is identical to that in EBGEO, except that the text along the vertical axis differs:EBGEO names the given GR strain as the maximum GR strain, Lodder (2010) showed thatthis must be the average strain.
3.3 Comparison of EBGEO and measurements
Appendix 3.A describes how the input and output parameters of the calculationsfrom the tests were determined.Table 3.2 and Table 3.3 (page 57) give the resulting input properties for thecalculations of test K2.
3.3.1 Calculation step 1: arching
EBGEO’s step 1 divides the load into two parts: A and B+C. Figure 3.5 shows themeasured and calculated value for A (left) and B+C (right) for the typical test K2(see van Eekelen et al., 2012a, Chapter 2 of this thesis). The figure shows that theA parameter from the EBGEO calculation is lower, and that EBGEO’s B+C valueis higher. Use of EBGEO in a design is therefore on the ‘safe’ side. Thisobservation is confirmed by field measurements along the Kyoto Road (VanEekelen et al., 2010a), the N210 in the Netherlands (Haring et al., 2008), the
10.0
5.0
4.0
3.5
3.0
2.5
2.0 = F21.50.6 0.8 1.00.0 0.2 0.46.0
5.5
5.0
4.5
4.0
3.5
3.0
2.5
2.0
1.5
1.0
0.5
0.0
aver
age
(%)
0.00 0.05 0.10 0.15 0.20 0.25=F1
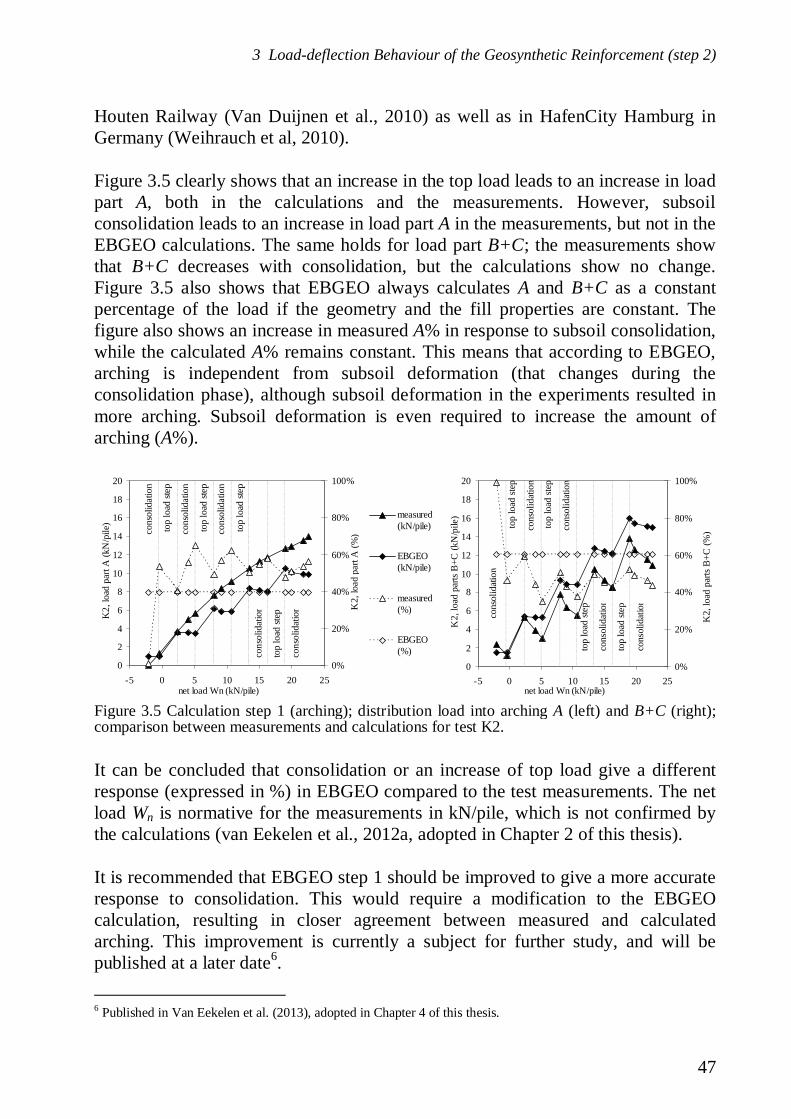
3 Load-deflection Behaviour of the Geosynthetic Reinforcement (step 2)
47
Houten Railway (Van Duijnen et al., 2010) as well as in HafenCity Hamburg inGermany (Weihrauch et al, 2010).
Figure 3.5 clearly shows that an increase in the top load leads to an increase in loadpart A, both in the calculations and the measurements. However, subsoilconsolidation leads to an increase in load part A in the measurements, but not in theEBGEO calculations. The same holds for load part B+C; the measurements showthat B+C decreases with consolidation, but the calculations show no change.Figure 3.5 also shows that EBGEO always calculates A and B+C as a constantpercentage of the load if the geometry and the fill properties are constant. Thefigure also shows an increase in measured A% in response to subsoil consolidation,while the calculated A% remains constant. This means that according to EBGEO,arching is independent from subsoil deformation (that changes during theconsolidation phase), although subsoil deformation in the experiments resulted inmore arching. Subsoil deformation is even required to increase the amount ofarching (A%).
It can be concluded that consolidation or an increase of top load give a differentresponse (expressed in %) in EBGEO compared to the test measurements. The netload Wn is normative for the measurements in kN/pile, which is not confirmed bythe calculations (van Eekelen et al., 2012a, adopted in Chapter 2 of this thesis).
It is recommended that EBGEO step 1 should be improved to give a more accurateresponse to consolidation. This would require a modification to the EBGEOcalculation, resulting in closer agreement between measured and calculatedarching. This improvement is currently a subject for further study, and will bepublished at a later date6.
6 Published in Van Eekelen et al. (2013), adopted in Chapter 4 of this thesis.
0
2
4
6
8
10
12
14
16
18
20
-5 0 5 10 15 20 25net load Wn (kN/pile)
K2,
load
part
A(k
N/p
ile)
.
0%
20%
40%
60%
80%
100%
K2,
load
part
A(%
)
measured(kN/pile)
EBGEO(kN/pile)
measured(%)
EBGEO(%)co
nsol
idat
ion
cons
olid
atio
n.
top
load
step
top
load
step
top
load
step
cons
olid
atio
n.
cons
olid
atio
n.
cons
olid
atio
n
top
load
step
0
2
4
6
8
10
12
14
16
18
20
-5 0 5 10 15 20 25net load Wn (kN/pile)
K2,
load
parts
B+C
(kN
/pile
).
0%
20%
40%
60%
80%
100%
K2,
load
parts
B+C
(%)
cons
olid
atio
n.
top
load
step
cons
olid
atio
n
top
load
step
top
load
step
cons
olid
atio
n.
cons
olid
atio
n.
cons
olid
atio
n
top
load
step
Figure 3.5 Calculation step 1 (arching); distribution load into arching A (left) and B+C (right);comparison between measurements and calculations for test K2.

Basal Reinforced Piled Embankments
48
3.3.2 Calculation step 2: membrane behaviour
Figure 3.6 compares the results of the second calculation step with the testmeasurements. The ‘measured’ average GR strains in all strain diagrams in thispaper are calculated using the measured vertical deflection z2, using a third orderpower law function, as explained in Van Eekelen et al. (2012a, Chapter 2 of thisthesis). It should be noted that the measured B+C value in Figure 3.6 was directinput for the calculations. This makes it possible to compare the measurements andcalculation results of step 2 only. The results in this figure are presentedchronologically from left to right. It should be noted that the values for (B+C)decrease for each top load. The figure shows that the calculated GR strains foridentical B+C values are much higher than the measured GR strains.
3.3.3 Conclusions: step 1+2
It can be concluded that step 1 of the EBGEO calculations results in a value for GRload (B+C) that is higher than that shown by the model tests, mainly becausesubsoil consolidation leads to an increase in load part A in the measurements, butnot in the EBGEO calculations. In addition, step 2 of the EBGEO calculationsresults in a GR strain value that is higher than that shown by the model tests.Chapter 3.4 shows that this has two reasons: (1) the wrong EBGEO-assumption forthe load distribution on the GR, as shown in Van Eekelen et al. (2012a, Chapter 2of this thesis) and (2) EBGEO assumes that only a part of the subsoil is mobilised.Because of the over-estimation of the load on the GR in step 1, and the over-estimation of the strain in step 2, EBGEO (step 1+2) calculations give GR strain
0
1
2
3
4
5
345
K2,
aver
ages
train
s(%
).
Inpu
tcal
cula
tions
:mea
sure
dB
+C. top load
Ws = 7.6 kN/pile
0
1
2
3
4
5
567
top loadWs = 15.1 kN/pile
0
1
2
3
4
5
91011
top loadWs = 22.7kN/pile
0
1
2
3
4
5
11121314
EBGEO
measured from z2
top loadWs =30.2 kN/pile
measured B+C (kN/pile)
Figure 3.6 Calculation step 2 (membrane): GR strains are calculated from (B+C); comparisonbetween measurements and EBGEO calculations for test K2. It should be noted that B+Cdecreases during each top load. All calculations are carried out using the measured B+C value asan input parameter.
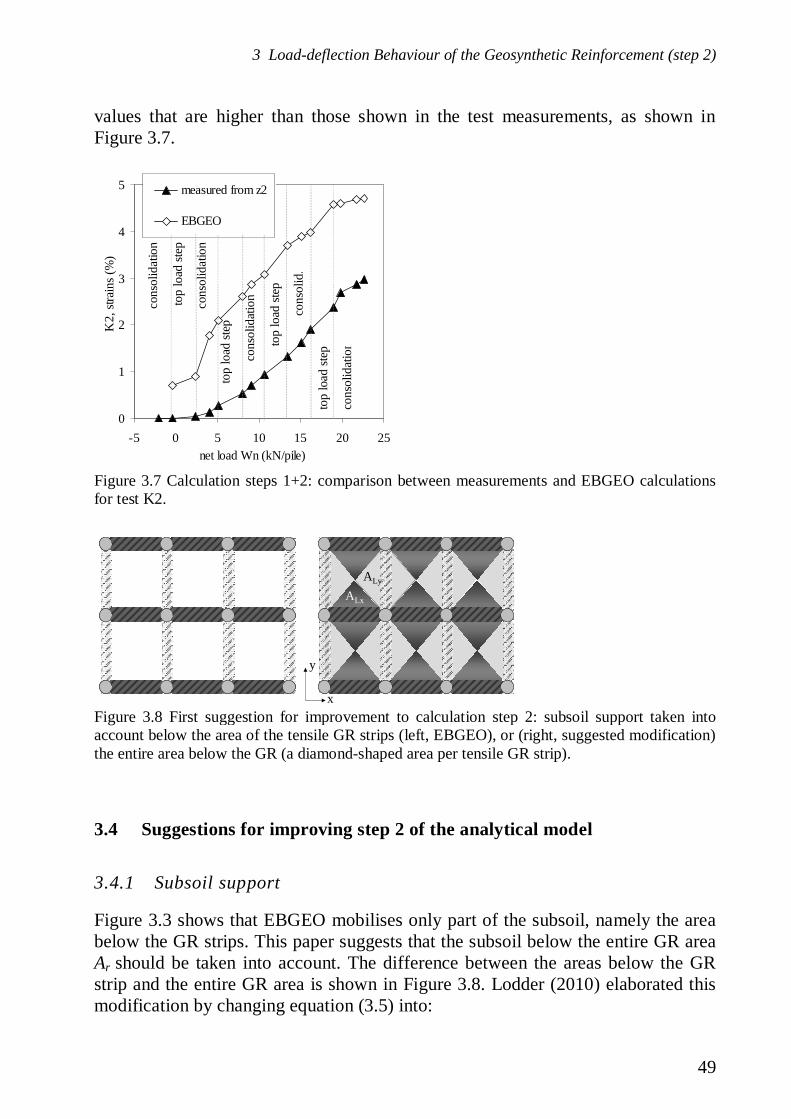
3 Load-deflection Behaviour of the Geosynthetic Reinforcement (step 2)
49
values that are higher than those shown in the test measurements, as shown inFigure 3.7.
3.4 Suggestions for improving step 2 of the analytical model
3.4.1 Subsoil support
Figure 3.3 shows that EBGEO mobilises only part of the subsoil, namely the areabelow the GR strips. This paper suggests that the subsoil below the entire GR areaAr should be taken into account. The difference between the areas below the GRstrip and the entire GR area is shown in Figure 3.8. Lodder (2010) elaborated thismodification by changing equation (3.5) into:
0
1
2
3
4
5
-5 0 5 10 15 20 25net load Wn (kN/pile)
K2,
strai
ns(%
)
measured from z2
EBGEO
cons
olid
atio
n.
top
load
step
cons
olid
.
top
load
step
top
load
step
cons
olid
atio
n.cons
olid
atio
n.
cons
olid
atio
n
top
load
step
x
y
ALy
ALx
Figure 3.7 Calculation steps 1+2: comparison between measurements and EBGEO calculationsfor test K2.
Figure 3.8 First suggestion for improvement to calculation step 2: subsoil support taken intoaccount below the area of the tensile GR strips (left, EBGEO), or (right, suggested modification)the entire area below the GR (a diamond-shaped area per tensile GR strip).
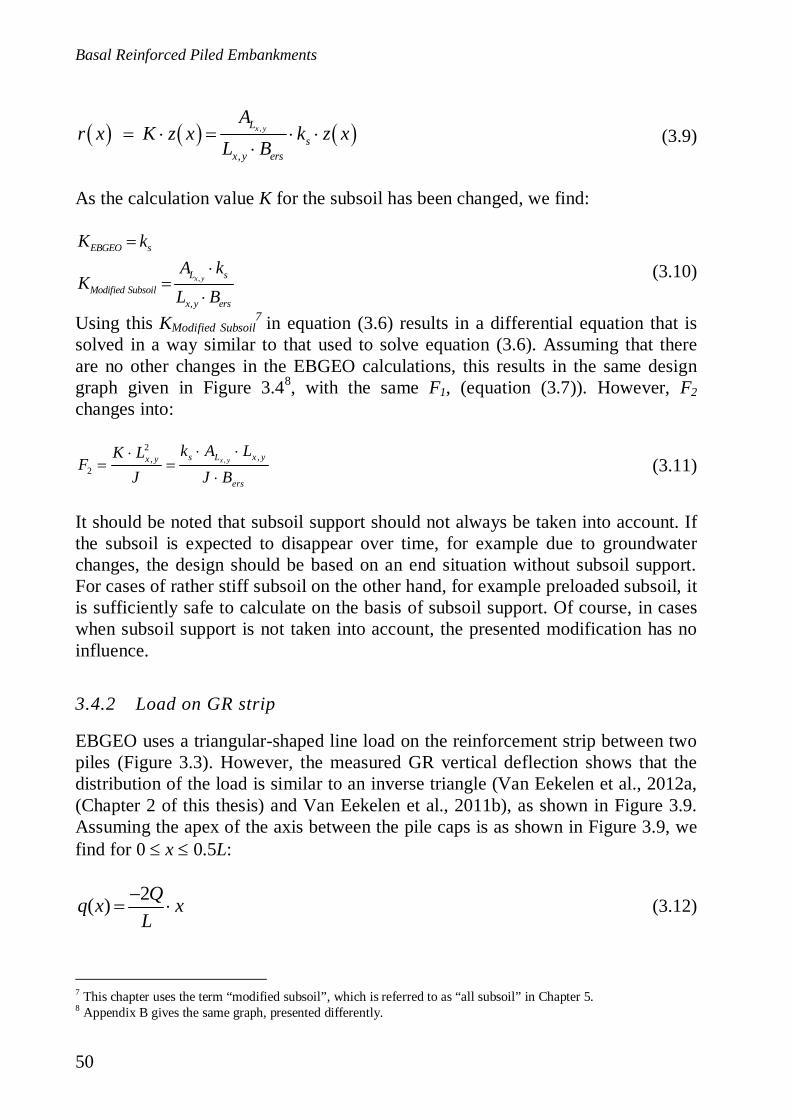
Basal Reinforced Piled Embankments
50
,
,
x yLs
x y ers
Ar x K z x k z x
L B (3.9)
As the calculation value K for the subsoil has been changed, we find:
,
,
x y
EBGEO s
L sModified Subsoil
x y ers
K kA k
KL B
(3.10)
Using this KModified Subsoil7 in equation (3.6) results in a differential equation that is
solved in a way similar to that used to solve equation (3.6). Assuming that thereare no other changes in the EBGEO calculations, this results in the same designgraph given in Figure 3.48, with the same F1, (equation (3.7)). However, F2changes into:
,
2,,
2x ys L x yx y
ers
k A LK LF
J J B(3.11)
It should be noted that subsoil support should not always be taken into account. Ifthe subsoil is expected to disappear over time, for example due to groundwaterchanges, the design should be based on an end situation without subsoil support.For cases of rather stiff subsoil on the other hand, for example preloaded subsoil, itis sufficiently safe to calculate on the basis of subsoil support. Of course, in caseswhen subsoil support is not taken into account, the presented modification has noinfluence.
3.4.2 Load on GR strip
EBGEO uses a triangular-shaped line load on the reinforcement strip between twopiles (Figure 3.3). However, the measured GR vertical deflection shows that thedistribution of the load is similar to an inverse triangle (Van Eekelen et al., 2012a,(Chapter 2 of this thesis) and Van Eekelen et al., 2011b), as shown in Figure 3.9.Assuming the apex of the axis between the pile caps is as shown in Figure 3.9, wefind for 0 x 0.5L:
2( ) Qq x xL
(3.12)
7 This chapter uses the term “modified subsoil”, which is referred to as “all subsoil” in Chapter 5.8 Appendix B gives the same graph, presented differently.
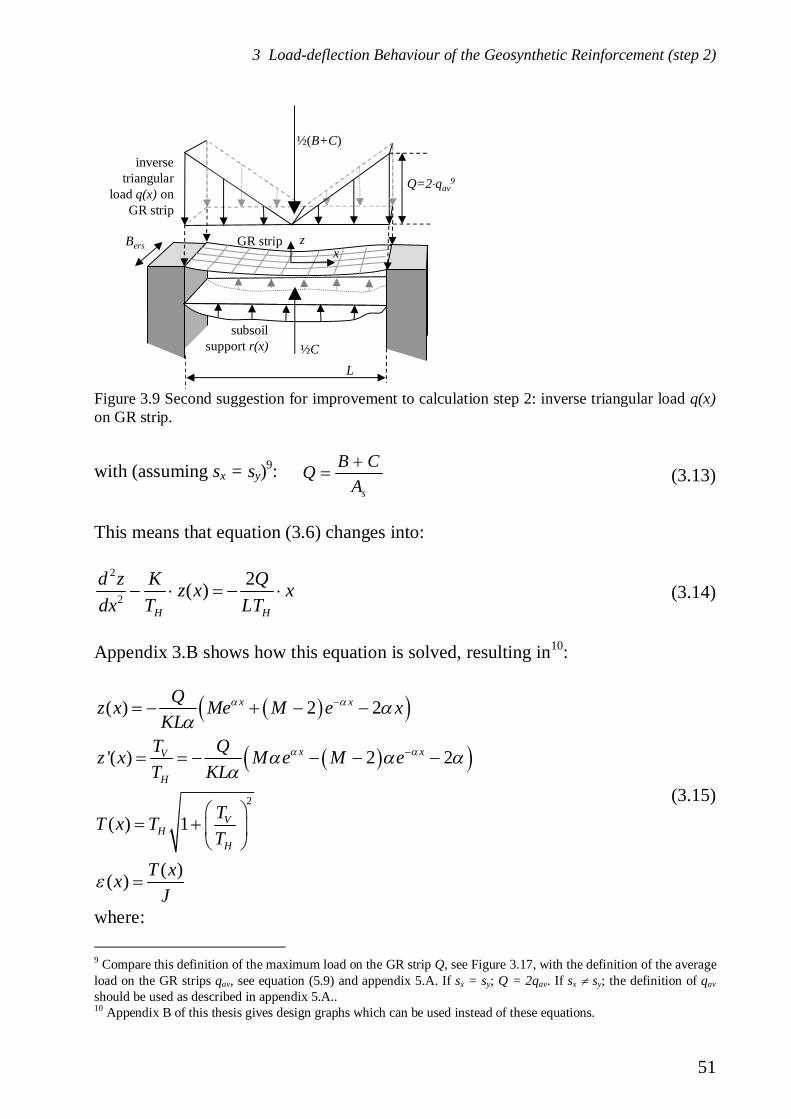
3 Load-deflection Behaviour of the Geosynthetic Reinforcement (step 2)
51
with (assuming sx = sy)9:s
B CQA (3.13)
This means that equation (3.6) changes into:
2
2
2( )H H
d z K Qz x xdx T LT
(3.14)
Appendix 3.B shows how this equation is solved, resulting in10:
2
( ) 2 2
'( ) 2 2
( ) 1
( )( )
x x
x xV
H
VH
H
Qz x Me M e xKL
T Qz x M e M eT KL
TT x TT
T xxJ
(3.15)
where:
9 Compare this definition of the maximum load on the GR strip Q, see Figure 3.17, with the definition of the averageload on the GR strips qav, see equation (5.9) and appendix 5.A. If sx = sy; Q = 2qav. If sx sy; the definition of qavshould be used as described in appendix 5.A..10 Appendix B of this thesis gives design graphs which can be used instead of these equations.
Bers
inversetriangular
load q(x) onGR strip
½(B+C)
x
z
GR strip z
subsoilsupport r(x) ½C
L
Q=2 qav9
Figure 3.9 Second suggestion for improvement to calculation step 2: inverse triangular load q(x)on GR strip.
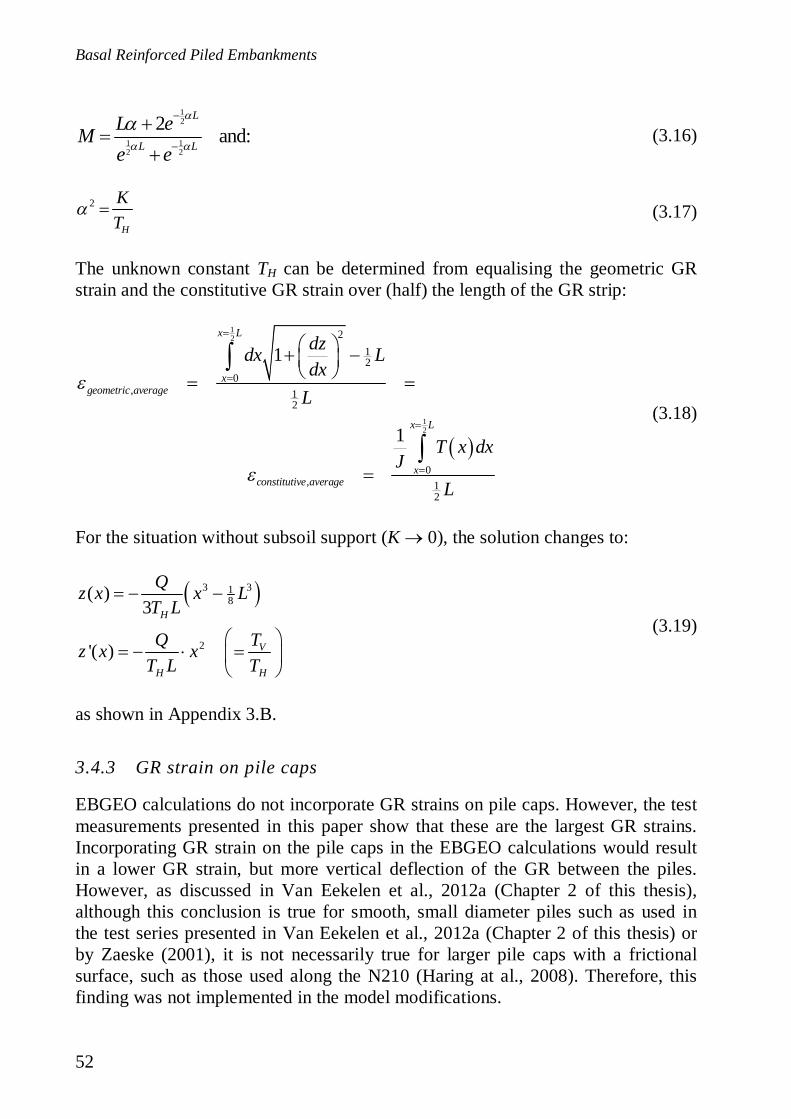
Basal Reinforced Piled Embankments
52
12
1 12 2
2 and:L
L L
L eMe e
(3.16)
2
H
KT (3.17)
The unknown constant TH can be determined from equalising the geometric GRstrain and the constitutive GR strain over (half) the length of the GR strip:
12
12
212
0, 1
2
0, 1
2
1
1
x L
xgeometric average
x L
xconstitutive average
dzdx Ldx
L
T x dxJ
L
(3.18)
For the situation without subsoil support (K 0), the solution changes to:
3 318
2
( )3
'( )
H
V
H H
Qz x x LT L
Q Tz x xT L T
(3.19)
as shown in Appendix 3.B.
3.4.3 GR strain on pile caps
EBGEO calculations do not incorporate GR strains on pile caps. However, the testmeasurements presented in this paper show that these are the largest GR strains.Incorporating GR strain on the pile caps in the EBGEO calculations would resultin a lower GR strain, but more vertical deflection of the GR between the piles.However, as discussed in Van Eekelen et al., 2012a (Chapter 2 of this thesis),although this conclusion is true for smooth, small diameter piles such as used inthe test series presented in Van Eekelen et al., 2012a (Chapter 2 of this thesis) orby Zaeske (2001), it is not necessarily true for larger pile caps with a frictionalsurface, such as those used along the N210 (Haring at al., 2008). Therefore, thisfinding was not implemented in the model modifications.
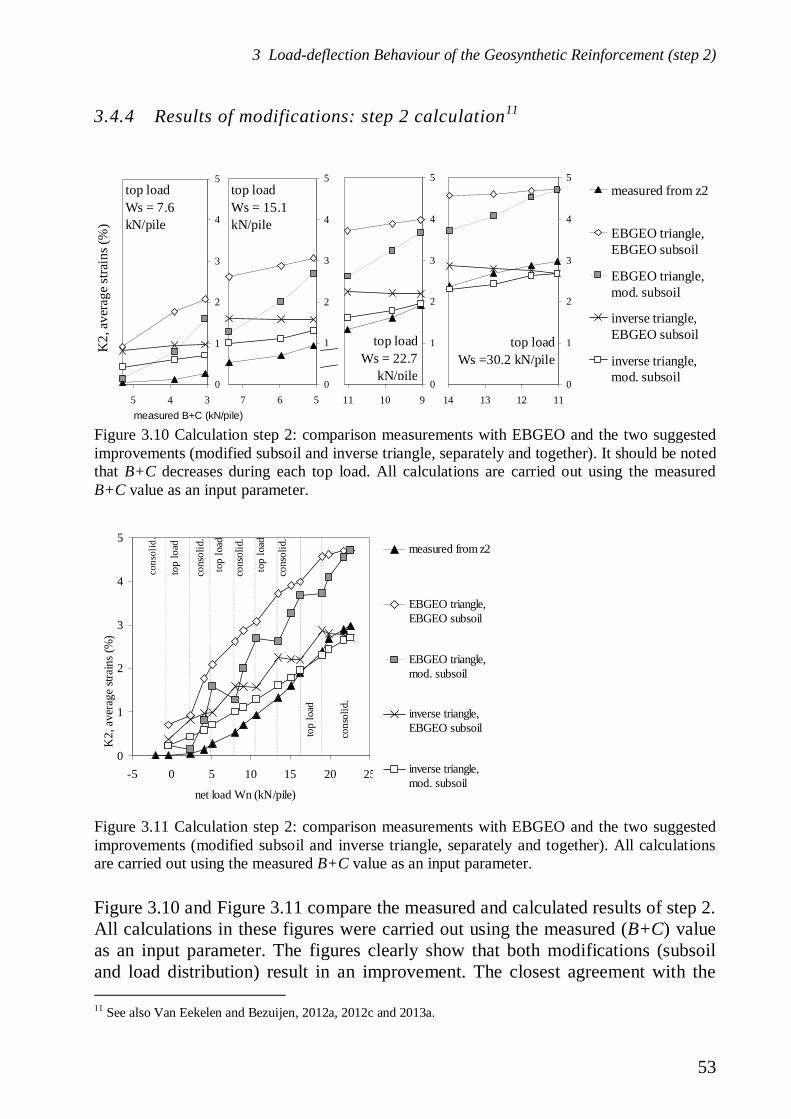
3 Load-deflection Behaviour of the Geosynthetic Reinforcement (step 2)
53
3.4.4 Results of modifications: step 2 calculation11
Figure 3.10 and Figure 3.11 compare the measured and calculated results of step 2.All calculations in these figures were carried out using the measured (B+C) valueas an input parameter. The figures clearly show that both modifications (subsoiland load distribution) result in an improvement. The closest agreement with the
11 See also Van Eekelen and Bezuijen, 2012a, 2012c and 2013a.
0
1
2
3
4
5
345
K2,
aver
ages
train
s(%
).
top loadWs = 7.6kN/pile
0
1
2
3
4
5
567
top loadWs = 15.1kN/pile
0
1
2
3
4
5
91011
top loadWs = 22.7
kN/pile0
1
2
3
4
5
11121314
top loadWs =30.2 kN/pile
0
1
2
3
4
5
3
measured from z2
EBGEO triangle,EBGEO subsoil
EBGEO triangle,mod. subsoil
inverse triangle,EBGEO subsoil
inverse triangle,mod. subsoil
measured B+C (kN/pile)
0
1
2
3
4
5
-5 0 5 10 15 20 25
net load Wn (kN/pile)
K2,
aver
age
strai
ns(%
).
cons
olid
.
top
load
cons
olid
.
top
load
top
load
cons
olid
.
cons
olid
.
cons
olid
.
top
load 0
1
2
3
4
5
3
measured from z2
EBGEO triangle,EBGEO subsoil
EBGEO triangle,mod. subsoil
inverse triangle,EBGEO subsoil
inverse triangle,mod. subsoil
Figure 3.10 Calculation step 2: comparison measurements with EBGEO and the two suggestedimprovements (modified subsoil and inverse triangle, separately and together). It should be notedthat B+C decreases during each top load. All calculations are carried out using the measuredB+C value as an input parameter.
Figure 3.11 Calculation step 2: comparison measurements with EBGEO and the two suggestedimprovements (modified subsoil and inverse triangle, separately and together). All calculationsare carried out using the measured B+C value as an input parameter.
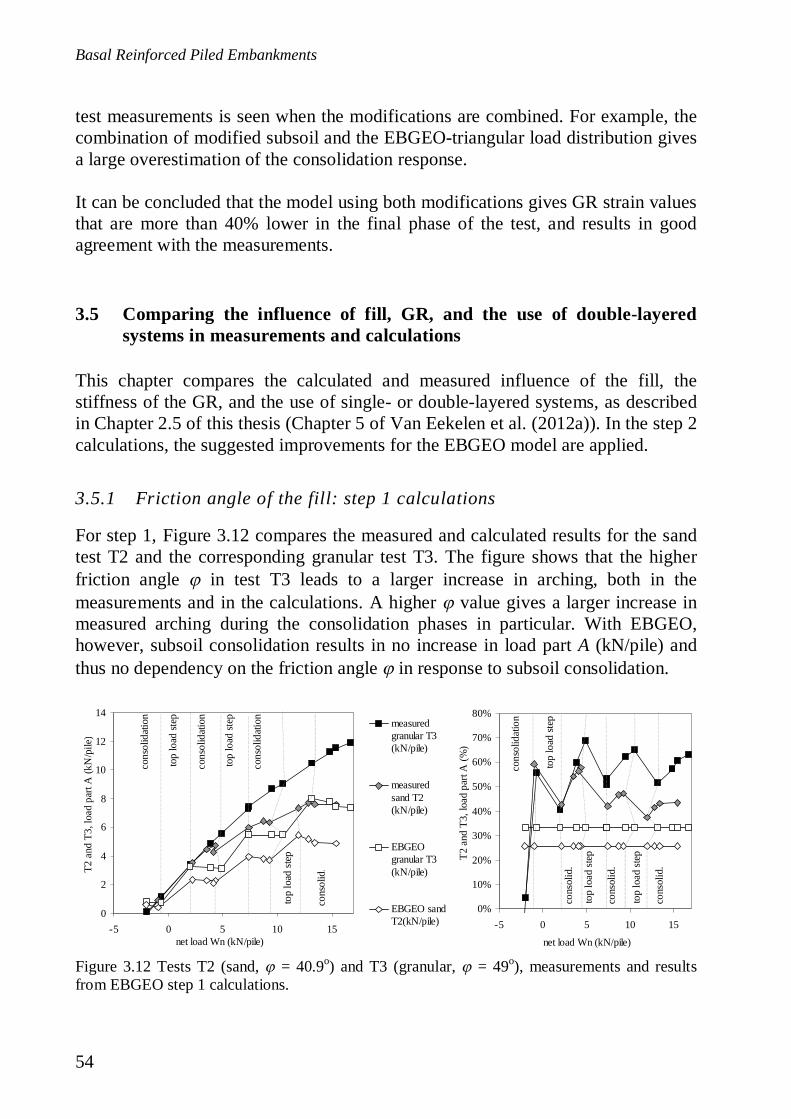
Basal Reinforced Piled Embankments
54
test measurements is seen when the modifications are combined. For example, thecombination of modified subsoil and the EBGEO-triangular load distribution givesa large overestimation of the consolidation response.
It can be concluded that the model using both modifications gives GR strain valuesthat are more than 40% lower in the final phase of the test, and results in goodagreement with the measurements.
3.5 Comparing the influence of fill, GR, and the use of double-layeredsystems in measurements and calculations
This chapter compares the calculated and measured influence of the fill, thestiffness of the GR, and the use of single- or double-layered systems, as describedin Chapter 2.5 of this thesis (Chapter 5 of Van Eekelen et al. (2012a)). In the step 2calculations, the suggested improvements for the EBGEO model are applied.
3.5.1 Friction angle of the fill: step 1 calculations
For step 1, Figure 3.12 compares the measured and calculated results for the sandtest T2 and the corresponding granular test T3. The figure shows that the higherfriction angle in test T3 leads to a larger increase in arching, both in themeasurements and in the calculations. A higher value gives a larger increase inmeasured arching during the consolidation phases in particular. With EBGEO,however, subsoil consolidation results in no increase in load part A (kN/pile) andthus no dependency on the friction angle in response to subsoil consolidation.
0
2
4
6
8
10
12
14
-5 0 5 10 15net load Wn (kN/pile)
T2an
dT3
,loa
dpa
rtA
(kN
/pile
).
measuredgranular T3(kN/pile)
measuredsand T2(kN/pile)
EBGEOgranular T3(kN/pile)
EBGEO sandT2(kN/pile)
cons
olid
atio
n.
top
load
step
top
load
step
cons
olid
atio
n.
cons
olid
atio
n.
cons
olid
.
top
load
step
0%
10%
20%
30%
40%
50%
60%
70%
80%
-5 0 5 10 15
net load Wn (kN/pile)
T2an
dT3
,loa
dpa
rtA
(%).
cons
olid
atio
n.
top
load
step
top
load
step
cons
olid
.
top
load
step
cons
olid
.
cons
olid
.
Figure 3.12 Tests T2 (sand, = 40.9o) and T3 (granular, = 49o), measurements and resultsfrom EBGEO step 1 calculations.

3 Load-deflection Behaviour of the Geosynthetic Reinforcement (step 2)
55
An increase in top load results in a decreasing value for the measured A%.EBGEO, however, always predicts a constant A%. This value is dependent on thegeometry and the , not on changes in top load or subsoil support.It can be concluded that EBGEO’s lack of response to consolidation (in step 1) isdominant, so that EBGEO considerably underestimates arching load A. Fill with alower value (sand) responds much less to consolidation than granular fill. Ittherefore seems that EBGEO predicts the behaviour of sand better than that ofgranular fill.
3.5.2 Stiffness of the GR
The GR stiffness J does not influence the arching behaviour (step 1) of the piledembankment in the measurements: virtually an identical A value is found for eachGR if other factors remain the same. The measurements (Figure 2.14) andcalculations using EBGEO (= step 1, see Chapter 3.3.1) correspond with this.
However, the GR stiffness J influences the GR strain (step 2), both in themeasurements and the calculations. Figure 3.13 shows that measured andcalculated GR strains are in the same range when they are considered as a functionof B+C (thus step 2), and that the influence of J is approximately the same in themeasurements and the calculations. Figure 3.14 shows that the tendency of themeasured and calculated GR strains is also the same when they are considered as afunction of the net load.
0
1
2
3
4
78910measured B+C (kN/pile)
stra
in(%
)
top loadWs = 22.7 kN/pile
JN2<<JT4<JK2
0
1
3
K2 measuredfrom z2
K2 inv.triangle,mod.subsoil
N2 measuredfrom z2
N2 inv.triangle,mod.subsoil
T4 measuredfrom z2
T4 inv.triangle,mod.subsoil
0
1
3
K3 measuredfrom z2
K3 inv.triangle,mod.subsoil
N3 measuredfrom z2
N3 inv.triangle,mod.subsoil
0
1
2
3
4
9101112measured B+C (kN/pile)
stra
in(%
)
top loadWs =22.7 kN/pile
JN3<JK3
Figure 3.13 The influence of GR stiffness J on average GR strain; comparison measurements andstep 2 calculations using both suggested modifications (inverse triangle and modified subsoil).Compare with Figure 3.10. Left: Tests K2, N2 and T4, all with a single GR layer and granularfill. Right: Tests N3 and K3, both with a double GR layer and granular fill.
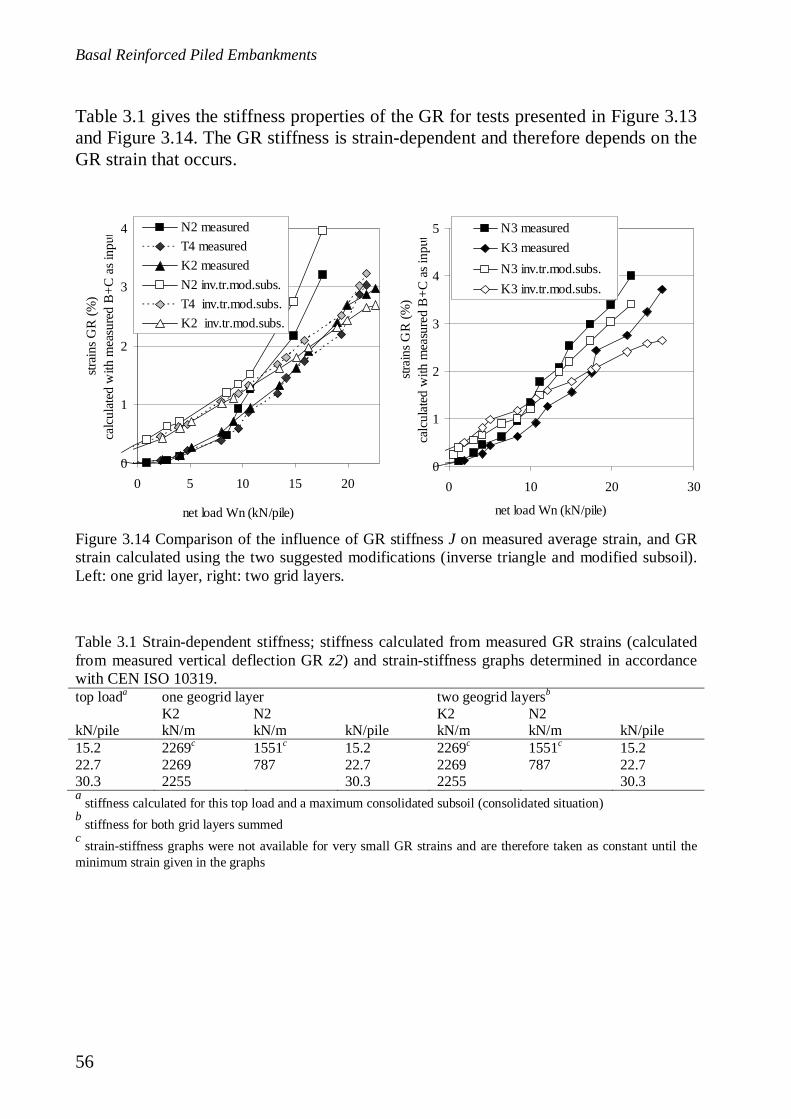
Basal Reinforced Piled Embankments
56
Table 3.1 gives the stiffness properties of the GR for tests presented in Figure 3.13and Figure 3.14. The GR stiffness is strain-dependent and therefore depends on theGR strain that occurs.
Table 3.1 Strain-dependent stiffness; stiffness calculated from measured GR strains (calculatedfrom measured vertical deflection GR z2) and strain-stiffness graphs determined in accordancewith CEN ISO 10319.top loada one geogrid layer two geogrid layersb
K2 N2 K2 N2kN/pile kN/m kN/m kN/pile kN/m kN/m kN/pile15.2 2269c 1551c 15.2 2269c 1551c 15.222.7 2269 787 22.7 2269 787 22.730.3 2255 30.3 2255 30.3a stiffness calculated for this top load and a maximum consolidated subsoil (consolidated situation)b stiffness for both grid layers summedc strain-stiffness graphs were not available for very small GR strains and are therefore taken as constant until theminimum strain given in the graphs
0
1
2
3
4
0 5 10 15 20
net load Wn (kN/pile)
strai
nsG
R(%
)ca
lcul
ated
with
mea
sure
dB
+Cas
inpu
t. N2 measuredT4 measuredK2 measuredN2 inv.tr.mod.subs.T4 inv.tr.mod.subs.K2 inv.tr.mod.subs.
0
1
2
3
4
5
0 10 20 30
net load Wn (kN/pile)
strai
nsG
R(%
)ca
lcul
ated
with
mea
sure
dB
+Cas
inpu
t.
N3 measuredK3 measuredN3 inv.tr.mod.subs.K3 inv.tr.mod.subs.
Figure 3.14 Comparison of the influence of GR stiffness J on measured average strain, and GRstrain calculated using the two suggested modifications (inverse triangle and modified subsoil).Left: one grid layer, right: two grid layers.
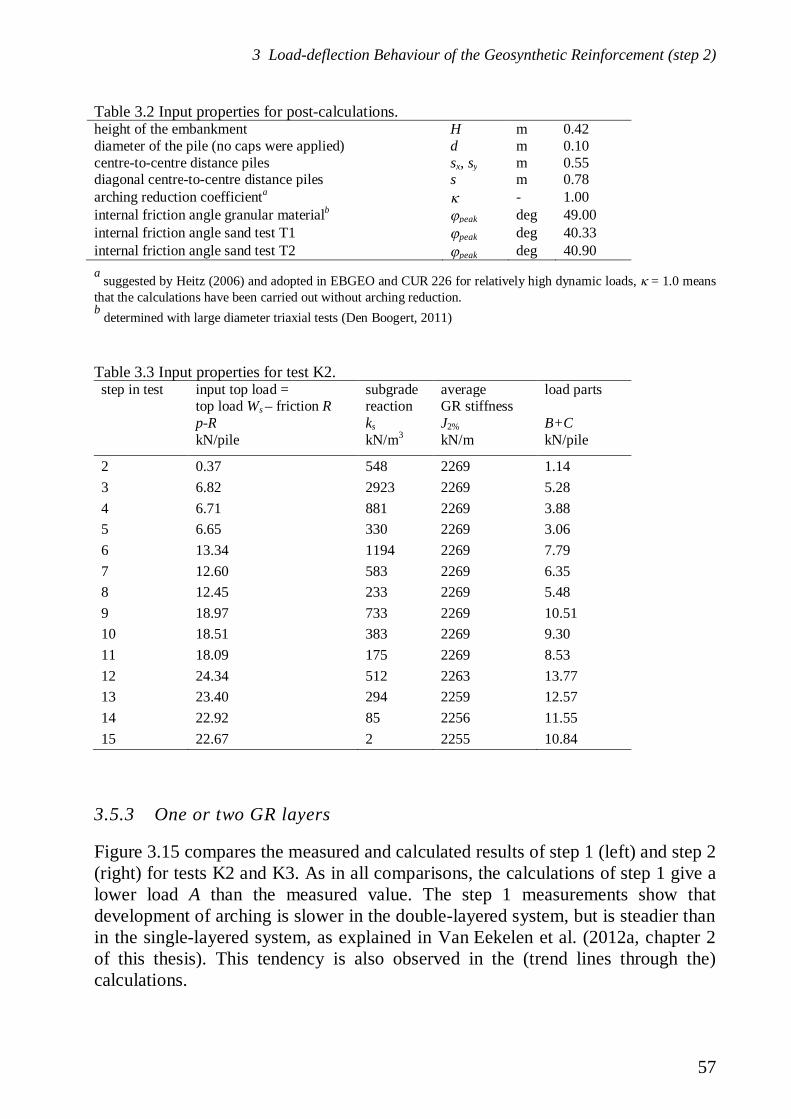
3 Load-deflection Behaviour of the Geosynthetic Reinforcement (step 2)
57
Table 3.2 Input properties for post-calculations.height of the embankment H m 0.42diameter of the pile (no caps were applied) d m 0.10centre-to-centre distance piles sx, sy m 0.55diagonal centre-to-centre distance piles s m 0.78arching reduction coefficienta - 1.00internal friction angle granular materialb
peak deg 49.00internal friction angle sand test T1 peak deg 40.33internal friction angle sand test T2 peak deg 40.90a suggested by Heitz (2006) and adopted in EBGEO and CUR 226 for relatively high dynamic loads, = 1.0 meansthat the calculations have been carried out without arching reduction.b determined with large diameter triaxial tests (Den Boogert, 2011)
Table 3.3 Input properties for test K2.step in test input top load =
top load Ws – friction Rsubgradereaction
averageGR stiffness
load parts
p-R ks J2% B+CkN/pile kN/m3 kN/m kN/pile
2 0.37 548 2269 1.143 6.82 2923 2269 5.284 6.71 881 2269 3.885 6.65 330 2269 3.066 13.34 1194 2269 7.797 12.60 583 2269 6.358 12.45 233 2269 5.489 18.97 733 2269 10.5110 18.51 383 2269 9.3011 18.09 175 2269 8.5312 24.34 512 2263 13.7713 23.40 294 2259 12.5714 22.92 85 2256 11.5515 22.67 2 2255 10.84
3.5.3 One or two GR layers
Figure 3.15 compares the measured and calculated results of step 1 (left) and step 2(right) for tests K2 and K3. As in all comparisons, the calculations of step 1 give alower load A than the measured value. The step 1 measurements show thatdevelopment of arching is slower in the double-layered system, but is steadier thanin the single-layered system, as explained in Van Eekelen et al. (2012a, chapter 2of this thesis). This tendency is also observed in the (trend lines through the)calculations.

Basal Reinforced Piled Embankments
58
For both steps 1 and 2, it can be concluded that the calculations do not match themeasurements in the single-layered systems any more closely than they matchmeasurements in the double-layered systems.
3.6 Conclusions
EBGEO consists of two calculation steps; step 1 and step 2. Step 1 calculates theloading on the piles A due to arching and consequently the resulting value B+C(load on GR and subsoil), and step 2 calculates the resulting strains in the GR. It isshown that step 1 calculates a higher B+C value (load on GR and subsoil) than themeasured value, and step 2 calculates higher GR strains than are seen in themeasurements. Any design calculations made using EBGEO are therefore on thesafe side. This over-prediction is mainly due to the following reasons:
3.6.1 Step 1
Consolidation of the subsoil results in increased measured arching in the fill.Consolidation (subsoil deformation) is in fact necessary for the developmentof arching. In addition, the measured response to consolidation depends onthe internal friction angle of the fill. If EBGEO is used, consolidation leadsto no increase in arching. This results in a value for arching load part A thatis lower than shown in the model tests, and in turn gives a calculation forload part B+C that is higher than shown in the model tests. This agrees withthe conclusion that the net load on the fill determines the behaviour of the
0
4
8
12
16
20
0 5 10 15 20 25
net load Wn (kN/pile)
resu
ltsste
p1:
arch
ing
load
part
A(k
N/p
ile)
.
0
1
2
3
4
5
0 5 10 15 20 25net load Wn (kN/pile)
aver
age
strai
n(%
).
K2 measured
K3 measured
K2 EBGEO
K3 EBGEO
K2 EBGEO step 1,modified step 2
K3 EBGEO step 1,modified step 2
K2 measured step 1,modified step 2
K3 measured step 1,modified step 2
Figure 3.15 Load distribution, comparison of reinforcement divided in one (K2) or two (K3) gridlayers, comparison of EBGEO with and without subsoil modifications and measurements. Thethick lines are second order polynomial fits through the measurements.
3 Load-deflection Behaviour of the Geosynthetic Reinforcement (step 2)
59
system. The improvement of step 1 is a subject for further study, and will bepublished in ‘Geotextiles and Geomembranes’ at a later date.
3.6.2 Step 2
EBGEO mobilises only part of the subsoil, namely the area below the GRstrips between the piles. This paper suggests how the supporting subsoil areacan be increased, and shows that this gives much better agreement with themeasurements.
The measured GR vertical deflection shows that the distribution of the lineload on the reinforcement strip between two piles tends to have thedistribution of an inverse triangle. However, EBGEO calculations are basedon a triangular-shaped line load.
EBGEO calculations do not take GR strains on the pile caps into account,although these can be the largest GR strains under specific conditions, suchas for the smooth, small-diameter pile caps in the test set-up. As this willgenerally not be the case in the field, it was decided not to modify the step 2calculations on the basis of this conclusion.
This paper presents equations for modifying step 2 by improving both the subsoilsupport and the load distribution. It has been shown that this gives more than 40%less GR strain than the EBGEO assumptions, so providing much better agreementwith the test measurements.
The influence of the GR stiffness J is comparable in the modified EBGEO step 2calculations and in the measurements. The agreement between calculated andmeasured results is neither better nor worse for single-layered systems than fordouble-layered systems.
Basal Reinforced Piled Embankments
60
Appendix 3.A Procedure for analytical calculations to compare withexperimental results
The measurements were calculated using EBGEO (2010). No safety factors wereapplied, and only vertical load was considered as no thrust forces occur within thetest box. Without safety factors, calculations in accordance with EBGEO (2010)are the same as calculations in accordance with CUR 226 (2010), as described (inEnglish) in Van Eekelen et al., (2010b).
BS8006-1 (2010) and Modified BS8006 (Van Eekelen and Bezuijen, 2008 andVan Eekelen et al., 2011a, adopted in appendix A of this thesis) do not take subsoilsupport into account, and are therefore not suitable for comparing themeasurements under consideration.
EBGEO input parameters
Table 3.2 (page 57) shows the input parameters that are identical for each test.Table 2.1 gives the unit weight of the fills.
For each equilibrium point, the following input parameters were determinedseparately.
(1) The top load ws in kPa; the friction R (kN/pile) measured in each test wassubtracted from the measured top load Ws (kN/pile) and converted to kPa by
, 4( ) /s input s fillw W R A (3.20)
(2) The GR stiffness. Each supplier determined the strain-dependent stiffnessbehaviour of their GR, in accordance with CEN ISO 10319. This value wasused to determine the stiffness for each equilibrium point from the measuredvertical deflection z2, using the following steps. (a) The average strain ofthe GR strip was determined from the measured z2, assuming a third orderpower law deformation pattern (this procedure appeared to be more reliablethan using the results of the cable measurement system, see Van Eekelen etal., 2012a) (b) The supplied stiffness behaviour graphs from the suppliers ofthe various GRs provide a stiffness value for this . Where GR strains wereless than the lowest given strain, the same stiffness was assumed as thatgiven for the smallest strain in the suppliers’ data. Therefore, the stiffness isassumed to be constant for small GR strains. The stiffness along andperpendicular to the machine direction is determined separately.

3 Load-deflection Behaviour of the Geosynthetic Reinforcement (step 2)
61
(3) The modulus of the foam’s subgrade reaction, ks, in kN/m3, while the tap isclosed in between the loading or drainage steps. The somewhat ‘artificial’modulus of subgrade reaction has been determined as follows:
sfoam
CkA z (3.21)
where z (m) is the average settlement of the foam cushion due toconsolidation (calculated from the measured volume of water drained fromthe foam cushion).
In the measurements, the soaked foam cushion gives a more constant loading overthe whole area. EBGEO assumes that deformation of the subsoil is proportional toloading on the subsoil. This will be closer to reality. In EBGEO and in the field,the GR will experience more support in the centre between two piles. The shape ofthe deformed GR will therefore approach an even higher order power law functionthan the foam cushion construction. Table 3.3 (page 57) presents the inputparameters for test K2.
EBGEO output parametersThe calculation results of calculation step 1 are given in terms of A equation (3.1),and B+C (equation (3.2)), for load distribution, see Figure 3.2). The results ofcalculation step 2 (membrane behaviour) are given in terms of average GR strain:Figure 3.4 and equation (3.7) for EBGEO, and equation (3.44) for the suggestedmodification of step 2.
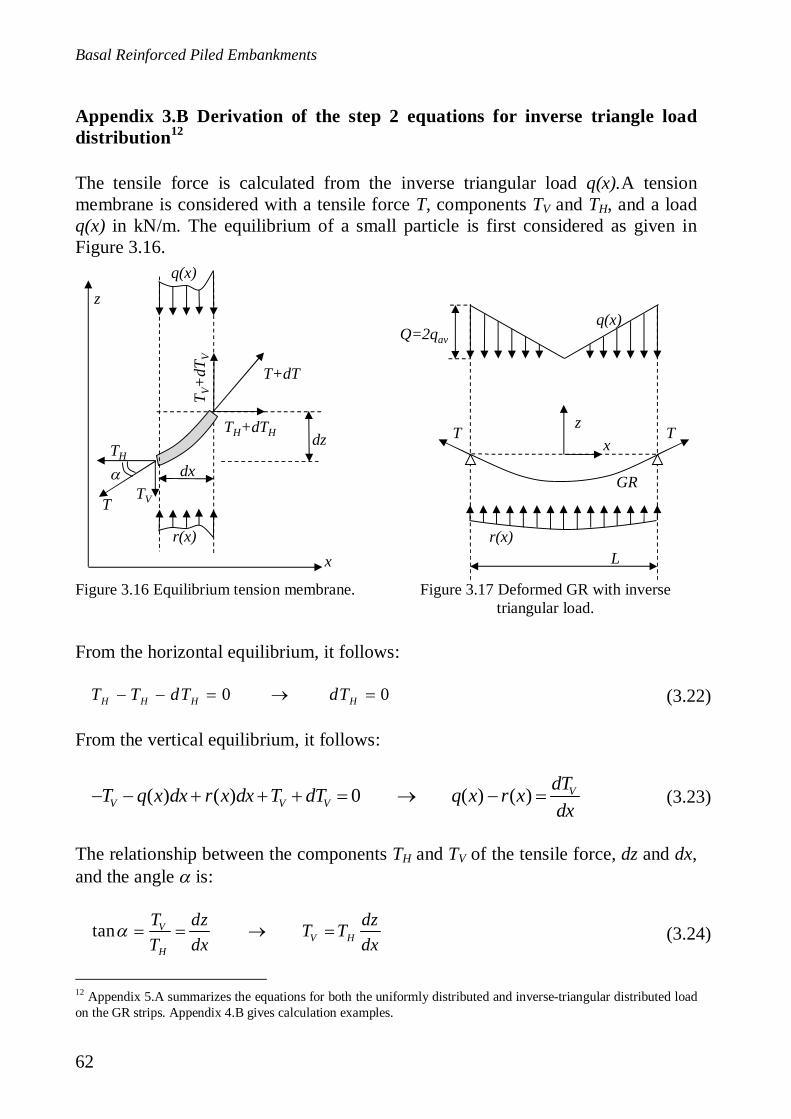
Basal Reinforced Piled Embankments
62
Appendix 3.B Derivation of the step 2 equations for inverse triangle loaddistribution12
The tensile force is calculated from the inverse triangular load q(x).A tensionmembrane is considered with a tensile force T, components TV and TH, and a loadq(x) in kN/m. The equilibrium of a small particle is first considered as given inFigure 3.16.
From the horizontal equilibrium, it follows:
From the vertical equilibrium, it follows:
The relationship between the components TH and TV of the tensile force, dz and dx,and the angle is:
12 Appendix 5.A summarizes the equations for both the uniformly distributed and inverse-triangular distributed loadon the GR strips. Appendix 4.B gives calculation examples.
T V+
dTV
TH+dTH
T+dT
TV
TH
T
dx
dz
x
zq(x)
r(x)
z
q(x)
TT
r(x)
x
Q=2qav
L
GR
Figure 3.16 Equilibrium tension membrane. Figure 3.17 Deformed GR with inversetriangular load.
0 0H H H HT T dT dT (3.22)
( ) ( ) 0 ( ) ( ) VV V V
dTT q x dx r x dx T dT q x r xdx
(3.23)
tan VV H
H
T dz dzT TT dx dx (3.24)
3 Load-deflection Behaviour of the Geosynthetic Reinforcement (step 2)
63
This gives:
Using equation (3.22) and thus 0HdTdx
it follows:
Using equation (3.23), this gives the differential equation for reinforcement strips:
Where qnet(x) is the net load on the GR strip. For the inverse triangular load, wefind for 0 < x < L/2 (see Figure 3.17):
With
Thus:
Using equation (3.5) or (3.9) it follows that the differential equation to be solvedis:
2
2V H
HdT dT dz d zTdx dx dx dx
(3.25)
2
2V
HdT d zTdx dx
(3.26)
2
2
( ) ( ) ( )net
H H
d z q x r x q xdx T T
(3.27)
2( ) Qq x xL
(3.28)
122
s s
B C B CQA A
(3.29)
2
2
( ) 2
H H
d z r x Q xdx T LT
(3.30)
2
2
2( )H H
d z K Qz x xdx T LT
(3.31)
Basal Reinforced Piled Embankments
64
Homogeneous solutionThe corresponding homogeneous equation is:
If a solution is assumed to be:
substitution in equation (3.32) gives:
and the complementary function is:
Particular solutionIf a solution is assumed to be:
substitution in equation (3.31) gives:
and the particular term is:
2
2 ( ) 0H
d z K z xdx T
(3.32)
( ) xz x A e (3.33)
2 0x x
H
KA e AeT (3.34)
2Thus:H
KT (3.35)
1 2( ) x xz x A e A e (3.36)
3( )H
Qz x A xLT (3.37)
3 3 2
2 20 2 H
H H H
K Q Q TA x x AT LT LT K (3.38)
( ) 2 Qz x xKL
(3.39)
3 Load-deflection Behaviour of the Geosynthetic Reinforcement (step 2)
65
General solutionThe following general solution results (for 0 < x < L/2):
Boundary conditionsTwo constraints give expressions for A1 and A2:
For the second constraint it is assumed that the pile and pile cap behave rigidly.Wefind that the critical height decreases:
It follows that:
From this, the tensile force in the GR and the GR strain can be calculated asfollows:
1 2
1 2
2( )
2'( )
x x
x x
Qz x A e A e xKL
Qz x A e A eKL
(3.40)
1 12 2
1 2 2 1
1 1
2 2'(0) 0 0
20 02
L L
Q Qz A A A AKL KL
L Q Qz Ae A eKL K
(3.41)
1 12 2
1 1 1 12 2 2 2
1 22 2 2
L L
L L L L
Q L e Q L eA and AKL KLe e e e
(3.42)
12
1 12 2
( ) 2 2
2
x x
L
L L
Qz x Me M e xKL
L ewhere Me e
(3.43)
2
'( ) 2 2
( ) 1 '( )( )( )
x x
H
Qz x M e M eKL
T x T z xT xx
J
(3.44)
Basal Reinforced Piled Embankments
66
The average strain can be calculated numerically, as shown in equation (3.45).Because the average strains were measured (see appendix 3.A), average strains arecalculated for comparisons with the measurements presented in this paper. EBGEOalways determines average strains. However, it is preferable to base a design on thecalculated maximum strains, calculated from (3.44) using x = L/2.
The unknown constant TH can be determined by equalising the geometric strainand the constitutive strain over (half) the length of the GR strip:
Situation without subsoil support (K 0):If the Maclaurin series is applied:
And thus:
Equation (3.43) is written as:
Substituting equation (3.47) in equation (3.48) gives:
1 12 22
12
0 0, ,1 1
2 2
11x L x L
x xgeometric average constitutive average
dzdx L T x dxdx J
L L(3.45)
12
12
2 2 3 3 4 4 5 51 1 1 12 6 24 120
2 2 3 3 4 4 5 51 1 1 12 6 24 120
2 3 4 52 3 4 51 1 1 1 1 1 1 1 12 2 2 6 2 24 2 120 2
2 3 4 52 3 4 51 1 1 1 1 1 1 1 12 2 2 6 2 24 2 120 2
1 .....
1 .....
1 .....
1 ...
x
x
L
L
e x x x x x
e x x x x x
e L L L L L
e L L L L L .
(3.46)
1 12 2
12
2 2 4 4112
2 2 3 3 4 4 5 51 1 13 12 60
2 42 41 1 12 12 2
2 3 4 52 3 4 51 1 1 1 1 1 12 3 2 12 2 60 2
2 .....
2 2 2 .....
2 ....
2 2 .....
x x
x
L L
L
e e x x
e x x x x x
e e L L
e L L L L L
(3.47)
12
1 12 2
3
1 2( ) 2 2L
x x xL L
H
Q L ez x e e e xT L e e
(3.48)

3 Load-deflection Behaviour of the Geosynthetic Reinforcement (step 2)
67
Thus:
Therefore:
For K 0, we find 0, thus:
2 42 41 1 12 12 2
2 3 4 52 3 4 51 1 1 1 1 1 12 3 2 12 2 60 2
3
2 2 4 4 2 2 3 3 4 4 5 51 1 1 112 3 12 60
21( )2
2 2 2 2
H
L L L L L LQz xT L L L
x x x x x x x x
(3.49)
2 42 41 1 12 12 2
3 53 51 1 1 12 2 4 43 2 60 2 1
123
2 2 3 3 4 4 5 51 1 13 12 60
1( ) 1 22
2
H
L LQz x x xT L L L
x x x x
(3.50)
2
2 42 41 1 12 12 2
3 53 51 1 1 13 2 60 2 2 2 4 4 3 2 51 1 1
12 3 60( ) 22H
L LQz x x x x xT L L L
(3.51)
3 318( )
3 H
Qz x x LT L (3.52)

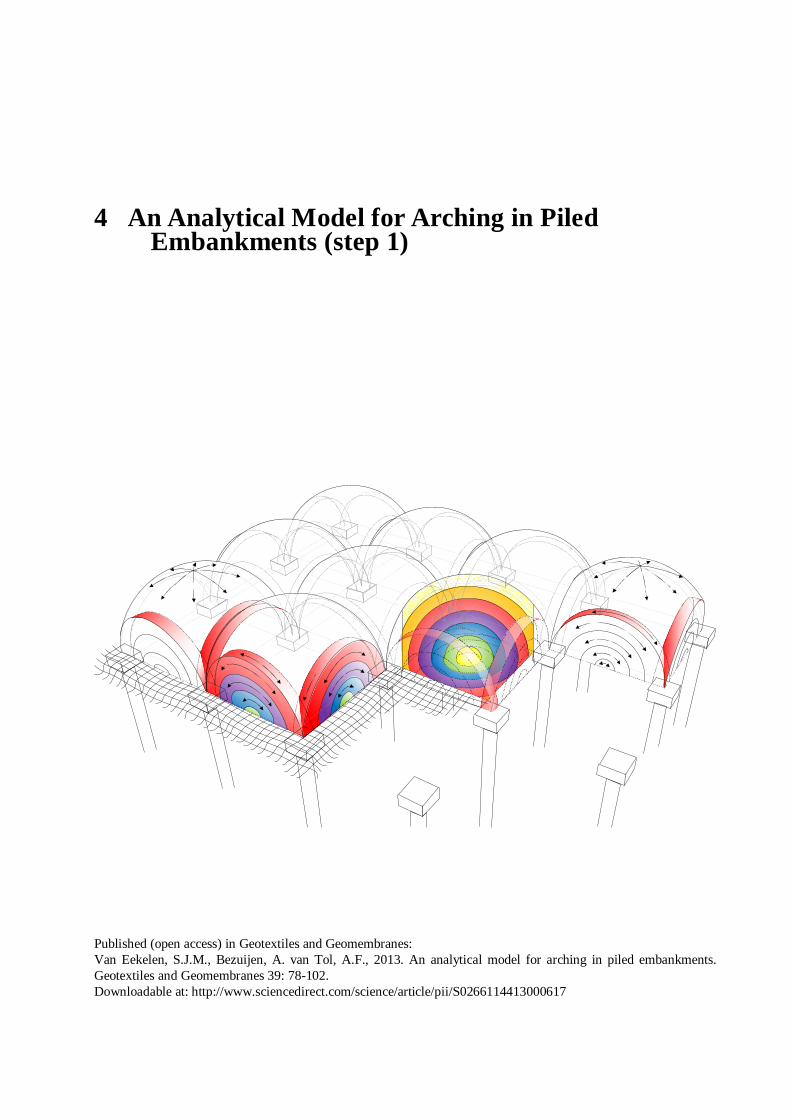
4 An Analytical Model for Arching in PiledEmbankments (step 1)
Published (open access) in Geotextiles and Geomembranes:Van Eekelen, S.J.M., Bezuijen, A. van Tol, A.F., 2013. An analytical model for arching in piled embankments.Geotextiles and Geomembranes 39: 78-102.Downloadable at: http://www.sciencedirect.com/science/article/pii/S0266114413000617
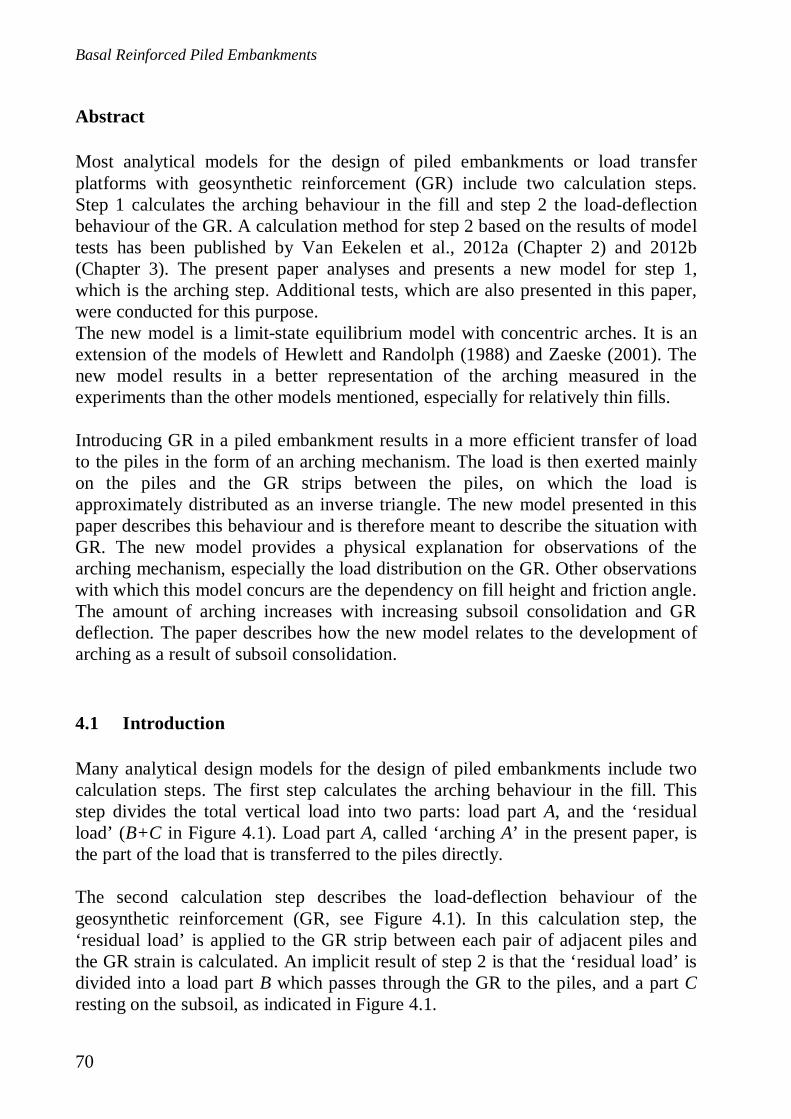
Basal Reinforced Piled Embankments
70
Abstract
Most analytical models for the design of piled embankments or load transferplatforms with geosynthetic reinforcement (GR) include two calculation steps.Step 1 calculates the arching behaviour in the fill and step 2 the load-deflectionbehaviour of the GR. A calculation method for step 2 based on the results of modeltests has been published by Van Eekelen et al., 2012a (Chapter 2) and 2012b(Chapter 3). The present paper analyses and presents a new model for step 1,which is the arching step. Additional tests, which are also presented in this paper,were conducted for this purpose.The new model is a limit-state equilibrium model with concentric arches. It is anextension of the models of Hewlett and Randolph (1988) and Zaeske (2001). Thenew model results in a better representation of the arching measured in theexperiments than the other models mentioned, especially for relatively thin fills.
Introducing GR in a piled embankment results in a more efficient transfer of loadto the piles in the form of an arching mechanism. The load is then exerted mainlyon the piles and the GR strips between the piles, on which the load isapproximately distributed as an inverse triangle. The new model presented in thispaper describes this behaviour and is therefore meant to describe the situation withGR. The new model provides a physical explanation for observations of thearching mechanism, especially the load distribution on the GR. Other observationswith which this model concurs are the dependency on fill height and friction angle.The amount of arching increases with increasing subsoil consolidation and GRdeflection. The paper describes how the new model relates to the development ofarching as a result of subsoil consolidation.
4.1 Introduction
Many analytical design models for the design of piled embankments include twocalculation steps. The first step calculates the arching behaviour in the fill. Thisstep divides the total vertical load into two parts: load part A, and the ‘residualload’ (B+C in Figure 4.1). Load part A, called ‘arching A’ in the present paper, isthe part of the load that is transferred to the piles directly.
The second calculation step describes the load-deflection behaviour of thegeosynthetic reinforcement (GR, see Figure 4.1). In this calculation step, the‘residual load’ is applied to the GR strip between each pair of adjacent piles andthe GR strain is calculated. An implicit result of step 2 is that the ‘residual load’ isdivided into a load part B which passes through the GR to the piles, and a part Cresting on the subsoil, as indicated in Figure 4.1.
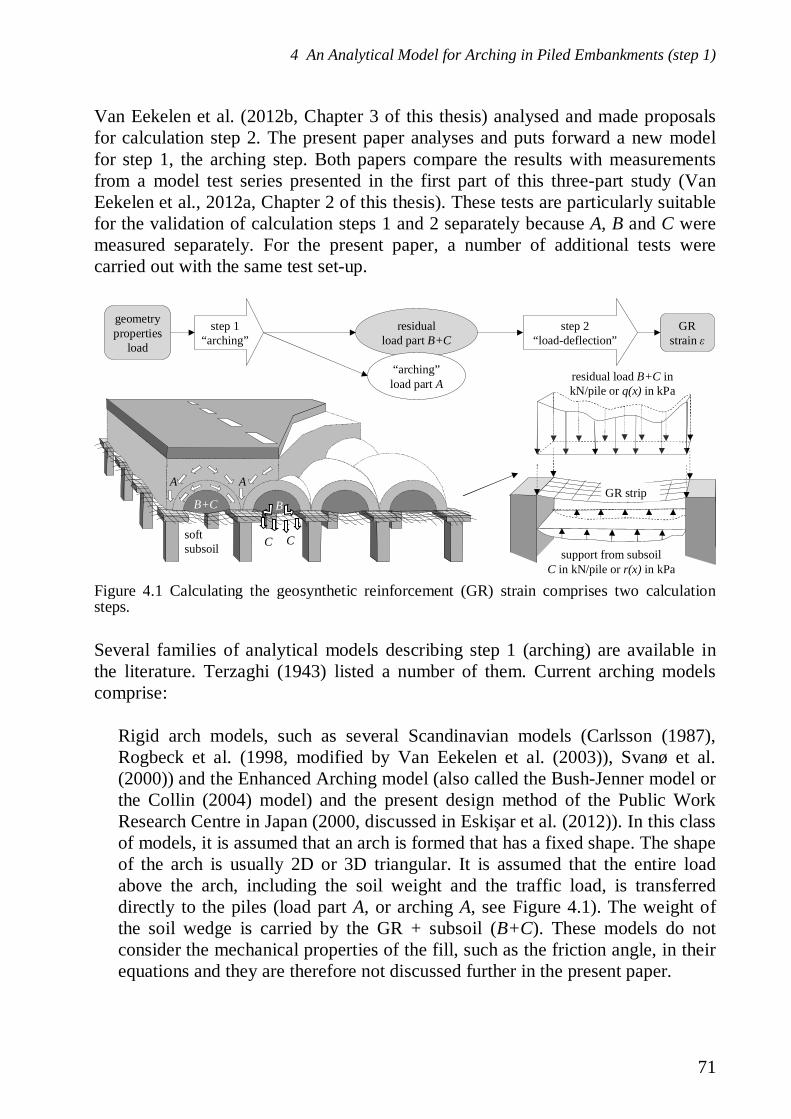
4 An Analytical Model for Arching in Piled Embankments (step 1)
71
Van Eekelen et al. (2012b, Chapter 3 of this thesis) analysed and made proposalsfor calculation step 2. The present paper analyses and puts forward a new modelfor step 1, the arching step. Both papers compare the results with measurementsfrom a model test series presented in the first part of this three-part study (VanEekelen et al., 2012a, Chapter 2 of this thesis). These tests are particularly suitablefor the validation of calculation steps 1 and 2 separately because A, B and C weremeasured separately. For the present paper, a number of additional tests werecarried out with the same test set-up.
Several families of analytical models describing step 1 (arching) are available inthe literature. Terzaghi (1943) listed a number of them. Current arching modelscomprise:
Rigid arch models, such as several Scandinavian models (Carlsson (1987),Rogbeck et al. (1998, modified by Van Eekelen et al. (2003)), Svanø et al.(2000)) and the Enhanced Arching model (also called the Bush-Jenner model orthe Collin (2004) model) and the present design method of the Public WorkResearch Centre in Japan (2000, discussed in Eski ar et al. (2012)). In this classof models, it is assumed that an arch is formed that has a fixed shape. The shapeof the arch is usually 2D or 3D triangular. It is assumed that the entire loadabove the arch, including the soil weight and the traffic load, is transferreddirectly to the piles (load part A, or arching A, see Figure 4.1). The weight ofthe soil wedge is carried by the GR + subsoil (B+C). These models do notconsider the mechanical properties of the fill, such as the friction angle, in theirequations and they are therefore not discussed further in the present paper.
geometryproperties
load
GRstrain
step 1“arching”
residualload part B+C
step 2“load-deflection”
GR stripB+C
AA
softsubsoil
residual load B+C inkN/pile or q(x) in kPa
support from subsoilC in kN/pile or r(x) in kPa
B
C C
“arching”load part A
Figure 4.1 Calculating the geosynthetic reinforcement (GR) strain comprises two calculationsteps.
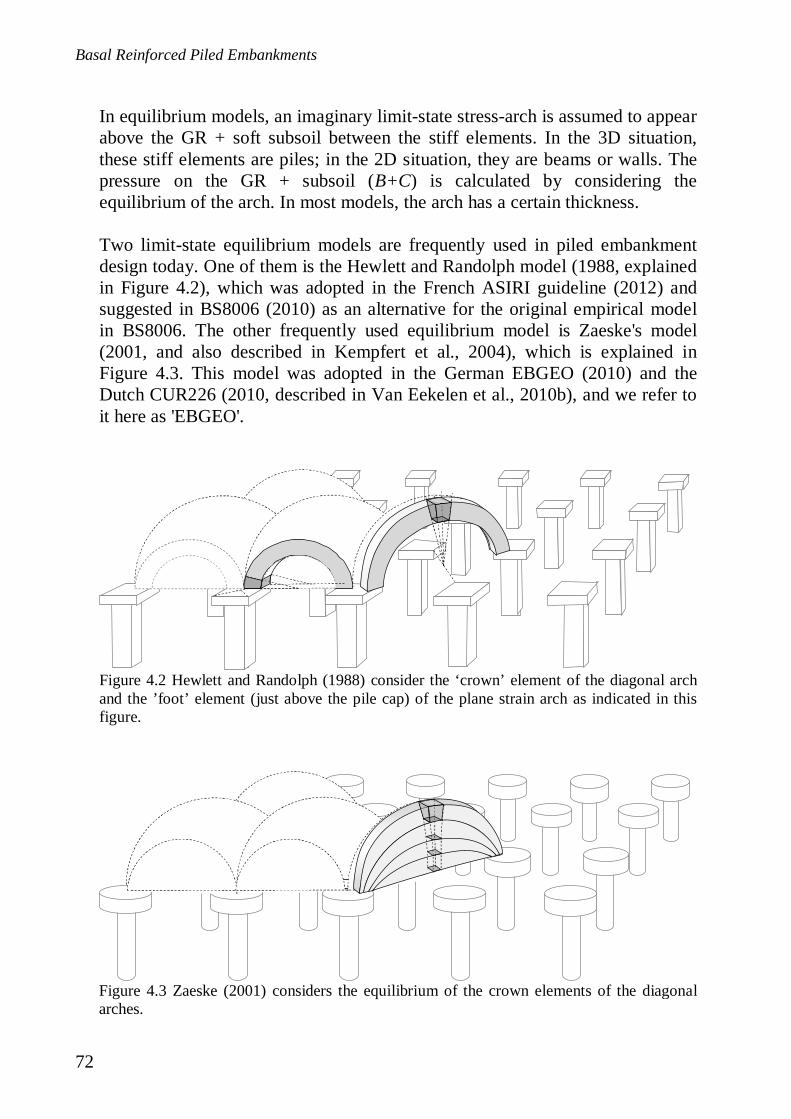
Basal Reinforced Piled Embankments
72
In equilibrium models, an imaginary limit-state stress-arch is assumed to appearabove the GR + soft subsoil between the stiff elements. In the 3D situation,these stiff elements are piles; in the 2D situation, they are beams or walls. Thepressure on the GR + subsoil (B+C) is calculated by considering theequilibrium of the arch. In most models, the arch has a certain thickness.
Two limit-state equilibrium models are frequently used in piled embankmentdesign today. One of them is the Hewlett and Randolph model (1988, explainedin Figure 4.2), which was adopted in the French ASIRI guideline (2012) andsuggested in BS8006 (2010) as an alternative for the original empirical modelin BS8006. The other frequently used equilibrium model is Zaeske's model(2001, and also described in Kempfert et al., 2004), which is explained inFigure 4.3. This model was adopted in the German EBGEO (2010) and theDutch CUR226 (2010, described in Van Eekelen et al., 2010b), and we refer toit here as 'EBGEO'.
Figure 4.2 Hewlett and Randolph (1988) consider the ‘crown’ element of the diagonal archand the ’foot’ element (just above the pile cap) of the plane strain arch as indicated in thisfigure.
Figure 4.3 Zaeske (2001) considers the equilibrium of the crown elements of the diagonalarches.

4 An Analytical Model for Arching in Piled Embankments (step 1)
73
Another family of arching models is the family of frictional models. Severalauthors have adopted the frictional model proposed by Terzaghi (1943), who inturn based his model on previous work from other authors such as Cain (1916)and Völlmy (1937). McKelvey (1994) extended Terzaghi by assuming that a‘plane of equal settlement’ exists and combined this with a tensioned membranetheory.
Russell and Pierpoint (1997) extended the Terzaghi model to include a thirddimension by assuming the presence of friction in the vertical planes along theedges of the square pile caps. McGuire et al. (2012) also adopted the idea of a‘plane of equal settlement', which they described as the ‘critical height’. Theyconducted numerous tests and collected field data to determine and validatetheir equation for the critical height. This critical height should be used incombination with Russell and Pierpoint’s (1997) version of Terzaghi (1943).Naughton (2007) determined the critical height with log spiral shear planes.Britton and Naughton (2008) presented 3D experiments validating the criticalheight of this model.
Although the ideas underlying the frictional models are extremely important,these models are not generally used in Europe for piled embankment design andthey will not be discussed further. A possible reason for the infrequent use ofthese models in Europe is that the results depend to a large extent on the valueof K0 (the ratio between horizontal and vertical pressure) and the fact that it isdifficult to determine an accurate value for K0.
Other examples of models considered in the literature are the models usingmechanical elements, like the load displacement compatibility method of Filz etal. (2012), the one-dimensional model of R.P. Chen et al. (2008b) and the planestrain models of Deb (2010), Deb and Mahapatra (2012) and Zhang et al.(2012). Filz et al. (2012) model the fill, the GR and the piles + subsoil asseparate elements. The boundary condition for each of the elements is thatdeformation must match neighbouring elements. This determines the loadtransferred to the piles directly (arching A, see Figure 4.1). Filz et al. (2012)limit arching A with 3D Terzaghi (cross-shaped, according to Russell andPierpoint, 1997), plus critical height.
A familiar empirical model is the modified Marston and Anderson model(1913) that was modified by Jones et al. (1990) and adopted in BS8006 and theFinnish design guideline (Liikennevirasto, 2012). Marston and Anderson (1913)carried out numerous experiments to determine arching above a pipe in soil.They found a 2D equation that was modified by Jones et al. (1990) for the3D piled embankments, as explained and further modified in Van Eekelen et al.

Basal Reinforced Piled Embankments
74
(2011a, adopted in appendix A of this thesis). This model is very importantbecause of the widespread application of BS8006.
The final type of model that should be mentioned is the family of hammockmodels, such as the ‘path of minor principal stress’ model described by Handy(1985).
Most step 1 models calculate one average pressure on the GR. EBGEO uses, in itsstep 2, a triangular pressure distribution. This is an assumption following fromfigure 9.15 of EBGEO (2010), not the result of a calculation. Van Eekelen et al.(2012a and b, Chapters 2 and 3 of this thesis) showed that the measured pressuredistribution on the GR strip between the piles can be better approximated with an'inverse triangle'.
The present paper presents a new equilibrium model for step 1 that is a bettermatch for several experimental, numerical and field observations, particularly themeasured inverse triangle in the pressure distribution. The starting point for thisstudy consisted of the design models in general use in Europe. The new model isan extension of the Hewlett and Randolph (1988) and EBGEO (2010) models.
4.2 Additional laboratory tests
4.2.1 Measurements of steps 1 and step 2 separately
Van Eekelen et al. (2012a, Chapter 2 of this thesis) presented and analysed a seriesof twelve model laboratory model tests on piled embankments. Since then, eightadditional model tests have been carried out with the same set-up. Six of themwere carried out specifically to validate variations in calculation step 1. These testsare presented here. One of the strengths of the test set-up was that it was possibleto validate calculation steps 1 and 2 (Figure 4.1) separately because the values ofA, B and C are measured separately.
4.2.2 Description tests
Figure 4.4 shows the test set-up for both the first and the second series, except fortwo additional total pressure cells (TPCs), which were used in the second seriesonly. The insides of the box walls were located on the lines of symmetry. A foamcushion modelled the soft soil around the four piles. This cushion was a saturatedand watertight sealed foam rubber cushion. A tap allowed drainage of the cushionduring the test to model the soft-soil consolidation process.
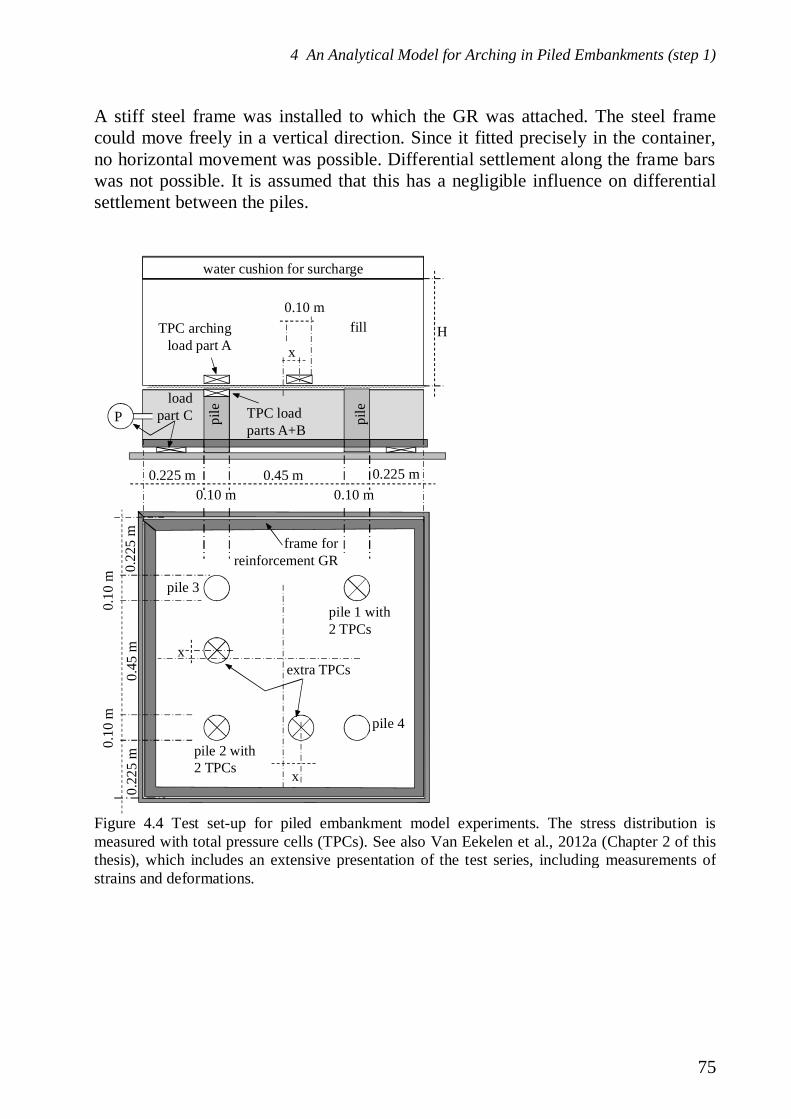
4 An Analytical Model for Arching in Piled Embankments (step 1)
75
A stiff steel frame was installed to which the GR was attached. The steel framecould move freely in a vertical direction. Since it fitted precisely in the container,no horizontal movement was possible. Differential settlement along the frame barswas not possible. It is assumed that this has a negligible influence on differentialsettlement between the piles.
fill
pile
pile
xH
water cushion for surcharge
0.10 m
pile 3
pile 1 with2 TPCs
pile 4
frame forreinforcement GR
extra TPCs
0.45 m0.225 m0.10 m 0.10 m
0.225 m
pile 2 with2 TPCs x
0.45
m0.
225
m
0.10
m0.
10m
0.22
5m
x
TPC archingload part A
TPC loadparts A+B
loadpart CP
Figure 4.4 Test set-up for piled embankment model experiments. The stress distribution ismeasured with total pressure cells (TPCs). See also Van Eekelen et al., 2012a (Chapter 2 of thisthesis), which includes an extensive presentation of the test series, including measurements ofstrains and deformations.
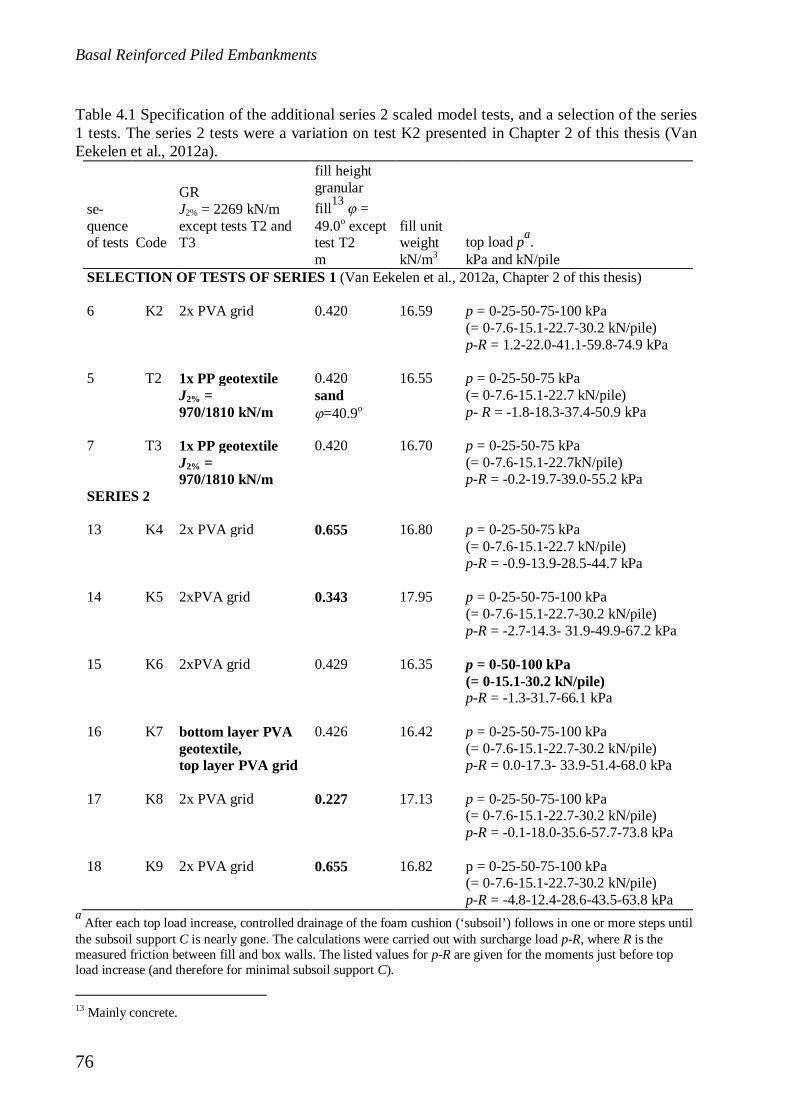
Basal Reinforced Piled Embankments
76
Table 4.1 Specification of the additional series 2 scaled model tests, and a selection of the series1 tests. The series 2 tests were a variation on test K2 presented in Chapter 2 of this thesis (VanEekelen et al., 2012a).
se-quenceof tests Code
GRJ2% = 2269 kN/mexcept tests T2 andT3
fill heightgranularfill13 =49.0o excepttest T2
fill unitweight top load pa.
m kN/m3 kPa and kN/pileSELECTION OF TESTS OF SERIES 1 (Van Eekelen et al., 2012a, Chapter 2 of this thesis)
6 K2 2x PVA grid 0.420 16.59 p = 0-25-50-75-100 kPa(= 0-7.6-15.1-22.7-30.2 kN/pile)p-R = 1.2-22.0-41.1-59.8-74.9 kPa
5 T2 1x PP geotextileJ2% =970/1810 kN/m
0.420sand
=40.9o
16.55 p = 0-25-50-75 kPa(= 0-7.6-15.1-22.7 kN/pile)p- R = -1.8-18.3-37.4-50.9 kPa
7 T3 1x PP geotextileJ2% =970/1810 kN/m
0.420 16.70 p = 0-25-50-75 kPa(= 0-7.6-15.1-22.7kN/pile)p-R = -0.2-19.7-39.0-55.2 kPa
SERIES 2
13 K4 2x PVA grid 0.655 16.80 p = 0-25-50-75 kPa(= 0-7.6-15.1-22.7 kN/pile)p-R = -0.9-13.9-28.5-44.7 kPa
14 K5 2xPVA grid 0.343 17.95 p = 0-25-50-75-100 kPa(= 0-7.6-15.1-22.7-30.2 kN/pile)p-R = -2.7-14.3- 31.9-49.9-67.2 kPa
15 K6 2xPVA grid 0.429 16.35 p = 0-50-100 kPa(= 0-15.1-30.2 kN/pile)p-R = -1.3-31.7-66.1 kPa
16 K7 bottom layer PVAgeotextile,top layer PVA grid
0.426 16.42 p = 0-25-50-75-100 kPa(= 0-7.6-15.1-22.7-30.2 kN/pile)p-R = 0.0-17.3- 33.9-51.4-68.0 kPa
17 K8 2x PVA grid 0.227 17.13 p = 0-25-50-75-100 kPa(= 0-7.6-15.1-22.7-30.2 kN/pile)p-R = -0.1-18.0-35.6-57.7-73.8 kPa
18 K9 2x PVA grid 0.655 16.82 p = 0-25-50-75-100 kPa(= 0-7.6-15.1-22.7-30.2 kN/pile)p-R = -4.8-12.4-28.6-43.5-63.8 kPa
a After each top load increase, controlled drainage of the foam cushion (‘subsoil’) follows in one or more steps untilthe subsoil support C is nearly gone. The calculations were carried out with surcharge load p-R, where R is themeasured friction between fill and box walls. The listed values for p-R are given for the moments just before topload increase (and therefore for minimal subsoil support C).
13 Mainly concrete.
4 An Analytical Model for Arching in Piled Embankments (step 1)
77
The embankment in most tests was granular fill (crushed recycled constructionmaterial 1-16 mm, = 49o at a unit weight of 16.4 kN/m3). The friction angle
= 49o of the granular fill was measured in large diameter (ø = 0.3 m) triaxialtests. The average relative density in the triaxial tests and scale model tests wasnearly the same at 61.0% and 62.9% respectively. The top load was applied with awater cushion that made it possible to apply stresses comparable with fieldstresses.
The area replacement ratio a2/(sx sy) in the test series described was 2.6%, while thearea replacement ratio in Dutch practice is between 4.5 and 12%. This was adeliberate decision with the aim of generating enough GR tensile forces at thissmaller scale.
After the introduction of the fill, each test was carried out as follows: (1) onedrainage step foam cushion (subsoil consolidation), (2) first top load increment,(3) one or more drainage steps (4) second top load increment, (5) one or moredrainage steps and so on, up to the maximum top load (varying between 50 and100 kPa) and the subsequent drainage steps. The test concluded with the completeremoval of the subsoil support by applying vacuum to the foam cushion. Table 4.1lists a selection of the tests in the first series, and all the tests in the new secondseries presented in the present paper. The tests from the second series are allvariations on test K2, except that each test included one variation, which isindicated in bold in Table 4.1. Furthermore, additional total pressure cells wereadded to measure the load distribution on the GR strips
The GR in these additional tests consisted of two layers of woven PVA grid,except for test K7, where the bottom layer was replaced by a similar PVAgeotextile. The two uniaxial reinforcement layers were placed directly upon eachother on one frame. The strength direction of one geogrid was perpendicular to theother. There was no distance between these two GR layers. The two layers aretherefore considered to be a single GR layer that is completely biaxial.
GR stiffness depends on GR strain and the duration of loading, as well as otherfactors. The stiffness values of the weak direction of one GR layer and the stiffdirection of the other layer were aggregated, resulting in a total GR stiffnessJ2% = 2269 kN/m in each direction. J2% is the GR stiffness for a GR strain of 2%,and is determined in accordance with ISO 10319. These ISO tests are much fasterthan the piled embankment model tests (that took 3 days each). This means that theGR in the model tests is loaded longer and will behave differently (less stiffly)from the behaviour suggested by this J2%. However, GR stiffness is not a parameterin analytical step 1: the arching calculations considered in the present paper.Van Eekelen et al. (2012a, Chapter 2 of this thesis) confirmed that using GR has a

Basal Reinforced Piled Embankments
78
major impact on the arching mechanism, but GR stiffness (as long as the stiffnesscomplies with a good-quality design model) does not have a measurable influence.
4.2.3 Results of the additional tests
Figure 4.5 compares the measurements of arching A in the new model tests withseveral old model tests. The numbers between brackets refer to the sequence oftests.
The granular fill was re-used for each test. It was observed that large numbers ofgrains were crushed during the successive tests. This will probably have caused areduction of the friction angle. A lower friction angle results in less arching, asshown by the figure. Arching was also relatively low in test T2, in which a sand fillwas used.
The friction angle = 49o of the granular fill was measured with large triaxial testscarried out between experiments 12 and 13. This effect of reducing friction isneglected in the present paper. In the calculations, friction angle = 49o wasapplied. More results from the additional tests are presented in Figure 4.7, Figure4.15, Figure 4.17, Figure 4.19, and Figure 4.21 of this paper.
0
2
4
6
8
10
12
14
16
0 5 10 15 20 25
mea
sure
dlo
adpa
rtA
(kN
/pile
)
net load Wn (kN/pile)
T2 (5) T3 (7)K2 (6) K4 (15)K5 (16) K6 (17)K7 (18) K8 (19)K9 (20)
Figure 4.5 Measurements of arching A in a selection of the experiments in series 1 (Van Eekelenet al., 2012a, Chapter 2 of this thesis) and the additional tests in series 2. The numbers betweenthe brackets refer to the sequence of tests.
4 An Analytical Model for Arching in Piled Embankments (step 1)
79
4.3 Observations of arching in experiments, field tests and numericalcalculations
4.3.1 Measuring arching
This paper focuses on the description of the arching mechanism, and therefore oncalculation step 1 in Figure 4.1. Arching divides the vertical load into two parts, asshown in Figure 4.1. One part is load part A (called ‘arching A’ in this paper),which is the load that is transferred to the pile caps directly. The remaining loadpart is B+C.
Direct validation of arching in a GR reinforced piled platform with measurementsis only possible when A is measured separately, as shown in Figure 4.4. This figureshows how load A was measured in the tests, using total pressure cells (TPCs) witha diameter equal to the pile diameter. They were located on top of the piles and ontop of the GR. In addition, two total pressure cells measured A+B. They werelocated below the GR on top of the piles. This paper gives arching A in kN/pile. Inseveral figures, arching is presented as a percentage of the total load, which isreferred to as "A%". A% corresponds to efficacy ("E") as used by several authors,where E = A% = A/(A+B+C), with A, B and C given in kN/pile, A% in % and E asa ratio (-).
Many researchers (such as Zaeske, 2001; Blanc et al., 2013) have measured A+B ormeasured A in a piled platform without GR (Hewlett and Randolph, 1988; Ellisand Aslam, 2009a, for example). As far as we are aware, only the Dutch researchprogramme has reported measurements of A in experiments with GR (Van Eekelenet al., 2012a and b, adopted in Chapters 2 and 3 of this thesis) and three field testswith GR (Van Duijnen et al., 2010, Van Eekelen et al., 2010a, 2010b andVan Eekelen et al., 2012c, 2013).
4.3.2 Comparison of predictions and measurements of arching A
Van Eekelen et al. (2012b, Chapter 3 of this thesis) measured A in their experimentseries and showed that EBGEO generally under-predicts the measured A. Thispaper presents additional tests of the same type. Van Duijnen et al. (2010)measured A in field tests under a railway in Houten, the Netherlands. They showedthat EBGEO considerably under-predicts A, as also shown in Figure 4.16a.More recently, Van Eekelen and Bezuijen (2013b) showed that EBGEO onlyslightly under-predicts A as a result of the permanent load in field measurements inWoerden, the Netherlands, as shown in Figure 4.16b.

Basal Reinforced Piled Embankments
80
It should be noted that the results of the predictions are highly dependent on thefriction angle of the fill and that this friction angle is difficult to determine in thefield. The presented EBGEO prediction for Woerden, for example, is calculatedwith a best-guess friction angle = 43o, resulting in A = 113 kN/pile, as indicatedin Figure 4.16b. However, this EBGEO-prediction of A falls to 96 kN/pile for
= 37.5o and rises to 132 kN/pile for = 49o.
It is also not certain that this fill friction angle or fill cohesion remains constant inall circumstances, such as heavy rain or long dry, hot periods: the arching in Figure4.16b increased in the spring of 2011 during a dry, hot period.
4.3.3 Impact of fill height
Several researchers have reported that the efficiency of arching increases withincreasing fill height. Examples are Y.M. Chen et al. (2008a) in 2D experimentswith GR and Zaeske (2001) with 3D experiments (although the latter only showedthe differences in his experiments without GR), Han and Gabr (2002) withnumerical analysis with GR, Le Hello and Villard (2009) with numerical analysiswith GR (see Figure 4.18), Jenck et al. (2009) with 2D experiments without GRand numerical analysis, Ellis and Aslam (2009a) with centrifuge tests without GR,and Deb and Mohapatra (2013) with 2D analytical calculations. All theseresearchers showed that a higher fill results in relatively more load beingtransferred to the piles, either directly or via the GR. A higher fill therefore resultsin a relative reduction in the load exerted on the GR and/or the subsoil between thepiles.
The experiments presented in this paper also show that fill height has an impact, asseen in Figure 4.17. A% increases with fill height and seems to stabilise withincreasing embankment height, as shown in Figure 4.17 and Figure 4.18. WhenA% stabilises, the absolute values of A and B+C (kN/pile or kPa) will increasewith increasing fill height. This tendency towards increasing arching is followedby many design models, such as Carlson (1987), Guido et al. (1987), Hewlett andRandolph (1988), Russel and Pierpoint (1997), Sintef (2002) and Kempfert et al.(2004), which was adopted in EBGEO (2010), as Le Hello and Villard (2009) haveshown.
The critical height is the height at which the shear forces in the embankment fillare reduced to zero (Naughton, 2007), which is the case at the ‘plane of equalsettlement’, defined by McKelvey (1994) as the lowest plane where no differentialsettlement occurs. Lally and Naughton (2012) carried out a series of 2D GR-reinforced centrifuge tests. They found close agreement between the observed
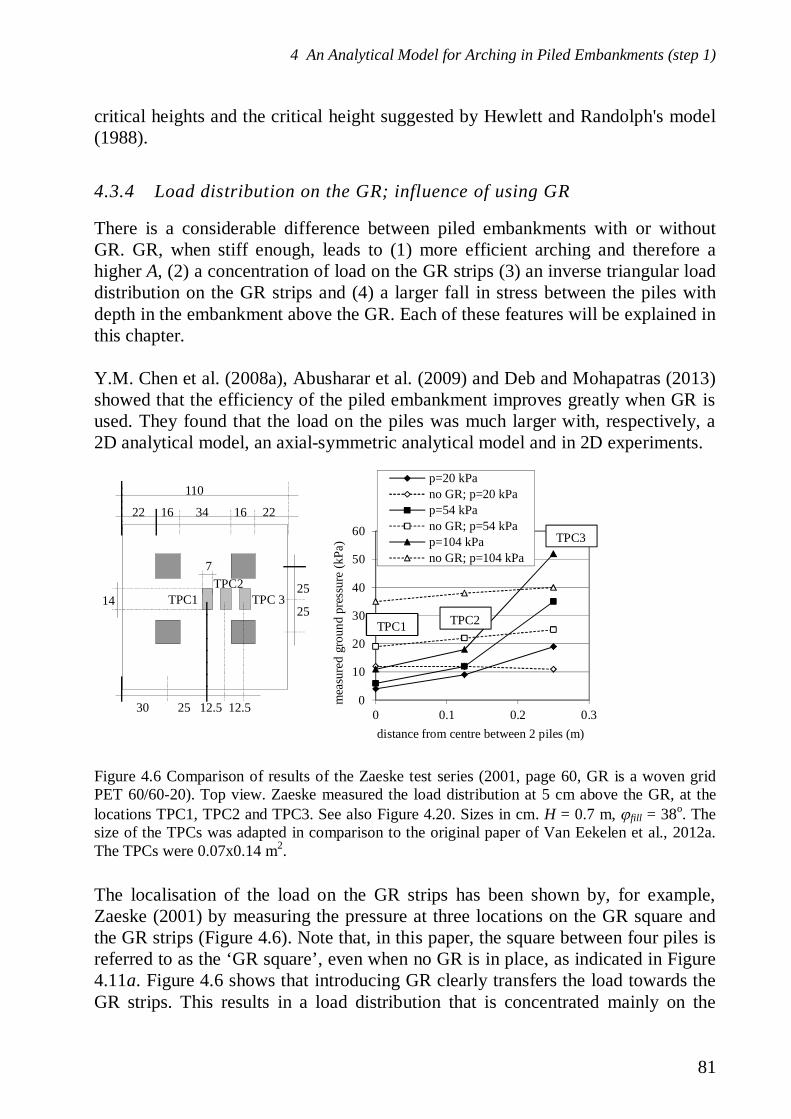
4 An Analytical Model for Arching in Piled Embankments (step 1)
81
critical heights and the critical height suggested by Hewlett and Randolph's model(1988).
4.3.4 Load distribution on the GR; influence of using GR
There is a considerable difference between piled embankments with or withoutGR. GR, when stiff enough, leads to (1) more efficient arching and therefore ahigher A, (2) a concentration of load on the GR strips (3) an inverse triangular loaddistribution on the GR strips and (4) a larger fall in stress between the piles withdepth in the embankment above the GR. Each of these features will be explained inthis chapter.
Y.M. Chen et al. (2008a), Abusharar et al. (2009) and Deb and Mohapatras (2013)showed that the efficiency of the piled embankment improves greatly when GR isused. They found that the load on the piles was much larger with, respectively, a2D analytical model, an axial-symmetric analytical model and in 2D experiments.
The localisation of the load on the GR strips has been shown by, for example,Zaeske (2001) by measuring the pressure at three locations on the GR square andthe GR strips (Figure 4.6). Note that, in this paper, the square between four piles isreferred to as the ‘GR square’, even when no GR is in place, as indicated in Figure4.11a. Figure 4.6 shows that introducing GR clearly transfers the load towards theGR strips. This results in a load distribution that is concentrated mainly on the
7
14TPC2
TPC1 TPC 325
25
30 25 12.5 12.5
110
22 16 34 16 22
0
10
20
30
40
50
60
0 0.1 0.2 0.3
mea
sure
dgr
ound
pres
sure
(kPa
)
distance from centre between 2 piles (m)
p=20 kPano GR; p=20 kPap=54 kPano GR; p=54 kPap=104 kPano GR; p=104 kPa
TPC1 TPC2
TPC3
Figure 4.6 Comparison of results of the Zaeske test series (2001, page 60, GR is a woven gridPET 60/60-20). Top view. Zaeske measured the load distribution at 5 cm above the GR, at thelocations TPC1, TPC2 and TPC3. See also Figure 4.20. Sizes in cm. H = 0.7 m, fill = 38o. Thesize of the TPCs was adapted in comparison to the original paper of Van Eekelen et al., 2012a.The TPCs were 0.07x0.14 m2.

Basal Reinforced Piled Embankments
82
GR strips (and probably the piles, but Zaeske did not measure A). As a result, it isexpected that the strains in the GR occur mainly in the GR strips between the piles.This was indeed found in both Zaeske (2001) and Van Eekelen et al. (2012b,Chapter 3 of this thesis).
The pressure on the GR strips is not equally distributed; it rises towards the piles.In the additional tests presented in this paper, the load distribution on the GR stripwas measured with additional total pressure cells on the GR strip (Figure 4.4).These measurements (Figure 4.7) do indeed show that the load on the GR risestowards the piles. This load distribution can be approximated by a model with aninverse triangular load distribution. The inverse triangular model has advantagessince it is a relatively simple analytical model. Van Eekelen et al. (2012a and b(Chapters 2 and 3 of this thesis) and 2013) showed that this simplified analyticalmodel provides a good match with measurements of deformation in laboratoryexperiments.
Furthermore, the inverse triangle (or at least the concentration of load close to thepiles, and the minimum load in the centre between piles) was also found in, forexample, finite element calculations on a soldier pile wall by Vermeer et al.(2001), discrete element calculations on a heap of grains on a deflecting subsurface(Nadukuru and Michalowski, 2012), numerical calculations by Han et al. (2012),with a inversed triangle in their Figure 9, and by Den Boogert et al. (2012a,b),settlement measurements in a field test (Van Eekelen et al., 2012c and 2013) andthe large-scale model tests of Filz and Sloan (2013).
normalised measured total B+C(distributed in a inversetriangular shape, kPa)
K4; Q=161 kPaK5; Q=265 kPaK6; Q=239 kPa
K7; Q=260 kPaK8; Q=240 kPaK9; Q=265 kPa
1.00.80.60.40.2
loca
lmea
sure
dpr
essu
reon
GR
/Q(k
Pa/k
Pa)
normalisedmeasured B+C,expressed asaverage pressureon GR strips(B+C)average(kPa)
Q= 2 (B+C)average (kPa)
Figure 4.7 Measured load distribution on GR in newly presented tests (Table 4.1) compared withthe total measured load B+C on the GR, presented as an equally distributed load and with theinverse triangular load distribution of Van Eekelen et al., 2012a and b (Chapters 2 and 3 of thisthesis). The total measured B+C (kN/pile) was measured with the transducers that measure A,A+B and C indicated in Figure 4.4. These values were divided by the area of a GR strip to getthe equally distributed load (B+C)average in kPa. The local pressures were measured in kPa withthe extra TPC’s indicated in Figure 4.4.
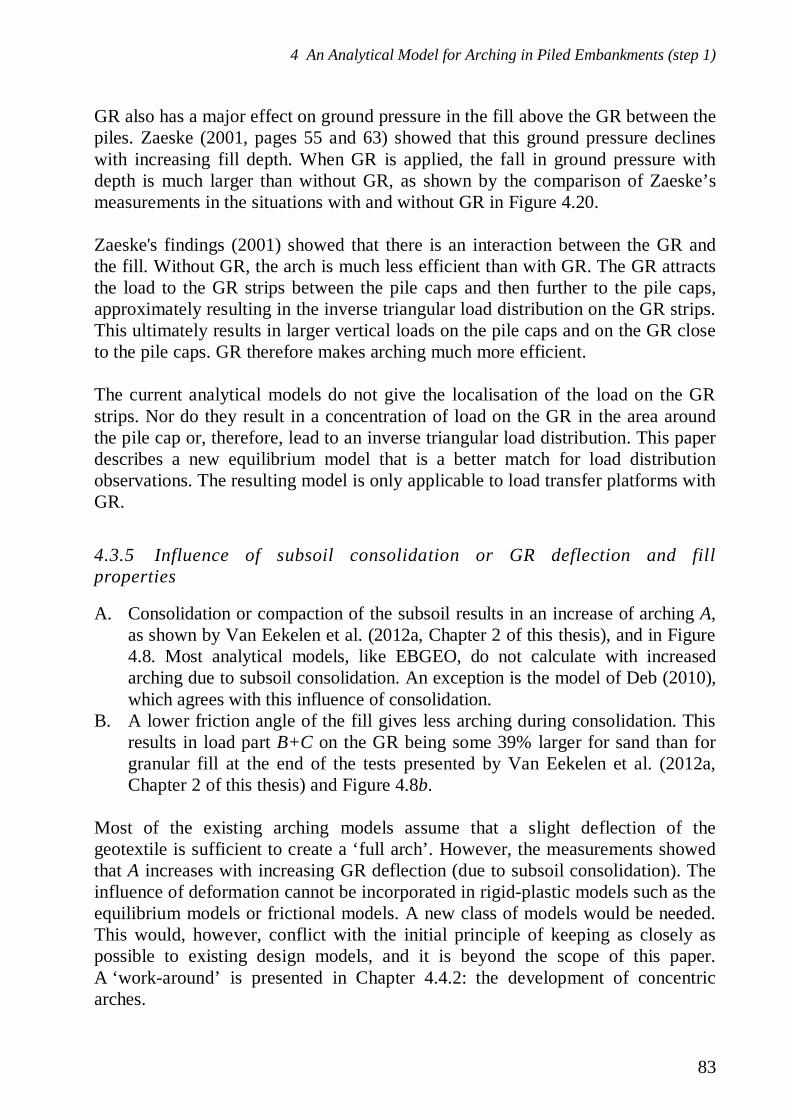
4 An Analytical Model for Arching in Piled Embankments (step 1)
83
GR also has a major effect on ground pressure in the fill above the GR between thepiles. Zaeske (2001, pages 55 and 63) showed that this ground pressure declineswith increasing fill depth. When GR is applied, the fall in ground pressure withdepth is much larger than without GR, as shown by the comparison of Zaeske’smeasurements in the situations with and without GR in Figure 4.20.
Zaeske's findings (2001) showed that there is an interaction between the GR andthe fill. Without GR, the arch is much less efficient than with GR. The GR attractsthe load to the GR strips between the pile caps and then further to the pile caps,approximately resulting in the inverse triangular load distribution on the GR strips.This ultimately results in larger vertical loads on the pile caps and on the GR closeto the pile caps. GR therefore makes arching much more efficient.
The current analytical models do not give the localisation of the load on the GRstrips. Nor do they result in a concentration of load on the GR in the area aroundthe pile cap or, therefore, lead to an inverse triangular load distribution. This paperdescribes a new equilibrium model that is a better match for load distributionobservations. The resulting model is only applicable to load transfer platforms withGR.
4.3.5 Influence of subsoil consolidation or GR deflection and fillproperties
A. Consolidation or compaction of the subsoil results in an increase of arching A,as shown by Van Eekelen et al. (2012a, Chapter 2 of this thesis), and in Figure4.8. Most analytical models, like EBGEO, do not calculate with increasedarching due to subsoil consolidation. An exception is the model of Deb (2010),which agrees with this influence of consolidation.
B. A lower friction angle of the fill gives less arching during consolidation. Thisresults in load part B+C on the GR being some 39% larger for sand than forgranular fill at the end of the tests presented by Van Eekelen et al. (2012a,Chapter 2 of this thesis) and Figure 4.8b.
Most of the existing arching models assume that a slight deflection of thegeotextile is sufficient to create a ‘full arch’. However, the measurements showedthat A increases with increasing GR deflection (due to subsoil consolidation). Theinfluence of deformation cannot be incorporated in rigid-plastic models such as theequilibrium models or frictional models. A new class of models would be needed.This would, however, conflict with the initial principle of keeping as closely aspossible to existing design models, and it is beyond the scope of this paper.A ‘work-around’ is presented in Chapter 4.4.2: the development of concentricarches.
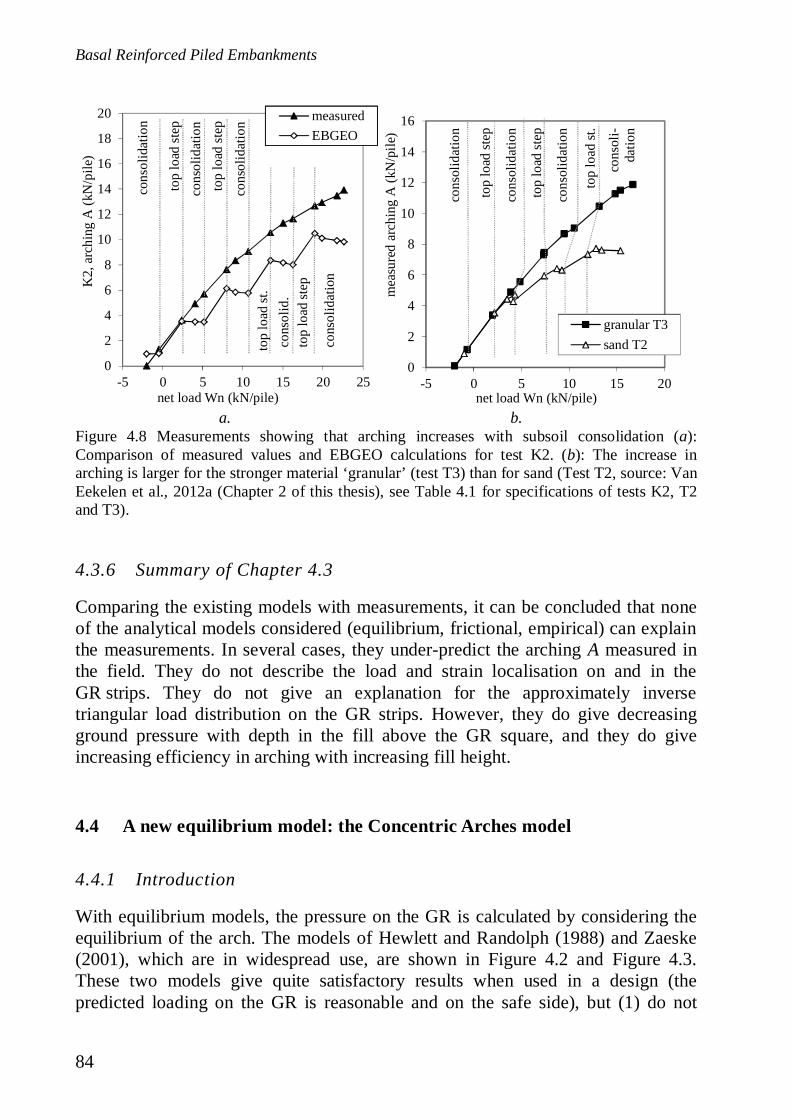
Basal Reinforced Piled Embankments
84
a. b.
4.3.6 Summary of Chapter 4.3
Comparing the existing models with measurements, it can be concluded that noneof the analytical models considered (equilibrium, frictional, empirical) can explainthe measurements. In several cases, they under-predict the arching A measured inthe field. They do not describe the load and strain localisation on and in theGR strips. They do not give an explanation for the approximately inversetriangular load distribution on the GR strips. However, they do give decreasingground pressure with depth in the fill above the GR square, and they do giveincreasing efficiency in arching with increasing fill height.
4.4 A new equilibrium model: the Concentric Arches model
4.4.1 Introduction
With equilibrium models, the pressure on the GR is calculated by considering theequilibrium of the arch. The models of Hewlett and Randolph (1988) and Zaeske(2001), which are in widespread use, are shown in Figure 4.2 and Figure 4.3.These two models give quite satisfactory results when used in a design (thepredicted loading on the GR is reasonable and on the safe side), but (1) do not
0
2
4
6
8
10
12
14
16
18
20
-5 0 5 10 15 20 25
K2,
arch
ing
A(k
N/p
ile)
net load Wn (kN/pile)
measuredEBGEO
cons
olid
atio
n
top
load
step
cons
olid
.to
plo
adst
.
top
load
step
cons
olid
atio
n
cons
olid
atio
n
cons
olid
atio
n
top
load
step
0
2
4
6
8
10
12
14
16
-5 0 5 10 15 20m
easu
red
arch
ing
A(k
N/p
ile)
net load Wn (kN/pile)
granular T3sand T2
cons
olid
atio
n
top
load
step
cons
oli-
datio
n
top
load
st.
top
load
step
cons
olid
atio
n
cons
olid
atio
n
Figure 4.8 Measurements showing that arching increases with subsoil consolidation (a):Comparison of measured values and EBGEO calculations for test K2. (b): The increase inarching is larger for the stronger material ‘granular’ (test T3) than for sand (Test T2, source: VanEekelen et al., 2012a (Chapter 2 of this thesis), see Table 4.1 for specifications of tests K2, T2and T3).

4 An Analytical Model for Arching in Piled Embankments (step 1)
85
explain the concentration of load on the GR strip, (2) do not explain or derive aninverse triangular load distribution on the GR strips and (3) do not give increasingarching during subsoil consolidation. Furthermore, the Hewlett and Randolphmodel is not meant for arching with GR, and not particularly suitable for partialarching situations, which are situations where the fill or embankment is thinnerthan the full arch height, in other words when H < sd/2. The Zaeske model canwork with these low embankments.
This chapter introduces a new model, the concentric hemispheres model. Thismodel accounts for increased arching with subsoil consolidation and finds loadlocalisation on the GR strips. Furthermore, it gives a physical explanation for theinverse triangular load distribution and is therefore a better match for theobservations in Chapter 4.3.
However, in practical applications, a limit-state version of the model will beapplied. In that case, the Concentric Arches model behaves in a rigid-plastic wayand will no longer describe the influence of subsoil consolidation or deformation.It should be noted that in this paper a hemisphere is a 3D arch as indicated inFigure 4.13, and an arch is a 2D arch, as indicated in Figure 4.12.
4.4.2 Development of concentric arches
Figure 4.9 introduces a 2D picture of the new model that describes thedevelopment of arching during subsoil consolidation, accompanied by anincreasing GR deflection.
In Figure 4.9a, a small GR deflection results in the start of arch formation at theedge of the pile cap. At this location (the edge of the pile cap), the differentialsettlement between GR and pile cap is at a maximum and the load starts to beattracted to the stiffer pile cap, resulting in an increasing pile load A. Subsequently,increasing GR deflection closes the arch (b).
Now, the piece of GR close to the pile behaves in a relatively stiff way because itis ‘attached’ to the pile and can move less freely than the GR in the middle.Another arch therefore starts to develop inside the first one (c). After this, morearches develop, each one smaller than the preceding one (d). Each smaller archexerts a smaller force on its subsurface than the preceding larger arch. The archesgive the directions of the main principal stresses: the major principal stress in thetangential direction and the minor principal stress in the radial direction.The creation of new arches is accompanied by increasing load transfer in thedirection of the piles and a reduction of the load on the GR area between the piles.This results in a more or less inverse triangular load distribution on the GR strip.

Basal Reinforced Piled Embankments
86
The process of arch development terminates in a set of concentric hemisphereswhich Figure 4.10 shows in 3D. The GR is essential in this model because, withoutGR, there will be a more or less even settlement of the area between the piles andthe Concentric Arches cannot develop, as shown with 2D experiments by forexample Hong et al. (2007) and Jenck et al. (2009).
The development of arching in a basal reinforced piled embankment has neverbeen observed through, for example, a glass wall. However, the formation ofsubsequent new Concentric Arches as a result of settlement underground has beenobserved in experiments at the University of Cambridge (Casarin, 2011). In theseexperiments, sand was poured onto a rubber tunnel. The largest differentialsettlements started, in this case, in the centre of the tunnel. In that case, a smallarch in the fill occurred first, followed by a succession of larger arches.
a. b.
c. d.
The theory that base deflection results in Concentric Arches has also been stated byseveral authors presenting numerical analyses. For example, Han et al. (2012)carried out 2D DEM piled embankment analysis and showed (in their Figure 11)force chains that resemble concentric arches, with smaller forces in the smallerarches. Vermeer et al. (2001) found main stress directions following ConcentricArches when they studied the horizontal stress distribution in the soil behind asoldier pile wall. A soldier pile wall of this kind consists of relatively weak timber
Figure 4.9 Increasing GR defection results in an increasing lateral transport of load viaconcentric arch-shaped stress paths and an inverse triangular load distribution on the GR.
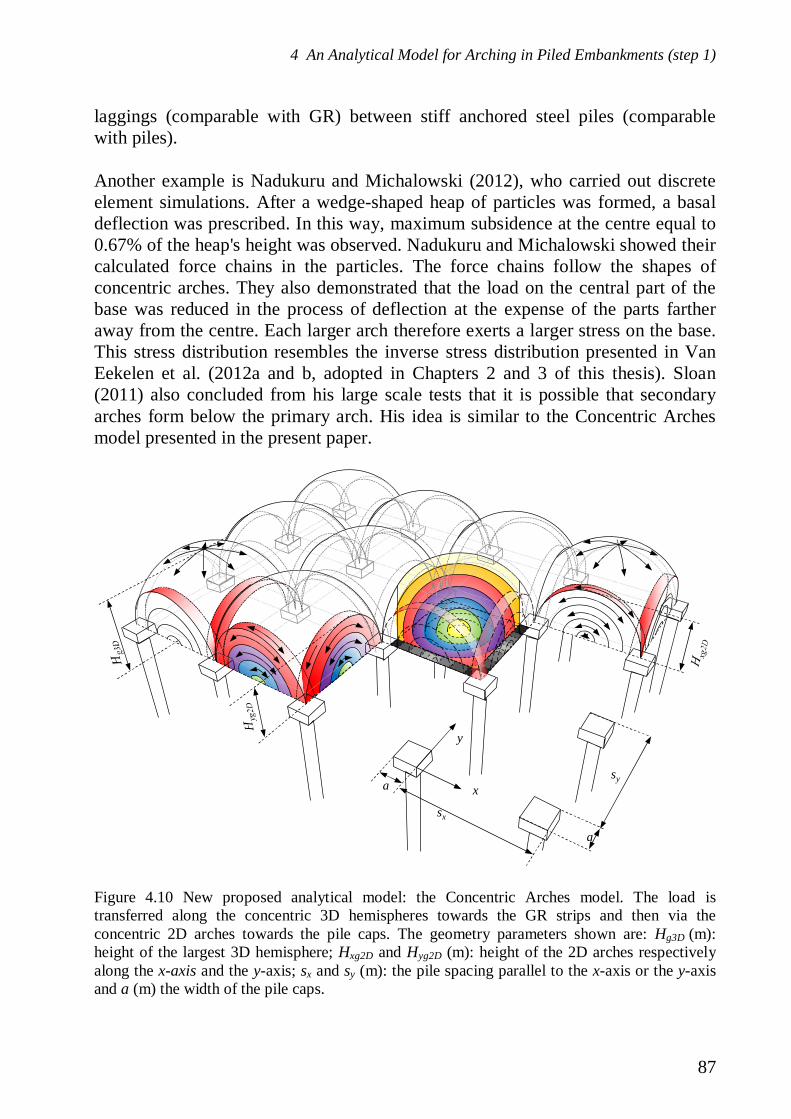
4 An Analytical Model for Arching in Piled Embankments (step 1)
87
laggings (comparable with GR) between stiff anchored steel piles (comparablewith piles).
Another example is Nadukuru and Michalowski (2012), who carried out discreteelement simulations. After a wedge-shaped heap of particles was formed, a basaldeflection was prescribed. In this way, maximum subsidence at the centre equal to0.67% of the heap's height was observed. Nadukuru and Michalowski showed theircalculated force chains in the particles. The force chains follow the shapes ofconcentric arches. They also demonstrated that the load on the central part of thebase was reduced in the process of deflection at the expense of the parts fartheraway from the centre. Each larger arch therefore exerts a larger stress on the base.This stress distribution resembles the inverse stress distribution presented in VanEekelen et al. (2012a and b, adopted in Chapters 2 and 3 of this thesis). Sloan(2011) also concluded from his large scale tests that it is possible that secondaryarches form below the primary arch. His idea is similar to the Concentric Archesmodel presented in the present paper.
x
y
sx
sy
a
a
Figure 4.10 New proposed analytical model: the Concentric Arches model. The load istransferred along the concentric 3D hemispheres towards the GR strips and then via theconcentric 2D arches towards the pile caps. The geometry parameters shown are: Hg3D (m):height of the largest 3D hemisphere; Hxg2D and Hyg2D (m): height of the 2D arches respectivelyalong the x-axis and the y-axis; sx and sy (m): the pile spacing parallel to the x-axis or the y-axisand a (m) the width of the pile caps.
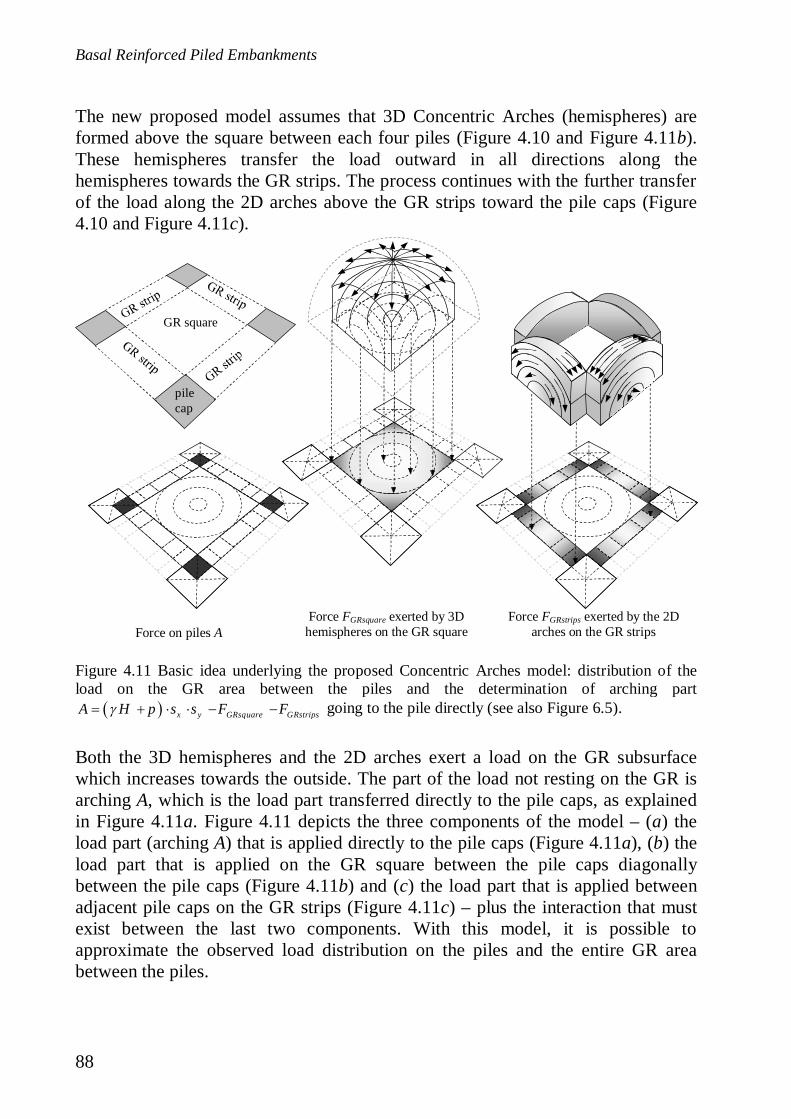
Basal Reinforced Piled Embankments
88
The new proposed model assumes that 3D Concentric Arches (hemispheres) areformed above the square between each four piles (Figure 4.10 and Figure 4.11b).These hemispheres transfer the load outward in all directions along thehemispheres towards the GR strips. The process continues with the further transferof the load along the 2D arches above the GR strips toward the pile caps (Figure4.10 and Figure 4.11c).
Force on piles AForce FGRsquare exerted by 3D
hemispheres on the GR squareForce FGRstrips exerted by the 2D
arches on the GR strips
Both the 3D hemispheres and the 2D arches exert a load on the GR subsurfacewhich increases towards the outside. The part of the load not resting on the GR isarching A, which is the load part transferred directly to the pile caps, as explainedin Figure 4.11a. Figure 4.11 depicts the three components of the model – (a) theload part (arching A) that is applied directly to the pile caps (Figure 4.11a), (b) theload part that is applied on the GR square between the pile caps diagonallybetween the pile caps (Figure 4.11b) and (c) the load part that is applied betweenadjacent pile caps on the GR strips (Figure 4.11c) – plus the interaction that mustexist between the last two components. With this model, it is possible toapproximate the observed load distribution on the piles and the entire GR areabetween the piles.
pilecap
GR square
Figure 4.11 Basic idea underlying the proposed Concentric Arches model: distribution of theload on the GR area between the piles and the determination of arching part
x y GRsquare GRstripsA H p s s F F going to the pile directly (see also Figure 6.5).
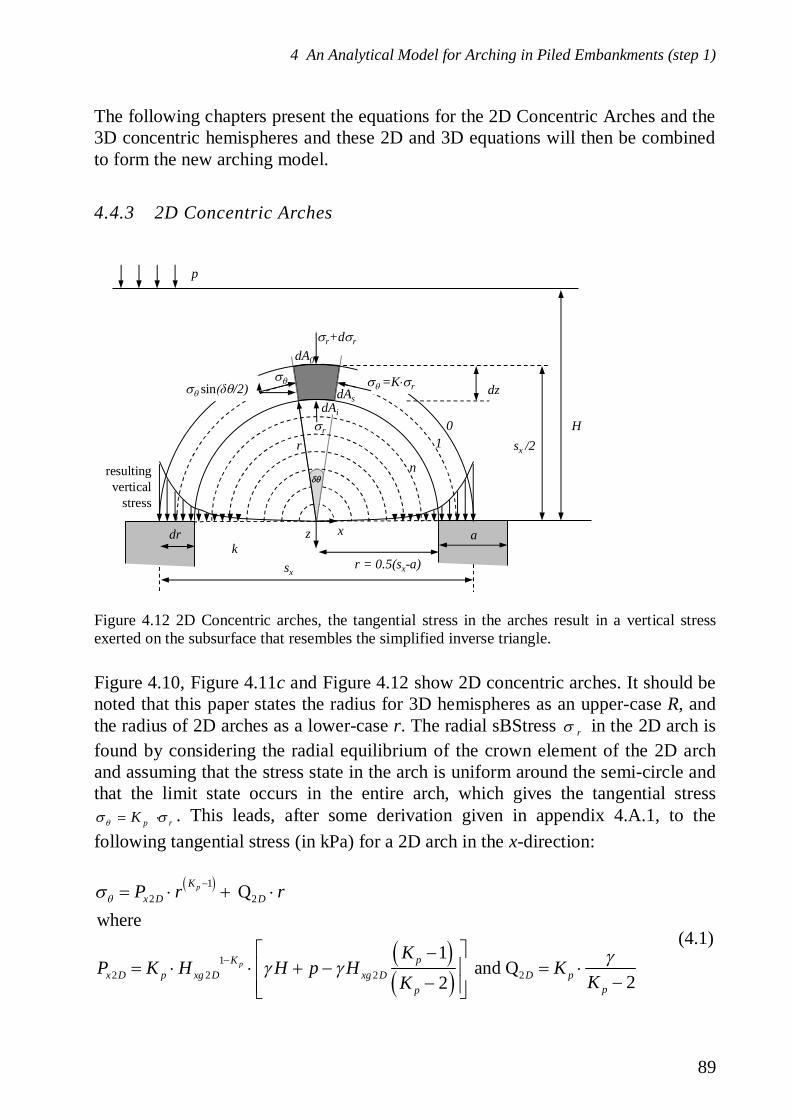
4 An Analytical Model for Arching in Piled Embankments (step 1)
89
The following chapters present the equations for the 2D Concentric Arches and the3D concentric hemispheres and these 2D and 3D equations will then be combinedto form the new arching model.
4.4.3 2D Concentric Arches
Figure 4.10, Figure 4.11c and Figure 4.12 show 2D concentric arches. It should benoted that this paper states the radius for 3D hemispheres as an upper-case R, andthe radius of 2D arches as a lower-case r. The radial sBStress r in the 2D arch isfound by considering the radial equilibrium of the crown element of the 2D archand assuming that the stress state in the arch is uniform around the semi-circle andthat the limit state occurs in the entire arch, which gives the tangential stress
p rK . This leads, after some derivation given in appendix 4.A.1, to thefollowing tangential stress (in kPa) for a 2D arch in the x-direction:
12 2
12 2 2 2
Qwhere
1 and Q
22
p
p
Kx D D
pKx D p xg D xg D D p
pp
P r r
KP K H H p H K
KK
(4.1)
dA0
dAs
r+d r
z
r 01
n
k
p
Hsx /2
x
dz
adr
r = 0.5(sx-a)
sin /2) =K r
resultingvertical
stress
sx
dAi
r
Figure 4.12 2D Concentric arches, the tangential stress in the arches result in a vertical stressexerted on the subsurface that resembles the simplified inverse triangle.
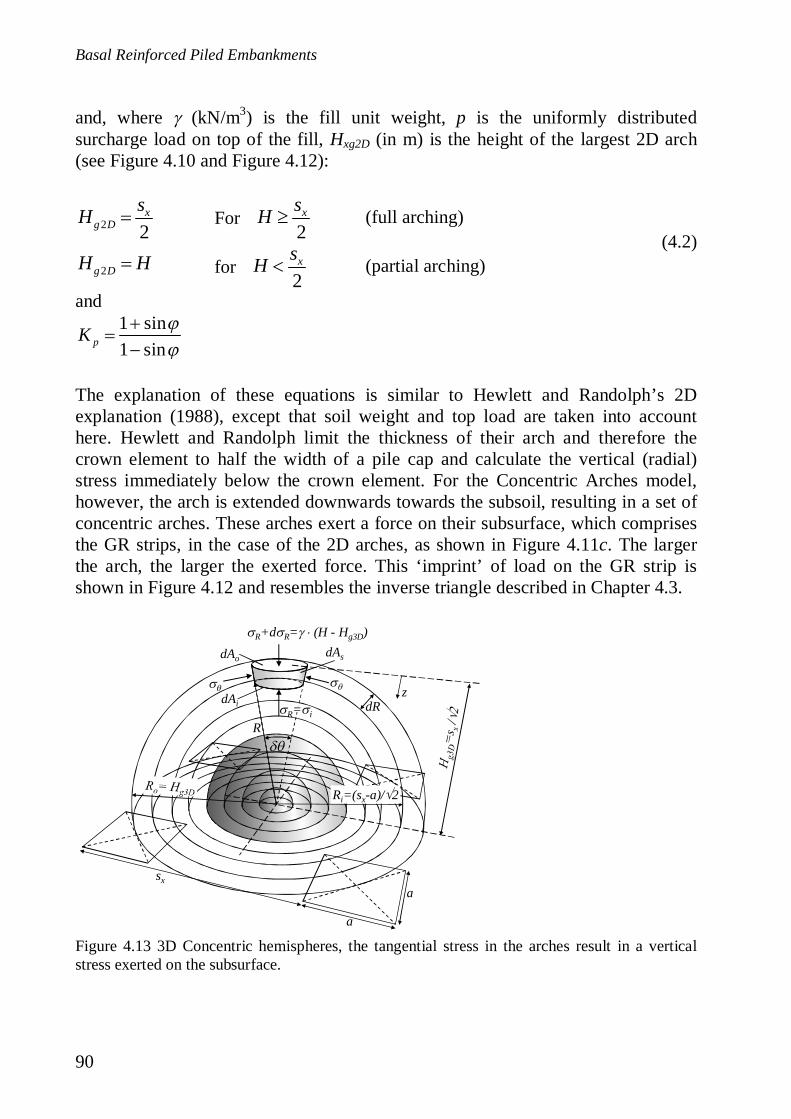
Basal Reinforced Piled Embankments
90
and, where (kN/m3) is the fill unit weight, p is the uniformly distributedsurcharge load on top of the fill, Hxg2D (in m) is the height of the largest 2D arch(see Figure 4.10 and Figure 4.12):
2 2x
g DsH For
2xsH (full arching)
(4.2)2g DH H for
2xsH (partial arching)
and1 sin1 sinpK
The explanation of these equations is similar to Hewlett and Randolph’s 2Dexplanation (1988), except that soil weight and top load are taken into accounthere. Hewlett and Randolph limit the thickness of their arch and therefore thecrown element to half the width of a pile cap and calculate the vertical (radial)stress immediately below the crown element. For the Concentric Arches model,however, the arch is extended downwards towards the subsoil, resulting in a set ofconcentric arches. These arches exert a force on their subsurface, which comprisesthe GR strips, in the case of the 2D arches, as shown in Figure 4.11c. The largerthe arch, the larger the exerted force. This ‘imprint’ of load on the GR strip isshown in Figure 4.12 and resembles the inverse triangle described in Chapter 4.3.
R+d R= (H - Hg3D)
a
sx
z
dAo
dAi
dAs
R= idR
R
a
Ri=(sx-a)/ 2
Figure 4.13 3D Concentric hemispheres, the tangential stress in the arches result in a verticalstress exerted on the subsurface.
4 An Analytical Model for Arching in Piled Embankments (step 1)
91
4.4.4 3D concentric hemispheres
Figure 4.10, Figure 4.11b and Figure 4.13 show 3D concentric hemispheres. Thetangential stress (kPa) in the 3D arches is found in a similar way as for the 2Darches, as explained in appendix 4.A.2,
2 1( 0) 3 3
2 23 3 3 3
Q
where
2 2 and Q
2 3 2 3
p
p
Kp D D
K pD p g D g D D p
p p
P R R
KP K H H H K
K K
(4.3)
and where Kp is given by equation (4.2) and Hg3D (m) by:
3 2d
g DsH for
2dsH full arching
(4.4)3g DH H for
2dsH partial arching
With surcharge load p (kPa) the tangential stress (kPa) becomes (analogous toHewlett and Randolph, 1988; Zaeske, 2001):
2 13 3QpK
D DH z p
P R RH z
(4.5)
Where z is the vertical distance between the considered point and the GR. So far,the explanation of the 3D equations is the same as Hewlett and Randolph’s (1988).Hewlett and Randolph now limit the thickness of the arch and therefore the crownelement to half the diagonal of a pile cap and calculate the vertical (radial) stressimmediately below the crown element which gives Hewlett and Randolph’sequation (10) (1988).
In the concentric hemispheres model, however, the arch is extended downwardstowards the subsoil, resulting in a set of concentric hemispheres. Thesehemispheres exert a force on their subsurface. The larger the radius, the larger theforce exerted on the subsurface.
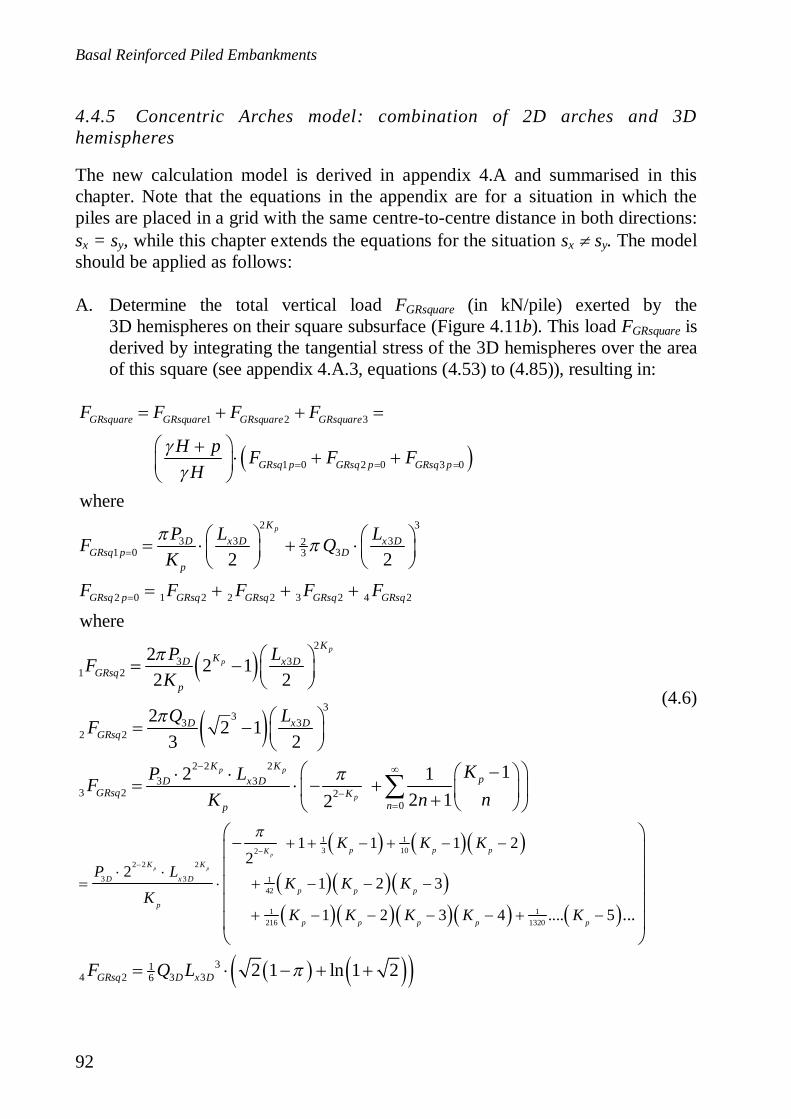
Basal Reinforced Piled Embankments
92
4.4.5 Concentric Arches model: combination of 2D arches and 3Dhemispheres
The new calculation model is derived in appendix 4.A and summarised in thischapter. Note that the equations in the appendix are for a situation in which thepiles are placed in a grid with the same centre-to-centre distance in both directions:sx = sy, while this chapter extends the equations for the situation sx sy. The modelshould be applied as follows:
A. Determine the total vertical load FGRsquare (in kN/pile) exerted by the3D hemispheres on their square subsurface (Figure 4.11b). This load FGRsquare isderived by integrating the tangential stress of the 3D hemispheres over the areaof this square (see appendix 4.A.3, equations (4.53) to (4.85)), resulting in:
1 2 3
1 0 2 0 3 0
2 33 3 32
1 0 33
2 0 1 2 2 2 3 2 4 2
31 2
where
2 2
where
2
p
GRsquare GRsquare GRsquare GRsquare
GRsq p GRsq p GRsq p
KD x D x D
GRsq p Dp
GRsq p GRsq GRsq GRsq GRsq
GRsq
F F F F
H p F F FH
P L LF QK
F F F F F
PF
1 13 102
2 2 2
3 3 142
1216
23
333 3
2 2
2 2 23 3
3 2 20
1 1 1 22
21 2 3
1 2 3
2 12 2
2 2 13 2
12 12 12
p
p p
pp
p p
p
p p pK
K K
D x Dp p p
p
p p p
KKD x D
p
D x DGRsq
K KpD x D
GRsq Knp
K K K
P LK K K
KK K K
LK
Q LF
KP LFnK n
11320
314 2 3 36
4 .... 5 ...
2 1 ln 1 2
p p
GRsq D x D
K K
F Q L
(4.6)
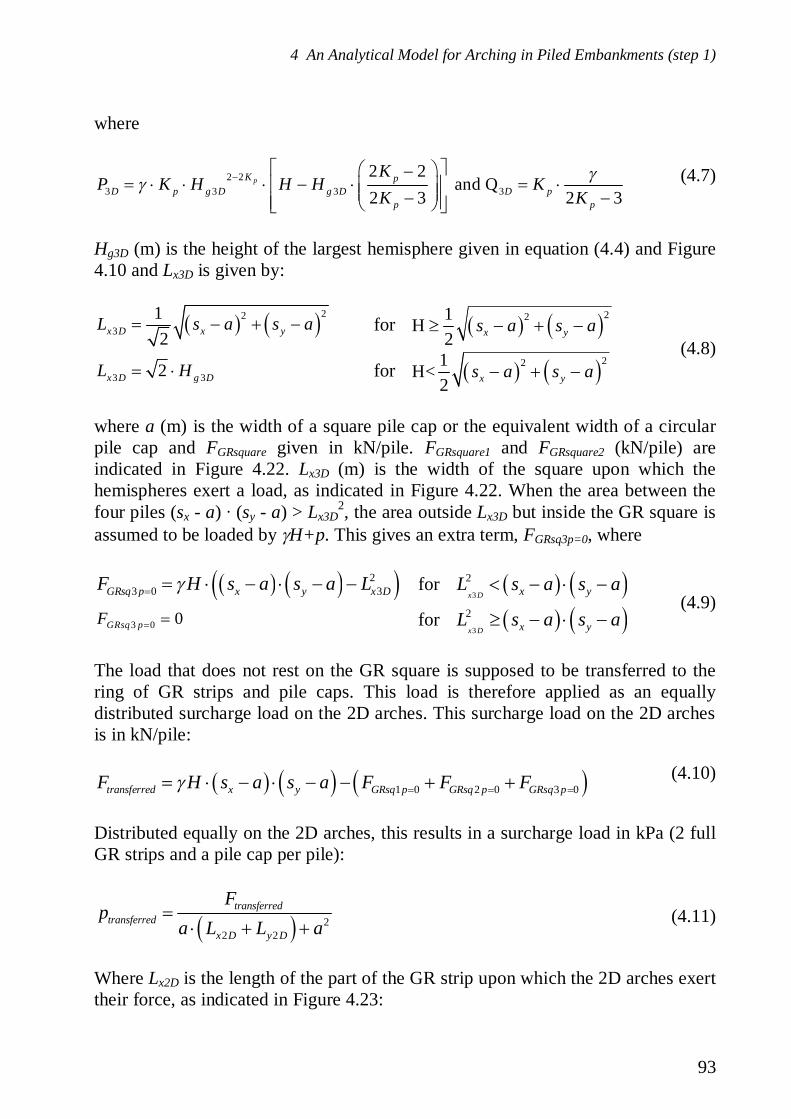
4 An Analytical Model for Arching in Piled Embankments (step 1)
93
where
2 23 3 3 3
2 2 and Q
2 3 2 3pK p
D p g D g D D pp p
KP K H H H K
K K(4.7)
Hg3D (m) is the height of the largest hemisphere given in equation (4.4) and Figure4.10 and Lx3D is given by:
223
12x D x yL s a s a for
221H2 x ys a s a
(4.8)3 32x D g DL H for
221H<2 x ys a s a
where a (m) is the width of a square pile cap or the equivalent width of a circularpile cap and FGRsquare given in kN/pile. FGRsquare1 and FGRsquare2 (kN/pile) areindicated in Figure 4.22. Lx3D (m) is the width of the square upon which thehemispheres exert a load, as indicated in Figure 4.22. When the area between thefour piles (sx - a) (sy - a) > Lx3D
2, the area outside Lx3D but inside the GR square isassumed to be loaded by H+p. This gives an extra term, FGRsq3p=0, where
23 0 3GRsq p x y x DF H s a s a L for
3
2x D x yL s a s a
(4.9)3 0 0GRsq pF for
3
2x D x yL s a s a
The load that does not rest on the GR square is supposed to be transferred to thering of GR strips and pile caps. This load is therefore applied as an equallydistributed surcharge load on the 2D arches. This surcharge load on the 2D archesis in kN/pile:
1 0 2 0 3 0transferred x y GRsq p GRsq p GRsq pF H s a s a F F F (4.10)
Distributed equally on the 2D arches, this results in a surcharge load in kPa (2 fullGR strips and a pile cap per pile):
22 2
transferredtransferred
x D y D
Fp
a L L a (4.11)
Where Lx2D is the length of the part of the GR strip upon which the 2D arches exerttheir force, as indicated in Figure 4.23:
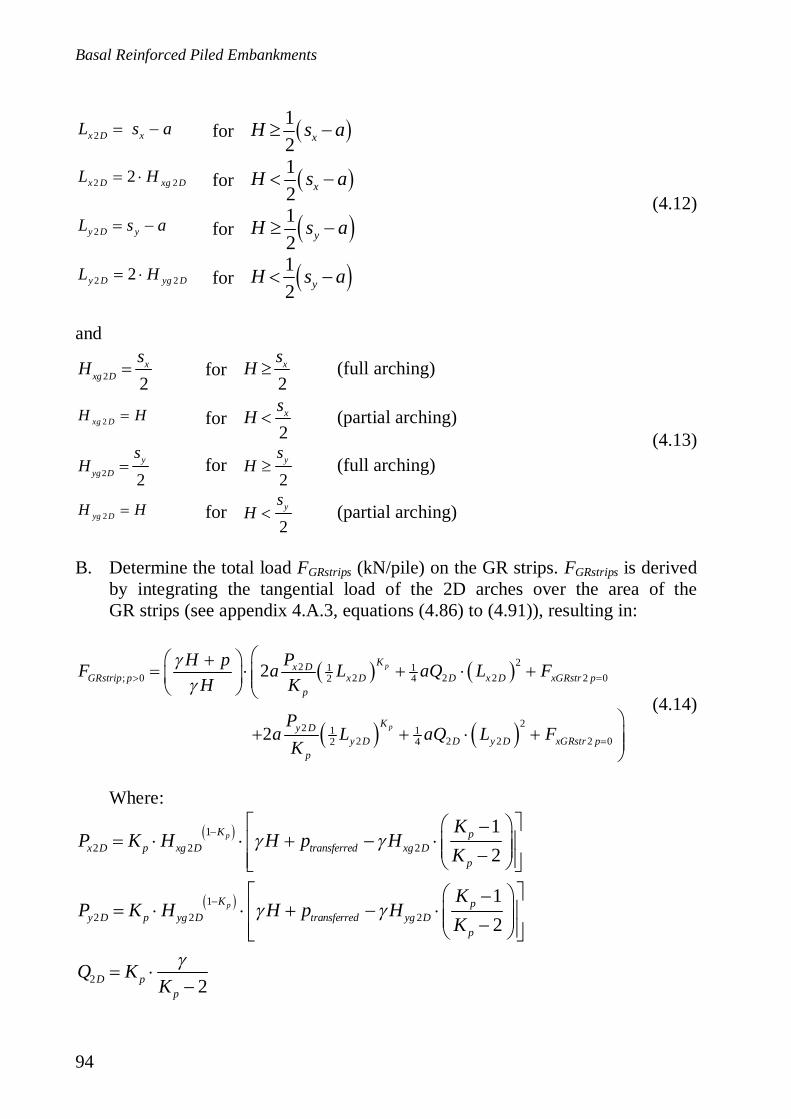
Basal Reinforced Piled Embankments
94
2x D xL s a for12 xH s a
(4.12)2 22x D xg DL H for
12 xH s a
2y D yL s a for12 yH s a
2 22y D yg DL H for12 yH s a
and
2 2x
xg D
sH for
2xs
H (full arching)
(4.13)2xg DH H for
2xs
H (partial arching)
2 2y
yg D
sH for
2ys
H (full arching)
2yg DH H for2
ysH (partial arching)
B. Determine the total load FGRstrips (kN/pile) on the GR strips. FGRstrips is derivedby integrating the tangential load of the 2D arches over the area of theGR strips (see appendix 4.A.3, equations (4.86) to (4.91)), resulting in:
22 1 1; 0 2 2 2 2 02 4
22 1 12 2 2 2 02 4
2
2
p
p
Kx DGRstrip p x D D x D xGRstr p
p
Ky Dy D D y D xGRstr p
p
H p PF a L aQ L FH K
Pa L aQ L F
K
(4.14)
Where:
12 2 2
12 2 2
2
12
12
2
p
p
K px D p xg D transferred xg D
p
K py D p yg D transferred yg D
p
D pp
KP K H H p H
K
KP K H H p H
K
Q KK

4 An Analytical Model for Arching in Piled Embankments (step 1)
95
2 0 2xGRstr p x x DF Ha s a L for 12 xH s a
2 0 0GRstr pF for 12 xH s a
2 0 2yGRstr p y y DF Ha s a L for 12 yH s a
2 0 0GRstr pF for 12 yH s a
And where Lx2D and Ly2D are given in equation (4.12). A practical limitation is aminimum embankment height of 0.5 xH s and 0.5 yH s , so that the2D arches always have enough height to develop fully. Furthermore, the largest2D arches are wide enough to rest on the pile caps, as the width of the largest archis equal to sx or sy. Figure 4.14 shows that this requirement is not additional toEBGEO (2010) and CUR226 (2010) and only increases the minimum height in alimited, less realistic, number of cases for the British Standard (BS8006, 2010).However, the equations for the case , 0.5 x yH s are stated here for calculations forthe construction phase.
C. Determine the load distribution. The part transferred to the piles directly(arching A in kN/pile) is:
pile x y GRsquare GRstripsA F H p s s F F (4.15)
0.0
0.5
1.0
1.5
2.0
2.5
3.0
1.0 1.5 2.0 2.5 3.0
min
imum
emba
nkm
enth
eigh
tH(m
)
centre-to-centre distance piles sx (m)
pile cap width a = 0.5 m
0.0
0.5
1.0
1.5
2.0
2.5
0.25 0.50 0.75 1.00
min
imum
emba
nkm
enth
eigh
tH(m
)
width of pile cap a (m)
centre-to-centre distancepiles sx = 2.25 m
BS8006 H 0.7(sx-a)EBGEO H 0.8(sd-d)CUR226 H 0.66(sd-d)concentric arches H 0.5sx
Figure 4.14 Comparison of required minimum embankment heights for the new ConcentricArches model, BS8006 (2010), EBGEO (2010) and CUR226 (2010).
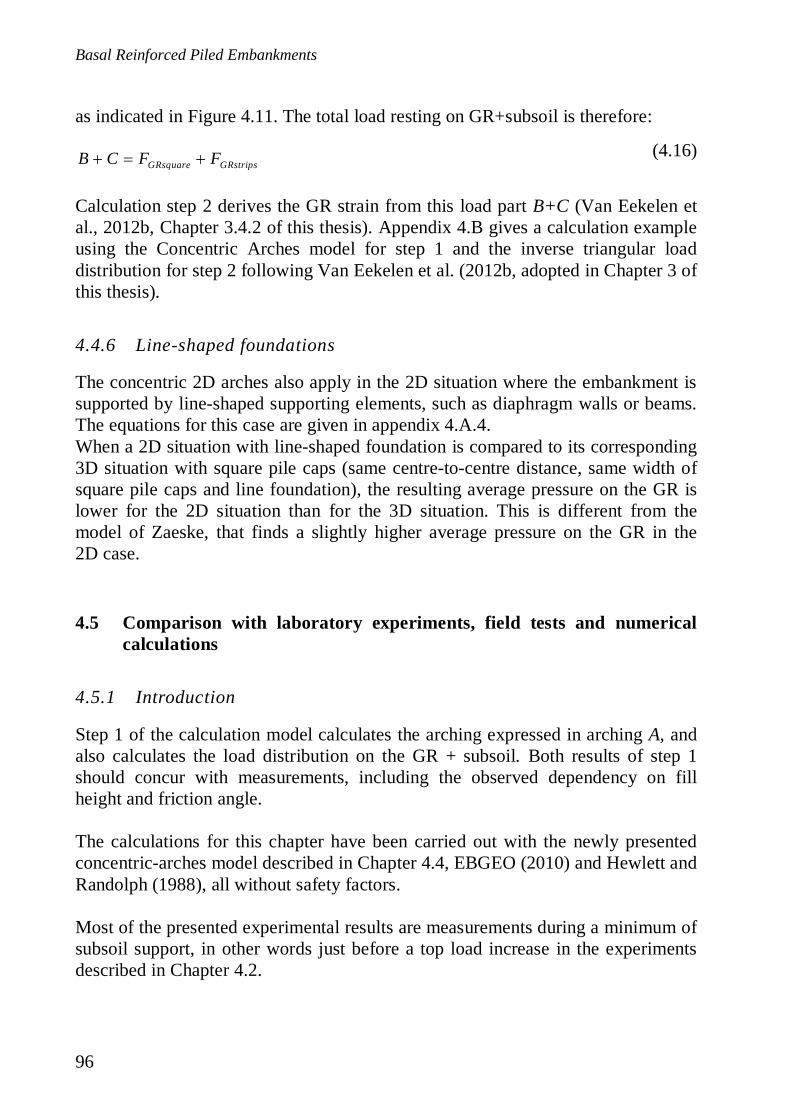
Basal Reinforced Piled Embankments
96
as indicated in Figure 4.11. The total load resting on GR+subsoil is therefore:
GRsquare GRstripsB C F F (4.16)
Calculation step 2 derives the GR strain from this load part B+C (Van Eekelen etal., 2012b, Chapter 3.4.2 of this thesis). Appendix 4.B gives a calculation exampleusing the Concentric Arches model for step 1 and the inverse triangular loaddistribution for step 2 following Van Eekelen et al. (2012b, adopted in Chapter 3 ofthis thesis).
4.4.6 Line-shaped foundations
The concentric 2D arches also apply in the 2D situation where the embankment issupported by line-shaped supporting elements, such as diaphragm walls or beams.The equations for this case are given in appendix 4.A.4.When a 2D situation with line-shaped foundation is compared to its corresponding3D situation with square pile caps (same centre-to-centre distance, same width ofsquare pile caps and line foundation), the resulting average pressure on the GR islower for the 2D situation than for the 3D situation. This is different from themodel of Zaeske, that finds a slightly higher average pressure on the GR in the2D case.
4.5 Comparison with laboratory experiments, field tests and numericalcalculations
4.5.1 Introduction
Step 1 of the calculation model calculates the arching expressed in arching A, andalso calculates the load distribution on the GR + subsoil. Both results of step 1should concur with measurements, including the observed dependency on fillheight and friction angle.
The calculations for this chapter have been carried out with the newly presentedconcentric-arches model described in Chapter 4.4, EBGEO (2010) and Hewlett andRandolph (1988), all without safety factors.
Most of the presented experimental results are measurements during a minimum ofsubsoil support, in other words just before a top load increase in the experimentsdescribed in Chapter 4.2.
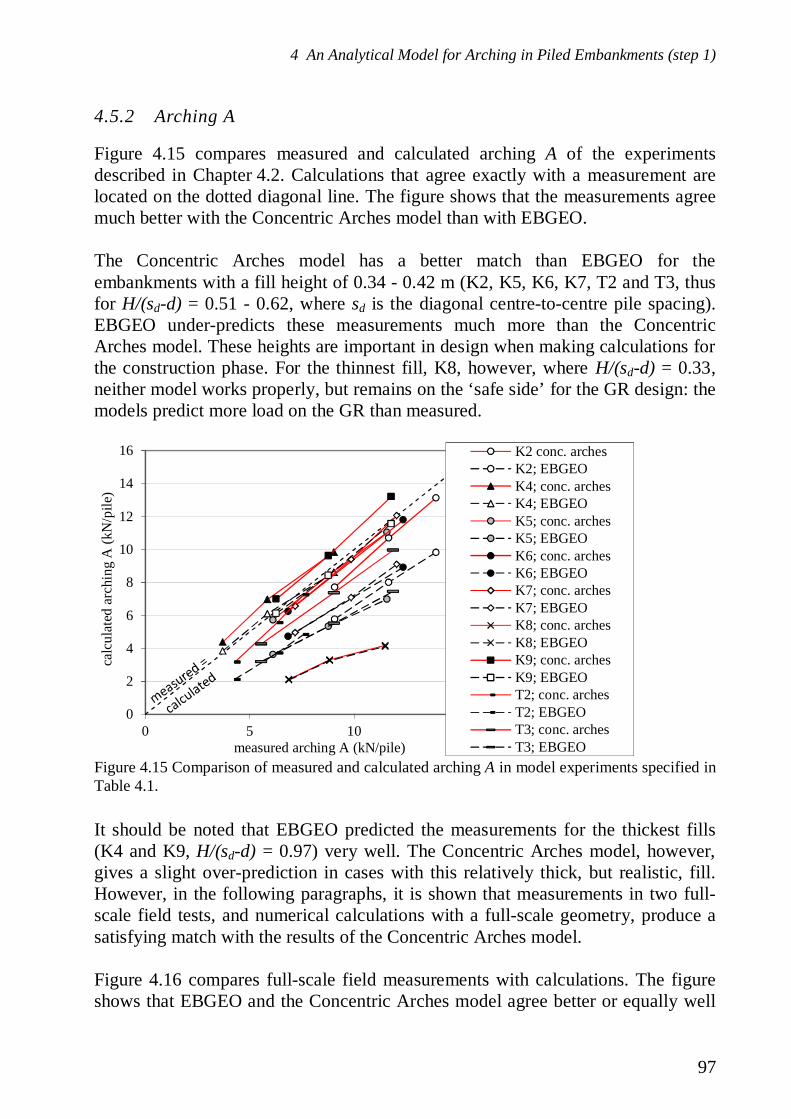
4 An Analytical Model for Arching in Piled Embankments (step 1)
97
4.5.2 Arching A
Figure 4.15 compares measured and calculated arching A of the experimentsdescribed in Chapter 4.2. Calculations that agree exactly with a measurement arelocated on the dotted diagonal line. The figure shows that the measurements agreemuch better with the Concentric Arches model than with EBGEO.
The Concentric Arches model has a better match than EBGEO for theembankments with a fill height of 0.34 - 0.42 m (K2, K5, K6, K7, T2 and T3, thusfor H/(sd-d) = 0.51 - 0.62, where sd is the diagonal centre-to-centre pile spacing).EBGEO under-predicts these measurements much more than the ConcentricArches model. These heights are important in design when making calculations forthe construction phase. For the thinnest fill, K8, however, where H/(sd-d) = 0.33,neither model works properly, but remains on the ‘safe side’ for the GR design: themodels predict more load on the GR than measured.
It should be noted that EBGEO predicted the measurements for the thickest fills(K4 and K9, H/(sd-d) = 0.97) very well. The Concentric Arches model, however,gives a slight over-prediction in cases with this relatively thick, but realistic, fill.However, in the following paragraphs, it is shown that measurements in two full-scale field tests, and numerical calculations with a full-scale geometry, produce asatisfying match with the results of the Concentric Arches model.
Figure 4.16 compares full-scale field measurements with calculations. The figureshows that EBGEO and the Concentric Arches model agree better or equally well
0
2
4
6
8
10
12
14
16
0 5 10 15
calc
ulat
edar
chin
gA
(kN
/pile
)
measured arching A (kN/pile)
K2 conc. archesK2; EBGEOK4; conc. archesK4; EBGEOK5; conc. archesK5; EBGEOK6; conc. archesK6; EBGEOK7; conc. archesK7; EBGEOK8; conc. archesK8; EBGEOK9; conc. archesK9; EBGEOT2; conc. archesT2; EBGEOT3; conc. archesT3; EBGEO
Figure 4.15 Comparison of measured and calculated arching A in model experiments specified inTable 4.1.
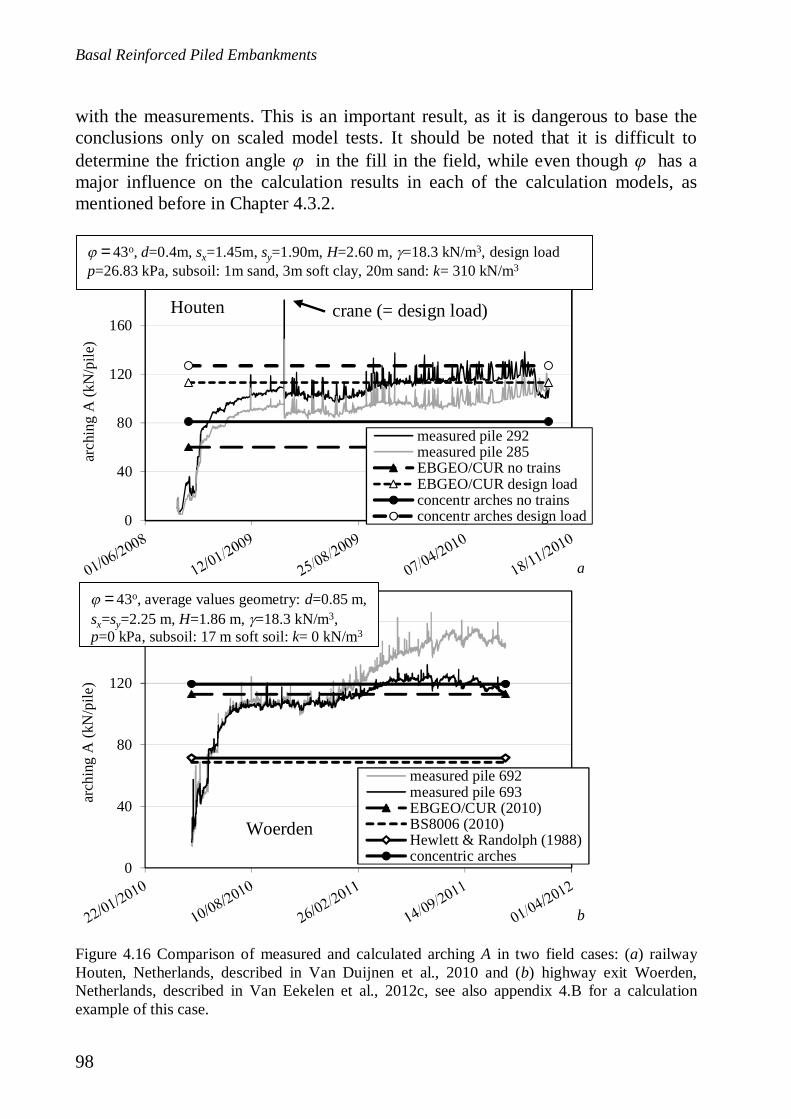
Basal Reinforced Piled Embankments
98
with the measurements. This is an important result, as it is dangerous to base theconclusions only on scaled model tests. It should be noted that it is difficult todetermine the friction angle in the fill in the field, while even though has amajor influence on the calculation results in each of the calculation models, asmentioned before in Chapter 4.3.2.
0
40
80
120
160
200
arch
ing
A(k
N/p
ile)
measured pile 292measured pile 285EBGEO/CUR no trainsEBGEO/CUR design loadconcentr arches no trainsconcentr arches design load
crane (= design load)
= 43o, d=0.4m, sx=1.45m, sy=1.90m, H=2.60 m, =18.3 kN/m3, design loadp=26.83 kPa, subsoil: 1m sand, 3m soft clay, 20m sand: k= 310 kN/m3
Houten
a
0
40
80
120
160
arch
ing
A(k
N/p
ile)
measured pile 692measured pile 693EBGEO/CUR (2010)BS8006 (2010)Hewlett & Randolph (1988)concentric arches
Woerden
= 43o, average values geometry: d=0.85 m,sx=sy=2.25 m, H=1.86 m, =18.3 kN/m3,p=0 kPa, subsoil: 17 m soft soil: k= 0 kN/m3
b
Figure 4.16 Comparison of measured and calculated arching A in two field cases: (a) railwayHouten, Netherlands, described in Van Duijnen et al., 2010 and (b) highway exit Woerden,Netherlands, described in Van Eekelen et al., 2012c, see also appendix 4.B for a calculationexample of this case.
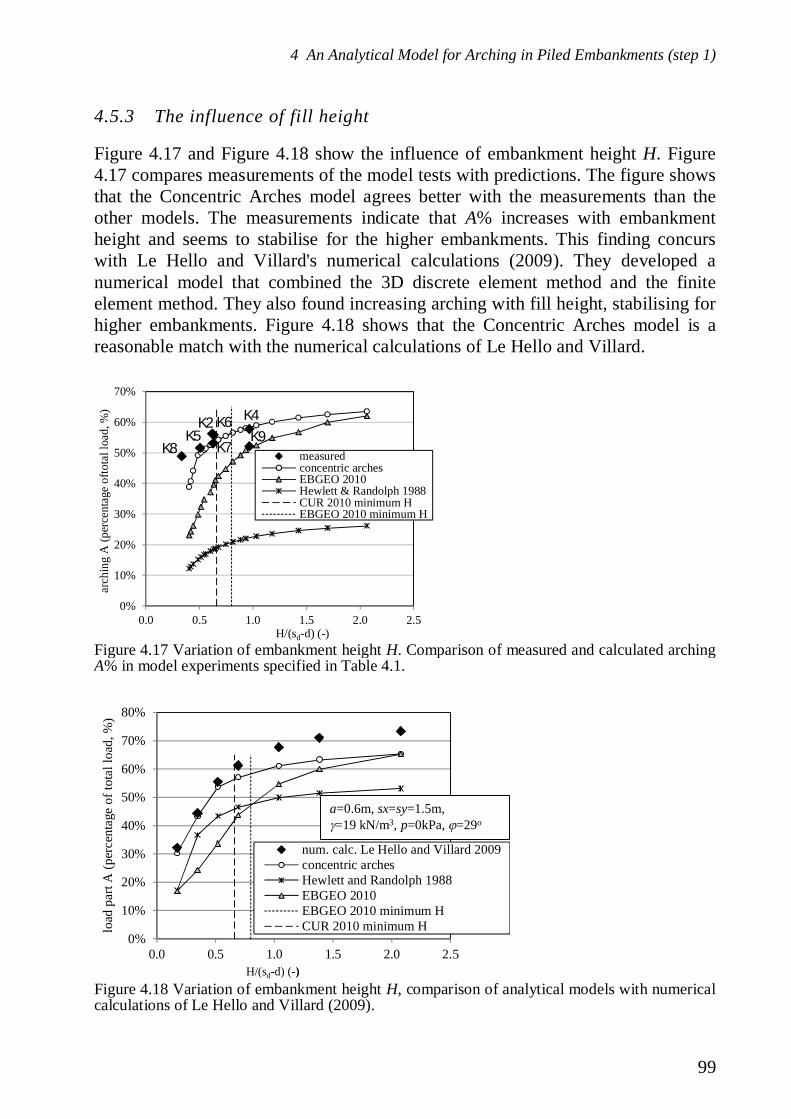
4 An Analytical Model for Arching in Piled Embankments (step 1)
99
4.5.3 The influence of fill height
Figure 4.17 and Figure 4.18 show the influence of embankment height H. Figure4.17 compares measurements of the model tests with predictions. The figure showsthat the Concentric Arches model agrees better with the measurements than theother models. The measurements indicate that A% increases with embankmentheight and seems to stabilise for the higher embankments. This finding concurswith Le Hello and Villard's numerical calculations (2009). They developed anumerical model that combined the 3D discrete element method and the finiteelement method. They also found increasing arching with fill height, stabilising forhigher embankments. Figure 4.18 shows that the Concentric Arches model is areasonable match with the numerical calculations of Le Hello and Villard.
0%
10%
20%
30%
40%
50%
60%
70%
0.0 0.5 1.0 1.5 2.0 2.5
arch
ing
A(p
erce
ntag
eof
tota
lloa
d,%
)
H/(sd-d) (-)
measuredconcentric archesEBGEO 2010Hewlett & Randolph 1988CUR 2010 minimum HEBGEO 2010 minimum H
K8K5
K2K9
K4
K7
K6
0%
10%
20%
30%
40%
50%
60%
70%
80%
0.0 0.5 1.0 1.5 2.0 2.5
load
part
A(p
erce
ntag
eof
tota
lloa
d,%
)
H/(sd-d) (-)
num. calc. Le Hello and Villard 2009concentric archesHewlett and Randolph 1988EBGEO 2010EBGEO 2010 minimum HCUR 2010 minimum H
a=0.6m, sx=sy=1.5m,=19 kN/m3, p=0kPa, =29o
Figure 4.17 Variation of embankment height H. Comparison of measured and calculated archingA% in model experiments specified in Table 4.1.
Figure 4.18 Variation of embankment height H, comparison of analytical models with numericalcalculations of Le Hello and Villard (2009).
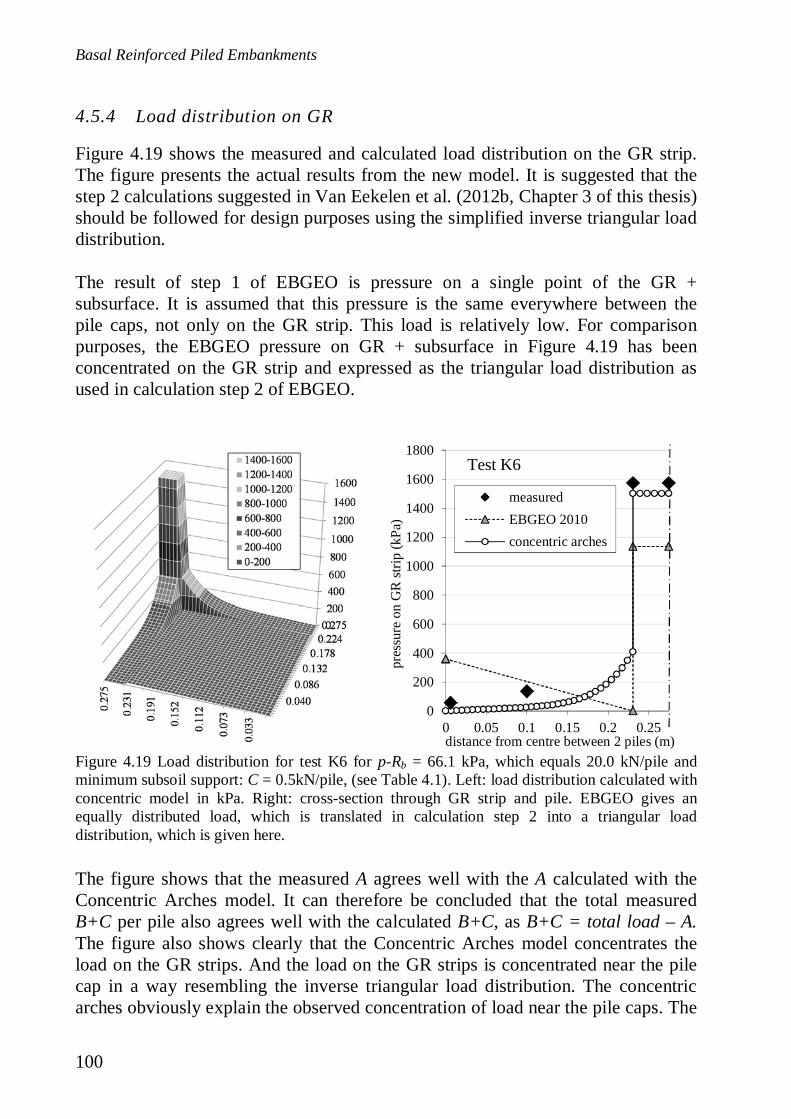
Basal Reinforced Piled Embankments
100
4.5.4 Load distribution on GR
Figure 4.19 shows the measured and calculated load distribution on the GR strip.The figure presents the actual results from the new model. It is suggested that thestep 2 calculations suggested in Van Eekelen et al. (2012b, Chapter 3 of this thesis)should be followed for design purposes using the simplified inverse triangular loaddistribution.
The result of step 1 of EBGEO is pressure on a single point of the GR +subsurface. It is assumed that this pressure is the same everywhere between thepile caps, not only on the GR strip. This load is relatively low. For comparisonpurposes, the EBGEO pressure on GR + subsurface in Figure 4.19 has beenconcentrated on the GR strip and expressed as the triangular load distribution asused in calculation step 2 of EBGEO.
The figure shows that the measured A agrees well with the A calculated with theConcentric Arches model. It can therefore be concluded that the total measuredB+C per pile also agrees well with the calculated B+C, as B+C = total load – A.The figure also shows clearly that the Concentric Arches model concentrates theload on the GR strips. And the load on the GR strips is concentrated near the pilecap in a way resembling the inverse triangular load distribution. The concentricarches obviously explain the observed concentration of load near the pile caps. The
0
200
400
600
800
1000
1200
1400
1600
1800
0 0.05 0.1 0.15 0.2 0.25
pres
sure
onG
Rst
rip(k
Pa)
distance from centre between 2 piles (m)
Test K6
measuredEBGEO 2010concentric arches
Figure 4.19 Load distribution for test K6 for p-Rb = 66.1 kPa, which equals 20.0 kN/pile andminimum subsoil support: C = 0.5kN/pile, (see Table 4.1). Left: load distribution calculated withconcentric model in kPa. Right: cross-section through GR strip and pile. EBGEO gives anequally distributed load, which is translated in calculation step 2 into a triangular loaddistribution, which is given here.
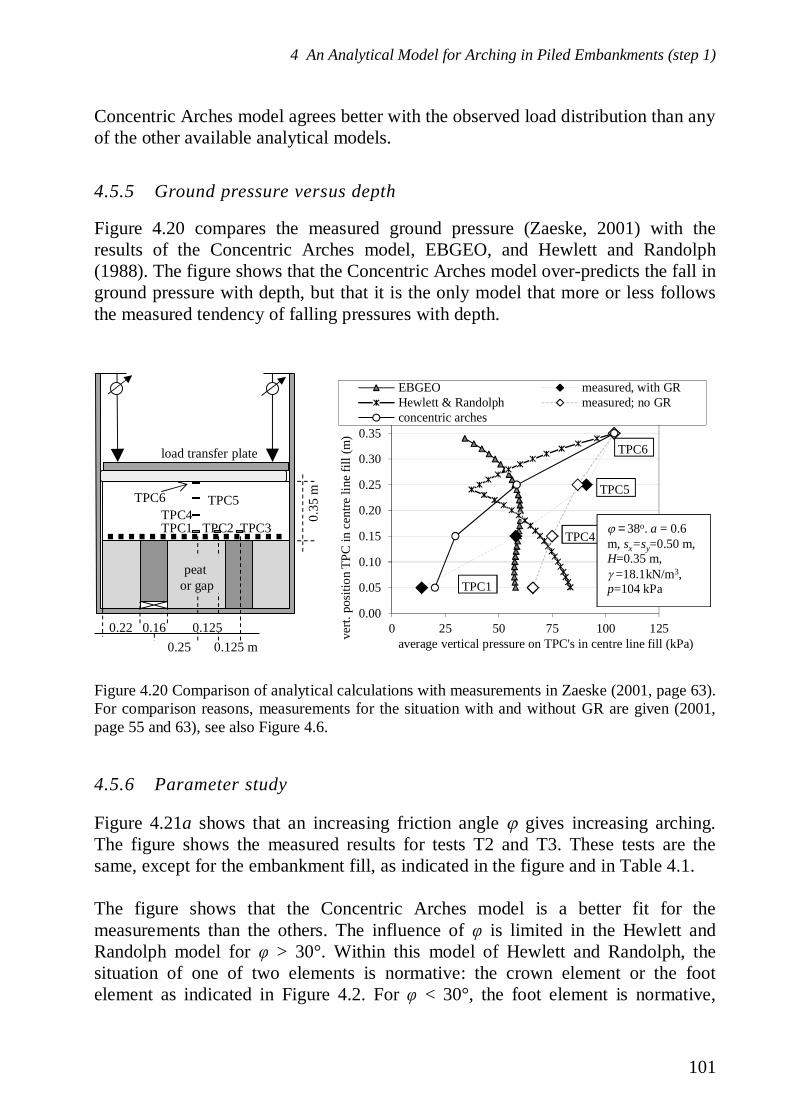
4 An Analytical Model for Arching in Piled Embankments (step 1)
101
Concentric Arches model agrees better with the observed load distribution than anyof the other available analytical models.
4.5.5 Ground pressure versus depth
Figure 4.20 compares the measured ground pressure (Zaeske, 2001) with theresults of the Concentric Arches model, EBGEO, and Hewlett and Randolph(1988). The figure shows that the Concentric Arches model over-predicts the fall inground pressure with depth, but that it is the only model that more or less followsthe measured tendency of falling pressures with depth.
4.5.6 Parameter study
Figure 4.21a shows that an increasing friction angle gives increasing arching.The figure shows the measured results for tests T2 and T3. These tests are thesame, except for the embankment fill, as indicated in the figure and in Table 4.1.
The figure shows that the Concentric Arches model is a better fit for themeasurements than the others. The influence of is limited in the Hewlett andRandolph model for > 30°. Within this model of Hewlett and Randolph, thesituation of one of two elements is normative: the crown element or the footelement as indicated in Figure 4.2. For < 30°, the foot element is normative,
TPC2 TPC3TPC1
TPC6 TPC5TPC4 0.
35m
load transfer plate
0.25 0.125 m
peator gap
0.22 0.16 0.1250.00
0.05
0.10
0.15
0.20
0.25
0.30
0.35
0.40
0 25 50 75 100 125vert.
posi
tion
TPC
ince
ntre
line
fill(
m)
average vertical pressure on TPC's in centre line fill (kPa)
EBGEO measured, with GRHewlett & Randolph measured; no GRconcentric arches
TPC6
TPC5
TPC4
TPC1
= 38o. a = 0.6m, sx=sy=0.50 m,H=0.35 m,
=18.1kN/m3,p=104 kPa
Figure 4.20 Comparison of analytical calculations with measurements in Zaeske (2001, page 63).For comparison reasons, measurements for the situation with and without GR are given (2001,page 55 and 63), see also Figure 4.6.
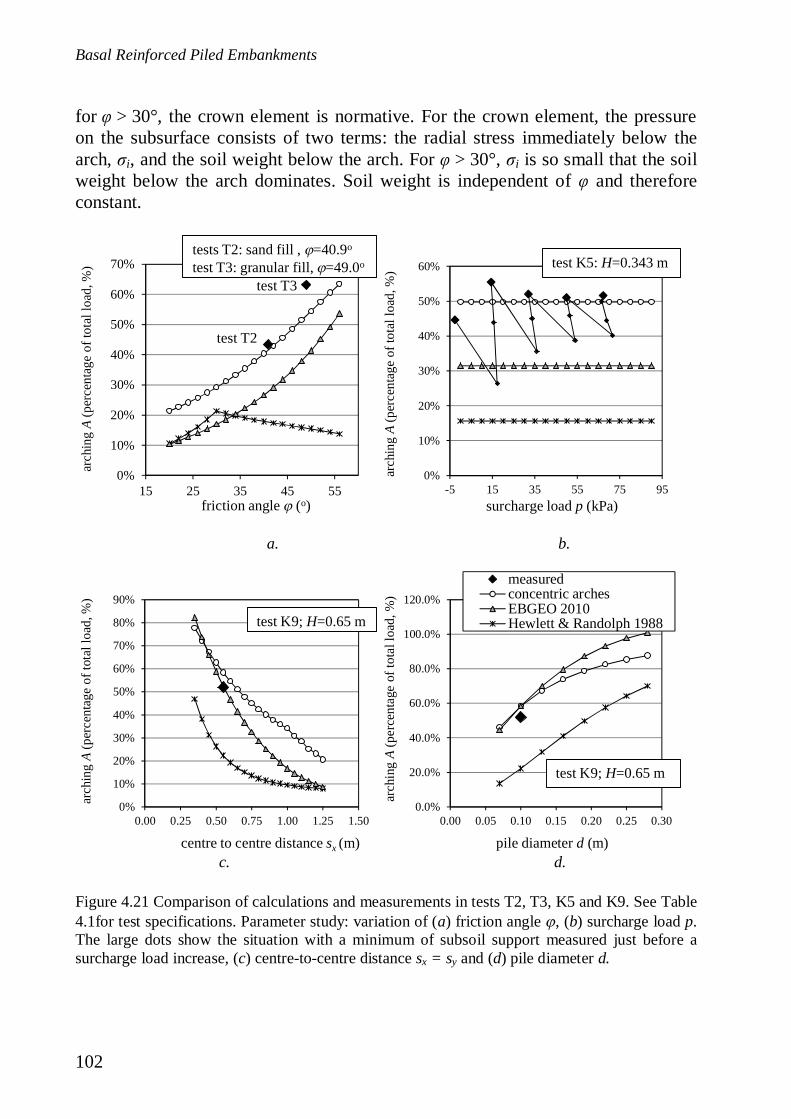
Basal Reinforced Piled Embankments
102
for > 30°, the crown element is normative. For the crown element, the pressureon the subsurface consists of two terms: the radial stress immediately below thearch, i, and the soil weight below the arch. For > 30°, i is so small that the soilweight below the arch dominates. Soil weight is independent of and thereforeconstant.
a. b.
c. d.
0%
10%
20%
30%
40%
50%
60%
70%
15 25 35 45 55
arch
ing
A(p
erce
ntag
eof
tota
lloa
d,%
)
friction angle (o)
tests T2: sand fill , =40.9o
test T3: granular fill, =49.0o
test T3
test T2
0%
10%
20%
30%
40%
50%
60%
-5 15 35 55 75 95
arch
ing
A(p
erce
ntag
eof
tota
lloa
d,%
)
surcharge load p (kPa)
test K5: H=0.343 m
0%
10%
20%
30%
40%
50%
60%
70%
80%
90%
0.00 0.25 0.50 0.75 1.00 1.25 1.50
arch
ing
A(p
erce
ntag
eof
tota
lloa
d,%
)
centre to centre distance sx (m)
test K9; H=0.65 m
0.0%
20.0%
40.0%
60.0%
80.0%
100.0%
120.0%
0.00 0.05 0.10 0.15 0.20 0.25 0.30
arch
ing
A(p
erce
ntag
eof
tota
lloa
d,%
)
pile diameter d (m)
measuredconcentric archesEBGEO 2010Hewlett & Randolph 1988
test K9; H=0.65 m
Figure 4.21 Comparison of calculations and measurements in tests T2, T3, K5 and K9. See Table4.1for test specifications. Parameter study: variation of (a) friction angle , (b) surcharge load p.The large dots show the situation with a minimum of subsoil support measured just before asurcharge load increase, (c) centre-to-centre distance sx = sy and (d) pile diameter d.
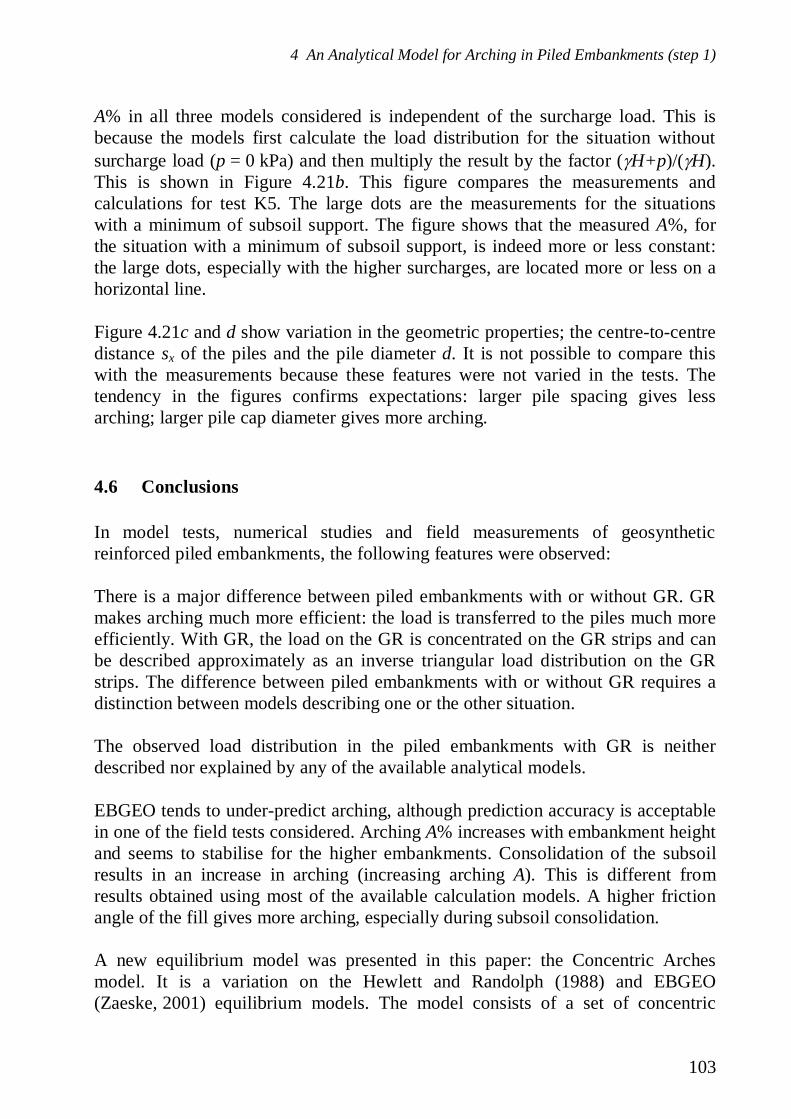
4 An Analytical Model for Arching in Piled Embankments (step 1)
103
A% in all three models considered is independent of the surcharge load. This isbecause the models first calculate the load distribution for the situation withoutsurcharge load (p = 0 kPa) and then multiply the result by the factor ( H+p)/( H).This is shown in Figure 4.21b. This figure compares the measurements andcalculations for test K5. The large dots are the measurements for the situationswith a minimum of subsoil support. The figure shows that the measured A%, forthe situation with a minimum of subsoil support, is indeed more or less constant:the large dots, especially with the higher surcharges, are located more or less on ahorizontal line.
Figure 4.21c and d show variation in the geometric properties; the centre-to-centredistance sx of the piles and the pile diameter d. It is not possible to compare thiswith the measurements because these features were not varied in the tests. Thetendency in the figures confirms expectations: larger pile spacing gives lessarching; larger pile cap diameter gives more arching.
4.6 Conclusions
In model tests, numerical studies and field measurements of geosyntheticreinforced piled embankments, the following features were observed:
There is a major difference between piled embankments with or without GR. GRmakes arching much more efficient: the load is transferred to the piles much moreefficiently. With GR, the load on the GR is concentrated on the GR strips and canbe described approximately as an inverse triangular load distribution on the GRstrips. The difference between piled embankments with or without GR requires adistinction between models describing one or the other situation.
The observed load distribution in the piled embankments with GR is neitherdescribed nor explained by any of the available analytical models.
EBGEO tends to under-predict arching, although prediction accuracy is acceptablein one of the field tests considered. Arching A% increases with embankment heightand seems to stabilise for the higher embankments. Consolidation of the subsoilresults in an increase in arching (increasing arching A). This is different fromresults obtained using most of the available calculation models. A higher frictionangle of the fill gives more arching, especially during subsoil consolidation.
A new equilibrium model was presented in this paper: the Concentric Archesmodel. It is a variation on the Hewlett and Randolph (1988) and EBGEO(Zaeske, 2001) equilibrium models. The model consists of a set of concentric
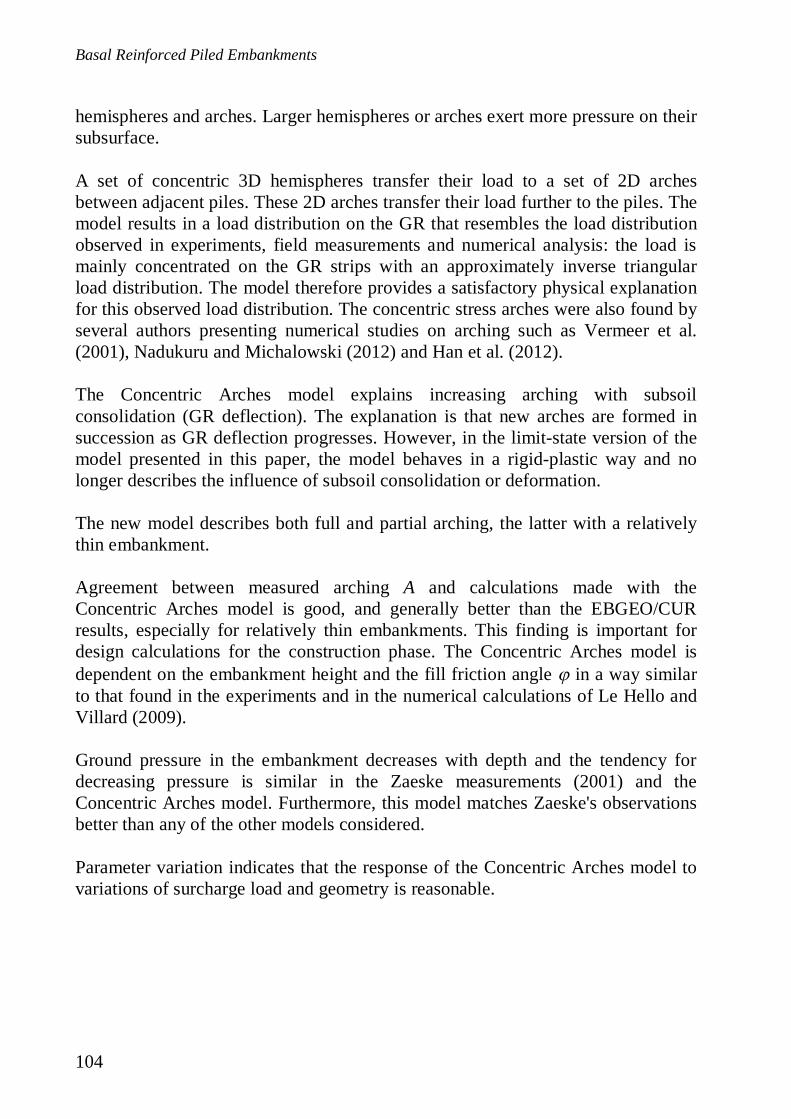
Basal Reinforced Piled Embankments
104
hemispheres and arches. Larger hemispheres or arches exert more pressure on theirsubsurface.
A set of concentric 3D hemispheres transfer their load to a set of 2D archesbetween adjacent piles. These 2D arches transfer their load further to the piles. Themodel results in a load distribution on the GR that resembles the load distributionobserved in experiments, field measurements and numerical analysis: the load ismainly concentrated on the GR strips with an approximately inverse triangularload distribution. The model therefore provides a satisfactory physical explanationfor this observed load distribution. The concentric stress arches were also found byseveral authors presenting numerical studies on arching such as Vermeer et al.(2001), Nadukuru and Michalowski (2012) and Han et al. (2012).
The Concentric Arches model explains increasing arching with subsoilconsolidation (GR deflection). The explanation is that new arches are formed insuccession as GR deflection progresses. However, in the limit-state version of themodel presented in this paper, the model behaves in a rigid-plastic way and nolonger describes the influence of subsoil consolidation or deformation.
The new model describes both full and partial arching, the latter with a relativelythin embankment.
Agreement between measured arching A and calculations made with theConcentric Arches model is good, and generally better than the EBGEO/CURresults, especially for relatively thin embankments. This finding is important fordesign calculations for the construction phase. The Concentric Arches model isdependent on the embankment height and the fill friction angle in a way similarto that found in the experiments and in the numerical calculations of Le Hello andVillard (2009).
Ground pressure in the embankment decreases with depth and the tendency fordecreasing pressure is similar in the Zaeske measurements (2001) and theConcentric Arches model. Furthermore, this model matches Zaeske's observationsbetter than any of the other models considered.
Parameter variation indicates that the response of the Concentric Arches model tovariations of surcharge load and geometry is reasonable.
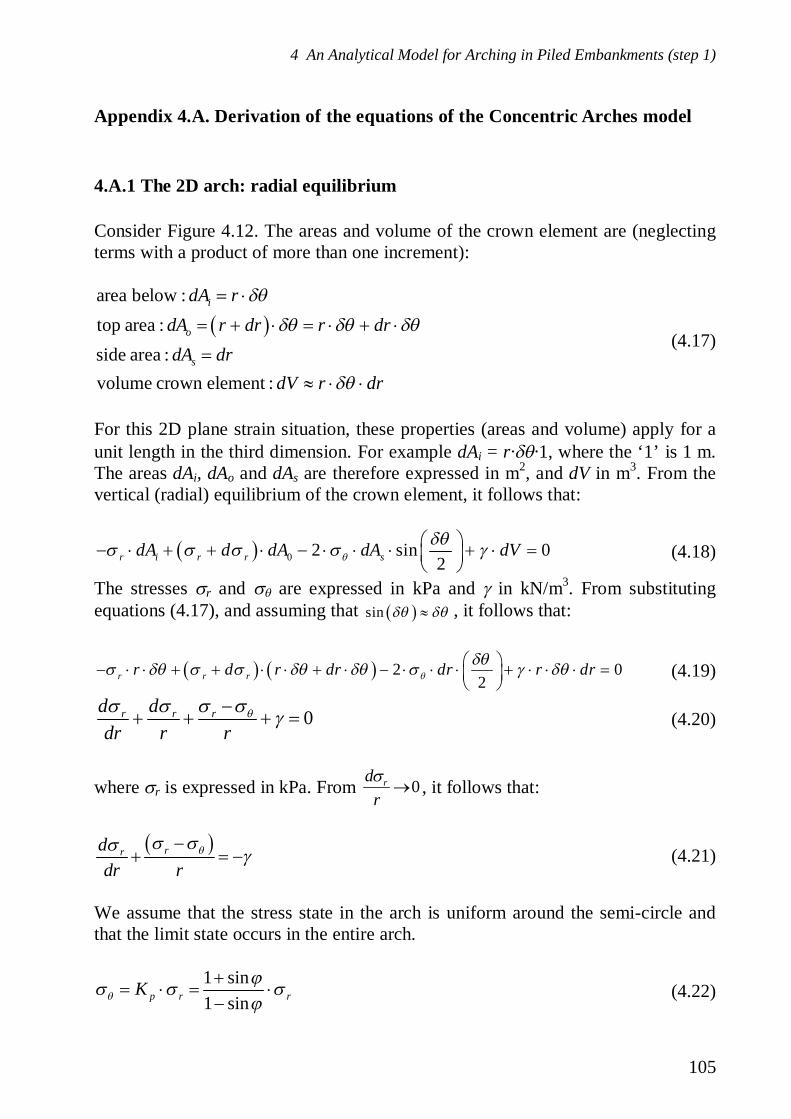
4 An Analytical Model for Arching in Piled Embankments (step 1)
105
Appendix 4.A. Derivation of the equations of the Concentric Arches model
4.A.1 The 2D arch: radial equilibrium
Consider Figure 4.12. The areas and volume of the crown element are (neglectingterms with a product of more than one increment):
area below :top area :side area :volume crown element :
i
o
s
dA rdA r dr r drdA dr
dV r dr
(4.17)
For this 2D plane strain situation, these properties (areas and volume) apply for aunit length in the third dimension. For example dAi = r· ·1, where the ‘1’ is 1 m.The areas dAi, dAo and dAs are therefore expressed in m2, and dV in m3. From thevertical (radial) equilibrium of the crown element, it follows that:
0 2 sin 02r i r r sdA d dA dA dV (4.18)
The stresses r and are expressed in kPa and in kN/m3. From substitutingequations (4.17), and assuming that sin , it follows that:
2 02r r rr d r dr dr r dr (4.19)
0r r rd ddr r r
(4.20)
where r is expressed in kPa. From 0rdr
, it follows that:
rrddr r
(4.21)
We assume that the stress state in the arch is uniform around the semi-circle andthat the limit state occurs in the entire arch.
1 sin1 sinp r rK (4.22)

Basal Reinforced Piled Embankments
106
This results in the 2D differential equation for the radial stress in 2D arches:
1 prr
Kddr r
(4.23)
To solve this differential equation, it can be rewritten as
rr
d p r q rdr
(4.24)
Where
1 andpK
p r q rr
(4.25)
The left-hand and right-hand sides of Equation (4.23) are multiplied by anintegration factor: ( )p r dr
e . This standard procedure to solve this kind of differentialequation results in:
( ) ( )p r dr p r drr
d e e q rdr
(4.26)
We find:
1( ) 1 ln 1
pp p
Kdrp r dr K r Kre e e r (4.27)
Thus (4.26) becomes:
1 1 1p p pK K Kr
d r q r r rdr
(4.28)
1 1 2
2p p pK K K
rp
r r dr r CK
(4.29)
where C is a constant. Thus
2
1 12
p
p p
K
r K Kp
r CK r r
(4.30)

4 An Analytical Model for Arching in Piled Embankments (step 1)
107
Thus
1
2pK
rp
C r rK (4.31)
For the weightless case we find equation 3 of Hewlett and Randolph’s 1988:
1pKr C r (4.32)
The boundary condition on the outside of the 2D arch is:
2 2g D r g Dr H H H p (4.33)
Where Hg2D is the height of the largest 2D arch and given by equation (4.2).Substitution of this condition into equation (4.31) gives:
1
2 2 2
12 2
2
12
p
p
K
g D g D g Dp
K pg D g D
p
C H H H H pK
KC H H p H
K
(4.34)
thus
1112
2 22
p
p
KKpx
rx pp
KsH p r rs KK
(4.35)
As the tangential stress = Kp r in kPa, we find:
12 2
2 2
1
2 2
where we have defined and as:
12 and2 22
p
p
KD D
D D
Kpx
D p D px pp
P r Q r
P Q
KsP K H p Q Ks KK
(4.36)
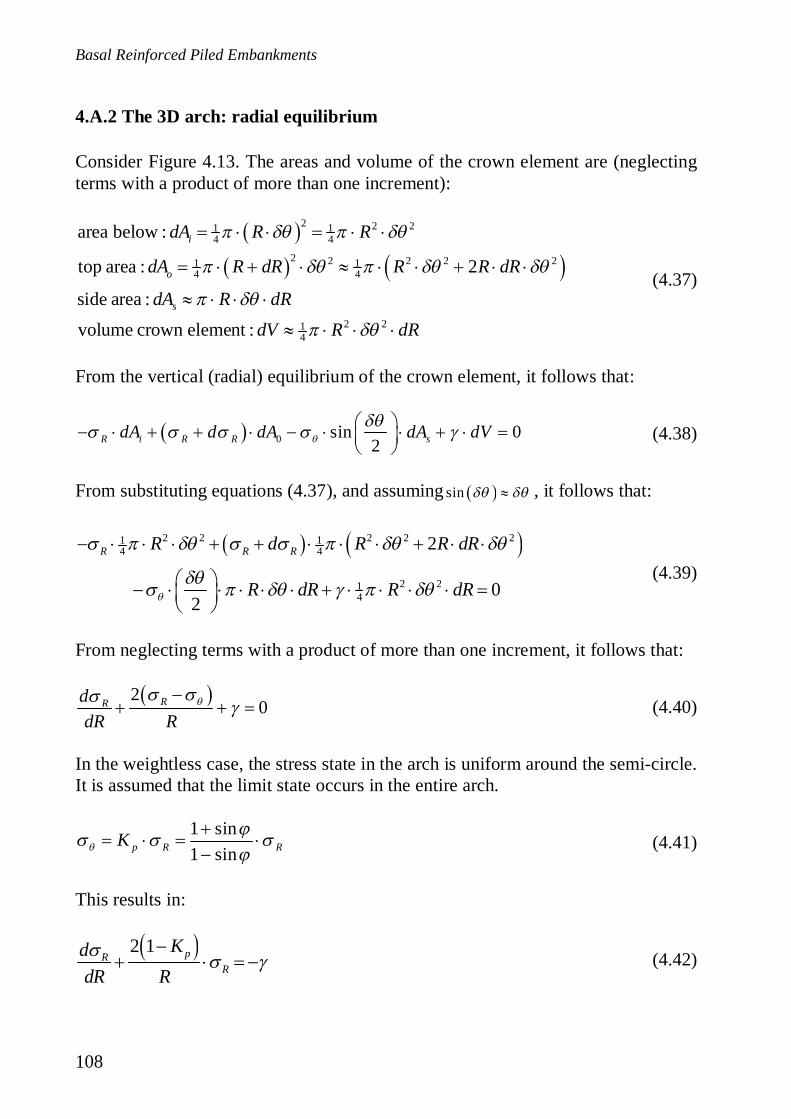
Basal Reinforced Piled Embankments
108
4.A.2 The 3D arch: radial equilibrium
Consider Figure 4.13. The areas and volume of the crown element are (neglectingterms with a product of more than one increment):
2 2 21 14 4
2 2 2 2 21 14 4
2 214
area below :
top area : 2
side area :
volume crown element :
i
o
s
dA R R
dA R dR R R dR
dA R dRdV R dR
(4.37)
From the vertical (radial) equilibrium of the crown element, it follows that:
0 sin 02R i R R sdA d dA dA dV (4.38)
From substituting equations (4.37), and assuming sin , it follows that:
2 2 2 2 21 14 4
2 214
2
02
R R RR d R R dR
R dR R dR(4.39)
From neglecting terms with a product of more than one increment, it follows that:
20RRd
dR R(4.40)
In the weightless case, the stress state in the arch is uniform around the semi-circle.It is assumed that the limit state occurs in the entire arch.
1 sin1 sinp R RK (4.41)
This results in:
2 1 pRR
KddR R
(4.42)

4 An Analytical Model for Arching in Piled Embankments (step 1)
109
which is the differential equation for the radial stress in the 3D hemisphere. So far,the explanation is the same as Hewlett and Randolph’s (1988). To solve thisdifferential equation, equation (4.23) can be rewritten as:
( ) ( )p R dR p R dRR
d e e q RdR
(4.43)
with:
2 1( ) = and ( )
and 2 1
p
p
Kp R q R
R RK
(4.44)
We find:
( ) lndRp R dR RRe e e R (4.45)
Thus equation (4.43) becomes:
Rd R q R R RdR
(4.46)
1
1RR R C (4.47)
where C is a constant. Thus
2 1
1
2 3p
R
KR
p
CRR
C R RK
(4.48)
The outer radius of the hemisphere is Ro = sx/ 2. The surcharge load will first beneglected and taken into account afterwards, analogous to Zaeske (2001) andHewlett and Randolph (1988). The boundary condition on the outside of the archis:
3 3o g D R g DR R H H H (4.49)
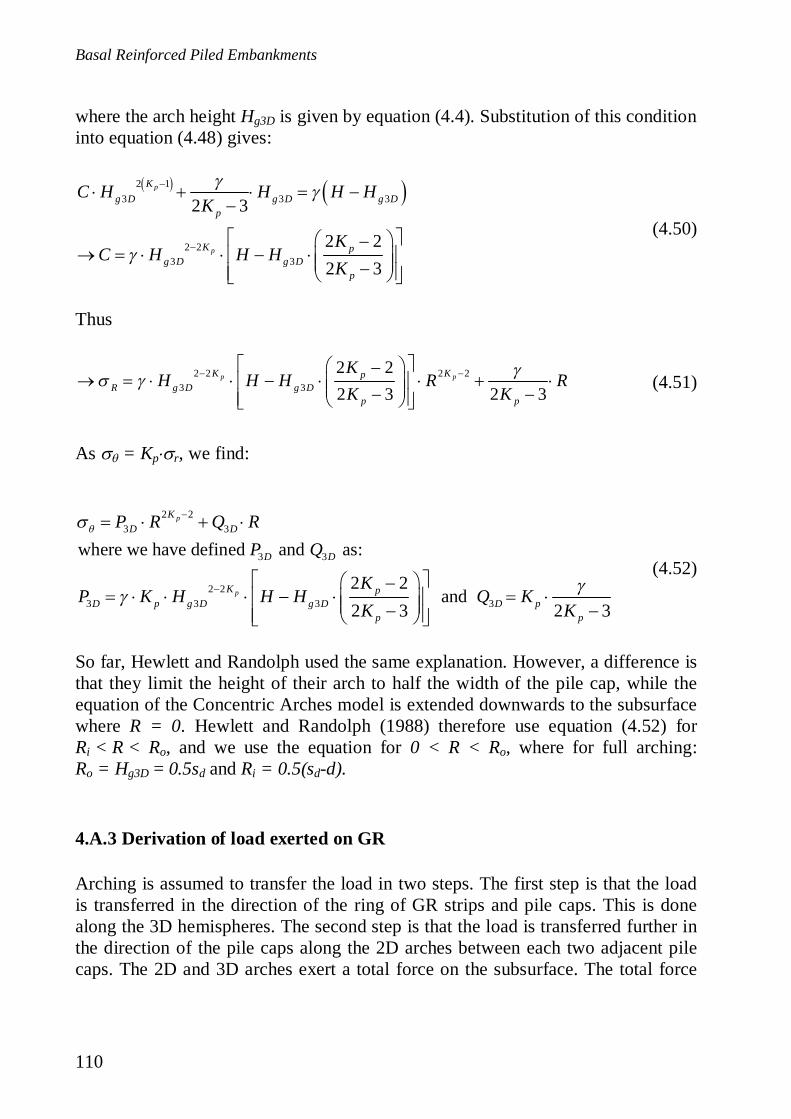
Basal Reinforced Piled Embankments
110
where the arch height Hg3D is given by equation (4.4). Substitution of this conditioninto equation (4.48) gives:
2 13 3 3
2 23 3
2 3
2 22 3
p
p
Kg D g D g D
p
K pg D g D
p
C H H H HK
KC H H H
K
(4.50)
Thus
2 2 2 23 3
2 22 3 2 3
p pK KpR g D g D
p p
KH H H R R
K K(4.51)
As = Kp r, we find:
2 23 3
3 3
2 23 3 3 3
where we have defined and as:
2 2 and
2 3 2 3
p
p
KD D
D D
K pD p g D g D D p
p p
P R Q RP Q
KP K H H H Q K
K K
(4.52)
So far, Hewlett and Randolph used the same explanation. However, a difference isthat they limit the height of their arch to half the width of the pile cap, while theequation of the Concentric Arches model is extended downwards to the subsurfacewhere R = 0. Hewlett and Randolph (1988) therefore use equation (4.52) forRi < R < Ro, and we use the equation for 0 < R < Ro, where for full arching:Ro = Hg3D = 0.5sd and Ri = 0.5(sd-d).
4.A.3 Derivation of load exerted on GR
Arching is assumed to transfer the load in two steps. The first step is that the loadis transferred in the direction of the ring of GR strips and pile caps. This is donealong the 3D hemispheres. The second step is that the load is transferred further inthe direction of the pile caps along the 2D arches between each two adjacent pilecaps. The 2D and 3D arches exert a total force on the subsurface. The total force
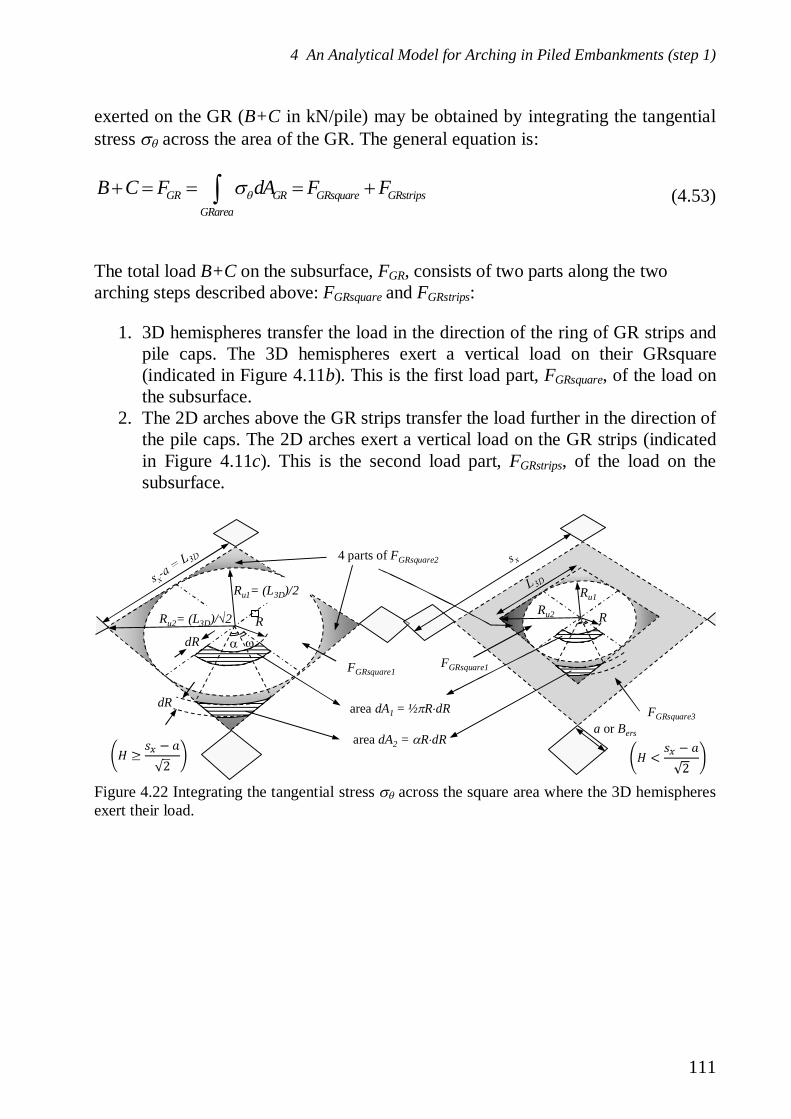
4 An Analytical Model for Arching in Piled Embankments (step 1)
111
exerted on the GR (B+C in kN/pile) may be obtained by integrating the tangentialstress across the area of the GR. The general equation is:
GR GR GRsquare GRstripsGRarea
B C F dA F F (4.53)
The total load B+C on the subsurface, FGR, consists of two parts along the twoarching steps described above: FGRsquare and FGRstrips:
1. 3D hemispheres transfer the load in the direction of the ring of GR strips andpile caps. The 3D hemispheres exert a vertical load on their GRsquare(indicated in Figure 4.11b). This is the first load part, FGRsquare, of the load onthe subsurface.
2. The 2D arches above the GR strips transfer the load further in the direction ofthe pile caps. The 2D arches exert a vertical load on the GR strips (indicatedin Figure 4.11c). This is the second load part, FGRstrips, of the load on thesubsurface.
4 parts of FGRsquare2
area dA1 = ½ R dR
area dA2 = R dR
Ru2= (L3D)/ 2
dRR
dR
Ru1= (L3D)/2
FGRsquare1
R
a or Bers
Ru2
Ru1
FGRsquare1
FGRsquare3
Figure 4.22 Integrating the tangential stress across the square area where the 3D hemispheresexert their load.
Basal Reinforced Piled Embankments
112
Total force on the GR square; determination of FGRsquare
Consider Figure 4.22. As long as2
xs aH , FGRsquare consists of the load exerted
by the hemispheres only. In that case (on the left of Figure 4.22), the total forceexerted on the GRsquare may be obtained by integrating the tangential stress in
the 3D hemispheres across the GRsquare. When2
xs aH , the total force exerted
on the GRsquare may be obtained by integrating the tangential stress across thesmaller (Lx3D Lx3D -)square, with width Lx3D, as indicated on the right of Figure4.22. The load FGRsq3 on the area outside this Lx3D Lx3D -square and inside theGRsquare is assumed to be H+p, which will be derived for later on. Lx3D isdefined as follows:
3x D xL s a for2
xs aH(4.54)
3 32x D g DL H for2
xs aH
where Hg3D in defined in equation (4.4). For the situation in which sx sy theintegration is carried out for an imaginary square with width Lx3D. This width isdetermined as:
223
12x D x yL s a s a for
2212 x yH s a s a
(4.55)3 32x D g DL H for
2212 x yH s a s a
Considering the situation that221
2 x yH s a s a , the square with width
Lx3D has the same diagonal as the area between the four piles. Integrating thetangential stress across this imaginary square gives the same or a higher force onthe GR square than numerical integration of the tangential stress over therectangular between the four piles. In the remainder of this appendix, the situationwith sx = sy applies.
The total force GRsquareF on the GR square is derived by dividing the square intothree sections:

4 An Analytical Model for Arching in Piled Embankments (step 1)
113
- part 1GRsquareF , inside the largest circle in the Lx3D Lx3D -square (white inFigure 4.22)
- part 2GRsquareF , outside the circle but inside the Lx3D Lx3D -square (dark greyFigure 4.22).
- part 3GRsquareF , outside the Lx3D Lx3D-square but inside the GR square (lightgrey in the right-hand figure in Figure 4.22).
The three terms are calculated with surcharge load p = 0, and will afterwards be
multiplied by the term H pH
to find the total load on the GR square:
1 2 3
1 0 2 0 3 0
GRsquare GRsquare GRsquare GRsquare
GRsq p GRsq p GRsq p
F F F F
H p F F FH
(4.56)
The first load part, FGRsquare1, which rests on the circular area in the largest circle, isdetermined as follows:
1 1 1
,31
2 1 211 0 3 32
0 0 0
22 33 1
1 0 33
0
2 33 3 32
1 33
4 4 2
22
12 2
u u up
x Du
p
p
R R RK
GRsq p GR D D
LR
KDGRsq p D
p
KD x D x D
GRsquare Dp
F dA RdR P R Q R dR
PF R Q RK
p P L LF QH K
(4.57)
where , P3D and Q3D are given in equation (4.52). The second load part,FGRsquare2, which rests on the area within the square but outside the circle, isdependent on angle . This angle is a function of R, and can be read from Figure
4.22, as the complementary angle 1 3arccos arccos2
u x DR LR R
. We therefore
find, for :
32arccos2 2
x DLR
(4.58)

Basal Reinforced Piled Embankments
114
The force on the grey areas in Figure 4.22 (outside the circle, inside the GR square)should therefore be determined by:
2
1
2 2
1 1
2
1
2 23 3
2 2 0
2 0 2
2 2 ,32 0 3 3
4
1 where
4 4
4 2arccos2 2
u
p
u
u u
u u
up
u
RK
D DR
GRsquare GRsq p
R R
GRsq p GRsqR R
RK x D
GRsq p D DR
P R Q R RdR
pF FH
F dA RdR
LF P R Q R RdR
R
(4.59)
This integral can be separated into four terms, which will be solved separately:
2
1
2
1
2
1
2
1
2 0 1 2 2 2 3 2 4 2
2 11 2 3
22 2 3
2 1 33 2 3
2 34 2 3
where
2
2
8 arccos2
8 arccos2
up
u
u
u
up
u
u
u
GRsq p GRsq GRsq GRsq GRsq
RK
GRsq DR
R
GRsq DR
RK x D
GRsq DR
Rx D
GRsq DR
F F F F F
F P R dR
F Q R dR
LF P R dRR
LF Q R dRR
(4.60)
The first two terms are solved as follows (Ru2 and Ru1 are indicated in Figure 4.22):
2
1
2
1
223 3 3
1 2
3333 3 3
2 2
2 2 12 2
2 2 2 13 3 2
pup p
u
u
u
KRK KD D x D
GRsq Rp p
RD D x DGRsq R
P P LF RK K
Q Q LF R
(4.61)
The other two integral terms are re-written as:
4 An Analytical Model for Arching in Piled Embankments (step 1)
115
2
1
2
1
2 13 2 3
3
4 2 2 3
3
arccos8 2
arccos8 2
up
u
u
u
RKGRsq x D
D R
RGRsq x D
D R
F LR dRP R
F LR dRQ R
(4.62)
We continue with solving the fourth term, 4 2GRsqF , and substitute:
3 3
3
3
3 3 32
2 2
22
3 3 1222
3 311
22 2
12 2
thus and2 2 2
x D x D
x D
x D
x D x D x D
L L
LL
x D x Duu
x D x Duu
L LRR
L LRR
L L LR dR dR
dR d(4.63)
where is the cosine of the complementary angle 3arccos2
x DLR
in Figure 4.22.
Thus
12
12
224 2 3 3
23 1
24 2 4
313 3
arccos8 2 2
arccos
GRsq x D x D
D
GRsq
D x D
F L L dQ
Fd
Q L
(4.64)
We bring the power to the increment
12 2
4 2 33
13 3
3arccosGRsq
D x D
Fd
Q L(4.65)
Partial integration gives:
121
2
224 2 3 3
3 113 3
3arccos arccosGRsq
D x D
Fd
Q L(4.66)
Basal Reinforced Piled Embankments
116
As2
1arccos1
dd
, we find:
12 2 3
4 23 2
13 3
32 1
GRsq
D x D
Fd
Q L(4.67)
We substitute:
21122
2
2
2
2 2
3
1 1 122
1 1 1 01
111
1d d
u
u
uu
uu u
d du
(4.68)
This gives:
14 2 2
303 3
31
2GRsq
D x D
Fu du
Q L(4.69)
This gives, with any integral table:
4 2 1 12 23
3 3
32 ln 1 2
2GRsq
D x D
F
Q L(4.70)
Thus
314 2 3 36 2 1 ln 1 2GRsq D x DF Q L (4.71)
The derivation of the third term, 3 2GRsqF , follows the same procedure as for 4 2GRsqF .With equations (4.63) and (4.62) we find:
4 An Analytical Model for Arching in Piled Embankments (step 1)
117
12 22 3
2 13 22
13 3
2arccos
p
p
p
KKGRsq
KD x D
Fd
P L(4.72)
We bring the power to the increment:
12
2 1 2
22 323 2
213 3
12
2 2arccos
p p
p
p
p
K K
p
KKp GRsq
KD x D
dK
K Fd
P L
(4.73)
Partial integration:
121
2
22 222 23 2
2 113 3
2arccos arccos
p
p p
p
KK Kp GRsq
KD x D
K Fd
P L(4.74)
Thus
12 22 2 2
3 22 2 2
13 3
22 1
p p
p p
K Kp GRsq
K KD x D
K Fd
P L(4.75)
Finally, the substitution of:
32
32
21122
2
2
2
2 2 3
2 2
3 2
3 2
1 1 122
1 1 1 01
111
1 d d
1
1
d d 1 d
ppKK
u
u
uu
u u u
u
u
u u u u u
d du
(4.76)
Basal Reinforced Piled Embankments
118
gives:
32
2 23 2
23 3
1 22 2
20
2 2 113 2 2
2 203 3
2
11 1 d
2
21 d
2
p
p
p
p
pp
p p
Kp GRsq
KD x D
K
K
KKp GRsq
K KD x D
K F
P L
uu u u u
u
K Fu u
P L
(4.77)
This last term can be rewritten with a binomial series:
1 112 2
00 0
11 d u dpK p n
n
Ku u u
n(4.78)
where:
2 4 6
2
0
1 2 1 2 31+ 1 u + u + u ...
2! 3!
1 u
p p p p pp
p n
n
K K K K KK
Kn (4.79)
From this, it follows that:
1112 2 1
0 00 0
1 11 11 d u2 1 2 1
pK p pn
n n
K Ku u
n nn n(4.80)
4 An Analytical Model for Arching in Piled Embankments (step 1)
119
2
22 2
3 3
2 2 113 2 2
2 203 3
2 23 2
2 203 3
22 23 3
3 2 20
2
2
21 d
2
2 112 12
12 12 12
ppKK
D x D
p
pp
p p
p
p p
pp
p
KKp GRsq
K KD x D
Kp GRsq p
K KnD x D
KKpD x D
GRsq Knp
P L
K
K Fu u
P L
K F KnnP L
KP LF
nK n
1 1
3 10
1
42
1
216
1
1320
1
9360
1 1 1 2
1 2 3
1 2 3 4
1 2 3 4 5
1 2 3 4 5 6
.....
pp p pK
p p p
p p p p
p p p p p
p p p p p p
K K K
K K K
K K K K
K K K K K
K K K K K K
(4.81)
The resulting total load on the GR square for the case sx sy is given by equation(4.6) of this paper.
An alternative is to solve this numerically. This means that the GR square isdivided into a large number of small areas. The average vertical stress on eachincrement is determined and multiplied by its area. The sum gives the total forceon the GR square with FGRsquare in kN/pile. FGRsquare1 and FGRsquare2 (kN/pile) areindicated in Figure 4.22, where Hg3D (m) is the height of the largest hemisphereand Lx3D is the width of the square upon which the hemispheres exert a load, asindicated in Figure 4.22. When Lx3D < (sx - a), the area outside Lx3D but inside theGR square is assumed to be loaded by H + p. This gives an extra term, FGRsq3p=0,where
2 23 0 3GRsq p x x DF H s a L for 3x D xL s a
(4.82)3 0 0GRsq pF for 3x D xL s a
Note that it is assumed that sx = sy in this appendix. In Chapter 4.4.5 the equationsare given for sx sy. It is supposed that the load not resting on the GR square istransferred to the ring of GR strips and pile caps. This load is therefore applied asan equally distributed surcharge load on the 2D arches. This surcharge load on the2D arches is, in kN/pile:

Basal Reinforced Piled Embankments
120
21 0 2 0 3 0transferred x GRsq p GRsq p GRsq pF H s a F F F (4.83)
Where a is the width of a square pile cap or the equivalent width of a circular pilecap. Distributed equally on the 2D arches, this results in a surcharge load in kPa(2 full GR strips and a pile cap per pile):
222
transferredtransferred
x D
Fp
a L a (4.84)
Where
2x D xL s a for12 xH s a
(4.85)2 22x D g DL H for
12 xH s a
where Hg2D in defined in equation (4.13)
Total force on the GR strip; determination of FGRstrip
In this appendix, for reasons of clarity, it is assumed that sx = sy. The tangentialstress (kPa) in the 2D arches above the GR strips is now given by:
12 2
12 2 2
2
(2D arch), where
12
2
p
p
KD D
K pD p g D transferred g D
p
D pp
P r Q r
KP K H H p H
K
Q KK
(4.86)
Where ptransferred (kPa) is the load transferred from the 3D hemispheres to the 2Darches and given by equation (4.84) and Hg2D (m) is the height of the 2D arch andgiven by equation (4.13). When sx sy, a distinction should be made between Px2Dversus Py2D and Hxg2D versus Hyg2D. The rest of the equation is equal to equation(4.1) in this paper. The total force on the GR strip (without surcharge load p) may
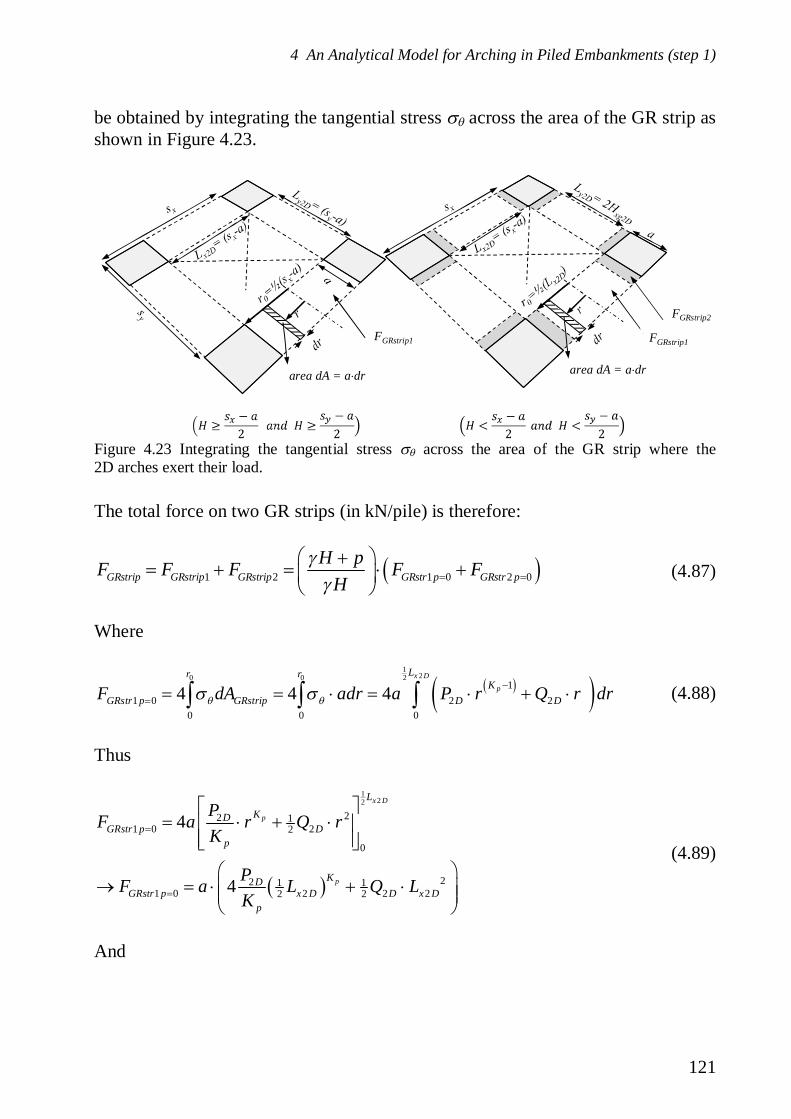
4 An Analytical Model for Arching in Piled Embankments (step 1)
121
be obtained by integrating the tangential stress across the area of the GR strip asshown in Figure 4.23.
The total force on two GR strips (in kN/pile) is therefore:
1 2 1 0 2 0GRstrip GRstrip GRstrip GRstr p GRstr pH pF F F F F
H(4.87)
Where
120 0 2
11 0 2 2
0 0 0
4 4 4x D
p
Lr rK
GRstr p GRstrip D DF dA adr a P r Q r dr (4.88)
Thus
122
22 11 0 22
0
22 1 11 0 2 2 22 2
4
4
x D
p
p
L
KDGRstr p D
p
KDGRstr p x D D x D
p
PF a r Q rK
PF a L Q LK
(4.89)
And
area dA = a dr area dA = a dr
FGRstrip2
FGRstrip1FGRstrip1
Figure 4.23 Integrating the tangential stress across the area of the GR strip where the2D arches exert their load.
Basal Reinforced Piled Embankments
122
2 0 22GRstr p x x DF Ha s a L for 12 xH s a
(4.90)2 0 0GRstr pF for 1
2 xH s a
With surcharge load p > 0:
22 1 1; 0 2 2 2 2 02 24 pKD
GRstrip p x D D x D GRstr pp
H p PF a L aQ L FH K
(4.91)
For the situation sx sy, this equation changes into equation (4.14).
4.A.4 2D variant: line-shaped support
The 2D equations can be worked out easily for the situation in which theembankment is supported by line-shaped supporting elements (such as diaphragmwalls). In this case, equation (4.86) is applicable, where ptransferred = 0 kPa, as this isthe load transferred from the 3D hemispheres that do not exist in the 2D case.
The total load in kN/m’ on a 1-m-wide line foundation is (in accordance withequation (4.87)):
1 2 1 0 2 0GR line GR line GR line GR line p GR line pH pF F F F F
H(4.92)
where1
20 0 21
1 0 2 20 0 0
2 2 2x D
p
Lr rK
GR line p GR line D DF dA dr P r Q r dr (4.93)
Thus
122
22 11 0 22
0
22 1 11 0 2 2 22 4
2
2
x D
p
p
LKD
GR line p Dp
KDGR line p x D D x D
p
PF r Q rK
PF L Q LK
(4.94)
and
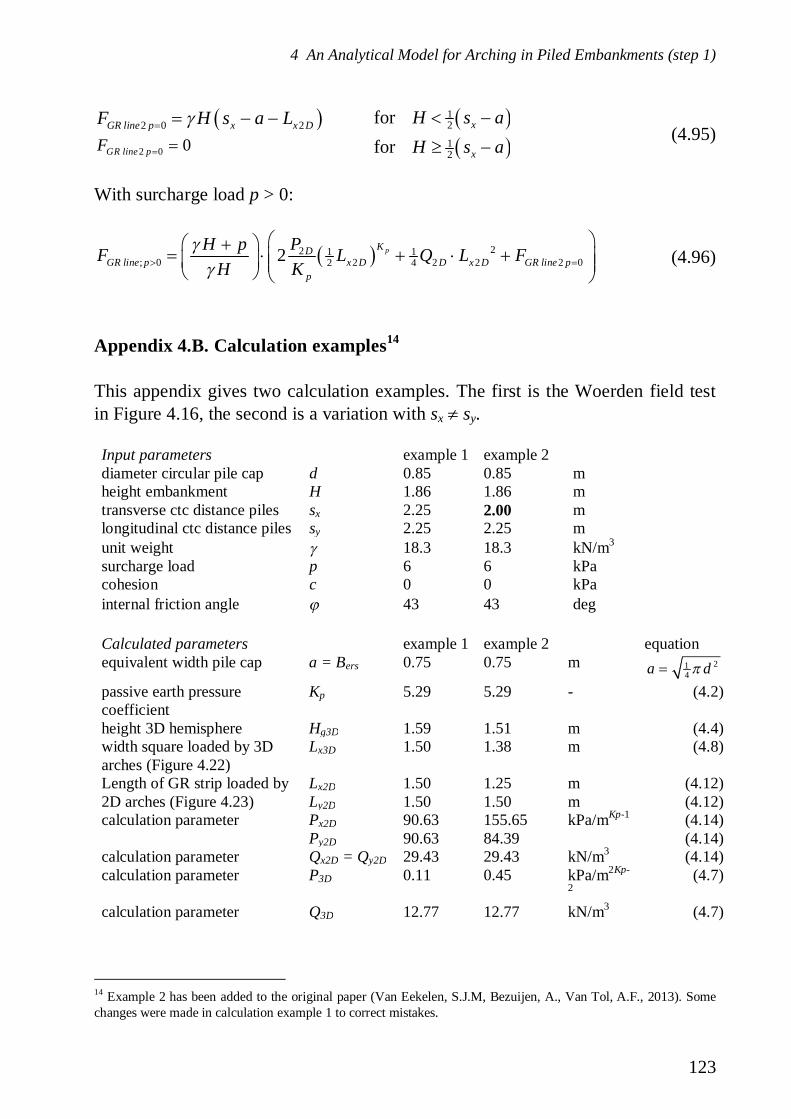
4 An Analytical Model for Arching in Piled Embankments (step 1)
123
2 0 2GR line p x x DF H s a L for 12 xH s a
(4.95)2 0 0GR line pF for 1
2 xH s a
With surcharge load p > 0:
22 1 1; 0 2 2 2 2 02 42 pKD
GR line p x D D x D GR line pp
H p PF L Q L FH K
(4.96)
Appendix 4.B. Calculation examples14
This appendix gives two calculation examples. The first is the Woerden field testin Figure 4.16, the second is a variation with sx sy.
Input parameters example 1 example 2diameter circular pile cap d 0.85 0.85 mheight embankment H 1.86 1.86 mtransverse ctc distance piles sx 2.25 2.00 mlongitudinal ctc distance piles sy 2.25 2.25 munit weight 18.3 18.3 kN/m3
surcharge load p 6 6 kPacohesion c 0 0 kPainternal friction angle 43 43 deg
Calculated parameters example 1 example 2 equationequivalent width pile cap a = Bers 0.75 0.75 m 21
4a dpassive earth pressurecoefficient
Kp 5.29 5.29 - (4.2)
height 3D hemisphere Hg3D 1.59 1.51 m (4.4)width square loaded by 3Darches (Figure 4.22)
Lx3D 1.50 1.38 m (4.8)
Length of GR strip loaded by2D arches (Figure 4.23)
Lx2D 1.50 1.25 m (4.12)Ly2D 1.50 1.50 m (4.12)
calculation parameter Px2D 90.63 155.65 kPa/mKp-1 (4.14)Py2D 90.63 84.39 (4.14)
calculation parameter Qx2D = Qy2D 29.43 29.43 kN/m3 (4.14)calculation parameter P3D 0.11 0.45 kPa/m2Kp-
2(4.7)
calculation parameter Q3D 12.77 12.77 kN/m3 (4.7)
14 Example 2 has been added to the original paper (Van Eekelen, S.J.M, Bezuijen, A., Van Tol, A.F., 2013). Somechanges were made in calculation example 1 to correct mistakes.

Basal Reinforced Piled Embankments
124
Determination of the force exerted by the 3D hemispheres on the GR square(no surcharge load yet: p = 0)
example 1 example 2force inside circle in GRsquare (Figure 4.22)
FGRsq1;p=0 11.21 8.74 kN/pile (4.6)
part 1 of force on area insideLx3D Lx3D square, but outsidecircle (Figure 4.22)
1FGRsq2 0.11 0.20 kN/pile (4.6)
part 2 of force on area insideLx3D Lx3D square, but outsidecircle (Figure 4.22)
2FGRsq2 20.50 15.98 kN/pile (4.6)
part 3 of force on area insideLx3D Lx3D square, but outsidecircle (Figure 4.22)
3FGRsq2 -0.10 -0.17 kN/pile (4.6)
part 4 of force on area insideLx3D Lx3D square, but outsidecircle (Figure 4.22)
4FGRsq2 -15.33 -11.94 kN/pile (4.6)
total force on area insideLx3D Lx3D square, but outsidecircle (Figure 4.22)
FGRsq2;p=0 5.19 4.06 kN/pile 1FGRsq2 +
2FGRsq2 +
3FGRsq2 +
4FGRsq2(4.6)
force on area outsideLx3D Lx3D square, but insideGR square)
FGRsq3;p=0 0.00 0.00 kN/pile (4.9)
total force on GR square(Figure 4.22) for p = 0 kPa
FGRsquare;p=0 16.40 12.80 kN/pile (4.6)
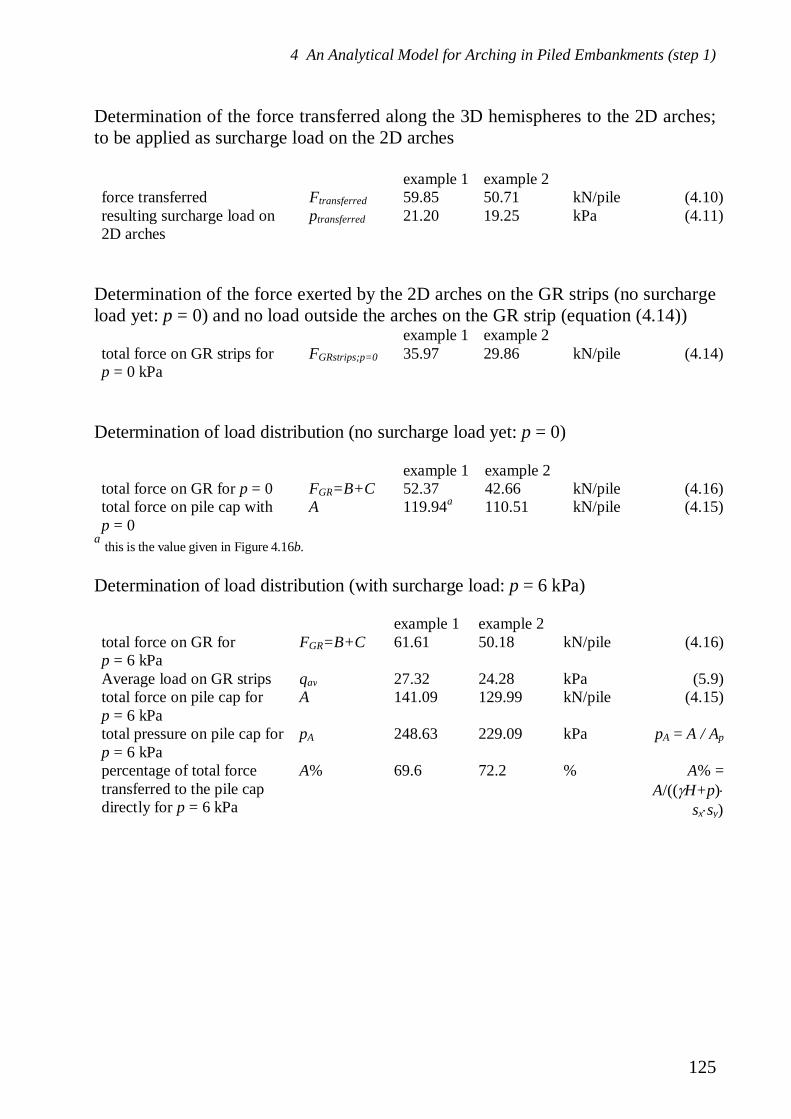
4 An Analytical Model for Arching in Piled Embankments (step 1)
125
Determination of the force transferred along the 3D hemispheres to the 2D arches;to be applied as surcharge load on the 2D arches
example 1 example 2force transferred Ftransferred 59.85 50.71 kN/pile (4.10)resulting surcharge load on2D arches
ptransferred 21.20 19.25 kPa (4.11)
Determination of the force exerted by the 2D arches on the GR strips (no surchargeload yet: p = 0) and no load outside the arches on the GR strip (equation (4.14))
example 1 example 2total force on GR strips forp = 0 kPa
FGRstrips;p=0 35.97 29.86 kN/pile (4.14)
Determination of load distribution (no surcharge load yet: p = 0)
example 1 example 2total force on GR for p = 0 FGR=B+C 52.37 42.66 kN/pile (4.16)total force on pile cap withp = 0
A 119.94a 110.51 kN/pile (4.15)
a this is the value given in Figure 4.16b.
Determination of load distribution (with surcharge load: p = 6 kPa)
example 1 example 2total force on GR forp = 6 kPa
FGR=B+C 61.61 50.18 kN/pile (4.16)
Average load on GR strips qav 27.32 24.28 kPa (5.9)total force on pile cap forp = 6 kPa
A 141.09 129.99 kN/pile (4.15)
total pressure on pile cap forp = 6 kPa
pA 248.63 229.09 kPa pA = A / Ap
percentage of total forcetransferred to the pile capdirectly for p = 6 kPa
A% 69.6 72.2 % A% =A/(( H+p)
sx sy)
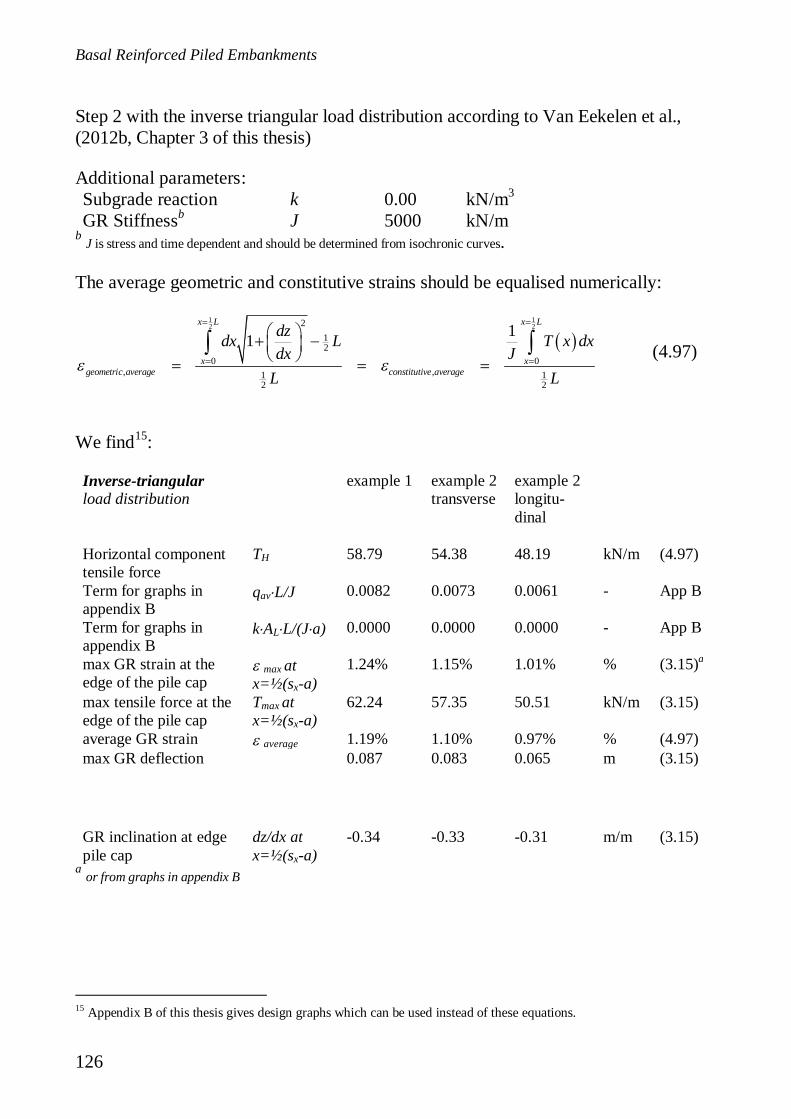
Basal Reinforced Piled Embankments
126
Step 2 with the inverse triangular load distribution according to Van Eekelen et al.,(2012b, Chapter 3 of this thesis)
Additional parameters:Subgrade reaction k 0.00 kN/m3
GR Stiffnessb J 5000 kN/mb J is stress and time dependent and should be determined from isochronic curves.
The average geometric and constitutive strains should be equalised numerically:
1 12 22
12
0 0, ,1 1
2 2
11x L x L
x xgeometric average constitutive average
dzdx L T x dxdx J
L L(4.97)
We find15:
Inverse-triangularload distribution
example 1 example 2transverse
example 2longitu-dinal
Horizontal componenttensile force
TH 58.79 54.38 48.19 kN/m (4.97)
Term for graphs inappendix B
qav L/J 0.0082 0.0073 0.0061 - App B
Term for graphs inappendix B
k AL L/(J a) 0.0000 0.0000 0.0000 - App B
max GR strain at theedge of the pile cap
max atx=½(sx-a)
1.24% 1.15% 1.01% % (3.15)a
max tensile force at theedge of the pile cap
Tmax atx=½(sx-a)
62.24 57.35 50.51 kN/m (3.15)
average GR strain average 1.19% 1.10% 0.97% % (4.97)max GR deflection 0.087 0.083 0.065 m (3.15)
GR inclination at edgepile cap
dz/dx atx=½(sx-a)
-0.34 -0.33 -0.31 m/m (3.15)
a or from graphs in appendix B
15 Appendix B of this thesis gives design graphs which can be used instead of these equations.
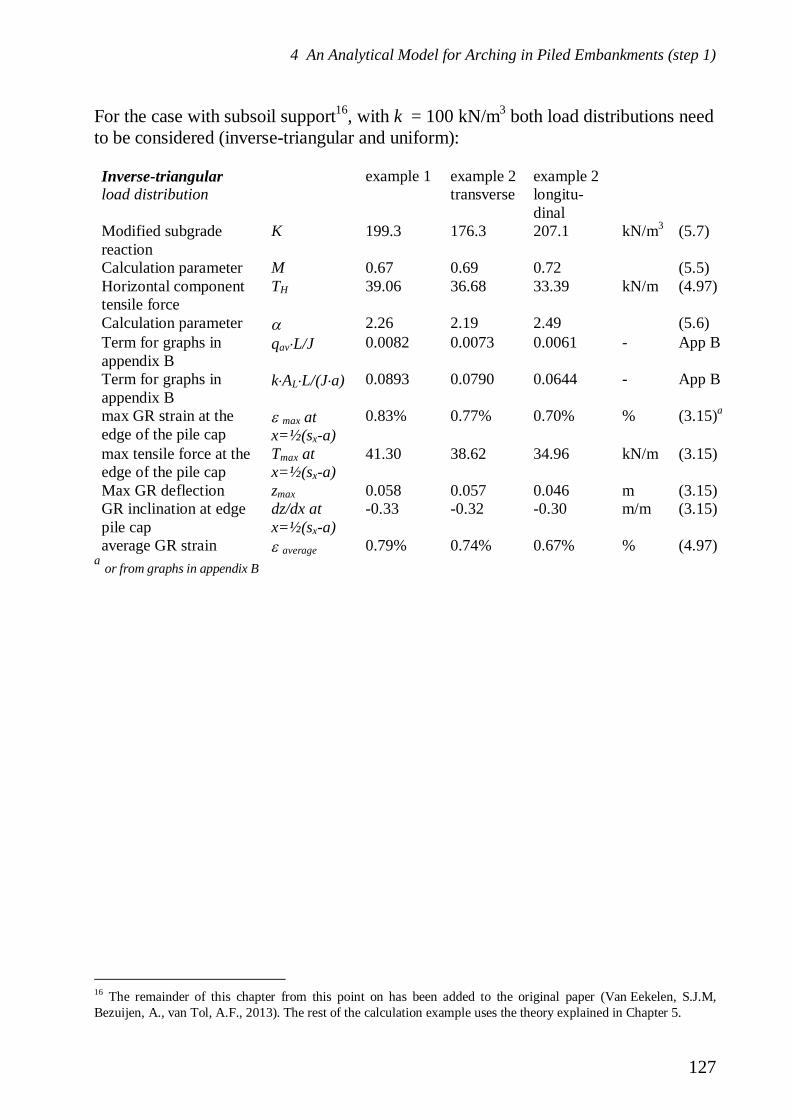
4 An Analytical Model for Arching in Piled Embankments (step 1)
127
For the case with subsoil support16, with k = 100 kN/m3 both load distributions needto be considered (inverse-triangular and uniform):
Inverse-triangularload distribution
example 1 example 2transverse
example 2longitu-dinal
Modified subgradereaction
K 199.3 176.3 207.1 kN/m3 (5.7)
Calculation parameter M 0.67 0.69 0.72 (5.5)Horizontal componenttensile force
TH 39.06 36.68 33.39 kN/m (4.97)
Calculation parameter 2.26 2.19 2.49 (5.6)Term for graphs inappendix B
qav L/J 0.0082 0.0073 0.0061 - App B
Term for graphs inappendix B
k AL L/(J a) 0.0893 0.0790 0.0644 - App B
max GR strain at theedge of the pile cap
max atx=½(sx-a)
0.83% 0.77% 0.70% % (3.15)a
max tensile force at theedge of the pile cap
Tmax atx=½(sx-a)
41.30 38.62 34.96 kN/m (3.15)
Max GR deflection zmax 0.058 0.057 0.046 m (3.15)GR inclination at edgepile cap
dz/dx atx=½(sx-a)
-0.33 -0.32 -0.30 m/m (3.15)
average GR strain average 0.79% 0.74% 0.67% % (4.97)a or from graphs in appendix B
16 The remainder of this chapter from this point on has been added to the original paper (Van Eekelen, S.J.M,Bezuijen, A., van Tol, A.F., 2013). The rest of the calculation example uses the theory explained in Chapter 5.

Basal Reinforced Piled Embankments
128
Uniformload distribution
example 1 example 2transverse
example 2longitu-dinal
Modified subgradereaction
K 199.3 176.3 207.1 kN/m3 (5.7)
Horizontal componenttensile force
TH 44.21 41.74 38.35 kN/m (4.97)
Calculation parameter 2.12 2.05 2.32 (5.6)Term for graphs inappendix B
qav L/J 0.0073 0.0061 - App B
Term for graphs inappendix B
k AL L/(J a) 0.0790 0.0644 - App B
max GR strain at theedge of the pile cap
max atx=½(sx-a)
0.92% 0.86% 0.79% % (5.4) a
max tensile force at theedge of the pile cap
Tmax atx=½(sx-a)
45.78 43.11 39.47 kN/m (5.4)
Max GR deflection zmax 0.083 0.081 0.065 m (5.4)GR inclination at edgepile cap
dz/dx atx=½(sx-a)
-0.26 -0.25 -0.24 m/m (5.4)
average GR strain average 0.89% 0.84% 0.77% % (4.97)a or from graphs in appendix B
The inverse triangular load distribution gives smaller strains than the uniform loaddistribution and the inverse triangular is therefore normative in this case, asexplained in Chapter 5.5.
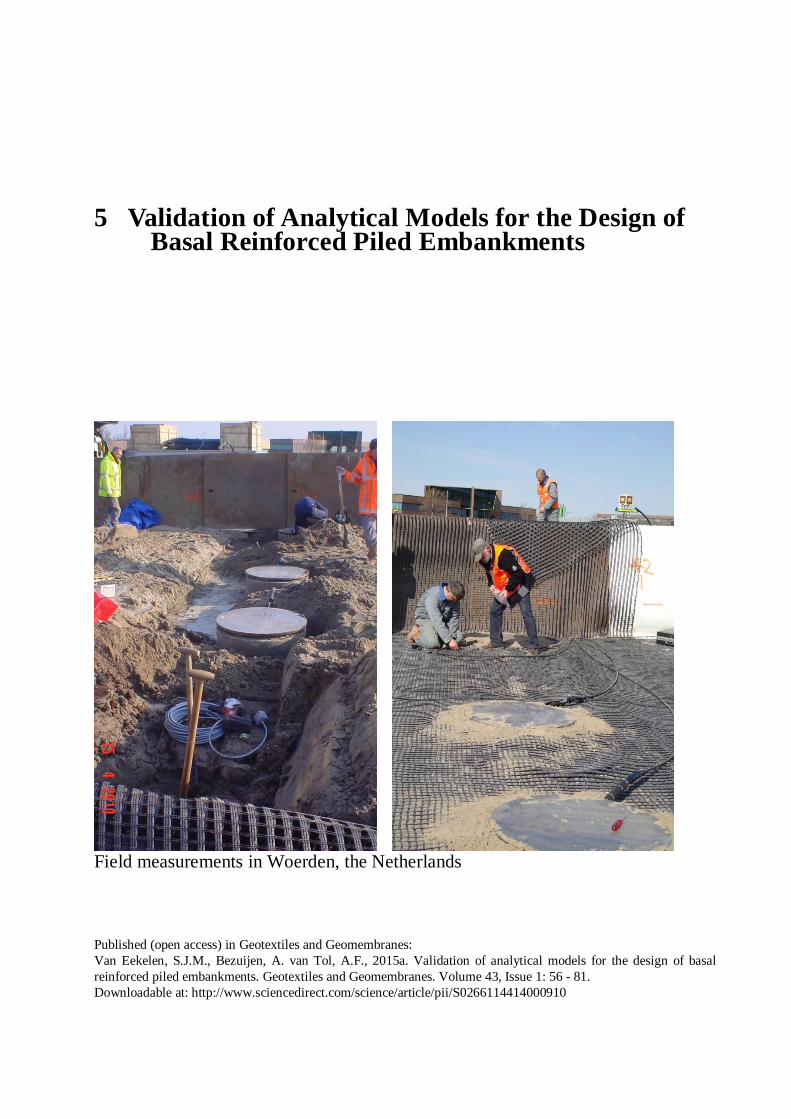
5 Validation of Analytical Models for the Design ofBasal Reinforced Piled Embankments
Field measurements in Woerden, the Netherlands
Published (open access) in Geotextiles and Geomembranes:Van Eekelen, S.J.M., Bezuijen, A. van Tol, A.F., 2015a. Validation of analytical models for the design of basalreinforced piled embankments. Geotextiles and Geomembranes. Volume 43, Issue 1: 56 - 81.Downloadable at: http://www.sciencedirect.com/science/article/pii/S0266114414000910

Basal Reinforced Piled Embankments
130
Abstract
Van Eekelen et al. (2012a, b and 2013, Chapters 2, 3 and 4 of this thesis) haveintroduced an analytical model for the design of the geosynthetic reinforcement(GR) in a piled embankment. This paper further validates this model withmeasurements from seven full-scale tests and four series of scaled modelexperiments. Most of these measurements have been reported earlier in theliterature.The new model describes arching with the “Concentric Arching model” (CAmodel). This model is an extension of the single arch model of Hewlett andRandolph (1988) and the multi-scale model of Zaeske (2001), which is alsodescribed in Kempfert et al. (2004). For load-deflection behaviour, Van Eekelen etal. (2012a, b and 2013, Chapters 2, 3 and 4 of this thesis) proposed the use of a netload distribution that is inverse triangular instead of uniform or triangular. Theseauthors also proposed the inclusion of all the subsoil support beneath the GR in thecalculations.On the basis of comparisons between the measurements and calculations, it isconcluded that the CA model matches the measurements better than the models ofZaeske or Hewlett and Randolph.Where there is no subsoil support, or almost no subsoil support, the inversetriangular load distribution on the GR strips between adjacent piles gives the bestmatch with the measurements. Cases with subsoil support generally lead to lessGR strain. In the cases with significant subsoil support, the load distribution isapproximately uniform. In the cases with limited subsoil support, it should bedetermined which load distribution gives the minimum GR strain to find the bestmatch with the measurements.
5.1 Introduction
Basal reinforced piled embankments are increasingly popular due to the goodperformance of these structures, mainly in areas with soft soil. They can beconstructed quickly, they do not exert horizontal soil pressure on adjacent sensitivestructures and residual settlement is very limited or absent. As a result, they requirevery limited maintenance. Several design guidelines have been published orupdated lately in Europe, including the German EBGEO (2010), the DutchCUR226 (2010, described in Van Eekelen et al., 2010b), the British BS8006(2010, described and analysed in Van Eekelen et al., 2011a, see appendix A of thisthesis) and the French ASIRI (2012). The CUR226 committee is currently workingon an update to bring the CUR226 in line with recent research results. This paperpresents a validation study that has been carried out to support the choices madefor the update of CUR226 (2015).
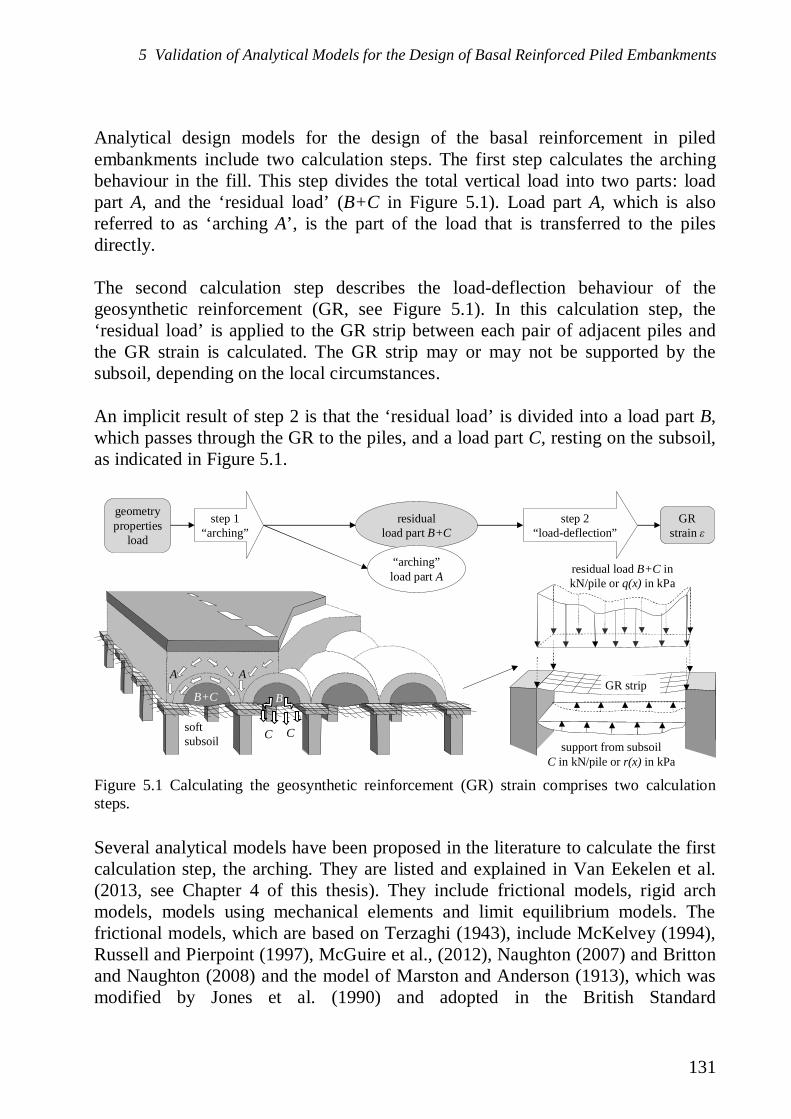
5 Validation of Analytical Models for the Design of Basal Reinforced Piled Embankments
131
Analytical design models for the design of the basal reinforcement in piledembankments include two calculation steps. The first step calculates the archingbehaviour in the fill. This step divides the total vertical load into two parts: loadpart A, and the ‘residual load’ (B+C in Figure 5.1). Load part A, which is alsoreferred to as ‘arching A’, is the part of the load that is transferred to the pilesdirectly.
The second calculation step describes the load-deflection behaviour of thegeosynthetic reinforcement (GR, see Figure 5.1). In this calculation step, the‘residual load’ is applied to the GR strip between each pair of adjacent piles andthe GR strain is calculated. The GR strip may or may not be supported by thesubsoil, depending on the local circumstances.
An implicit result of step 2 is that the ‘residual load’ is divided into a load part B,which passes through the GR to the piles, and a load part C, resting on the subsoil,as indicated in Figure 5.1.
Several analytical models have been proposed in the literature to calculate the firstcalculation step, the arching. They are listed and explained in Van Eekelen et al.(2013, see Chapter 4 of this thesis). They include frictional models, rigid archmodels, models using mechanical elements and limit equilibrium models. Thefrictional models, which are based on Terzaghi (1943), include McKelvey (1994),Russell and Pierpoint (1997), McGuire et al., (2012), Naughton (2007) and Brittonand Naughton (2008) and the model of Marston and Anderson (1913), which wasmodified by Jones et al. (1990) and adopted in the British Standard
geometryproperties
load
GRstrain
step 1“arching”
residualload part B+C
step 2“load-deflection”
GR stripB+C
AA
softsubsoil
residual load B+C inkN/pile or q(x) in kPa
support from subsoilC in kN/pile or r(x) in kPa
B
C C
“arching”load part A
Figure 5.1 Calculating the geosynthetic reinforcement (GR) strain comprises two calculationsteps.

Basal Reinforced Piled Embankments
132
BS8006 (2010). The rigid arch models include Scandinavian models such asCarlsson (1987), Rogbeck et al. (1998, modified by Van Eekelen et al., 2003),Svanø et al. (2000), the enhanced arch model described in, for example,Collin (2004), the design method of the Public Work Research Centre in Japan(2000, discussed in Eski ar et al., 2012). The models that consider the behaviour ofthe separate mechanical elements and match their boundaries are described in, forexample, Filz et al. (2012), Deb (2010), Deb and Mohapatra (2013) and Zhang etal. (2012). The present paper focuses on the last family of arching models: limitequilibrium models. The following Chapter describes these models.
Several approaches for the second calculation step have also been presented in theliterature. The German approach (adopted in EBGEO, 2010 and CUR226, 2010),including some variations, is described in the following chapter. An approachusing finite differences and minimisation of the total energy has been presented byJones et al. (2010) with a 3D plate model, Halvordson et al. (2010) with a3D cable-net model and Plaut et al. (2010) with an axisymmetric model.This paper validates three variations of limit equilibrium models for the arching ofstep 1 in combination with several variations of load-deflection membrane theoryfor step 2. Results obtained with the combination of these models are comparedwith measurements in seven full-scale cases and four series of scaled modelexperiments.
This paper specifically considers piled embankments with GR. Any reportedmeasurements without GR were therefore not suitable for this paper. Examples areHong et al. (2014) with 2D full-scale experiments, Ellis and Aslam (2009a, b) andLally and Naughton (2012) with centrifuge tests, Britton and Naughton (2008,2010) with model experiments, and Hewlett and Randolph (1988) with scaled 2Dtrapdoor experiments.
Specific measurements are necessary to validate steps 1 and 2 separately. Tovalidate step 1 separately, arching A needs to be measured. When GR is present,A needs to be measured above the GR. To validate a step 2 model, both arching Aand the GR strain need to be measured. Only a very limited number ofresearchers have reported measurements of A in full-scale tests with GR(Van Eekelen et al., 2010a, 2012c; and Van Duijnen et al., 2010) or scaledexperiments with GR (Oh and Shin, 2007; Van Eekelen et al., 2012a (Chapter 2 ofthis thesis). Van Eekelen et al. (2012b and 2013 (Chapter 4 of this thesis), VanEekelen and Bezuijen, 2013b) used most of these measurements to validate theirproposed steps 1 and 2 separately.
When validating steps 1 and 2 together, measurements of A are not necessary andmeasurements of the GR strain suffice. Seven full-scale cases have been reported

5 Validation of Analytical Models for the Design of Basal Reinforced Piled Embankments
133
with the data that will be considered in the present paper: in Brazil (Spotti, 2006;and Almeida et al., 2007 and 2008), in Houten, the Netherlands (Van Duijnen etal., 2010), near Woerden, the Netherlands (Van Eekelen et al., 2012c), in Finland(Huang et al., 2009, including FDM calculations), in the Krimpenerwaard, theNetherlands (Haring et al., 2008), in Hamburg, Germany (Weirauch et al., 2013)and in France (Briançon and Simon, 2012). Additionally, four series of modelexperiments reported in the literature are considered in the present paper: fromVirginia (Sloan, 2011 and McGuire et al., 2012), the Republic of Korea (Oh andShin, 2007), Germany (Zaeske, 2001, also reported in Kempfert et al., 2004) andthe Netherlands (Van Eekelen et al., 2012a and b, adopted in Chapter 2 and 3 ofthis thesis).
Several other measurements reported in the literature were not suitable for use inthe present paper because GR strains were not measured or not reported. Theyinclude Chen et al. (2008a), Blanc et al. (2013 and 2014) and Van Eekelen et al.(2010a). Zhuang et al. (2014) used this last reference for the validation of theirsimplified model, and calculated the ‘measured’ GR deflection from the measuredload distribution.
Chapter 5.2 summarises the analytical models included for consideration. Chapter5.3 includes a summary of the cases considered. Special attention is paid to thedetermination of the calculation parameters for each case. Chapter 5.4 comparesthe analytical calculation results with the measurements for each of the consideredcases. Chapter 5.5 discusses the results.
5.2 Description of the considered analytical models
This paper validates several combinations of analytical models for step 1, thearching and step 2, the load-deflection behaviour. See Figure 5.1 and Table 5.13.
5.2.1 Step 1: arching
The two most frequently used arching models in Europe are Hewlett andRandolph's single arch model (1988, see Figure 5.2a) and Zaeske's multi-scalemodel (2001, also cited in Kempfert et al., 2004, see Figure 5.2b). An extension ofthese two models is the Concentric Arches model (CA model, see Figure 5.2c)presented recently by Van Eekelen et al. (2013, Chapter 4 of this thesis). Thismodel was specifically developed in response to the observation that a major partof the load on the GR concentrates on the GR strips between adjacent piles, andthat the load distribution on these strips approaches the inverse triangular shape, asshown in Figure 5.3c. This is further discussed in the next chapter.
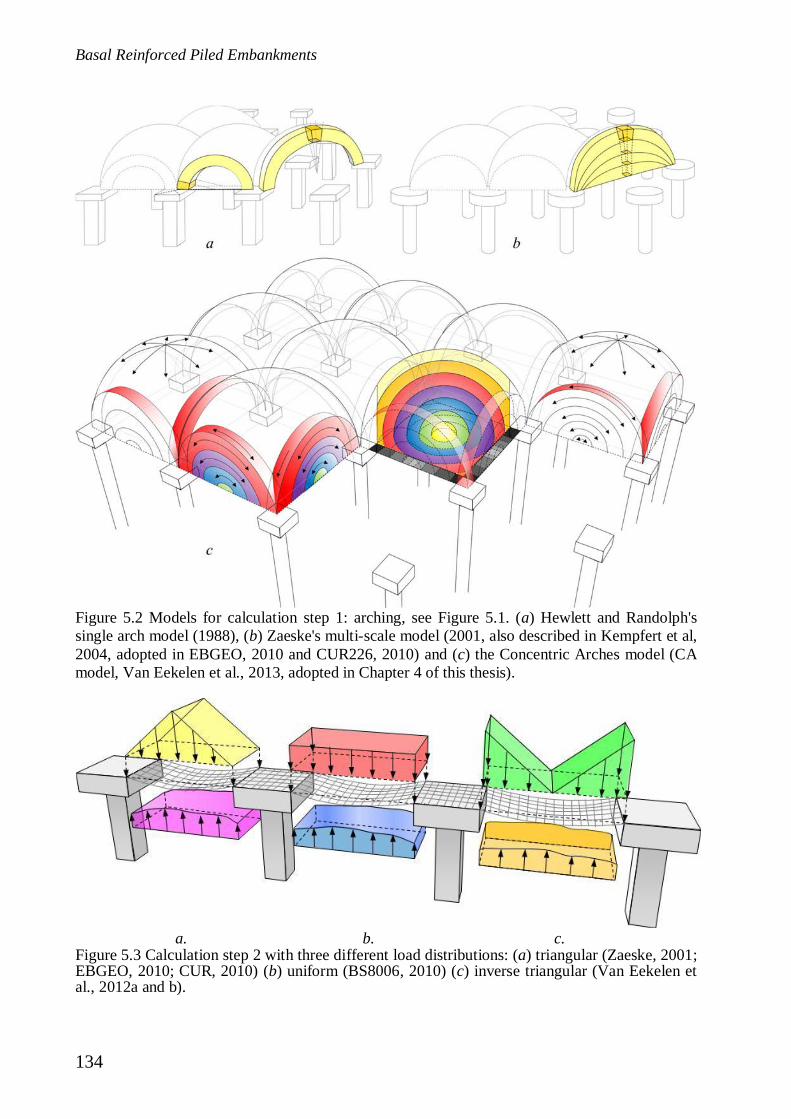
Basal Reinforced Piled Embankments
134
a. b. c.
Figure 5.2 Models for calculation step 1: arching, see Figure 5.1. (a) Hewlett and Randolph'ssingle arch model (1988), (b) Zaeske's multi-scale model (2001, also described in Kempfert et al,2004, adopted in EBGEO, 2010 and CUR226, 2010) and (c) the Concentric Arches model (CAmodel, Van Eekelen et al., 2013, adopted in Chapter 4 of this thesis).
Figure 5.3 Calculation step 2 with three different load distributions: (a) triangular (Zaeske, 2001;EBGEO, 2010; CUR, 2010) (b) uniform (BS8006, 2010) (c) inverse triangular (Van Eekelen etal., 2012a and b).
5 Validation of Analytical Models for the Design of Basal Reinforced Piled Embankments
135
The applicability of arching models should be limited to situations where thedistance between the piles is comparable to those applied in the considered cases.When the distance between the pile caps becomes too large, the arching or ratherpunching here is less efficient, as shown by Hong et al. (2014).
5.2.2 Step 2: load-deflection behaviour
In the second calculation step, the ‘residual load’ that results from step 1 is appliedto the GR strip between each two adjacent piles. The GR strip may be supported bysubsoil. The GR strain is then calculated using differential equations based onmembrane theory, as explained in Van Eekelen et al. (2012b, Chapter 3 of thisthesis).
Two issues are of major importance in step 2. Firstly, the load distribution on theGR strip has a strong influence on the calculated GR strain (see Figure 3). VanEekelen et al. (2012a,b, Chapter 2 and 3 of this thesis, also discussed in Filz andSloan, 2013) concluded that this distribution approaches the inverse triangulardistribution as opposed to the triangular distribution of EBGEO(2010); CUR(2010) and Zaeske (2001) and the uniform distribution of BS8006 (2010). This isalso confirmed by the findings of, for example, Han and Gabr (2002). These threeload distributions are all considered in the present paper.
Secondly, subsoil support has a major influence. The most extreme situationsoccur when the subsoil support is lost. This can happen, for example, due tolowering the water table in the subsoil, the settlement of soft subsoil under theweight of a working platform below the GR, or migrating voids, for example dueto old mine workings. To stay on the safe side in design, BS8006 disregardssubsoil support.
Some design guidelines, such as EBGEO (2010) and CUR (2010), accept takingsubsoil support into account. However, they only consider the subsoil beneath theGR strip under consideration between adjacent piles. Lodder et al. (2012) and VanEekelen et al. (2012b, Chapter 3 of this thesis) suggested using a modified valuefor the subgrade reaction k to take into account all subsoil17 underneath the entireGR. This suggestion is in line with the work of Jones et al. (2010), Halvordson etal. (2010), Plaut et al. (2010) and Filz et al. (2012).
17 In Chapter 3, “all subsoil” is referred to as “Modified Subsoil”.
Basal Reinforced Piled Embankments
136
5.2.3 Validation of arching, load distribution and subsoil support
Van Eekelen et al. (2013, Chapter 4 of this thesis) recommend using the CAmodel, an inverse triangular load distribution and taking into account all soilsupport underneath the GR between the piles. They validated the CA model withlaboratory experiments, numerical calculations of Le Hello and Villard (2009) andmeasurements in two full-scale cases (Van Eekelen et al., 2012c and 2015b, c, d;Van Duijnen et al., 2010). Van Eekelen et al. (2012b, Chapter 3 of this thesis)validated the inverse triangular load distribution with or without subsoil supportwith model experiments. The present paper gives additional validations for thevariations in steps 1 and 2 described in the previous chapters.
5.3 Case study descriptions
5.3.1 Introduction
This chapter briefly describes seven full-scale cases and four series of modelexperiments. Mean (best-guess) values for the parameters used in the calculationsare determined. Characteristic values, which are the values generally used indesign, cannot be used here.
The analytical models considered have been developed for cohesion-less frictionalfills. In practice, however, fills often have some level of cohesion. For designpurposes, it is advisable to disregard this cohesion. This simplification results in a‘safe’ design: greater GR strain will be calculated than if cohesion is taken intoaccount.
For the purposes of validation, however, cohesive fill is less suitable. It is possibleto take cohesion into account by increasing the friction angle. However, for smallstresses, the maximum difference between the two principal stresses is much largerfor cohesive fills than for a fill with an artificially high friction angle. This meansthat higher tangential stresses can develop in a highly cohesive fill. This can resultin a lot of arching and therefore low GR strains that are lower than any calculatedGR strain with an artificially high friction angle. This paper focuses exclusively onpiled embankments with frictional fills.
5 Validation of Analytical Models for the Design of Basal Reinforced Piled Embankments
137
The subgrade reaction coefficient k (kN/m3) was determined as follows, in order ofpreference:
- In some cases the relationship between the vertical pressure p and settlementz is known, for example for an adjacent unreinforced area subjected to thesame surcharge load. In those cases the value of k was determined using therelationship k = p/z. However, if the settlement measured in the adjacentfield is much larger than the settlement in the piled embankment, the valueselected for k should be lower. For example, in the case of Woerden(Chapter 5.3.3), it is expected that the weight of the working platform belowthe GR will have caused so much settlement that the contact between thesubsoil and the GR will be lost, resulting in k = 0 kN/m3. In other cases,subsoil support decreases when the contact between the GR and the subsoilis reduced during subsoil settlement.
- In some cases calculations were carried out using a simple 1D consolidationmodel. In those cases, the soil profile and the required soil parameters weredetermined with the results of the original soil investigation.
- In other cases, the Young’s modulus E of the subsoil in combination withthe thickness of the soft soil layer t or layers ti is known. In those cases thevalue of k was determined using the relationships given in EBGEO (2010):k = E/t, or in the case of multiple layers: k = E1 E2/(E1 t2+E2 t1). It ispossible that this leads to an underestimation of the subgrade soil reactionbecause the stiffness of the subsoil can increase due to the pre-loadingcaused by the pile installation or due to the negative friction along the pileshafts. Given this negative friction, it is not advisable to calculate k usinglarge thicknesses for soft soils.
The installation of piles in soft soil results in (1) an increase in soft soil stiffnessdue to increasing stress and (2) negative friction along the pile shafts resulting inan apparent increase of stiffness. These effects are disregarded in the present paper.
A limitation of the study in this paper is that most field tests and numericalcalculations did not continue until failure occurred and so no information isavailable about the ultimate limit state. However, model experiments by Zaeske(2001, Chapters 5.3.11 and 5.4.11) and Van Eekelen et al. (2012a, see Chapters5.3.12 and 5.4.12) did continue in many cases until failure occurred. Furthermore,the authors of the present paper believe that the available data for the workingcondition are sufficient to determine the reliability of the analytical models for theworking condition.
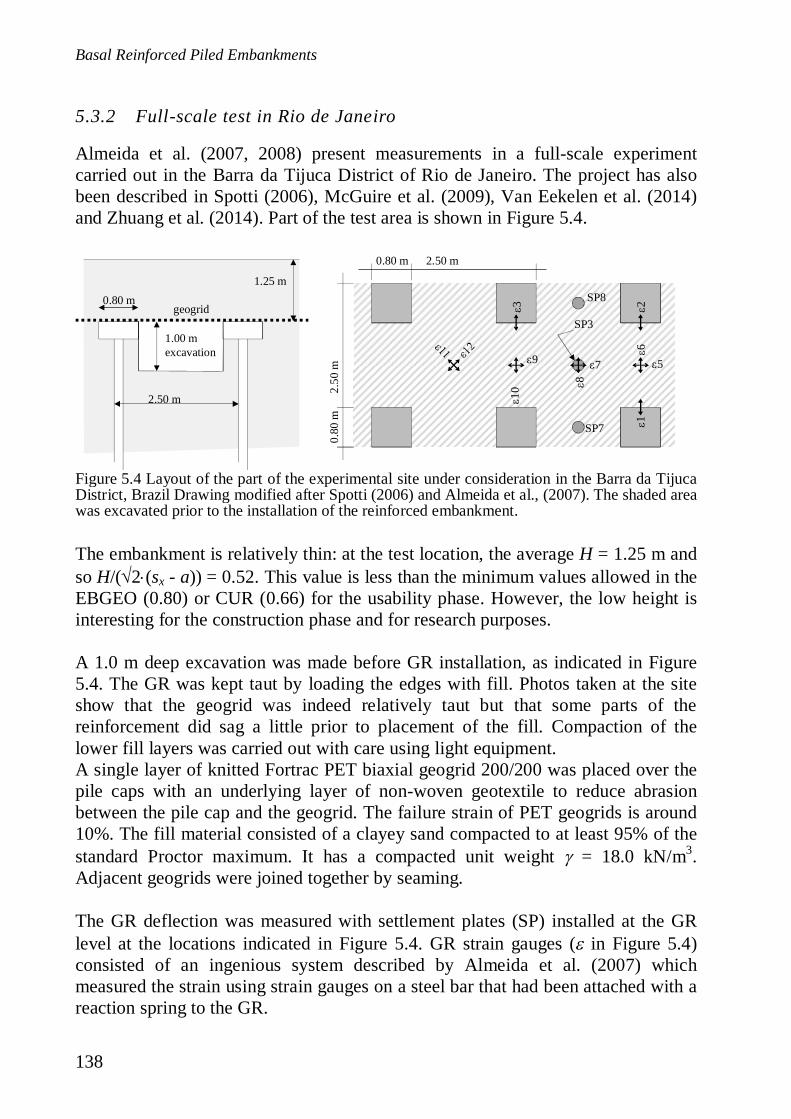
Basal Reinforced Piled Embankments
138
5.3.2 Full-scale test in Rio de Janeiro
Almeida et al. (2007, 2008) present measurements in a full-scale experimentcarried out in the Barra da Tijuca District of Rio de Janeiro. The project has alsobeen described in Spotti (2006), McGuire et al. (2009), Van Eekelen et al. (2014)and Zhuang et al. (2014). Part of the test area is shown in Figure 5.4.
The embankment is relatively thin: at the test location, the average H = 1.25 m andso H/( 2 (sx - a)) = 0.52. This value is less than the minimum values allowed in theEBGEO (0.80) or CUR (0.66) for the usability phase. However, the low height isinteresting for the construction phase and for research purposes.
A 1.0 m deep excavation was made before GR installation, as indicated in Figure5.4. The GR was kept taut by loading the edges with fill. Photos taken at the siteshow that the geogrid was indeed relatively taut but that some parts of thereinforcement did sag a little prior to placement of the fill. Compaction of thelower fill layers was carried out with care using light equipment.A single layer of knitted Fortrac PET biaxial geogrid 200/200 was placed over thepile caps with an underlying layer of non-woven geotextile to reduce abrasionbetween the pile cap and the geogrid. The failure strain of PET geogrids is around10%. The fill material consisted of a clayey sand compacted to at least 95% of thestandard Proctor maximum. It has a compacted unit weight = 18.0 kN/m3.Adjacent geogrids were joined together by seaming.
The GR deflection was measured with settlement plates (SP) installed at the GRlevel at the locations indicated in Figure 5.4. GR strain gauges ( in Figure 5.4)consisted of an ingenious system described by Almeida et al. (2007) whichmeasured the strain using strain gauges on a steel bar that had been attached with areaction spring to the GR.
0.80
m2.
50m
0.80 m 2.50 m
5
26
1
8
7
10
9
3 SP8
SP3
SP7
1.00 mexcavation
geogrid
2.50 m
0.80 m1.25 m
Figure 5.4 Layout of the part of the experimental site under consideration in the Barra da TijucaDistrict, Brazil Drawing modified after Spotti (2006) and Almeida et al., (2007). The shaded areawas excavated prior to the installation of the reinforced embankment.
5 Validation of Analytical Models for the Design of Basal Reinforced Piled Embankments
139
Determination of parametersThe stiffness J (kN/m) of the geogrid depends on the tensile force and the loadingtime. The average of the larger values for the measured GR strains is 1.5% (seeFigure 5.15). The total loading time is 188 days. The isochronous curves of theapplied geogrid give J1.5%,1 month = 1637 kN/m and the J1.5%,1 year = 1594 kN/m. Weassume that the average of these values is J1.5%,188 days = 1615 kN/m.
Table 5.1 Parameters used in the calculations of case Almeida et al. (2007, 2008).centre-to-centredistancepilessx = sy
widthsquarepilecapsa
heightfillH
unitweightfill
frictionangle fill
subgradereactionk
stiffnessGRJx = Jy
surchargeloadp
m m m kN/m3 deg kN/m3 kN/m kPa2.50 0.80 1.25 18.0 43-68a 0 1615 0a In the comparison in Chapter 5.4.2, the value of has been varied. In Chapter 5.5, = 68o has been used becausethis value gives the lowest GR strains of the two possibilities given in this chapter.
Direct shear tests on fill samples given in Spotti (2006) show an average frictionangle = 42o and an average cohesion c = 18.9 kPa. As described in Chapter 5.3.1,the high cohesion value results in a limitation for validation purposes. However, itwas believed worthwhile to include this case in this study because of theexcavation below the GR and the low embankment. It was therefore necessary tofind an equivalent friction angle for c = 0. An equivalent can be found bydetermining the fill strength at the average pressure at GR level( v = H+p = 18 1.25 = 22.5kPa). From this, it follows that:
; 0tan 22.5* tan42 18.9atan atan 60
22.5
oov
virtual cv
c(5.1)
However, McGuire et al. (2009) have found (after back-calculations frommeasurements in nearby 2D test fields): = 68o for c = 0 kPa. McGuire et al.consider these results satisfying, although their value for seems unreasonablyhigh.
To prevent misinterpretation as a result of selecting the wrong friction angle, awide range of values for was used in the calculations of this paper. Table 5.1summarises the parameters used in the calculations.
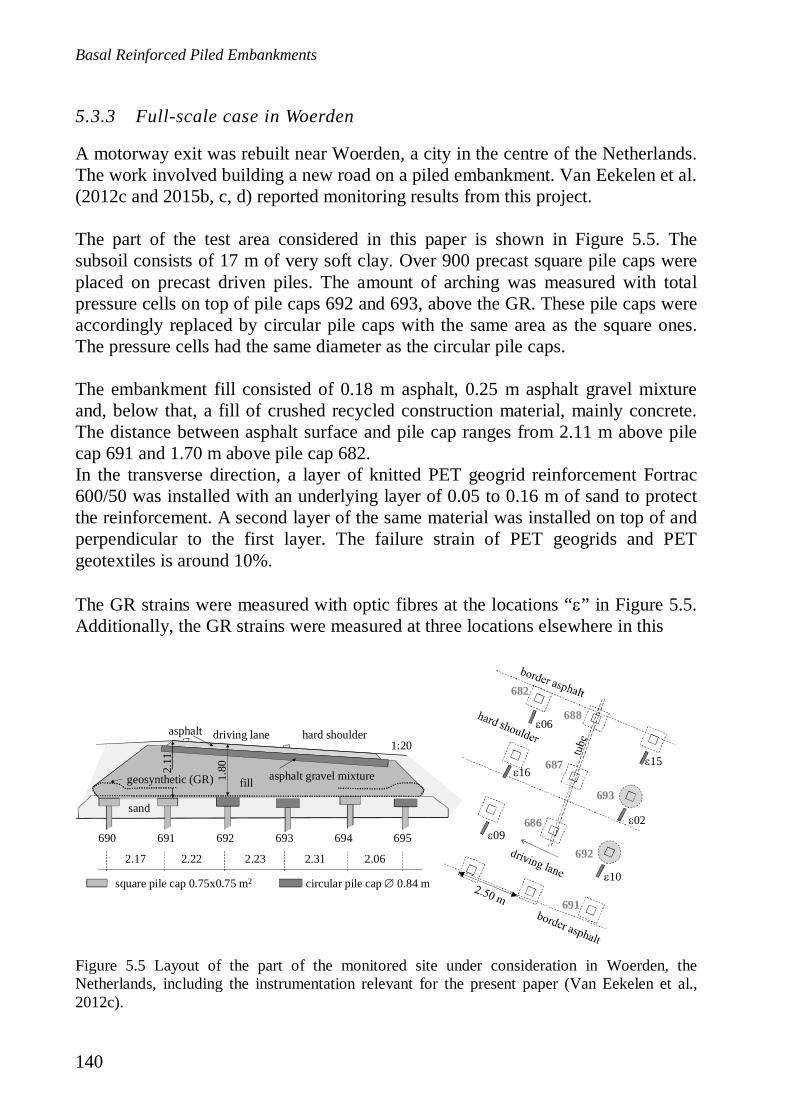
Basal Reinforced Piled Embankments
140
5.3.3 Full-scale case in Woerden
A motorway exit was rebuilt near Woerden, a city in the centre of the Netherlands.The work involved building a new road on a piled embankment. Van Eekelen et al.(2012c and 2015b, c, d) reported monitoring results from this project.
The part of the test area considered in this paper is shown in Figure 5.5. Thesubsoil consists of 17 m of very soft clay. Over 900 precast square pile caps wereplaced on precast driven piles. The amount of arching was measured with totalpressure cells on top of pile caps 692 and 693, above the GR. These pile caps wereaccordingly replaced by circular pile caps with the same area as the square ones.The pressure cells had the same diameter as the circular pile caps.
The embankment fill consisted of 0.18 m asphalt, 0.25 m asphalt gravel mixtureand, below that, a fill of crushed recycled construction material, mainly concrete.The distance between asphalt surface and pile cap ranges from 2.11 m above pilecap 691 and 1.70 m above pile cap 682.In the transverse direction, a layer of knitted PET geogrid reinforcement Fortrac600/50 was installed with an underlying layer of 0.05 to 0.16 m of sand to protectthe reinforcement. A second layer of the same material was installed on top of andperpendicular to the first layer. The failure strain of PET geogrids and PETgeotextiles is around 10%.
The GR strains were measured with optic fibres at the locations “ ” in Figure 5.5.Additionally, the GR strains were measured at three locations elsewhere in this
square pile cap 0.75x0.75 m2 circular pile cap 0.84 m
1:20
2.17
driving lane
690 691 692 693 694 695
hard shoulder
2.22 2.23 2.31 2.06
sand
fill1.80
09
15
02
06
16
10
692
693
686
687
688
asphalt gravel mixture
asphalt
691
682
geosynthetic (GR)
2.11
Figure 5.5 Layout of the part of the monitored site under consideration in Woerden, theNetherlands, including the instrumentation relevant for the present paper (Van Eekelen et al.,2012c).
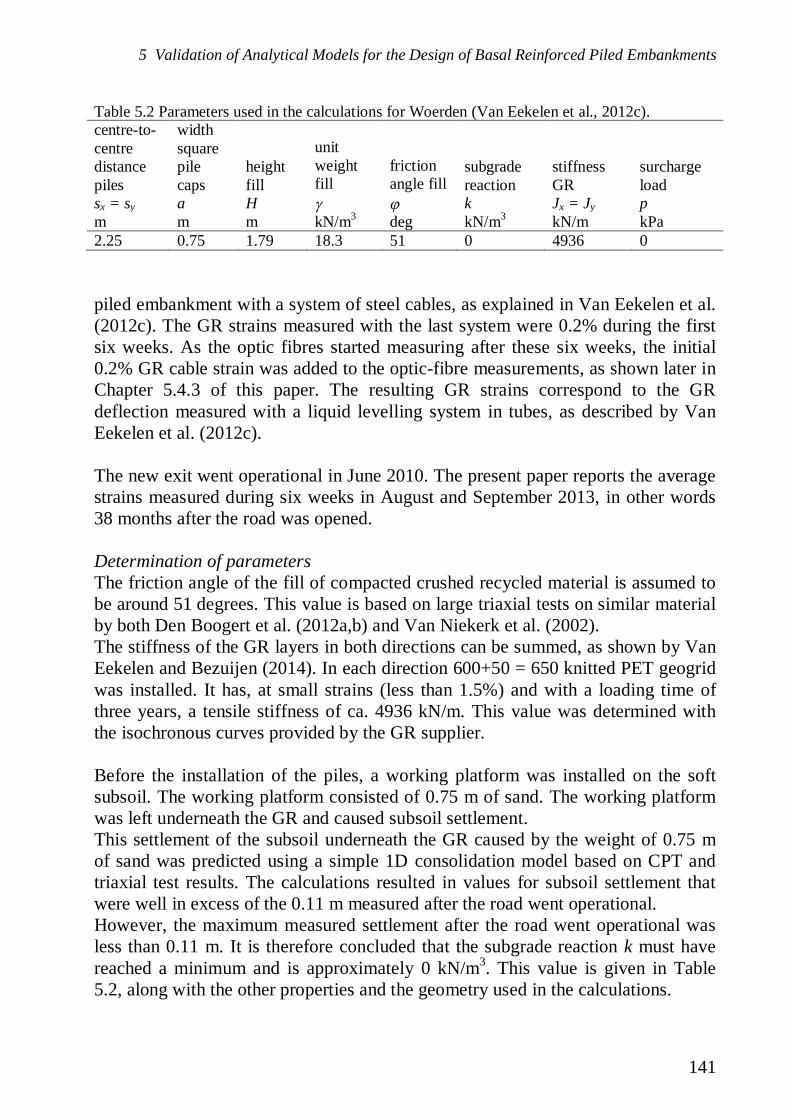
5 Validation of Analytical Models for the Design of Basal Reinforced Piled Embankments
141
Table 5.2 Parameters used in the calculations for Woerden (Van Eekelen et al., 2012c).centre-to-centredistancepilessx = sy
widthsquarepilecapsa
heightfillH
unitweightfill
frictionangle fill
subgradereactionk
stiffnessGRJx = Jy
surchargeloadp
m m m kN/m3 deg kN/m3 kN/m kPa2.25 0.75 1.79 18.3 51 0 4936 0
piled embankment with a system of steel cables, as explained in Van Eekelen et al.(2012c). The GR strains measured with the last system were 0.2% during the firstsix weeks. As the optic fibres started measuring after these six weeks, the initial0.2% GR cable strain was added to the optic-fibre measurements, as shown later inChapter 5.4.3 of this paper. The resulting GR strains correspond to the GRdeflection measured with a liquid levelling system in tubes, as described by VanEekelen et al. (2012c).
The new exit went operational in June 2010. The present paper reports the averagestrains measured during six weeks in August and September 2013, in other words38 months after the road was opened.
Determination of parametersThe friction angle of the fill of compacted crushed recycled material is assumed tobe around 51 degrees. This value is based on large triaxial tests on similar materialby both Den Boogert et al. (2012a,b) and Van Niekerk et al. (2002).The stiffness of the GR layers in both directions can be summed, as shown by VanEekelen and Bezuijen (2014). In each direction 600+50 = 650 knitted PET geogridwas installed. It has, at small strains (less than 1.5%) and with a loading time ofthree years, a tensile stiffness of ca. 4936 kN/m. This value was determined withthe isochronous curves provided by the GR supplier.
Before the installation of the piles, a working platform was installed on the softsubsoil. The working platform consisted of 0.75 m of sand. The working platformwas left underneath the GR and caused subsoil settlement.This settlement of the subsoil underneath the GR caused by the weight of 0.75 mof sand was predicted using a simple 1D consolidation model based on CPT andtriaxial test results. The calculations resulted in values for subsoil settlement thatwere well in excess of the 0.11 m measured after the road went operational.However, the maximum measured settlement after the road went operational wasless than 0.11 m. It is therefore concluded that the subgrade reaction k must havereached a minimum and is approximately 0 kN/m3. This value is given in Table5.2, along with the other properties and the geometry used in the calculations.
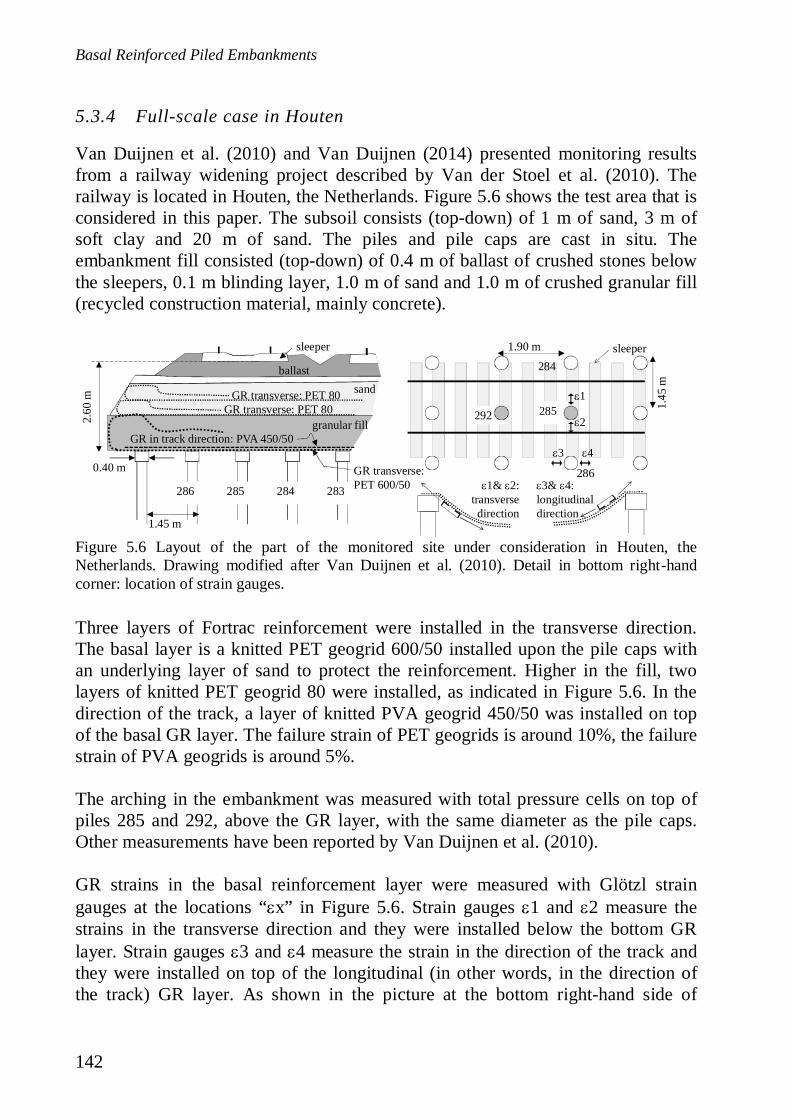
Basal Reinforced Piled Embankments
142
5.3.4 Full-scale case in Houten
Van Duijnen et al. (2010) and Van Duijnen (2014) presented monitoring resultsfrom a railway widening project described by Van der Stoel et al. (2010). Therailway is located in Houten, the Netherlands. Figure 5.6 shows the test area that isconsidered in this paper. The subsoil consists (top-down) of 1 m of sand, 3 m ofsoft clay and 20 m of sand. The piles and pile caps are cast in situ. Theembankment fill consisted (top-down) of 0.4 m of ballast of crushed stones belowthe sleepers, 0.1 m blinding layer, 1.0 m of sand and 1.0 m of crushed granular fill(recycled construction material, mainly concrete).
Three layers of Fortrac reinforcement were installed in the transverse direction.The basal layer is a knitted PET geogrid 600/50 installed upon the pile caps withan underlying layer of sand to protect the reinforcement. Higher in the fill, twolayers of knitted PET geogrid 80 were installed, as indicated in Figure 5.6. In thedirection of the track, a layer of knitted PVA geogrid 450/50 was installed on topof the basal GR layer. The failure strain of PET geogrids is around 10%, the failurestrain of PVA geogrids is around 5%.
The arching in the embankment was measured with total pressure cells on top ofpiles 285 and 292, above the GR layer, with the same diameter as the pile caps.Other measurements have been reported by Van Duijnen et al. (2010).
GR strains in the basal reinforcement layer were measured with Glötzl straingauges at the locations “ x” in Figure 5.6. Strain gauges 1 and 2 measure thestrains in the transverse direction and they were installed below the bottom GRlayer. Strain gauges 3 and 4 measure the strain in the direction of the track andthey were installed on top of the longitudinal (in other words, in the direction ofthe track) GR layer. As shown in the picture at the bottom right-hand side of
sleeper
285 1.45
m
1.90 m
284
286
1
2
3 4
292
0.40 m
1.45 m
2.60
m
285 284 283286
sleeper
GR transverse:PET 600/50
GR in track direction: PVA 450/50
GR transverse: PET 80GR transverse: PET 80
ballastsand
granular fill
3& 4:longitudinaldirection
1& 2:transversedirection
Figure 5.6 Layout of the part of the monitored site under consideration in Houten, theNetherlands. Drawing modified after Van Duijnen et al. (2010). Detail in bottom right-handcorner: location of strain gauges.

5 Validation of Analytical Models for the Design of Basal Reinforced Piled Embankments
143
Figure 5.6, it is expected that strain gauges 1 and 2 could result in a higher GRstrain than the real GR strain due to the curvature of the deflected GR. Straingauges 3 and 4, however, might measure a smaller strain than the real GR straindue to the bending.The railway went operational in November 2008. This paper reports the average ofthe strains measured in 2010.
Determination of parametersThe fill material consists of different layers, as indicated in Figure 5.6. It isassumed that the bottom level is decisive for the arching. This layer is comparableto the fill in Woerden and its friction angle is also assumed to be around 51degrees, as explained in Chapter 5.3.3.
The stiffness of the reinforcement was determined as follows. In the longitudinaldirection, the total reinforcement consists of woven PVA geogrid 450 + wovenPET geogrid 50. The stiffness of the separate layers may be summed, as describedin Van Eekelen and Bezuijen (2014). At a maximum 1.5 % strain and a loadingtime of two years, this gives a tensile stiffness Jalong = 5237 kN/m. In the transversedirection, the two upper layers were installed quite a large distance above the pilecaps and it is therefore assumed that it is not correct to add their stiffness to thetotal stiffness. The total reinforcement is therefore woven PET grid 600 + wovenPVA grid 50. At small strains (max 1.5%) and a loading time of two years, thisgives a tensile stiffness Jacross = 5208 kN/m. These values were determined with theisochronous curves provided by the GR supplier.
Table 5.3 Parameters used in the calculations for Houten (Van Duijnen et al., 2010).centre-to-centredistancepilessx along
centre-to-centredistancepilessy across
dia-metercircularpilecapsd
heightfillH
unitweightfill
frictionanglefill
subgradereactionk
stiffnessGRalongJx
stiffnessGRacrossJy
sur-chargeloadp
m m m m kN/m3 deg kN/m3 kN/m kN/m kPa1.90 1.45 0.40 2.60 18.3 51 480 5237 5208 0
The subgrade reaction k was calculated using a 1D consolidation model thatincluded parameters derived from CPT and triaxial test results. Later, settlementmeasurements became available for a nearby embankment on the same subsoil. Itwas concluded that the measured settlement was 30% less than predicted. Thesubgrade reaction was therefore divided by 0.7 to obtain a more realistic value. Theresulting value is given in Table 5.3, along with the other properties and thegeometry used in the calculations.
Basal Reinforced Piled Embankments
144
5.3.5 Large-scale French experiments
Briançon and Simon (2012) and, for example, Nunez et al. (2013) reported a seriesof large-scale tests. The researchers carried out tests in four test fields. Two ofthem are considered in this paper: test fields 3R and 4R. The researchers placed8 4 circular concrete piles in a square arrangement in each test field, as indicatedin Figure 5.7. No pile caps were installed.
The load transfer platform in test field 3R consisted of (bottom-up) a 0.15 mworking platform, 0.2 m of industrial gravel (0-31.5 mm), a layer of biaxial PETgeotextile and 0.2 m of industrial gravel. The failure strain of PET geotextiles isaround 10%. The industrial gravel consisted of crushed recycled road constructionmaterial.
The load transfer platform of test field 4R consisted of (bottom-up) a 0.15 mworking platform, 0.2 m of industrial gravel (0-31.5 mm), a layer of biaxialgeogrid, 0.2 m of industrial gravel, another biaxial geogrid and 0.1 m of industrialgravel. At the embankment edges, the GR was wrapped around and anchored backinto the embankment.
The rest of the embankment was a marly and chalky natural soil. The total heightof the embankment was 5.0 m. Settlement was measured at locations Ti in Figure5.7. Optic fibres (Geodetect® strips) were used to measure GR strains in field 3R,as indicated with in Figure 5.7.
Ti
2.0 m2.
0m
Ti Ti
5.0
m
2.0 m
0.38 m
test field 3R test field 4R
1 layer biaxial geotextile 2 layers biaxial geogrid
Figure 5.7 Layout of the part of fields 3R and 4R under consideration in the large-scale tests inFrance with settlement transducers Ti. Drawing modified after Briançon and Simon (2012).
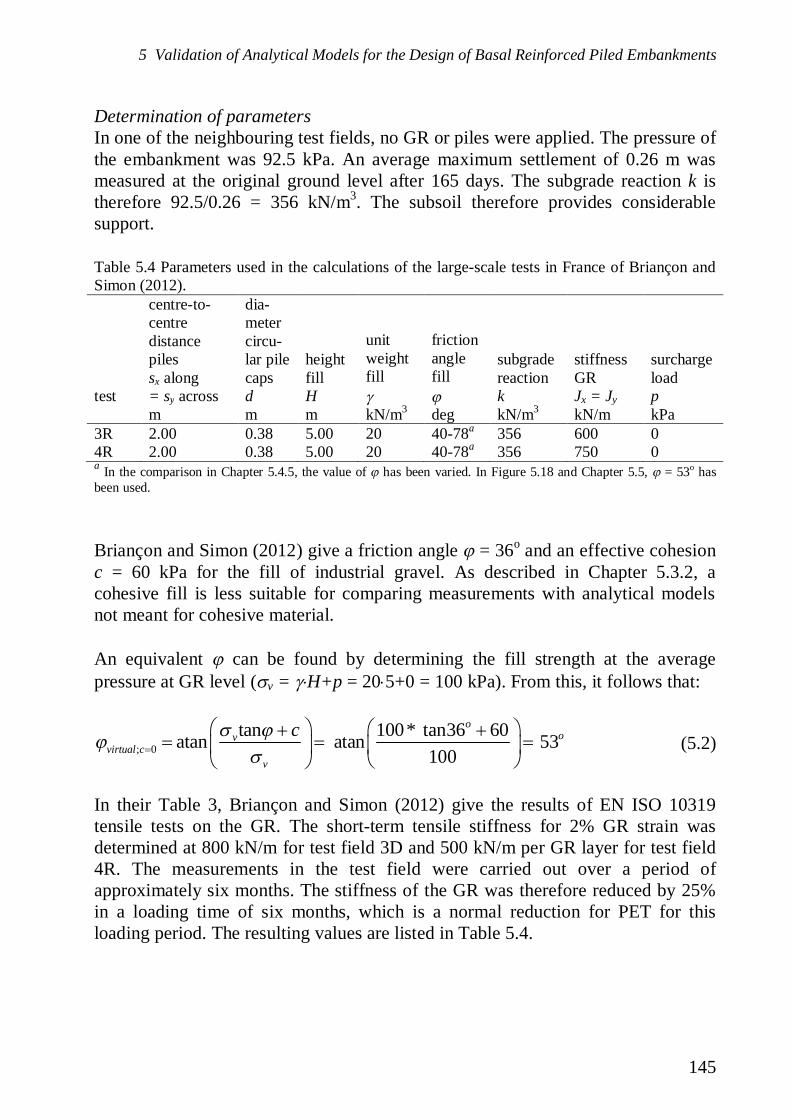
5 Validation of Analytical Models for the Design of Basal Reinforced Piled Embankments
145
Determination of parametersIn one of the neighbouring test fields, no GR or piles were applied. The pressure ofthe embankment was 92.5 kPa. An average maximum settlement of 0.26 m wasmeasured at the original ground level after 165 days. The subgrade reaction k istherefore 92.5/0.26 = 356 kN/m3. The subsoil therefore provides considerablesupport.
Table 5.4 Parameters used in the calculations of the large-scale tests in France of Briançon andSimon (2012).
test
centre-to-centredistancepilessx along= sy across
dia-metercircu-lar pilecapsd
heightfillH
unitweightfill
frictionanglefill
subgradereactionk
stiffnessGRJx = Jy
surchargeloadp
m m m kN/m3 deg kN/m3 kN/m kPa3R 2.00 0.38 5.00 20 40-78a 356 600 04R 2.00 0.38 5.00 20 40-78a 356 750 0a In the comparison in Chapter 5.4.5, the value of has been varied. In Figure 5.18 and Chapter 5.5, = 53o hasbeen used.
Briançon and Simon (2012) give a friction angle = 36o and an effective cohesionc = 60 kPa for the fill of industrial gravel. As described in Chapter 5.3.2, acohesive fill is less suitable for comparing measurements with analytical modelsnot meant for cohesive material.
An equivalent can be found by determining the fill strength at the averagepressure at GR level ( v = H+p = 20 5+0 = 100 kPa). From this, it follows that:
; 0tan 100* tan36 60atan
10at
0an 53
oov
virtual cv
c(5.2)
In their Table 3, Briançon and Simon (2012) give the results of EN ISO 10319tensile tests on the GR. The short-term tensile stiffness for 2% GR strain wasdetermined at 800 kN/m for test field 3D and 500 kN/m per GR layer for test field4R. The measurements in the test field were carried out over a period ofapproximately six months. The stiffness of the GR was therefore reduced by 25%in a loading time of six months, which is a normal reduction for PET for thisloading period. The resulting values are listed in Table 5.4.
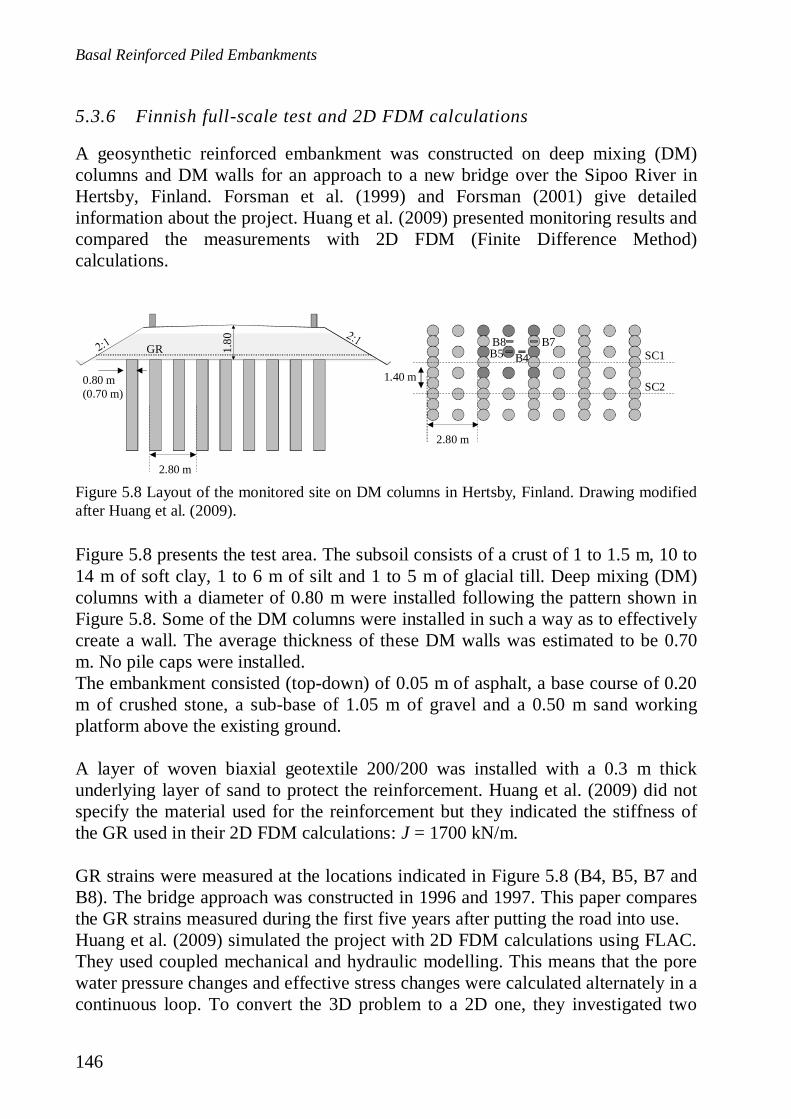
Basal Reinforced Piled Embankments
146
5.3.6 Finnish full-scale test and 2D FDM calculations
A geosynthetic reinforced embankment was constructed on deep mixing (DM)columns and DM walls for an approach to a new bridge over the Sipoo River inHertsby, Finland. Forsman et al. (1999) and Forsman (2001) give detailedinformation about the project. Huang et al. (2009) presented monitoring results andcompared the measurements with 2D FDM (Finite Difference Method)calculations.
Figure 5.8 presents the test area. The subsoil consists of a crust of 1 to 1.5 m, 10 to14 m of soft clay, 1 to 6 m of silt and 1 to 5 m of glacial till. Deep mixing (DM)columns with a diameter of 0.80 m were installed following the pattern shown inFigure 5.8. Some of the DM columns were installed in such a way as to effectivelycreate a wall. The average thickness of these DM walls was estimated to be 0.70m. No pile caps were installed.The embankment consisted (top-down) of 0.05 m of asphalt, a base course of 0.20m of crushed stone, a sub-base of 1.05 m of gravel and a 0.50 m sand workingplatform above the existing ground.
A layer of woven biaxial geotextile 200/200 was installed with a 0.3 m thickunderlying layer of sand to protect the reinforcement. Huang et al. (2009) did notspecify the material used for the reinforcement but they indicated the stiffness ofthe GR used in their 2D FDM calculations: J = 1700 kN/m.
GR strains were measured at the locations indicated in Figure 5.8 (B4, B5, B7 andB8). The bridge approach was constructed in 1996 and 1997. This paper comparesthe GR strains measured during the first five years after putting the road into use.Huang et al. (2009) simulated the project with 2D FDM calculations using FLAC.They used coupled mechanical and hydraulic modelling. This means that the porewater pressure changes and effective stress changes were calculated alternately in acontinuous loop. To convert the 3D problem to a 2D one, they investigated two
B4B5B7B8GR
0.80 m(0.70 m)
SC1
2.80 m
1.40 m
2.80 m
SC2
1.80
Figure 5.8 Layout of the monitored site on DM columns in Hertsby, Finland. Drawing modifiedafter Huang et al. (2009).
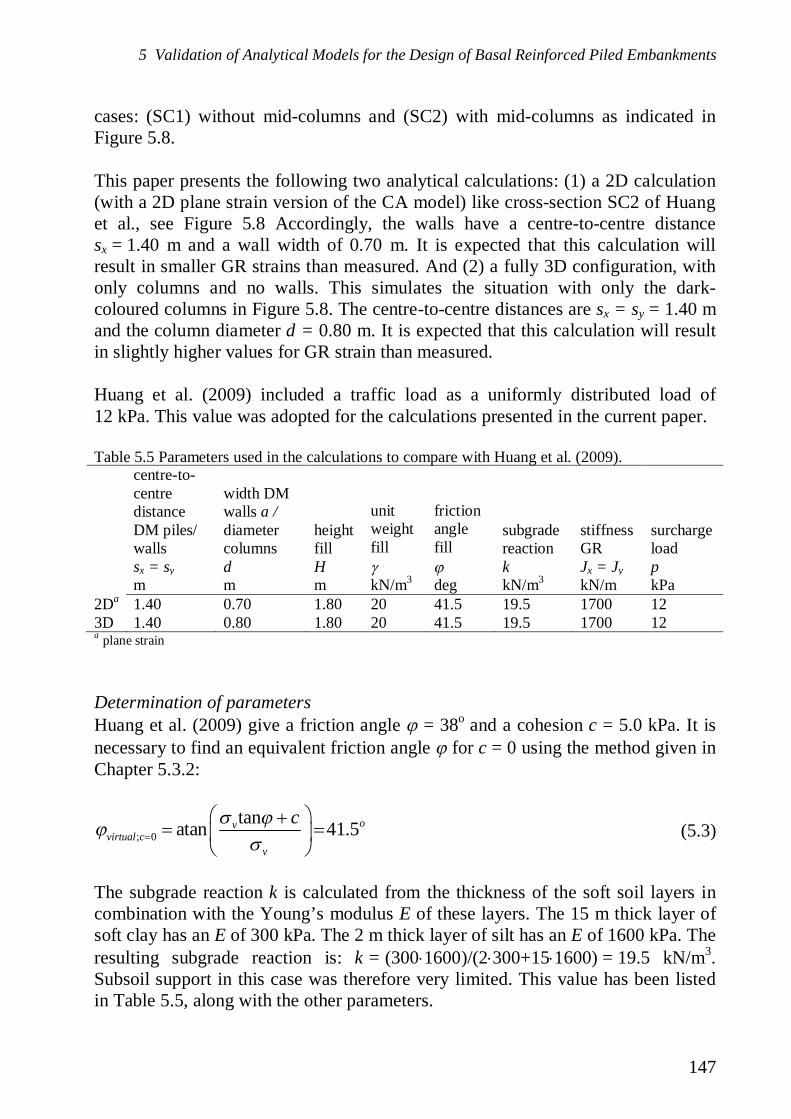
5 Validation of Analytical Models for the Design of Basal Reinforced Piled Embankments
147
cases: (SC1) without mid-columns and (SC2) with mid-columns as indicated inFigure 5.8.
This paper presents the following two analytical calculations: (1) a 2D calculation(with a 2D plane strain version of the CA model) like cross-section SC2 of Huanget al., see Figure 5.8 Accordingly, the walls have a centre-to-centre distancesx = 1.40 m and a wall width of 0.70 m. It is expected that this calculation willresult in smaller GR strains than measured. And (2) a fully 3D configuration, withonly columns and no walls. This simulates the situation with only the dark-coloured columns in Figure 5.8. The centre-to-centre distances are sx = sy = 1.40 mand the column diameter d = 0.80 m. It is expected that this calculation will resultin slightly higher values for GR strain than measured.
Huang et al. (2009) included a traffic load as a uniformly distributed load of12 kPa. This value was adopted for the calculations presented in the current paper.
Table 5.5 Parameters used in the calculations to compare with Huang et al. (2009).centre-to-centredistanceDM piles/wallssx = sy
width DMwalls a /diametercolumnsd
heightfillH
unitweightfill
frictionanglefill
subgradereactionk
stiffnessGRJx = Jy
surchargeloadp
m m m kN/m3 deg kN/m3 kN/m kPa2Da 1.40 0.70 1.80 20 41.5 19.5 1700 123D 1.40 0.80 1.80 20 41.5 19.5 1700 12a plane strain
Determination of parametersHuang et al. (2009) give a friction angle = 38o and a cohesion c = 5.0 kPa. It isnecessary to find an equivalent friction angle for c = 0 using the method given inChapter 5.3.2:
; 0tanatan 41.5ov
virtual cv
c(5.3)
The subgrade reaction k is calculated from the thickness of the soft soil layers incombination with the Young’s modulus E of these layers. The 15 m thick layer ofsoft clay has an E of 300 kPa. The 2 m thick layer of silt has an E of 1600 kPa. Theresulting subgrade reaction is: k = (300 1600)/(2 300+15 1600) = 19.5 kN/m3.Subsoil support in this case was therefore very limited. This value has been listedin Table 5.5, along with the other parameters.
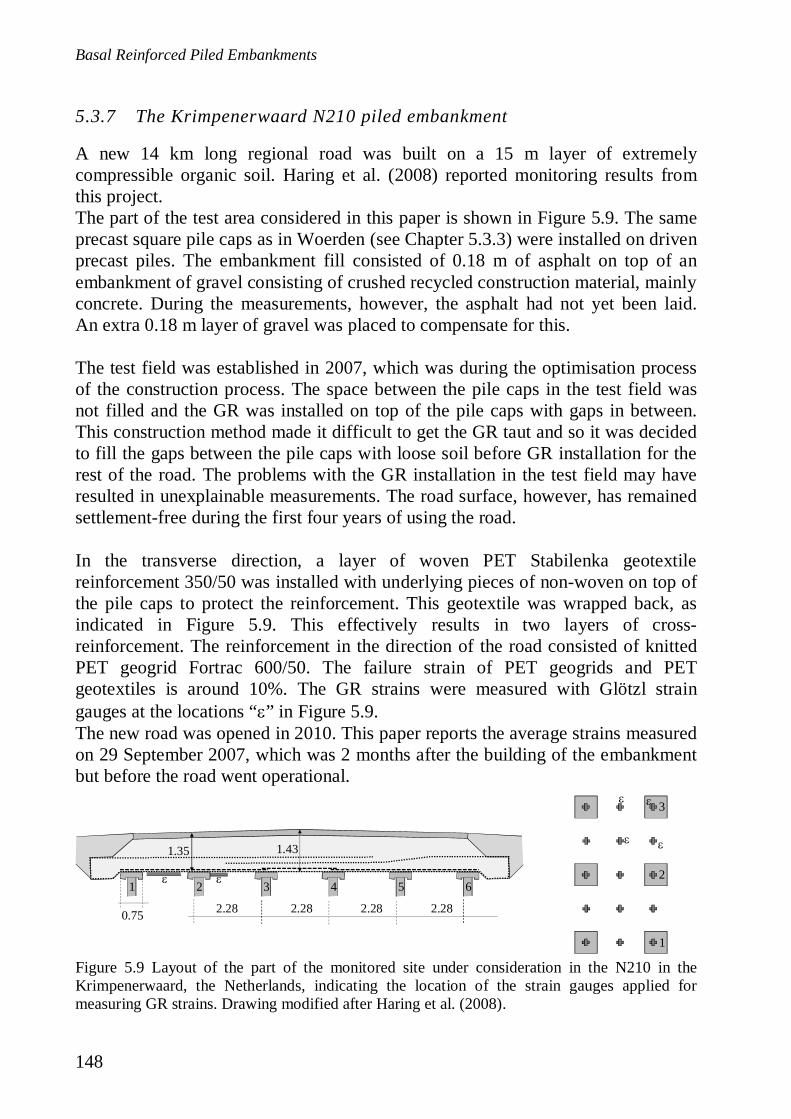
Basal Reinforced Piled Embankments
148
5.3.7 The Krimpenerwaard N210 piled embankment
A new 14 km long regional road was built on a 15 m layer of extremelycompressible organic soil. Haring et al. (2008) reported monitoring results fromthis project.The part of the test area considered in this paper is shown in Figure 5.9. The sameprecast square pile caps as in Woerden (see Chapter 5.3.3) were installed on drivenprecast piles. The embankment fill consisted of 0.18 m of asphalt on top of anembankment of gravel consisting of crushed recycled construction material, mainlyconcrete. During the measurements, however, the asphalt had not yet been laid.An extra 0.18 m layer of gravel was placed to compensate for this.
The test field was established in 2007, which was during the optimisation processof the construction process. The space between the pile caps in the test field wasnot filled and the GR was installed on top of the pile caps with gaps in between.This construction method made it difficult to get the GR taut and so it was decidedto fill the gaps between the pile caps with loose soil before GR installation for therest of the road. The problems with the GR installation in the test field may haveresulted in unexplainable measurements. The road surface, however, has remainedsettlement-free during the first four years of using the road.
In the transverse direction, a layer of woven PET Stabilenka geotextilereinforcement 350/50 was installed with underlying pieces of non-woven on top ofthe pile caps to protect the reinforcement. This geotextile was wrapped back, asindicated in Figure 5.9. This effectively results in two layers of cross-reinforcement. The reinforcement in the direction of the road consisted of knittedPET geogrid Fortrac 600/50. The failure strain of PET geogrids and PETgeotextiles is around 10%. The GR strains were measured with Glötzl straingauges at the locations “ ” in Figure 5.9.The new road was opened in 2010. This paper reports the average strains measuredon 29 September 2007, which was 2 months after the building of the embankmentbut before the road went operational.
PET 350/50 PET 600/50
2.28 2.28 2.28 2.280.75
1.431.35
1 32 4 5 6
3
2
1
Figure 5.9 Layout of the part of the monitored site under consideration in the N210 in theKrimpenerwaard, the Netherlands, indicating the location of the strain gauges applied formeasuring GR strains. Drawing modified after Haring et al. (2008).
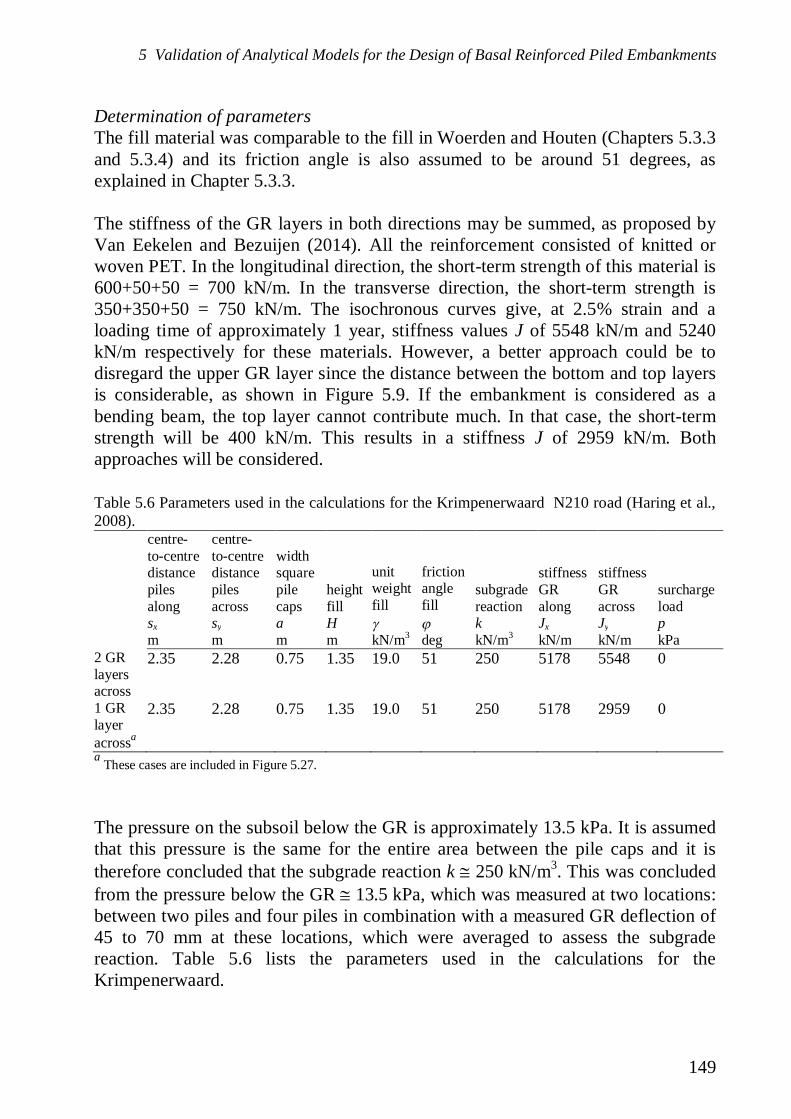
5 Validation of Analytical Models for the Design of Basal Reinforced Piled Embankments
149
Determination of parametersThe fill material was comparable to the fill in Woerden and Houten (Chapters 5.3.3and 5.3.4) and its friction angle is also assumed to be around 51 degrees, asexplained in Chapter 5.3.3.
The stiffness of the GR layers in both directions may be summed, as proposed byVan Eekelen and Bezuijen (2014). All the reinforcement consisted of knitted orwoven PET. In the longitudinal direction, the short-term strength of this material is600+50+50 = 700 kN/m. In the transverse direction, the short-term strength is350+350+50 = 750 kN/m. The isochronous curves give, at 2.5% strain and aloading time of approximately 1 year, stiffness values J of 5548 kN/m and 5240kN/m respectively for these materials. However, a better approach could be todisregard the upper GR layer since the distance between the bottom and top layersis considerable, as shown in Figure 5.9. If the embankment is considered as abending beam, the top layer cannot contribute much. In that case, the short-termstrength will be 400 kN/m. This results in a stiffness J of 2959 kN/m. Bothapproaches will be considered.
Table 5.6 Parameters used in the calculations for the Krimpenerwaard N210 road (Haring et al.,2008).
centre-to-centredistancepilesalongsx
centre-to-centredistancepilesacrosssy
widthsquarepilecapsa
heightfillH
unitweightfill
frictionanglefill
subgradereactionk
stiffnessGRalongJx
stiffnessGRacrossJy
surchargeloadp
m m m m kN/m3 deg kN/m3 kN/m kN/m kPa2 GRlayersacross
2.35 2.28 0.75 1.35 19.0 51 250 5178 5548 0
1 GRlayeracrossa
2.35 2.28 0.75 1.35 19.0 51 250 5178 2959 0
a These cases are included in Figure 5.27.
The pressure on the subsoil below the GR is approximately 13.5 kPa. It is assumedthat this pressure is the same for the entire area between the pile caps and it istherefore concluded that the subgrade reaction k 250 kN/m3. This was concludedfrom the pressure below the GR 13.5 kPa, which was measured at two locations:between two piles and four piles in combination with a measured GR deflection of45 to 70 mm at these locations, which were averaged to assess the subgradereaction. Table 5.6 lists the parameters used in the calculations for theKrimpenerwaard.
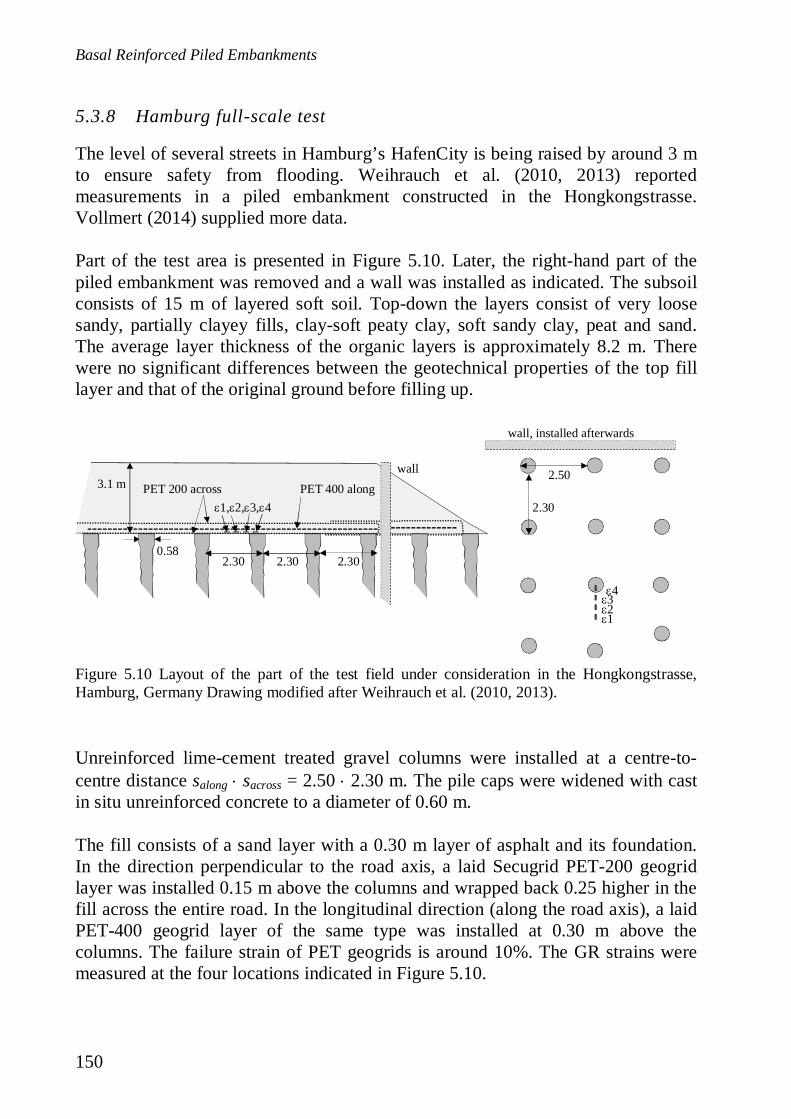
Basal Reinforced Piled Embankments
150
5.3.8 Hamburg full-scale test
The level of several streets in Hamburg’s HafenCity is being raised by around 3 mto ensure safety from flooding. Weihrauch et al. (2010, 2013) reportedmeasurements in a piled embankment constructed in the Hongkongstrasse.Vollmert (2014) supplied more data.
Part of the test area is presented in Figure 5.10. Later, the right-hand part of thepiled embankment was removed and a wall was installed as indicated. The subsoilconsists of 15 m of layered soft soil. Top-down the layers consist of very loosesandy, partially clayey fills, clay-soft peaty clay, soft sandy clay, peat and sand.The average layer thickness of the organic layers is approximately 8.2 m. Therewere no significant differences between the geotechnical properties of the top filllayer and that of the original ground before filling up.
Unreinforced lime-cement treated gravel columns were installed at a centre-to-centre distance salong sacross = 2.50 2.30 m. The pile caps were widened with castin situ unreinforced concrete to a diameter of 0.60 m.
The fill consists of a sand layer with a 0.30 m layer of asphalt and its foundation.In the direction perpendicular to the road axis, a laid Secugrid PET-200 geogridlayer was installed 0.15 m above the columns and wrapped back 0.25 higher in thefill across the entire road. In the longitudinal direction (along the road axis), a laidPET-400 geogrid layer of the same type was installed at 0.30 m above thecolumns. The failure strain of PET geogrids is around 10%. The GR strains weremeasured at the four locations indicated in Figure 5.10.
2.30 2.30
4321
1, 2, 3, 4PET 200 across PET 400 along
2.50
2.30
wall, installed afterwards
3.1 m
0.582.30
wall
Figure 5.10 Layout of the part of the test field under consideration in the Hongkongstrasse,Hamburg, Germany Drawing modified after Weihrauch et al. (2010, 2013).
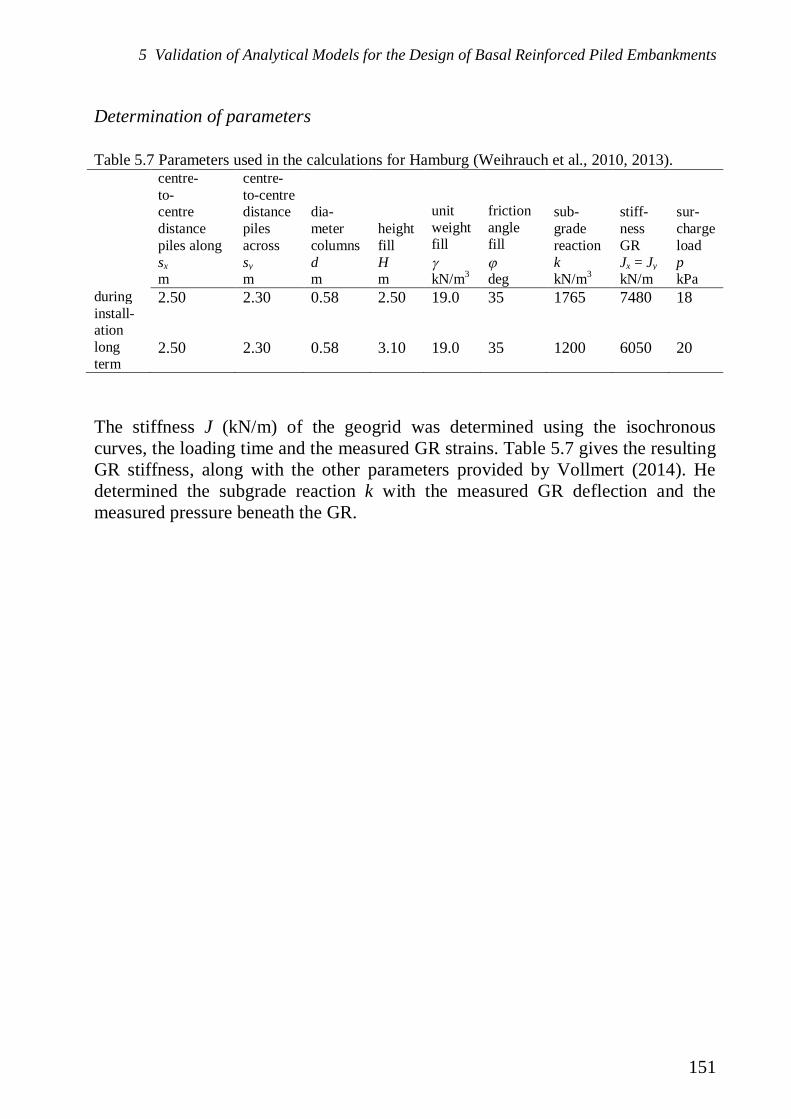
5 Validation of Analytical Models for the Design of Basal Reinforced Piled Embankments
151
Determination of parameters
Table 5.7 Parameters used in the calculations for Hamburg (Weihrauch et al., 2010, 2013).centre-to-centredistancepiles alongsx
centre-to-centredistancepilesacrosssy
dia-metercolumnsd
heightfillH
unitweightfill
frictionanglefill
sub-gradereactionk
stiff-nessGRJx = Jy
sur-chargeloadp
m m m m kN/m3 deg kN/m3 kN/m kPaduringinstall-ation
2.50 2.30 0.58 2.50 19.0 35 1765 7480 18
longterm
2.50 2.30 0.58 3.10 19.0 35 1200 6050 20
The stiffness J (kN/m) of the geogrid was determined using the isochronouscurves, the loading time and the measured GR strains. Table 5.7 gives the resultingGR stiffness, along with the other parameters provided by Vollmert (2014). Hedetermined the subgrade reaction k with the measured GR deflection and themeasured pressure beneath the GR.
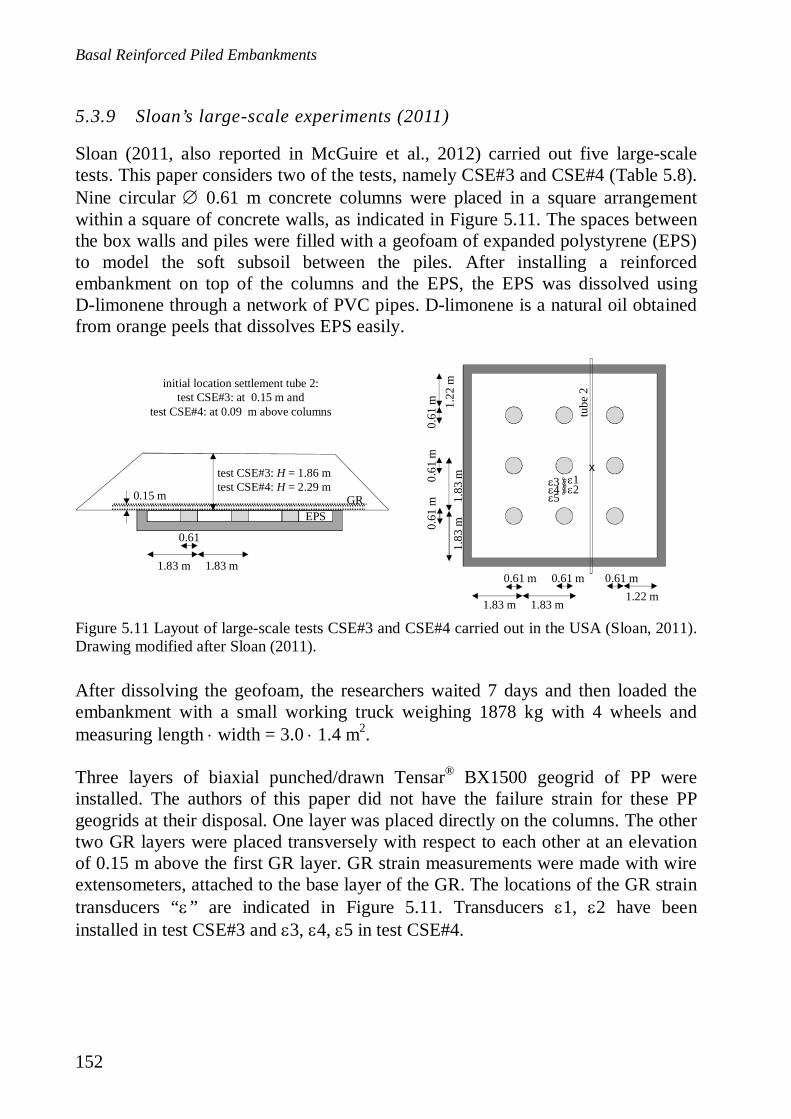
Basal Reinforced Piled Embankments
152
5.3.9 Sloan’s large-scale experiments (2011)
Sloan (2011, also reported in McGuire et al., 2012) carried out five large-scaletests. This paper considers two of the tests, namely CSE#3 and CSE#4 (Table 5.8).Nine circular 0.61 m concrete columns were placed in a square arrangementwithin a square of concrete walls, as indicated in Figure 5.11. The spaces betweenthe box walls and piles were filled with a geofoam of expanded polystyrene (EPS)to model the soft subsoil between the piles. After installing a reinforcedembankment on top of the columns and the EPS, the EPS was dissolved usingD-limonene through a network of PVC pipes. D-limonene is a natural oil obtainedfrom orange peels that dissolves EPS easily.
After dissolving the geofoam, the researchers waited 7 days and then loaded theembankment with a small working truck weighing 1878 kg with 4 wheels andmeasuring length width = 3.0 1.4 m2.
Three layers of biaxial punched/drawn Tensar® BX1500 geogrid of PP wereinstalled. The authors of this paper did not have the failure strain for these PPgeogrids at their disposal. One layer was placed directly on the columns. The othertwo GR layers were placed transversely with respect to each other at an elevationof 0.15 m above the first GR layer. GR strain measurements were made with wireextensometers, attached to the base layer of the GR. The locations of the GR straintransducers “ ” are indicated in Figure 5.11. Transducers 1, 2 have beeninstalled in test CSE#3 and 3, 4, 5 in test CSE#4.
0.15 m
EPS
test CSE#3: H = 1.86 mtest CSE#4: H = 2.29 m
1.83 m 1.83 m
0.61
345
12
initial location settlement tube 2:test CSE#3: at 0.15 m and
test CSE#4: at 0.09 m above columns tube
2
GR
x
0.61 m 0.61 m 0.61 m1.22 m
1.83 m 1.83 m
0.61
m0.
61m
0.61
m 1.22
m1.
83m
1.83
m
Figure 5.11 Layout of large-scale tests CSE#3 and CSE#4 carried out in the USA (Sloan, 2011).Drawing modified after Sloan (2011).

5 Validation of Analytical Models for the Design of Basal Reinforced Piled Embankments
153
Table 5.8 Parameters used in the calculations for the large-scale experiments of Sloan (2011).
test
centre-to-centredistancepilessalong =sacross
dia-metercircu-larpilecapsd
heightfillH
unitweightfill
frictionanglefill
subgradereactionk
stiffnessGRalongJx
stiffnessGRacrossJy
sur-chargeloadp
m m m kN/m3 deg kN/m3 kN/m kN/m kPaCSE#3 1.83 0.61 1.86 22.00 45 0 493 a 569a 0CSE#4 1.83 0.61 2.29 21.53 45 0 493 a 569 a 0a On the basis of the illustrations in Sloan (2006), it is assumed that the GR strain measurements were made in thetransverse direction, and therefore that Jx = 493 kN/m.
The fill consisted of gravel with 5% fines. This relatively low fines content waschosen to reduce the risk of an artificially high strength due to negative pore waterpressure. The fill was compacted dry to avoid capillarity and increased strengthdue to negative pore water pressures.
Determination of parametersLarge GR strains were measured during the piled embankment tests. Sloan (2006,table 7.3) gives the rapid loading tensile stiffness of the reinforcement for severalstrains and states that stiffness falls by approximately 55% during the experiments.At 8% strain and a loading time of 7 days, this results in the following tensilestiffness: in machine direction (MD) 139 kN/m and in XMD direction 215 kN/mper layer. Consequently, the total stiffness in one direction (MD+MD+XMD) is2 139+215 = 493 kN/m. In the other direction, the total stiffness is(XMD+XMD+MD) = 569 kN/m. It is possible that the reduction of the stiffness by55% is not accurate as PP is a material that creeps considerably. The resultingvalues are stated in Table 5.8, along with the other geometry and materialproperties. The value for the fill friction angle was taken from Sloan (2011).
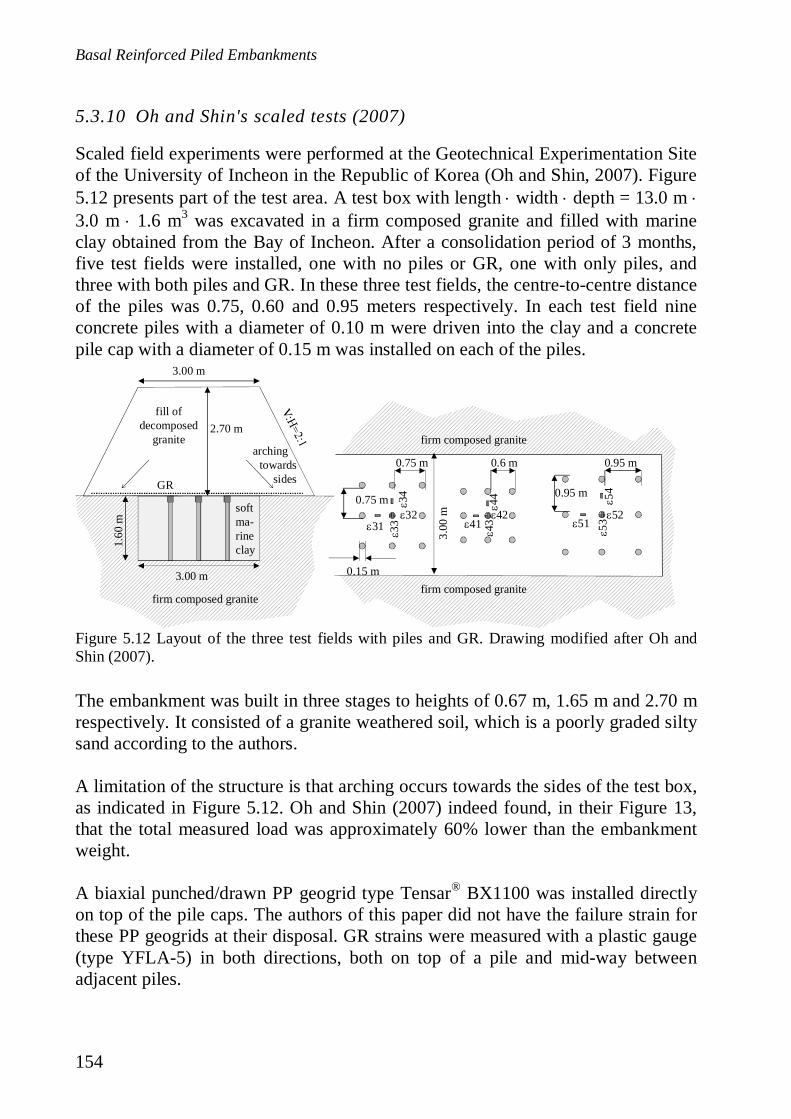
Basal Reinforced Piled Embankments
154
5.3.10 Oh and Shin's scaled tests (2007)
Scaled field experiments were performed at the Geotechnical Experimentation Siteof the University of Incheon in the Republic of Korea (Oh and Shin, 2007). Figure5.12 presents part of the test area. A test box with length width depth = 13.0 m3.0 m 1.6 m3 was excavated in a firm composed granite and filled with marineclay obtained from the Bay of Incheon. After a consolidation period of 3 months,five test fields were installed, one with no piles or GR, one with only piles, andthree with both piles and GR. In these three test fields, the centre-to-centre distanceof the piles was 0.75, 0.60 and 0.95 meters respectively. In each test field nineconcrete piles with a diameter of 0.10 m were driven into the clay and a concretepile cap with a diameter of 0.15 m was installed on each of the piles.
The embankment was built in three stages to heights of 0.67 m, 1.65 m and 2.70 mrespectively. It consisted of a granite weathered soil, which is a poorly graded siltysand according to the authors.
A limitation of the structure is that arching occurs towards the sides of the test box,as indicated in Figure 5.12. Oh and Shin (2007) indeed found, in their Figure 13,that the total measured load was approximately 60% lower than the embankmentweight.
A biaxial punched/drawn PP geogrid type Tensar® BX1100 was installed directlyon top of the pile caps. The authors of this paper did not have the failure strain forthese PP geogrids at their disposal. GR strains were measured with a plastic gauge(type YFLA-5) in both directions, both on top of a pile and mid-way betweenadjacent piles.
51
0.75 m 0.6 m 0.95 m
0.95 m0.75 m 54
52
5341
44
42
4331
34
32
33
0.15 m
3.00 m
3.00 m
2.70 m
1.60
m
fill ofdecomposed
granite
GR
softma-rineclay
firm composed granite
3.00
marching .
towardssides
firm composed granite
firm composed granite
Figure 5.12 Layout of the three test fields with piles and GR. Drawing modified after Oh andShin (2007).
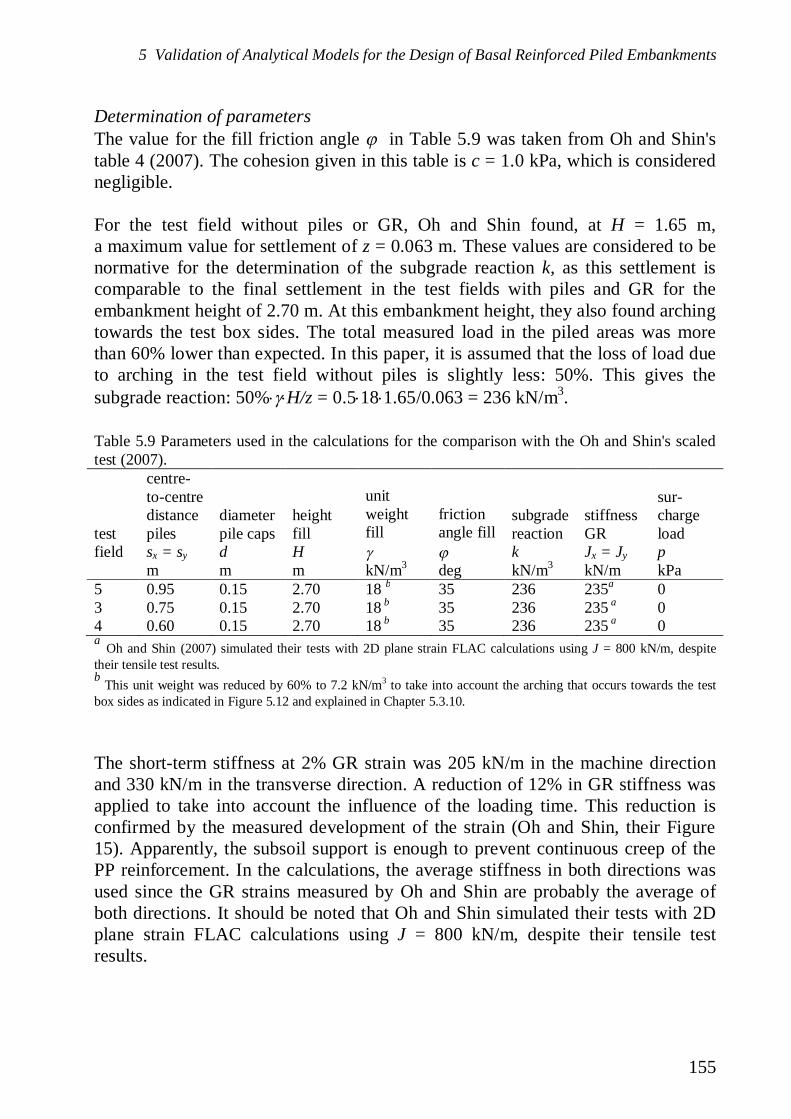
5 Validation of Analytical Models for the Design of Basal Reinforced Piled Embankments
155
Determination of parametersThe value for the fill friction angle in Table 5.9 was taken from Oh and Shin'stable 4 (2007). The cohesion given in this table is c = 1.0 kPa, which is considerednegligible.
For the test field without piles or GR, Oh and Shin found, at H = 1.65 m,a maximum value for settlement of z = 0.063 m. These values are considered to benormative for the determination of the subgrade reaction k, as this settlement iscomparable to the final settlement in the test fields with piles and GR for theembankment height of 2.70 m. At this embankment height, they also found archingtowards the test box sides. The total measured load in the piled areas was morethan 60% lower than expected. In this paper, it is assumed that the loss of load dueto arching in the test field without piles is slightly less: 50%. This gives thesubgrade reaction: 50% H/z = 0.5 18 1.65/0.063 = 236 kN/m3.
Table 5.9 Parameters used in the calculations for the comparison with the Oh and Shin's scaledtest (2007).
testfield
centre-to-centredistancepilessx = sy
diameterpile capsd
heightfillH
unitweightfill
frictionangle fill
subgradereactionk
stiffnessGRJx = Jy
sur-chargeloadp
m m m kN/m3 deg kN/m3 kN/m kPa5 0.95 0.15 2.70 18 b 35 236 235a 03 0.75 0.15 2.70 18 b 35 236 235 a 04 0.60 0.15 2.70 18 b 35 236 235 a 0a Oh and Shin (2007) simulated their tests with 2D plane strain FLAC calculations using J = 800 kN/m, despitetheir tensile test results.b This unit weight was reduced by 60% to 7.2 kN/m3 to take into account the arching that occurs towards the testbox sides as indicated in Figure 5.12 and explained in Chapter 5.3.10.
The short-term stiffness at 2% GR strain was 205 kN/m in the machine directionand 330 kN/m in the transverse direction. A reduction of 12% in GR stiffness wasapplied to take into account the influence of the loading time. This reduction isconfirmed by the measured development of the strain (Oh and Shin, their Figure15). Apparently, the subsoil support is enough to prevent continuous creep of thePP reinforcement. In the calculations, the average stiffness in both directions wasused since the GR strains measured by Oh and Shin are probably the average ofboth directions. It should be noted that Oh and Shin simulated their tests with 2Dplane strain FLAC calculations using J = 800 kN/m, despite their tensile testresults.
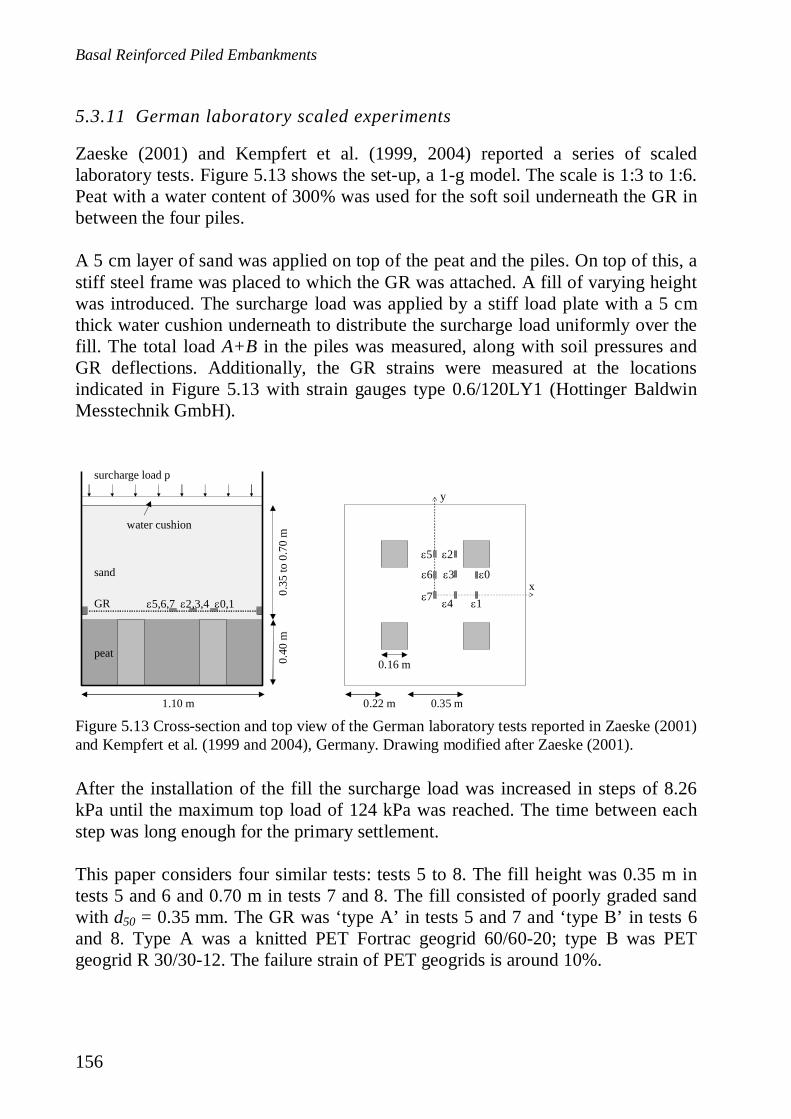
Basal Reinforced Piled Embankments
156
5.3.11 German laboratory scaled experiments
Zaeske (2001) and Kempfert et al. (1999, 2004) reported a series of scaledlaboratory tests. Figure 5.13 shows the set-up, a 1-g model. The scale is 1:3 to 1:6.Peat with a water content of 300% was used for the soft soil underneath the GR inbetween the four piles.
A 5 cm layer of sand was applied on top of the peat and the piles. On top of this, astiff steel frame was placed to which the GR was attached. A fill of varying heightwas introduced. The surcharge load was applied by a stiff load plate with a 5 cmthick water cushion underneath to distribute the surcharge load uniformly over thefill. The total load A+B in the piles was measured, along with soil pressures andGR deflections. Additionally, the GR strains were measured at the locationsindicated in Figure 5.13 with strain gauges type 0.6/120LY1 (Hottinger BaldwinMesstechnik GmbH).
After the installation of the fill the surcharge load was increased in steps of 8.26kPa until the maximum top load of 124 kPa was reached. The time between eachstep was long enough for the primary settlement.
This paper considers four similar tests: tests 5 to 8. The fill height was 0.35 m intests 5 and 6 and 0.70 m in tests 7 and 8. The fill consisted of poorly graded sandwith d50 = 0.35 mm. The GR was ‘type A’ in tests 5 and 7 and ‘type B’ in tests 6and 8. Type A was a knitted PET Fortrac geogrid 60/60-20; type B was PETgeogrid R 30/30-12. The failure strain of PET geogrids is around 10%.
1.10 m 0.35 m0.22 m
0.35
to0.
70m
0.40
m
0.16 m
sand
peat
surcharge load p
GR
y
x0
1
3
47
6
5 2
5,6,7 2,3,4 0,1
water cushion
Figure 5.13 Cross-section and top view of the German laboratory tests reported in Zaeske (2001)and Kempfert et al. (1999 and 2004), Germany. Drawing modified after Zaeske (2001).
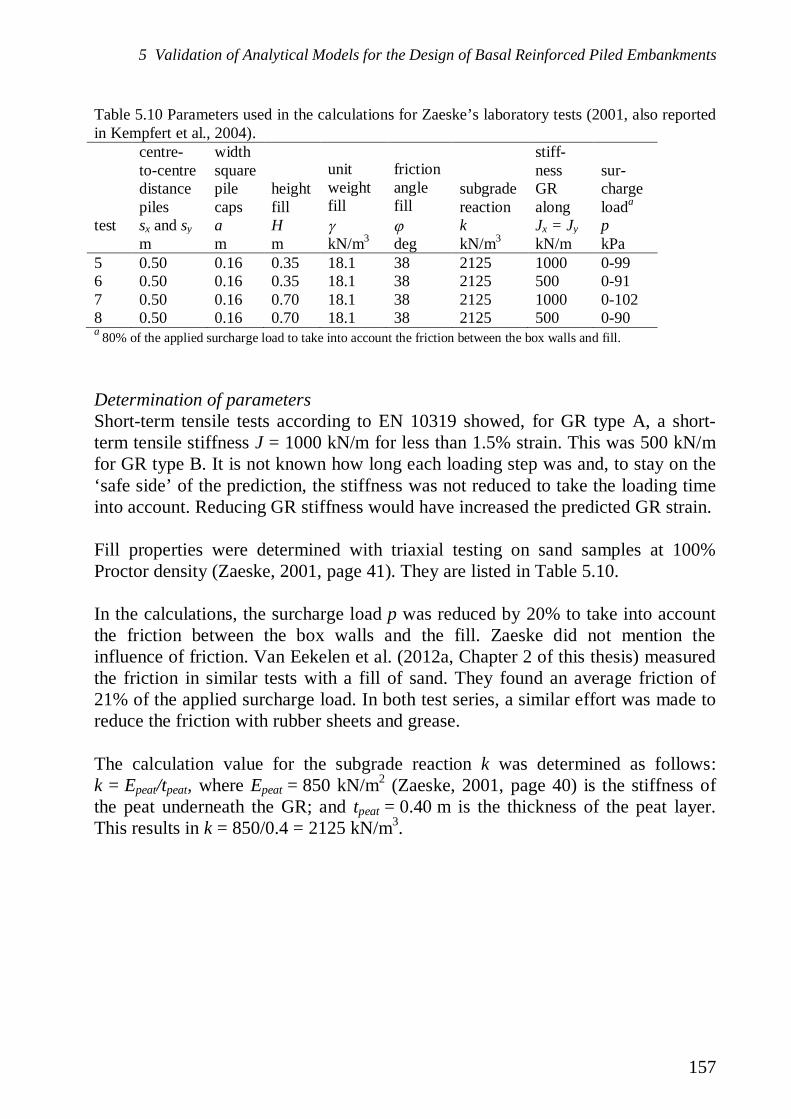
5 Validation of Analytical Models for the Design of Basal Reinforced Piled Embankments
157
Table 5.10 Parameters used in the calculations for Zaeske’s laboratory tests (2001, also reportedin Kempfert et al., 2004).
test
centre-to-centredistancepilessx and sy
widthsquarepilecapsa
heightfillH
unitweightfill
frictionanglefill
subgradereactionk
stiff-nessGRalongJx = Jy
sur-chargeloada
pm m m kN/m3 deg kN/m3 kN/m kPa
5 0.50 0.16 0.35 18.1 38 2125 1000 0-996 0.50 0.16 0.35 18.1 38 2125 500 0-917 0.50 0.16 0.70 18.1 38 2125 1000 0-1028 0.50 0.16 0.70 18.1 38 2125 500 0-90a 80% of the applied surcharge load to take into account the friction between the box walls and fill.
Determination of parametersShort-term tensile tests according to EN 10319 showed, for GR type A, a short-term tensile stiffness J = 1000 kN/m for less than 1.5% strain. This was 500 kN/mfor GR type B. It is not known how long each loading step was and, to stay on the‘safe side’ of the prediction, the stiffness was not reduced to take the loading timeinto account. Reducing GR stiffness would have increased the predicted GR strain.
Fill properties were determined with triaxial testing on sand samples at 100%Proctor density (Zaeske, 2001, page 41). They are listed in Table 5.10.
In the calculations, the surcharge load p was reduced by 20% to take into accountthe friction between the box walls and the fill. Zaeske did not mention theinfluence of friction. Van Eekelen et al. (2012a, Chapter 2 of this thesis) measuredthe friction in similar tests with a fill of sand. They found an average friction of21% of the applied surcharge load. In both test series, a similar effort was made toreduce the friction with rubber sheets and grease.
The calculation value for the subgrade reaction k was determined as follows:k = Epeat/tpeat, where Epeat = 850 kN/m2 (Zaeske, 2001, page 40) is the stiffness ofthe peat underneath the GR; and tpeat = 0.40 m is the thickness of the peat layer.This results in k = 850/0.4 = 2125 kN/m3.

Basal Reinforced Piled Embankments
158
5.3.12 Dutch laboratory scaled experiments
Van Eekelen et al. (2012a, 2013, Chapters 2 and 4 of this thesis) reported a seriesof nineteen scaled laboratory experiments, which will be summarised here for thesake of clarity. Figure 5.14 gives the set-up, which is a 1-g model. The scale is1:3 to 1:5. A foam cushion modelled the soft soil around the 4 piles. This cushionwas a watertight wrapped soaked foam rubber cushion. A tap was installed to drainthe cushion during the test, modelling the consolidation process of the soft soil.
A 1.5 to 2 cm layer of sand was applied on top of the foam cushion and the piles,followed by one or two stiff steel frames to which one or two GR layers wereattached. A fill of varying height was placed. The top load was applied with awater cushion that applied stresses comparable with field stresses.
The test set-up was similar to Zaeske’s test set-up (2001). In the series reportedhere, however, the fill consisted in most cases of granular material instead of sand,the subsoil support was not peat – it was controlled with the foam cushion instead– and the load distribution was measured differently so that load parts A, B and Ccould be measured separately.
Each test was carried out as follows: (1) 6 litres of water was drained from thefoam cushion (modelling subsoil consolidation), (2) installation of the watercushion on top of the fill followed by a first top load increase, (3) one or moredrainage steps of 6 litres until the subsoil support approached 0 kPa, (4) second topload increase, (5) one or more drainage steps followed by top load increases of 25kPa each until the maximum top load (usually 100 kPa) was reached and thesubsequent drainage steps and (6) draining the foam cushion under vacuum to
0.10 mfoam
cushion
fill
pile
pile
5 3 2
1.10 m0.45 m0.225 m
1
2
46
2
5 3
strain gauges bottomGR layer test N3
straingaugesin tests N2andbottomGR layertest N1
0.10 0.450.225
1.10
m
water cushion for surcharge load p
Figure 5.14 Cross-section and top view of the Dutch laboratory tests reported in Van Eekelen etal. (2012a, b, 2013, Chapters 2, 3 and 4 of this thesis), the Netherlands.
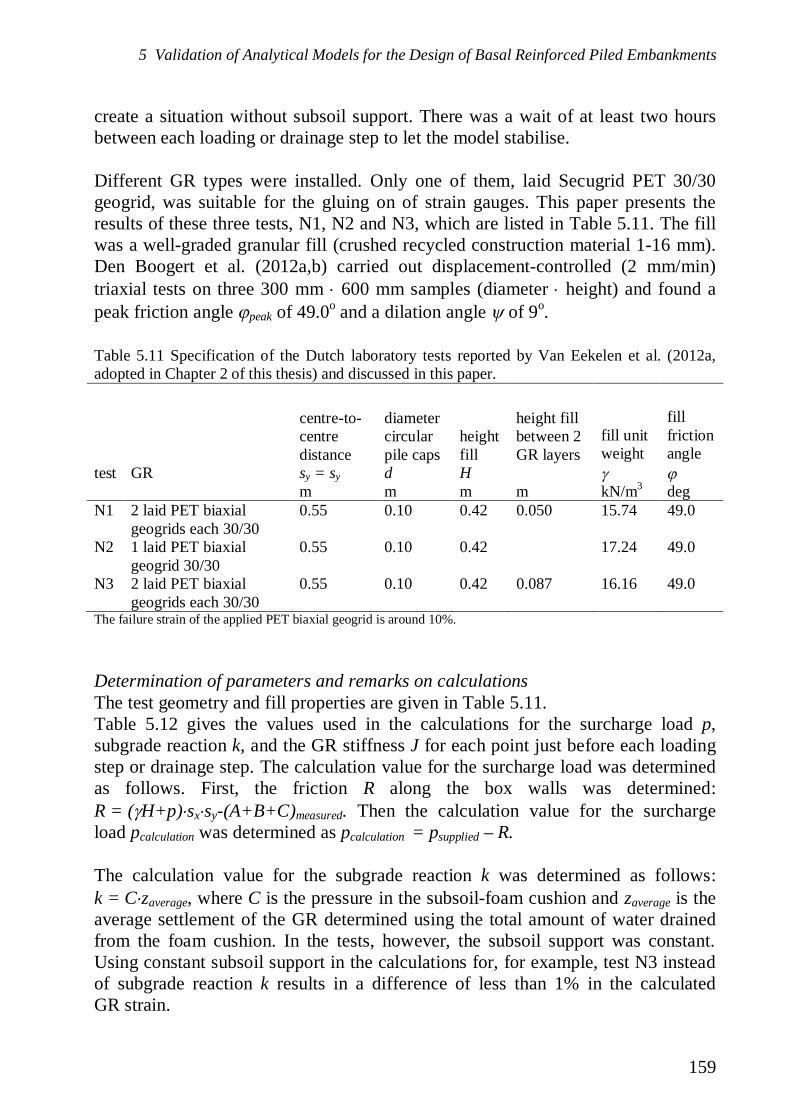
5 Validation of Analytical Models for the Design of Basal Reinforced Piled Embankments
159
create a situation without subsoil support. There was a wait of at least two hoursbetween each loading or drainage step to let the model stabilise.
Different GR types were installed. Only one of them, laid Secugrid PET 30/30geogrid, was suitable for the gluing on of strain gauges. This paper presents theresults of these three tests, N1, N2 and N3, which are listed in Table 5.11. The fillwas a well-graded granular fill (crushed recycled construction material 1-16 mm).Den Boogert et al. (2012a,b) carried out displacement-controlled (2 mm/min)triaxial tests on three 300 mm 600 mm samples (diameter height) and found apeak friction angle peak of 49.0o and a dilation angle of 9o.
Table 5.11 Specification of the Dutch laboratory tests reported by Van Eekelen et al. (2012a,adopted in Chapter 2 of this thesis) and discussed in this paper.
test GR
centre-to-centredistancesy = sy
diametercircularpile capsd
heightfillH
height fillbetween 2GR layers
fill unitweight
fillfrictionangle
m m m m kN/m3 degN1 2 laid PET biaxial
geogrids each 30/300.55 0.10 0.42 0.050 15.74 49.0
N2 1 laid PET biaxialgeogrid 30/30
0.55 0.10 0.42 17.24 49.0
N3 2 laid PET biaxialgeogrids each 30/30
0.55 0.10 0.42 0.087 16.16 49.0
The failure strain of the applied PET biaxial geogrid is around 10%.
Determination of parameters and remarks on calculationsThe test geometry and fill properties are given in Table 5.11.Table 5.12 gives the values used in the calculations for the surcharge load p,subgrade reaction k, and the GR stiffness J for each point just before each loadingstep or drainage step. The calculation value for the surcharge load was determinedas follows. First, the friction R along the box walls was determined:R = ( H+p) sx sy-(A+B+C)measured. Then the calculation value for the surchargeload pcalculation was determined as pcalculation = psupplied – R.
The calculation value for the subgrade reaction k was determined as follows:k = C zaverage, where C is the pressure in the subsoil-foam cushion and zaverage is theaverage settlement of the GR determined using the total amount of water drainedfrom the foam cushion. In the tests, however, the subsoil support was constant.Using constant subsoil support in the calculations for, for example, test N3 insteadof subgrade reaction k results in a difference of less than 1% in the calculatedGR strain.
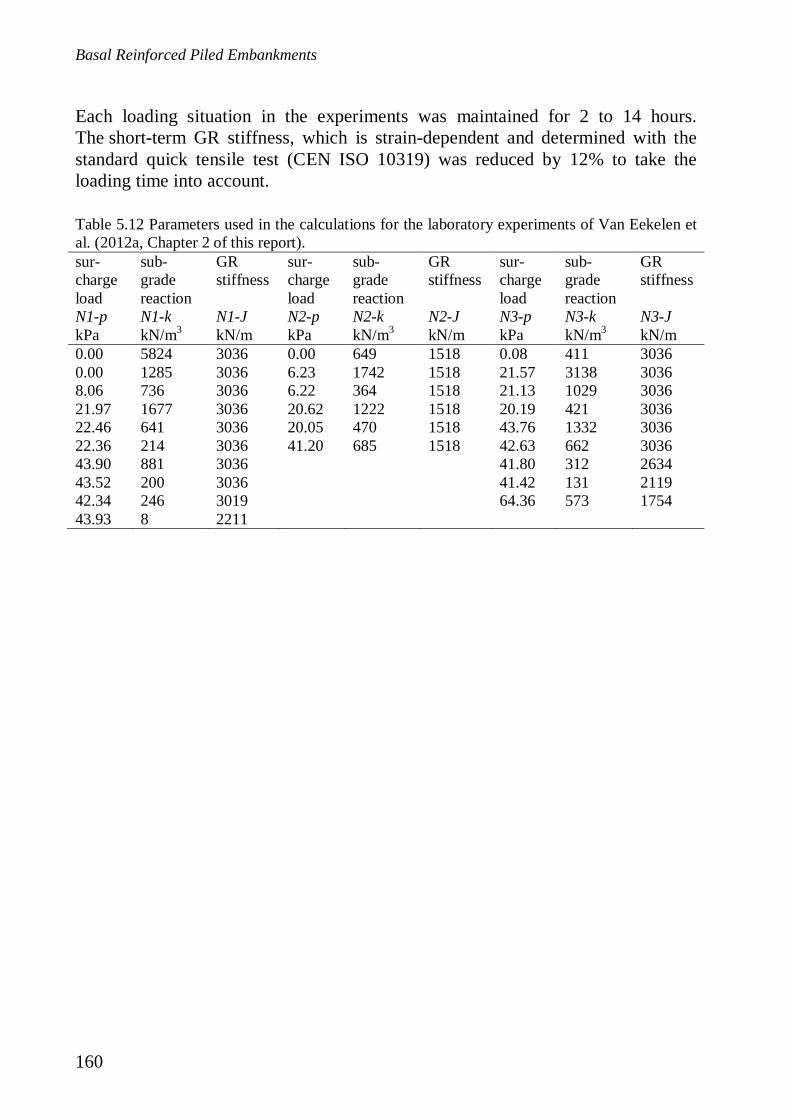
Basal Reinforced Piled Embankments
160
Each loading situation in the experiments was maintained for 2 to 14 hours.The short-term GR stiffness, which is strain-dependent and determined with thestandard quick tensile test (CEN ISO 10319) was reduced by 12% to take theloading time into account.
Table 5.12 Parameters used in the calculations for the laboratory experiments of Van Eekelen etal. (2012a, Chapter 2 of this report).sur-chargeload
sub-gradereaction
GRstiffness
sur-chargeload
sub-gradereaction
GRstiffness
sur-chargeload
sub-gradereaction
GRstiffness
N1-p N1-k N1-J N2-p N2-k N2-J N3-p N3-k N3-JkPa kN/m3 kN/m kPa kN/m3 kN/m kPa kN/m3 kN/m0.00 5824 3036 0.00 649 1518 0.08 411 30360.00 1285 3036 6.23 1742 1518 21.57 3138 30368.06 736 3036 6.22 364 1518 21.13 1029 303621.97 1677 3036 20.62 1222 1518 20.19 421 303622.46 641 3036 20.05 470 1518 43.76 1332 303622.36 214 3036 41.20 685 1518 42.63 662 303643.90 881 3036 41.80 312 263443.52 200 3036 41.42 131 211942.34 246 3019 64.36 573 175443.93 8 2211
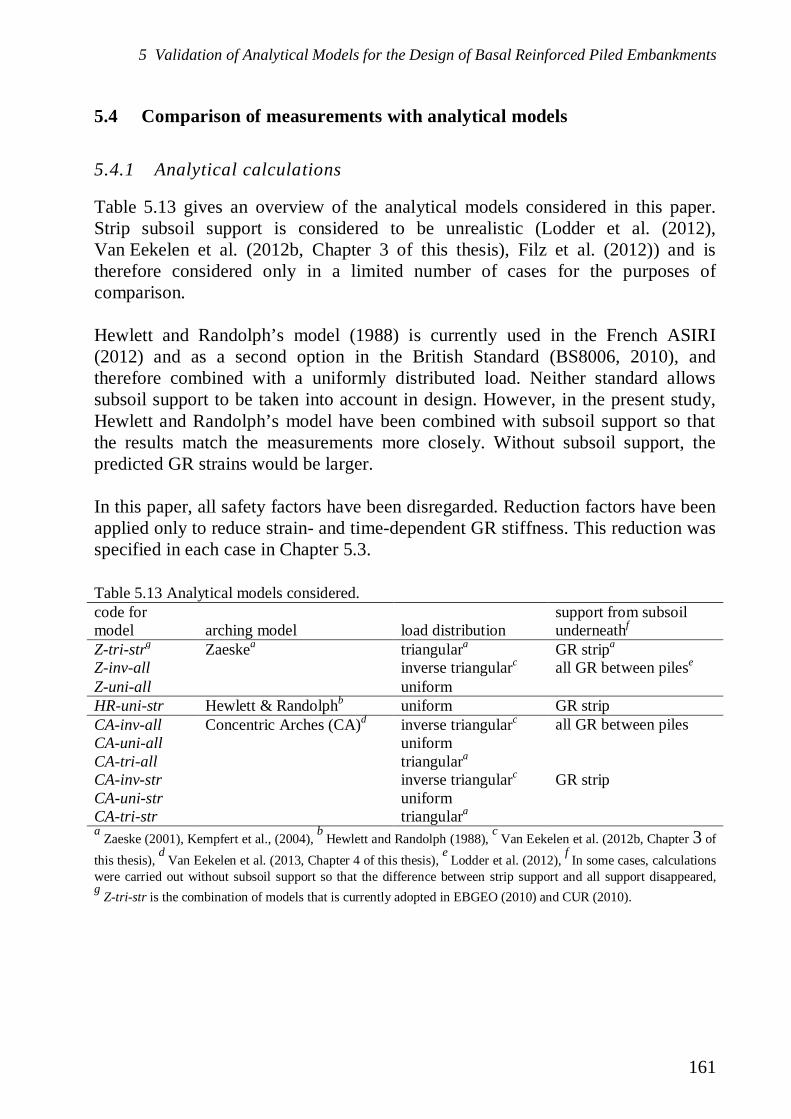
5 Validation of Analytical Models for the Design of Basal Reinforced Piled Embankments
161
5.4 Comparison of measurements with analytical models
5.4.1 Analytical calculations
Table 5.13 gives an overview of the analytical models considered in this paper.Strip subsoil support is considered to be unrealistic (Lodder et al. (2012),Van Eekelen et al. (2012b, Chapter 3 of this thesis), Filz et al. (2012)) and istherefore considered only in a limited number of cases for the purposes ofcomparison.
Hewlett and Randolph’s model (1988) is currently used in the French ASIRI(2012) and as a second option in the British Standard (BS8006, 2010), andtherefore combined with a uniformly distributed load. Neither standard allowssubsoil support to be taken into account in design. However, in the present study,Hewlett and Randolph’s model have been combined with subsoil support so thatthe results match the measurements more closely. Without subsoil support, thepredicted GR strains would be larger.
In this paper, all safety factors have been disregarded. Reduction factors have beenapplied only to reduce strain- and time-dependent GR stiffness. This reduction wasspecified in each case in Chapter 5.3.
Table 5.13 Analytical models considered.code formodel arching model load distribution
support from subsoilunderneathf
Z-tri-strg Zaeskea triangulara GR stripa
Z-inv-all inverse triangularc all GR between pilese
Z-uni-all uniformHR-uni-str Hewlett & Randolphb uniform GR stripCA-inv-all Concentric Arches (CA)d inverse triangularc all GR between pilesCA-uni-all uniformCA-tri-all triangulara
CA-inv-str inverse triangularc GR stripCA-uni-str uniformCA-tri-str triangulara
a Zaeske (2001), Kempfert et al., (2004), b Hewlett and Randolph (1988), c Van Eekelen et al. (2012b, Chapter 3 ofthis thesis), d Van Eekelen et al. (2013, Chapter 4 of this thesis), e Lodder et al. (2012), f In some cases, calculationswere carried out without subsoil support so that the difference between strip support and all support disappeared,g Z-tri-str is the combination of models that is currently adopted in EBGEO (2010) and CUR (2010).
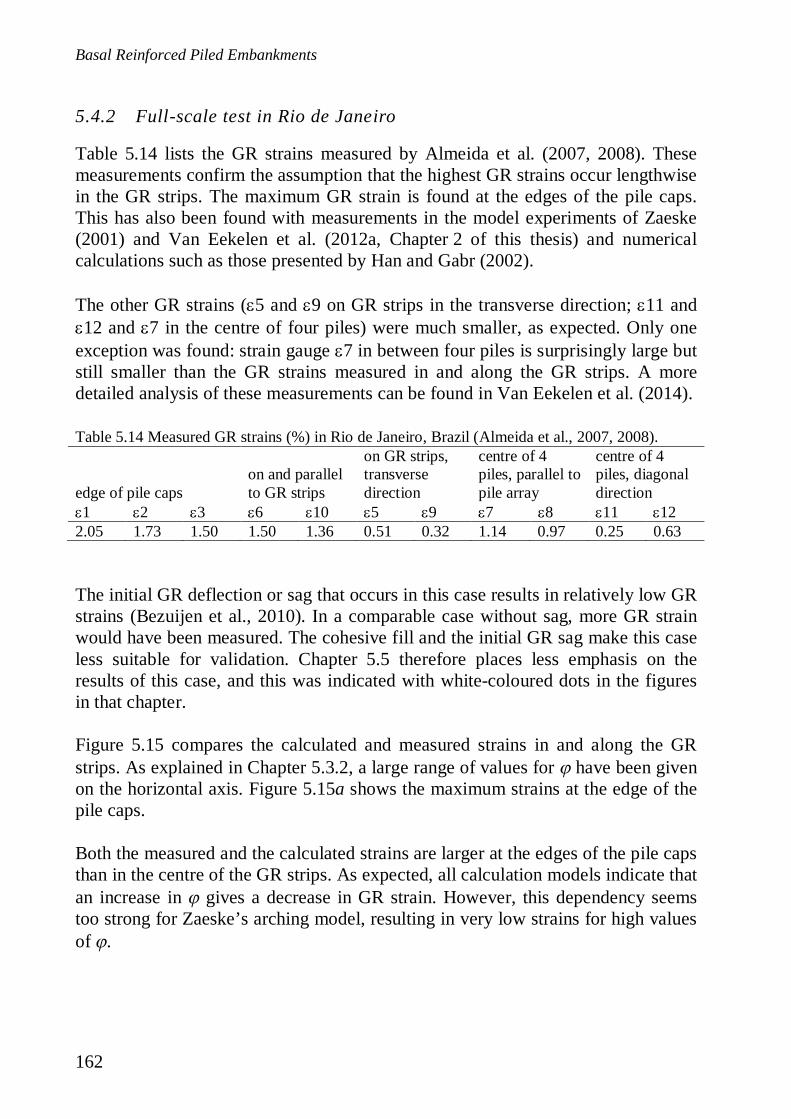
Basal Reinforced Piled Embankments
162
5.4.2 Full-scale test in Rio de Janeiro
Table 5.14 lists the GR strains measured by Almeida et al. (2007, 2008). Thesemeasurements confirm the assumption that the highest GR strains occur lengthwisein the GR strips. The maximum GR strain is found at the edges of the pile caps.This has also been found with measurements in the model experiments of Zaeske(2001) and Van Eekelen et al. (2012a, Chapter 2 of this thesis) and numericalcalculations such as those presented by Han and Gabr (2002).
The other GR strains ( 5 and 9 on GR strips in the transverse direction; 11 and12 and 7 in the centre of four piles) were much smaller, as expected. Only one
exception was found: strain gauge 7 in between four piles is surprisingly large butstill smaller than the GR strains measured in and along the GR strips. A moredetailed analysis of these measurements can be found in Van Eekelen et al. (2014).
Table 5.14 Measured GR strains (%) in Rio de Janeiro, Brazil (Almeida et al., 2007, 2008).
edge of pile capson and parallelto GR strips
on GR strips,transversedirection
centre of 4piles, parallel topile array
centre of 4piles, diagonaldirection
1 2 3 6 10 5 9 7 8 11 122.05 1.73 1.50 1.50 1.36 0.51 0.32 1.14 0.97 0.25 0.63
The initial GR deflection or sag that occurs in this case results in relatively low GRstrains (Bezuijen et al., 2010). In a comparable case without sag, more GR strainwould have been measured. The cohesive fill and the initial GR sag make this caseless suitable for validation. Chapter 5.5 therefore places less emphasis on theresults of this case, and this was indicated with white-coloured dots in the figuresin that chapter.
Figure 5.15 compares the calculated and measured strains in and along the GRstrips. As explained in Chapter 5.3.2, a large range of values for have been givenon the horizontal axis. Figure 5.15a shows the maximum strains at the edge of thepile caps.
Both the measured and the calculated strains are larger at the edges of the pile capsthan in the centre of the GR strips. As expected, all calculation models indicate thatan increase in gives a decrease in GR strain. However, this dependency seemstoo strong for Zaeske’s arching model, resulting in very low strains for high valuesof .
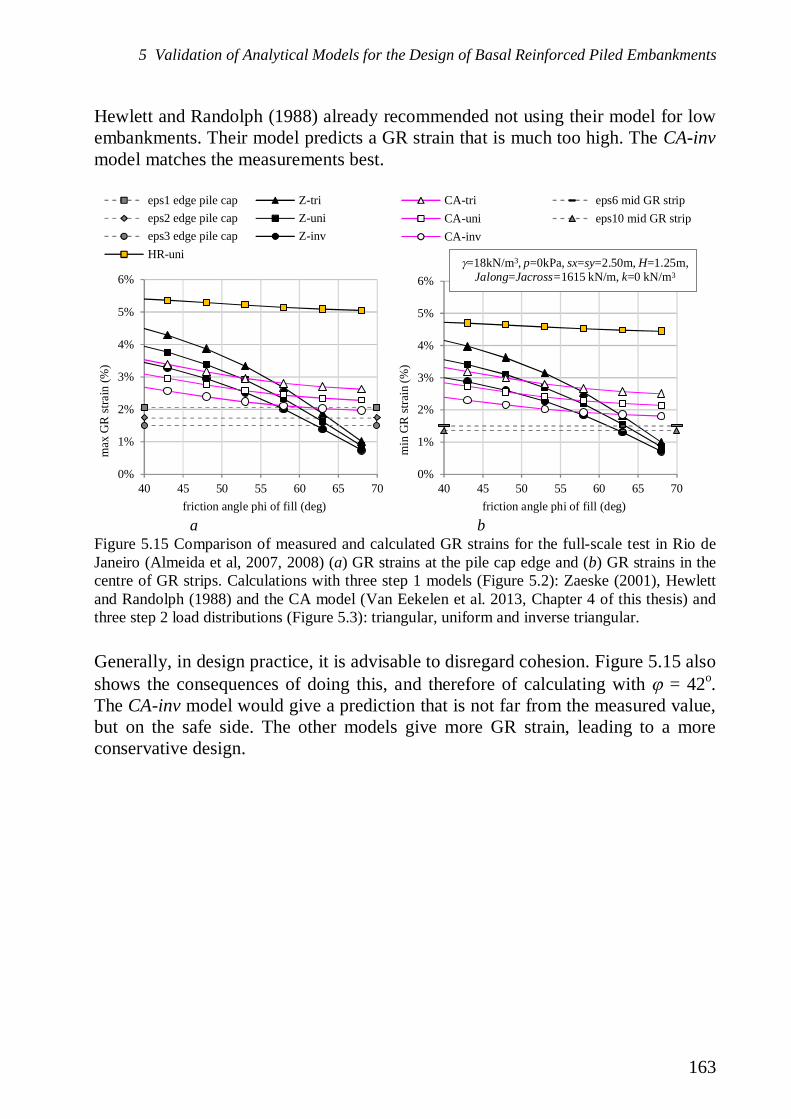
5 Validation of Analytical Models for the Design of Basal Reinforced Piled Embankments
163
Hewlett and Randolph (1988) already recommended not using their model for lowembankments. Their model predicts a GR strain that is much too high. The CA-invmodel matches the measurements best.
a b
Generally, in design practice, it is advisable to disregard cohesion. Figure 5.15 alsoshows the consequences of doing this, and therefore of calculating with = 42o.The CA-inv model would give a prediction that is not far from the measured value,but on the safe side. The other models give more GR strain, leading to a moreconservative design.
0%
1%
2%
3%
4%
5%
6%
40 45 50 55 60 65 70
max
GR
stra
in(%
)
friction angle phi of fill (deg)
eps1 edge pile cap Z-trieps2 edge pile cap Z-unieps3 edge pile cap Z-invHR-uni
0%
1%
2%
3%
4%
5%
6%
40 45 50 55 60 65 70
min
GR
stra
in(%
)
friction angle phi of fill (deg)
CA-tri eps6 mid GR stripCA-uni eps10 mid GR stripCA-inv
=18kN/m3, p=0kPa, sx=sy=2.50m, H=1.25m,Jalong=Jacross=1615 kN/m, k=0 kN/m3
Figure 5.15 Comparison of measured and calculated GR strains for the full-scale test in Rio deJaneiro (Almeida et al, 2007, 2008) (a) GR strains at the pile cap edge and (b) GR strains in thecentre of GR strips. Calculations with three step 1 models (Figure 5.2): Zaeske (2001), Hewlettand Randolph (1988) and the CA model (Van Eekelen et al. 2013, Chapter 4 of this thesis) andthree step 2 load distributions (Figure 5.3): triangular, uniform and inverse triangular.
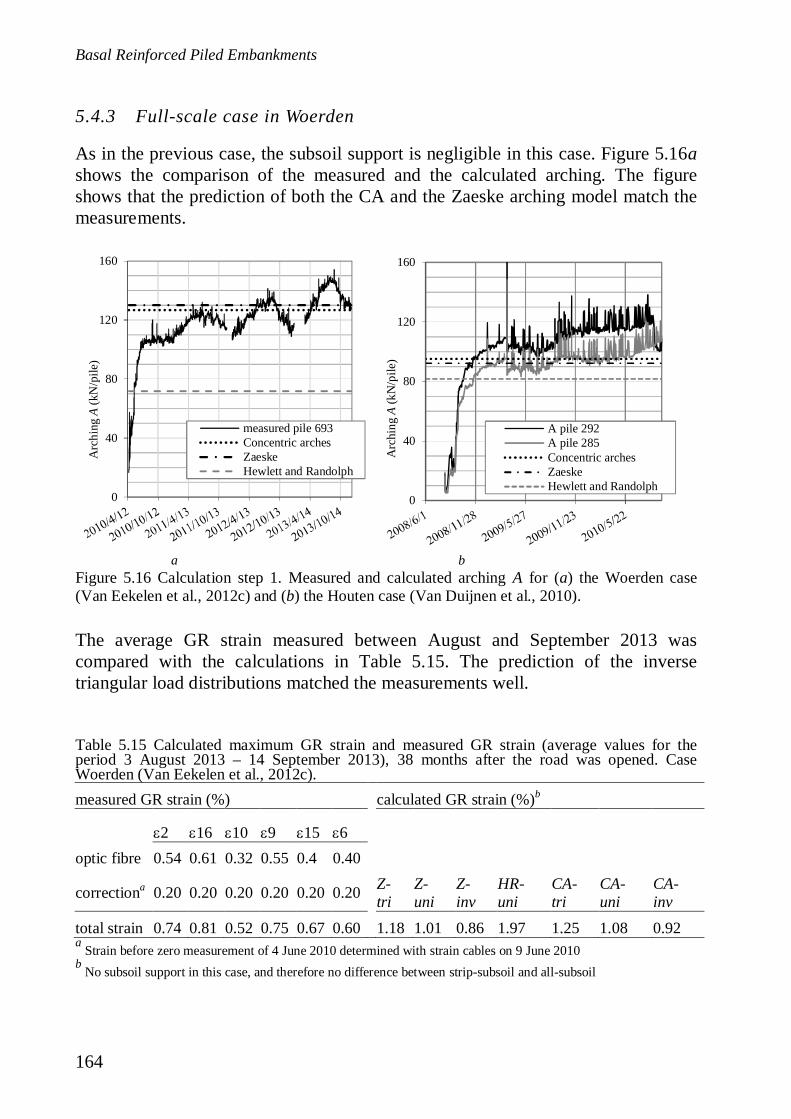
Basal Reinforced Piled Embankments
164
5.4.3 Full-scale case in Woerden
As in the previous case, the subsoil support is negligible in this case. Figure 5.16ashows the comparison of the measured and the calculated arching. The figureshows that the prediction of both the CA and the Zaeske arching model match themeasurements.
a b
The average GR strain measured between August and September 2013 wascompared with the calculations in Table 5.15. The prediction of the inversetriangular load distributions matched the measurements well.
Table 5.15 Calculated maximum GR strain and measured GR strain (average values for theperiod 3 August 2013 – 14 September 2013), 38 months after the road was opened. CaseWoerden (Van Eekelen et al., 2012c).measured GR strain (%) calculated GR strain (%)b
2 16 10 9 15 6optic fibre 0.54 0.61 0.32 0.55 0.4 0.40
correctiona 0.20 0.20 0.20 0.20 0.20 0.20 Z-tri
Z-uni
Z-inv
HR-uni
CA-tri
CA-uni
CA-inv
total strain 0.74 0.81 0.52 0.75 0.67 0.60 1.18 1.01 0.86 1.97 1.25 1.08 0.92a Strain before zero measurement of 4 June 2010 determined with strain cables on 9 June 2010b No subsoil support in this case, and therefore no difference between strip-subsoil and all-subsoil
0
40
80
120
160
Arc
hing
A(k
N/p
ile)
measured pile 693Concentric archesZaeskeHewlett and Randolph
0
40
80
120
160
Arc
hing
A(k
N/p
ile)
.
A pile 292A pile 285Concentric archesZaeskeHewlett and Randolph
Figure 5.16 Calculation step 1. Measured and calculated arching A for (a) the Woerden case(Van Eekelen et al., 2012c) and (b) the Houten case (Van Duijnen et al., 2010).
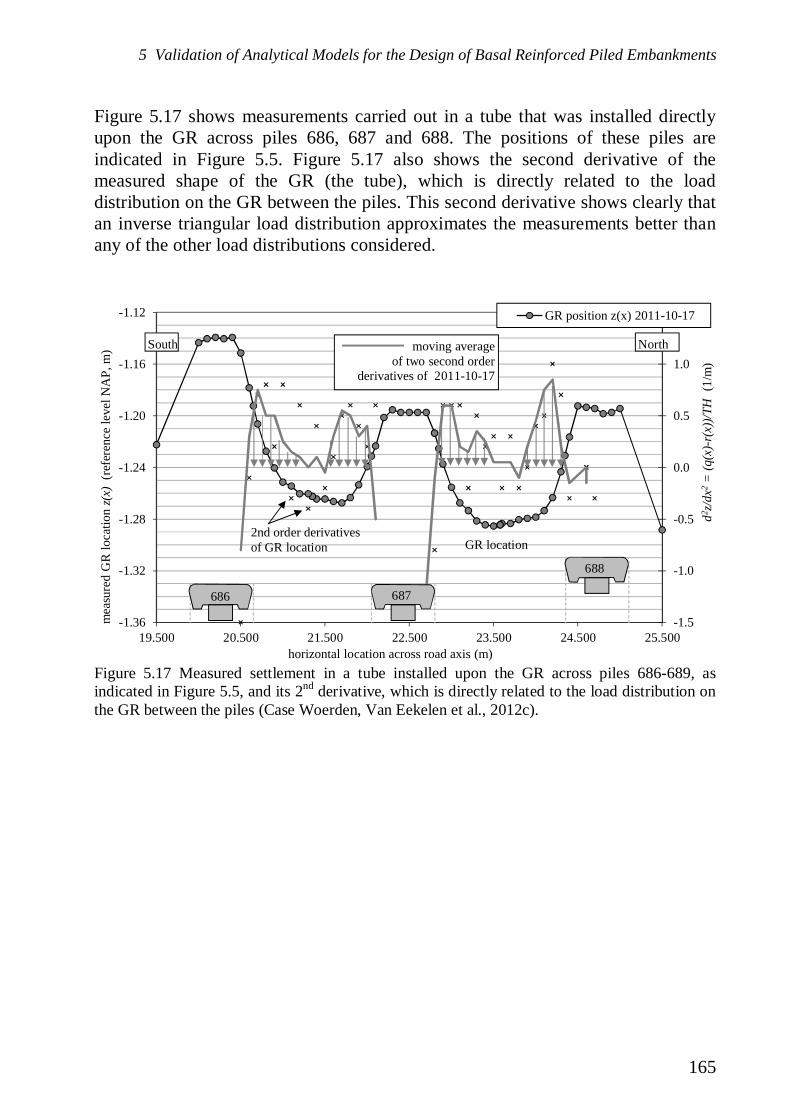
5 Validation of Analytical Models for the Design of Basal Reinforced Piled Embankments
165
Figure 5.17 shows measurements carried out in a tube that was installed directlyupon the GR across piles 686, 687 and 688. The positions of these piles areindicated in Figure 5.5. Figure 5.17 also shows the second derivative of themeasured shape of the GR (the tube), which is directly related to the loaddistribution on the GR between the piles. This second derivative shows clearly thatan inverse triangular load distribution approximates the measurements better thanany of the other load distributions considered.
-1.5
-1.0
-0.5
0.0
0.5
1.0
1.5
-1.36
-1.32
-1.28
-1.24
-1.20
-1.16
-1.12
19.500 20.500 21.500 22.500 23.500 24.500 25.500
d2 z/d
x2=
(q(x
)-r(
x))/T
H(1
/m)
mea
sure
dG
Rlo
catio
nz(
x)(r
efer
ence
leve
lNA
P,m
)
horizontal location across road axis (m)
GR position z(x) 2011-10-17
South Northmoving averageof two second order
derivatives of 2011-10-17
GR location2nd order derivativesof GR location
686 687
688
Figure 5.17 Measured settlement in a tube installed upon the GR across piles 686-689, asindicated in Figure 5.5, and its 2nd derivative, which is directly related to the load distribution onthe GR between the piles (Case Woerden, Van Eekelen et al., 2012c).
Basal Reinforced Piled Embankments
166
5.4.4 Full-scale case in Houten
Figure 5.16b compares the measured and calculated arching. The predictions ofboth the CA and the Zaeske arching models match the measurements quite well.Further measurements have been reported by Van Duijnen et al. (2010).
Table 5.16 Average of the GR strains (%) measured in 2010 and calculated maximum GR strains(%). The railway was opened in November 2008. Case Houten (Van Duijnen et al., 2010).
measured
Z-tri-stra
Z-uni-str
Z-inv-str
Z-tri-all
Z-uni-all
Z-inv-all
HR-uni-str
CA-tri-str
CA-uni-str
CA-inv-str
CA-tri-all
CA-uni-all
CA-inv-all
transverse1 =
0.4812 =
0.240 1.08 0.88 0.82 0.32 0.31 0.49 1.12 0.99 0.80 0.75 0.28 0.28 0.44longitudinal3 =
0.0544 =
0.024 1.00 0.81 0.87 0.33 0.35 0.57 1.07 0.89 0.73 0.80 0.28 0.31 0.52a model in EBGEO (2010) and CUR226 (2010)
Table 5.16 compares the measured and calculated GR strains. As explained inChapter 5.3.4, the measured GR strains are indeed relatively high across the trackand relatively low in the direction of the track. The transverse GR strains are in thesame range as predicted with CA-inv-all. The GR strains measured along the trackare so small that they have not been taken into account in the discussion in Chapter5.5 of this paper.
The current subsoil support is greater than assumed during design. Decreasingsubsoil support due to consolidation would lead to more GR strain if the load onthe GR were to remain the same, both in reality and in the calculations. However,in the calculations, the load on the GR would indeed remain the same because alimit equilibrium arching model is used. In reality, the load on the GR woulddecrease due to increasing arching. The GR strain would therefore fall less inreality than in the calculations. For decreasing subsoil support, the relationshipbetween measured GR strain and design model would provide additional safety:the calculated GR strains are larger than the measured values.
The inverse triangular distribution gives more strain than the uniform loaddistribution and, in the case of ‘all subsoil’, also more than the triangular loaddistribution. This is explained in the next chapter relating to the Frenchexperiments.

5 Validation of Analytical Models for the Design of Basal Reinforced Piled Embankments
167
5.4.5 Large-scale French experiments
As in the previous case, this case has a large amount of subsoil support. Arching istherefore less efficient since the differences in stiffness in the system are smaller.This results in less pressure on the piles and a more uniformly distributed pressureon the GR between the piles.
a. strip subsoil support in calculations b. all subsoil support in calculations
a b
Figure 5.18 compares calculated and measured GR deflection. The figure showsthat taking all subsoil into account results, as expected, in a better match with themeasurements. The measured GR deflection matches the CA-uni-all calculationsbest. This uniformly distributed load is combined with the counter-pressure, asshown in Figure 5.19. This results in a net load distribution that matches theinverse triangular load distribution better than the uniform or triangular loaddistribution.
The calculations with inverse triangular load distribution show most GR deflectionclose to the piles. The resulting shape of the deformed GR leads to a relatively high
0.0
0.1
0.2
0.3GR
defle
ctio
n(m
)
measured
CA-inv-str
CA-uni-str
CA-tri-str
CA-inv-all
CA-uni-all CA-tri-all
2.00 m aeq =0.34 m
100
0
-100
load
(kPa
)
Figure 5.18 Comparison of measured and calculated GR deflection in test field 3R of Briançonand Simon (2012) when = 53o. The measured GR deflection is the measured settlement bycomparison with the settlement measured on top of the piles. Calculations with the Zaeskearching model give comparable results, as shown in Figure 5.20. Measurements and calculationsfor test field 4R are also comparable.
Figure 5.19 Result of analytical calculation CA-uni-all for Briançon and Simon (2012): (a)uniformly distributed load in combination with subsoil support gives (b) a net load distributionthat matches the inverse triangular load distribution in Figure 5.3 better than the uniform ortriangular load distribution.

Basal Reinforced Piled Embankments
168
GR strain. This is caused by the large counter-pressure in the centre of the GRstrip, while the downwardly directed load midway between the piles is zero. Thismechanism may occur in practice to a small extent, as shown by the measurementsin Figure 5.18. However, a stiff subsoil leads to a more uniform load distributionon top of the GR and a net load distribution that is approximately inversetriangular.
Figure 5.20 compares the measured and calculated GR strains for a wide range offriction angles . CA-inv-all generally gives higher GR strains than measured,which is also the case for the other models for low friction angles.
0%
1%
2%
3%
4%
5%
40 50 60 70 80
GR
stra
inte
stfie
ld3R
(%)
friction angle phi (deg)
0%1%2%3%4%5%4050607080
Z-tri-all
Z-uni-all
Z-inv-all
CA-tri-all
CA-uni-all
CA-inv-all
measurements
Z-tri-str
0%
1%
2%
3%
4%
5%
40 50 60 70 80
GR
stra
inte
stfie
ld4R
(%)
friction angle phi (deg)
Figure 5.20 Comparison of measured and calculated maximum GR strains in Briançon andSimon’s full-scale field test (2012).
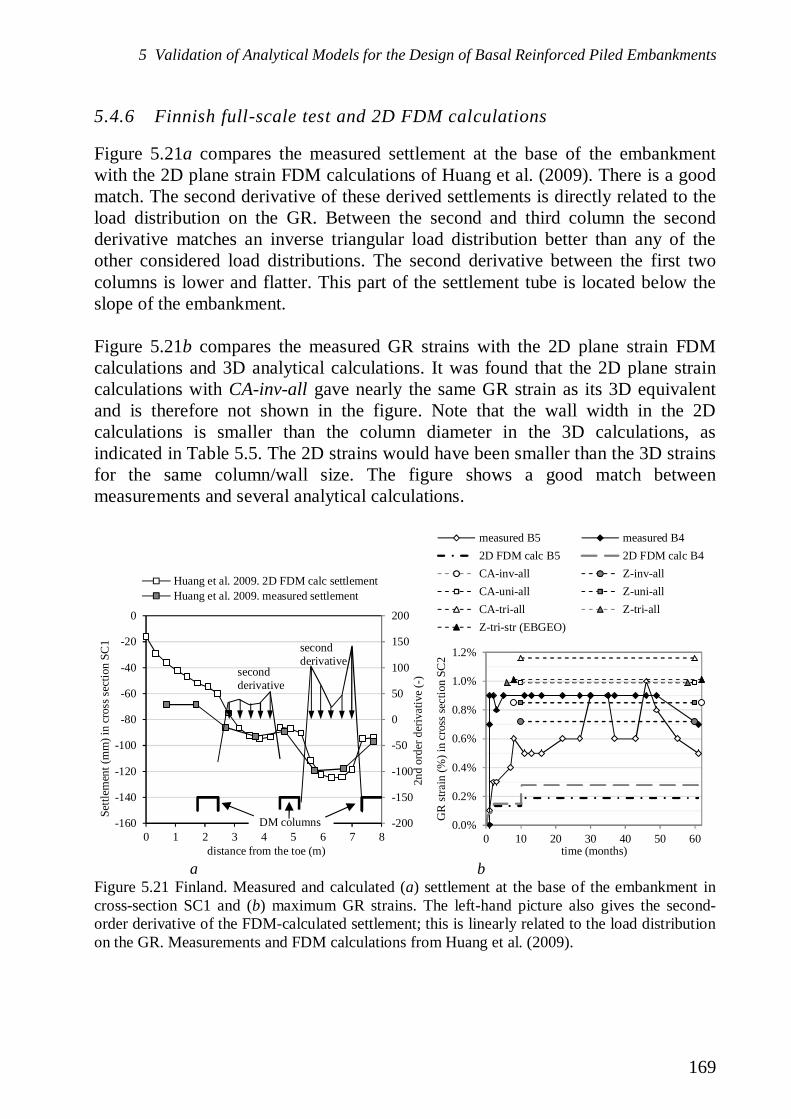
5 Validation of Analytical Models for the Design of Basal Reinforced Piled Embankments
169
5.4.6 Finnish full-scale test and 2D FDM calculations
Figure 5.21a compares the measured settlement at the base of the embankmentwith the 2D plane strain FDM calculations of Huang et al. (2009). There is a goodmatch. The second derivative of these derived settlements is directly related to theload distribution on the GR. Between the second and third column the secondderivative matches an inverse triangular load distribution better than any of theother considered load distributions. The second derivative between the first twocolumns is lower and flatter. This part of the settlement tube is located below theslope of the embankment.
Figure 5.21b compares the measured GR strains with the 2D plane strain FDMcalculations and 3D analytical calculations. It was found that the 2D plane straincalculations with CA-inv-all gave nearly the same GR strain as its 3D equivalentand is therefore not shown in the figure. Note that the wall width in the 2Dcalculations is smaller than the column diameter in the 3D calculations, asindicated in Table 5.5. The 2D strains would have been smaller than the 3D strainsfor the same column/wall size. The figure shows a good match betweenmeasurements and several analytical calculations.
a b
-200
-150
-100
-50
0
50
100
150
200
-160
-140
-120
-100
-80
-60
-40
-20
0
0 1 2 3 4 5 6 7 8
2nd
orde
rder
ivat
ive(
-)
Settl
emen
t(m
m)i
ncr
osss
ectio
nSC
1
distance from the toe (m)
Huang et al. 2009. 2D FDM calc settlementHuang et al. 2009. measured settlement
secondderivative
secondderivative
DM columns 0.0%
0.2%
0.4%
0.6%
0.8%
1.0%
1.2%
0 10 20 30 40 50 60
GR
stra
in(%
)in
cros
ssec
tion
SC2
time (months)
measured B5 measured B42D FDM calc B5 2D FDM calc B4CA-inv-all Z-inv-allCA-uni-all Z-uni-allCA-tri-all Z-tri-allZ-tri-str (EBGEO)
Figure 5.21 Finland. Measured and calculated (a) settlement at the base of the embankment incross-section SC1 and (b) maximum GR strains. The left-hand picture also gives the second-order derivative of the FDM-calculated settlement; this is linearly related to the load distributionon the GR. Measurements and FDM calculations from Huang et al. (2009).

Basal Reinforced Piled Embankments
170
5.4.7 The Krimpenerwaard N210 piled embankment
Table 5.17 Average of the GR strains measured in 2010 and calculated GR strains in the N210Krimpenerwaard road, the Netherlands (Haring et al., 2008; Van Duijnen, 2014).average of measurements calculations
sub-grade
Z-tri-str b
Z-tri-all
Z-uni-all
Z-inv-all
CA-tri-all
CA-uni-all
CA-inv-all
% kN/m3 % % % % % % %longitudinala pile cap 1.10 longitudinala 0 1.43 1.43 1.23 1.06 1.30 1.13 0.96
betweenpiles
0.60 250 0.72 0.35 0.31 0.43 0.28 0.26 0.38
tranversetaking intoaccount bothGR layers
pile cap 1.00 tranversetaking intoaccount bothGR layers
0 1.32 1.32 1.14 0.98 1.21 1.04 0.89betweenpiles
2.40 250 0.71 0.34 0.30 0.41 0.28 0.25 0.36
tranversetaking intoaccount1 GR layera
pile cap 1.00 tranversetaking intoaccount1 GR layera
0 2.03 2.03 1.76 1.51 1.85 1.60 1.38betweenpiles
2.40 250 0.92 0.39 0.37 0.57 0.31 0.31 0.50
a These cases are included in Figure 5.27. b model in EBGEO (2010) and CUR226 (2010)
Table 5.17 shows that the measured GR strains exceed the calculated values. If thecalculations are repeated with no subsoil (k = 0 kN/m3), the agreement betweenmeasurements and calculations improves. The GR installation was difficult forreasons explained in Chapter 5.3.7. Otherwise, no explanation for the discrepancybetween measurements and calculations could be found.
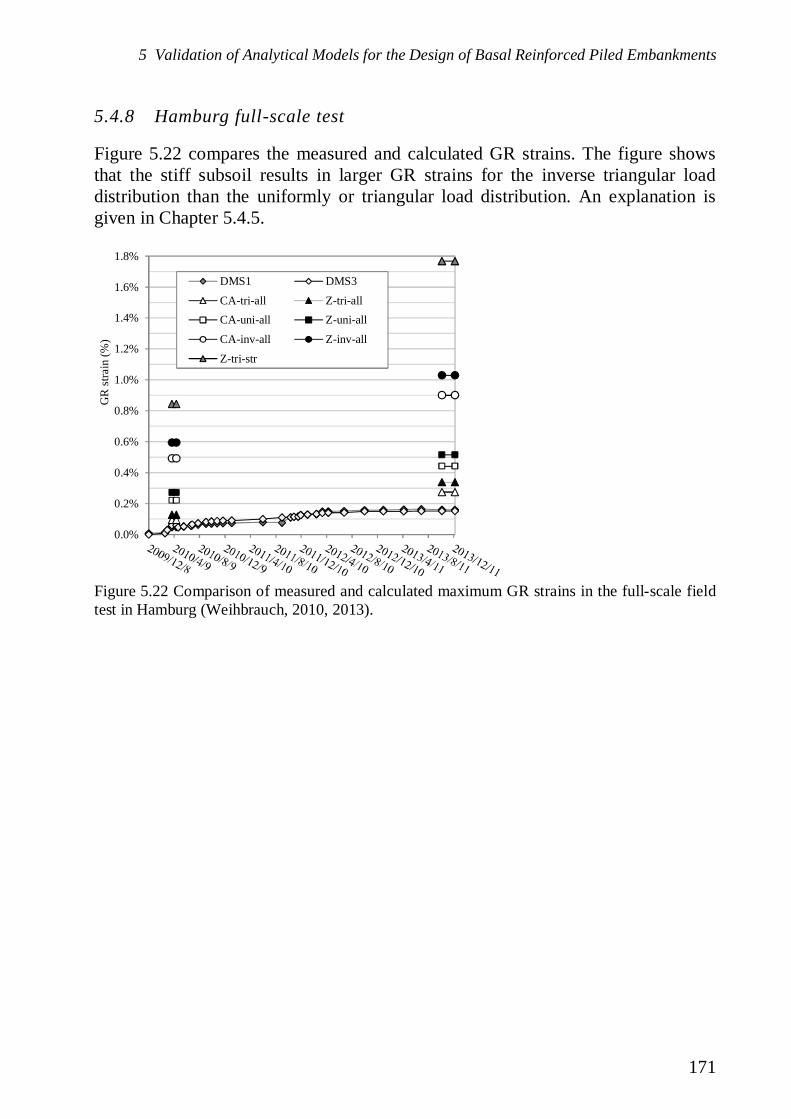
5 Validation of Analytical Models for the Design of Basal Reinforced Piled Embankments
171
5.4.8 Hamburg full-scale test
Figure 5.22 compares the measured and calculated GR strains. The figure showsthat the stiff subsoil results in larger GR strains for the inverse triangular loaddistribution than the uniformly or triangular load distribution. An explanation isgiven in Chapter 5.4.5.
0.0%
0.2%
0.4%
0.6%
0.8%
1.0%
1.2%
1.4%
1.6%
1.8%
GR
stra
in(%
)
DMS1 DMS3
CA-tri-all Z-tri-allCA-uni-all Z-uni-all
CA-inv-all Z-inv-all
Z-tri-str
Figure 5.22 Comparison of measured and calculated maximum GR strains in the full-scale fieldtest in Hamburg (Weihbrauch, 2010, 2013).
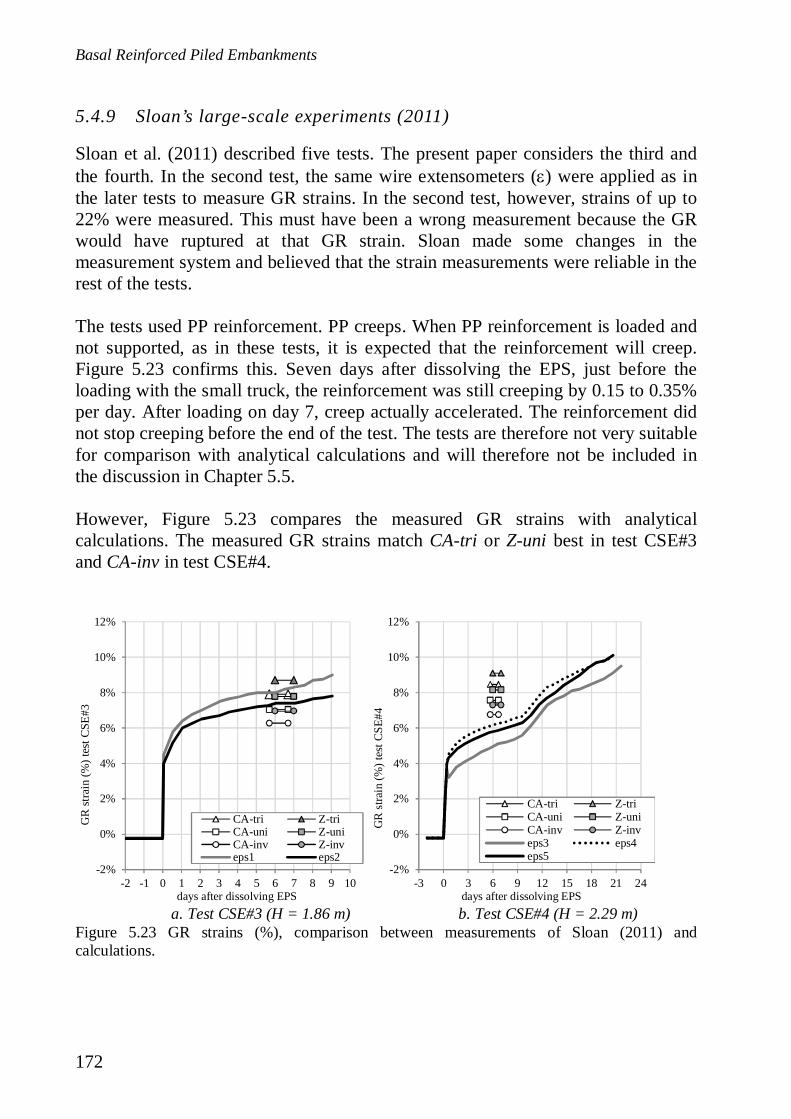
Basal Reinforced Piled Embankments
172
5.4.9 Sloan’s large-scale experiments (2011)
Sloan et al. (2011) described five tests. The present paper considers the third andthe fourth. In the second test, the same wire extensometers ( ) were applied as inthe later tests to measure GR strains. In the second test, however, strains of up to22% were measured. This must have been a wrong measurement because the GRwould have ruptured at that GR strain. Sloan made some changes in themeasurement system and believed that the strain measurements were reliable in therest of the tests.
The tests used PP reinforcement. PP creeps. When PP reinforcement is loaded andnot supported, as in these tests, it is expected that the reinforcement will creep.Figure 5.23 confirms this. Seven days after dissolving the EPS, just before theloading with the small truck, the reinforcement was still creeping by 0.15 to 0.35%per day. After loading on day 7, creep actually accelerated. The reinforcement didnot stop creeping before the end of the test. The tests are therefore not very suitablefor comparison with analytical calculations and will therefore not be included inthe discussion in Chapter 5.5.
However, Figure 5.23 compares the measured GR strains with analyticalcalculations. The measured GR strains match CA-tri or Z-uni best in test CSE#3and CA-inv in test CSE#4.
a. Test CSE#3 (H = 1.86 m) b. Test CSE#4 (H = 2.29 m)
-2%
0%
2%
4%
6%
8%
10%
12%
-2 -1 0 1 2 3 4 5 6 7 8 9 10
GR
stra
in(%
)tes
tCSE
#3
days after dissolving EPS
CA-tri Z-triCA-uni Z-uniCA-inv Z-inveps1 eps2
-2%
0%
2%
4%
6%
8%
10%
12%
-3 0 3 6 9 12 15 18 21 24
GR
stra
in(%
)tes
tCSE
#4
days after dissolving EPS
CA-tri Z-triCA-uni Z-uniCA-inv Z-inveps3 eps4eps5
Figure 5.23 GR strains (%), comparison between measurements of Sloan (2011) andcalculations.
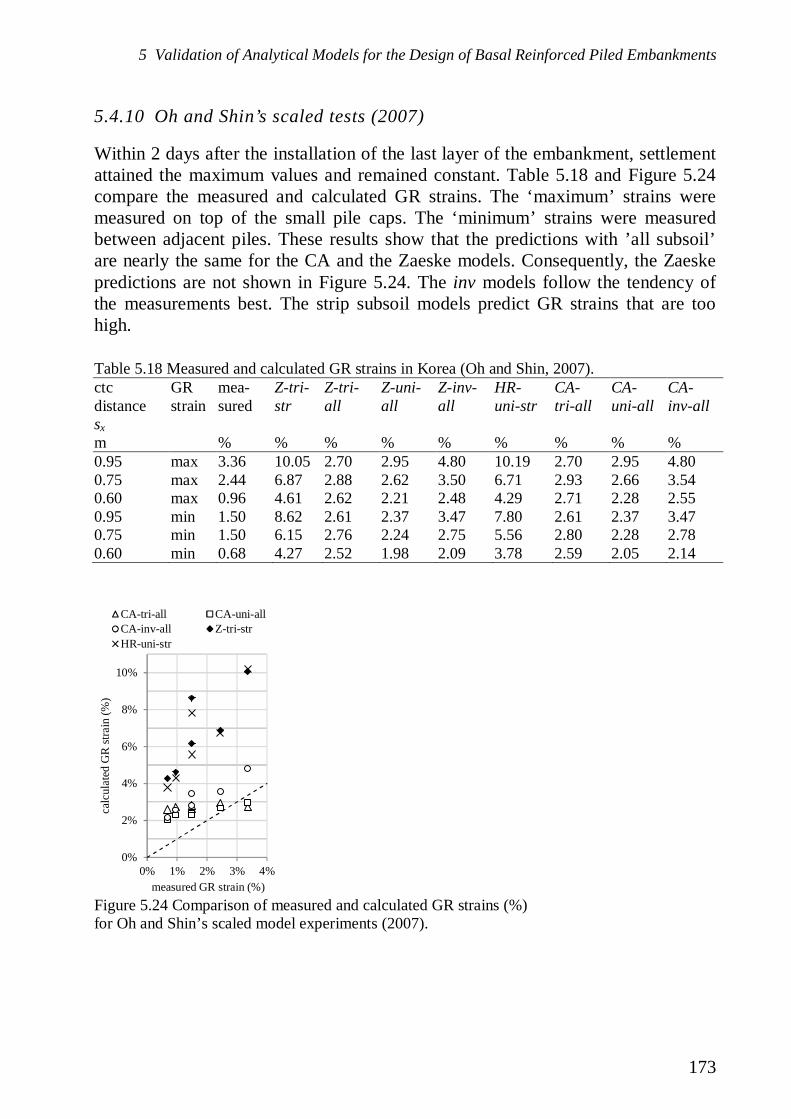
5 Validation of Analytical Models for the Design of Basal Reinforced Piled Embankments
173
5.4.10 Oh and Shin’s scaled tests (2007)
Within 2 days after the installation of the last layer of the embankment, settlementattained the maximum values and remained constant. Table 5.18 and Figure 5.24compare the measured and calculated GR strains. The ‘maximum’ strains weremeasured on top of the small pile caps. The ‘minimum’ strains were measuredbetween adjacent piles. These results show that the predictions with ’all subsoil’are nearly the same for the CA and the Zaeske models. Consequently, the Zaeskepredictions are not shown in Figure 5.24. The inv models follow the tendency ofthe measurements best. The strip subsoil models predict GR strains that are toohigh.
Table 5.18 Measured and calculated GR strains in Korea (Oh and Shin, 2007).ctcdistance
GRstrain
mea-sured
Z-tri-str
Z-tri-all
Z-uni-all
Z-inv-all
HR-uni-str
CA-tri-all
CA-uni-all
CA-inv-all
sxm % % % % % % % % %0.95 max 3.36 10.05 2.70 2.95 4.80 10.19 2.70 2.95 4.800.75 max 2.44 6.87 2.88 2.62 3.50 6.71 2.93 2.66 3.540.60 max 0.96 4.61 2.62 2.21 2.48 4.29 2.71 2.28 2.550.95 min 1.50 8.62 2.61 2.37 3.47 7.80 2.61 2.37 3.470.75 min 1.50 6.15 2.76 2.24 2.75 5.56 2.80 2.28 2.780.60 min 0.68 4.27 2.52 1.98 2.09 3.78 2.59 2.05 2.14
0%
2%
4%
6%
8%
10%
0% 1% 2% 3% 4%
calc
ulat
edG
Rstr
ain
(%)
measured GR strain (%)
CA-tri-all CA-uni-allCA-inv-all Z-tri-strHR-uni-str
Figure 5.24 Comparison of measured and calculated GR strains (%)for Oh and Shin’s scaled model experiments (2007).

Basal Reinforced Piled Embankments
174
5.4.11 German laboratory scaled experiments
Zaeske (2001) and Kempfert et al. (1999, 2004) showed that the largest GR strainswere found in and along the GR strip. The maximum was found close to the pilecap, in other words with strain gauge 0 (see Figure 5.13). Figure 5.25 thereforegives the measurements with 0 for Zaeske’s tests 5 and 7, as presented in hisFigures 4.21 and 5.12 (2001). The results for tests 6 and 8 show a comparablematch between measurements and calculations.
It should be noted that the measurements in Zaeske’s Figures 4.21 and 5.12 do notmatch the measurements in Zaeske’s Figure 6.19 and Figure 6 in Kempfert et al.(2004). The authors of the present paper are of the opinion that these last twofigures contain some mistakes and that figures 4.21 and 5.12 give the correctmeasurements.
The figure shows that Z-tri-str (adopted in EBGEO and CUR) and HR-uni-str givegreater GR strains than measured. Extension of the subsoil support to ‘all subsoil’improves the prediction considerably. The CA model results in a better match thanthe Zaeske model. These tests have a relatively stiff subsoil. As explained inChapter 5.4.5, the uniformly distributed load distribution results in the best matchwith the measurement, and the inverse triangular load distribution gives largerstrains.
0%
1%
2%
3%
4%
0 25 50 75 100
GR
stra
in(%
)tes
t5
reduced surcharge load (kPa)
test 5; H=0.35 mJ=1000 kN/m
0%
1%
2%
3%
4%
0 25 50 75 100
GR
stra
in(%
)tes
t7
reduced surcharge load (kPa)
test 7; H=0.70 mJ=1000 kN/m
0%1%2%3%4%5%6%0255075100
Z-tri-all Z-uni-all Z-inv-all Z-tri-str measured
CA-tri-all CA-uni-all CA-inv-all HR-uni-str
Figure 5.25 GR strains (%), comparison between calculations and measurements with straingauge 0 (see Figure 5.13) in Zaeske’s laboratory experiments (2001). The surcharge load in thecalculations was 80% of the applied surcharge load to compensate for the friction between thetest box walls and the sand fill. This reduced load is also given on the horizontal axis.
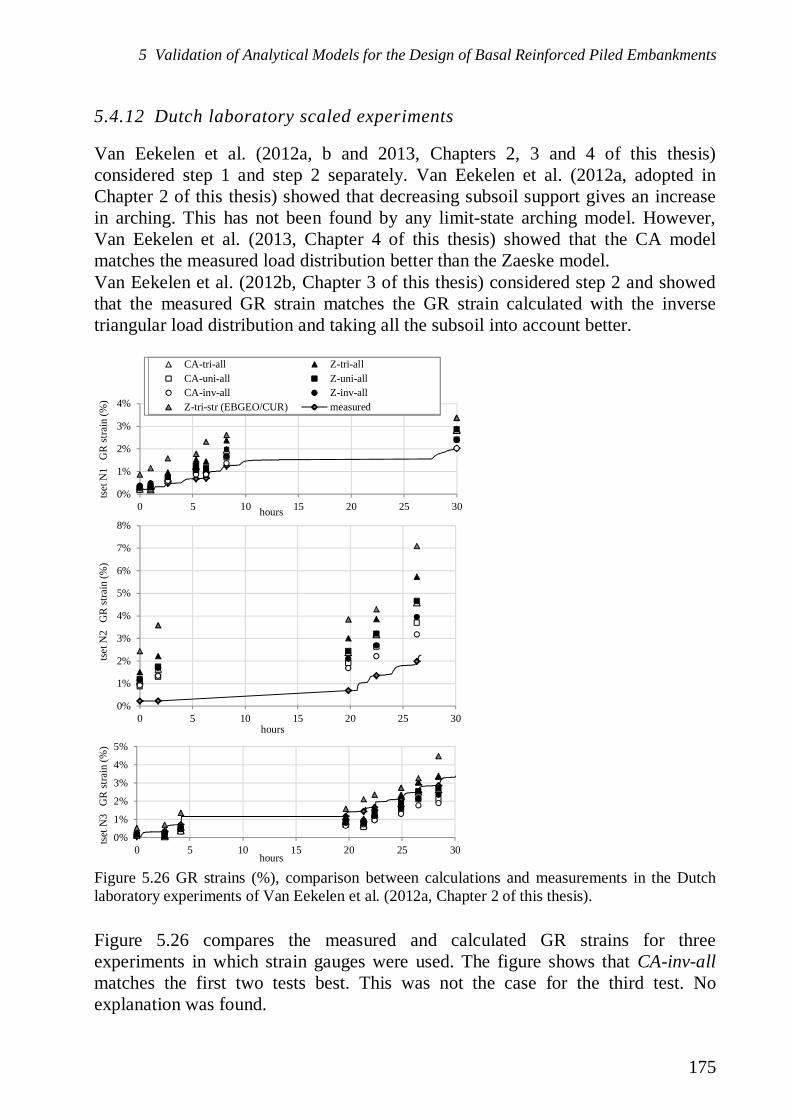
5 Validation of Analytical Models for the Design of Basal Reinforced Piled Embankments
175
5.4.12 Dutch laboratory scaled experiments
Van Eekelen et al. (2012a, b and 2013, Chapters 2, 3 and 4 of this thesis)considered step 1 and step 2 separately. Van Eekelen et al. (2012a, adopted inChapter 2 of this thesis) showed that decreasing subsoil support gives an increasein arching. This has not been found by any limit-state arching model. However,Van Eekelen et al. (2013, Chapter 4 of this thesis) showed that the CA modelmatches the measured load distribution better than the Zaeske model.Van Eekelen et al. (2012b, Chapter 3 of this thesis) considered step 2 and showedthat the measured GR strain matches the GR strain calculated with the inversetriangular load distribution and taking all the subsoil into account better.
Figure 5.26 compares the measured and calculated GR strains for threeexperiments in which strain gauges were used. The figure shows that CA-inv-allmatches the first two tests best. This was not the case for the third test. Noexplanation was found.
0%
1%
2%
3%
4%
5%
0 5 10 15 20 25 30
tset
N3
GR
stra
in(%
)
hours
0%
1%
2%
3%
4%
5%
6%
7%
8%
0 5 10 15 20 25 30
tset
N2
GR
stra
in(%
)
hours
0%
1%
2%
3%
4%
0 5 10 15 20 25 30
tset
N1
GR
stra
in(%
)
hours
0%1%2%3%4%5%
20 25 30 35 40 45 50 55
CA-tri-all Z-tri-allCA-uni-all Z-uni-allCA-inv-all Z-inv-allZ-tri-str (EBGEO/CUR) measured
Figure 5.26 GR strains (%), comparison between calculations and measurements in the Dutchlaboratory experiments of Van Eekelen et al. (2012a, Chapter 2 of this thesis).

Basal Reinforced Piled Embankments
176
5.5 Discussion
Figure 5.27 and Figure 5.28 compare the measurements presented above with sixcombinations of calculation methods, explained in Table 5.13. The tests with acohesive fill (Almeida et al., 2007 and Briançon and Simon, 2012) have beenincluded, even though they are less comparable with the analytical modelsdeveloped for non-cohesive fill.
Figure 5.27e and f show that Z-tri-str and HR-uni-str match the measurementsleast. These models overestimate the measurements with average 146% and 189%,as shown by the trendlines given in Figure 5.27. Figure 5.27 also shows that theConcentric Arches model (figures a and b) matches the measurements better thanthe Zaeske arching model (figures c and d). The average overestimation of theCA model is 16-34%, the average overestimation of the Zaeske model is 24-42%.At low friction angles, the Zaeske model generally gives higher GR strains thanmeasured. At high friction angles, the Zaeske model gives lower GR strains thanmeasured. This is in accordance with the findings of Van der Peet (2014) and Vander Peet and Van Eekelen (2014). They showed that the increase of arching withincreasing friction angle in 3D finite-element calculations matches the CA model,while the arching in the Zaeske model increases much more strongly withincreasing friction angle.
The cases with no or nearly no subsoil support are most critical as the highest GRstrains will occur in relative terms. Figure 5.28 therefore shows only these cases.From this figure, it can be concluded that CA-inv-all matches the measurementsbest. Thus, the inverse triangular load distribution gives the best prediction of theGR strain. This is explained as follows. If the GR sags, the deflection is largermidway between the piles than close to the piles. The load is always attracted tostiffer elements. This is arching. A large part of the load is therefore attracted to thepile directly. However, a relatively large part is also attracted to the parts of the GRclose to the piles, which sags less and therefore seems to be stiffer.Figure 5.27 shows that the uniformly distributed load matches the measurementsfor the cases with subsoil support best. This is explained as follows. Thedifferences in deflection between the different parts of the GR are smaller if theGR is partly supported by the subsoil. Less arching therefore occurs, and this isalso true for the area between the piles, resulting in a more evenly distributed load.
The combination of this uniformly distributed load and counter-pressure frombelow results in a net load that matches the inverse triangular load distributionbest, as shown in Figure 5.19. In the cases where the subsoil is very stiff, theinverse triangular load distribution results in less GR deflection in the centrebetween piles than it is close to the pile cap edges, as can be seen in Figure 5.18.
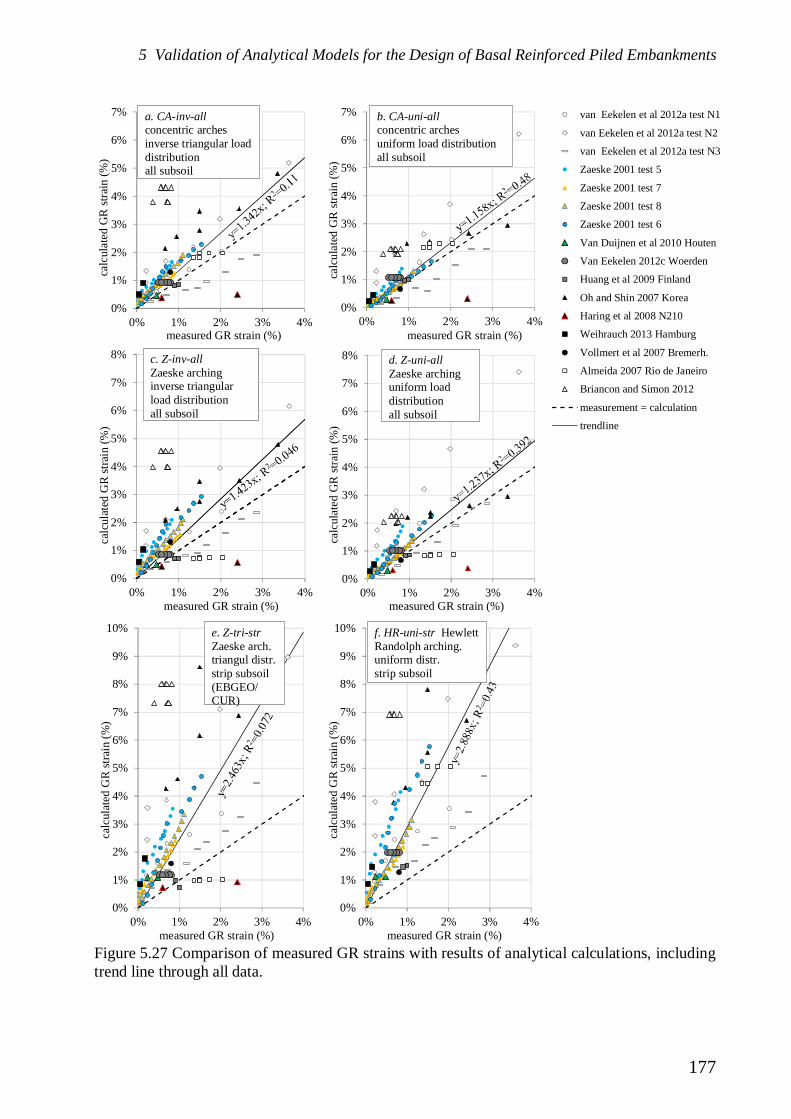
5 Validation of Analytical Models for the Design of Basal Reinforced Piled Embankments
177
0%
1%
2%
3%
4%
5%
6%
7%
0% 1% 2% 3% 4%
calc
ulat
edG
Rstr
ain
(%)
measured GR strain (%)
a. CA-inv-allconcentric archesinverse triangular loaddistributionall subsoil
0%
1%
2%
3%
4%
5%
6%
7%
0% 1% 2% 3% 4%ca
lcul
ated
GR
strai
n(%
)measured GR strain (%)
b. CA-uni-allconcentric archesuniform load distributionall subsoil
0%
1%
2%
3%
4%
5%
6%
7%
8%
0% 1% 2% 3% 4%
calc
ulat
edG
Rst
rain
(%)
measured GR strain (%)
c. Z-inv-allZaeske archinginverse triangularload distributionall subsoil
c. Z-inv-allZaeske archinginverse triangularload distributionall subsoil
0%
1%
2%
3%
4%
5%
6%
7%
8%
0% 1% 2% 3% 4%
calc
ulat
edG
Rstr
ain
(%)
measured GR strain (%)
d. Z-uni-allZaeske archinguniform loaddistributionall subsoil
0%
1%
2%
3%
4%
5%
6%
7%
8%
9%
10%
0% 1% 2% 3% 4%
calc
ulat
edG
Rst
rain
(%)
measured GR strain (%)
e. Z-tri-strZaeske arch.triangul distr.strip subsoil(EBGEO/CUR)
0%
1%
2%
3%
4%
5%
6%
7%
8%
9%
10%
0% 1% 2% 3% 4%
calc
ulat
edG
Rst
rain
(%)
measured GR strain (%)
f. HR-uni-str HewlettRandolph arching.uniform distr.strip subsoil
van Eekelen et al 2012a test N1
van Eekelen et al 2012a test N2
van Eekelen et al 2012a test N3
Zaeske 2001 test 5
Zaeske 2001 test 7
Zaeske 2001 test 8
Zaeske 2001 test 6
Van Duijnen et al 2010 Houten
Van Eekelen 2012c Woerden
Huang et al 2009 Finland
Oh and Shin 2007 Korea
Haring et al 2008 N210
Weihrauch 2013 Hamburg
Vollmert et al 2007 Bremerh.
Almeida 2007 Rio de Janeiro
Briancon and Simon 2012
measurement = calculation
trendline
Figure 5.27 Comparison of measured GR strains with results of analytical calculations, includingtrend line through all data.
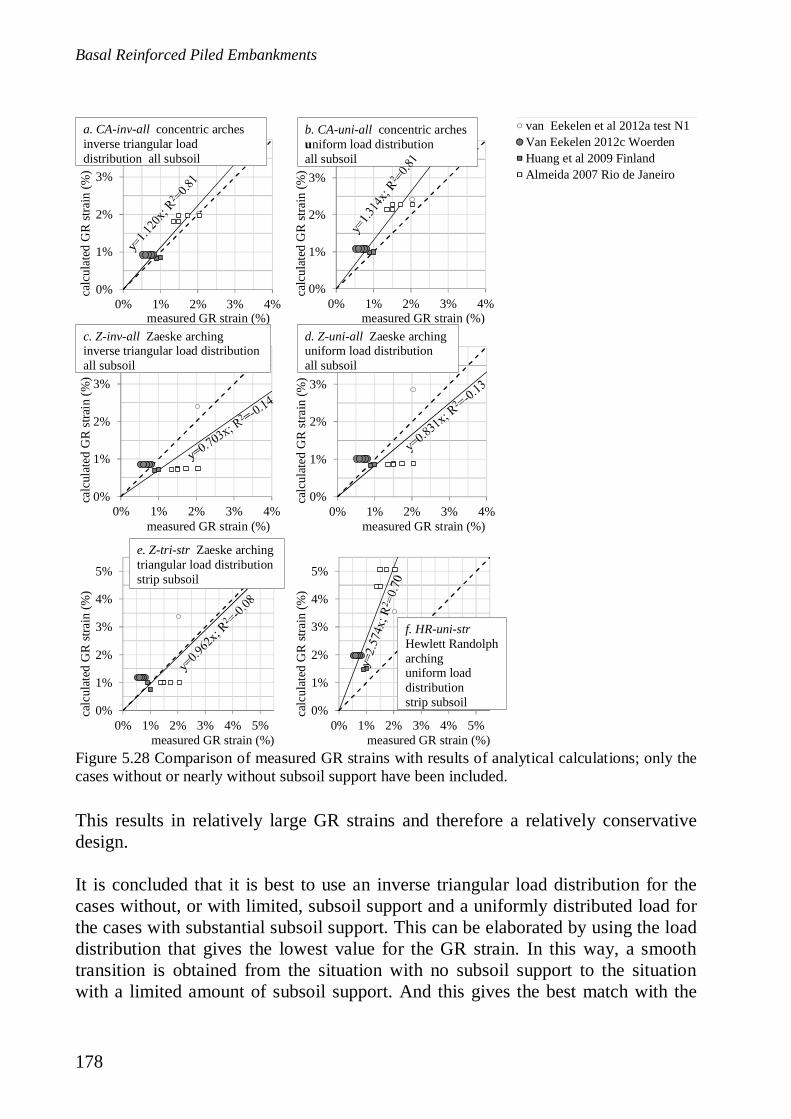
Basal Reinforced Piled Embankments
178
This results in relatively large GR strains and therefore a relatively conservativedesign.
It is concluded that it is best to use an inverse triangular load distribution for thecases without, or with limited, subsoil support and a uniformly distributed load forthe cases with substantial subsoil support. This can be elaborated by using the loaddistribution that gives the lowest value for the GR strain. In this way, a smoothtransition is obtained from the situation with no subsoil support to the situationwith a limited amount of subsoil support. And this gives the best match with the
0%
1%
2%
3%
4%
0% 1% 2% 3% 4%
calc
ulat
edG
Rstr
ain
(%)
measured GR strain (%)
a. CA-inv-all concentric archesinverse triangular loaddistribution all subsoil
0%
1%
2%
3%
4%
0% 1% 2% 3% 4%ca
lcul
ated
GR
strai
n(%
)measured GR strain (%)
b. CA-uni-all concentric archesuniform load distributionall subsoil
0%
1%
2%
3%
4%
0% 1% 2% 3% 4%
calc
ulat
edG
Rst
rain
(%)
measured GR strain (%)
c. Z-inv-all Zaeske archinginverse triangular load distributionall subsoil
0%
1%
2%
3%
4%
0% 1% 2% 3% 4%
calc
ulat
edG
Rst
rain
(%)
measured GR strain (%)
d. Z-uni-all Zaeske archinguniform load distributionall subsoil
0%
1%
2%
3%
4%
5%
0% 1% 2% 3% 4% 5%
calc
ulat
edG
Rstr
ain
(%)
measured GR strain (%)
e. Z-tri-str Zaeske archingtriangular load distributionstrip subsoil
van Eekelen et al 2012a test N1Van Eekelen 2012c WoerdenHuang et al 2009 FinlandAlmeida 2007 Rio de Janeiro
0%
1%
2%
3%
4%
5%
0% 1% 2% 3% 4% 5%
calc
ulat
edG
Rstr
ain
(%)
measured GR strain (%)
f. HR-uni-strHewlett Randolpharchinguniform loaddistributionstrip subsoil
Figure 5.28 Comparison of measured GR strains with results of analytical calculations; only thecases without or nearly without subsoil support have been included.
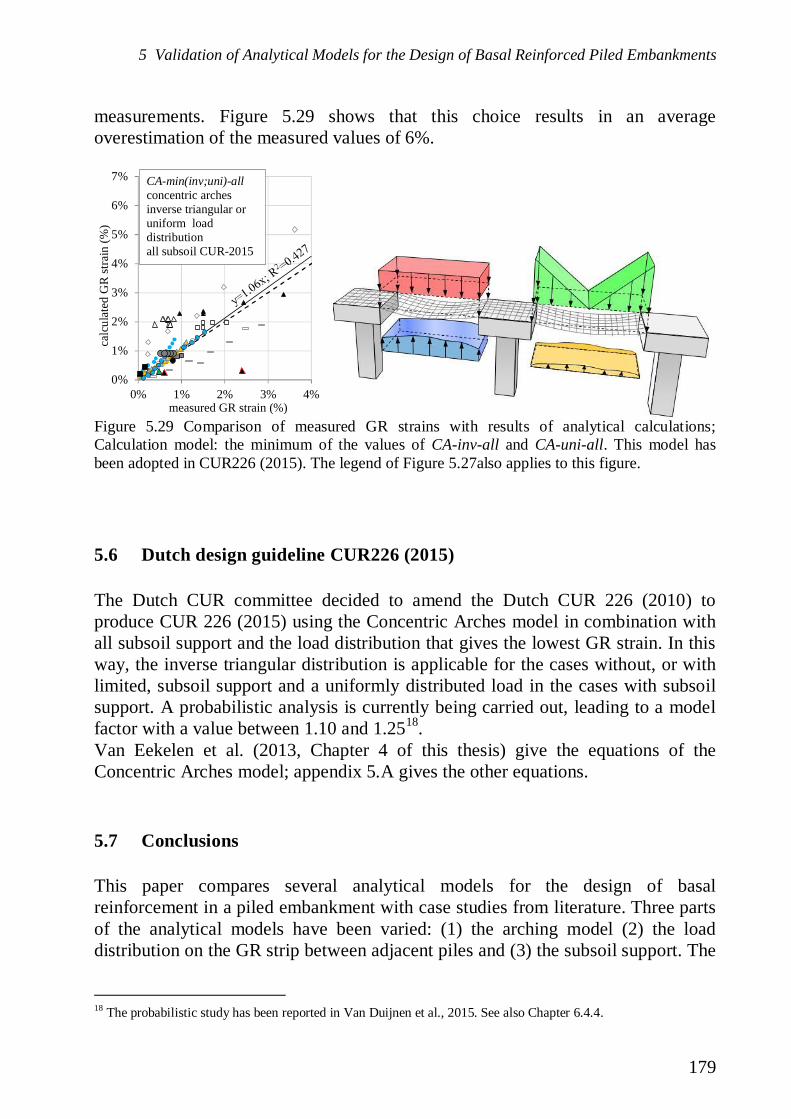
5 Validation of Analytical Models for the Design of Basal Reinforced Piled Embankments
179
measurements. Figure 5.29 shows that this choice results in an averageoverestimation of the measured values of 6%.
5.6 Dutch design guideline CUR226 (2015)
The Dutch CUR committee decided to amend the Dutch CUR 226 (2010) toproduce CUR 226 (2015) using the Concentric Arches model in combination withall subsoil support and the load distribution that gives the lowest GR strain. In thisway, the inverse triangular distribution is applicable for the cases without, or withlimited, subsoil support and a uniformly distributed load in the cases with subsoilsupport. A probabilistic analysis is currently being carried out, leading to a modelfactor with a value between 1.10 and 1.2518.Van Eekelen et al. (2013, Chapter 4 of this thesis) give the equations of theConcentric Arches model; appendix 5.A gives the other equations.
5.7 Conclusions
This paper compares several analytical models for the design of basalreinforcement in a piled embankment with case studies from literature. Three partsof the analytical models have been varied: (1) the arching model (2) the loaddistribution on the GR strip between adjacent piles and (3) the subsoil support. The
18 The probabilistic study has been reported in Van Duijnen et al., 2015. See also Chapter 6.4.4.
0%
1%
2%
3%
4%
5%
6%
7%
0% 1% 2% 3% 4%
calc
ulat
edG
Rst
rain
(%)
measured GR strain (%)
CA-min(inv;uni)-allconcentric archesinverse triangular oruniform loaddistributionall subsoil CUR-2015
Figure 5.29 Comparison of measured GR strains with results of analytical calculations;Calculation model: the minimum of the values of CA-inv-all and CA-uni-all. This model hasbeen adopted in CUR226 (2015). The legend of Figure 5.27also applies to this figure.
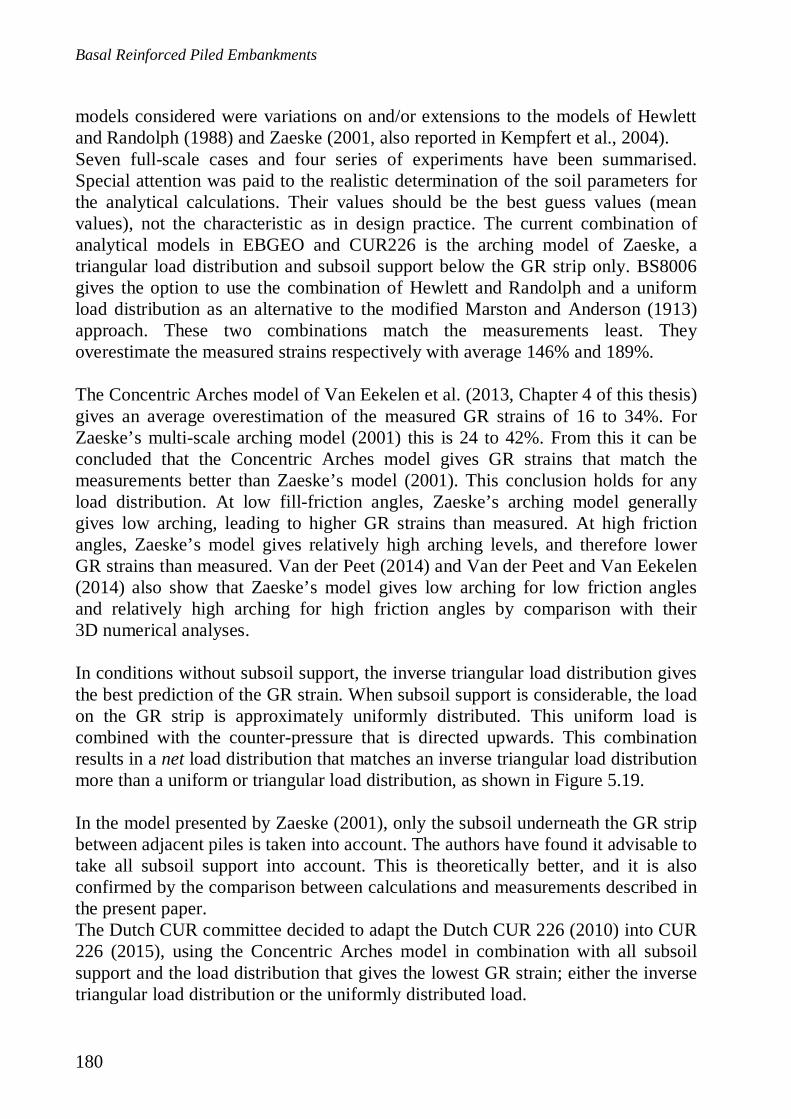
Basal Reinforced Piled Embankments
180
models considered were variations on and/or extensions to the models of Hewlettand Randolph (1988) and Zaeske (2001, also reported in Kempfert et al., 2004).Seven full-scale cases and four series of experiments have been summarised.Special attention was paid to the realistic determination of the soil parameters forthe analytical calculations. Their values should be the best guess values (meanvalues), not the characteristic as in design practice. The current combination ofanalytical models in EBGEO and CUR226 is the arching model of Zaeske, atriangular load distribution and subsoil support below the GR strip only. BS8006gives the option to use the combination of Hewlett and Randolph and a uniformload distribution as an alternative to the modified Marston and Anderson (1913)approach. These two combinations match the measurements least. Theyoverestimate the measured strains respectively with average 146% and 189%.
The Concentric Arches model of Van Eekelen et al. (2013, Chapter 4 of this thesis)gives an average overestimation of the measured GR strains of 16 to 34%. ForZaeske’s multi-scale arching model (2001) this is 24 to 42%. From this it can beconcluded that the Concentric Arches model gives GR strains that match themeasurements better than Zaeske’s model (2001). This conclusion holds for anyload distribution. At low fill-friction angles, Zaeske’s arching model generallygives low arching, leading to higher GR strains than measured. At high frictionangles, Zaeske’s model gives relatively high arching levels, and therefore lowerGR strains than measured. Van der Peet (2014) and Van der Peet and Van Eekelen(2014) also show that Zaeske’s model gives low arching for low friction anglesand relatively high arching for high friction angles by comparison with their3D numerical analyses.
In conditions without subsoil support, the inverse triangular load distribution givesthe best prediction of the GR strain. When subsoil support is considerable, the loadon the GR strip is approximately uniformly distributed. This uniform load iscombined with the counter-pressure that is directed upwards. This combinationresults in a net load distribution that matches an inverse triangular load distributionmore than a uniform or triangular load distribution, as shown in Figure 5.19.
In the model presented by Zaeske (2001), only the subsoil underneath the GR stripbetween adjacent piles is taken into account. The authors have found it advisable totake all subsoil support into account. This is theoretically better, and it is alsoconfirmed by the comparison between calculations and measurements described inthe present paper.The Dutch CUR committee decided to adapt the Dutch CUR 226 (2010) into CUR226 (2015), using the Concentric Arches model in combination with all subsoilsupport and the load distribution that gives the lowest GR strain; either the inversetriangular load distribution or the uniformly distributed load.
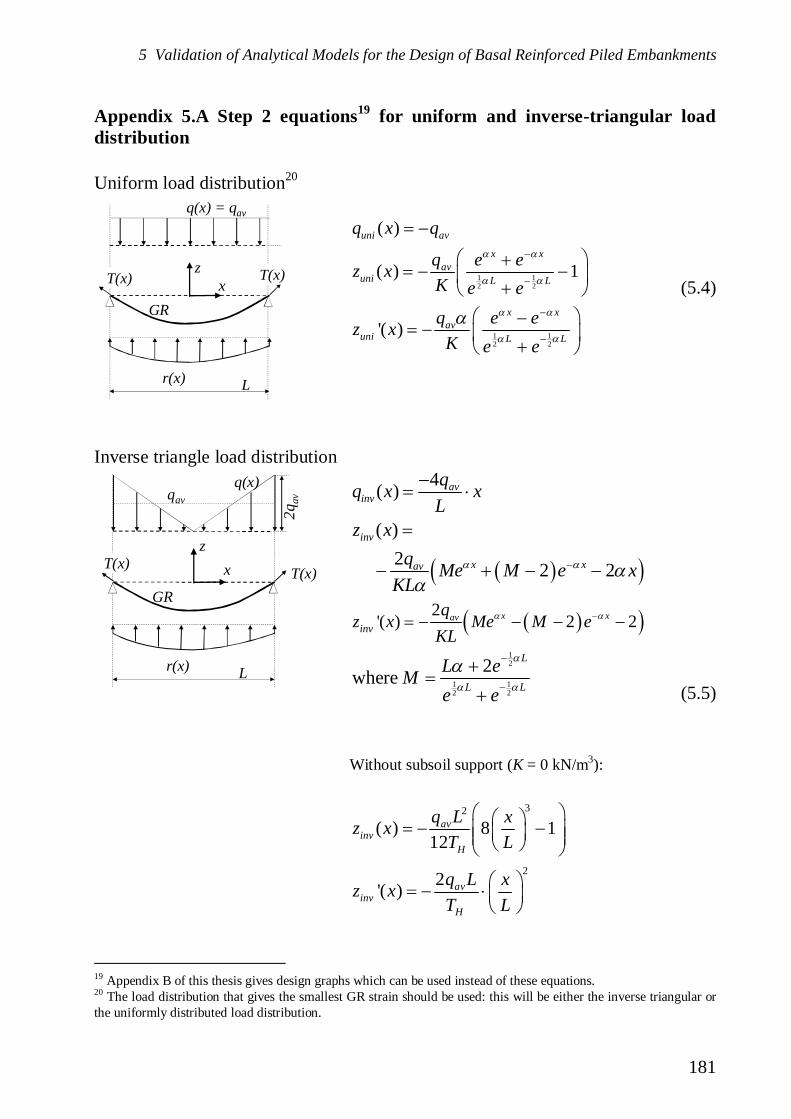
5 Validation of Analytical Models for the Design of Basal Reinforced Piled Embankments
181
Appendix 5.A Step 2 equations19 for uniform and inverse-triangular loaddistribution
Uniform load distribution20
1 12 2
1 12 2
( )
( ) 1
'( )
uni av
x xav
uni L L
x xav
uni L L
q x q
q e ez xK e eq e ez x
K e e
(5.4)
Inverse triangle load distribution
12
1 12 2
2'( ) 2 2
4( )
( )2 2 2
2where
x xav
avinv
inv
x xav
inv
L
L L
qz x Me M e
KL
qq x xL
z xq Me M e x
KL
L eMe e
Without subsoil support (K = 0 kN/m3):
32
2
( ) 8 112
2'( )
avinv
H
avinv
H
q L xz xT L
q L xz xT L
(5.5)
19 Appendix B of this thesis gives design graphs which can be used instead of these equations.20 The load distribution that gives the smallest GR strain should be used: this will be either the inverse triangular orthe uniformly distributed load distribution.
r(x)
zx
L
GR
q(x) = qav
T(x)T(x)
z
q(x)
T(x)
r(x)
x
L
GR
qav
T(x)
2qav

Basal Reinforced Piled Embankments
182
Where z(x) (m) is the GR deflection, z’(x) its derivative, L (m) is the clear distancebetween adjacent pile caps (Lx = sx - aeq and Ly = sy - aeq), TH is the horizontalcomponent of the tensile force T(x) in the GR strip and 2 (m-2) is given by:
2
H
KT (5.6)
Where the subgrade reaction coefficient k (kN/m3) is changed as follows intoK (kN/m3) to take into account all subsoil support (following Lodder et al., 2012and Van Eekelen et al., 2012b, adopted in Chapter 2 of this thesis):
,
,
x yL
x y eq
A kK
L a (5.7)
Where aeq = Bers (m) is the width of the square pile cap or the equivalent width ofthe circular pile cap and ALx,y (m2) is the GR area belonging to a GR strip in x- or ydirection:
212
212
arctan2
arctan2
yLx x y
x
xLy x y
y
sdA s ss
d sA s ss
(5.8)
with arctan in radials, d (m) is the pile cap diameter, q(x) (kPa) is the distributionload on the GR strips between adjacent piles and qav (kPa) is the average load onthe GR strips:
avGRstrip transversal GRstrip longitudinal
B CqA A (5.9)
Where B+C (kN/pile) is the total vertical load on the geosynthetic reinforcement.This value can be calculated with the equations given in Van Eekelen et al., 2013.The tensile force T(x) in the geosynthetic reinforcement (kN/m) can be calculatedas:
2( ) 1 '( )
( )( )
HT x T z x
T xxJ
(5.10)

5 Validation of Analytical Models for the Design of Basal Reinforced Piled Embankments
183
The maximum tensile force Tmax occurs at the edge of the pile cap. The value of THcan be solved by equalising the average geometric and constitutive strain:
12
12
212
0, 1
2
0, 1
2
1
1
x L
xgeometric average
x L
xconstitutive average
dz dx Ldx
L
T x dxJ
L
(5.11)

6 Discussion
6.1 Introduction
Several design methods for basal reinforced piled embankments were alreadyavailable before the start of the research described here. They produce results thatvary widely. Measurements that were published later – for example in Van Duijnenet al. (2010) and Van Eekelen et al. (2015a) – showed that the models in use in theEuropean design guidelines overpredict GR strain and therefore there was room forimprovement.
Chapter 1.2 showed that GR design includes two calculation steps: the archingbehaviour in the fill (step 1) and the load-deflection behaviour of the GR (step 2).On the basis of scaled model experiments (Chapter 2, Van Eekelen et al., 2012a)suggestions were made for a new model for calculation step 2: an inversetriangular net load distribution on the GR strips and an extension of the subsoilsupport to ‘all subsoil’ (Chapter 3). An explanation was found for this inverse-triangular load distribution and the strong load concentration on the GR strips withthe development of the new Concentric Arches (CA) Model (Chapter 4).
Chapter 5 compared the results of the new analytical model, and several existingmodels, with GR strains measured in eleven field monitoring projects orexperiment series from the literature. These projects included the experimentsreported in Chapter 2 and two field monitoring projects carried out as part of thisresearch. The conclusion was that the CA model matches the measurements betterthan any of the other step 1 models. In conditions without subsoil support, theinverse triangular load distribution gives the best prediction of the GR strain.When subsoil support is considerable, the load on the GR strip is approximatelyuniformly distributed.
This discussion chapter answers the three research questions (Chapter 1.3) anddiscusses the research results.
Basal Reinforced Piled Embankments
186
6.2 How is the vertical load distributed on the basal reinforcement of apiled embankment?
6.2.1 Load distribution dependent on stiffness behaviour
In a uniform earth structure, the vertical pressure at a given depth is uniformlydistributed. In a basal reinforced piled embankment, the vertical pressure at the GRlevel depends on the stiffness behaviour of the separate elements. The stiffer theelement, or the less the element moves, the more load it attracts. This is arching.
Most of the conclusions in this chapter are based on observations in scaled modeltests. Chapter 6.2.2 looks at whether scaled model tests can be sufficiently reliableto draw such conclusions about load distribution and arching.
The piles and pile caps are the stiffest elements and they therefore attract mostload. This load part, which is transferred to the pile caps directly, is called ‘loadpart A’ or ‘arching A’ in this thesis and depends on several features, as described inChapter 4. The scaled experiments showed that one major factor that has aninfluence is subsoil support (Chapter 2.4.1): decreasing subsoil support results inmore GR deflection, less load on the GR and more arching A. This is in line withthe idea that less stiff behaviour attracts less load.The experiments also showed that the load is attracted to stiffer elements moreefficiently if the fill is stronger; the arching is more efficient for higher frictionangles (Chapter 2.5.1) and embankments with a larger fill height H (Chapter4.3.3).
The GR strips between adjacent piles behave relatively stiffly because the spanbetween adjacent piles is relatively small. Additionally, some GR types are biaxialor uniaxial and are stiffer along the GR strips than, for example, diagonally.Consequently, the GR strips behave more stiffly than the surrounding GR and theGR strips therefore attract much more load than the surrounding GR. This loadconcentration on the GR strips was measured by Zaeske (2001, see Figure 4.6) andproven with 3D numerical calculations (Figure 6.2). This effect is clearest in thecases with little or no subsoil support.
The load distribution on the GR strips depends on the GR deflection. The areaswith the least GR deflection attract most load. The GR close to the pile caps isdeflected least, because the deflection is limited by the unmoving pile cap. Thislocation therefore attracts more load than the locations further away from the pilecap and so the highest pressures are found alongside the pile cap, with the lowestpressures on the GR strip being found at the central point between the pile caps. Ifthere is no subsoil support, the GR at the central point between the pile caps sags
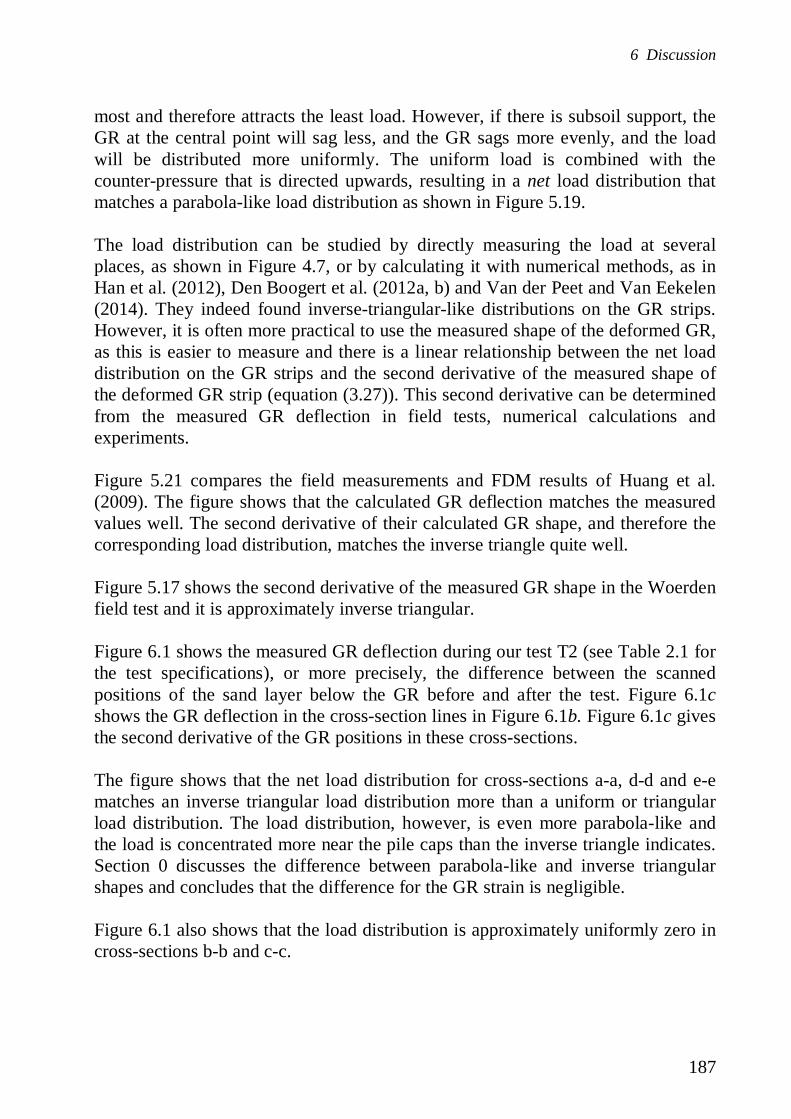
6 Discussion
187
most and therefore attracts the least load. However, if there is subsoil support, theGR at the central point will sag less, and the GR sags more evenly, and the loadwill be distributed more uniformly. The uniform load is combined with thecounter-pressure that is directed upwards, resulting in a net load distribution thatmatches a parabola-like load distribution as shown in Figure 5.19.
The load distribution can be studied by directly measuring the load at severalplaces, as shown in Figure 4.7, or by calculating it with numerical methods, as inHan et al. (2012), Den Boogert et al. (2012a, b) and Van der Peet and Van Eekelen(2014). They indeed found inverse-triangular-like distributions on the GR strips.However, it is often more practical to use the measured shape of the deformed GR,as this is easier to measure and there is a linear relationship between the net loaddistribution on the GR strips and the second derivative of the measured shape ofthe deformed GR strip (equation (3.27)). This second derivative can be determinedfrom the measured GR deflection in field tests, numerical calculations andexperiments.
Figure 5.21 compares the field measurements and FDM results of Huang et al.(2009). The figure shows that the calculated GR deflection matches the measuredvalues well. The second derivative of their calculated GR shape, and therefore thecorresponding load distribution, matches the inverse triangle quite well.
Figure 5.17 shows the second derivative of the measured GR shape in the Woerdenfield test and it is approximately inverse triangular.
Figure 6.1 shows the measured GR deflection during our test T2 (see Table 2.1 forthe test specifications), or more precisely, the difference between the scannedpositions of the sand layer below the GR before and after the test. Figure 6.1cshows the GR deflection in the cross-section lines in Figure 6.1b. Figure 6.1c givesthe second derivative of the GR positions in these cross-sections.
The figure shows that the net load distribution for cross-sections a-a, d-d and e-ematches an inverse triangular load distribution more than a uniform or triangularload distribution. The load distribution, however, is even more parabola-like andthe load is concentrated more near the pile caps than the inverse triangle indicates.Section 0 discusses the difference between parabola-like and inverse triangularshapes and concludes that the difference for the GR strain is negligible.
Figure 6.1 also shows that the load distribution is approximately uniformly zero incross-sections b-b and c-c.
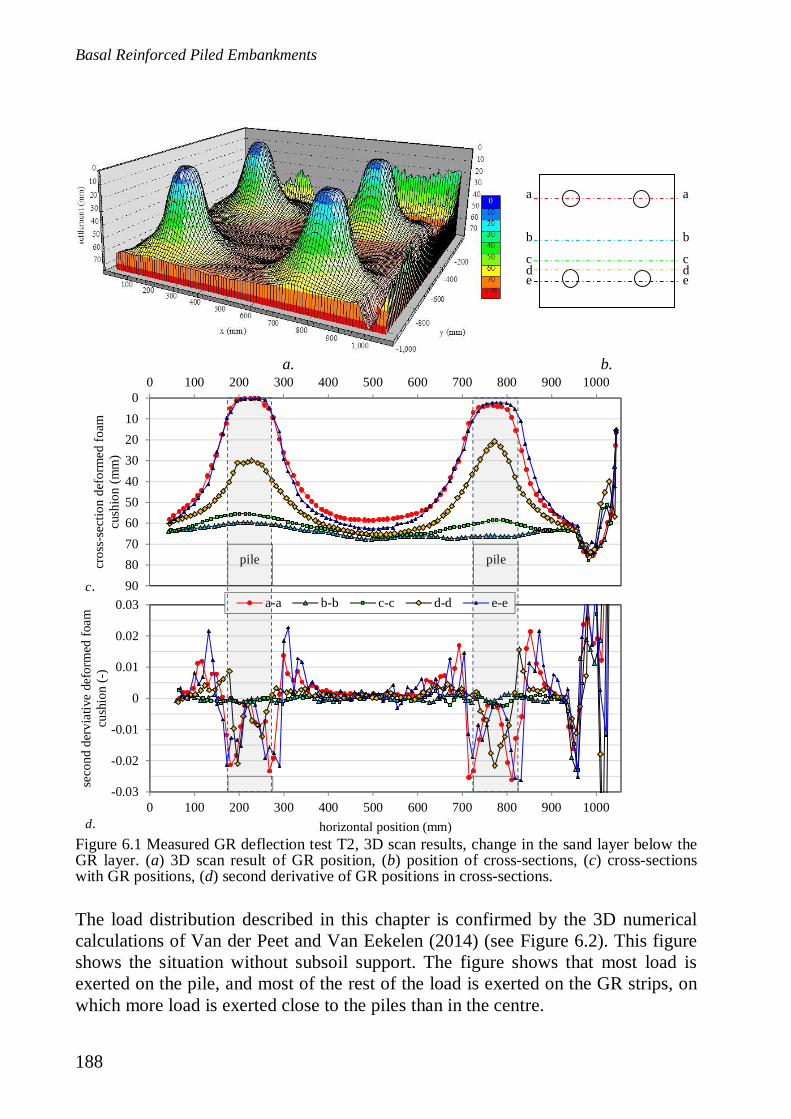
Basal Reinforced Piled Embankments
188
a. b.
The load distribution described in this chapter is confirmed by the 3D numericalcalculations of Van der Peet and Van Eekelen (2014) (see Figure 6.2). This figureshows the situation without subsoil support. The figure shows that most load isexerted on the pile, and most of the rest of the load is exerted on the GR strips, onwhich more load is exerted close to the piles than in the centre.
a
b
cde
a
b
cde
0102030405060708090
0 100 200 300 400 500 600 700 800 900 1000
cros
s-se
ctio
nde
form
edfo
amcu
shio
n(m
m)
c.
pile pile
-0.03
-0.02
-0.01
0
0.01
0.02
0.03
0 100 200 300 400 500 600 700 800 900 1000
seco
ndde
rvia
tive
defo
rmed
foam
cush
ion
(-)
horizontal position (mm)
a-a b-b c-c d-d e-e
d.Figure 6.1 Measured GR deflection test T2, 3D scan results, change in the sand layer below theGR layer. (a) 3D scan result of GR position, (b) position of cross-sections, (c) cross-sectionswith GR positions, (d) second derivative of GR positions in cross-sections.
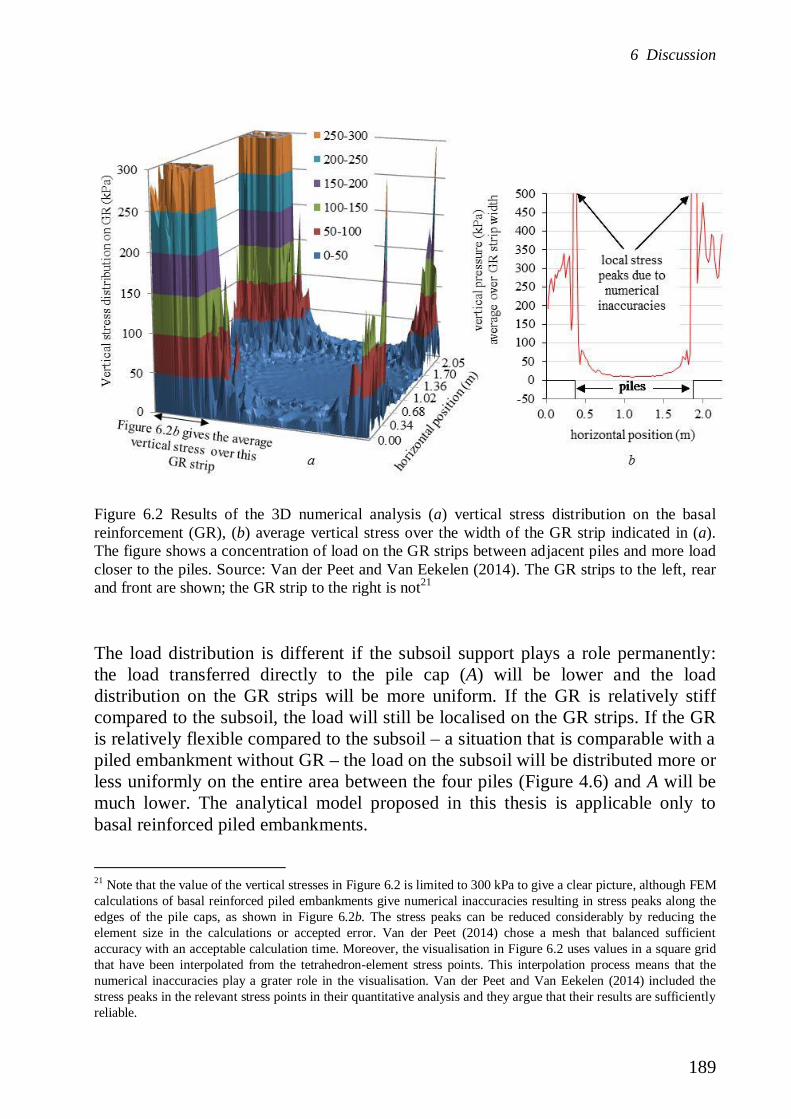
6 Discussion
189
The load distribution is different if the subsoil support plays a role permanently:the load transferred directly to the pile cap (A) will be lower and the loaddistribution on the GR strips will be more uniform. If the GR is relatively stiffcompared to the subsoil, the load will still be localised on the GR strips. If the GRis relatively flexible compared to the subsoil – a situation that is comparable with apiled embankment without GR – the load on the subsoil will be distributed more orless uniformly on the entire area between the four piles (Figure 4.6) and A will bemuch lower. The analytical model proposed in this thesis is applicable only tobasal reinforced piled embankments.
21 Note that the value of the vertical stresses in Figure 6.2 is limited to 300 kPa to give a clear picture, although FEMcalculations of basal reinforced piled embankments give numerical inaccuracies resulting in stress peaks along theedges of the pile caps, as shown in Figure 6.2b. The stress peaks can be reduced considerably by reducing theelement size in the calculations or accepted error. Van der Peet (2014) chose a mesh that balanced sufficientaccuracy with an acceptable calculation time. Moreover, the visualisation in Figure 6.2 uses values in a square gridthat have been interpolated from the tetrahedron-element stress points. This interpolation process means that thenumerical inaccuracies play a grater role in the visualisation. Van der Peet and Van Eekelen (2014) included thestress peaks in the relevant stress points in their quantitative analysis and they argue that their results are sufficientlyreliable.
Figure 6.2 Results of the 3D numerical analysis (a) vertical stress distribution on the basalreinforcement (GR), (b) average vertical stress over the width of the GR strip indicated in (a).The figure shows a concentration of load on the GR strips between adjacent piles and more loadcloser to the piles. Source: Van der Peet and Van Eekelen (2014). The GR strips to the left, rearand front are shown; the GR strip to the right is not21
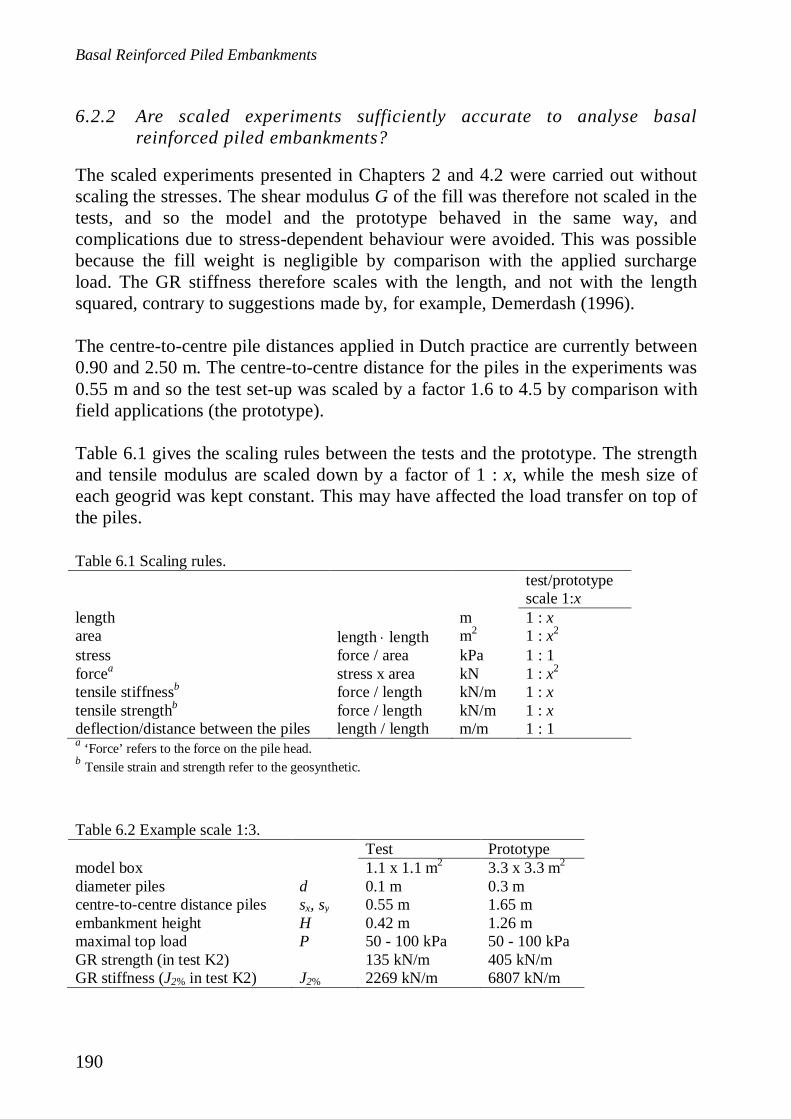
Basal Reinforced Piled Embankments
190
6.2.2 Are scaled experiments sufficiently accurate to analyse basalreinforced piled embankments?
The scaled experiments presented in Chapters 2 and 4.2 were carried out withoutscaling the stresses. The shear modulus G of the fill was therefore not scaled in thetests, and so the model and the prototype behaved in the same way, andcomplications due to stress-dependent behaviour were avoided. This was possiblebecause the fill weight is negligible by comparison with the applied surchargeload. The GR stiffness therefore scales with the length, and not with the lengthsquared, contrary to suggestions made by, for example, Demerdash (1996).
The centre-to-centre pile distances applied in Dutch practice are currently between0.90 and 2.50 m. The centre-to-centre distance for the piles in the experiments was0.55 m and so the test set-up was scaled by a factor 1.6 to 4.5 by comparison withfield applications (the prototype).
Table 6.1 gives the scaling rules between the tests and the prototype. The strengthand tensile modulus are scaled down by a factor of 1 : x, while the mesh size ofeach geogrid was kept constant. This may have affected the load transfer on top ofthe piles.
Table 6.1 Scaling rules.test/prototypescale 1:x
length m 1 : xarea length length m2 1 : x2
stress force / area kPa 1 : 1forcea stress x area kN 1 : x2
tensile stiffnessb force / length kN/m 1 : xtensile strengthb force / length kN/m 1 : xdeflection/distance between the piles length / length m/m 1 : 1a ‘Force’ refers to the force on the pile head.b Tensile strain and strength refer to the geosynthetic.
Table 6.2 Example scale 1:3.Test Prototype
model box 1.1 x 1.1 m2 3.3 x 3.3 m2
diameter piles d 0.1 m 0.3 mcentre-to-centre distance piles sx, sy 0.55 m 1.65 membankment height H 0.42 m 1.26 mmaximal top load P 50 - 100 kPa 50 - 100 kPaGR strength (in test K2) 135 kN/m 405 kN/mGR stiffness (J2% in test K2) J2% 2269 kN/m 6807 kN/m
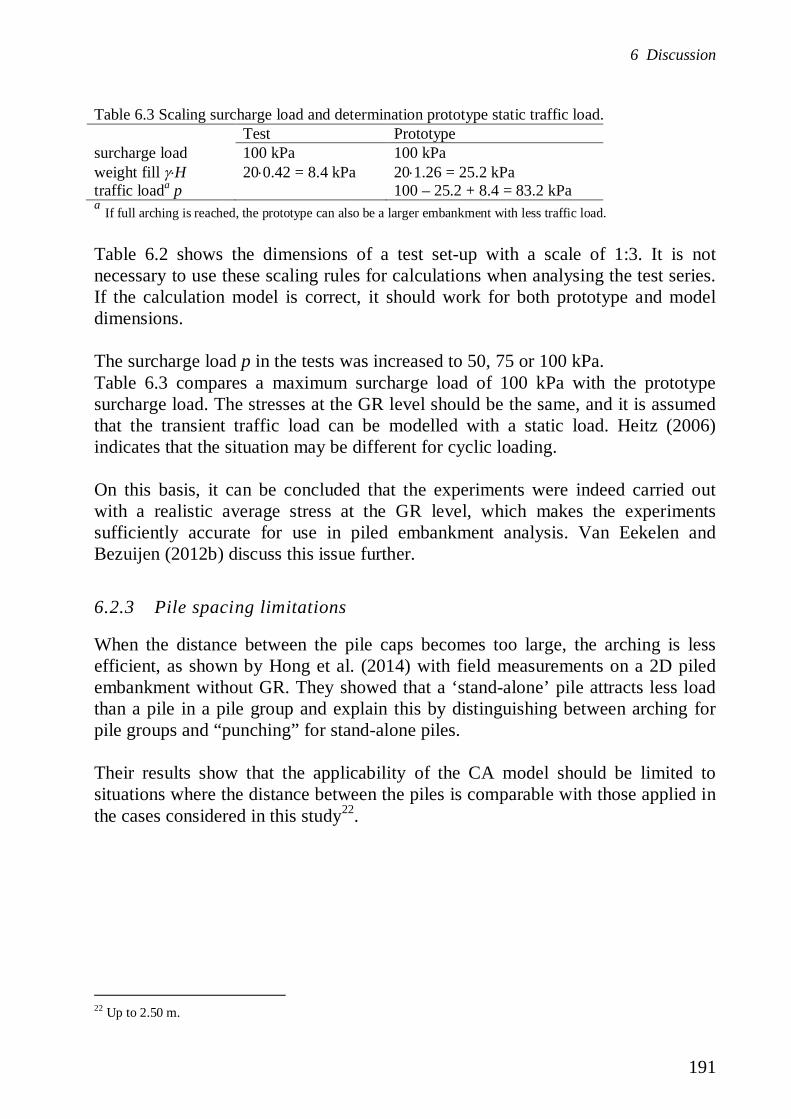
6 Discussion
191
Table 6.3 Scaling surcharge load and determination prototype static traffic load.Test Prototype
surcharge load 100 kPa 100 kPaweight fill H 20 0.42 = 8.4 kPa 20 1.26 = 25.2 kPatraffic loada p 100 – 25.2 + 8.4 = 83.2 kPaa If full arching is reached, the prototype can also be a larger embankment with less traffic load.
Table 6.2 shows the dimensions of a test set-up with a scale of 1:3. It is notnecessary to use these scaling rules for calculations when analysing the test series.If the calculation model is correct, it should work for both prototype and modeldimensions.
The surcharge load p in the tests was increased to 50, 75 or 100 kPa.Table 6.3 compares a maximum surcharge load of 100 kPa with the prototypesurcharge load. The stresses at the GR level should be the same, and it is assumedthat the transient traffic load can be modelled with a static load. Heitz (2006)indicates that the situation may be different for cyclic loading.
On this basis, it can be concluded that the experiments were indeed carried outwith a realistic average stress at the GR level, which makes the experimentssufficiently accurate for use in piled embankment analysis. Van Eekelen andBezuijen (2012b) discuss this issue further.
6.2.3 Pile spacing limitations
When the distance between the pile caps becomes too large, the arching is lessefficient, as shown by Hong et al. (2014) with field measurements on a 2D piledembankment without GR. They showed that a ‘stand-alone’ pile attracts less loadthan a pile in a pile group and explain this by distinguishing between arching forpile groups and “punching” for stand-alone piles.
Their results show that the applicability of the CA model should be limited tosituations where the distance between the piles is comparable with those applied inthe cases considered in this study22.
22 Up to 2.50 m.

Basal Reinforced Piled Embankments
192
6.3 How can the load distribution be explained and how can it bedescribed with an analytical arching model?
6.3.1 Arching in a basal reinforced piled embankment
This chapter explains the observed inverse-triangular load distribution on the GRstrips and the concentration of load on the GR strips. Furthermore, it describes howthe CA model follows this explanation.
Arching occurs around an area that settles more than the adjacent area. The load onthe area that settles most decreases and the load on the adjacent area, which settlesless, increases at the same time. The principal stress directions around the area thatsettles most follow approximately circular or elliptical shapes as shown in Figure6.3 and Figure 6.4.
a b
GR usually deforms in smooth curves, with the maximum deflection in the centrebetween piles. Each GR part that settles more than its neighbour receives less loadthan its neighbour. The CA model describes this behaviour with a set of concentricarches. The larger the arch around a settling area, the more load it exerts on itssubsurface. The arches give the directions of the principal stresses. 3D numericalanalyses confirm the idea of principal stresses that follow concentric arches andexert an increasing load on the GR with increasing arch size (Figure 6.3).Chapter 4.4.2 describes how the concentric arches develop as a result of ongoingGR deflection.
b
Figure 6.3 Comparison of principal stress directions above a GR strip between adjacent piles (a)Concentric Arches model and (b) 3D numerical analysis. Source of figure (a): Van Eekelen et al.(2013) and Figure 4.9. Source of figure (b): Van der Peet and Van Eekelen (2014).

6 Discussion
193
The load exerted on the GR between the piles concentrates on the GR strips. Thiscan be explained by imagining hemispherical stress paths between each group offour piles. The loads are transported along these hemispheres outwards, towardsthe stiffer piles, the stiffer GR strips and the stiffer intersection planes between thehemispheres of adjacent pile units. Above the GR strips the hemispheres intersect,and the loads are forced to follow a new path, along 2D arches, towards the piles.These 2D arches are loaded relatively heavily and exert part of their load on theirground surface: the GR strips.
This mechanism of transport of load along hemispheres and 2D arches in thehemisphere intersection plane is modelled with the CA model, which combines3D hemispheres and 2D arches. The CA model is explained and shown in Figure4.10 and Figure 4.11. Its combination of 2D and 3D concentric Arches results in aload distribution comparable to the one described in the previous chapter, as shownin Figure 4.19.
The Concentric Arches model is an improvement on the existing arching modelslisted in Chapter 4.1, because none of these existing analytical models describe theload and strain localisation on and in the GR strips. Furthermore, the CA modelprovides us with an explanation for the approximately inverse triangular loaddistribution on the GR strips. And, finally, the existing arching models tend tounder-predict measured values of arching A in many cases, while the ConcentricArching model matches these measurements well. This has been shown inChapters 4.3 and 5.5.
6.3.2 Partial arching
Partial arching occurs when an embankment is thin by comparison with the pilespacing, see Figure A.5 in the appendix. In that case, the arching cannot developfully and a relatively large part of the surcharge load will be transferred to the GRand its subsoil directly.
If the embankment is very thin by comparison with the pile spacing, it is expectedthat the pile is ‘not felt’ in the centre between the four piles. This would result in apressure on the GR at that location that approaches the undisturbed pressure H+p.The piles themselves attract a load higher than H+p. This means that the pressuremust decrease somewhere between the centre point between the four piles and thepiles. This theory is not confirmed by the 3D numerical analysis of Van der Peet(2014) as shown in Figure 6.4; she found that the pressure close to the piles and(not shown in Figure 6.4) close to the GR strips is larger than the pressure in thecentre point between the four piles.
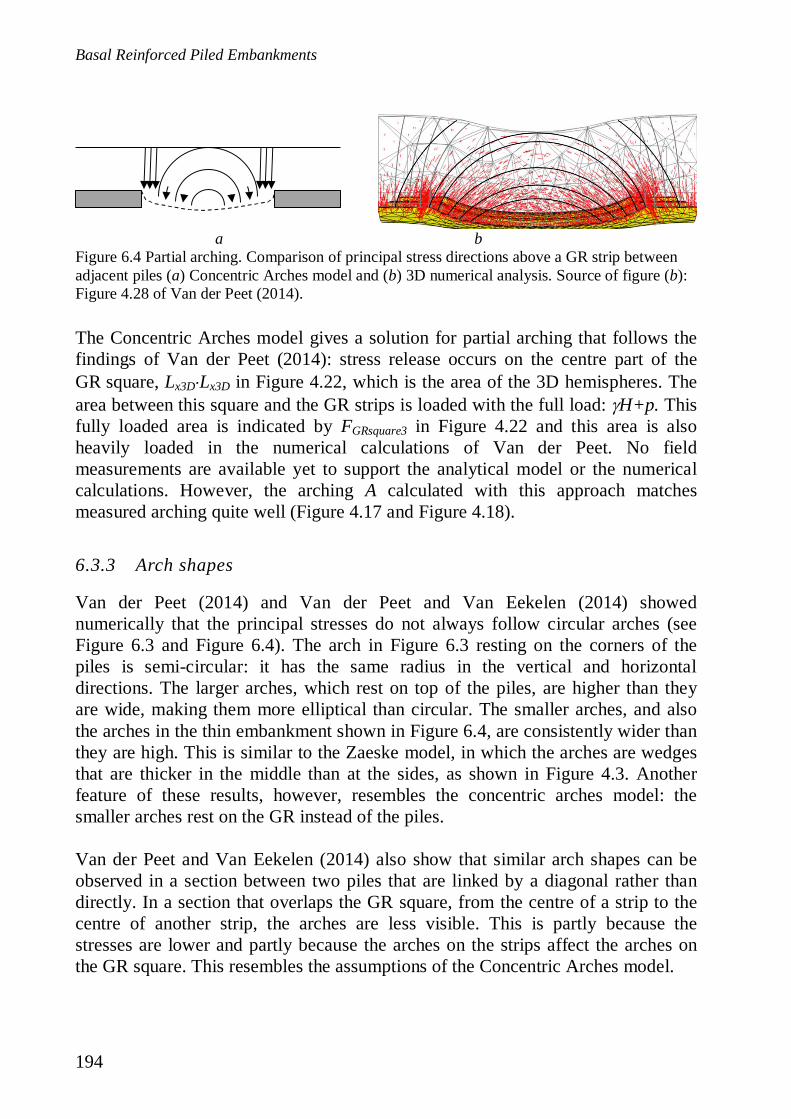
Basal Reinforced Piled Embankments
194
a bFigure 6.4 Partial arching. Comparison of principal stress directions above a GR strip betweenadjacent piles (a) Concentric Arches model and (b) 3D numerical analysis. Source of figure (b):Figure 4.28 of Van der Peet (2014).
The Concentric Arches model gives a solution for partial arching that follows thefindings of Van der Peet (2014): stress release occurs on the centre part of theGR square, Lx3D Lx3D in Figure 4.22, which is the area of the 3D hemispheres. Thearea between this square and the GR strips is loaded with the full load: H+p. Thisfully loaded area is indicated by FGRsquare3 in Figure 4.22 and this area is alsoheavily loaded in the numerical calculations of Van der Peet. No fieldmeasurements are available yet to support the analytical model or the numericalcalculations. However, the arching A calculated with this approach matchesmeasured arching quite well (Figure 4.17 and Figure 4.18).
6.3.3 Arch shapes
Van der Peet (2014) and Van der Peet and Van Eekelen (2014) showednumerically that the principal stresses do not always follow circular arches (seeFigure 6.3 and Figure 6.4). The arch in Figure 6.3 resting on the corners of thepiles is semi-circular: it has the same radius in the vertical and horizontaldirections. The larger arches, which rest on top of the piles, are higher than theyare wide, making them more elliptical than circular. The smaller arches, and alsothe arches in the thin embankment shown in Figure 6.4, are consistently wider thanthey are high. This is similar to the Zaeske model, in which the arches are wedgesthat are thicker in the middle than at the sides, as shown in Figure 4.3. Anotherfeature of these results, however, resembles the concentric arches model: thesmaller arches rest on the GR instead of the piles.
Van der Peet and Van Eekelen (2014) also show that similar arch shapes can beobserved in a section between two piles that are linked by a diagonal rather thandirectly. In a section that overlaps the GR square, from the centre of a strip to thecentre of another strip, the arches are less visible. This is partly because thestresses are lower and partly because the arches on the strips affect the arches onthe GR square. This resembles the assumptions of the Concentric Arches model.
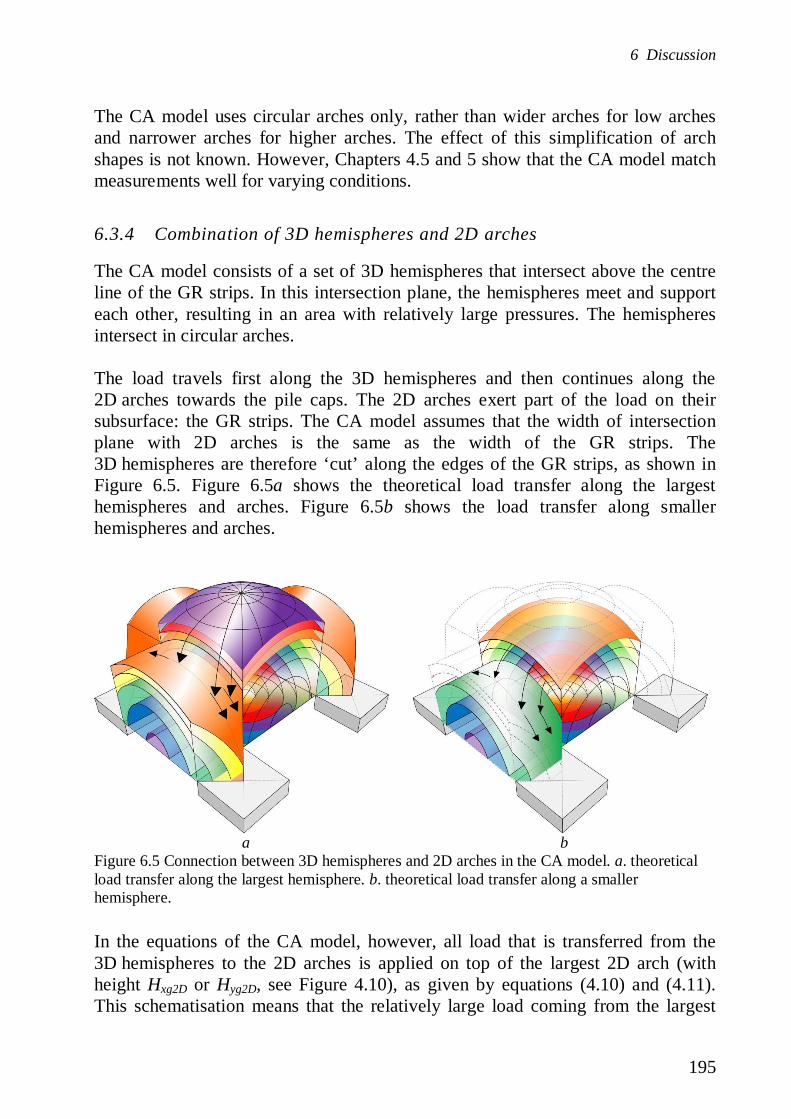
6 Discussion
195
The CA model uses circular arches only, rather than wider arches for low archesand narrower arches for higher arches. The effect of this simplification of archshapes is not known. However, Chapters 4.5 and 5 show that the CA model matchmeasurements well for varying conditions.
6.3.4 Combination of 3D hemispheres and 2D arches
The CA model consists of a set of 3D hemispheres that intersect above the centreline of the GR strips. In this intersection plane, the hemispheres meet and supporteach other, resulting in an area with relatively large pressures. The hemispheresintersect in circular arches.
The load travels first along the 3D hemispheres and then continues along the2D arches towards the pile caps. The 2D arches exert part of the load on theirsubsurface: the GR strips. The CA model assumes that the width of intersectionplane with 2D arches is the same as the width of the GR strips. The3D hemispheres are therefore ‘cut’ along the edges of the GR strips, as shown inFigure 6.5. Figure 6.5a shows the theoretical load transfer along the largesthemispheres and arches. Figure 6.5b shows the load transfer along smallerhemispheres and arches.
a bFigure 6.5 Connection between 3D hemispheres and 2D arches in the CA model. a. theoreticalload transfer along the largest hemisphere. b. theoretical load transfer along a smallerhemisphere.
In the equations of the CA model, however, all load that is transferred from the3D hemispheres to the 2D arches is applied on top of the largest 2D arch (withheight Hxg2D or Hyg2D, see Figure 4.10), as given by equations (4.10) and (4.11).This schematisation means that the relatively large load coming from the largest
Basal Reinforced Piled Embankments
196
hemispheres is applied uniformly and relatively low down on the largest 2D arch.This leads to a larger load on the GR strip than suggested by reality. The part of theload that travels along the smaller hemispheres towards the 2D arches is alsoapplied on top of the same, largest, 2D arch, which is higher than indicated byFigure 6.5b. This results in a smaller impact on the GR strip than suggested byreality. The exact consequence of transferring the load to the top of the 2D archesis not known, but it is expected that the effect will be limited. This is confirmed bythe comparisons of the model results with measurements in Chapter 5.
6.4 Which design method fits best with observations and measurements ofarching A and GR strains in field monitoring projects andexperiments?
6.4.1 Combining the CA model and the inverse triangular and uniformlydistributed load distribution
This thesis proposes analytical models for basal reinforced piled embankments.The conclusions and the newly developed analytical model are based onexperiments and field tests with fills that are mainly dry. Wet fills, horizontal loadslike spreading forces and horizontal traffic loads and cyclic loads are outside thescope of this thesis.
Three model elements have been changed or extended with respect to the designmethod in EBGEO (2010) and CUR (2010): the arching model for calculation step1, the load on the GR strips, and subsoil support for the GR in calculation step 2.This chapter discusses these three elements.
Firstly, Chapter 4 considered several families of arching models and narroweddown the study to equilibrium models for several reasons, such as the need fordependency on soil properties and because a radical departure from existingEuropean design models was felt to be undesirable. The CA model is therefore amodification and extension of the equilibrium models of Zaeske (2001) andHewlett and Randolph (1988).
Chapter 5.5 shows that the CA model gives GR strains that match measurements inseven field tests and four experiment series better than any of the other equilibriummodels. This conclusion holds for any load distribution. Van der Peet (2014) andVan der Peet and Van Eekelen (2014) also show that the Concentric Arches modelgives the best match with their results of 3D numerical analyses. Furthermore, themodel gives an explanation for the observed load distribution, including theconcentration of the load on the GR strips between adjacent piles.
6 Discussion
197
Secondly, two issues are important with respect to load on the GR strips: thedistribution of the total B+C between the GR strips in the longitudinal andtransverse directions, further discussed in Chapter 6.4.2, and the distribution of theload on each strip. In Chapter 2.4.3, it was concluded that the net load distributionon the GR strips is approximately inverse triangular. However, this is anapproximation of the real load distribution, which is probably non-zero in thecentre, resembling a parabola more than an inverse triangle. Chapter 6.4.3compares alternative load distributions of this kind with the triangular, uniform andinverse triangular load distributions and concludes that the difference betweenthese parabolic load distributions and the inverse triangular load distribution isnegligible.
In Chapter 5.5, it was concluded that, when there is no subsoil support, the inversetriangular load distribution gives the best prediction of the GR strain. When subsoilsupport is considerable, the load on the GR strip is approximately uniformlydistributed. This uniform load is combined with the counter-pressure that isdirected upwards. This combination results in a net load distribution that matchesan inverse triangular load distribution more than a uniform or triangular loaddistribution, as shown in Figure 5.19. For the inverse triangular and uniform loaddistributions, as well as parabolic load distributions, the resulting GR strain isconsiderably less than assumed previously with the triangular load distributionadopted in the German and Dutch guidelines (EBGEO, 2010 and CUR226, 2010),as shown in Chapters 3.4.4 and 6.4.3.
Thirdly, the original model of Zaeske considers only the subsoil supportunderneath the GR strips. This is considered to be unrealistic since there is noreason why only part of the subsoil should contribute to the support (Lodder et al.,2012, Chapter 3.4.1; Filz et al., 2012). Subsoil support was therefore extended to‘all subsoil’ between the pile caps.
6.4.2 Nonsquare rectangular pile arrangements
Once the load on the area between the piles has been calculated, this load has to bedivided between the GR strips in the x- and y-directions: the x-strip and y-strip inFigure 6.6. The approach adopted in the Zaeske model in EBGEO and CUR226(2010) is different from the approach in the CA model in CUR226 (2015) adoptedin CUR226 (2015). If sx = sy, there is no difference between the two methods. Ifsx sy, however, the two methods give different results.
The two methods are as follows. In the case of the CA model proposed in thisthesis, the load B+C in kN/pile on the GR is calculated with equation (4.16).

Basal Reinforced Piled Embankments
198
The CA model works with the average load on the GR strips, which is calculatedwith equation (5.9):
avx GRstrip y GRstrip
B CqA A (6.1)
where Ax-strip and Ay-strip are the areas of the x-GRstrip and y-GRstrip respectively.This gives the force Fx,CA and Fy,CA for the CA model on respectively the x-GRstrips and the y-GR strips:
, ,av x ers av y ersx CA y CAF q L B F q L B (6.2)
where Lx, Ly and Bers (m) are indicated in Figure 6.6.
Figure 6.6 Distribution of load between x- and y-GR strips, = 18.3 kN/m3, = 51o, p = 0 kPa,H = 2.6 m. The value of the total load on the strips (B+C) is calculated with the CA model. B+Cis distributed over the GR strips according to respectively the CA model and the Zaeske model.
In the case of the Zaeske (2001) model, the average pressure v;r on the GR areabetween the piles (ALy + ALx) is calculated with equation (3.2). Zaeske uses thediamond areas indicated in Figure 6.6 to calculate the force Fx,Zaeske and Fy,Zaeske onthe x-GR strips and the y-GR strips:
, ; , ;x Zaeske v r Lx y Zaeske v r LyF A F A (6.3)
Bers Lx = variable
L y=
1.65
m
ALx
ALy
x-GRstrip
y-G
Rstri
p
d = 0.40 m
B ers
=0.
35m
s y=
2.00
m
sx = variable
0
20
40
60
80
100
120
1.2 1.6 2.0 2.4 2.8 3.2
Forc
eF
onx-
GR
strip
and
y-G
Rstr
ip(k
N)
centre-to-centre distance sx (m)
Fx,CAFy,CAFx,ZaeskeFy,Zaeskesx=syB+C (CA model)
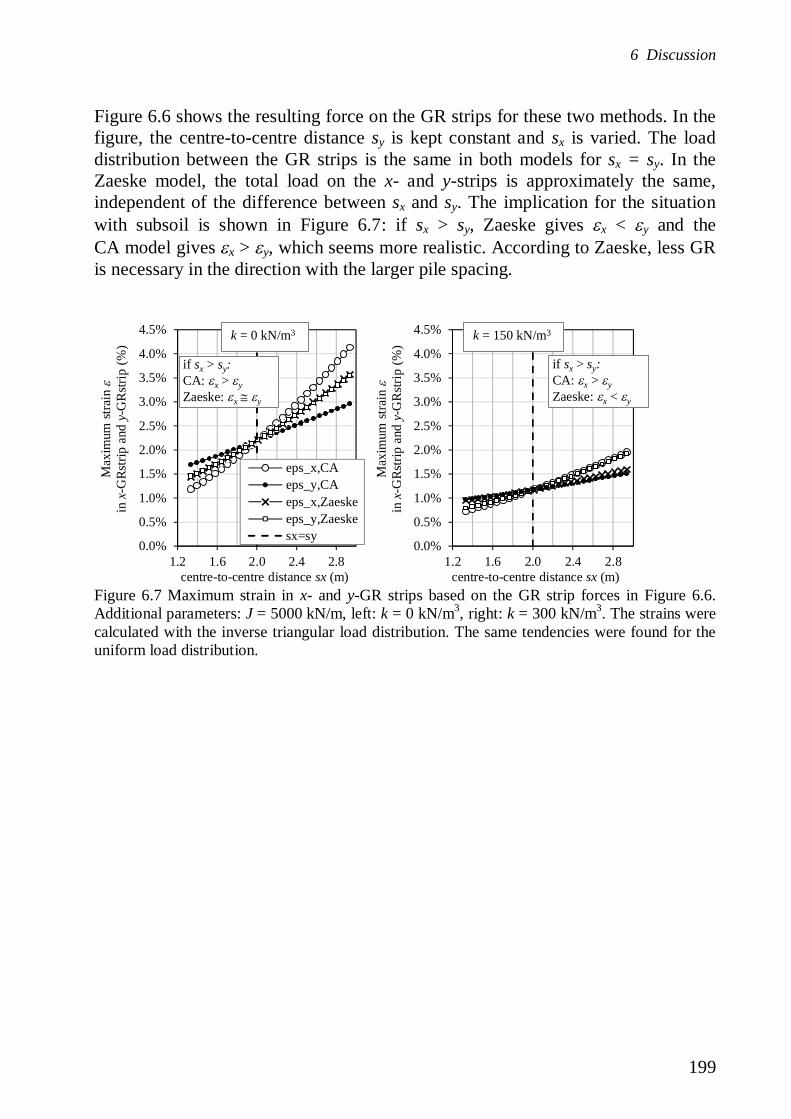
6 Discussion
199
Figure 6.6 shows the resulting force on the GR strips for these two methods. In thefigure, the centre-to-centre distance sy is kept constant and sx is varied. The loaddistribution between the GR strips is the same in both models for sx = sy. In theZaeske model, the total load on the x- and y-strips is approximately the same,independent of the difference between sx and sy. The implication for the situationwith subsoil is shown in Figure 6.7: if sx > sy, Zaeske gives x < y and theCA model gives x > y, which seems more realistic. According to Zaeske, less GRis necessary in the direction with the larger pile spacing.
Figure 6.7 Maximum strain in x- and y-GR strips based on the GR strip forces in Figure 6.6.Additional parameters: J = 5000 kN/m, left: k = 0 kN/m3, right: k = 300 kN/m3. The strains werecalculated with the inverse triangular load distribution. The same tendencies were found for theuniform load distribution.
0.0%
0.5%
1.0%
1.5%
2.0%
2.5%
3.0%
3.5%
4.0%
4.5%
1.2 1.6 2.0 2.4 2.8
Max
imum
strai
nin
x-G
Rstri
pan
dy-
GR
strip
(%)
centre-to-centre distance sx (m)
eps_x,CAeps_y,CAeps_x,Zaeskeeps_y,Zaeskesx=sy
if sx > sy:CA: x > yZaeske: x y
k = 0 kN/m3
0.0%
0.5%
1.0%
1.5%
2.0%
2.5%
3.0%
3.5%
4.0%
4.5%
1.2 1.6 2.0 2.4 2.8
Max
imum
strai
nin
x-G
Rstri
pan
dy-
GR
strip
(%)
centre-to-centre distance sx (m)
k = 150 kN/m3
if sx > sy:CA: x > yZaeske: x < y
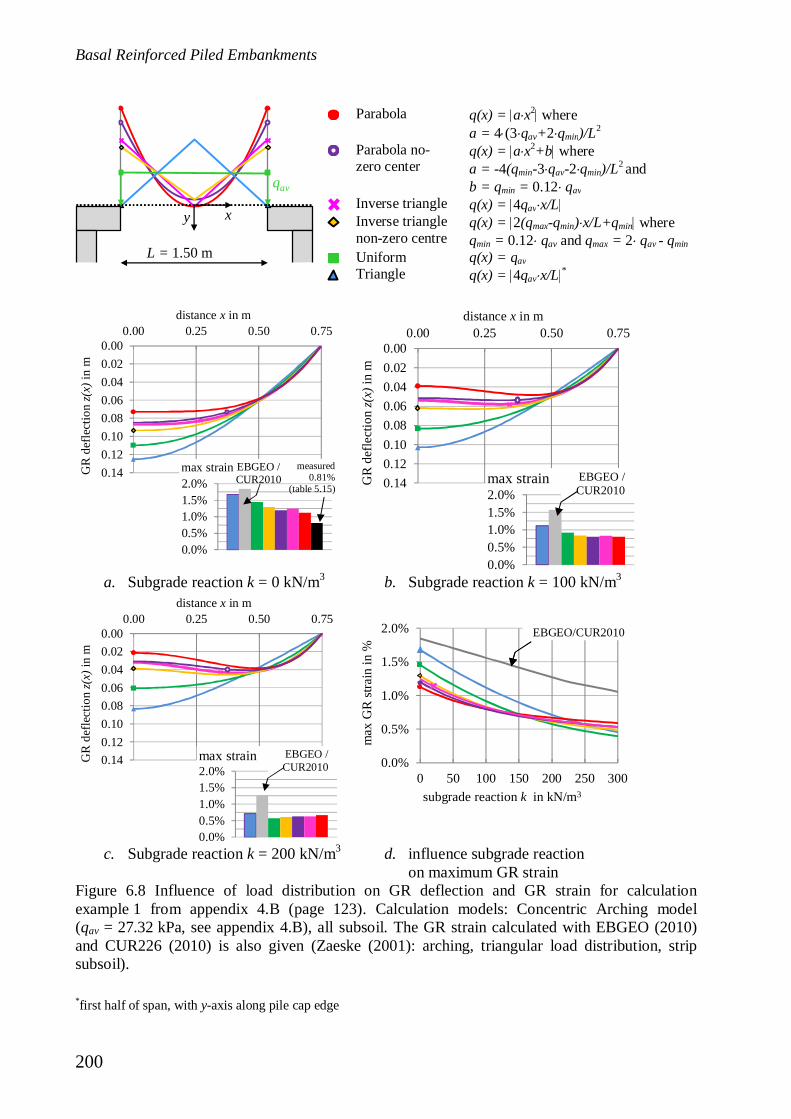
Basal Reinforced Piled Embankments
200
Parabola q(x) = a x2 wherea = 4 (3 qav+2 qmin)/L2
Parabola no-zero center
q(x) = a x2+b wherea = -4(qmin-3 qav-2 qmin)/L2 andb = qmin = 0.12 qav
Inverse triangle q(x) = 4qav x/LInverse trianglenon-zero centre
q(x) = 2(qmax-qmin) x/L+qmin whereqmin = 0.12 qav and qmax = 2 qav - qmin
Uniform q(x) = qavTriangle q(x) = 4qav x/L *
a. Subgrade reaction k = 0 kN/m3 b. Subgrade reaction k = 100 kN/m3
c. Subgrade reaction k = 200 kN/m3 d. influence subgrade reactionon maximum GR strain
Figure 6.8 Influence of load distribution on GR deflection and GR strain for calculationexample 1 from appendix 4.B (page 123). Calculation models: Concentric Arching model(qav = 27.32 kPa, see appendix 4.B), all subsoil. The GR strain calculated with EBGEO (2010)and CUR226 (2010) is also given (Zaeske (2001): arching, triangular load distribution, stripsubsoil).
*first half of span, with y-axis along pile cap edge
xy
L = 1.50 m
qav
0.000.020.040.060.080.100.120.14
0.00 0.25 0.50 0.75
GR
defle
ctio
nz(
x)in
m
distance x in m
0.0%0.5%1.0%1.5%2.0%max strain EBGEO /
CUR2010measured
0.81%(table 5.15)
0.000.020.040.060.080.100.120.14
0.00 0.25 0.50 0.75
GR
defle
ctio
nz(
x)in
m
distance x in m
0.0%0.5%1.0%1.5%2.0%max strain EBGEO /
CUR2010
0.000.020.040.060.080.100.120.14
0.00 0.25 0.50 0.75
GR
defle
ctio
nz(
x)in
m
distance x in m
0.0%0.5%1.0%1.5%2.0%max strain EBGEO /
CUR2010 0.0%
0.5%
1.0%
1.5%
2.0%
0 50 100 150 200 250 300
max
GR
strai
nin
%
subgrade reaction k in kN/m3
EBGEO/CUR2010EBGEO/CUR2010
6 Discussion
201
6.4.3 Alternative load distributions on the GR strips
Figure 6.8 compares the influence of several load distribution schematisations onthe GR deflection and the maximum GR strain. This thesis proposes using theinverse triangular load distribution for the situation without subsoil support. This isa schematisation that represents reality: in reality, the load distribution will bemore like the purple curves in Figure 6.8: a cup-parabola with a value larger thanzero in the centre.
Alternatively, the load distribution may approach the inverse triangular loaddistribution, but without a zero midpoint. Figure 6.8 shows that all these three loaddistributions (in yellow, pink and purple) give nearly the same GR deflection andmaximum GR strain. It can therefore be concluded that the relatively simpleinverse triangular load distribution is adequate.
Figure 6.8b and c, with a subgrade reaction k = 100 and 200 kN/m3, show that thecalculations with the inverse triangular or parabolic load distributions give mostGR deflection close to the piles. The resulting shape of the deformed GR leads to arelatively high GR strain, as was also explained in Chapter 5.4.5 of this thesis. Thisis caused by the large counter-pressure in the centre of the GR strip, while thedownward load midway between the piles is zero. This mechanism may occur inpractice to a small extent, as shown by the measurements in Figure 5.18. However,stiffer subsoil leads to a more uniform load distribution (green in Figure 6.8).
The pragmatic approach proposed in this thesis and adopted in the CUR226 (2015)guideline uses the Concentric Arches model in combination with all subsoilsupport and the load distribution that gives the lowest GR strain. In this way, theinverse triangular distribution is applicable to the cases without, or with limited,subsoil support; a uniformly distributed load is applicable to the cases withsubstantial subsoil support.
6.4.4 Safety analysis
Chapter 5.5 showed that the new model, with the CA model and the combinationof inverse triangular and uniform load distribution, calculates GR strains that areon average 1.06 times the measured values, while the Zaeske (2001) model used inCUR226 (2010) calculates GR strains that are on average 2.46 times the measuredvalues. The standard deviation was also smaller with the new model, even though aconsiderable standard deviation remained.
One can debate whether a design guideline should adopt a model that nearlyalways gives a design on the safe side, as with the Zaeske model, or whether a
Basal Reinforced Piled Embankments
202
design guideline should adopt a model that describes reality as well as possible andconsider safety separately. The Dutch CUR226 committee decided to adopt thenew model presented in this thesis and to combine this with the inclusion of amodel factor to cope with the uncertainty in the model. The value of the modelfactor was determined using the data points resulting from the comparison betweenmeasurements and calculations presented in Chapter 5.
Van Duijnen et al. (2015) reported on the safety analysis used to determine themodel factor and the associated load and material factors. Following thesuggestions made in EC 1990 (2011, Eurocode 0), they conducted a statisticalassessment of the differences between the measured and calculated GR strains andthen carried out Monte Carlo (MC) simulations for several reference cases in orderto obtain the model factor. Multiplying this model factor by the GR straincalculated with characteristic values gives a value that is higher than the realGR strain in 95% of the cases. In other words, if the model factor is used, reality isworse than the calculation in 5% of the cases.
Subsequently, Van Duijnen et al. (2015) determined three sets of partial materialand load factors associated with the model factor for a level 1 design approach(the method with partial factors). They showed that using these factor sets satisfythe reliability indices required for the three reliability classes of EC 1990 (2011,Eurocode 0). The resulting model and partial factors were adopted inCUR226 (2015).
7 Conclusions
7.1 Introduction
This thesis about basal reinforced piled embankments analysed the mechanismsthat determine the GR strain resulting from the dead weight of the embankmentand traffic weight. The study improved our understanding of the load distributionin a basal reinforced piled embankment, and a new design model for thegeosynthetic reinforcement was developed and validated.
Nineteen 3D scaled model experiments and three field monitoring projects werecarried out. The measured vertical deformations in a number of these scaled modelexperiments guided the development of ideas underlying the newly developedanalytical design model. The field tests added full-scale observations andmeasurements. The models were validated using the measurements of loaddistribution and GR strain from these field studies and three tests in the model testseries, and from five field studies and three model test series and some numericalresults from the literature. Furthermore, two Master’s students conducting researchas part of this doctorate study validated the newly developed analytical modelusing 3D numerical analysis with Plaxis 3D Tunnel and Plaxis 3D.
7.2 GR design in two steps
Several countries have issued design guidelines for basal reinforced piledembankments, and researchers are still working on improvements to analyticaldesign methods. Analytical models for the GR design in piled embankmentscalculate the GR strain. When multiplied by the GR stiffness this gives the tensileforce (kN/m), which determines the required GR strength. The calculation of theGR strain includes two calculation steps, as shown in Figure 1.3.
Calculation step 1 divides the total vertical load into two parts: load part A(kN/pile) and the ‘residual load’ (B+C in Figure 1.3a, in kN/pile). Load part A,which is also referred to as ‘arching A’ in this thesis, is the part of the load that istransferred to the piles directly. This load part is relatively large due to arching,which is the mechanism in which load is inclined to be attracted towards stifferelements, in this case the pile caps. The thesis also considers the ratioA% = A/(A+B+C).

Basal Reinforced Piled Embankments
204
Calculation step 2 then calculates the GR strain in the GR strip between each pairof adjacent piles by loading the GR strip with the residual load B+C and, ifpossible, supporting the GR strip by the subsoil.
The purpose of the second calculation step is to calculate the GR strain but it alsoresults in a further division of the vertical load: load part B (kN/pile), which passesthrough the GR to the piles, and load part C (kN/pile), which is the subsoil support,as indicated in Figure 1.3a.
7.3 Measuring technique in piled embankments
Arching A needs to be measured to validate calculation steps 1 and 2 separately.The fact that this was done in this research represented a major step forward. Botharching A and load part B were measured separately in all three field monitoringprojects and in the experiments. This was done with total pressure cells - with thesame diameter as the circular pile caps - that measured the pressure on the pile capsabove the GR (A) and underneath the GR (A+B). In the experiments, load part Cwas also measured separately. The combination with GR-strain measurementsmade the full analysis of the two calculation steps possible.
Several problems frequently occur when measuring GR strains. Traditional straingauges cannot be glued to the fabric of most GR types. In other cases, the failurestrain of the strain gauges may be smaller than the failure strain of the GR and thestrain gauge may then fail too soon. However, this latter problem was not observedin piled embankments in this study. Finally, it is possible that the strain gaugesmay affect GR stiffness behaviour.
In the Woerden test, good results were obtained by applying optic fibres. Theyresponded very clearly to truck passages, as shown by Van Eekelen et al. (2012c,2015b and d). In the model experiments, promising results were obtained with aspecially developed measurement system using bicycle gear cables (Chapter 2,Van Eekelen et al., 2012a). A larger version of this system was tried out in thisfield test alongside the optic fibres (Van Eekelen et al., 2012c). The system is verysimple and it is still in the trial phase, but the results are promising.
The positions of the settlement tubes were measured repeatedly with a liquidlevelling system. These measurements were usually taken at intervals of 0.50 m. Itwould be better to reduce this distance, for example to 0.10 m. Doing so makes itpossible to study the shape of the deformed GR and therefore the load distributionon the GR, as discussed in Chapter 4.2.
Conclusions
205
7.4 Observations in experiments, field tests and numerical analysis
7.4.1 Arching
The measured arching A, and load part B and its corresponding GR strain and GRvertical deflection, follow a smoothly ascending curve when plotted against the netload. This was concluded from the model experiments and confirmed with thefinite element calculations of Den Boogert et al. (2012a,b) and Van der Peet andVan Eekelen (2014).
Consolidation of the subsoil is necessary for the development of arching. It causesmore GR deflection and it increases the net load, which in turn results in anincrease in arching (load part A and A%) and an increased load through the GR(load part B) respectively.
To allow GR deflection to occur, the reinforcement should not be too stiff. This isgenerally not a problem with geosynthetic reinforcement. Furthermore, it isnecessary to force sufficient GR deflection before the road is asphalted or therailway built. In practice, the development of arching and GR deflection isencouraged by sending construction cranes and trucks over the embankment underconstruction. Measurements show that this results in the development of archingover a period of approximately 1 to 3 months, as shown in Figure 5.16. After thatpoint in time, GR deflection more or less stops.
The dependency of arching A or A% on several factors is discussed further inChapter 7.4.3.
7.4.2 Load and strain distribution
A major part of the load is attracted to the piles directly. This load part is archingA. The residual part of the load is (B+C).
There is a major difference between piled embankments with or without GR. If noGR is applied, (B+C) between the piles is distributed more or less evenly on thesubsoil. With GR, a major part of (B+C) is concentrated on the GR strips betweenadjacent piles. Van der Peet and Van Eekelen (2014) showed this concentration ofload on the GR strips with numerical calculations. Zaeske’s experiments (2001, seeFigure 4.6 of this thesis) showed the difference between piled embankments withor without GR. Using GR makes arching much more efficient. The differencebetween piled embankments with or without GR requires a distinction betweenmodels describing each situation.

Basal Reinforced Piled Embankments
206
All experiments reported in Chapters 2 and 4 show that the GR strains occurmainly in the GR strips on top of and between adjacent piles (Figure 2.7 andFigure 2.8). In the laboratory tests, the largest GR strains were actually found ontop of the piles. These tests used smooth, small-scale piles. This is different fromthe situation in practice, where large concrete caps are generally used. The size ofthese pile caps and the friction between the GR and the pile cap causes the GR tobe clamped in place, so that GR strains above the centre of the pile cap are muchsmaller. It is therefore assumed that the GR strain prediction will be sufficientlyaccurate if it is assumed that GR strain occurs only in the GR strips betweenadjacent piles. This concurs with the assumptions of the calculation models inBS8006 (2010), EBGEO (2010) and CUR226 (2010, 2015) and is confirmed bynumerical calculations (Den Boogert, 2011).
The smallest load on the GR strips occurs in the centre of the strip midwaybetween the piles and the largest load close to the pile cap edges. The loaddistribution on the GR strips is therefore approximately inverse triangular. Thiswas concluded from the measured shape of the deformed GR strips in theexperiments (Chapter 2.4.3) and in the field (Chapter 5.4.3), the measured loaddistribution in the experiments (Chapter 4.3.4) and from the load distribution or theGR strip shape in numerical calculations (Den Boogert et al., 2011; Han et al.,2012; Van der Peet and Van Eekelen, 2014).
7.4.3 Factors of influence
It was possible to analyse several determinant factors using the results of theexperiment series reported in Chapters 2 and 4.2. Most conclusions wereconfirmed by numerical calculations.
Chapter 7.4.1 described the considerable influence that consolidation has onarching.
Arching A% increases with embankment height H and seems to stabilise in higherembankments (Chapter 4.5.3). This was confirmed numerically by, for example,Le Hello and Villard (2009) and Van der Peet and Van Eekelen (2014).
A higher fill friction angle gives more arching, especially during consolidation.This results in load part B on the GR being some 39% larger for sand than forgranular fill at the end of tests T2 (sand fill, = 40.9o) and T3 (granular fill,
= 49.0o). The influence of the fill friction angle on the arching was also shownnumerically by, for example, Van der Peet (2014), Van der Peet and Van Eekelen(2014) and Le Hello and Villard (2009).

Conclusions
207
The GR stiffness J does not affect the measured arching A, as long as the stiffnesscomplies with a good-quality design model (nevertheless, the exact limiting valuesof the GR stiffness between which this conclusion is true have not beeninvestigated). However, the GR stiffness is related to the measured GR deflectionand therefore the GR strain, as shown in Chapter 2.5.4. Van der Peet and VanEekelen (2014) also found no influence of the GR stiffness J on arching.
An increase in surcharge load p or net load leads to both an increase in arching Aand load part B because the total load increases, as shown in Figure 2.5 and Figure2.11. If subsoil is available to bear the load, the percentage of the load goingdirectly to the piles, A%, decreases with increasing surcharge load p.Values for A% measured at the end of each consolidation phase are more or lessconstant after the initial phase. This shows that the arching stabilises quickly in thesituation with little or no subsoil support: it already has developed fully for arelatively small net load.
The difference in performance between a geotextile and a geogrid, given the samemechanical characteristics, was negligible in the model experiments that weconducted. The difference between, for example, applying a sand or granular fillwas much larger.
If two GR layers are considered, one consisting of a single biaxial grid layer andthe other one consisting of two uniaxial layers installed directly on top of oneanother, the same load distribution and deformations are measured as shown inChapter 2.5.3. The stiffness of one biaxial GR layer is therefore equal to the totalstiffness of the two uniaxial layers installed directly on top of one another. In otherwords, 1 + 1 = 2.
Systems with two GR layers with or without a fill layer between them also behavesimilarly. In both systems, arching depends linearly on the net load on the fill.However, the dependence is slightly stronger in systems with a fill layer. Thismeans that, in the system with a fill layer between the GR layers, arching isslightly less in the first phase of the tests and slightly more in the last phase of thetests than in the system without that fill layer. The deformation pattern is similar inall cases (both with and without a fill layer between the GR layers), at least for thegeometry considered in the experiments presented in Chapter 2. For designpurposes it is sufficient to consider the systems with and without a fill layerbetween the GR layers as the same. In other words, once again, 1 + 1 = 2. This wasdemonstrated and explained in Chapter 2.5.5, and in Van Eekelen and Bezuijen(2014).
Basal Reinforced Piled Embankments
208
7.5 New analytical model for calculating the maximum GR strain
This thesis presents a new model that is a modification and extension of theexisting models of Zaeske (2001) and Hewlett and Randolph (1988). The modelconsists of two steps: step 1, arching, and step 2, load-deflection behaviour. Thesetwo steps are explained here.
7.5.1 Calculation step 1: analytical model for arching
This thesis presents a new equilibrium model: the Concentric Arches (CA) model.It is a variation on the Hewlett and Randolph (1988) and EBGEO (Zaeske, 2001)equilibrium models. Other model types were excluded from this study becausethey do not include material behaviour or because a radical departure from existingEuropean design models was felt to be undesirable. The model consists ofconcentric hemispheres and arches that develop as a result of ongoingGR deflection. Larger hemispheres or arches exert more pressure on theirsubsurface.
The CA model consists of concentric 3D hemispheres and 2D arches. The load istransported along the 3D hemispheres outwards, towards the stiffer piles, the stifferGR strips and the stiffer intersection planes between the hemispheres of adjacentpile units. Above the GR strips, the hemispheres intersect, and the load turns andfollows the 2D arches towards the piles. A set of analytical equations wasestablished that describes the combination of 3D hemispheres and 2D arches.
The vertical effective stress in the fill between the piles decreases with depth. Thispattern was measured by Zaeske (2001) and the CA model finds a comparabletendency. The hemispheres and 2D arches exert part of their load on their groundsurface. As the 2D arches are loaded relatively heavily they exert a relatively largepart of the load on their ground surface: the GR strips.
The Concentric Arches model describes both full and partial arching, the latter forembankments thinner than the height of full hemispheres. In that case, the stress inthe centre between four piles is reduced by arching and the area close to the GRstrips is loaded fully with H+p. This rather pragmatic solution concurs with thestress release in the centre between four piles found numerically by Van der Peet(2014). The partial arching model of the CA model is different from the earlierequilibrium models considered: Hewlett and Randolph (1988) did not provide areal solution for partial arching, while Zaeske (2001) removes the upper part of hismodel, leaving only the lower scales of his model. The CA partial arching modelmatches the measurements in the experiments and numerical calculations muchbetter than the other equilibrium models considered, as shown in Chapter 4.5.3,

Conclusions
209
where the calculation results were compared with measurements in experimentsand numerical results of Le Hello and Villard (2009) and Van der Peet andVan Eekelen (2014).
The CA model results in a load distribution on the GR that resembles the loaddistribution observed in experiments, field measurements and numerical analysis; aload concentration on the piles and the GR strips with an approximately inversetriangular load distribution on the GR strips. The CA model therefore provides aphysical explanation for the observed load distribution. The concentric stressarches have also been found by several authors presenting numerical studies onarching such as Vermeer et al. (2001), Nadukuru and Michalowski (2012), Han etal. (2012) and Van der Peet and Van Eekelen (2014).
The Concentric Arches model explains how arching increases with subsoilconsolidation (GR deflection): new arches are formed in succession asGR deflection progresses.
However, in the limit-state version of the model presented in this paper, the modelbehaves in a rigid-plastic way and no longer describes the influence of subsoilconsolidation or deformation but describes fully developed arching. The influenceof deformation cannot be incorporated in rigid-plastic models such as theequilibrium models or frictional models. A new class of models would be neededto account for this. However, establishing those models would conflict with theinitial thinking that a radical departure from existing design models wasundesirable, and this area is outside the scope of this thesis.
Using numerical techniques would make it possible to make calculations thatinclude subsoil consolidation. However, as indicated in the introduction (Chapter1.2), these methods are generally not permissible in GR design since the methodstend to underpredict GR strain, as shown by for example Farag (2008). This seemsto be specifically the case for situations with subsoil support as shown by Van derPeet and Van Eekelen (2014). This thesis therefore narrowed its focus to analyticalGR design.
The equations for the Concentric Arches model are given in Chapter 4.4.5.
7.5.2 Calculation step 2: load-deflection behaviour
This thesis proposes modifications to the Zaeske (2001) approach for calculationstep 2. The model still considers only the GR strip between adjacent piles. Thewidth of the strip is equal to the width of the square pile caps or the equivalentwidth of circular pile caps.
Basal Reinforced Piled Embankments
210
The strips are loaded by B+C, as determined in calculation step 1. The distributionof this load is inverse triangular or uniform, depending on which gives the leastGR strain. In this way, the inverse triangular distribution applies in cases with littleor no subsoil support and the uniformly distributed load in the cases withsignificant subsoil support.
In the model presented by Zaeske (2001), only the subsoil underneath the GR stripbetween adjacent piles is taken into account. Measurements in the experimentsshowed that it is better to take all subsoil support into account (Chapter 3.4.4): thisis a theoretical improvement and it is also confirmed by the comparison betweencalculations and measurements described in Chapter 5. The subgrade reaction k istherefore increased to take into account all subsoil underneath the GR instead ofthe subsoil support beneath the strip only.
It has been shown in this thesis that the inverse triangular load distribution is agood approach, even though the load may be more parabola-like and may have anon-zero pressure in the centre of the GR strip, and even though the load may bemore concentrated near the pile caps than the inverse triangle indicates. However,such minor changes in the load distribution do not have a significant effect on theresulting calculated GR strain. The change from a triangular load distribution to auniform or inverse-triangular one is much larger, leading to a GR strain reductionin the range of 40 to 60%.
The proposed calculation model does not take GR strains on the pile caps intoaccount, as in the original models. These GR strains can be the largest GR strainsunder specific conditions, such as for the smooth, small-diameter pile caps in thetest set-up. As this will generally not be the case in the field, it was decided not tomodify the step 2 calculations to take the GR strains on the pile caps into account.
The equations for step 2, including ‘all subsoil’ and the inverse triangular and theuniformly distributed load distribution are given in appendix 5.A. Additionally,appendix B of this thesis gives design graphs that can be used instead of theequations.
7.5.3 Factors of influence
Consolidation of the subsoil results in an increase in arching A. Chapter 7.5.1explained that the rigid-plastic CA model does not describe this.
The Concentric Arches model is dependent on the embankment height H in a waysimilar to that found in experiments and in the numerical calculations of Le Hello
Conclusions
211
and Villard (2009) and Van der Peet and Van Eekelen (2014). For other models,the match is less satisfactory.
For fills with low friction angles, Zaeske’s arching model generally gives lowarching, leading to higher GR strains than measured. At high friction angles,Zaeske’s model gives relatively high arching levels, and therefore lower GR strainsthan measured. Van der Peet (2014) and Van der Peet and Van Eekelen (2014)confirm this tendency of Zaeske’s model by comparing Zaeske’s results with3D numerical analyses. The dependency of the CA model on the fill friction anglegives a much better match with these 3D numerical analyses.
The influence of the GR stiffness J in the step 2 calculations with the new model iscomparable with that in the measurements.
The surcharge load p, like GR stiffness, does not affect the relative amount ofarching in the equilibrium models considered. However, the numerical analysesshow that higher surcharge loads give higher values for A%. One explanation maybe that the surcharge load is added at the top of the embankment, where the load iseasily transferred horizontally to the piles. This would be less obvious if the loadwas added lower down the embankment. Secondly, the surcharge load leads to ahigher confining pressure in the embankment, enhancing the strength of the fill andconsequently the arching.
7.6 Validation of analytical models
The CA model calculates values for arching A that match measurements well, andgenerally better than values calculated with EBGEO/CUR (2010), especially in thecase of relatively thin embankments. This finding is important for designcalculations for the construction phase.
Several analytical models were validated with a lot of field and model tests.Variations on three parts of the analytical models were considered: (1) the archingmodel (2) the load distribution on the GR strip between adjacent piles and (3) thesubsoil support. The models considered were variations on and/or extensions to themodels of Hewlett and Randolph (1988) and Zaeske (2001, also reported inKempfert et al., 2004).
Particular attention was paid to the realistic determination of the soil parametersfor the analytical simulations of the lab and field tests. The values in thesesimulations should be the best-guess values (mean values) rather than thecharacteristic values, as in design practice.

Basal Reinforced Piled Embankments
212
The current combination of analytical models in EBGEO (2010) and CUR226(2010) is Zaeske’s arching model (2001): triangular load distribution and subsoilsupport below the GR strip only. BS8006 gives the option of using thecombination of Hewlett and Randolph and a uniform load distribution as analternative to the modified Marston and Anderson (1913) approach. These twocombinations match the measurements least; they calculate strains that are onaverage 2.46 and 2.89 times the measured strains respectively.
When applying the inverse triangular load distribution, the CA model gives onaverage 1.34 times the measured GR strains and Zaeske’s multi-scale archingmodel (2001) does the same by a factor of 1.42. For the uniform load distribution,this figure is 1.16 for the Concentric Arches model and 1.24 for Zaeske’s model. Itcan therefore be concluded that the Concentric Arches model gives GR strains thatmatch the measurements better than Zaeske’s model (2001). This conclusion holdsfor any load distribution.
If the load distribution that gives the smallest GR strain is chosen – in other words,the inverse triangular distribution for the cases without, or with limited, subsoilsupport and a uniformly distributed load in the cases with subsoil support – theConcentric Arches model gives on average 1.06 times the measured GR strains, inother words, an average overestimation of the measured strains of only 6%, asshown in Figure 5.29.
In conditions without subsoil support, the inverse triangular load distributionpredicts the GR strain best: the calculated GR strains were on average 12% largerthan measured, by comparison with 31% in the case of the Zaeske (2001) model.When subsoil support is considerable, the load on the GR strip is distributed in anapproximately uniform way. This uniform load is combined with the counter-pressure that is directed upwards, leading to a net load distribution that matches aninverse triangular load distribution more than a uniform or triangular loaddistribution, as shown in Figure 5.19.
The Dutch CUR committee decided to replace the Dutch CUR 226 (2010) withCUR 226 (2015), using the Concentric Arches model in combination with allsubsoil support and the load distribution that gives the lowest GR strain: either theinverse triangular load distribution or the uniformly distributed load.
Conclusions
213
7.7 Recommendations for future research
7.7.1 Horizontal load on the GR
The 3D numerical calculations presented by Van der Peet and Van Eekelen (2014)show that the direction of the major principal stresses just above the GR is notvertical everywhere, even though this is one of the assumptions underlying theConcentric Arches model. The implications of this finding should be investigated.
Furthermore, the effect of lateral loads caused by, for example, spreading forces orlateral traffic forces, should be considered more carefully. The experiments andfinite element calculations of Farag (2008) should be taken into consideration.
7.7.2 Subsoil support
The experiments presented in this thesis showed that subsoil consolidation has amajor impact on arching and on the GR strain. The CA model proposed in thisthesis explains increasing arching with subsoil consolidation and GR deflection.The explanation is that new arches are formed in succession as GR deflectionprogresses. However, in the limit-state version of the model presented in thisthesis, the model behaves in a rigid-plastic way and it no longer describes theinfluence of subsoil consolidation or deformation.
This suggests that it could be better not to separate the first and second calculationsteps as is done in this thesis. This has been suggested by, for example, Deb etal. (2010).
Furthermore, the subsoil support in calculation step 2 was modelled using springs.Optimisation through the introduction of a consolidation model in step 2 would bea useful extension. This would also reduce the difficulties affecting thedetermination of a correct value for the subgrade reaction. In this case, negativeskin friction along the pile shafts should be taken into account, as in the FrenchASIRI (2012).
7.7.3 Traffic load
All design methods use a uniform distributed surcharge load to take traffic loadinto account. There are several methods for converting a normative truck load intoa uniformly distributed surcharge load. Van Eekelen et al. (2015b,d) presentmeasurements during truck passages showing that the calculation methods mayoverestimate the influence of the truck passages. It is possible that the load may bespread more than has been assumed. Further research is needed.

Basal Reinforced Piled Embankments
214
The influence of cyclic loading by traffic can either enhance or disrupt the archingmechanism. Improvement occurs as a result of compaction due to vibration ortraffic. This improves the soil strength and therefore arching. Arching may beadversely affected by fractures or slip planes generated by the passage of heavytrucks. Heitz (2006) and Van Eekelen et al. (2007) have shown, on the basis ofmodel experiments and field measurements respectively, that the arching tends tobe restored after damage has occurred: they found an increase in arching during aperiod of rest.
Heitz (2006) studied the influence of cyclic loading on piled embankments withand without GR. He concluded that the introduction of GR reduced the influenceof the vibrations on arching considerably. He calibrated a calculation rule to reducearching in cases with a relatively large cyclic loading, the “ model”. Heitz basedhis calibration purely on his unreinforced experiments: it was not possible to usehis reinforced tests because he had not been able to measure A separately. Heitzalso concluded that arching can recover between periods of cyclic loading. This,and the fact that the model was based on the unreinforced tests, makes it likelythat the current model is more conservative than necessary. Further research isrecommended.
7.7.4 Water
In natural peat swamps, water tables may be as high as 0.10 to 0.20 m below thesurface. In urbanised delta areas with soft soil, this figure is often around 0.50 to0.70 m. In these areas, road surfaces often have to be built at relatively low levels.This leaves limited space for the construction of dry embankments on pilefoundations. However, most piled embankments are designed in such a way thatthe embankment can be kept dry. This means reducing the pile spacing orinstalling the road surface at a higher level than in the original design.
As a result, there is considerable pressure to locate embankments below the levelof the water table. Furthermore, floods, heavy showers or artesian water can affectthe arching behaviour due to changes in the fill behaviour, the reduction ofeffective stresses, and the weight or swell of the subsoil. Van Eekelen et al.,(2012c), Briançon and Simon (2012) and Sloan (2011) all presented measurementsshowing that moisture affects arching behaviour. However, the mechanism is notyet understood and further research is required.
7.7.5 Other fill types
The analytical models considered have been developed for cohesionless frictionalfills, and it has been assumed that frictional fills such as crushed rock, sand or
Conclusions
215
crushed recycled construction material such as concrete and masonry will be used.In practice, however, these fills often have some level of cohesion. In those cases,it is generally advisable to disregard this cohesion and therefore to introduce anadditional safety.
Furthermore, in some countries, such as Brazil and Indonesia, the fill materialsconsist of laterite, a tropical residual soil. Although the properties of laterite canvary greatly, its behaviour is usually cohesive. Research looking at the long-termarching behaviour of these tropical soils in piled embankment applications isrecommended. Model experiments with laterite of the kind described in Chapter 2and Van Eekelen et al., 2012a should be conducted.


Appendices


A. Analysis and Modification of the BritishStandard BS8006 for the Design of PiledEmbankments
Published in Geotextiles and Geomembranes:Van Eekelen, S.J.M., Bezuijen, A. van Tol, A.F., 2011. Analysis and modification of the British Standard BS8006for the design of piled embankments. Geotextiles and Geomembranes 29: 345-359. Reprinted with permission fromElsevier. Downloadable at: http://www.sciencedirect.com/science/article/pii/S0266114411000173Minor corrections and some footnotes have been introduced to make the text consistent with the other chapters ofthis thesis.
Basal Reinforced Piled Embankments
220
Abstract
The piled embankment is an increasingly popular construction method. The DutchDesign Guideline for piled embankments (CUR 226) was published in the first halfof 2010. Several existing models were analysed before it was decided to adopt thecalculation rules in the Dutch Guideline. The British Standard BS8006 sometimescalculates tensile forces in the geosynthetic reinforcement that differ considerablyfrom the tensile forces calculated with other models. For quite thin embankmentsin particular, BS8006 designs a relatively strong and therefore expensivegeosynthetic reinforcement by comparison with other design models. Thesedifferences are not always fully understood, leading to uncertainty. This paperanalyses BS8006 and demonstrates why it behaves differently from other models.It also examines why this behaviour is different than would be expected. Forexample, it is shown that calculations using BS8006 are based on a load which ishigher than the actual load.A modification to BS8006 is proposed, which is shown to give results comparableto the results of the German Standard EBGEO for situations where there is nosubsoil support. The results of BS8006, Modified BS8006, and the German/Dutchguideline are compared with finite element calculations and field measurements. Itis concluded that the results derived with the Modified BS8006 are more accuratethan those obtained using BS8006.
A. 1 Introduction
The piled embankment is an increasingly popular construction method. In theNetherlands for example, more than 20 piled embankments have been constructedduring the last 10 years. Many more piled embankments have been reported incountries such as Germany, England, Scandinavia, the United States, Brazil, India,and Poland. The Dutch Design Guideline (CUR 226) was published in the first halfof 2010. This Guideline adopts major parts of the German Guideline EBGEO(2010).
Several existing models have been analysed to determine the calculation rules usedin the Dutch Guideline. The British Standard BS8006 sometimes calculates tensileforces in the geosynthetic basal reinforcement (GR) that differ considerably fromother models. In the case of quite thin embankments in particular, BS8006 designsa relatively strong and thus expensive GR in comparison with other design models.These differences are not always fully understood leading to uncertainty. Thispaper analyses BS8006 and demonstrates why it behaves differently from othermodels. It also shows why this behaviour is different than would be expected. Amodification for BS8006 is proposed, referred to as the Modified BS8006.
Appendices
221
The tensile force in the GR must first be calculated to design the GR in a piledembankment. The tensile force is caused by vertical load (traffic, soil weight) andby lateral load (active ground pressure due to outward horizontal thrust of theembankment). This paper only considers the tensile force calculations caused bythe vertical loads in the system.
Chapter A. 2 of this paper thoroughly analyses BS8006 for reinforcement in piledembankments, and identifies its limitations. The resultant proposal for theModified BS8006 is given in Chapter A. 3.The final two chapters compare the results of BS8006, the Modified BS8006, andthe German/Dutch guidelines with finite element calculations and fieldmeasurements.
Safety philosophy is beyond the scope of this paper, and all safety factors in thecalculation methods are therefore ignored. The paper focuses on the tensile forcecalculations caused by vertical loads in the piled embankment. Throughout thepaper, pile spacing is assumed to be identical in both directions, except inChapter A.3.4. Here, equations for the Modified BS8006 are elaborated for thesituation that sx sy. Differences in GR stiffness J in both directions do notinfluence the equations.
A. 2 British Standard BS8006 for the design of reinforcement in piledembankments
A.2.1 Introduction
British Standard BS8006 calculates the tensile force in the GR caused by thevertical load in the following four steps23:
1. The vertical load is divided into three parts2. The load on the reinforcement is concentrated on the strips of reinforcement
between adjacent pile caps.3. Full arching is assumed4. The tensile force in the GR is calculated, from the vertical load part B.
Each of these four steps will be analysed in Chapters A.2.2 to A.2.5.
23 The rest of this thesis distinguishes between two calculation steps. Step 1 (arching) is the division of the load intotwo parts, which corresponds with this first step (for C = 0). Step 2 in the rest of the thesis corresponds to the otherthree steps listed here. Step 2 mentioned here, about the load concentration on the GR strips between adjacent pilecaps, is discussed in this appendix for BS8006 and in Chapter 6.4.2 for Zaeske (2001) and the new CA model.
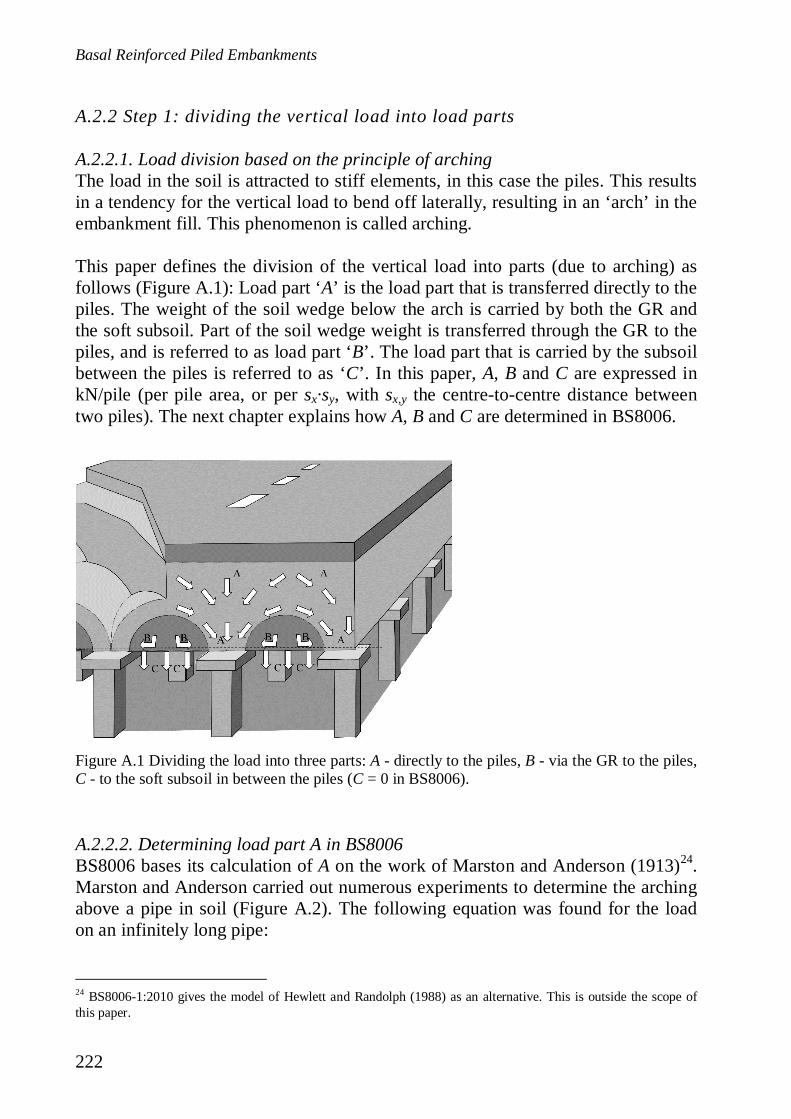
Basal Reinforced Piled Embankments
222
A.2.2 Step 1: dividing the vertical load into load parts
A.2.2.1. Load division based on the principle of archingThe load in the soil is attracted to stiff elements, in this case the piles. This resultsin a tendency for the vertical load to bend off laterally, resulting in an ‘arch’ in theembankment fill. This phenomenon is called arching.
This paper defines the division of the vertical load into parts (due to arching) asfollows (Figure A.1): Load part ‘A’ is the load part that is transferred directly to thepiles. The weight of the soil wedge below the arch is carried by both the GR andthe soft subsoil. Part of the soil wedge weight is transferred through the GR to thepiles, and is referred to as load part ‘B’. The load part that is carried by the subsoilbetween the piles is referred to as ‘C’. In this paper, A, B and C are expressed inkN/pile (per pile area, or per sx·sy, with sx,y the centre-to-centre distance betweentwo piles). The next chapter explains how A, B and C are determined in BS8006.
A.2.2.2. Determining load part A in BS8006BS8006 bases its calculation of A on the work of Marston and Anderson (1913)24.Marston and Anderson carried out numerous experiments to determine the archingabove a pipe in soil (Figure A.2). The following equation was found for the loadon an infinitely long pipe:
24 BS8006-1:2010 gives the model of Hewlett and Randolph (1988) as an alternative. This is outside the scope ofthis paper.
Figure A.1 Dividing the load into three parts: A - directly to the piles, B - via the GR to the piles,C - to the soft subsoil in between the piles (C = 0 in BS8006).
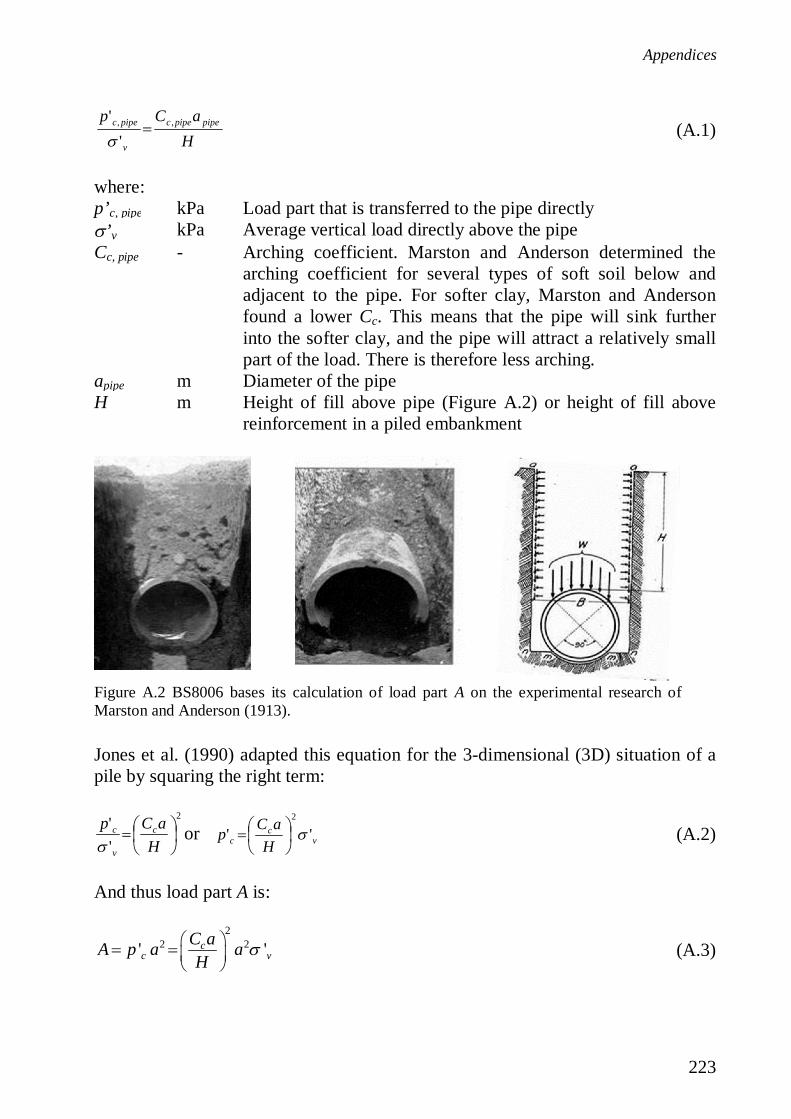
Appendices
223
HaCp pipepipec
v
pipec ,,
''
(A.1)
where:p’c, pipe kPa Load part that is transferred to the pipe directly
’v kPa Average vertical load directly above the pipeCc, pipe - Arching coefficient. Marston and Anderson determined the
arching coefficient for several types of soft soil below andadjacent to the pipe. For softer clay, Marston and Andersonfound a lower Cc. This means that the pipe will sink furtherinto the softer clay, and the pipe will attract a relatively smallpart of the load. There is therefore less arching.
apipe m Diameter of the pipeH m Height of fill above pipe (Figure A.2) or height of fill above
reinforcement in a piled embankment
Jones et al. (1990) adapted this equation for the 3-dimensional (3D) situation of apile by squaring the right term:
2
''
HaCp c
v
c or vc
c HaCp ''
2
(A.2)
And thus load part A is:
22 2' 'c
c vC aA p a aH
(A.3)
Figure A.2 BS8006 bases its calculation of load part A on the experimental research ofMarston and Anderson (1913).

Basal Reinforced Piled Embankments
224
Equation (A.2) has been adopted in BS8006 on page 185 (BS8006-1: 2010). Joneset al. (1990) and BS8006 also adapted how the arching coefficient Cc for the 3Dgeometry of a piled embankment should be determined as follows:
End-bearing piles: Friction and other piles:
18.095.1aHCc (A.4) 07.05.1
aHCc (A.5)
Where:p’c kPa Load part in kPa that is transferred directly to the pile.
p’c = A/Ap where A (kN) is the load part directly on the pile asshown in Figure A.1and Ap (m2) is the area of the pile; Ap = a2.
’v kPa Average vertical effective stress directly above the pile capCc - Arching coefficient adapted by Jones et al. (1990) for the piled
embankmenta m Size of pile cap, or the equivalent size side in the case of
circular pilesH m Height of fill above reinforcement
A.2.2.3. Determining load parts B and C in BS8006Load part A has been determined in the previous chapter. This result can be used todetermine load parts B and C. BS8006 assumes that the subsoil will not support theembankment over time. Therefore, C = 0 kN/pile in any design calculation withBS8006.
This is a conservative (i.e. safe) assumption. Assumptions using C > 0 kN/pile canlead to unsafe situations unless it can be proven that this case will exist in the field.For example, a future groundwater level decrease can result in sufficient settlementto loosen any subsoil support, or a working platform placed on the subsoil beforepile installation may cause settlements below the mattress.
In other cases where it can be proven that minimal settlements are expected,calculations can reasonably include some subsoil support, as in the GermanEBGEO. To validate design calculation methods with field tests, it is in any casenecessary that calculations include subsoil support. This is because a considerabledegree of subsoil support has been measured in the available field studies (in theNetherlands for example, in the N210 project (Haring et al. (2008), a rail roadproject in Houten (Van Duijnen et al., 2010), and in the Kyoto Road project (VanEekelen et al., 2010a)). Although this support was measured during monitoring, itmay disappear in future years.
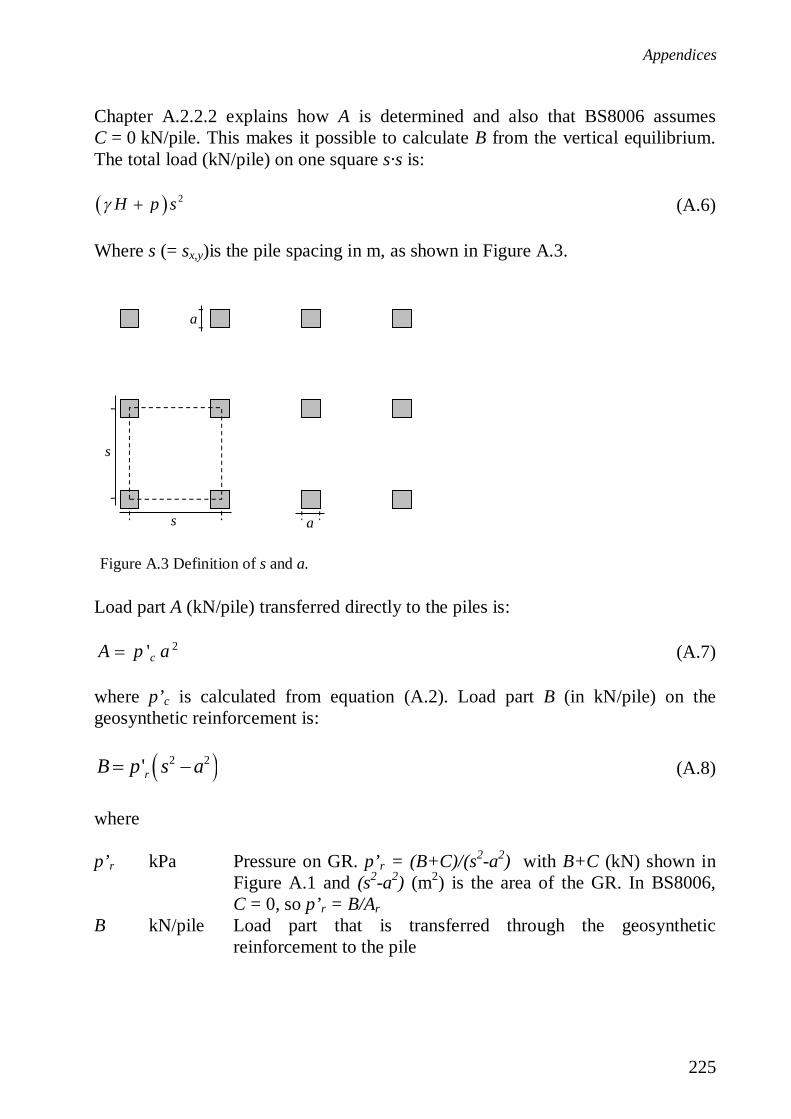
Appendices
225
Chapter A.2.2.2 explains how A is determined and also that BS8006 assumesC = 0 kN/pile. This makes it possible to calculate B from the vertical equilibrium.The total load (kN/pile) on one square s·s is:
2H p s (A.6)
Where s (= sx,y)is the pile spacing in m, as shown in Figure A.3.
Load part A (kN/pile) transferred directly to the piles is:
2'cA p a (A.7)
where p’c is calculated from equation (A.2). Load part B (in kN/pile) on thegeosynthetic reinforcement is:
2 2'rB p s a (A.8)
where
p’r kPa Pressure on GR. p’r = (B+C)/(s2-a2) with B+C (kN) shown inFigure A.1 and (s2-a2) (m2) is the area of the GR. In BS8006,C = 0, so p’r = B/Ar
B kN/pile Load part that is transferred through the geosyntheticreinforcement to the pile
a
a
s
s
Figure A.3 Definition of s and a.
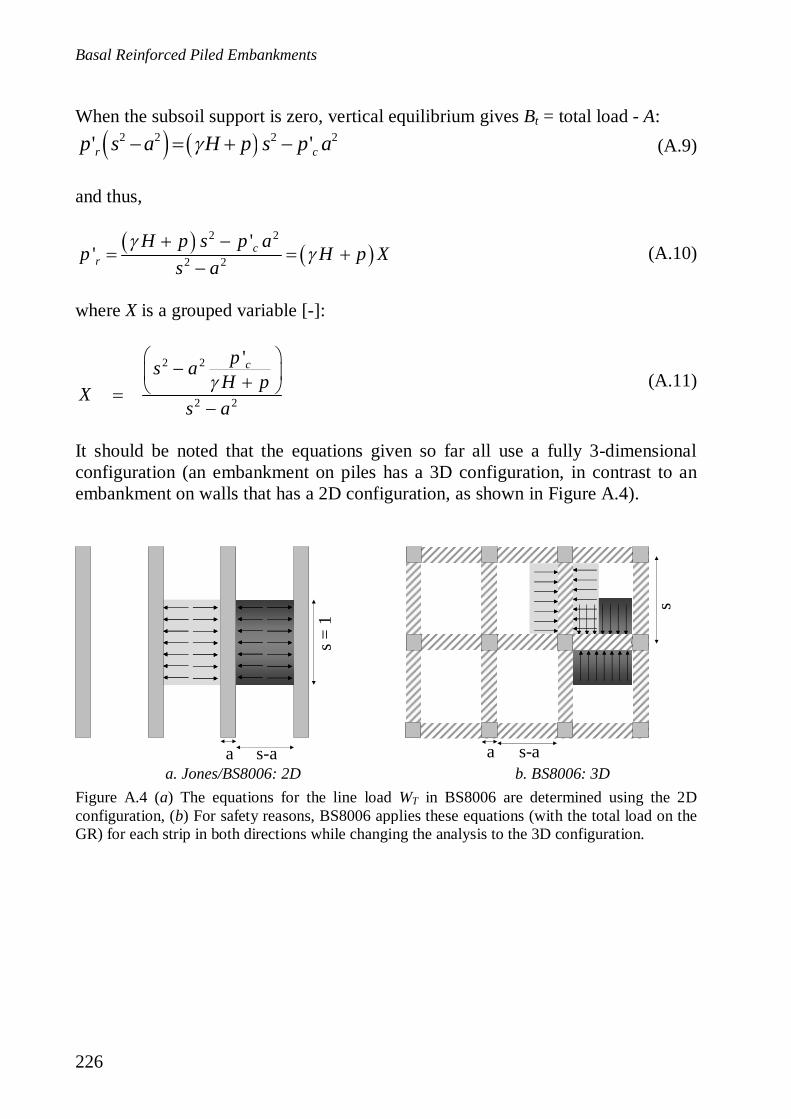
Basal Reinforced Piled Embankments
226
When the subsoil support is zero, vertical equilibrium gives Bt = total load - A:2 2 2 2' 'r cp s a H p s p a (A.9)
and thus,
2 2
2 2'
' cr
H p s p ap H p X
s a(A.10)
where X is a grouped variable [-]:
2 2
2 2
'cps aH pX
s a(A.11)
It should be noted that the equations given so far all use a fully 3-dimensionalconfiguration (an embankment on piles has a 3D configuration, in contrast to anembankment on walls that has a 2D configuration, as shown in Figure A.4).
a. Jones/BS8006: 2D b. BS8006: 3Ds-aa
s=1
a s-a
s
Figure A.4 (a) The equations for the line load WT in BS8006 are determined using the 2Dconfiguration, (b) For safety reasons, BS8006 applies these equations (with the total load on theGR) for each strip in both directions while changing the analysis to the 3D configuration.
Appendices
227
A.2.3 Step 2: concentration of load part B on the reinforcement stripsbetween the pile caps
A.2.3.1 Calculation of the line load WT for a 2D configurationBS8006 assumes that the vertical load on the GR is carried only by the GR stripsbetween two adjacent pile caps. These ‘strips’ are shown shaded in Figure A.4b.It is assumed that only very limited strain and tensile stress occur in thereinforcement between these strips.
Jones et al. (1990) determined this line load WT for the 2D configuration, as shownin Figure A.4a. The strip with width s is intended to carry the entire load that restson a square (s-a) s. Here, s is unity (1 m). This only becomes relevant in the3D case. Thus Jones et al. find:
' ' 'Tr T r T r
Wp s a s W s a p or W s ps
(A.12)
Where: WT (kN/m): In the 3D case (Figure A.4b): Line load resting on thereinforcement strip in between two piles. For the 2D case (Figure A.4a): evenlydistributed load acting on the reinforcement across its span between twosupporting walls per unit length of wall, with unity width s = 1m. This is inagreement with, for example, Le Hello (2007).
Although the width of the GR strip s in the 2D case is unity 1 m, the line load isfirst calculated for a strip without width. BS8006 then reintroduces this width inthe equations, see equation (A.23).
Combining equation (A.12) with the vertical equilibrium in equation (A.10) gives:
TW s H p X (A.13)
with the grouped variable X given in equation (A.11). Note that equation (A.13) isa mixture of the 3D-equilibrium equation (A.10) and the 2D (plane strain) line loadequation (A.12).
Equations (A.13) and (A.11) agree with equation (2) of Jones et al. (1990).BS8006-1:2010 adopts these equations to express the line load in the secondequation on page 186 (Chapter 8.3.3.7.1). This expression for the line load is forthe case H 1.4 (s-a), which is referred to as ‘partial arching’ throughout thispaper. Chapter A.2.4 explains the concepts of ‘partial arching’ and ‘full arching’.
Basal Reinforced Piled Embankments
228
A.2.3.2. Double application of the line load WT for a 3D configurationJones et al. (1990) derived the equation for the line load WT equation (A.13).BS8006 adopts this nearly-plane strain equation. However, BS8006 uses therecommendation of Jones et al. that this line load should be calculated both to theGR strips perpendicular to the load axis, and to the GR strips along the road axis,as shown in Figure A.4b. This means that the analysis has now changed to the3D case by calculating the load resting on the GR twice. Jones et al. made thischoice to guarantee sufficient safety, an understandable decision for a first designstandard in the nineties.Figure A.4a. shows the plane strain situation where the vertical equilibrium issatisfied. However, BS8006 uses Figure A.4b, where the vertical equilibrium is notsatisfied. Equation (A.13) from BS8006 for line load can be used to calculate theaverage load on the GR, load part B, and the pile efficiency Ep.
This paper defines load part B as the load transferred through the GR to the piles,in kN per pile. Two GR strips lie in one s·s square, so that B can be determinedusing equation (A.13) of BS8006:
2 2TB W s a s H p s a X (A.14)
Note that this equation for B does not agree with (A.8). Vertical equilibrium nolonger exists. The average stress on the reinforcement resulting from the BS8006equations is:
2 2' 2 2
W s H pB Tp Xr s a s as a(A.15)
This gives a pile efficiency Ep (kN/pile/kN/pile):
2 21 1 12
H p s - a X s aBE Xp w sH ptot(A.16)
A.2.4 Step 3: assuming the existence of full arching.
BS8006 assumes the existence of full arching, analogous to McKelvey (1994) whoassumes the existence of a ‘plane of equal settlement’. The assumption is asfollows: when the embankment is sufficiently high for the arch to develop fully,then the entire load from above the arch will be transferred directly to the piles.Reinforcement in the bottom of the embankment will thus not ‘feel’ the traffic loador an increasing embankment height.
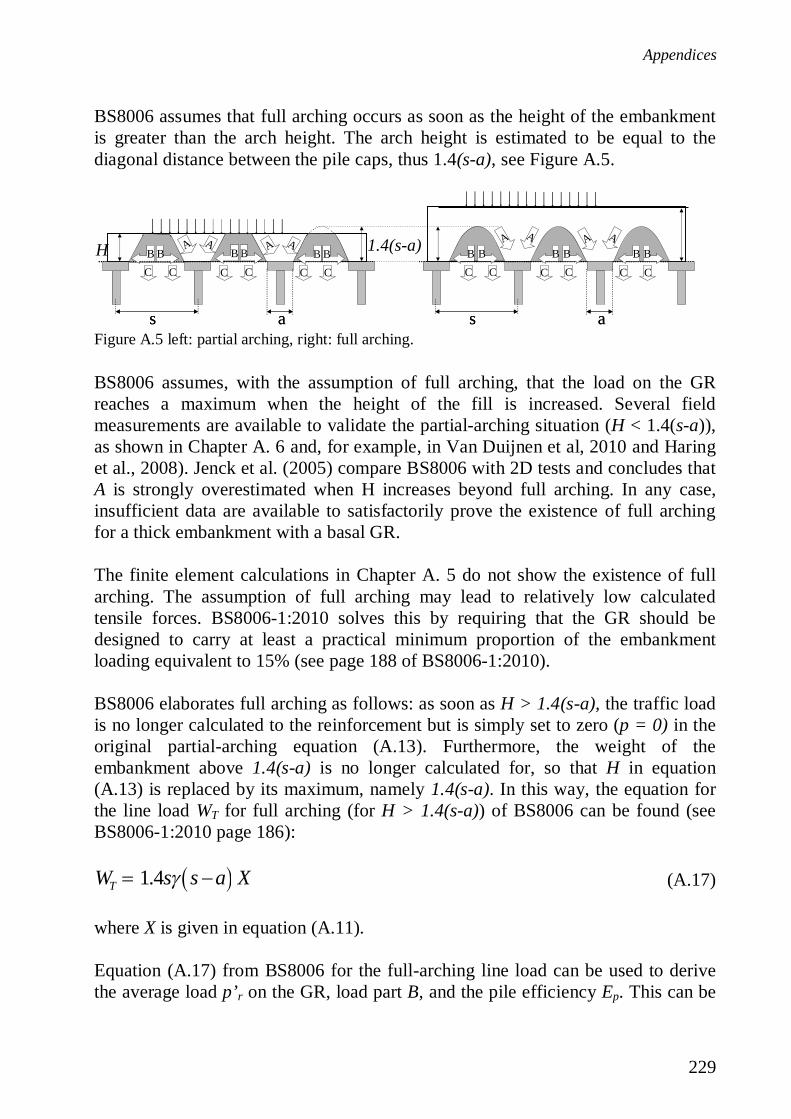
Appendices
229
BS8006 assumes that full arching occurs as soon as the height of the embankmentis greater than the arch height. The arch height is estimated to be equal to thediagonal distance between the pile caps, thus 1.4(s-a), see Figure A.5.
BS8006 assumes, with the assumption of full arching, that the load on the GRreaches a maximum when the height of the fill is increased. Several fieldmeasurements are available to validate the partial-arching situation (H < 1.4(s-a)),as shown in Chapter A. 6 and, for example, in Van Duijnen et al, 2010 and Haringet al., 2008). Jenck et al. (2005) compare BS8006 with 2D tests and concludes thatA is strongly overestimated when H increases beyond full arching. In any case,insufficient data are available to satisfactorily prove the existence of full archingfor a thick embankment with a basal GR.
The finite element calculations in Chapter A. 5 do not show the existence of fullarching. The assumption of full arching may lead to relatively low calculatedtensile forces. BS8006-1:2010 solves this by requiring that the GR should bedesigned to carry at least a practical minimum proportion of the embankmentloading equivalent to 15% (see page 188 of BS8006-1:2010).
BS8006 elaborates full arching as follows: as soon as H > 1.4(s-a), the traffic loadis no longer calculated to the reinforcement but is simply set to zero (p = 0) in theoriginal partial-arching equation (A.13). Furthermore, the weight of theembankment above 1.4(s-a) is no longer calculated for, so that H in equation(A.13) is replaced by its maximum, namely 1.4(s-a). In this way, the equation forthe line load WT for full arching (for H > 1.4(s-a)) of BS8006 can be found (seeBS8006-1:2010 page 186):
1.4TW s s a X (A.17)
where X is given in equation (A.11).
Equation (A.17) from BS8006 for the full-arching line load can be used to derivethe average load p’r on the GR, load part B, and the pile efficiency Ep. This can be
1.4(s-a)AA AA
C CC C C C
BBHAA AA
C CC C C C
BB BBBBBB BB
as as as asFigure A.5 left: partial arching, right: full arching.
Basal Reinforced Piled Embankments
230
used to derive the average load on the GR p’rt, for the 2D configuration given inFigure A.4a and equation (A.12):
' 1.4Trt
Wp s a Xs (A.18)
However, WT is calculated twice, in the same way as for partial arching, as shownin Figure A.4b. This therefore results in
2.82' Tr
s s aWp Xs a s a
(A.19)
and B (in kN/pile) for full arching, see equation (A.14):
22 2.8TB W s a s s a X (A.20)
This gives a pile efficiency Ep (kN/pile/kN/pile):
2 2
2
2.8 2.81 1 1p
tot
s s - a X s - aBE Xw s H p s H p
(A.21)
A.2.5 Step 4: from line load to tensile force
The equally-distributed load WT on the GR strip without width is determined insteps 2 and 3 (equations (A.13) and (A.17)). The tensile force T in the GR strip canbe derived from this WT. For this purpose, the GR strip is modelled as a tensionmembrane and the following assumptions are made:
- there is no subsoil support- the line load WT is equally distributed- the GR strip fixed at the sides of the pile caps- the tensile force is calculated at the side of the pile cap and is therefore a
maximum (not an average, as in the German EBGEO).
The first two assumptions result in a parabola-shaped deformed tension membrane,as shown in Appendix A.A. It is noted that several researchers (for example VanEekelen et al, 2011b) found that the greatest load is concentrated around the edgesof the pile caps. This means that the assumption of equal load distribution is closerto reality than some other commonly-used models, such as the triangular shapedload in EBGEO (2010).
Appendices
231
Appendix A.A shows how a differential equation for the tension membrane isderived and solved, resulting in the tensile force T in kN in the GR strip (the striphas a zero width):
112 6
TW s aT (A.22)
Dividing this by the width a of the GR strip then gives the tensile force Trp in thestrip with width a in kN/m:
( ) 112 6
Trp
W s aTa
(A.23)
Here, the (estimated) strain is an input parameter to calculate the tensile force Trp.The apparent stiffness of the geosynthetic reinforcement can therefore becalculated as:
rpTJ (A.24)
A.2.6 Different interpretations of BS8006 from literature
Chapter A.2.3 showed that the BS8006 equations are based on 3D equilibriumequations as well as 2D equations, to concentrate the load in line loads on the GRstrips. Furthermore, the load on the GR is calculated twice. Several authors haveinterpreted BS8006 in order to compare it with other models.
For example, Abusharar et al. (2009) and Le Hello (2007) assumed that theequations were developed for a fully 2D configuration. Love and Milligan (2003),Stewart (2005), and Russell and Pierpoint (1997) on the other hand assumed thatthe equations were developed for a 3D configuration. These interpretations areelaborated and compared in appendix A.B.
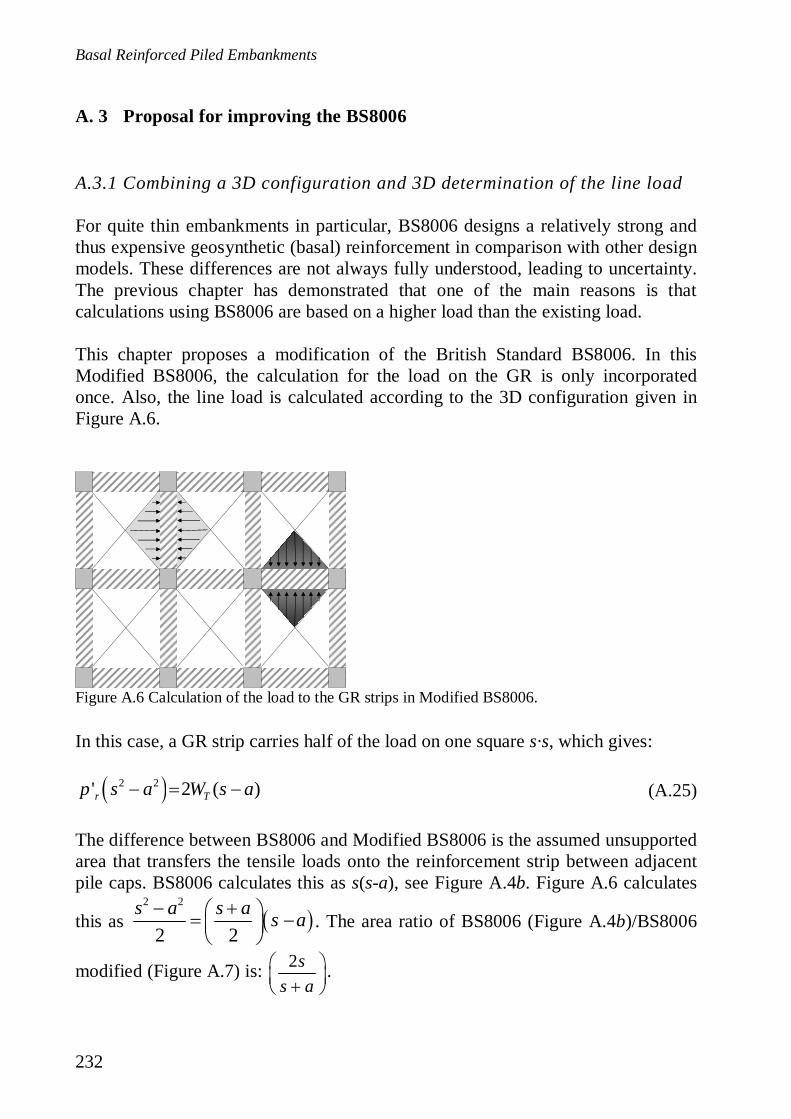
Basal Reinforced Piled Embankments
232
A. 3 Proposal for improving the BS8006
A.3.1 Combining a 3D configuration and 3D determination of the line load
For quite thin embankments in particular, BS8006 designs a relatively strong andthus expensive geosynthetic (basal) reinforcement in comparison with other designmodels. These differences are not always fully understood, leading to uncertainty.The previous chapter has demonstrated that one of the main reasons is thatcalculations using BS8006 are based on a higher load than the existing load.
This chapter proposes a modification of the British Standard BS8006. In thisModified BS8006, the calculation for the load on the GR is only incorporatedonce. Also, the line load is calculated according to the 3D configuration given inFigure A.6.
In this case, a GR strip carries half of the load on one square s·s, which gives:
2 2' 2 ( )r Tp s a W s a (A.25)
The difference between BS8006 and Modified BS8006 is the assumed unsupportedarea that transfers the tensile loads onto the reinforcement strip between adjacentpile caps. BS8006 calculates this as s(s-a), see Figure A.4b. Figure A.6 calculates
this as2 2
2 2s a s a s a . The area ratio of BS8006 (Figure A.4b)/BS8006
modified (Figure A.7) is: 2ss a
.
Figure A.6 Calculation of the load to the GR strips in Modified BS8006.
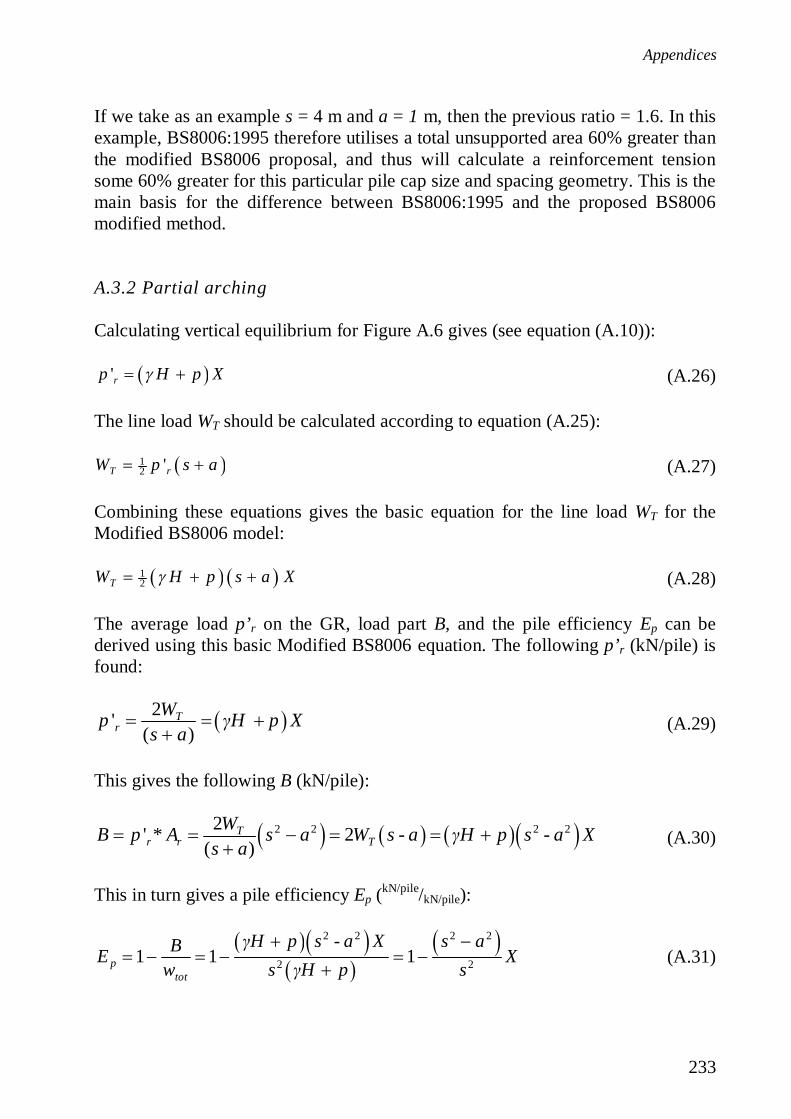
Appendices
233
If we take as an example s = 4 m and a = 1 m, then the previous ratio = 1.6. In thisexample, BS8006:1995 therefore utilises a total unsupported area 60% greater thanthe modified BS8006 proposal, and thus will calculate a reinforcement tensionsome 60% greater for this particular pile cap size and spacing geometry. This is themain basis for the difference between BS8006:1995 and the proposed BS8006modified method.
A.3.2 Partial arching
Calculating vertical equilibrium for Figure A.6 gives (see equation (A.10)):
'rp H p X (A.26)
The line load WT should be calculated according to equation (A.25):
12 'T rW p s a (A.27)
Combining these equations gives the basic equation for the line load WT for theModified BS8006 model:
12TW H p s a X (A.28)
The average load p’r on the GR, load part B, and the pile efficiency Ep can bederived using this basic Modified BS8006 equation. The following p’r (kN/pile) isfound:
2'( )
Tr
Wp H p Xs a (A.29)
This gives the following B (kN/pile):
2 2 2 22' * 2( )
Tr r T
WB p A s a W s - a H p s - a Xs a (A.30)
This in turn gives a pile efficiency Ep (kN/pile/kN/pile):
2 2 2 2
2 21 1 1ptot
H p s - a X s aBE Xw s H p s
(A.31)

Basal Reinforced Piled Embankments
234
A.3.3 Full arching
The assumption of full arching can be applied to the Modified BS8006. However,it has already been argued in Chapter A.2.4 that the assumption of full arching maylead to relatively low calculated tensile forces, which is solved in BS8006 asshown in Chapter A.2.4. If the Modified BS8006 applies full arching, the tensileforces may even decrease. These equations should therefore only be applied withgreat care. Further validation of the full-arching theory is recommended. If fullarching is assumed in the Modified BS8006, p = 0 kPa and H = 1.4(s-a) are usedin equation (A.28):
2 20.7TW s a X (A.32)
The average load p’r on the GR, load part B, and the pile efficiency Ep can bederived using this basic Modified BS8006 equation. The following p’r (kN/pile) isfound:
2' 1.4( )
Tr
Wp s a Xs a (A.33)
This gives the following B (kN/pile):
2 2 2 22' * 2 1.4( )
Tr r T
WB p A s a W s - a s a s - a Xs a (A.34)
This in turn gives a pile efficiency Ep (kN/pile/kN/pile):
2 2 2 2
2 2
1.41 1 1p
tot
s a s - a X s aBE Xw s H p s
(A.35)
Table A.1 summarises the assumptions and starting points of Jones’ equations,BS8006, and the Modified BS8006. The proposed modification gives a fully3D elaboration and a correct vertical equilibrium.

Appendices
235
A.3.4 Different pile spacing along and perpendicular to road axis
This chapter gives the equations for the Modified BS8006 if the pile spacingsalong and perpendicular to the road axis are not equal; sx sy. The groupedvariable X in equation (A.11) changes in:
2
2
'cx y
x y
ps s aH pX
s s a(A.36)
Table A.1 Summary of the assumptions and starting points of Jones’ equations, the originalBS8006, and the Modified BS8006.
Jonesa
Plane strain BS8006ModifiedBS8006
1. calculate load part A that passes directly tothe piles (based on Marston and Anderson,equation (A.2)).
Marston(equation(A.2))
Marston(equation(A.2))
Marston(equation(A.2))
2. support of subsoil? no no no3. calculate load part Bt on the reinforcement 3D
equilibrium3Dequilibrium
3Dequilibrium
4. concentrate load part B on thereinforcement in between the pile caps
2D geometry 2D geometry 3D geometry
5. double the load on the reinforcement, byapplying line load to both directions alongand perpendicular to the road axis
only 2D, thusonly onedirectionconsidered
yes no
6. for comparison between the models:calculate back the load on thereinforcement from the line load
2D geometry differs perauthorb
3D geometry
7. vertical equilibrium?For partial arching
Yes No Yes
8. vertical equilibrium?for full arching
No Noc No
a Jones et al. concentrated on a 2D method because the finite element studies developed for the paper could onlymodel in plane strain, i.e. 2D. This does not mean that Jones et al were proposing a 2D design approach, asexplained in Chapter A.2.3.2.b see appendix A.B, for example Abusharar et al. (2009) and Le Hello (2007) use a 2D geometry, whereas Love andMilligan (2003), Stewart (2005) and Russell and Pierpoint (1997) use a 3D geometry, Chen et al. (2008a).use analternative 2D approach.c as recognized by Cornet and Horgan, 2010, in the paper in which they present the differences betweenBS8006:1995 and BS8006:2010.
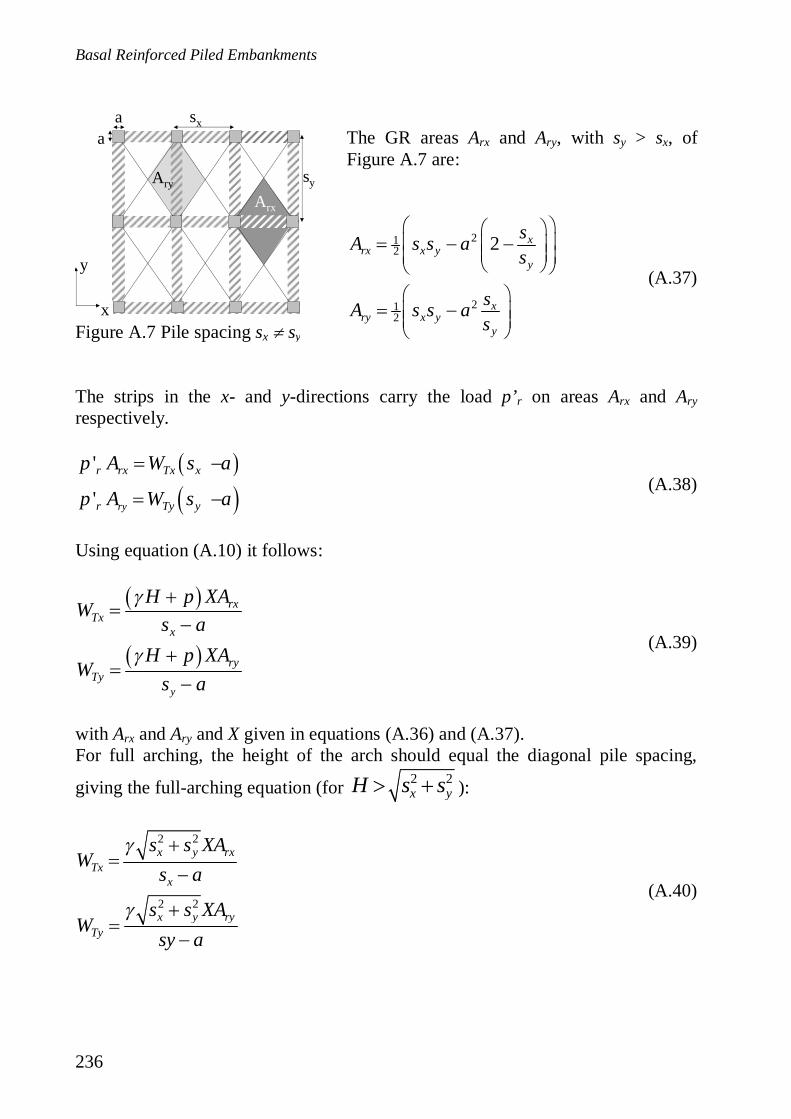
Basal Reinforced Piled Embankments
236
Figure A.7 Pile spacing sx sy
The GR areas Arx and Ary, with sy > sx, ofFigure A.7 are:
212
212
2 xrx x y
y
xry x y
y
sA s s as
sA s s as
(A.37)
The strips in the x- and y-directions carry the load p’r on areas Arx and Aryrespectively.
'
' ry
r rx Tx x
r Ty y
p A W s a
p A W s a(A.38)
Using equation (A.10) it follows:
y
rxTx
x
ryTy
H p XAW
s aH p XA
Ws a
(A.39)
with Arx and Ary and X given in equations (A.36) and (A.37).For full arching, the height of the arch should equal the diagonal pile spacing,
giving the full-arching equation (for 2 2x yH s s ):
2 2
2 2
x y rxTx
x
x y ryTy
s s XAW
s a
s s XAW
sy a
(A.40)
Ary
Arx
sx
sy
aa
x
y
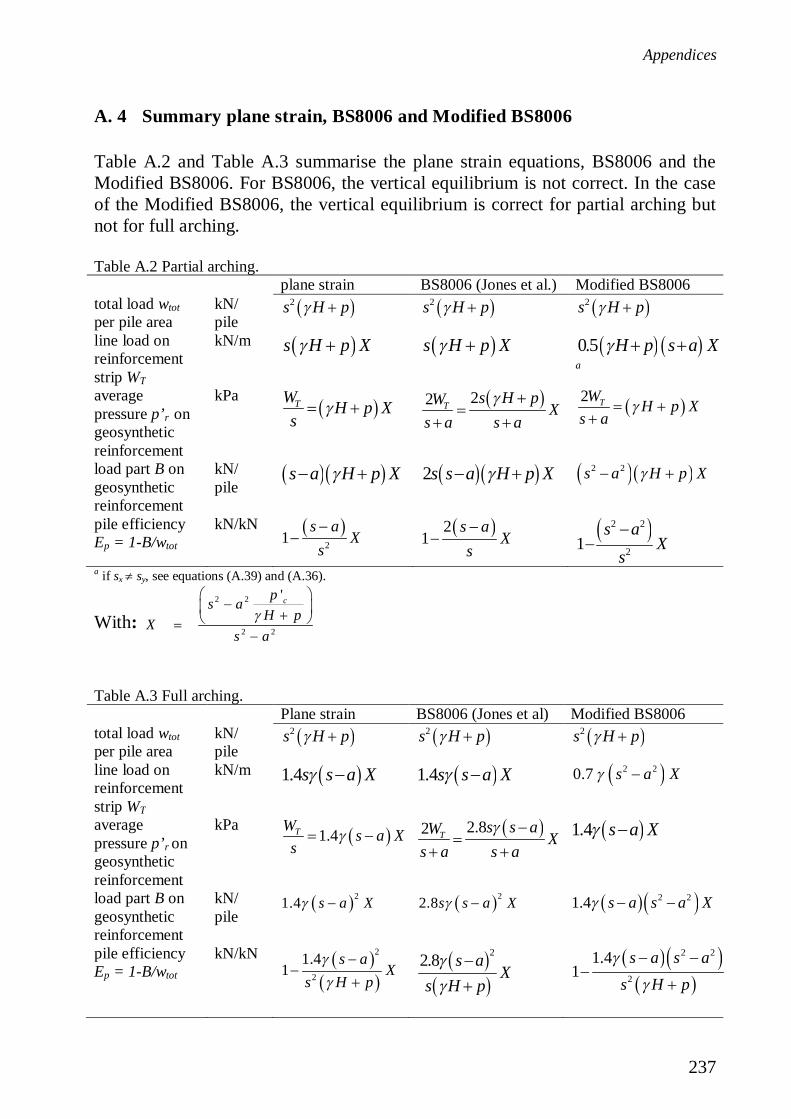
Appendices
237
A. 4 Summary plane strain, BS8006 and Modified BS8006
Table A.2 and Table A.3 summarise the plane strain equations, BS8006 and theModified BS8006. For BS8006, the vertical equilibrium is not correct. In the caseof the Modified BS8006, the vertical equilibrium is correct for partial arching butnot for full arching.
Table A.2 Partial arching.plane strain BS8006 (Jones et al.) Modified BS8006
total load wtotper pile area
kN/pile
2s H p 2s H p 2s H p
line load onreinforcementstrip WT
kN/m s H p X s H p X 0.5 H p s a Xa
averagepressure p’r ongeosyntheticreinforcement
kPa TW H p Xs
22 T s H pW Xs a s a
2 TW H p Xs a
load part B ongeosyntheticreinforcement
kN/pile
s a H p X 2s s a H p X 2 2s a H p X
pile efficiencyEp = 1-B/wtot
kN/kN21
s aX
s2
1s a
Xs
2 2
21s a
Xs
a if sx sy, see equations (A.39) and (A.36).
With:2 2
2 2
'cps aH pX
s a
Table A.3 Full arching.Plane strain BS8006 (Jones et al) Modified BS8006
total load wtotper pile area
kN/pile
2s H p 2s H p 2s H p
line load onreinforcementstrip WT
kN/m 1.4s s a X 1.4s s a X 2 20.7 s a X
averagepressure p’r ongeosyntheticreinforcement
kPa1.4TW s a X
s2.82 T s s aW X
s a s a1.4 s a X
load part B ongeosyntheticreinforcement
kN/pile
21.4 s a X 22.8s s a X 2 21.4 s a s a X
pile efficiencyEp = 1-B/wtot
kN/kN 2
2
1.41
s aX
s H p
22.8 s aX
s H p
2 2
2
1.41
s a s as H p

Basal Reinforced Piled Embankments
238
A. 5 Comparison with finite element calculations.
A.5.1 Geometry and properties
This chapter compares the results of finite element calculations (Plaxis) and theModified BS8006, BS8006, and EBGEO. Moreover, parameter variationdemonstrates the influence exerted by the properties of these models. Table A.4shows the properties of the piled embankment’s basic geometry (also see VanEekelen and Jansen, 2008). Comparison calculations in this paper only considerthe tensile forces due to the vertical load. Spreading forces are ignored.
Table A.4 Properties of basic geometry example calculation.end-bearing or friction piles end bearingdoes the subsoil provide support?modulus of subgrade reaction
k kN/m3 no support:k = 0 kN/m3
height embankment(between top pile cap and road surface)
H m 1.25
centre-to-centre distance piles(along and perpendicular to road axis)
sx=sy m 1.75
diagonal centre-to-centre distance sd m 2.47(equivalent) diameter pile caps d m 0.50 m(equivalent) width pile cap a m 0.44 marea pile caps m2 0.20 m2
material fill granular materialmaterial fill volume weight kN/m3 20
material fill internal friction angle deg 37.5
permanent weight asphalt and foundation layer kPa 6traffic load p kPa 30long-term tensile stiffness geosyntheticreinforcement, along road axisa.
J kN/m 1500
a In the BS8006 calculations, the input strain is adapted until the calculated tensile stiffness of the reinforcement isequal to J = 1500 kN/m (calculated using equation (A.61)).
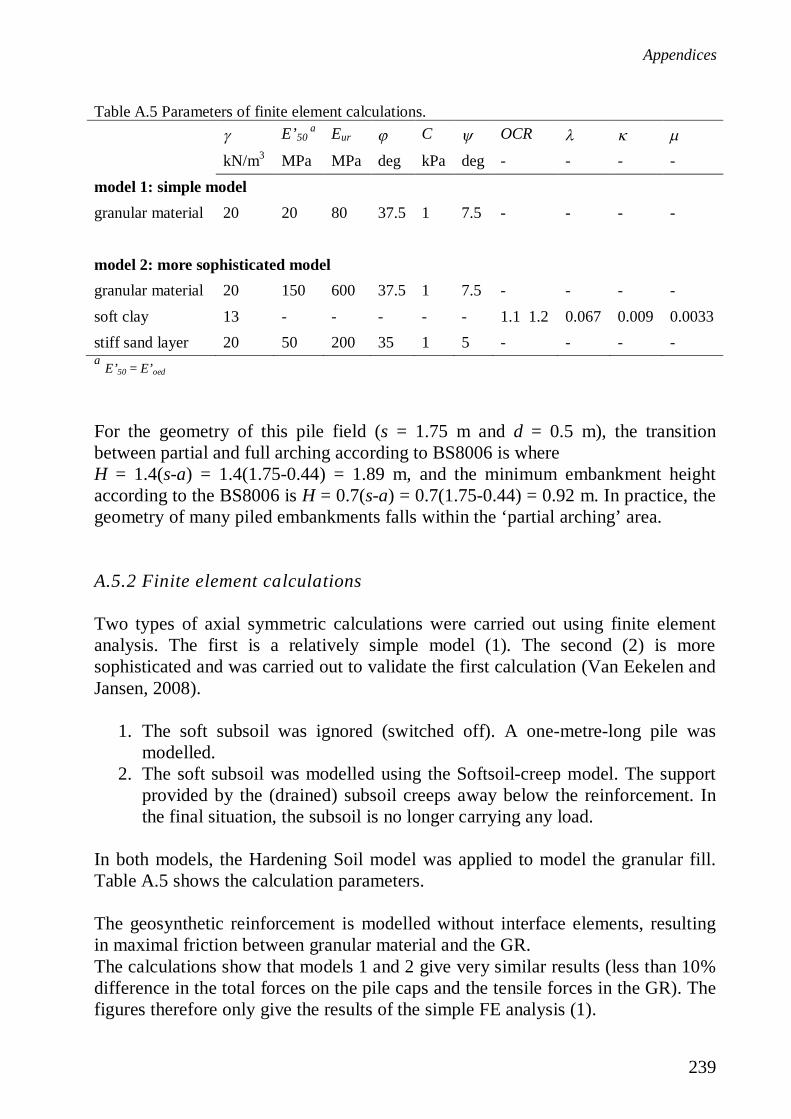
Appendices
239
Table A.5 Parameters of finite element calculations.E’50
a Eur C OCR
kN/m3 MPa MPa deg kPa deg - - - -model 1: simple modelgranular material 20 20 80 37.5 1 7.5 - - - -
model 2: more sophisticated modelgranular material 20 150 600 37.5 1 7.5 - - - -soft clay 13 - - - - - 1.1 1.2 0.067 0.009 0.0033stiff sand layer 20 50 200 35 1 5 - - - -a E’50 = E’oed
For the geometry of this pile field (s = 1.75 m and d = 0.5 m), the transitionbetween partial and full arching according to BS8006 is whereH = 1.4(s-a) = 1.4(1.75-0.44) = 1.89 m, and the minimum embankment heightaccording to the BS8006 is H = 0.7(s-a) = 0.7(1.75-0.44) = 0.92 m. In practice, thegeometry of many piled embankments falls within the ‘partial arching’ area.
A.5.2 Finite element calculations
Two types of axial symmetric calculations were carried out using finite elementanalysis. The first is a relatively simple model (1). The second (2) is moresophisticated and was carried out to validate the first calculation (Van Eekelen andJansen, 2008).
1. The soft subsoil was ignored (switched off). A one-metre-long pile wasmodelled.
2. The soft subsoil was modelled using the Softsoil-creep model. The supportprovided by the (drained) subsoil creeps away below the reinforcement. Inthe final situation, the subsoil is no longer carrying any load.
In both models, the Hardening Soil model was applied to model the granular fill.Table A.5 shows the calculation parameters.
The geosynthetic reinforcement is modelled without interface elements, resultingin maximal friction between granular material and the GR.The calculations show that models 1 and 2 give very similar results (less than 10%difference in the total forces on the pile caps and the tensile forces in the GR). Thefigures therefore only give the results of the simple FE analysis (1).
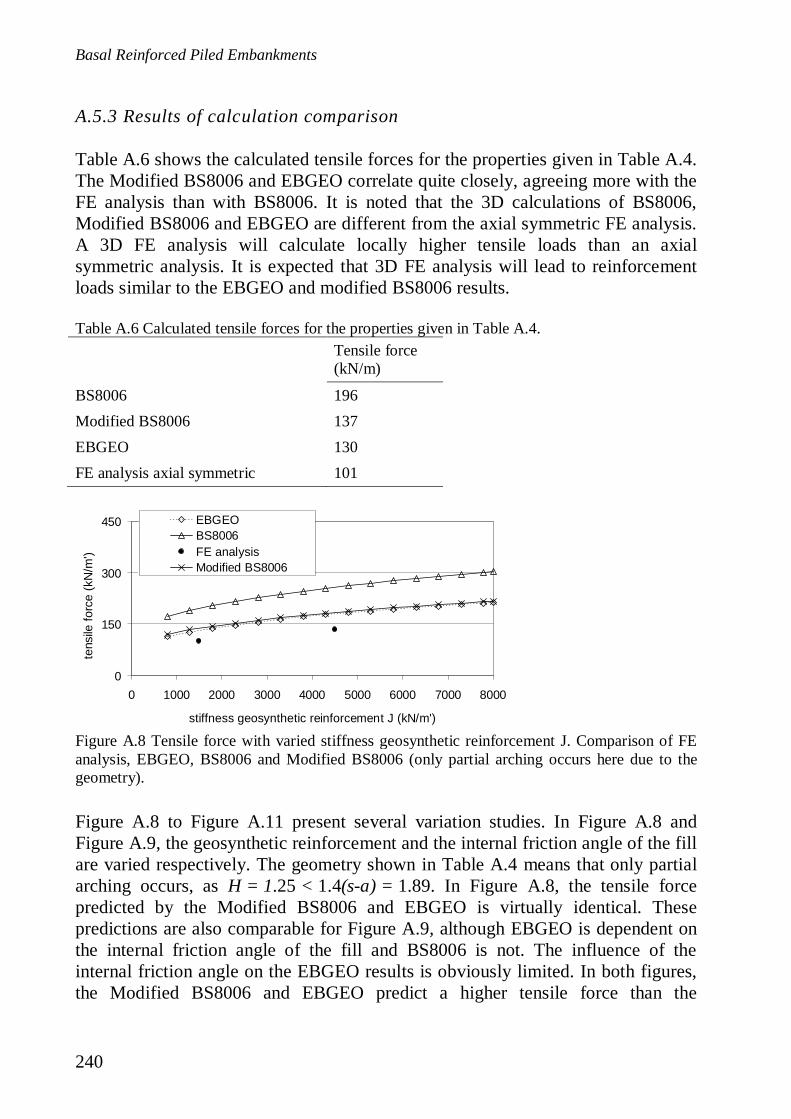
Basal Reinforced Piled Embankments
240
A.5.3 Results of calculation comparison
Table A.6 shows the calculated tensile forces for the properties given in Table A.4.The Modified BS8006 and EBGEO correlate quite closely, agreeing more with theFE analysis than with BS8006. It is noted that the 3D calculations of BS8006,Modified BS8006 and EBGEO are different from the axial symmetric FE analysis.A 3D FE analysis will calculate locally higher tensile loads than an axialsymmetric analysis. It is expected that 3D FE analysis will lead to reinforcementloads similar to the EBGEO and modified BS8006 results.
Table A.6 Calculated tensile forces for the properties given in Table A.4.Tensile force(kN/m)
BS8006 196Modified BS8006 137EBGEO 130FE analysis axial symmetric 101
Figure A.8 to Figure A.11 present several variation studies. In Figure A.8 andFigure A.9, the geosynthetic reinforcement and the internal friction angle of the fillare varied respectively. The geometry shown in Table A.4 means that only partialarching occurs, as H = 1.25 < 1.4(s-a) = 1.89. In Figure A.8, the tensile forcepredicted by the Modified BS8006 and EBGEO is virtually identical. Thesepredictions are also comparable for Figure A.9, although EBGEO is dependent onthe internal friction angle of the fill and BS8006 is not. The influence of theinternal friction angle on the EBGEO results is obviously limited. In both figures,the Modified BS8006 and EBGEO predict a higher tensile force than the
0
150
300
450
0 1000 2000 3000 4000 5000 6000 7000 8000
stiffness geosynthetic reinforcement J (kN/m')
tens
ilefo
rce
(kN
/m')
.
EBGEOBS8006FE analysisModified BS8006
Figure A.8 Tensile force with varied stiffness geosynthetic reinforcement J. Comparison of FEanalysis, EBGEO, BS8006 and Modified BS8006 (only partial arching occurs here due to thegeometry).
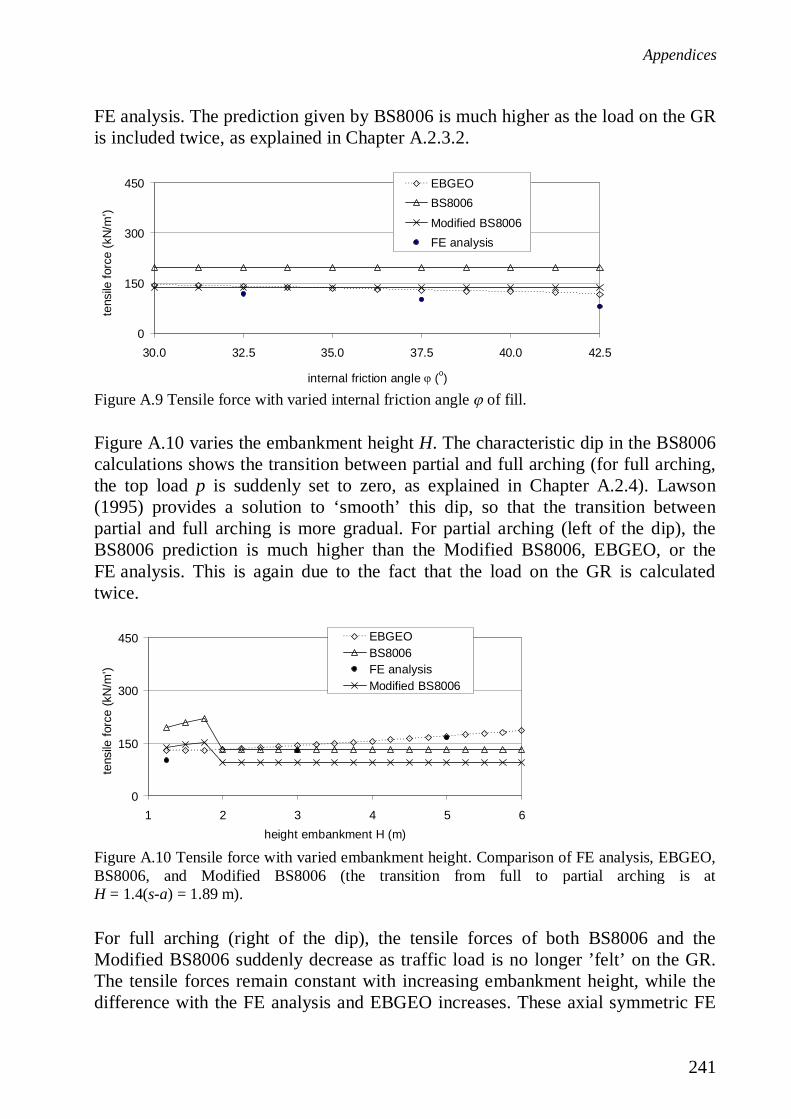
Appendices
241
FE analysis. The prediction given by BS8006 is much higher as the load on the GRis included twice, as explained in Chapter A.2.3.2.
Figure A.10 varies the embankment height H. The characteristic dip in the BS8006calculations shows the transition between partial and full arching (for full arching,the top load p is suddenly set to zero, as explained in Chapter A.2.4). Lawson(1995) provides a solution to ‘smooth’ this dip, so that the transition betweenpartial and full arching is more gradual. For partial arching (left of the dip), theBS8006 prediction is much higher than the Modified BS8006, EBGEO, or theFE analysis. This is again due to the fact that the load on the GR is calculatedtwice.
For full arching (right of the dip), the tensile forces of both BS8006 and theModified BS8006 suddenly decrease as traffic load is no longer ’felt’ on the GR.The tensile forces remain constant with increasing embankment height, while thedifference with the FE analysis and EBGEO increases. These axial symmetric FE
0
150
300
450
30.0 32.5 35.0 37.5 40.0 42.5
internal friction angle (o)
tens
ilefo
rce
(kN
/m')
.
EBGEOBS8006
Modified BS8006FE analysis
0
150
300
450
1 2 3 4 5 6height embankment H (m)
tens
ilefo
rce
(kN
/m')
.
EBGEOBS8006FE analysisModified BS8006
Figure A.9 Tensile force with varied internal friction angle of fill.
Figure A.10 Tensile force with varied embankment height. Comparison of FE analysis, EBGEO,BS8006, and Modified BS8006 (the transition from full to partial arching is atH = 1.4(s-a) = 1.89 m).
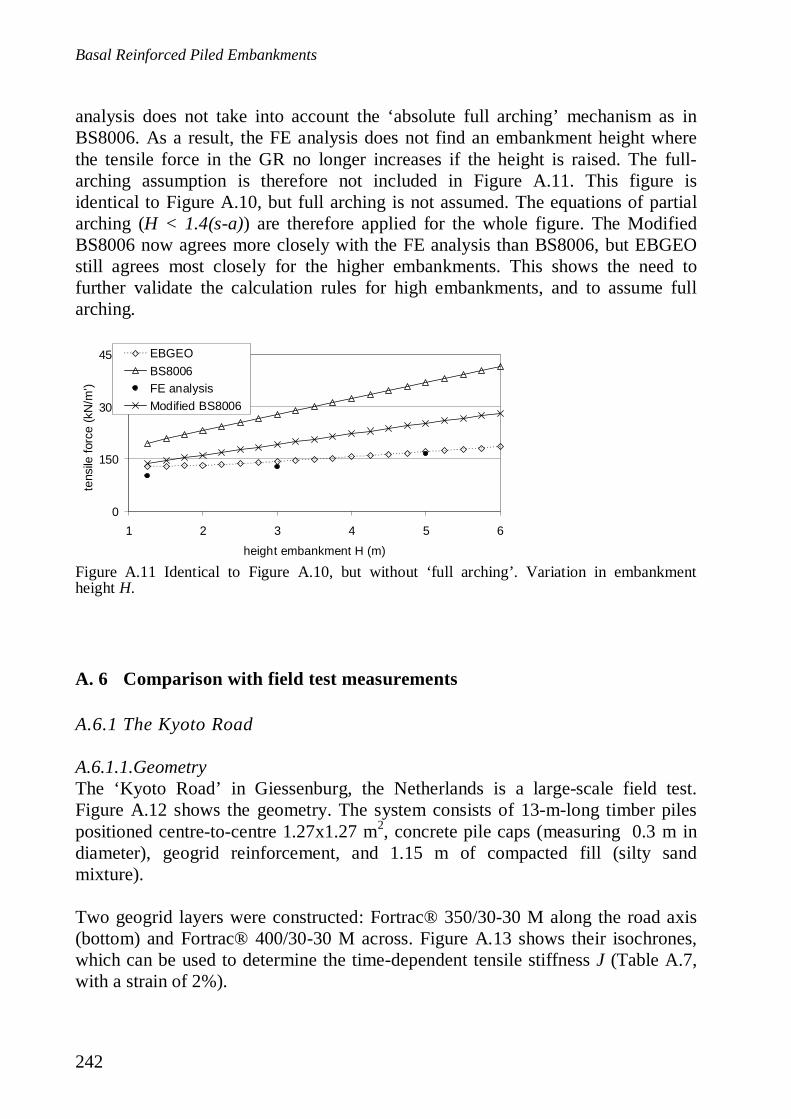
Basal Reinforced Piled Embankments
242
analysis does not take into account the ‘absolute full arching’ mechanism as inBS8006. As a result, the FE analysis does not find an embankment height wherethe tensile force in the GR no longer increases if the height is raised. The full-arching assumption is therefore not included in Figure A.11. This figure isidentical to Figure A.10, but full arching is not assumed. The equations of partialarching (H < 1.4(s-a)) are therefore applied for the whole figure. The ModifiedBS8006 now agrees more closely with the FE analysis than BS8006, but EBGEOstill agrees most closely for the higher embankments. This shows the need tofurther validate the calculation rules for high embankments, and to assume fullarching.
A. 6 Comparison with field test measurements
A.6.1 The Kyoto Road
A.6.1.1.GeometryThe ‘Kyoto Road’ in Giessenburg, the Netherlands is a large-scale field test.Figure A.12 shows the geometry. The system consists of 13-m-long timber pilespositioned centre-to-centre 1.27x1.27 m2, concrete pile caps (measuring 0.3 m indiameter), geogrid reinforcement, and 1.15 m of compacted fill (silty sandmixture).
Two geogrid layers were constructed: Fortrac® 350/30-30 M along the road axis(bottom) and Fortrac® 400/30-30 M across. Figure A.13 shows their isochrones,which can be used to determine the time-dependent tensile stiffness J (Table A.7,with a strain of 2%).
0
150
300
450
1 2 3 4 5 6height embankment H (m)
tens
ilefo
rce
(kN
/m')
.
EBGEOBS8006FE analysisModified BS8006
Figure A.11 Identical to Figure A.10, but without ‘full arching’. Variation in embankmentheight H.
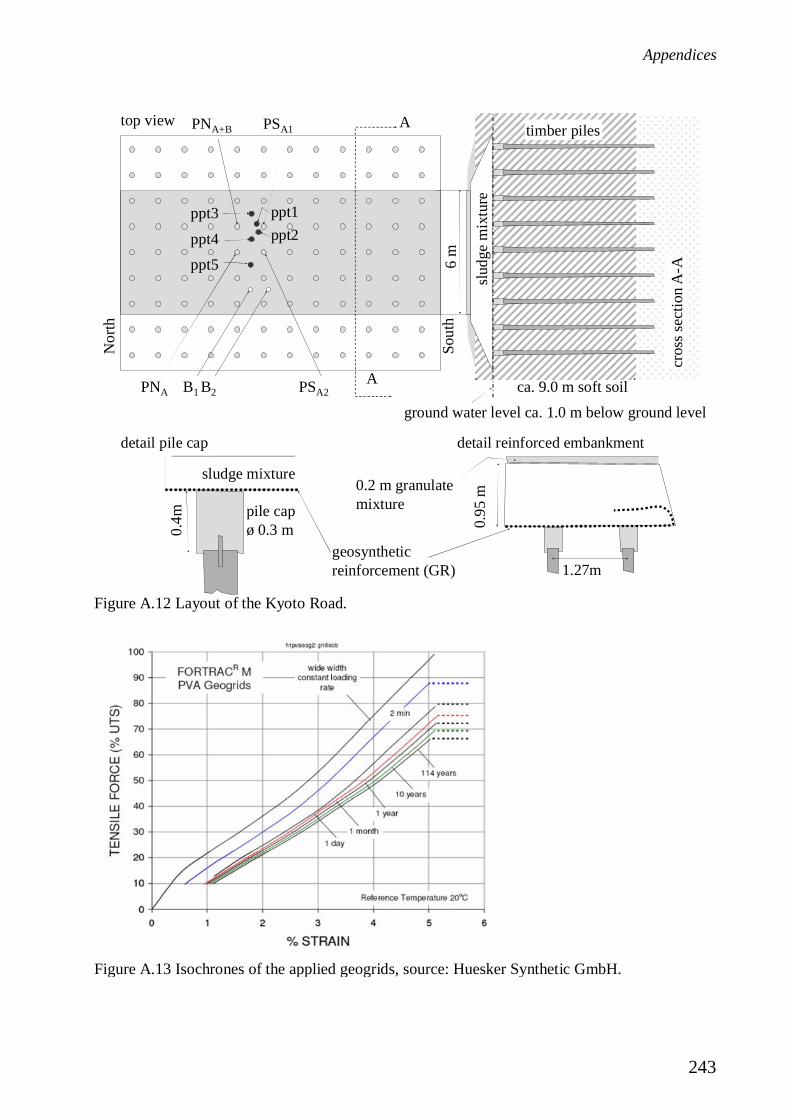
Appendices
243
Nor
th
B1 B2
PNA+B
PNA
PSA1
PSA2
Sout
h
ca.9msoftsoil
sludg
em
ixtu
re
timber piles
6m
ca. 9.0 m soft soil
A
A
ppt1ppt2
ppt3
ppt4ppt5
top view
cros
ssec
tion
A-A
ground water level ca. 1.0 m below ground level
geosyntheticreinforcement (GR)
0.2 m granulatemixture
1.27m
0.95
m
pile capø 0.3 m
sludge mixture
0.4m
detail pile cap detail reinforced embankment
Figure A.12 Layout of the Kyoto Road.
Figure A.13 Isochrones of the applied geogrids, source: Huesker Synthetic GmbH.
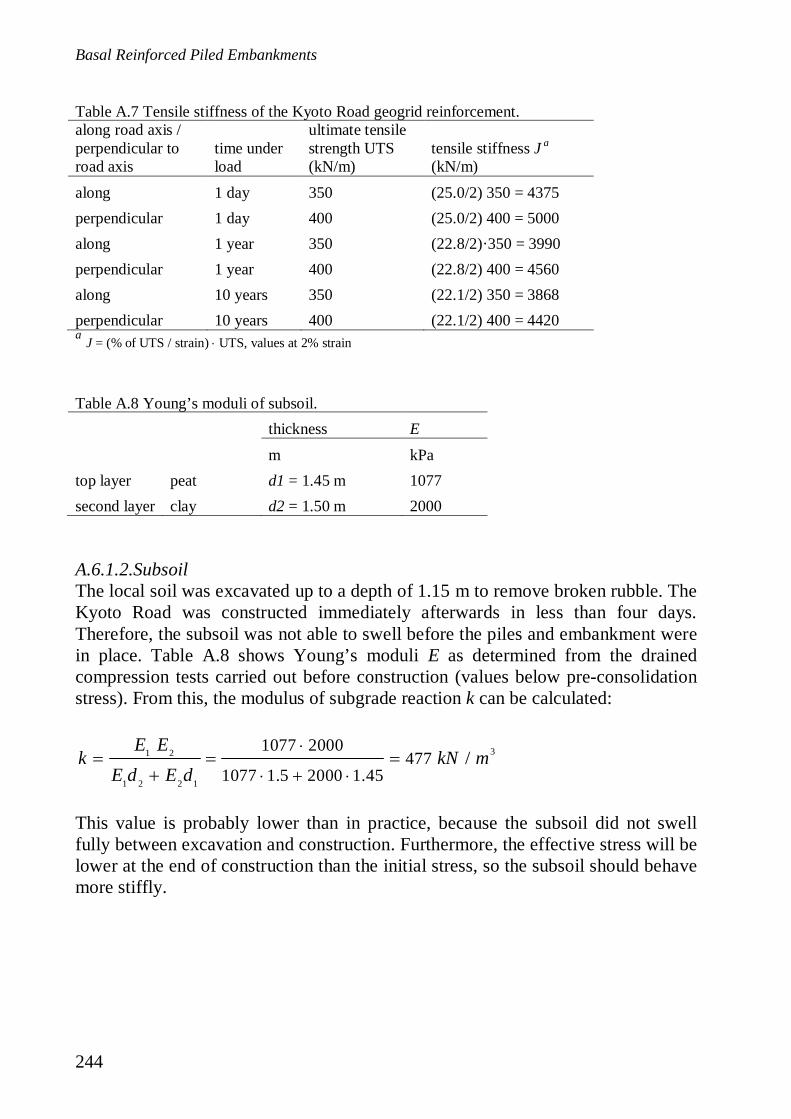
Basal Reinforced Piled Embankments
244
Table A.7 Tensile stiffness of the Kyoto Road geogrid reinforcement.along road axis /perpendicular toroad axis
time underload
ultimate tensilestrength UTS(kN/m)
tensile stiffness J a
(kN/m)along 1 day 350 (25.0/2) 350 = 4375perpendicular 1 day 400 (25.0/2) 400 = 5000along 1 year 350 (22.8/2)·350 = 3990perpendicular 1 year 400 (22.8/2) 400 = 4560along 10 years 350 (22.1/2) 350 = 3868perpendicular 10 years 400 (22.1/2) 400 = 4420a J = (% of UTS / strain) UTS, values at 2% strain
Table A.8 Young’s moduli of subsoil.thickness Em kPa
top layer peat d1 = 1.45 m 1077second layer clay d2 = 1.50 m 2000
A.6.1.2.SubsoilThe local soil was excavated up to a depth of 1.15 m to remove broken rubble. TheKyoto Road was constructed immediately afterwards in less than four days.Therefore, the subsoil was not able to swell before the piles and embankment werein place. Table A.8 shows Young’s moduli E as determined from the drainedcompression tests carried out before construction (values below pre-consolidationstress). From this, the modulus of subgrade reaction k can be calculated:
31 2
1 2 2 1
1077 2000477
1077 1.5 2000 1.45/
E Ek kN m
E d E d
This value is probably lower than in practice, because the subsoil did not swellfully between excavation and construction. Furthermore, the effective stress will belower at the end of construction than the initial stress, so the subsoil should behavemore stiffly.
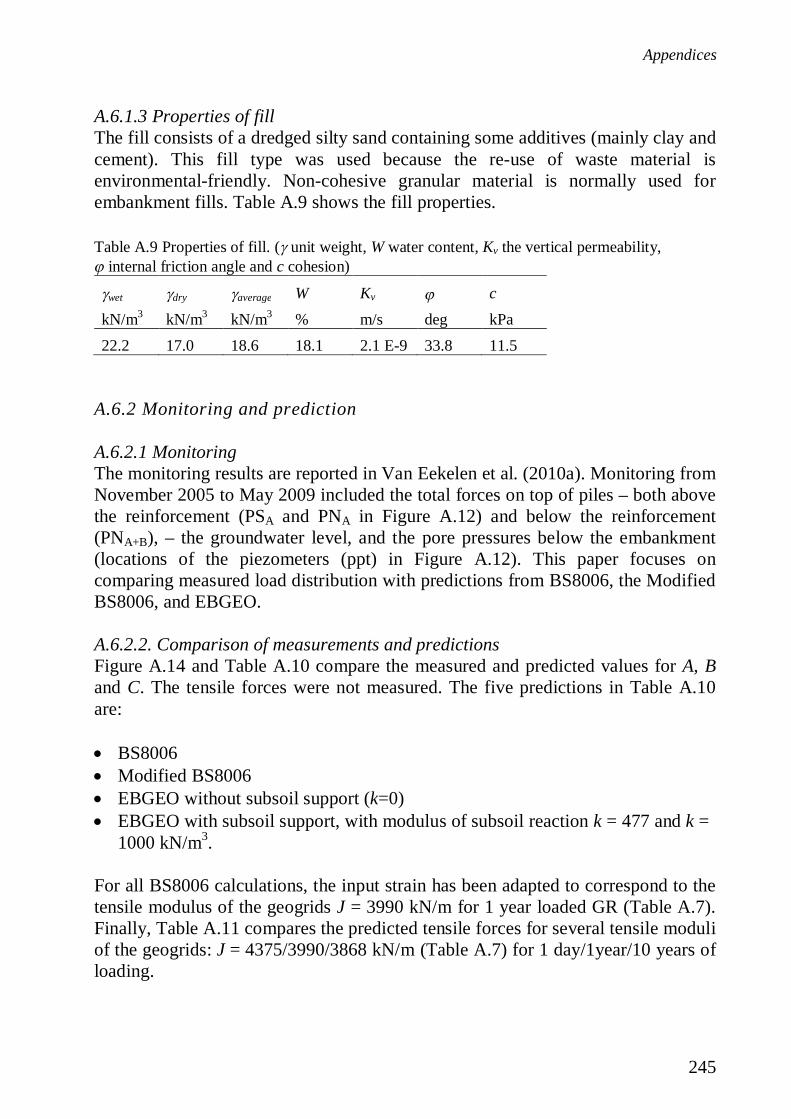
Appendices
245
A.6.1.3 Properties of fillThe fill consists of a dredged silty sand containing some additives (mainly clay andcement). This fill type was used because the re-use of waste material isenvironmental-friendly. Non-cohesive granular material is normally used forembankment fills. Table A.9 shows the fill properties.
Table A.9 Properties of fill. ( unit weight, W water content, Kv the vertical permeability, internal friction angle and c cohesion)
wet dry average W Kv ckN/m3 kN/m3 kN/m3 % m/s deg kPa22.2 17.0 18.6 18.1 2.1 E-9 33.8 11.5
A.6.2 Monitoring and prediction
A.6.2.1 MonitoringThe monitoring results are reported in Van Eekelen et al. (2010a). Monitoring fromNovember 2005 to May 2009 included the total forces on top of piles – both abovethe reinforcement (PSA and PNA in Figure A.12) and below the reinforcement(PNA+B), – the groundwater level, and the pore pressures below the embankment(locations of the piezometers (ppt) in Figure A.12). This paper focuses oncomparing measured load distribution with predictions from BS8006, the ModifiedBS8006, and EBGEO.
A.6.2.2. Comparison of measurements and predictionsFigure A.14 and Table A.10 compare the measured and predicted values for A, Band C. The tensile forces were not measured. The five predictions in Table A.10are:
BS8006Modified BS8006EBGEO without subsoil support (k=0)EBGEO with subsoil support, with modulus of subsoil reaction k = 477 and k =1000 kN/m3.
For all BS8006 calculations, the input strain has been adapted to correspond to thetensile modulus of the geogrids J = 3990 kN/m for 1 year loaded GR (Table A.7).Finally, Table A.11 compares the predicted tensile forces for several tensile moduliof the geogrids: J = 4375/3990/3868 kN/m (Table A.7) for 1 day/1year/10 years ofloading.

Basal Reinforced Piled Embankments
246
0
10
20
30
40
25-10-055-04-06
14-09-06
23-02-074-08-07
13-01-08
23-06-082-12-08
13-05-09
load
part
C(k
N)
.
arching
BS8006
EBGEO k=477kN/m3
measurements (total load - measured (A+B))
load on soft soil without piles
EBGEO k=1000kN/m3
0
10
20
30
40
50
25-10-055-04-06
14-09-0623-02-07
4-08-0713-01-08
23-06-082-12-08
13-05-09
load
part
B(k
N)
no arching, no soft soil supportModified BS8006
EBGEO without soft soil support (k=0)
EBGEO k =477kN/m3
measured B = (B+A)-A
EBGEO k =1000kN/m3
BS8006
0
5
10
25-10-055-04-06
14-09-06
23-02-074-08-07
13-01-08
23-06-082-12-08
13-05-09
load
part
A(k
N)
.
no arching
BS8006
EBGEO
arching
measured A
Figure A.14 Comparison measured and predicted A, B and C.
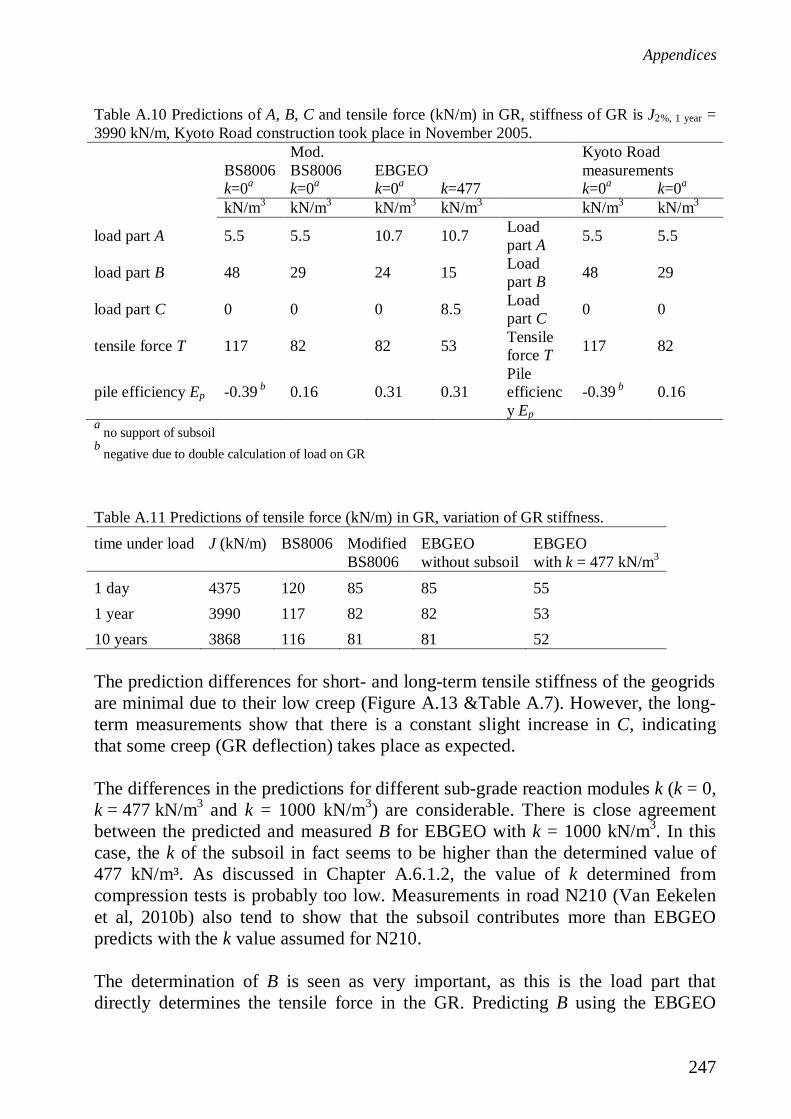
Appendices
247
Table A.10 Predictions of A, B, C and tensile force (kN/m) in GR, stiffness of GR is J2%, 1 year =3990 kN/m, Kyoto Road construction took place in November 2005.
BS8006Mod.BS8006 EBGEO
Kyoto Roadmeasurements
k=0a k=0a k=0a k=477 k=0a k=0a
kN/m3 kN/m3 kN/m3 kN/m3 kN/m3 kN/m3
load part A 5.5 5.5 10.7 10.7 Loadpart A 5.5 5.5
load part B 48 29 24 15 Loadpart B 48 29
load part C 0 0 0 8.5 Loadpart C 0 0
tensile force T 117 82 82 53 Tensileforce T 117 82
pile efficiency Ep -0.39 b 0.16 0.31 0.31Pileefficiency Ep
-0.39 b 0.16
a no support of subsoilb negative due to double calculation of load on GR
Table A.11 Predictions of tensile force (kN/m) in GR, variation of GR stiffness.time under load J (kN/m) BS8006 Modified
BS8006EBGEOwithout subsoil
EBGEOwith k = 477 kN/m3
1 day 4375 120 85 85 551 year 3990 117 82 82 5310 years 3868 116 81 81 52
The prediction differences for short- and long-term tensile stiffness of the geogridsare minimal due to their low creep (Figure A.13 &Table A.7). However, the long-term measurements show that there is a constant slight increase in C, indicatingthat some creep (GR deflection) takes place as expected.
The differences in the predictions for different sub-grade reaction modules k (k = 0,k = 477 kN/m3 and k = 1000 kN/m3) are considerable. There is close agreementbetween the predicted and measured B for EBGEO with k = 1000 kN/m3. In thiscase, the k of the subsoil in fact seems to be higher than the determined value of477 kN/m³. As discussed in Chapter A.6.1.2, the value of k determined fromcompression tests is probably too low. Measurements in road N210 (Van Eekelenet al, 2010b) also tend to show that the subsoil contributes more than EBGEOpredicts with the k value assumed for N210.
The determination of B is seen as very important, as this is the load part thatdirectly determines the tensile force in the GR. Predicting B using the EBGEO
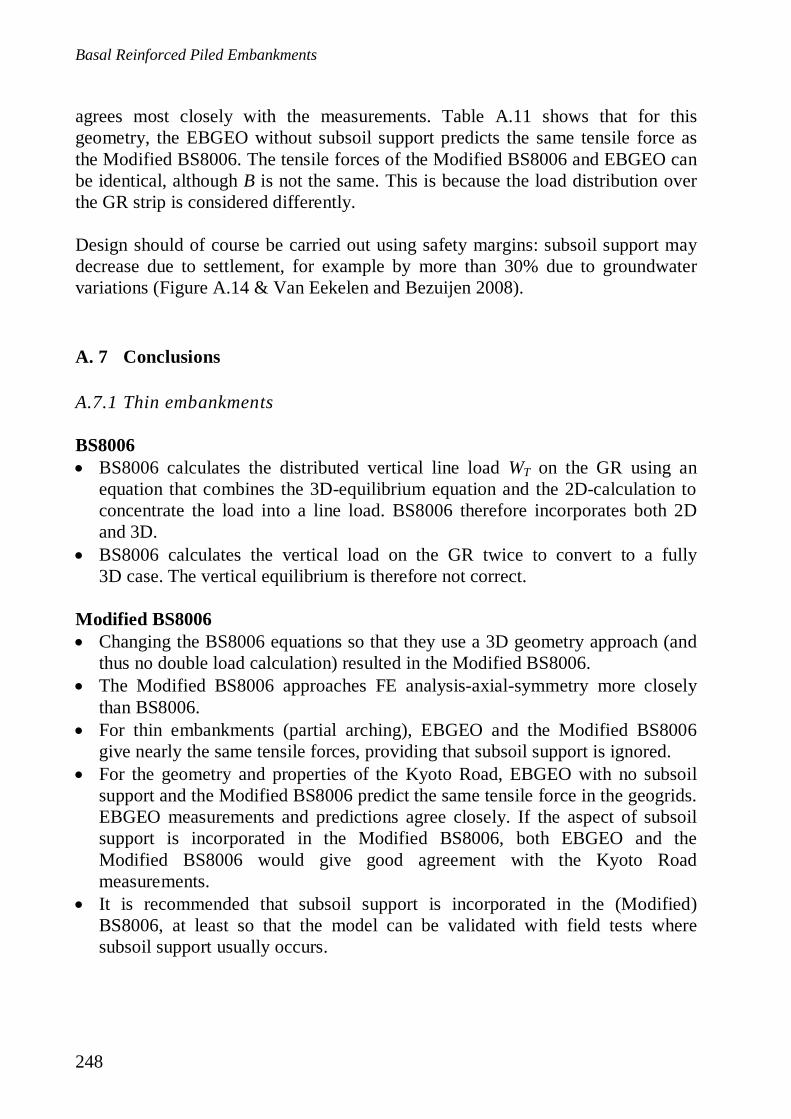
Basal Reinforced Piled Embankments
248
agrees most closely with the measurements. Table A.11 shows that for thisgeometry, the EBGEO without subsoil support predicts the same tensile force asthe Modified BS8006. The tensile forces of the Modified BS8006 and EBGEO canbe identical, although B is not the same. This is because the load distribution overthe GR strip is considered differently.
Design should of course be carried out using safety margins: subsoil support maydecrease due to settlement, for example by more than 30% due to groundwatervariations (Figure A.14 & Van Eekelen and Bezuijen 2008).
A. 7 Conclusions
A.7.1 Thin embankments
BS8006BS8006 calculates the distributed vertical line load WT on the GR using anequation that combines the 3D-equilibrium equation and the 2D-calculation toconcentrate the load into a line load. BS8006 therefore incorporates both 2Dand 3D.BS8006 calculates the vertical load on the GR twice to convert to a fully3D case. The vertical equilibrium is therefore not correct.
Modified BS8006Changing the BS8006 equations so that they use a 3D geometry approach (andthus no double load calculation) resulted in the Modified BS8006.The Modified BS8006 approaches FE analysis-axial-symmetry more closelythan BS8006.For thin embankments (partial arching), EBGEO and the Modified BS8006give nearly the same tensile forces, providing that subsoil support is ignored.For the geometry and properties of the Kyoto Road, EBGEO with no subsoilsupport and the Modified BS8006 predict the same tensile force in the geogrids.EBGEO measurements and predictions agree closely. If the aspect of subsoilsupport is incorporated in the Modified BS8006, both EBGEO and theModified BS8006 would give good agreement with the Kyoto Roadmeasurements.It is recommended that subsoil support is incorporated in the (Modified)BS8006, at least so that the model can be validated with field tests wheresubsoil support usually occurs.
Appendices
249
A.7.2 High embankments (full-arching theory)
For thick embankments (H > 1.4(s-a)), BS8006 assumes that full archingoccurs. The full-arching theory assumes that traffic load or extra soil weight dueto increased embankment height is not carried by the reinforcement. This extraload is simply ‘cut off’. This assumption is not confirmed by finite elementcalculations. Further validation of the full-arching theory is recommended, forexample using field measurements on thick embankments.Due to the elaboration of the full-arching assumptions, an increasingembankment height gives a dip in the predicted tensile force in thereinforcement if a calculation using a non-zero surcharge load is carried out.It is recommended that the behaviour of high embankments is further validatedbefore applying the Modified BS8006 for full arching (H > 1.4(s-a) or
22yx ssH ), as the Modified BS8006 with full arching gives lower predicted
tensile forces in the GR than BS8006.Elaboration of the full-arching assumption is too black-and-white to ensure asound prediction. The transition should be implemented more smoothly, asdescribed by Lawson (1995).
Appendix A.A Differential equation for step 4: from line load to tensile force
The tensile force is calculated from the line load WT.
A tension membrane is considered with a tensile force T, components TV and TH,and a load q(x) in kN/m. The equilibrium of a small particle is first considered witha length ds (projection on x-axis dx) given in Figure A.15.
From the horizontal equilibrium it follows:
0 0H H H HT T dT dT (A.41)From the vertical equilibrium it follows:
0 VV V V
dTT qdx pdx T dT q pdx
(A.42)
As the subsoil support is ignored in BS8006:
VdTqdx
(A.43)
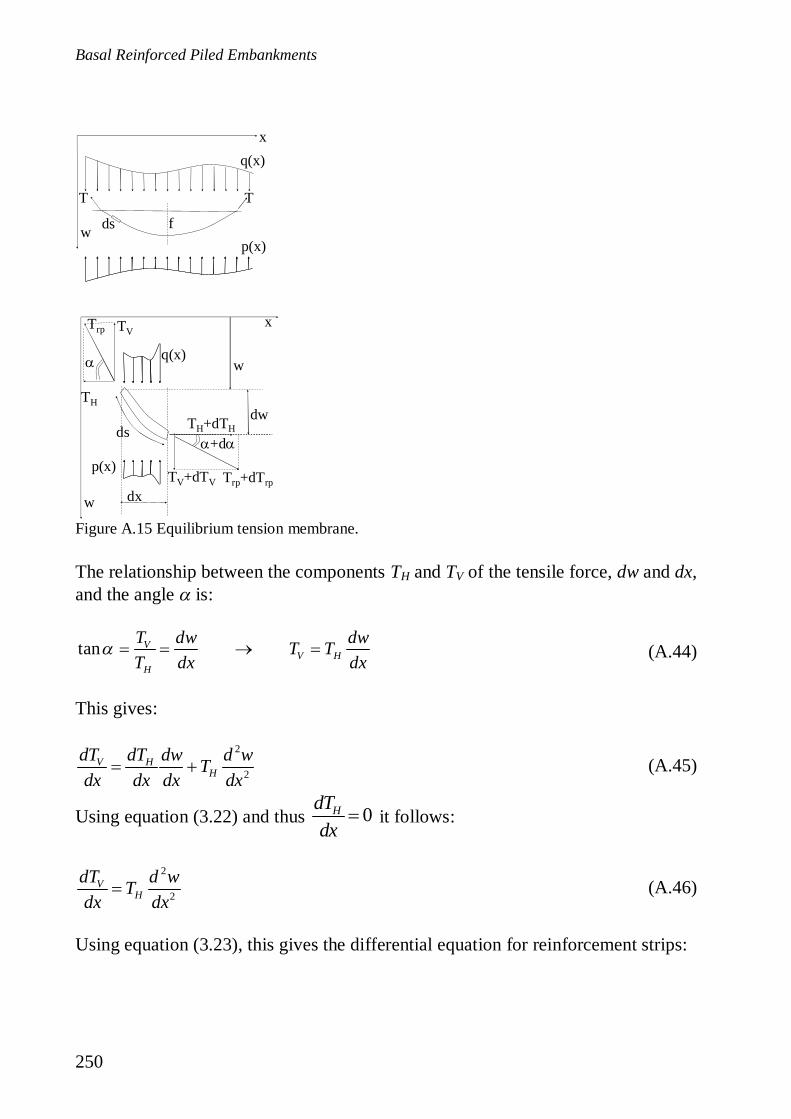
Basal Reinforced Piled Embankments
250
The relationship between the components TH and TV of the tensile force, dw and dx,and the angle is:
tan VV H
H
T dw dwT TT dx dx (A.44)
This gives:
2
2V H
HdT dT dw d wTdx dx dx dx
(A.45)
Using equation (3.22) and thus 0HdTdx
it follows:
2
2V
HdT d wTdx dx
(A.46)
Using equation (3.23), this gives the differential equation for reinforcement strips:
ds
TV+dTV
TH+dTH
Trp+dTrp
TV
TH
Trp
+d
dx
dw
x
w
w
w
q(x)
ds
TT
x
p(x)
q(x)
p(x)
f
Figure A.15 Equilibrium tension membrane.
Appendices
251
2
2H H
d w q pdx T T
(A.47)
For BS8006, with p = 0 it follows:
2
2H
d w qdx T
(A.48)
BS8006 assumes that q(x) is the equally-distributed load WT. Integrating equation(A.43) gives:
1V TT W x c (A.49)
And integration of equation (A.48) gives:
211 22H TT w W x c x c (A.50)
where c1 and c2 integration are constants. Two constraints give expressions forc1 and c2:
2
211 2
0 0 0
( ) 0 ( )T
x w c
x s a w c W s a(A.51)
Thus, using equations (A.49) and (A.50):
12
12
( )( )
V T T
T
H
T W x W s aW x s a xw
T(A.52)
The extremes are:
12
12
2
12
0 ( )( )
( )8
V T
V T
Textreme
H
x T W s ax s a T W s a
W s ax s a w f
T
(A.53)
or, the inverse of the last equation:
Basal Reinforced Piled Embankments
252
2
8T
HW s a
Tf
(A.54)
Bouma (1989) shows the relationship between the length of the undeformed andthe deformed GR strip:
228 3
3 8 ( )fl or f s a ls a
(A.55)
where:
f m Maximal deflection of the GR strip in between two pile capsl m Difference of GR strip length between the original length (s-a) and the
deformed length
The relationship between the (average) strain and l is given by:
l s a (A.56)
This gives:38
f s a (A.57)
When incorporated into equation (A.54) this gives:
24T
H
W s aT (A.58)
The tensile force T in the GR strip can now be calculated:
2 20 0 0
112 6
Tx V x H x
W s aT T T (A.59)
where Tx=0 is the total tensile force (in kN) in the geosynthetic reinforcement stripwith zero width. Dividing this by the width a of the GR strip finally gives thetensile force Trp,x=0 in the GR strip with width a kN/m:
( ) 112 6
Trp
W s aTa
(A.60)
Appendices
253
To summarise, this calculation is based on the following assumptions:
- there is no subsoil support- the line load WT is equally distributed- deformation is parabolic in shape- the GR strip is fixed at the corners of the pile caps- the tensile force is calculated at x = 0 and is therefore a maximum (and not an
average, as in the German Standard EBGEO).
In practice, equation (A.60) must be repeated. Here, the strain has the function ofan input parameter for calculating the tensile force Trp. This means that theapparent stiffness of the geosynthetic reinforcement can be calculated as:
rpTJ (A.61)
Appendix A.B. Different interpretations of BS8006 from literature
Introduction
Chapter A.2.3 showed that the BS8006 equations are based on 3D-equilibriumequations as well as 2D equations to concentrate the load on the GR strips. BS8006calculates the load on the GR twice. Several authors have interpreted BS8006 sothat it can be compared with other models. This appendix presents their views andcompares their work.The authors begin with the line load equations (A.13) and (A.17) and calculateback to p’r, B or the pile efficiency Ep = 1-B/wtot. The authors usually follow eithera 2D or a 3D interpretation of the 2D/3D-BS8006.These interpretations do not influence the final calculated tensile force, as thetensile force is calculated from the line load equations (A.13) or (A.17) and thetensile force equation (A.60). When comparing BS8006 with other models,however, it is important to realise that BS8006 is a 2D-3D combination, doublingthe load on the reinforcement and assuming full arching.
Assuming a 2D configurationFor example, Le Hello (2007) assumed a 2D configuration. Starting from equation(A.12) and assuming the configuration of Figure A.4a the author finds:
' Tr
Wps
(A.62)
Basal Reinforced Piled Embankments
254
Partial archingFor partial arching, the equation for the line load is given by equation (A.13).Combining this with equation (A.62) gives:
' Tr
Wp H p Xs
(A.63)
Continuing the assumption of a 2D configuration gives:
'rB s a p s a H p X (A.64)
and thus a pile efficiency Ep:
2 21 1 1ptot
s a H p X s a XBEw s H p s
(A.65)
Full archingFor full arching, the equation for the line load is given by equation (A.17).Combining this with equation (A.62) gives:
' 1.4Tr
Wp s a Xs
(A.66)
Continuing the assumption of a 2D configuration gives:
2' 1.4rB s a p s a X (A.67)
and thus a pile efficiency Ep:
2
21.4
1 1ptot
s a XBEw s H p
(A.68)
Abusharar et al (2009) also calculate the total load for determining the pileefficiency on the basis of 2D. This means that they use a total load s( H +p), thuss instead of s2. Throughout this paper, the pile efficiency is calculated using thecalculated B and the total load on one grid s·s, thus s2( H +p).Chen et al. (2008a) compared the results of 2D experiments with – among others –BS8006. However, Chen did not fully use BS8006, but instead used the original2D equation of Marston (equation (A.1))) when applying the arching coefficientsCc of BS8006 (equation (A.4)).
Appendices
255
Assuming a 3D configurationOther authors assume that BS8006 has determined its line load (equation (A.12) to(A.11)) using the 3D configuration shown in Figure A.6 (for example, see Loveand Milligan, 2003, Russell and Pierpoint, 1997, Stewart and Filz, 2005). TheGerman Standard EBGEO applies nearly the same configuration, except that thepile caps are circular. The authors assume that this tensile strip carries half the loadon one square s·s, giving:
2 2 23 : ' 2 ( ) ' Tr T r
WD p s a W s a ps a
(A.69)
Authors such as Love and Milligan (2003), Stewart (2005), and Russell andPierpoint (1997) arrive at this equation.
Partial archingFor partial arching, the equation for the line load is given by equation (A.13).Combining this with equation (A.69) gives:
22' Tr
s H pWp Xs a s a
(A.70)
This gives the following B (kN/pile):
2 22' 2 2( )
Tr r T
WB p A s a W s - a s H p s - a Xs a (A.71)
This in turn gives a pile efficiency Ep (kN/pile/kN/pile):
22 2
1 1 1ptot
H p s - a X s aBE Xw s H p s (A.72)
Basal Reinforced Piled Embankments
256
Full archingFor full arching, the equation for the line load is given by equation (A.17).Combining this with equation (A.69) gives:
2.823 : ' Tr
s s aWD p Xs a s a
(A.73)
Authors such as Love and Milligan (2003), Stewart (2005), and Russell and Pierpoint (1997)also arrived at this last equation. This gives the following B (kN/pile):
22 22' 2 2 8( )
Tr r T
WB p A s a W s - a . s s - a Xs a (A.74)
This in turn gives a pile efficiency Ep (kN/pile/kN/pile):
2 2
22.8 2.8
1 1 1ptot
s s - a X s - aBE Xw s H p s H p
(A.75)
Different interpretations from literature: a conclusionJones et al. (1990) developed the equations partly for a 3D configuration(equilibrium), and partly for a 2D configuration (line load determination).Some authors assume that the equations were developed on the basis of a fully 2Dconfiguration. Others assume that the equations were developed for a 3Dconfiguration. The 2D case results in different values for p’r, B and E, the 3D caseresults in the same values for p’r, B and E as found in the elaboration of BS8006(Chapter A. 2).
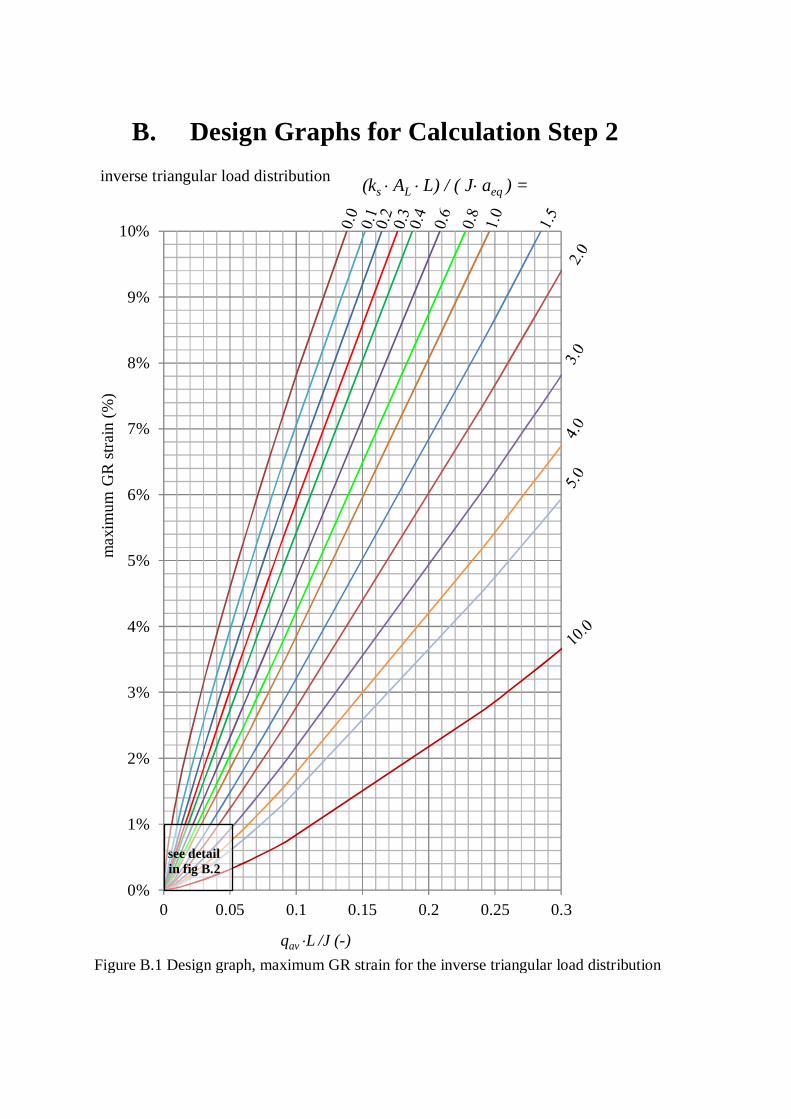
B. Design Graphs for Calculation Step 2
0%
1%
2%
3%
4%
5%
6%
7%
8%
9%
10%
0 0.05 0.1 0.15 0.2 0.25 0.3
max
imum
GR
strai
n(%
)
qav L /J (-)
inverse triangular load distribution
see detailin fig B.2
(ks AL L) / ( J aeq ) =
Figure B.1 Design graph, maximum GR strain for the inverse triangular load distribution
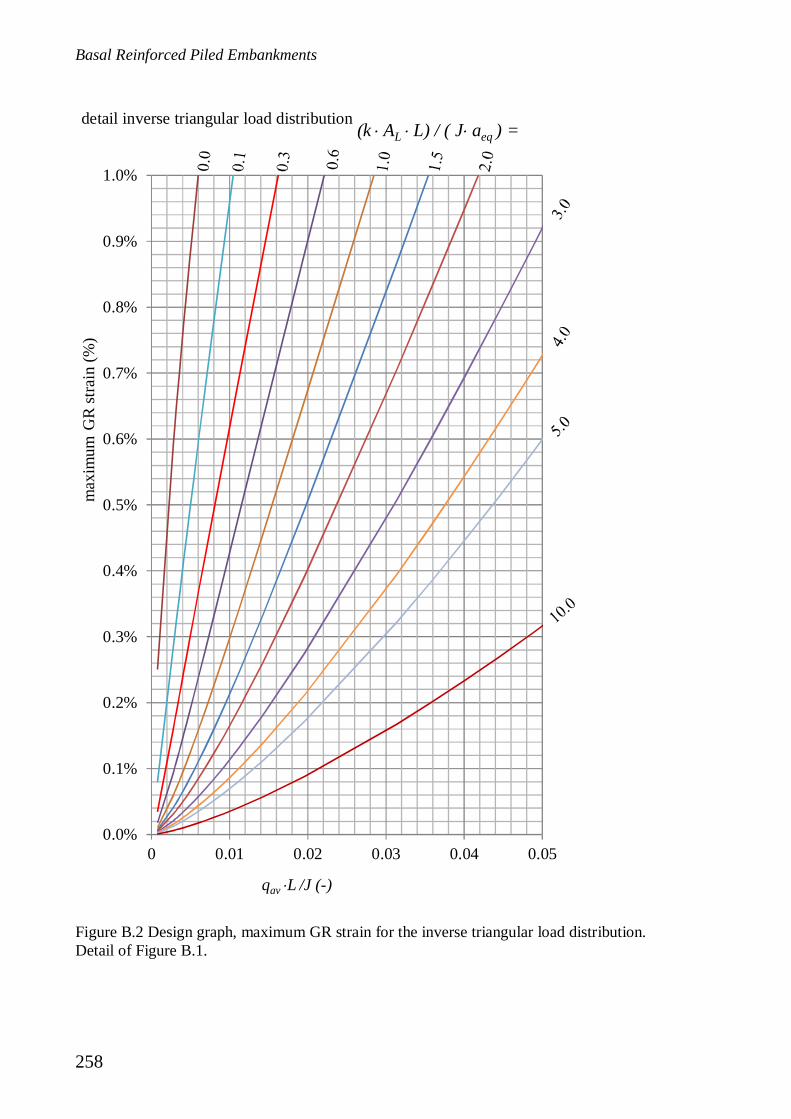
Basal Reinforced Piled Embankments
258
0.0%
0.1%
0.2%
0.3%
0.4%
0.5%
0.6%
0.7%
0.8%
0.9%
1.0%
0 0.01 0.02 0.03 0.04 0.05
max
imum
GR
stra
in(%
)
qav L /J (-)
detail inverse triangular load distribution(k AL L) / ( J aeq ) =
Figure B.2 Design graph, maximum GR strain for the inverse triangular load distribution.Detail of Figure B.1.

Appendices
259
0%
1%
2%
3%
4%
5%
6%
7%
8%
9%
10%
0 0.05 0.1 0.15 0.2 0.25 0.3
max
imum
GR
strai
n(%
)
qav L /J (-)
uniform load distribution
see detailin fig B.4
(k AL L) / ( J aeq ) =
Figure B.3 Design graph, maximum GR strain for the uniform load distribution.
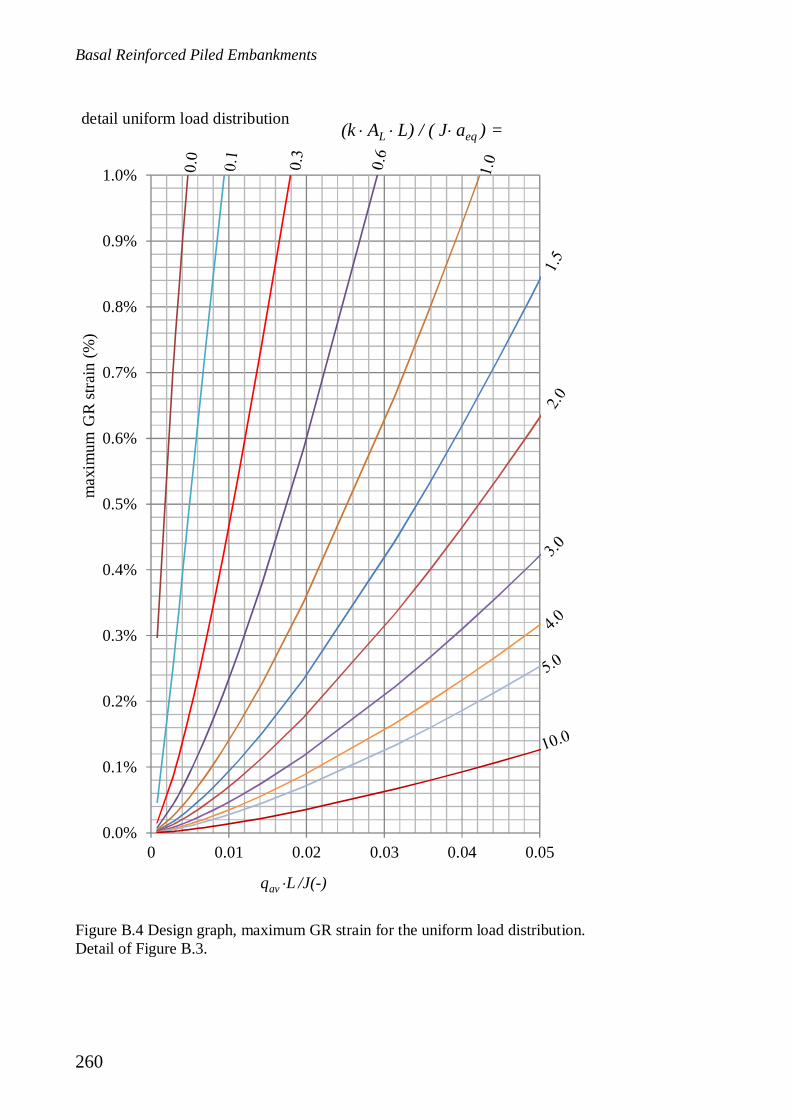
Basal Reinforced Piled Embankments
260
0.0%
0.1%
0.2%
0.3%
0.4%
0.5%
0.6%
0.7%
0.8%
0.9%
1.0%
0 0.01 0.02 0.03 0.04 0.05
max
imum
GR
strai
n(%
)
qav L /J(-)
detail uniform load distribution (k AL L) / ( J aeq ) =
Figure B.4 Design graph, maximum GR strain for the uniform load distribution.Detail of Figure B.3.

PublicationsAn overview of publications written within or along the research carried out for this study:
Peer reviewed journal papers
2015 Chapter 5 ofthis thesis
Van Eekelen, S.J.M., Bezuijen, A., van Tol, A.F., 2015a. Validationof analytical models for the design of basal reinforced piledembankments. Geotextiles and Geomembranes Volume 43, Issue 1,56 – 81.
2013 Chapter 4 ofthis thesis
Van Eekelen, S.J.M., Bezuijen, A., van Tol, A.F., 2013. An analyticalmodel for arching in piled embankments. Geotextiles andGeomembranes 39: 78 – 102.
2012 Chapter 2 ofthis thesis
Van Eekelen, S.J.M., Bezuijen, A., Lodder, H.J., van Tol, A.F.,2012a. Model experiments on piled embankments Part I. Geotextilesand Geomembranes 32: 69 - 81.
2012 Chapter 3 ofthis thesis
Van Eekelen, S.J.M., Bezuijen, A., Lodder, H.J., van Tol, A.F.,2012b. Model experiments on piled embankments. Part II.Geotextiles and Geomembranes 32: 82 - 94 including itscorrigendum: Van Eekelen, S.J.M., Bezuijen, A., Lodder, H.J., vanTol, A.F., 2012b2. Corrigendum to ‘Model experiments on piledembankments. Part II’ [Geotextiles and Geomembranes volume 32:82 - 94]. Geotextiles and Geomembranes 35: 119.
2011 Appendix Aof thisthesis
Eekelen, S.J.M., van, Bezuijen, A., and van Tol, A.F., 2011a,Analysis and modification of the British Standard BS8006 for thedesign of piled embankments, Geotextiles and Geomembranes 29:345-359.
Extended/peer-reviewed conference proceedings (>= 4 pages)2015 Van Eekelen, S.J.M., Bezuijen, A., van Tol, A.F., 2015b. Axial pile forces in
piled embankments, field measurements. In: Proceedings of ECSMGE 2015,Edinburgh.
2014 Van Eekelen, S.J.M., Bezuijen, A., 2014. Is 1+1=2? Results of 3D modelexperiments on piled embankments. In: Proceedings of 10ICG, Berlin,Germany, paper number 128.
2014 Bezuijen, A., van Eekelen, S.J.M., 2014. Basal reinforced piled embankments;Validation of inverse triangular load distribution with an extended Terzaghiequation. In: Proceedings of 10ICG, Berlin, Germany, paper number 201.
2014 Van Eekelen, S.J.M., Almeida, M.S.S, Bezuijen, A., 2014. European analyticalcalculations compared with a full-scale Brazilian piled embankment. In:Proceedings of 10ICG, Berlin, Germany, paper number 127.
2014 Van der Peet, T.C., van Eekelen, S.J.M., 2014. 3D numerical analysis of basalreinforced piled embankments. In: Proceedings of 10ICG, Berlin, Germany,paper number 112.
2013 Van Eekelen, S.J.M. and Bezuijen, A. 2013a. Equilibrium models for archingin basal reinforced piled embankments. In: Proceedings of 18th ICSMGE, Paris.1267 – 1270.
2013 Van Eekelen, S.J.M. and Bezuijen, A., 2013b. Dutch research on piledembankments, In: Proceedings of Geo-Congress, California, March 2013.
Basal Reinforced Piled Embankments
262
2012 Van Eekelen, S.J.M., Bezuijen, A., van Duijnen, P.G., 2012c. Does a piledembankment ‘feel’ the passage of a heavy truck? High frequency fieldmeasurements. In: Proceedings of the 5th European Geosynthetics CongressEuroGeo 5. Valencia. Digital version volume 5: 162-166.
2012 Van Eekelen, S.J.M., Bezuijen, A., 2012a. Inversed triangular load distributionin a piled embankment, 3D model experiments, field tests, numerical analysisand consequences. In: Proceedings of EuroGeo5, Valencia, Spain.
2012 Van Eekelen, S.J.M., Nancey, A., Bezuijen, A., 2012. Influence of fill materialand type of geosynthetic reinforcement in a piled embankment, modelexperiments. In: Proceedings of EuroGeo5, Valencia, Spain.
2012 Lodder, H.J., van Eekelen, S.J.M., Bezuijen, A. 2012. The influence of subsoilreaction in a basal reinforced piled embankment. In: Proceedings of EuroGeo5,Valencia, Spain.
2012 Van Eekelen, S.J.M., Bezuijen, A., 2012b. Model experiments on geosyntheticreinforced piled embankments, 3D test series. In: Proceedings of Eurofuge,Delft.
2012 Van Eekelen, S.J.M., Bezuijen, A. 2012c. Basal reinforced piled embankmentsin the Netherlands, Field studies and laboratory tests, In: Proceedings ISSMGE- TC 211 International Symposium on Ground Improvement IS-GI Brussels.
2011 Van Eekelen, S.J.M., Lodder, H.J., Bezuijen, A., 2011b. Load distribution onthe geosynthetic reinforcement within a piled embankment. In: Proceedings ofICSMGE 2011, Athens, 1137-1142.
2010 Van Eekelen, S.J.M., Jansen, H.L., van Duijnen, P.G., de Kant, M., van Dalen,J.H., Brugman, M.H.A., van der Stoel, A.E.C., Peters, M.G.J.M., 2010. TheDutch design guideline for piled embankments. In: Proceedings of 9ICG,Brazil 1911-1916.
2010 Van Duijnen, P.G., van Eekelen, S.J.M., van der Stoel, A.E.C., 2010.Monitoring of a Railway Piled Embankment. In: Proceedings of 9ICG, Brazil,1461-1464.
2010 Bezuijen, A., van Eekelen, S.J.M., van Duijnen, P.G., 2010. Piledembankments, influence of installation and type of loading. In: Proceedings of9ICG, Brazil, 1921-1924.
2010 Van Eekelen, S.J.M. and Bezuijen, A., Alexiew, D., 2010. The Kyoto roadpiled embankment: 31/2 years of measurements. In: Proceedings of 9ICG,Brazil, 1941-1944.
2010 Van Eekelen, S.J.M. and Venmans, A.A.M., Piled embankments in theNetherlands; how to decide, how to design?, New Techniques on Soft Soils, ed.Márcio Almeida, ISBN 978-85-7975-002-1, 157-166,
2009 Van Eekelen, S.J.M., Bezuijen, A., van Duijnen, P.G. and Jansen, P.G., 2009.Piled embankments using geosynthetic reinforcement in the Netherlands:design, monitoring & evaluation. In: Proceedings of the 17th ICSMGE inAlexandria, Egypt, M. Hamza et al. (Eds.), © 2009 IOS Press., 1690-1693.
Publications
263
Other publications
Dutch language journals2015 Van Eekelen, S.J.M., Bezuijen, A., van Tol, A.F., 2015. Paalmatrasonderzoek,
boog- en membraanwerking. GeoKunst, GeoTechniek, January 2015, 48-53.2012 Den Boogert, Th., van Duijnen, P.G., Peters, M., van Eekelen, S.J.M., 2012.
Paalmatrasproeven III, Eindige elementenberekeningen, GeoKunst,GeoTechniek, January 2012, 48-53.
2012 Van Eekelen, S.J.M., Bezuijen, A., van Duijnen, P.G., 2012. Wat voelt eenpaalmatras van een vrachtwagen? Veldmetingen te Woerden. Land + Water,June – July 2012.
2012 Van Eekelen, S.J.M., 2012. Nederlandse ontwerprichtlijn paalmatrassen geeftbetrouwbaar ontwerp, CT Civiele Techniek, no. 7, 34-36.
2011 Eekelen, S.J.M., van, Lodder, H.J., Bezuijen, A., 2011. Paalmatrasproeven I,Vervormingen van geokunststoffen in een paalmatras, en de daaruit volgendebelastingsverdeling, Geokunst, GeoTechniek, April 2011, 78-80.
2011 Van Eekelen, S.J.M., van der Vegt, J.W.G., Lodder, H.J., Bezuijen, A., 2011.Paalmatrasproeven II, belangrijkste conclusies, GeoKunst, GeoTechniek, July2011, 46-50.
2011 Van Eekelen, S.J.M., 2011. Paalmatrasproeven IIa. Eén laag biaxiaal of tweelagen uniaxiale wapening in een paalmatras, GeoKunst, GeoTechniek, juli2011, 51-52.
2011 Van Eekelen, S.J.M., 2011. Nederlandse ontwerpichtlijn paalmatrassen geeftbetrouwbaar ontwerp, 2011, CT Civiele Techniek, nummer 7, 34-36.
2010 Van Eekelen, S.J.M., 2010. Snel en onderhoudsarm bouwen metpaalmatrassen, GWW-Totaal, juni 2010.
2009 Van Eekelen, S.J.M., 2009. De Nederlandse CUR Ontwerprichtlijn voorPaalmatrassystemen, GeoTechniek, Thema-uitgave Geotechniekdag 2009, 14-18.
2009 Van Duijnen, P.G., van Eekelen, S.J.M., 2009. Eerste paalmatras onderspoorbaan in Nederland, overgangsconstructie zonder onderhoud? Geokunst,GeoTechniek, October 2009, 58-63.
English-language journals (not peer-reviewed)2014 Van Eekelen, S.J.M., Bezuijen, A., van Tol, A.F., 2014, Research on Basal
Reinforced Piled Embankments, Arching and Load-Deflection Behaviour, IGSNews, Vol. 30, No. 3, 14-18.
2014 Van der Peet, T.C., van Duijnen, P.G., van Eekelen, S.J.M., 2014. Validating anew design method for piled embankments with Plaxis 2D and 3D. Publishedin Plaxis Bulletin, Autumn issue 2014, 6 – 9.
2013 Van Eekelen, S.J.M., Bezuijen, A., 2013. A new equilibrium model for archingin basal reinforced piled embankments, Geotechniek Special ICSMGE,September 2013, 7-9.
2012 Van Eekelen, S.J.M., Bezuijen, A., 2012. Dutch Research on basal reinforcedpiled embankments, Geotechniek Special Ground Improvement, May/June2012, 12-17.
2012 (Den Boogert, Th., van Duijnen, P., van Eekelen, S.J.M., Numerical analysis ofgeosynthetic reinforced piled embankment scale model tests, Plaxis Bulletin,31, spring issue 2012, 12-16).

Basal Reinforced Piled Embankments
264
2009 Van Eekelen, Suzanne, The Dutch Design Guideline for Piled Embankments,IGS News, Vol. 25, No. 2, July 2009, page 23.
Syllabi2013 Van Eekelen, S.J.M., syllabus on basal reinforced piled embankments. Part of
the syllabus ‘Foundation engineering’ of the university of Ghent and thesyllabus “CIE4376 Embankments and Geosynthetics” of the Delft Universityof Technology, 30 pages.
2013 Van Eekelen, S.J.M., syllabus on basal reinforced piled embankments, 15pages, part of the syllabus of the Post-Academic PAO course “Realisatie bouwen infrastructuur op slappe bodem” (“Realisation of constructions andinfrastructure on soft soil”).
ReferencesAbusharar, S.W., Zeng, J.J., Chen, B.G., Yin, J.H., 2009. A simplified method for analysis of a
piled embankment reinforced with geosynthetics. Geotextiles and Geomembranes 27, 39-52.Almeida, M.S.S., Ehrlich, M., Spotti, A.P., Marques, M.E.S., 2007. Embankment supported on
piles with biaxial geogrids. Geotech. Eng., 160(4), 185-192.Almeida, M.S.S., Marques, M.E.S., Almeida, M.C.F., Mendonca, M.B., 2008. Performance on
two low piled embankments with geogrids at Rio de Janeiro. In: Proceedings of the First PanAmerican Geosynthetics Conference and Exhibition, Cancun, Mexico, 1285-1295.
ASIRI, 2012. Recommandations pour la conception, le dimensionnement, l'exécution et lecontrôle de l'amélioration des sols de fondation par inclusions rigides, ISBN: 978-2-85978-462-1.
Bezuijen, A., van Eekelen, S.J.M., van Duijnen, P.G., 2010. Piled embankments, influence ofinstallation and type of loading. In: Proceedings of the 9th International Conference onGeosynthetics, Brazil, 2010; 1921-1924.
Blanc, M., Rault, G., Thorel, L., Almeida, M., 2013. Centrifuge investigation of load transfermechanisms in a granular mattress above a rigid inclusions network. Geotextiles andGeomembranes 36: 92 - 105.
Blanc, M., Thorel, L., Girout, R., Almeida, M., 2014. Geosynthetic reinforcement of a granularload transfer platform above rigid inclusions; comparison between centrifuge testing andanalytical modelling. Geosynthetics International, Volume 21, Issue 1: 37-52.
Bouma, A.L., 1989. Mechanica van constructies, elasto-statica van slanke structuren, First ed.Delftse Uitgevers Maatschappij b.v. ISBN 90 6562 11.
BS1377, part 8: 1990. British Standard Methods of tests for Soils for civil engineering purposes,Part 8. Shear strength tests (effective stress). British Standards Institution, London
BS8006-1: 2010. Code of practice for strengthened/reinforced soils and other fills. BritishStandards Institution, ISBN 978-0-580-53842-1.
Briançon, L., Simon, B., 2012. Performance of Pile-Supported Embankment over Soft Soil: Full-Scale Experiment, J. Geotechn. Geoenviron. Eng. 2012.138:551-561.
Britton, E.J., Naughton, P.J., 2008. An experimental investigation of arching in piledembankments. In: Proceedings of the 4th European Geosynthetics Congress EuroGeo 4.Edinburgh. Paper number 106.
Britton, E.J., Naughton, P.J., 2010. An experimental study to determine the location of thecritical height in piled embankments. In: Proceedings of the 9th Conference on Geosynthetics,Brazil, 1961-1964.
Cain, W., 1916. Earth Pressure, Retaining Walls and Bins, New York, John Wiley and Sons. Inc.Carlsson, B., 1987. Reinforced soil, principles for calculation, Terratema AB, Linköping (in
Swedish).Casarin, C., 2011. private communication, São Paulo, Brazil.CEN EN ISO 10319:2008 Geosynthetics - Wide-width tensile test. NEN, Delft, Netherlands.Chen, Y.M., Cao, W.P., Chen, R.P., 2008a. An experimental investigation of soil arching within
basal reinforced and unreinforced piled embankments. Geotextiles and Geomembranes 26,164-174.
Chen, R.P., Chen, Y.M., Han, J., Xu, Z.Z., 2008b. A theoretical solution for pile-supportedembankments on soft soils under one-dimensional compression. Can. Geotech. J. 45, 611-623.
Collin, J.G., 2004. Column supported embankment design considerations. 52nd AnnualGeotechnical Engineering Conference- University of Minnesota.
Basal Reinforced Piled Embankments
266
Corbet, S.P., Horgan, G., 2010, Introduction to international codes for reinforced soil design.In: Proceedings of 9ICG, Brazil, pp. 225-231.
CUR 226, 2010. Ontwerprichtlijn paalmatrassystemen (Design Guideline Piled Embankments),ISBN 978-90-376-0518-1 (in Dutch).
CUR 226, 2015. Ontwerprichtlijn paalmatrassystemen (Design Guideline Piled Embankments),updated version (in Dutch).
Deb, K., 2010. A mathematical model to study the soil arching effect in stone column-supportedembankment resting on soft foundation soil. Applied Mathematical Modelling 34 (2010),3871-3883.
Deb, K. Mohapatra, S.R., 2013. Analysis of stone column-supported geosynthetic-reinforcedembankments, Applied Mathematical Modelling, Volume 37, Issue 5, 1 March 2013, 2943-2960.
Demerdash, M.A., 1996. An experimental study of piled embankments incorporatinggeosynthetic basal reinforcement. PhD Thesis, University of Newcastle upon Tyne, UK.
Den Boogert, T.J.M., 2011. Piled Embankments with Geosynthetic Reinforcement, NumericalAnalysis of Scale Model Tests. Master of Science thesis, Delft University of Technology.
Den Boogert, Th., van Duijnen, P.G., van Eekelen, S.J.M., 2012a. Numerical analysis ofgeosynthetic reinforced piled embankment scale model tests. Plaxis Bulletin 31, 12-17.
Den Boogert, Th., van Duijnen, P.G., Peters, M., van Eekelen, S.J.M., 2012b. PaalmatrasproevenIII, Eindige elementenberekeningen, GeoKunst, GeoTechniek, January 2012, 48-53.
EBGEO, 2010 (in German). Empfehlungen für den Entwurf und die Berechnung von Erdkörpernmit Bewehrungen aus Geokunststoffen e EBGEO, vol. 2. German Geotechnical Society,Auflage, ISBN 978-3-433-02950-3. Also available in English: Recommendations for Designand Analysis of Earth Structures using Geosynthetic Reinforcements EBGEO, 2011. ISBN978-3-433-02983-1 and digital in English ISBN 978-3-433-60093-1.
EC1990: NEN-EN 1990+A1+A1/C2 (nl), 2011. Basis of structural design, ICS 91.010.30;91.080.01, December 2011 (Eurocode 0).
Ellis, E., Aslam, R., 2009a. Arching in piled embankments. Comparison of centrifuge tests andpredictive methods, part 1 of 2. Ground Engineering, June 2009, 34-38.
Ellis, E., Aslam, R., 2009b. Arching in piled embankments. Comparison of centrifuge tests andpredictive methods, part 2 of 2. Ground Engineering, July 2009, 28-31.
Eski ar, T., Otani, J. and Hironaka, J., 2012. Visualization of soil arching on reinforcedembankment with rigid pile foundation using X-ray CT. Geotextiles and Geomembranes 32:44-54.
Farag, G.S.F., 2008. Lateral spreading in basal reinforced embankments supported by pile-likeelements. Schiftenreihe Getechnik, Heft 20, Universität Kassel, März 2008.
Filz, G.M. and Smith, M.E., 2008. Net Vertical Loads on Geosynthetic Reinforcement inColumn-Supported Embankments. Soil Improvement (GSP 172). Part of Geo-Denver 2007:New Peaks in Geotechnics. In: Proceedings of Sessions of Geo-Denver 2007.
Filz, G., Sloan, J., McGuire, M., Collin, J., Smith, M., 2012. Column-Supported Embankments:Settlement and Load Transfer. Geotechnical Engineering State of the Art and Practice: 54-77.doi: 10.1061/9780784412138.0003.
Filz, G., Sloan, J., 2013. Load Distribution on Geosynthetic Reinforcement in Column-Supported Embankments. In: Proceedings of Geo-Congress, California, 1829-1837.
Fischer, L. 1960. Theory and Practice of Shell Structures, Berlin: Wilhelm Ernst and Sohn. 541pages.
References
267
Forsman, J., Honkala, A., Smura, M., 1999. Hertsby case: a column stabilized and geotextilereinforced road embankment on soft subsoil. Dry mix method for deep soil stabilization,H. Bredenberg, G. Holm, and B. B. Broms, eds., Balkema, Rotterdam, The Netherlands, 263–268.
Forsman, J. 2001. Geovahvistetutkimus, koerakenteiden loppuraportti 1996–2001Georeinforcement-projcet, final report of test structures 1996–2001, Tiehallinto, Helsinki,Finland (in Finnish).
Guido, V.A., Kneuppel, Sweeney, M.A., 1987. Plate loading test on geogrid reinforced earthslabs. In: Proceedings Geosynthetics 87 Conference, New Orleans, 216–225.
Halvordson, K.A., Plaut, R.H., Filz, G.M., 2010. Analysis of geosynthetic reinforcement in pile-supported embankments. Part II: 3D cable-net model. Geosynthetics International 17 (2), 68 -76. ISSN: 1072-6349, E-ISSN: 1751-7613.
Han, J., Gabr, M.A., 2002. Numerical Analysis of Geosynthetic-Reinforced and Pile-SupportedEarth Platforms over Soft Soil, Journal of geotechnical and geoenvironmental engineering,January 2002; 44-53.
Han, J., Bhandari, A., Wang, F., 2012. DEM Analysis of Stresses and Deformations of Geogrid-Reinforced Embankments over Piles. Int. J. Geomech. 2012.12:340-350.
Handy, R. L., 1973. The Igloo and the Natural Bridge as Ultimate Structures, Arctic, Vol. 26,No. 4, 276-281.
Handy, R.L., 1985, The Arch in Soil Arching, Journal of Geotechnical Engineering, Vol. Ill, No.3, March, 1985. ©ASCE, ISSN 0733-9410/85/0003-0302/$01.00. Paper No. 19547.
Haring, W., Profittlich, M., Hangen, H., 2008. Reconstruction of the national road N210Bergambacht to Krimpen a.d. IJssel, NL: design approach, construction experiences andmeasurement results. In: Proceedings 4th European Geosynthetics Conference, September2008, Edinburgh, UK.
Heitz, C., 2006. Bodengewölbe unter ruhender und nichtruhender Belastung beiBerücksichtigung von Bewehrungseinlagen aus Geogittern. Schriftenreihe Geotechnik, UniKassel, Heft 19, November 2006 (in German).
Hewlett, W.J., Randolph, M.F., 1988. Analysis of piled embankments. Ground Engineering,April 1988, Volume 22, Number 3, 12-18.
Hong, W.P., Lee, J.H., Lee, K.W., 2007. Load transfer by soil arching in pile-supportedembankments. Soils and Foundations Vol. 47, No. 5, 833-843.
Hong, W.P., Lee, J., Hong, S., 2014. Full-scale Tests on embankments founded on piled beams.J. Geotech. Geoenviron. Eng. http://dx.doi.org/10.1061/(ASCE)GT.1943-5606.0001145.
Horgan, G.J., and Sarsby, R.W., 2002. The arching effect of soils over voids and pilesincorporating geosynthetic reinforcement. Geosynthetics, 7th ICG, Delmas, Gourc & Girard(eds) Swets & Zeitlinger, Lisse ISBN 90 5809 523 1, 373-378.
Huang, J., Han, j., Oztoprak, S., 2009. Coupled Mechanical and Hydraulic Modeling ofGeosynthetic-Reinforced Column-Supported Embankments. J. Geotech. Geoenviron. Eng.2009.135:1011-1021.
Jenck, O., Dias, D., Kastner, R., 2005, Soft ground improvement by vertical rigid piles two-dimensional physical modelling and comparison with current design models, Soils andFoundations, Vol. 45, No. 6, 15-30.
Jenck, O., Dias, D., and Kastner, R., 2009. Discrete element modelling of a granular platformsupported by piles in soft soil – Validation on a small scale model test and comparison to anumerical analysis in a continuum. Computers and Geotechnics 36: 917–927.
Jones, B.M., Plaut, R.H., Filz, G.M., 2010. Analysis of geosynthetic reinforcement in pile-supported embankments. Part I: 3D plate model. Geosynthetics International 17 (2), 59e67.ISSN: 1072-6349, E-ISSN: 1751-7613.
Basal Reinforced Piled Embankments
268
Jones, C.J.F.P., Lawson, C.R., Ayres, D.J., 1990. Geotextile reinforced piled embankments, in:Geotextiles, Geomembranes and Related Products, Den Hoedt (ed.), 1990, Balkema,Rotterdam, ISBN 90 6191 119 2, 155-160.
Kempfert, H.G., Zaeske, D., Alexiew, D., 1999. Interactions in reinforced bearing layers overpartial supported underground. In: Geotechnical Engineering for TransportationInfrastructure, Barends et al. (eds) © 1999 Balkema, Rotterdam, ISBN 90 5809 047 7.
Kempfert, H.G., Göbel, C., Alexiew, D., Heitz, C., 2004. German recommendations forreinforced embankments on pile-similar elements. In: Proceedings of EuroGeo 3, Munich,279-284.
Lally, D. and Naughton, P.J., 2012. An investigation of the arching mechanism in a geotechnicalcentrifuge. In: Proceedings 5th European Geosynthetics Congress. Valencia. Vol 5. 363-367.
Lawson, C.R., 1995. Basal reinforced embankment practice in the United Kingdom, The practiceof soil reinforcing in Europe. Thomas Telford. London. 173-194.
Le Hello, B., 2007. Renforcement par geosynthetiques des remblais sur inclusions rigides, étudeexpérimentale en vraie grandeur et analyse numérique. PhD thèses, l’université Grenoble I,(in French).
Le Hello, B., Villard, P., 2009. Embankments reinforced by piles and geosynthetics – Numericaland experimental studies with the transfer of load on the soil embankment. EngineeringGeology 106 (2009) 78 – 91.
Liikennevirasto, 2012. Geolujitetut maarakenteet, Tiegeotekniikan käsikirja, Liikennevirastonoppaita 2/2012, ISBN 978-952-255-104-7. Finnish design guideline for geosyntheticreinforcement (in Finnish).
Lodder, H.J., 2010. piled and reinforced embankments, Comparing scale model tests and theory.Master of Science thesis, Delft University of Technology.
Lodder, H.J., van Eekelen, S.J.M., Bezuijen, A., 2012. The influence of subsoil reaction in abasal reinforced piled embankment. In: Proceedings of Eurogeo5, Valencia. Volume 5.
Love, J. and Milligan, G., 2003. Design methods for basally reinforced pile-supportedembankments over soft ground, Ground Engineering., March 2003, 39-43.
Low, B.K., Tang, S.K., and Chao, V., 1994. Arching in piled embankments. J. of Geo. Eng.,ASCE, 120(11), 1917-1938.
Marston, A., Anderson, A.O., 1913. The Theory of Loads on Pipes in Ditches and Tests ofCement and Clay Drain Tile and Sewer Pipe, Bulletin No. 31, Engineering ExperimentStation.
McGuire, M.P., Filz, G.M., Almeida, M.S.S., 2009. Load-Displacement Compatibility Analysisof a Low-Height Column-Supported Embankment. In: Proceedings of IFCEE09, Florida, 225-232.
McGuire, M., Sloan, J., Collin, J., Filz, G., 2012. Critical Height of Column-SupportedEmbankments from Bench-Scale and Field-Scale Tests, ISSMGE - TC 211 InternationalSymposium on Ground Improvement IS-GI Brussels.
McKelvey, J.A., 1994, the Anatomy of Soil Arching, Geotextiles and Geomembranes 13 (1994)317-329.
Nadukuru, S.S., Michalowski, R.L., 2012. Arching in Distribution of active Load on RetainingWalls. J. Geotechn. Geoenviron. Eng., May 2012. 575-584.
Naughton, P., 2007. The Significance of Critical Height in the Design of Piled Embankments.Soil Improvement: 1-10. doi: 10.1061/40916(235)3.
Nordic guidelines for reinforced soils and fills (NGI), 2003. Revision A was published inFebruary 2004, and can be downloaded at www.sgf.net.
References
269
Nunez, M.A., Briançon, L., Dias, D., 2013. Analyses of a pile-supported embankment over softclay: Full-scale experiment, analytical and numerical approaches, Engineering Geology 153(2013) 53-67.
Oh, Y.I., Shin, E.C., 2007. Reinforced and arching effect of geogrid-reinforced and pile-supported embankment on marine soft ground. Marine Georesources and Geotechnology, 25,97-118.
Plaut, R.H., Filz, G.M., 2010. Analysis of geosynthetic reinforcement in pilesupportedembankments. Part III: axisymmetric model. Geosynthetics International 17 (2), 77-85. ISSN:1072-6349, E-ISSN: 1751-7613.
Public Work Research Center, 2000. Manual on Design and Execution of Reinforced SoilMethod with Use of Geotextiles, second ed. Public Work Research Center, 248-256 (inJapanese).
Rogbeck, Y., Gustavsson, S., Södergren, I. Lindquist, D., 1998. Reinforced Piled Embankmentsin Sweden - Design Aspects. In: Proceedings of the Sixth International Conference onGeosynthetics, 755-762.
Russell, D., Pierpoint, N., 1997. An assessment of design methods for piled embankments,Ground Engineering, November 1997, 39-44.
SINTEF, 2002. A computer program for designing reinforced embankments. In: Proceedings ofthe 7 ICG, Nice 2002, France, vol. 1, 201–204.
Sloan, J.A., 2011. Column-supported embankments: full-scale tests and designrecommendations. PhD thesis, Virginia Polytechnic Institute and State University,Blacksburg, VA.
Spotti, A.P., 2006. Monitoring results of a piled embankment with geogrids (in Portuguese). ScDThesis. COPPE/UFRJ, Rio de Janeiro, Brazil.
Stewart, M.E. and Filz, G., 2005. Influence of Clay Compressibility on Geosynthetic Loads inBridging Layers for Column-Supported Embankments. In: Proceedings of Geo-Frontiers2005, USA, GSP 131 Contemporary Issues in Foundation Engineering.
Svanø, G., Ilstad, T., Eiksund, G., Want, A., 2000. Alternative calculation principle for design ofpiled embankments with base reinforcement. In: Proceedings of the 4th GIGS in Helsinki.
Terzaghi, K., 1943. Theoretical Soil Mechanics. John Wiley and Sons, New York.Van der Peet, T.C., 2014. Arching in basal reinforced piled embankments, numerical validation
of the Concentric Arches model, MSc thesis, Delft University of Technology, Delft, theNetherlands.
Van der Peet, T.C., van Eekelen, S.J.M., 2014. 3D numerical analysis of basal reinforced piledembankments. In: Proceedings of IGS10, September 2014, Berlin, Germany. Paper no. 112.
Van der Stoel, A.E.C., Brok, C., De Lange, A.P., van Duijnen, P.G., 2010. Construction of thefirst railroad widening in the Netherlands on a Load Transfer Platform (LTP). In: Proceedingsof 9 ICG, Brazil, 1969-1972.
Van Duijnen, P.G., van Eekelen, S.J.M., van der Stoel, A.E.C., 2010. Monitoring of a RailwayPiled Embankment. In: Proceedings of 9 ICG, Brazil, 1461-1464.
Van Duijnen, P.G., 2014. Personal communication.Van Duijnen, P.G., Schweckendiek, T., Calle, E.O.F., van Eekelen, S.J.M., 2015. Calibration of
partial factors for basal reinforced piled embankments. In: Proceedings of ISGSR2015 Risks,Rotterdam.
Van Eekelen, S.J.M., Bezuijen, A. Oung, O., 2003. Arching in piled embankments; experimentsand design calculations. In: Proceedings of Foundations: Innovations, observations, designand practice, 885-894.
Basal Reinforced Piled Embankments
270
Van Eekelen, S.J.M., Van, M.A., Bezuijen, A., 2007. The Kyotoroad, a full-scale test.Measurements and calculations. In: Proceedings of ECSMGE 2007, Madrid, Spain, 1533-1538.
Van Eekelen, S.J.M. en Bezuijen, A., 2008. Considering the basic starting points of the design ofpiled embankments in the British Standard BS8006. In: Proceedings of EuroGeo4, papernumber 315, September 2008, Edinburgh, Scotland.
Van Eekelen, S.J.M., Jansen, H., 2008. Op weg naar een Nederlandse ontwerprichtlijn voorpaalmatrassen 1, Verslag van een casestudie, GeoKunst nr. 3, 2008 (in Dutch).
Van Eekelen, S.J.M., Bezuijen, A., Alexiew, D., 2010a. The Kyoto Road Piled Embankment:31/2 Years of Measurements. In: Proceedings of 9 ICG, Brazil, 1941-1944.
Van Eekelen, S.J.M., Jansen, H.L., van Duijnen, P.G., De Kant, M., van Dalen, J.H., Brugman,M.H.A., van der Stoel, A.E.C., Peters, M.G.J.M., 2010b. The Dutch design guideline for piledembankments. In: Proceedings of 9 ICG, Brazil, 1911-1916.
Van Eekelen, S.J.M.; Bezuijen, A., van Tol, A.F., 2011a. Analysis and modification of theBritish Standard BS8006 for the design of piled embankments. Geotextiles andGeomembranes 29: 345-359. Adopted in appendix A of this thesis.
Van Eekelen, S.J.M., Lodder, H.J., Bezuijen, A., 2011b. Load distribution on the geosyntheticreinforcement within a piled embankment, In: Proceedings of ICSMGE 2011, Athens, 1137-1142.
Van Eekelen, S.J.M., Bezuijen, A., Lodder, H.J., van Tol, A.F., 2012a. Model experiments onpiled embankments Part I. Geotextiles and Geomembranes 32: 69-81. Adopted in Chapter 2of this thesis.
Van Eekelen, S.J.M., Bezuijen, A., Lodder, H.J., van Tol, A.F., 2012b. Model experiments onpiled embankments. Part II. Geotextiles and Geomembranes 32: 82-94 including itscorrigendum: Van Eekelen, S.J.M., Bezuijen, A., Lodder, H.J., van Tol, A.F., 2012b2.Corrigendum to ‘Model experiments on piled embankments. Part II’ [Geotextiles andGeomembranes volume 32: 82-94]. Geotextiles and Geomembranes 35: 119. Adopted inChapter 3 of this thesis.
Van Eekelen, S.J.M., Bezuijen, A., van Duijnen, P.G., 2012c. Does a piled embankment ‘feel’the passage of a heavy truck? High frequency field measurements. In: Proceedings of the 5thEuropean Geosynthetics Congress EuroGeo 5. Valencia. Digital version volume 5: 162-166.
Van Eekelen, S.J.M., Bezuijen, A., 2012a. Inversed triangular load distribution in a piledembankment, 3D model experiments, field tests, numerical analysis and consequences.EuroGeo5, Valencia, Spain.
Van Eekelen, S.J.M., Bezuijen, A. 2012b. Model experiments on geosynthetic reinforced piledembankments, 3D test series. In: Proceedings of Eurofuge, Delft.
Van Eekelen, S.J.M., Bezuijen, A. 2012c. Basal reinforced piled embankments in theNetherlands, Field studies and laboratory tests, ISSMGE - TC 211 International Symposiumon Ground Improvement IS-GI Brussels.
Van Eekelen, S.J.M., Bezuijen, A. van Tol, A.F., 2013. An analytical model for arching in piledembankments. Geotextiles and Geomembranes 39: 78-102. Adopted in Chapter 4 of thisthesis.
Van Eekelen, S.J.M. and Bezuijen, A. 2013a. Equilibrium models for arching in basal reinforcedpiled embankments. In: Proceedings of 18th ICSMGE, Paris. 1267 – 1270.
Van Eekelen, S.J.M., Bezuijen, A., 2013b, Dutch research on piled embankments. In:Proceedings of Geo-Congress, California, March 2013, 1838-1847.
Van Eekelen, S.J.M., Almeida, M.S.S., Bezuijen, A., 2014. European analytical calculationscompared with a full-scale Brazilian piled embankment. In: Proceedings of 10ICG, Berlin,Germany. Paper no. 127.
References
271
Van Eekelen, S.J.M., Bezuijen, A., 2014. Is 1 + 1 = 2? Results of 3D model experiments on piledembankments. In: Proceedings of 10ICG, Berlin, Germany. Paper no. 128.
Van Eekelen, S.J.M., Bezuijen, A. van Tol, A.F., 2015a. Validation of analytical models for thedesign of basal reinforced piled embankments. Geotextiles and Geomembranes. Volume 43,Issue 1, 56 - 81. Adopted in Chapter 5 of this thesis.
Van Eekelen, S.J.M., Bezuijen, A., van Tol, A.F., 2015b. Axial pile forces in piledembankments, field measurements. In: Proceedings of XVI ECSMGE, Edinburgh.
Van Niekerk, A.A., Molenaar, A.A.A., Houben, L.J.M., 2002. Effect of Material Quality andCompaction on the Mechanical Behaviour of Base Course Materials and PavementPerformance. In: Proceedings of the 6th international conference on the bearing capacity ofroads and airfields, Lisbon, Portugal, June 2002: 1071-179. Swets and Zeitlinger BV.
Vermeer, P.A., Punlor, A., Ruse, N., 2001. Arching effects behind a soldier pile wall. Computersand Geotechnics 28 (2001) 379–396.
Vollmert, L., Kahl, M., Giegerich, G., Meyer, N., 2007. In-situ verification of an extendedcalculation method for geogrid reinforced load distribution platforms on piled foundations. In:Proceedings of ECSGE 2007, Madrid, Volume 3, 1573 - 1578.
Vollmert, L., 2014. Personal communication.Völlmy, A., 1937. Eingebettete Rohre, Mitt. Inst. Baustatik, Eidgen. Tech. Hochschule, Zürich,
Mitt. no. 9.Weihrauch, S., Oehrlein, S., Vollmert, L., 2010. Baugrundverbesserungsmassnahmen in der
HafenCity Hamburg am Beispiel des Stellvertreterprojektes Hongkongstrasse. Bautechnik.Volume 87, issue 10: 655-659 (in German).
Weihrauch, S., Oehrlein, S., Vollmert, L., 2013. Subgrade improvement measures fort the mainrescue roads in the urban redevelopment area HafenCity in Hamburg. In: Proceedings of 18thICSMGE, Paris.
Zaeske, D., 2001. Zur Wirkungsweise von unbewehrten und bewehrten mineralischenTragschichten über pfahlartigen Gründungselementen. Schriftenreihe Geotechnik, Uni Kassel,Heft 10, February 2001 (in German).
Zhang, L., Zhao, M., Hu, Y., Zhao, H., Chen, B., 2012. Semi-analytical solutions forgeosynthetic-reinforced and pile-supported embankment, Computers and Geotechnics,Volume 44, June 2012, 167-175, ISSN 0266-352X, 10.1016/j.compgeo.2012.04.001.
Zhuang, Y., Wang, K.Y., Liu, H.L., 2014. A simplified model to analyze the reinforced piledembankments, Geotextiles and Geomembranes, Volume 42, Issue 2, April 2014, 154-165.


Curriculum VitaeSuzanne van Eekelen was born on 28 April 1966 inNottingham, Great Britain, to Dutch parents, beforemoving to the Netherlands at the age of one. Sheobtained her secondary education diploma from theLodewijk Makeblijde College in Rijswijk, SouthHolland, in 1984. In 1991, she completed her Master’sdegree at the Civil Engineering Department of DelftUniversity of Technology with her thesis entitledNumerical modelling of soil sampling. She thenembarked on her professional career with DelftGeotechnics, which later changed its name toGeoDelft before becoming part of Deltares. Suzannecompleted this doctorate at Deltares and DelftUniversity of Technology.
Suzanne van Eekelen is now a researcher in geotechnical engineering and anexpert in the field of geosynthetic reinforcement, in particular piled embankments.She has reviewed or advised many piled embankment projects and she specialisesin laboratory experiments and field monitoring. She has developed an analyticalmodel for the design of basal reinforced piled embankments. This model, which ispresented in this thesis, was adopted in the 2015 update of the Dutch CUR226guideline for basal reinforced piled embankments.
In the past, Suzanne has engaged in research on constitutive modelling, developedthe Delft Egg model for clay behaviour and later included creep behaviour in theDelft Soft Soil model. She has conducted numerical analyses of large deformationsin soil, sample disturbance, granular flow under gravity, and shield tunnelling. Shehas led research on upgrading dikes with short sheet piling and been involved in amulti-disciplinary project on the IJssel Lake in the Netherlands.
Suzanne is the author or co-author of 10 international journal papers andapproximately 100 proceedings papers and other publications. She has taught andlectured on several courses and multiple conferences, including courses at DelftUniversity of Technology, Ghent University, PAO Netherlands and conferencessuch as the Dutch and Belgium Geotechnics Day (2009, 2012), the BrazilianWorkshop Geosintéticos (2011), the Finnish Soil reinforcement workshop (2011)and several national and international conferences and courses of the IGS andISSMGE.

Basal Reinforced Piled Embankments
274
Suzanne chairs several committees: since 2005, the Dutch CUR226 Committee forthe Dutch Guideline for piled embankments; since 2013, the Dutch CUR198Committee that updates the design guideline for retaining structures of reinforcedsoil and, since 2011, the Committee for Innovation and Knowledge transfer of theDutch Chapter of the International Geosynthetics Society.
Suzanne has received several awards for her doctorate study:- the IGS award 2014 for her research on piled embankments described in the
journal papers included in this thesis (Van Eekelen et al., 2011, 2012a,2012b, 2013, 2015a);
- the award for the best paper in Geotextiles and Geomembranes in 2012 forVan Eekelen et al., 2012a (Chapter 2 of this thesis);
- an Honourable Mention as one of the four best papers in Geotextiles andGeomembranes in 2011 for Van Eekelen et al., 2011a (included in theappendix to this thesis);
- for the same paper: the 2011 Keverling Buisman Award.
Suzanne is married to Maarten Vos. They have two sons and a daughter:Gerrit (1995), Roel (1997) and Ida (1999).
Linkedin: nl.linkedin.com/in/suzannevaneekelenPublications on Google Scholar:http://scholar.google.nl/citations?user=lrmZe_EAAAAJ&hl=nlPublications on Scopus:http://www.scopus.com/authid/detail.url?authorId=6507209956
www.paalmatrassen.nlwww.piledembankments.comSuzanne.vanEekelen@deltares.nl


![Concentric Arches Model Validation with Embankment on soft ... · Load transfer in Geosynthetic reinforced piled supported embankments [Source: (7)] 1.2 DIFFERENT DESIGN CODES AVAILABLE](https://img.pdfslide.us/doc/110x75/60631c9d554bbd5a483f2844/concentric-arches-model-validation-with-embankment-on-soft-load-transfer-in.jpg)