Embed Size (px)
DESCRIPTION
FORCE did an Impact Analysis of the Rainwater Harvesting that had been done in a locality of New Delhi, India - Alakanada. The study proves that rainwater harvesting is useful and adds value not just in terms of water but in other ways too.
Citation preview
December 2010
For
Impact Assessment of Rainwater Harvesting (A case study of Alakananda, New Delhi)
Report by:
FORCE
With Support from
Sh Shubh Sharada: RWA Member, Mandakini Enclave
Under the guidance of:
Mr. RC Sharma – Scientist, Central Groundwater Board (Retd)
Jyoti Sharma – President, FORCE
STUDY REPORT
F O R C E
Forum for Organised Resource Conservation and Enhancement
For more information on FORCE visit our website: www.force.org.in
FORCE–C-8/8035, Vasant Kunj, New Delhi–110070.T: 11 46018754 M: 9899812888 email [email protected]

PREFACE
Rainwater Harvesting is now widely acknowledged as a simple, effective
method of augmenting local water reserves. 10 states in India have
already made rainwater harvesting mandatory for all new buildings. Many
more are expected to follow suit. The central government has announced
several schemes to support rainwater harvesting and has also included it
in the list of approved activities for several existing schemes.
And yet, the skeptics continue to doubt its efficacy. Myths abound about its
inefficiency, unsuitability to some terrain types and damage to buildings
etc.
FORCE has been actively propagating the adoption of rainwater harvesting
by communities because it is the cheapest, most effective method of
increasing local water reserves. Through our awareness programs, we
have tried to address all these doubts about Rainwater Harvesting, yet
much more needs to be done.
We have been working with the Residents Welfare Associations of
Alakananda to help them adopt / maintain rainwater harvesting for the
past few years. In our interactions with them, both on formal public
platforms and in informal meetings, they have been sharing very positive
stories about the increase in the yield of their tubewells, dried up
tubewells that have started yielding water, measured rise in water table
etc.
This Study was done to check the validity of those claims. Also, we hoped
that, if validated, these results would lay to rest some of the doubts raised
about the efficacy of rainwater harvesting.
The study was conducted by FORCE with a team of students of reputed
universities – TERI University and University of Pennsylvania (USA) under
the guidance of a Scientist (Retd) from Central Groundwater Board and
with support from the Residents Welfare Associations of Alakananda
notably Mandakini Enclave RWA.
We are thankful to the students and advisors who helped give shape to this
study. We hope that this study will prove what we have been observing all
along – that rainwater harvesting is an effective, efficient way of recharge
to groundwater.
TABLE OF CONTENTS
S.NO. TOPIC PAGE
SECTION 1
1.1. INTRODUCTION
About Water Supply in Delhi
The Role of Groundwater in Delhi’s Water Supply
1.2 BACKGROUND INFORMATION
Groundwater Status and Trends in Delhi
Typical contaminants in groundwater & their effect
About Rainwater Harvesting
SECTION 2
2.1 OBJECTIVES OF THE STUDY 17
2.2 GEOGRAPHICAL SCOPE OF THE STUDY
2.3 METHODOLOGY
Data Collection
Limitations of the study
SECTION 3
3.1 DETAILS OF STUDY AREA
3.2
Hydrometreological conditions
Hydrological details
SECTION 4
4.1 FINDINGS & CONCLUSIONS
Rainwater Harvesting status in Alakananda
Groundwater draft as compared to RWH
Groundwater status
Community Observations of water level
Pre & Post Monsoon 2010 Water Level
Pre & Post Monsoon 2010 Water Quality
Contribution of Aquifer Characteristics impact
Financial Implications and benefits of rainwater harvesting
Social Impact of RWH in Alakananda
SECTION 5
5.1 CASE STUDY – MANADKINI ENCLAVE, ALAKANANDA
SECTION 6
6.1 RECOMMENDATIONS

SECTION 1 1.1 INTRODUCTION
About Water Supply in Delhi
Present Water Demand and Supply
In Delhi, the civic body responsible for the provision of water is Delhi Jal Board (DJB). The
norms set by DJB call for the supply of a total of 225 LPCD. If these norms are applied to
the dual water supply system, this would mean that the water would be supplied as follows:
Potable or drinking water 75 LPCD
Domestic water 150 LPCD
Total 225 LPCD
As per the above requirements and accounting the population of Delhi, per capita per day,
present total requirement for drinking and domestic purposes comes out as is 3675.5 MLD
per day (810 MGD). Considering the irrigational and industrial requirements water, the total
water requirement would be 3940 MLD (866 MGD). At present Delhi Jal Board is supplying
about 630 MGD of water by treating the surface water through the conventional treatment
plants.
The share of surface water allotted to NCT, Delhi from the Himalayan Rivers through
different interstate agreements is as follows:
1. Yamuna 724 mcm
2. Ganga 178.8 mcm
3. Beas (Bhakra water) 246.4 mcm
The river Yamuna provides the major share of surface water in the territory i.e. 724 mcm.
The interim seasonal allocation of annual utilizable flow of the river Yamuna for the NCT of
Delhi is as follows:
Table-3.1:
Interim seasonal allocation of annual utilizable flow of the river Yamuna for the
NCT of Delhi
July-Oct
(monsoonseason)
Nov-Feb (non-
monsoonseason)
March to June
(Summer)
Annual
580 mcm 68 mcm 76 mcm 724 mcm
From the above table it is seen that the major part of the allotted water is in monsoon
period which cannot be fully utilizable as the requirement during that period is low. As per
the information available, nearly half of this flood water is not being utilized at present and
flows out of Delhi in these months. Already drained out and overexploited, except Yamuna,
Delhi has no other surface source of water to rely upon.
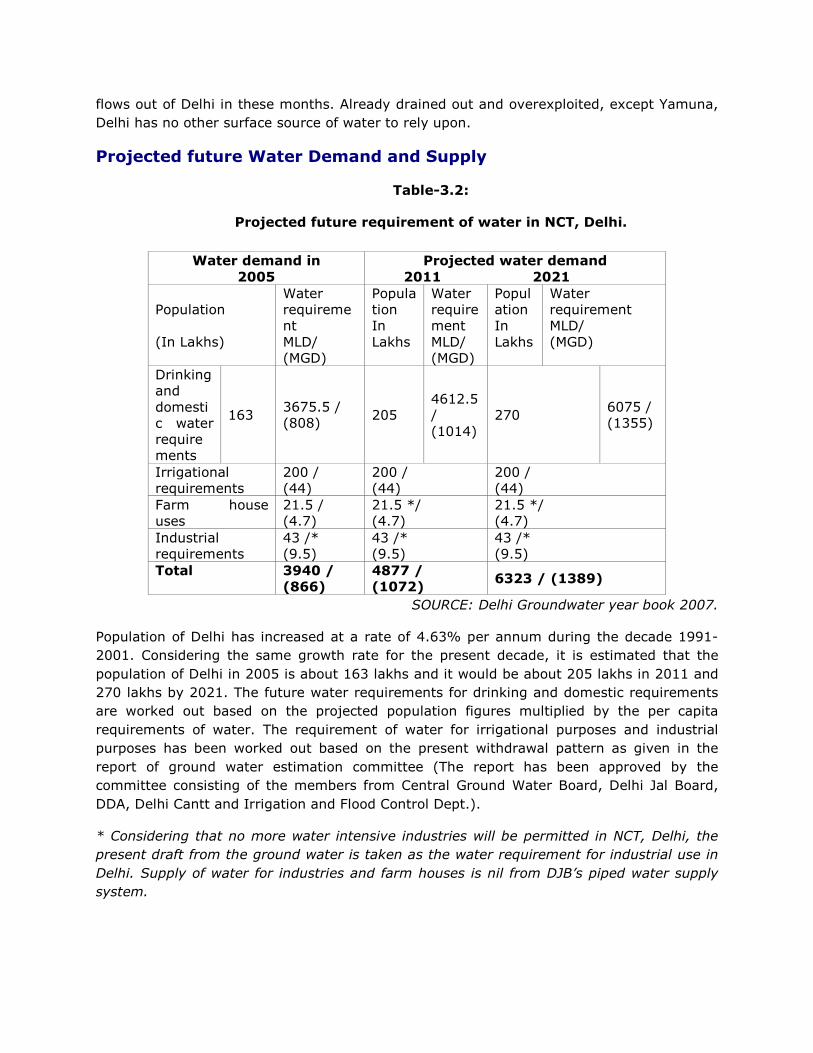
Projected future Water Demand and Supply
Table-3.2:
Projected future requirement of water in NCT, Delhi.
SOURCE: Delhi Groundwater year book 2007.
Population of Delhi has increased at a rate of 4.63% per annum during the decade 1991-
2001. Considering the same growth rate for the present decade, it is estimated that the
population of Delhi in 2005 is about 163 lakhs and it would be about 205 lakhs in 2011 and
270 lakhs by 2021. The future water requirements for drinking and domestic requirements
are worked out based on the projected population figures multiplied by the per capita
requirements of water. The requirement of water for irrigational purposes and industrial
purposes has been worked out based on the present withdrawal pattern as given in the
report of ground water estimation committee (The report has been approved by the
committee consisting of the members from Central Ground Water Board, Delhi Jal Board,
DDA, Delhi Cantt and Irrigation and Flood Control Dept.).
* Considering that no more water intensive industries will be permitted in NCT, Delhi, the
present draft from the ground water is taken as the water requirement for industrial use in
Delhi. Supply of water for industries and farm houses is nil from DJB’s piped water supply
system.
Water demand in
2005
Projected water demand
2011 2021
Population
(In Lakhs)
Water
requireme
nt
MLD/
(MGD)
Popula
tion
In
Lakhs
Water
require
ment
MLD/
(MGD)
Popul
ation
In
Lakhs
Water
requirement
MLD/
(MGD)
Drinking
and
domesti
c water
require
ments
163 3675.5 /
(808) 205
4612.5
/
(1014)
270 6075 /
(1355)
Irrigational
requirements
200 /
(44)
200 /
(44)
200 /
(44)
Farm house
uses
21.5 /
(4.7)
21.5 */
(4.7)
21.5 */
(4.7)
Industrial
requirements
43 /*
(9.5)
43 /*
(9.5)
43 /*
(9.5)
Total 3940 /
(866)
4877 /
(1072) 6323 / (1389)

Considering the 15% transmission losses, the projected water requirement for 2011 and
2021 is about 4877 MLD (1072 MGD) and 6323 MLD (1389 MGD).
Considering the present treatment capacities of water treatment plants located in Delhi, the
future water availability to fulfill the demands projected above are as follows:
Table 3.3
The future availability of water from all sources.
Withdrawal of water (MGD)
Source of Water Treatment Plant
Wazirabad Water Treatment Plant
210 Yamuna River
Chandrawal Water Treatment Plant Hyderpur Water Treatment Plant 240 Bhakra Storage and
Western Yamuna Canal
Nangloi Water Treatment Plant 100 Upper Ganga Canal,
U.P. Bhagirathi Water Treatment Plant
140 from Tehri Dam Sonia Vihar Treatment plant
20 Surface water Delhi parallel branch (lining of canal of 102 km stretch)
125 Ground Water From the tubewells present in different parts of NCT, Delhi and tubewells recommended in Yamuna Flood plain areas (Dewatering and refilling of shallow aquifers)
825 Total
The Role Of Groundwater In Delhi’s Water Supply
The case of Delhi is representative of the situation of many urban water systems in
developing metropolises. The low level of service ensured by the public utility has led the
upper and middle classes to develop coping strategies based on private groundwater
abstraction. These might include direct use of groundwater from a private tube well,
development of a private small supply network fed with untreated groundwater, or supply
by tanker, groundwater remaining the primary source of raw water in most of those private
supply chains. As a consequence, indiscriminate abstraction has led to a rapid fall in water
tables across the city, which threatens the short term sustainability of the system.
As per Delhi Jal Board, the contribution of groundwater to the municipal supply is around
11% in terms of volume, which represents around 370 Million Liters a Day (MLD). This

figure is often used as an indicator of the relative importance of groundwater for the city's
water supply.
However, these figures do not show the real role of groundwater in the city’s water supply.
In order to understand the hidden role of groundwater in Delhi’s water supply, one has to
understand the current state of failure of the municipal supply system. Water supply from
the network is intermittent and unreliable. Private connections and public standpoint get
water only one to four hours a day, with a great uncertainty on the pressure. Zerah (2000)
investigated the development of private strategies for coping with the unreliability of the
public supply, and found that the total annual cost of those strategies represented twice the
annual public expenditure in water in Delhi.
Image 1.2 War on water, a common scenario in Delhi.
Therefore, a large number private tube wells have been installed as a complement or a
substitute to the public supply. Although the number of private tube wells legally registered
to the authority in charge is around 100 000, different sources estimate the actual number
of private tube wells between 2000001 and 3600002. Precise information on private
groundwater use is difficult to obtain since this use is subject to public regulation. No
precise estimation of the total volume of water abstracted through private tube wells exist.
However, some rough estimates for the year 1996 give a total abstraction around 1300
MLD.
One can compare these estimates with the volume of municipal water actually reaching the
final user. The total l capacity of the municipal system is of 2950 MLD, and recent estimates
give a level of technical losses of 40%. The volume of municipal water reaching the final
user is therefore around 1770 MLD. Assuming a growth in the private abstraction of
groundwater between 1996 and 2004, we can consider that in terms of volume, private
abstraction of groundwater represents around 50% of the total supply to the final
users.
At present, there is a demand and supply gap of about 236 MGD. This gap may increase
and reaches to 247 MGD during 2011 and 564 MGD by 2021. But the analysis of both

surface and ground water sources, the total availability of water is just 825 MGD fulfilling
the just 50% of total water requirements. As per the data of NCRPB, the gap would be
about 1900 MLD (417 MGD) as the total water requirement is worked out based on the
population projection of 220 lakhs. But as per the figures projected based on the growth
percentage of population in NCT, Delhi the demand –supply gap is about 564.
1.2 BACKGROUND INFORMATION
Ground Water Status And Trends In Delhi
Delhi is experiencing increasing pressure to meet demand for its water resources. Growing
urbanization, improvements in living standards, exploding population are just some of the
contributing factors. In Delhi too ground water contributes to substantial quantity of supply.
Especially in new development areas ground water is largely being utilized as a drinking
water resource, mainly because of the insufficiency of the Yamuna water share for Delhi.
Ground water collects in the aquifers over thousands of years through infiltration and
ground water flow recharge. Some amount of ground water is replenished regularly through
rainwater infiltration. Sustainable use of ground water means withdrawal of ground water at
a rate at which it is replenished through recharge. Faster withdrawal rates would lead to fall
in water table and finally depletion of ground water.
The alarm bells are ringing right below our feet. Delhi extracts almost double the amount of
groundwater than is recharged every year. A status report on groundwater by the NCR
Planning Board (NCRPB) reveals that the water table in Delhi was dipping by 2 meters every
year. The report says the city currently draws 0.47 billion cubic meters (bcm) of water from
the ground every year while only 0.28 bcm gets recharged. That means Delhi loses a
whopping 0.19 bcm of groundwater in a year.
Depth to Water Table
A comparison of water levels from 1962 to 1977, 1977 to 1983 and 1983 to 1995 brings out
a clear picture of water level declines in major parts of the territory. During 1977, the water
table was by and large within 6m below ground level(bgl) in major parts of the territory
deepest being 23m bgl at near Quatab minar in Mehrauli Block. In 1983 the depth to water
level declined to 10 m bgl in major parts. In 1995 the extent of area with water levels in the
range of 10 to 20 m bgl has substantially increased.
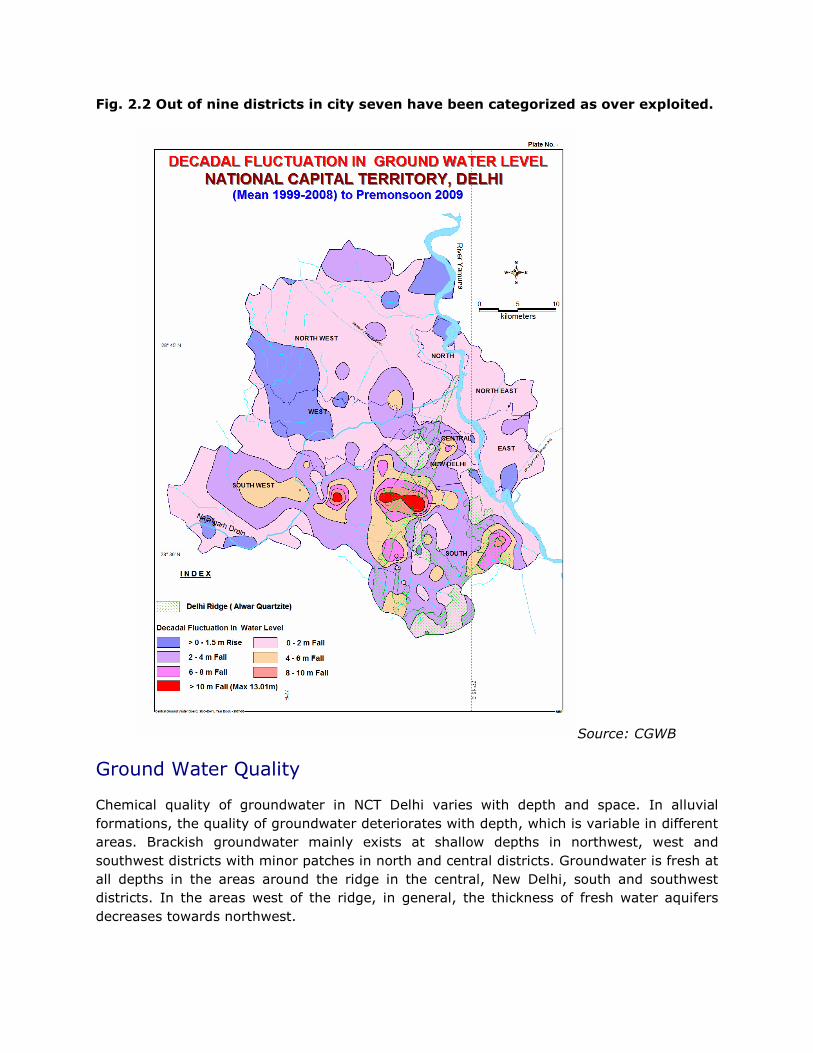
Fig. 2.2 Out of nine districts in city seven have been categorized as over exploited.
Source: CGWB
Ground Water Quality
Chemical quality of groundwater in NCT Delhi varies with depth and space. In alluvial
formations, the quality of groundwater deteriorates with depth, which is variable in different
areas. Brackish groundwater mainly exists at shallow depths in northwest, west and
southwest districts with minor patches in north and central districts. Groundwater is fresh at
all depths in the areas around the ridge in the central, New Delhi, south and southwest
districts. In the areas west of the ridge, in general, the thickness of fresh water aquifers
decreases towards northwest.

Salinity of ground water in different districts is found in the decreasing order as Southwest
> West >Northwest> Northeast and East districts. The salinity of ground water increases
with depth. Occurrence of moderately to highly saline ground water and increase in salinity
with depth suggests that at many places, mostly highly urbanized area, the ground water
flushing is incomplete and amount of contemporary recharge to ground water is very limited
or even absent at many places.
In over 30 percent of the area in NCT Delhi, the fluoride concentration in ground water is
more than the WHO prescribed maximum permissible concentrations in drinking water i.e.
1.5mg/l. The areas spread mainly in the South-western and Western part of the city
comprising Southwest, West and Northwest districts (Fig. 2.3).
The studies carried out by CGWB indicate that nitrate concentrations in ground water of
Delhi have wide range (less than 1 mg/lt to 945 mg/lt). The higher nitrate concentration
may be attributed due to combined effect of contamination from domestic sewage; livestock
rearing, landfills and run off from fertilized fields, unlined drains and cattle sheds. These

wide ranges in concentrations suggest mainly point source of contamination. The high
nitrate concentration in ground water is significant particularly in the parts of West,
Southwest and some pockets in Northwest districts (Fig.2.3).
The most common water quality problem in rural and urban water supplies in Delhi is
bacteriological contamination. Central Ground Water Board in collaboration with Central
Pollution Control Board carried out water sampling in NCT Delhi for bacteriological
contamination also. Out of total number of 269 ground water samples collected 58% water
samples were found bacteriological contaminated in N.C.T. Delhi. The presence of total coli-
forms and fecal coli-forms was mostly from ground water samples collected from hand
pumps. In the most of the hand pumps, the ground water is polluted due to bacteriological
contamination, due to poor maintenance of hand pumps and unhygienic conditions around
the structure. The areas affected with respect to fecal contamination are located in
Southwest, Central and East Districts of NCT, Delhi.
Typical Contaminants In Groundwater And Their Effects
Fluoride
Fluoride is a chemical that occurs naturally within many types of rock. The Maximum
Acceptable Concentration of fluoride in drinking water is 1.5 mg/L. Most of the fluoride
found in groundwater is naturally occurring from the breakdown of rocks and soils or
weathering and deposition of atmospheric volcanic particles. Fluoride can also come from:
• Runoff and infiltration of chemical fertilizers in agricultural areas
• Septic and sewage treatment system discharges in communities with
fluoridated water supplies
At low concentrations fluoride can reduce the risk of dental cavities. Exposure to somewhat
higher amounts of fluoride can cause dental fluorosis. In its mildest form this results in
discoloration of teeth, while severe dental fluorosis includes pitting and alteration of tooth
enamel. Even higher intakes of fluoride taken over a long period of time can result in
changes to bone, a condition known as skeletal fluorosis. This can cause joint pain,
restriction of mobility, and possibly increase the risk of some bone fractures.
Hardness
Water hardness is primarily the amount of calcium and magnesium, and to a lesser extent,
iron in the water. Water hardness is measured by adding up the concentrations of calcium,
magnesium and converting this value to an equivalent concentration of calcium carbonate
(CaCO3) in milligrams per liter (mg/L) of water.
The optimum range of hardness in drinking water is from 80 to 100 mg/L. Water with
hardness greater than 200 mg/L is considered poor in usage and water with hardness
greater than 500 mg/L is normally considered unacceptable for domestic purposes.
Water hardness in most groundwater is naturally occurring from weathering of limestone,
sedimentary rock and calcium bearing minerals. Hardness can also occur locally in

groundwater from chemical and household effluents. Hard water is mainly an aesthetic
concern because of the unpleasant taste that a high concentration of calcium and other ions
give to water. It also reduces the ability of soap to produce lather, and causes scale
formation in pipes and on plumbing fixtures. Excessive hardness may indicate the presence
of other chemicals such as nitrate.
Nitrate
Nitrate is the most common form of nitrogen found in water. In water, nitrate has no taste
or scent and can only be detected through a chemical test. The Maximum Acceptable
Concentration (MAC) for nitrate in drinking water is 45 milligrams per liter (mg/L).
The presence of nitrate in groundwater in greater conc. usually reflects the impact of human
activities on well water quality. Nitrate is usually introduced into groundwater through
widespread or diffuse sources, commonly called non-point sources, which can be hard to
detect. These sources can include:
• Groundwater pollution from septic and sewage discharges.
• Leaching of animal manure
• Leaching of chemical fertilizers
Though nitrate is considered relatively non-toxic, a high nitrate concentration in drinking
water is an environmental health concern because it can harm infants by reducing the
ability of blood to transport oxygen. In babies, especially those under six months old,
methaemoglobinaemia, commonly called “blue-baby syndrome,” can result from oxygen
deprivation caused by drinking water high in nitrate. Death can occur in extreme cases.
Phosphate
A number of anthropogenic sources can be responsible for elevated P levels in groundwater.
These include:
• leaking mains water pipes (as orthophosphate is added to drinking water
supplies)
• Septic tank overflows.
• manure heaps and unlined slurry storage facilities
Silica
Silica released as a result of chemical breakdown of silicate minerals in rocks and sediments
by chemical weathering, is acquired by circulating groundwater. Therefore the source of
silica (SiO2) in groundwater is almost exclusively and unequivocally a result of water–rock
interaction. Concentration of SiO2 in groundwater varies from 1 to 30 mg/l, the median
value being 17 mg/l.

Studies demonstrates that silica content of groundwater is directly proportional to the
residence time of water underground. Relatively high silica content in groundwater,
therefore, implies more intense water–rock interaction, which, in turn, may be related to
various aquifer-related parameters, such as permeability, residence time and litho logy.
pH and TDS count
pH value of 6.5-8.5 is considered as safe. Also this neutral pH is quite significant in
maintaining numerous chemical dynamics among different chemicals in ground water. TDS
(total dissolved solids) is also a parameter in the determination of water quality.
Table 7.1. Freshwater resources according to salinity Water Quality
Water Quality Parameter
Fresh Water TDS < 1000 ppm
Brackish Water 1000 < TDS < 5000 ppm
Saline Water TDS > 5000 ppm
Microbiological – E.coli -analysis
The presence of E. Coli in well water may indicate recent contamination of the groundwater
by human sewage or animal droppings which could contain other bacteria, viruses, or
disease causing organisms. This is why Coliform bacteria are considered “indicator
organisms”; their presence warns of the potential presence of disease causing organisms
and should alert the person responsible for the water to take precautionary action.
A basic laboratory test is the best way to tell if Coliform organisms are present, as they can
be there with no appearance or taste difference. When water is tested for Fecal or Total
Coliform, the results are usually given as the number of colony forming units per 100
millilitres (CFU/100ml) of water sampled. No sample should contain Fecal Coliform or E. coli,
and ideally there should be no Total Coliform, however a single sample may contain up to
10 Total Coliform CFU/100 ml.
Sources of Total and Fecal Coli form in groundwater can include:
• Infiltration of domestic or wild animal fecal matter
• Effluent from septic systems or sewage discharges
Poor well maintenance and construction (particularly shallow dug wells) can also increase
the risk of bacteria and other harmful organisms getting into a well water supply. The
presence of Fecal Coliform bacteria or E. coli indicates contamination of water with fecal
waste that may contain other harmful or disease causing organisms, including bacteria,
viruses, or parasites such as Giardia, the cause of beaver fever. Drinking water
contaminated with these organisms can cause stomach and intestinal illness including
diarrhea and nausea, and even lead to death. These effects may be more severe and

possibly life threatening for babies, children, the elderly or people with immune deficiencies
or other illnesses.
About Rainwater Harvesting
Rainwater harvesting has been done from the days of ancient civilizations in India using
improvised methods with local materials. In scientific terms, water harvesting refers to
collection and storage of rainwater and efficient utilization of the limited water endowment
of physiographic unit such as a watershed.
There are two main techniques of rainwater harvesting:
a) Storage of rainwater on surface in natural or man made storage systems
for future use.
b) Recharge to groundwater
Rain – a critical part of the Hydrological Cycle - is a primary source of water for all of us.
Fig. 4.1 Hydrological cycle
With growing human impact over the natural self sustaining environment, various
components of hydrological cycle are being disturbed. As all the components of this cycle
are interlinked and interdependent, growing influence on one simultaneously degraded other
components also. Rainwater harvesting also helps restore the hydrological cycle and to
maintain fresh water balance on the land surfaces.
Rainwater Harvesting for Artificial Recharge to Ground Water
RainWater harvesting is the deliberate collection and storage of rainwater that runs off on
natural or manmade catchment areas. Catchment includes rooftops, compounds, rocky
surface or hill slopes or artificially prepared impervious/ semi-pervious land surface. The

amount of water harvested depends on the frequency and intensity of rainfall, catchment
characteristics, water demands and how much runoff occurs and how quickly or how easy it
is for the water to infiltrate through the subsoil and percolate down to recharge the aquifers.
In urban areas, though adequate space for surface storage is not available, water levels are
deep enough to provide unsaturated geophysical zones that can be used to store rainwater
and recharge the aquifers. Hence rainwater harvesting is the ideal solution to solve the
water supply problems of an urban area like Delhi
Fig.4.2 Schematic diagram of Artificial recharge of groundwater.
The type of artificial recharge system that can be developed at any specific site is
controlled, to a large degree, by the geologic and hydrologic conditions that exist at that
site. Site selection criteria, in addition to economic considerations should include at least the
following:
· Source of recharge water
· Chemical and physical characteristics of the recharge water
· Chemical characteristics of water in the aquifer

· Availability of an aquifer suitable for artificial recharge
· Thickness and permeability of the material overlying the aquifer, if any.
· Thickness and permeability of the aquifer.
· Proximity of the potential recharge site to an appropriate well field cone of
depression.
· Water- level difference between the aquifer and the recharge site
· Topography.
· Availability of property (land)
Capturing and storing rainwater for use is particularly important in dry land, hilly, urban and
coastal areas. It not only provides an improvement in the groundwater both in terms of
quantity and quality, but also prevents flash flooding, land subsidence in urban areas.
Additional services like increase well yields and storage of storm water for usage. In recent
studies in alluvial areas, energy saving for 1m rise in ground water level was found around
0.40 kilo watt per hour.
Rain water recharge structures besides being sustainable drivers of aquifer recharge, serves
many a role. Local water harvesting systems developed by local communities and
households can reduce the pressure on the state to provide all the financial resources
needed for water supply. In addition, involving people will give them a sense of ownership
and reduce the burden on government funds.
Rainwater Harvesting in Delhi
One of the Reports from regional authority says that though NCR receives 22.54 bcm of
rainwater every year, approximately 16.9 bcm falls during the monsoon season alone. It is
estimated that on an average, 6.27 bcm of water is lost due to surface run-off. The report
points out that region's capacity to store as much as 183.82 bcm of groundwater remains
highly unutilized
NCR planning board has pointed out that the groundwater level in NCR is getting critical in
the absence of a broad framework for rainwater harvesting and saving the disappearing
ponds and lakes. It has also prepared a Master Plan for groundwater recharge in NCR.
Building regulations have also been modified to make RWH mandatory, on new buildings,
and in severely affected areas, users of tube wells are supposed to install such systems to
compensate their abstraction.

SECTION 2
2.1 OBJECTIVES OF THE STUDY
There are several myths surrounding rainwater harvesting, especially among laypersons
with limited knowledge about the subject. They often question its efficacy in urban
environments and discourage people from adopting it.
This Impact Analysis was conducted to establish that rainwater harvesting is effective and
cost efficient even in highly built up environments such as in our study area.
With this study, we hope that we would be able to present concrete proof of the immediate
localized impact of rain water harvesting. The sub-objectives of the study were:
1) To quantify the Rainwater harvesting that has been done in Alaknanda. Also to specify
the dimensions and state of maintenance of these structures
2) Impact Assessment of rainwater harvesting on three parameters:
a) Quantitative impact i.e. rise in water table of the area
b) Qualitative impact i.e. improvement in the water quality
c) Socio-economic impact of rainwater harvesting
We hope that the results of this study will help to reduce cynicism of the people about urban
rainwater harvesting and thereby encourage more adoption of the same.
2.2 GEOGRAPHICAL SCOPE OF THE STUDY
About Alakananda
Alaknanda, a DDA developed locality having several Apartment Complexes , in South Delhi,
was one of the first to adopt Rainwater Harvesting. It has several well-known apartment
complexes such as Mandakini Apartments, Narmada Apartments, NRI Complex, Aravli
Apartment, Gangotri Apartments, Tara Apartments, Yamuna Apartments etc. All these
complexes have well designed and maintained storm water drainage systems.
Majority of apartment complexes in Alaknanda have implemented rainwater harvesting.
These complexes are also making efforts to maintain their RWH structures and monitor their
effect on the water table. The community leaders claim that the water table in their area
has gone up and that the yield in their tube wells near the RWH structures has increased.
Of all the apartment complexes in Alakananda, the study was conducted in
Mandakini Apartment
- Aravali Apartment

-Narmada Apartment
-NRI Complex
- Rishi Apartment
- Nilgiri Apartment
- Yamuna Apartment
Image 5.1 Demarcated Study area Source: Google earth.
2.3 METHODOLOGY
Data Collection
Data for the analysis was collected both from primary and secondary sources.
Primary data sources included:
1) Identifying the rainwater harvesting structures and their catchment areas (artificial
recharge to groundwater) present in the area. The total amount of recharge because of
these structures was estimated individually assuming 80% efficiency of structures.
2) Field testing of Pre and Post Monsoon 2010 water levels at different points within the
study area. Water depth level changes are used as indicators for the successful
augmentation of runoff water in aquifer after the establishment of RWH.
2) Field testing of water quality samples for pre and post monsoon 2010 at various points in
the study area.
3) Interviews with Residents Welfare Associations (RWA) of each housing complex in the
study area and Administrative officials to get historical information about water issues in the

area. Also to obtain information about the number of hours for which tubewells run in the
area (to calculate groundwater extraction in the area)
The sources of Secondary Data and their use is as given below:
• All the reference materials in the field (Ministry manuals, guides on the estimation of
recharge by CGWB and relevant research papers) were collected prior starting up the
project and an approach was accomplished.
• Formal data from the local RWA offices in the forms of documents. Also public
authority offices (MCD, DJB) were visited for any relevant information.
• Design Criteria of Recharge Structures was collected from the RWA offices and
inspected whether they are laid accordingly with the CGWB designs or modified if
any to suit local conditions and space availability.
• As most of the rainwater recharge structure has been completed with the assistance
of FORCE NGO, so all the documents regarding proposals of projects, layout plans,
finance/sponsors details etc. was collected. In addition, periodic depth level records,
as well as yearly status of maintenance of these structures was also taken
• By a generalized survey the Runoff which was expected in the documentation of
recharging structures was assessed by taking into account all the components
contributing to recharge by following formula.
Runoff = Catchment area * Runoff Coefficient * Rainfall
• Runoff Coefficients (the mathematical factor that accounts for runoff loss by
evaporation and retention on the surface itself) as given by Central Groundwater
Board were taken.
Table 5.3 Type of catchment Runoff coefficient
• Roof Catchments
o Tiles 0.9
o Corrugated Metal Sheets 0.7 - 0.9
• Ground surface coverings
o Concrete 0.6 - 0.8
o Brick Pavement 0.5 – 0.6
• Untreated ground catchments
o Soil on slopes less than 10 percent 0.0 - 0.3
o Rocky natural catchments 0.2 – 0.5
o Green area 0.05 - 0.10 Water Sampling
Sampling of water was performed in pre-monsoon (July 16, 2010). Water samples were
drawn from the bore well nearest to recharge structure using sterilized sampling devices by
a team comprising of Expert from MINMEC CONSULTANCY, one RWA Personnel, three
coordinators from FORCE NGO. In housing societies where bore wells are not present
samples were collected directly from the Recharge well. The samples were placed in
polyethylene bottles for chemical analysis and microbiological analysis, put into ice-bag
containers and transported to the MINMEC laboratory the same day.
A total of 9 samples were collected. Out of them, 2 were drawn from the Mandakini
apartment, from the rest of apartments one individual sample was collected for the analysis.
The samples were tested for pH, Electrical conductivity, TDS, Fluoride, Total
hardness, Phosphate, Nitrate, Silica, E.Coli, TDS
Chemical analysis
The collected samples were chemically analyzed according to the standard methods for the
examination of water.
Limitations of the Study
The study faced several limitations which made it impossible to get all the data that was
required for a thorough comprehensive study. The key limitations were:
1) Non-Availability of government data about exact groundwater status of the area. We
were surprised to find that neither the Delhi Jal Board nor the Municipal Corporation
of Delhi, keep any records about the depth to water levels in their tubewells or about
water quality of their tubewells. The lithographs or survey details made prior to /
during the digging of tubewells by these agencies in the area were also not available.
2) The only government data that was available for groundwater was from Central
Groundwater Board. This data too was not specific to our study area – Alakananda.
The nearest peizometers (observation wells) from which the data is collected by
Central Groundwater Board were at a distance of 4-5 km from our study area and
were substantially different in terms of land usage, population density, dependence
on tubewells and other characteristics which impact water levels in an area. Hence
that data could not be used for comparison with current observed data
3) Consistent, year wise community records for water levels / depths were not available
for most localities. Even details of rainwater harvesting projects were not available in
the Residents Welfare Association offices. Apart from a general lack of necessity to
maintain these records, another contributory factor was the change in the members
of the Residents Welfare Association. The members who had made the rainwater
harvesting systems were no longer in the RWA and had not passed on all the
information about the rainwater harvesting systems.
4) Inability to take water level readings / samples in many areas. Since there were no
observation wells made along with the rainwater harvesting projects, we had to take
readings from abandoned tubewells in the vicinity or those in the recharge structures
themselves. In many places, it was not possible to even access any of these and so
we tried taking readings in working tubewells. This was impossible in most cases
because the withdrawal pipe, cable wire and phalange joints in them do not allow our

water level indicator to move down the well. The distance of our sample tubewell
from the recharge structure was also not standardised.
5) For the above reasons, the readings might not be accurately indicative of the status
of groundwater level and quality in the area.

SECTION 3
3.1 DETAILS OF STUDY AREA
Hydrometeorological Conditions
Alaknanda, our study area is a micro catchment domain within NCT Delhi, so Delhi climate
and precipitation pattern was used for the study due to lack of data for localized studied
domain.
Table 5.2
Average Month-wise precipitation with rainy days in Delhi
The normal annual rainfall in the district is 611.3 mm. The rainfall in the district increases
from the southwest to the northwest. About 81% of the annual rainfall is received during
the monsoon months July, August and September. The rest of the annual rainfall is received
as winter rain and as thunderstorm rain in the pre and post monsoon months as shown in
The variation of rainfall from year to year is large. On an average rain of 2.5 mm or more
falls on 27 days in the year, of these, 19 days are during the monsoon months. The average
annual evaporation losses are 2224 mm
Hydrological Conditions
Alaknanda lies in the South District in political boundaries of Delhi region. The South district
of NCT Delhi covers 250 Sq. Km. of area in which 45.2 Sq. Km. area shows mountainous
undulating terrain exposed with Delhi quartzite.
The region is characterized by few meter of overburden composed of unconsolidated clay,
silt, sand and varying proportions of Kankars, followed by quartzite. Moderately fractured
zones in the quartzite are prevalent at the depth of 30 to 90 m and the fractures gradually
decrease as depth increases . The weathered zone is found at every place above hard rock
but thickness of weathered zone varies from place to place. The depth to water level varies
widely in this district and is ranging from 30 to 65m bgl . The depth of fresh / saline water
interface varies from 75 to 100 m. The thickness of the fresh water zone varies from 30 to
Month Jan Feb Ma
r
Apr
.
Ma
y
Jun Jul
y
Au
g
Sep Oct No
v.
Dec
.
Annu
al
Rainfall
(in mm)
14.
5
13.
2 9.9 5.5 9.2
38.
8
191
.6
197
.4
105
.3
19.
3 2.8 4.3 611.3
Rainy days 1.2 1.0 0.8 0.5 0.8 2.1 7.4 7.9 4.0 0.8 0.1 0.4 27.0
Evaporation
(in mm) 71 101 177 300 400 333 233 133 147 149 102 78 2224
Source: Indian Meteorological Department

85 m. The yield of 30 to 50 m deep tube wells is 36 m³ /hr ( 8000 gallons/ hr) to 135 m³
/hr ( 30000 gallons/ hr) for 2.5 to 15m of drawdown. The groundwater quality is generally
potable in nature. Nitrate content varies between 98 to 980 ppm.
Image 5.2 Geological section of Alaknanda uncovered from the section of South district of
Delhi. Source: CGWB

SECTION 4
4.1 FINDINGS & CONCLUSIONS
Rainwater Harvesting status in Alakananda
Most of the area in the housing colonies of Alakananda is concretized. Even the small parks
in the area, have not been planned to receive surplus runoff from the surrounding
catchment. Hence, due to the natural topography of the area, the rainwater runoff gets
drained out quickly. The storm water drains that carry the runoff from rooftops and roads in
the area too are concrete lined.
The geological structure of the area is such that it has a very low specific yield of 0.06-0.12.
According to CGWB records only 3%-5% of natural recharge can occur via natural pathway.
As a result, there is very little natural recharge to groundwater. Only the top soil stratum
absorbs some water which also evaporates within a few days.
Thus ground water recharge occurring naturally is negligible.
Rainwater Harvesting for Artificial recharge to groundwater
Several housing complexes in Alakananda have adopted rainwater harvesting. The number
& potential of their rainwater harvesting structures are as given in the table below
Apartment Name
(Yr of completion of RWH)
No. of
Recharge
structures
Runoff water
expected to the
structure (m³)
Quantified
Recharge (80%
efficiency) (m³)
Mandakini
(2007)
6
11,500 9200
NRI Complex
(2006)
6
14,523 11,618
Narmada
(2009)
1
4000 3200
Nilgiri
(2008)
2 1500 1200
Gangotri
(2008)
1
3900 3120
Aravali
(2007 & 2009)
3
7800 6040
*Yamuna Apartments 2 10,000 8,000
*Structures could not be opened for verification. Records were also not available
Apart from those in Yamuna Apartments, none of the rainwater harvesting structures were
made as a part of the initial construction of the flats. Rainwater Harvesting was neither a
part of the developmental plan of Delhi Development Authority nor was it mentioned in the
handing over documents as additional recommended works in the locality.

It was on the initiative of the environmentally aware and responsible citizens of Alakananda
that so many rainwater harvesting structures were made later by the Residents Welfare
Association of each area. The initial awareness about rainwater harvesting was created by
NGO-FORCE and Coca-Cola India as a part of its Delh- wide campaign – JAL BEEMA
ABHIYAAN. In this campaign, FORCE members along with Central Groundwater Board
officials, Delhi Jal Board officials and the local political leaders went from locality to locality
to create awareness and initiate action plans for rainwater harvesting.
All the structures were designed by Central Groundwater Board and FORCE and their
construction was funded by the Residents Welfare Association. In many cases, the
association also received support from corporates such as Coca-Cola India and from the
rainwater harvesting financial support scheme by Delhi Jal Board.
The method usually followed is that of Recharge Trenches with one or more recharge wells.
The conduits used for transporting rainwater runoff to the structures are usually the storm
water drains in the area. The structure has an arrangement for first flush with a semi-closed
inlet i.e. a bypass arrangement for regular drain flow or first 10 minutes of mild rainfall has
been provided. In many cases, shutters have been provided to manually monitor this
process. The recharge structures are completely covered, equipped with ventilation
apertures.
The local Resident Welfare Associations are responsible for the maintenance of the rainwater
harvesting structures and their catchments. They are also educated on issues related to
possible contaminants in runoff because of domestic waste water / garbage etc. The
structures are cleaned in the pre monsoon season every year - the filters are excavated,
cleaned and then filled back (here also corporate or government support is sometimes
availed of by the RWAs). The conduits/ storm water drains are also cleaned of leaves,
plastics and other clogging agents.
Groundwater draft as compared to Rainwater Harvesting
A Comparison of the average annual extraction of groundwater vis a vis the calculated
artificial recharge to groundwater shows some interesting results
Apartment Name (Year of completion)
No. of Recharge structures
Recharge potential of to structure (m³ / yr)
Expected Recharge (at 80% efficiency (m³ / yr)
No. of Bore wells (govt+Private)
Annual draft of Ground water (m³/yr)**
Difference between Recharge and Draft (m³)
Mandakini (2007)
6 {RT1=4 RS=1 RA=1}
11,500 9200 3 (1+2)
7776 + 1424
NRI Complex (2006)
6 {RT1=4 RT2=1 RS=1}
14,523 11,618 10 (0+10) [Small submersibles]
10,368 + 1250

Narmada (2009)
1 {R T 2=1}
4000 3200 1 (1+0)
4860 1660
Nilgiri (2008)
2 {R A =2}
1500 1200 0 0 + 1200
Gangotri (2008)
1 {R S=1}
3900 3120 3 {3+0}
11,664 - 8544
Aravali (2009)
2 {R AB=2}
7800 6040 4 {4+0}
14,580 - 8540
Yamuna 2 (RT2)
10,000 8,000 2 7776 + 224
Index : R T 1 = Recharge Trench with one recharge well
R T 2 = Recharge Trench with two recharge wells
R S = Recharge Shaft with borewell
R A = Recharge trench with abandoned borewell
**(avg. rate 1.5l/s & 0.8l/s for submersibles and avg.
time of 2.5hr/day for MCD and 1.5hr/day for Private Tube well Source: RWA records of Rainwater Harvesting done in their
area and interviews with RWA members, MCD & DJB staff.
As can be seen from the above table,
1) With a well planned, implemented and maintained rainwater harvesting system, it is
possible to recharge more to groundwater than is being withdrawn from the
groundwater reserves by operational tubewells in the area
2) Hence Rainwater Harvesting can not only neutralise the impact of groundwater
extraction, it can actually add a surplus to the aquifer thus leading to a long term
rise in the water table.
3) With minimal maintenance and community involvement, rainwater harvesting is
sustainable and its impact can be observed year after year.
Even in housing complexes like Narmada, Gangotri and Aravali, where though Rainwater
harvesting has been done, the groundwater draft in the locality is much higher, atleast
partial water balance is being achieved. Also, as subsequent results will show, the localised
rise in water table around the recharge structure will actually increase the water table for
the operational tubewells in the area.
Groundwater status
Community Observations of water level
The members of most of the Residents’ Welfare Associations in the area are aware citizens
who take an active interest in the community issues of their localities. They are aware about

the potential benefits of rainwater harvesting. Many of them have also been observing the
tubewells in their areas for any rise in yield / water table.
The table below lists down their observations on groundwater that they shared with us in
the interviews we had with them.
Apartment Name (Year of completion)
Recharge potential of to structure (m³ / yr)
Premonsoon and post monsoon Water table fluctuation (m)
Mandakini (2007) 11,500 +2.5 (each year)
NRI Complex (2006) 14,523 +3
Narmada (2009) 4000 Structure made in 2010
Nilgiri (2008) 1500 -
Gangotri (2008) ( Rishi apartments)
3900 Rise in water table in the first year itself after RWH
Aravali (2009) 7800 An MCD tubewell used for horticulture which had dried up, started yielding water after the first post RWH monsoon
Yamuna 10,000 -
It is clear from the observations above, that the RWAs have observed and recorded a rise in
water table every year after the making of the rainwater harvesting structures. In case of
structures which have been operational for several years now, the recorded rise is an
average for those years. The RWA has either observed this rise in the Recharge Well itself,
or in an operational tubewell near one of the RWH structures in the area.
Pre & Post Monsoon 2010 Water Level
S.NO Society Structure
Pre-Monsoon 2010 water Level ( mbgl)
Post-Monsoon 2010 water Level ( mbgl)
1 NRI Complex Borewell (running) 43 39.5
2 Mandakini Abandoned Borewell 15.73 13.6
3 Rishi RWH 18.1 17
4 Nigiri Borewell 20.9 7.6
5 Narmada RWH 9.49 5.18
6 Aravali not available not available
7 Yamuna Not available Not available

NOTES:
1) The pre and post monsoon depth readings for a locality were taken in the same
borewell. Hence the comparisons are point to point comparisons
2) At some places it was not possible to take depth readings because of inability to
lower measurement instrument into a nearby borewell / tubewell.
3) We had also approached Central Groundwater Board for sharing the water evel
readings of their nearest Peizometer. However the nearest peizometers were in
Pushpa Vihar and Tughlaquabad – both of which were more than 3-4 kms away from
our study area. Those readings would not have been indicative of the local
groundwater scenario.
Pre & Post Monsoon 2010 Water Quality
The results of the chemical and microbiological analysis of the water samples are presented
in Table7.2. The pre- monsoon pH values of the recharged water from aquifer ranged from
6.3 to 9.2 with a mean value of 7.9. It is easy to distinguish from the table that pH values
of abandoned bore well are highly alkaline. This is because the sample has been taken from
the top surface of static groundwater. Hence, it has surface influences and is not a true
representation of aquifer water. Running bore wells provide satisfactory results.
Sampled water had low–medium values for conductivity (median conductivity
82.31µmScm1) and low–medium level of Total Dissolved Solid (158-1330 ppm.). In almost
all the recharge borewell sample water was found to be well within fresh water range and
the nearby running borewells has also got satisfactorily agreeable levels.
Fluoride was detected within permissible range in all the collected samples. The
microbiological quality of the sampled water was assessed by examination of the common
microbial indicator E. Coli yields very fine result. In all the collected water samples, except
one E. Coli was not detected, Even in the only one, Narmada, it lies within permissible
limits. This may be due to the fact that in Narmada Apartment the recharge structure is yet
to start operational this monsoon so the sample collected was from static water level in the
bore and may have colonies of bacteria.
The only Indicator which is to be dealt with was Nitrate. Normal permissible levels of Nitrate
is 45 mg/l. In all the samples collected nitrate level was found to be very high, about ten
times larger than permissible level.
The only satisfying result in concentration of nitrate was found in Mandakini Apartment
recharge borewell i.e. 13.4 mg/l. which mean that in a properly maintained recharge
structure and catchment Artificial recharge is not the causative factor of higher Nitrate level.
As per CGWB records nitrate concentration in the ground water of area is high and the
artificial recharge is helping to dilute excess nitrate in Ground Aquifer.

In Artificial Recharge even if some nitrate contamination does happen, Desiltation chamber
and slow sand filter carrying process of Biological denitrification, reduces nitrate to a
gaseous nitrogen species. The gaseous product is primarily nitrogen gas, but it may also be
nitrous oxide or nitric oxide. A broad range of bacteria, including many in the genera
Pseudomonas, Micrococus, Archromobacter, Thiobacillus, and Bacillus can reduce nitrate.
Also natural biological denitrification occurs extensively if a sufficient source of reducing
organic carbon is present. Such organic compounds as glucose, and starch or mixtures of
these (e.g. a sugary brewery waste) are common carbon sources. If Catchment is not well
maintained and household wastes or other contaminations carrying nitrate do enter Aquifer
through Artificial recharge, then these above mentioned organic Carbon sources which are
extensively utilized and present in extensive amount in each household would also be
Recharged along with nitrate and enhance denitrification process acting as a catalyst.
But above such trend is not reflected in any other parameter like Total Hardness in terms of
CaCO3 mg/l and phosphate level. Thus higher nitrate level is in Aquifer and Artificial
Recharge is diluting to bring down its level in Alaknanda
A comparison with post monsoon observations taken in December 2010, shows the results
as shown in table .
The decrease in concentration of silica etc indicates a dilution natural water contaminants
because of rainwater harvesting. The decrease in nitrates also indicates that the runoff is
relatively free of sewage / leachates from dumped solid waste and has therefore contributed
to the decline in the nitrate level of the groundwater. However, the increase in phosphates
fluorides and TDH seems to indicate that the runoff contains residues from soaps /
detergents and fluorinated water. This issue needs to be addressed by the RWAs through a
stronger mass education drive on prevention of contamination to rainwater runoff.
Contribution of Aquifer Characteristics to Observed rise in
Water Table
The extraordinary results gained by Recharge structures in Alaknanda is also aided by local
Hydro geological attributes of aquifer. The Geological section of Alakananda area as seen
from Central Groundwater Board reports of the district shows that the aquifer is a confined
aquifer

Image 5.3: Aquifer attributes of Alaknanda.
The Regional aquifer is bounded by hard rock interface on both sides so the horizontal water
movement is not there. Hence the water recharged in the area, remains confined to this
aquifer and bound within the localized domain. This is the reason why the rise in water table
as because of the impact of artificial recharge to groundwater is so visible in Alakananda.
The above information also implies that this type of aquifer is very sensitive to excesssive
extraction of groundwater. With insignificant natural recharge, and excessive withdrawal,
the water table will deplete very rapidly. Hence joint efforts of communities and all the
stakeholders are needed to ensure Alaknanda groundwater balance.
Financial Implications & Benefits Of Rainwater Harvesting
The number and size (and hence the cost) of rainwater harvesting structures in an area is
directly related to the runoff available at the rainwater harvesting site. The cost is also
related to the usage type of the area where the rainwater harvesting structure is being
made. In all urban areas, the cost of community rainwater harvesting is relatively high
because it has to be reinforced suitably so that the usage type of the top surface can be
restored to its earlier status. Also, since the area is likely to be subjected to higher surface
pressures, heavy concrete reinforcement are important to ensure safety of users and nearby
buildings.
Designing a rainwater harvesting system that is retro-fitted onto an existing building /
locality is also costlier because of the dismantling and adaptations that have to be done
before the rainwater harvesting system can be installed. However, the cost of a Rainwater
harvesting system designed as an integrated component of a new construction project is
relatively much lower.
The cost borne per beneficiary of a community rainwater harvesting done in a planned
colony, like those in Alaknanda, is much lesser as compared to similarly efficient structures

made by individuals. This is because of optimization of recharge potential at each rainwater
harvesting site. Also in these areas, there are separate storm water drains, which join the
MCD drains on the main road. These storm water drains carry water from the rooftops and
the pavements. Hence, here the drains serve as collective conduits for recharge structures
and no additional costs needs to be incurred for channelizing runoff to the structures.
We tried to calculate the total cost of rainwater harvesting that has been done in all the
study areas in Alakananda. However, due to unavailability of records, we were not able to
get costs for all structures made. Also, since the structures had been made in different
years, a detailed exercise to calculate present value of the cost incurred would have been
needed to get an accurate expenditure estimate.
However, on the basis of information we collected and estimates provided by RWA
members, approximately Rs 35 lakh (Rs 3.5 million) has been spent on rainwater harvesting
in the area. The total rainwater harvesting potential created with this amount is 53223
cu.m. per year.
Thus, if the lifespan of a rainwater harvesting project is assumed to be 20 years (
as per norms of CGWB), then the cost per litre of recharge is merely Rs. 0.003 /-
i.e. just Rs 3 per cu.m. With this minimal investment, the residents have ensured a
sustainable, and growing source of water supply for themselves.
Infact, in most cases, the cost to the community of such projects is less than 33% of the
cost mentioned above. This is because of the financial support extended for Rainwater
harvesting projects by corporates such as Coca-Cola India and the Delhi government
Cost saving because of Saving Energy
In all areas where the water table is low, groundwater is pumped up with electricity driven
submersible or surface installed water pumps. These motors usually vary in power from 1
HP to 7 HP (735 Watts to 5145 Watts). In Alakananda too similar motors are used for
groundwater extraction.
In a study by Central Groundwater Board, it was shown that with every 1 meter rise in
ground water level, energy consumption in withdrawal of water is reduced by 0.4 KWH ( Kilo
Watt Hour).
In the study area, we were able to record 23 running tubewells ( though there might
actually be more). These supply water to the parks present inside apartments and also to
supply water during scarcity. On an average they are run for four hours (two mornings and
two in the evening).
As the water level is deeper so an average 7 hp motor is present in each of these bore wells
whose running cost is somewhat around 10-12 units (KWH) in an hour.
Hence total consumption would be 475 Kilo Watts per day.
So calculating the energy saving and money in electric bills will be:
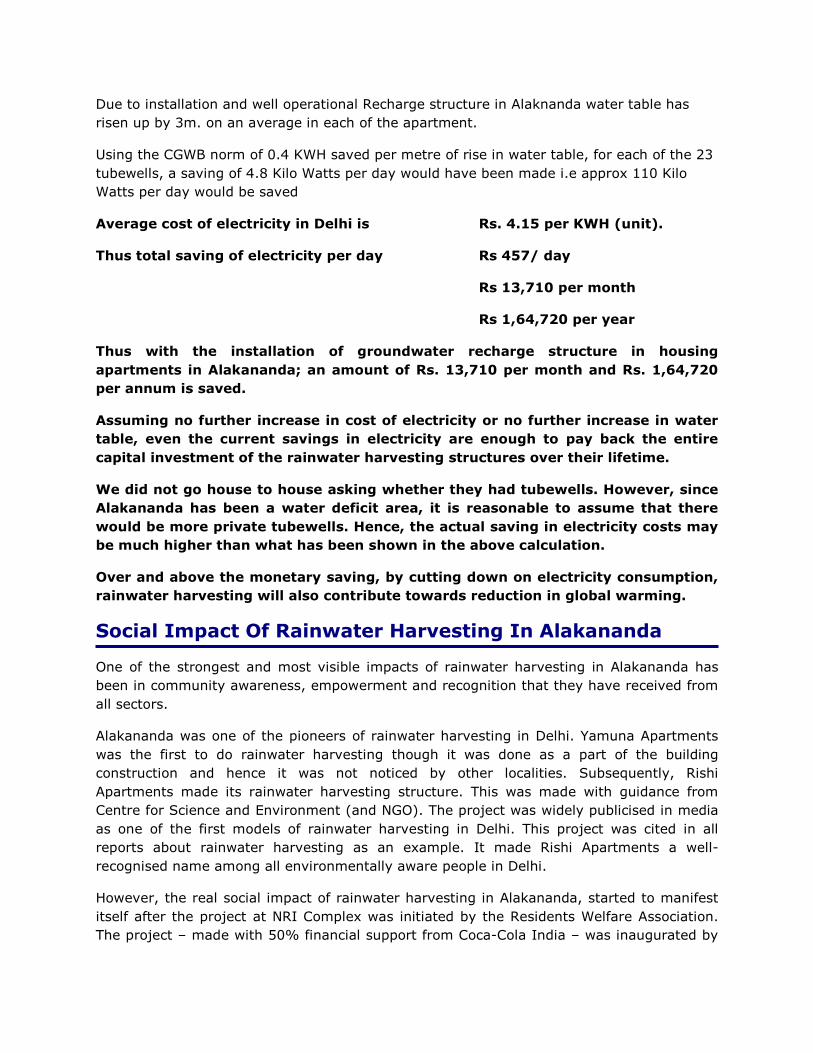
Due to installation and well operational Recharge structure in Alaknanda water table has
risen up by 3m. on an average in each of the apartment.
Using the CGWB norm of 0.4 KWH saved per metre of rise in water table, for each of the 23
tubewells, a saving of 4.8 Kilo Watts per day would have been made i.e approx 110 Kilo
Watts per day would be saved
Average cost of electricity in Delhi is Rs. 4.15 per KWH (unit).
Thus total saving of electricity per day Rs 457/ day
Rs 13,710 per month
Rs 1,64,720 per year
Thus with the installation of groundwater recharge structure in housing
apartments in Alakananda; an amount of Rs. 13,710 per month and Rs. 1,64,720
per annum is saved.
Assuming no further increase in cost of electricity or no further increase in water
table, even the current savings in electricity are enough to pay back the entire
capital investment of the rainwater harvesting structures over their lifetime.
We did not go house to house asking whether they had tubewells. However, since
Alakananda has been a water deficit area, it is reasonable to assume that there
would be more private tubewells. Hence, the actual saving in electricity costs may
be much higher than what has been shown in the above calculation.
Over and above the monetary saving, by cutting down on electricity consumption,
rainwater harvesting will also contribute towards reduction in global warming.
Social Impact Of Rainwater Harvesting In Alakananda
One of the strongest and most visible impacts of rainwater harvesting in Alakananda has
been in community awareness, empowerment and recognition that they have received from
all sectors.
Alakananda was one of the pioneers of rainwater harvesting in Delhi. Yamuna Apartments
was the first to do rainwater harvesting though it was done as a part of the building
construction and hence it was not noticed by other localities. Subsequently, Rishi
Apartments made its rainwater harvesting structure. This was made with guidance from
Centre for Science and Environment (and NGO). The project was widely publicised in media
as one of the first models of rainwater harvesting in Delhi. This project was cited in all
reports about rainwater harvesting as an example. It made Rishi Apartments a well-
recognised name among all environmentally aware people in Delhi.
However, the real social impact of rainwater harvesting in Alakananda, started to manifest
itself after the project at NRI Complex was initiated by the Residents Welfare Association.
The project – made with 50% financial support from Coca-Cola India – was inaugurated by
the RWA with great fanfare. They invited all the RWAs of nearby colonies, all the residents
of NRI complex, community leaders from other areas and the political leaders of the area –
the MLA and the Municpal Counciller. The Chief Guest for the inaugural ceremony was the
Honble Chief Minister of Delhi.
The RWA conducted a traditional ceremony (pooja) for an auspicious start to the project.
The ceremony and the Chief Minister’s personal support for rainwater harvesting was widely
covered in media reports. Also, the involvement of the residents and other nearby RWAs in
the project right from its inception, went a long way towards enthusing other community
leaders to adopt the same in their areas.
The RWA of NRI complex got wide coverage in the media as responsible, environmentally
aware citizens. The Chief Minister’s active involvement gave the RWA recognition also as
partners with government in making Delhi Water Secure. RWAs from all over Delhi, got in
touch with the NRI Complex RWA to understand the practical issues to be handled when
doing rainwater harvesting. Since the NRI Complex RWA had a positive experience and
reinforcement of self image through the project, they were a major influence for other
RWAs to follow suit.
With a repetition of the same process in all other Alakananda Rainwater Harvesting projects,
it has become a badge of honour for an RWA to have done rainwater harvesting. Also, the
positive word-of mouth that was generated has probably been the single biggest contributor
to the rainwater harvesting movement in Delhi.
There has been a spate of rainwater harvesting project implementations in the past 3-4
years. This has been fuelled largely by the media recognition given to the initial adopters in
Alakananda. Also, the RWAs, government, NGOs such as FORCE and other supporters such
as Coca-Cola India worked in close co-ordination making it possible to learn from each
project and adapt the learnings for improvements in the future.
This sharing of learnings also impacted the government’s rainwater harvesting policy to
make it more people friendly. The problems that RWAs encountered in taking support
through the Delhi Government’s financial assistance scheme for rainwater harvesting were
discussed with the authorities by the people themselves – notably those from NRI Complex,
Mandakini Enclave etc. Based on the community recommendation, the government modified
the policy to make sure that every RWA that took up rainwater harvesting was guaranteed
atleast 50% of the support and the remaining too was to be expedited based on adherence
to designs. Practical realities, like construction problems because of cable lines, drains etc
were also discussed with the government. The subsequent policy modifications made the
verification norms more flexible and accomodative of ground level realities.
Also, the close interaction with local political leaders created interest in them for rainwater
harvesting. Through their word of mouth, the movement spread further. One interesting off-
shoot of the rainwater harvesting campaigns was that politicians got an opportunity to
interact with the residents of each locality on a welfare issue in which there was no scope
for negative politics. Their whole-hearted support to the NGOs has also helped cement a
positive relationship between the RWAs and the political leaders.
The good response to rainwater harvesting and encouraging results, further encouraged the
government to give more inducements – both financial and public image boosting - to the
public to adopt rainwater harvesting. First, the Delhi Government made Rainwater
Harvesting a key evaluation criterion with 25% weightage ,for RWA effectiveness. Based on
RWA scores on these criterion, annual awards were given to the Best RWAs of Delhi. Hence,
the best award almost always went to RWAs that had done rainwater harvesting. To top it
all, the Chief Minister instituted a special award – The Chief Minister’s Best Rainwater
Harvester Award - for RWAs and individuals who had adopted rainwater harvesting.
In 2008, Mandakini Enclave won the Chief Minister’s best Rainwater Harvesters Award. They
were awarded their prize in the Annual Bhagidari Mela attended by 1600 Resident’s Welfare
Associations and the bureaucratic heads of every department in Delhi government. They
also made a presentation on the rainwater harvesting in their area to all RWAs. This was a
big morale booster for Alakananda RWAs.
Today, the RWAs of Alakananda and its residents are perhaps the strongest and most vocal
champions of rainwater harvesting. Other civil society groups like Lioness Club, Rotary Club,
Inner Wheel Club, Art of Living and RWAs of many other areas joined in the Rainwater
Harvesting mission. As the ripples of learning spread, the recharge drive and the message
of save water and share water travelled far and wide. It is because of this that rainwater
harvesting in Delhi is primarily a voluntary, people led pogram. With more support to such
RWAs, they can definitely help the city become the country’s first – WATER SECURE city
Long Term Indirect Benefits of Rainwater Harvesting
Much progress has been made in the last decade in understanding that water has not only
an economic value, but social, religious, cultural and environmental values as well, and that
these are often interdependent.
If we incorporate nonuse values (hidden benefits) of the water which is being recharged by
these structures then these cost of making them will lag far behind the benefits they give.
Some of the non use values i.e. positive externalities are like:
• Benefits of preserving groundwater resource for future generations.
• Prevention of degradation of ecosystem services.
• Benefits to individuals through reduced expenditure on water disease treatment i.e.
health-related costs.
• Decreased water treatment costs by dilution of the contaminants which are
generated due to excessive overdraft of water.
• Increased property values due to ready availability of water.
SECTION 5
CASE STUDY
Mandakini Apartments, Alakananda
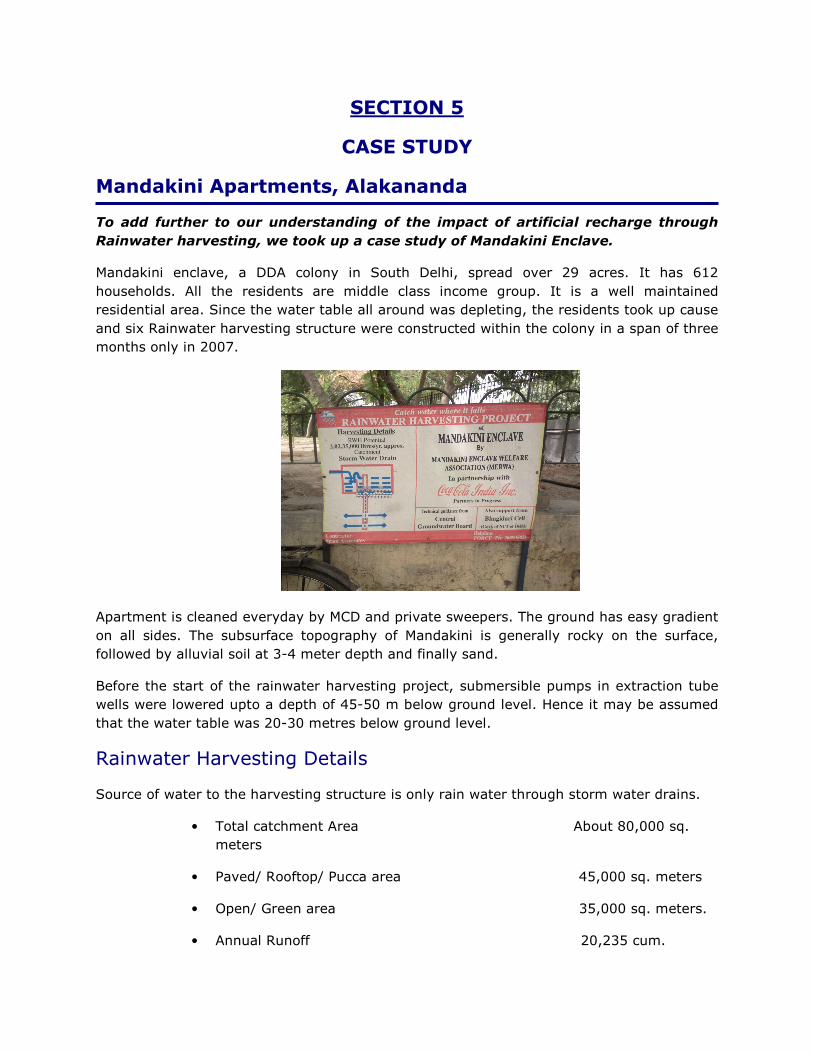
To add further to our understanding of the impact of artificial recharge through
Rainwater harvesting, we took up a case study of Mandakini Enclave.
Mandakini enclave, a DDA colony in South Delhi, spread over 29 acres. It has 612
households. All the residents are middle class income group. It is a well maintained
residential area. Since the water table all around was depleting, the residents took up cause
and six Rainwater harvesting structure were constructed within the colony in a span of three
months only in 2007.
Apartment is cleaned everyday by MCD and private sweepers. The ground has easy gradient
on all sides. The subsurface topography of Mandakini is generally rocky on the surface,
followed by alluvial soil at 3-4 meter depth and finally sand.
Before the start of the rainwater harvesting project, submersible pumps in extraction tube
wells were lowered upto a depth of 45-50 m below ground level. Hence it may be assumed
that the water table was 20-30 metres below ground level.
Rainwater Harvesting Details
Source of water to the harvesting structure is only rain water through storm water drains.
• Total catchment Area About 80,000 sq.
meters
• Paved/ Rooftop/ Pucca area 45,000 sq. meters
• Open/ Green area 35,000 sq. meters.
• Annual Runoff 20,235 cum.

• Runoff used for ground water 11500 cum.
Recharge and surface storage
For checking the entry of contaminated water, shutters have been provided to the
structures. This provides provision for bypass to prevent entry of contaminated water and
allowing entry of rainwater during monsoon period. The shutters can be shut or opened
when required.
The provision of bypass is essential as any accidental, regular household flow in the storm
water drains, even during the monsoon, can be stopped from getting into RWH structure.
This ensures detergent and phenyl water thrown in balconies and open areas does not
contaminate groundwater.
Regarding the conditions of drains leading to RWH chambers, because of natural slope,
water flows smoothly in the drains and there is no stagnation. Also scavengers are engaged
by the Mandakini Enclave RWA, for periodic cleaning and desilting of drains. In addition to
these, Jalis have been provided at strategic places in the drains to keep them clean of
debris.
Technical details of the project
Central Ground Water Board provides help and guidance. Detailed field investigations were
carried out and technical designs of rainwater harvesting structures were prepared.
Rainwater harvesting scheme adopted by Mandakini apartment has made use of an
abandoned tube well, putting it to productive use which had otherwise no utility. Therefore
the entire water harvesting scheme in the colony comprised of
• Recharge Trenches 4 nos
• Recharge Shaft 1 nos
• Recharge through abandoned tube well 1 nos

Fig.
Detailed layout plan of Mandakini Apartment with location of Rainwater harvesting
structures and flow of Runoff.
Example Of Design Of The Recharge Trenches Made In Mandakini

Partnerships with Stakeholders
FORCE NGO which played a critical role in the adoption and fuelling Water recharge
movement in Alaknanda is still active for the cause and organizes a number of promotional

activities involving the local residents.
Special workshops are organized by RWA with FORCE time to time for creating awareness
among the residents of Rainwater harvesting and precautions to be taken to prevent
contamination of water to these recharge structures. In addition circulars are issued on per
year basis to the residents listing out “Do’s and Don’ts” to ensure safe and sustainable rain
water harvesting. FORCE also guides and supports (with financial assistance from corporate
partners like Coca-Cola India) RWAs for ensuring pre-monsoon annual maintenance of their
RWH structures.
Financial Assistance
The estimated expenditure on six structures was Rs. 5,70,000 which has been contributed
as:
• Coca Cola (India) Ltd. Rs. 3,00,000 (sponsor)
• Residents of Mandakini enclave Rs. 1,70,000/-
• Government of NCT of Delhi Rs 1,00,000/-
The Rs. 1, 00,000 contribution of Government of Delhi came from Delhi Jal Board under its
BHAGIDARI SCHEME. The money was prudently deposited in RWA account by residents
and was used subsequently in the annual cleaning and maintenance
Impact of Rainwater Harvesting on water levels in Mandakini
Enclave
The runoff expected to be available for the prepared artificial recharge structure was
calculated to be 11,500 m³. Taking an efficiency of 80% of the recharge structure 9200 m³
of water is being recharged every year by harvesting Rainwater. The natural recharge is
assumed to be negligible as almost entire apartment is built up and the smaller open areas
due to their slope and geology are unable to significantly contribute towards groundwater
recharge.
Mandakini Enclave Apartment has one MCD tube well for watering parks and other activities
and two private tube wells. The average yield of all the tube wells was around 1.5 liter/s
Also, interviews with local MCD workers and Residents Welfare Association reveals that
average running time for MCD tube well was around 2.5 hour a day over the year and that
of private one was around 1.5 hr. Therefore annual draft of ground water:
1.5*60*60*30*12*2.5/1000 + 1.5*60*60*30*12*1.5/1000
= 7776 m³
Thus every year 1424 m³ of water is successfully additionally injected into the
aquifer even after taking into account the annual withdrawal of water for the

Apartment. That is perhaps the reason why that the result of artificial recharging
in Mandakini apartment was reflected from the very first rainy season in 2007
given in the Table below.
TABLE 6.1 LEVEL OF WATER IN 2007(in meters)
Water
Recharge
structure
unit no.
May June July August Rise in
water table
S1
20 19 18 15 5
S2
25 23 26 22 3
S3
27 25 23 20 7
S4
20 18 17 15 5
S5
30 24 22 19 11
S6
25 23.5 19 22 3
Thus there has been on an average 5.5 m rise in the water table which was very
encouraging in such a short period and as a result of only first rainy season for the
system.
Mandakini Apartment was among the first apartment to adopt artificial recharge of
Groundwater. They were also one of the first to win the Chief Minister’s Special
Rainwater Harvesting Award. It was their dedicated efforts, awards and success
story of continuous rise in water table which inspired other neighboring colonies
to adopt RWH.
Cost to Community of doing rainwater harvesting
Total cost of Scheme(including 6 recharging structures). Rs. 6,00,000
Since there are 612 flats in the locality, the cost per flat is Rs 600000/612
i.e community cost of making a capital investment in rainwater harvesting will be
Rs.981/- per flat. This will make them water secure atleast for the next 20 years.
The rainwater harvesting structures also need to be maintained. Cost of maintenance is
approx 2500/- per year per structure i.e Rs 15,000 per year.
Hence running cost of project per flat will be Rs 24 per year
When compared with the fact that in Delhi the average household monthly bill for
the highly subsidized metered water supply by DJB is Rs. 400-700 per month, this
seems like a small price to pay for water security and mental peace.
SECTION 6
RECOMMENDATIONS
New technology, traditional wisdom and people’s participation hold the key to resolving
water management problems. This has successfully been demonstrated by the communities
in Alaknanda.
The results from the artificial recharge schemes adopted by them have shown that there is
a demonstrable, sustainable rise in water level because of rainwater harvesting. The results
have also shown that the rise can be sustained even when there is large scale withdrawal of
groundwater also from the same area.
The technology used for rainwater harvesting i.e. recharge trenches with recharge wells and
the methodology for re-directing rainwater runoff to those structures, is also shown to be
very efficient in adding to the active aquifers in an area. That is the reason why, despite
there being little natural infiltration in the area because of large scale concreting, the
recharge to groundwater was still made possible by the rainwater harvesting systems. The
Impact Analysis report also shows that more needs to be done to prevent household used
water flows into the rainwater harvesting systems or to add filters to the structure designs
that remove soap water residues.
A cost-benefit analysis of rainwater harvesting in Alakananda, shows that with a nominal
one time investment on asset creation of just Rs 1000/- and an annual Maintenance cost of
Rs 25 / person, it is possible for a community to make itself Water Secure. Also, the savings
in electricity consumption are enough to write off the entire cost of the project. Effectively,
it means that it costs lesser for a community to adopt rainwater harvesting and make itself
Water Secure, than it does to extract water with depleting ground water levels.
Rainwater Harvesting is a means of not just ensuring Water Security, but also of ensuring
Community Empowerment and Participative Governance. When rainwater harvesting is
adopted in a Partnership format with communities leading the way and administration
supporting them, it can be a powerful tool for social transformation. As our experience in
Alakananda showed, the Residents Welfare Associations moved from strength to strength
simply because of their rainwater harvesting efforts. They not just made themselves water
secure, but helped create a positive atmosphere of collective working. They became a
credible voice for change – so much so that their inputs made the government modify its
Rainwater Harvesting Policy.
The Study brings out another developmental perspective. Technological solutions need to be
“appropriate” in order to contribute to development. Getting people involved and owning the
changes is the key to its sustainability. Community participation must be allowed an
important role in all conservation efforts, especially in urban water.
Alakananda was able to create within itself a microcosm reflecting the above developmental
perspectives. This win-win situation not only enabled Alaknanda residents to increase its
water resource when the entire south Delhi was dreading a water crisis. It also helped

Alakananda reduce risk and costs related to its own water supplies. In the process it set a
model for effective and sustainable management of water supplies for Delhi government
and for urban communities to influence policy change. In addition partnerships with NGOs
and other local community groups offer a way of accessing experience and expertise in
participatory approaches.
On the basis of the above, the recommendations for the future of rainwater harvesting are:
1) Rainwater Harvesting must be adopted in urban areas at a community level
2) For ensuring measurable rise in water levels, appropriate rainwater harvesting
technology must be used to enable direct recharge to the active aquifer.
3) A community led and partnership based approach to rainwater harvesting
implementation is necessary to ensure sustainability of the projects.
4) Cleaning and maintenance of the structures needs to be planned in consultation with
the community. This should also include maintenance of catchment topography and
keeping it contamination free
5) Up-gradation of rainwater harvesting filtration system needs to be done to enable
removal of soap residues from rainwater runoff in storm water conduits
6) Community initiative and leadership in rainwater harvesting must be ensured. Media
plans must include giving credit in mass media to the Community leaders. This is
necessary to kickstart a voluntary, community led rainwater harvesting movement.