Embed Size (px)
Citation preview

ICHEME SYMPOSIUM SERIES NO. 124
IMMEDIATE AND UNDERLYING CAUSES OF VESSEL FAILURES: IMPLICATIONS FOR INCLUDING MANAGEMENT AND ORGANISATIONAL FACTORS IN QUANTIFIED RISK ASSESSMENT
N W Hurst Research and Laboratories Services Division, Health and Safety Executive, Broad Lane, Sheffield S3 7HQ
This paper describes the causes of loss of containment for 230 reported incidents involving vessel failure. The aim is to better understand the role of organisational and management factors as a determinant of risk. For this reason the failures have been classified by both the direct causes, such as overpressure, and by failures of the underlying sociotechnical system. These underlying failures are both root causes (or origins) of failure such as poor design and failures of mechanisms which have the potential to prevent or recover unsafe situations. The importance of the results is discussed in terms of the use HSE makes of generic failure rates as part of RISKAT, the HSE Risk Assessment Tool.
PRODUCTION
Failures of vessels at industrial and major hazard plant constitute one important class of failure which is considered when Quantified Risk Assessment (QRA) methods are used to calculate the levels of risk from such sites. The Health and Safety Executive (HSE) makes use of the results of QRA methods to give advice to local planning authorities concerning the use of land around major hazard sites (1). Recently, HSE has commissioned research to investigate the main factors which contribute to the failures of some important items of plant equipment such as pipework and vessels. The results obtained for the pipework study have already been described (2) while this paper describes the analysis for failures of vessels. The work reported here was carried out by the scientific and technical consultants 'TeGhnica' Ltd (3).
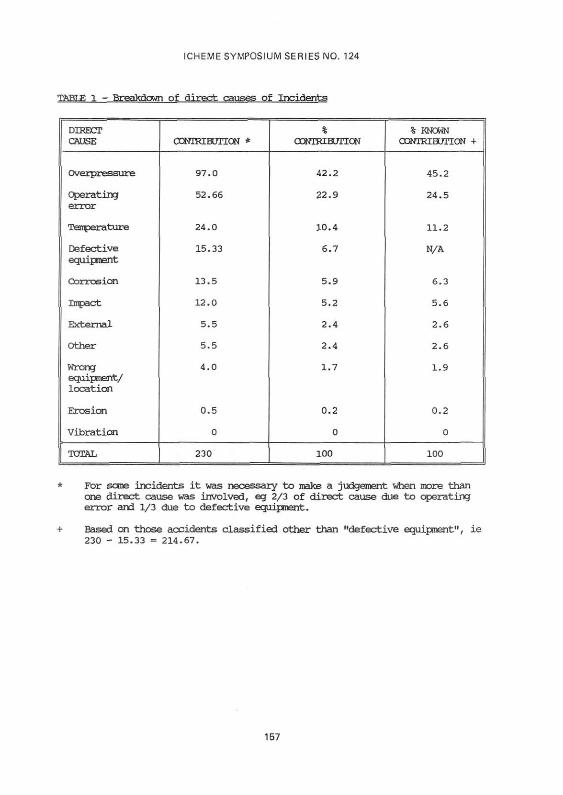
In commissioning this research HSE aims to better understand the role of organisational and management factors in determining the levels of risk at major hazard sites. In the first instance two important items of equipment (i.e. pipework and vessels) have been chosen and their failures investigated in detail. A failure classification scheme has been developed and used to analyse available data. This classifies failures according to the direct (or immediate) cause e.g. corrosion, impact or operating error; the underlying cause (or origins of failure) e.g. a design fault, maintenance error or construction error; and by the failure of a preventive mechanism (recovery failure) which (in theory) could have been used to prevent the failure from occurring e.g. a HAZOP study which was not carried out or a failure to review operating procedures which were badly designed. Thus each failure is classified in a three dimensional manner e.g. a failure which results from corrosion caused by bad design which was not recovered by a HAZOP study.
This paper reports the results obtained from an analysis of the failures of 230 vessels classified according to this structure. The results are presented
155

ICHEME SYMPOSIUM SERIES NO. 124
firstly as the contribution from direct causes of failure and secondly by the underlying cause and preventive mechanism.
RESUUS
Direct Causes of Failure
The general classification scheme used in this study was the same as that used for the previous assessment of pipework failures (2). The structure of the scheme is shown in Figure 1. Vessel failure incidents were analysed from previous reports, for which direct causes were identified. Vessel failures of unknown direct cause were not included in the analysis. Further details of the sources of data are given in Appendix 1. A breakdown of the direct causes in rank order of prevelance is shown in Table 1. The percentage known direct causes are also given, where the contribution from defective equipment (equipment known but cause of defect unknown) was removed and percentages of recalculated. These data are shown graphically in Figure 2. It can be seen that overpressure is the most common direct cause of the vessel failures with operating error also significant. These two categories alone account for almost 70% of the known direct causes of vessel failure.
A breakdown of direct causes to a secondary level of direct cause is given in Appendix 2. The tables in Appendix 2 provide a more detailed description of each of the direct causes of failure. The full report (3) includes a further description of each of the sub-causes given in Appendix 2.
Human Contribution to Vessel Failure
Operating errors accounted directly for 24.5% of known direct cause contributions, the majority of these being errors in control operation and operating errors due to failed communications. Operating errors involved leaving valves in the wrong status, filling the wrong vessels, but mostly overfilling and adopting inadequate or ad hoc procedures. Communication errors included inadequate information given to operators by the process control interface (procedures or verbally) assuming a vessel was safe when not, and poor permit to work systems. Other human contributions to failure involved vehicle impacts, overpressure due to the wrong material fed into a vessel and incorrect installation. The total direct human contribution to vessel failures (Table 2) is 32.8% of all known direct causes. Some of the entries in Table 2 are derived from the % of known direct causes and Appendix 2. For example, vehicle impact = (5.6% x 41.7%) = 2.3% from Table l and Table 6 Appendix 2. Other entries are similarly calculated using data from the full analysis (3). For example, "layering of reactive chemicals" is a sub-division of Appendix 2 not reported here.
Underlying Causes of Failure and Failures of Preventive Mechanisms
This section considers all the direct causes of failure and how the underlying causes of failure and failures of preventive mechanisms contribute to them.
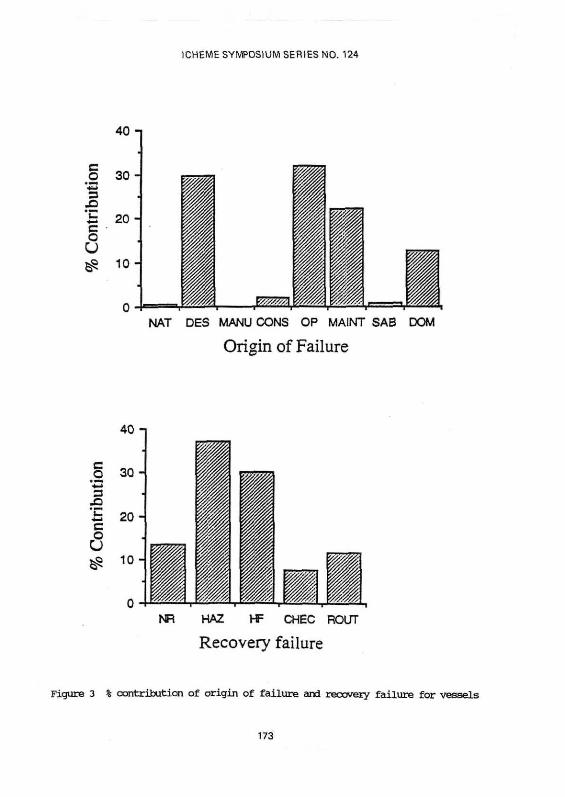
For 16% of incidents, the origin of failure (underlying cause) and recovery failures were unknown. Table 3 shows the percentages of known origin of failure and recovery failure for the remaining data. Table 3 was produced by considering all the direct causes together and represents Figure 1 "collapsed" into a single table. These data are shown graphically in Figure 3.
156
ICHEME SYMPOSIUM SERIES NO. 124
TABLE 1 - Breakdown of direct causes of Incidents
DIRECT CAUSE
Overpressure
Operating error
Temperature
Defective equipment
Corrosion
Impact
External
Other
Wrong equipment/ location
Erosion
Vibration
TOTAL
CCNTKEBUTION *
97.0
52.66
24.0
15.33
13.5
12.0
5.5
5.5
4.0
0.5
0
230
% CONTRIBUTION
42.2
22.9
10.4
6.7
5.9
5.2
2.4
2.4
1.7
0.2
0
100
% KNOWN CONTRIBUTION +
45.2
24.5
11.2
N/A
6.3
5.6
2.6
2.6
1.9
0.2
0
100
* For some incidents it was necessary to make a judgement when more than one direct cause was involved, eg 2/3 of direct cause due to operating error and 1/3 due to defective equipment.
+ Based on those accidents classified other than "defective equipment", ie 230 - 15.33 = 214.67.
157

ICHEME SYMPOSIUM SERIES NO. 124
TABLE 2 - Human contribution to the direct causes of Vessel Failure
Operating Error
External caustic attack due to repeated overfilling
Vehicle impact
Vessel hits protruding object/s dropped while being moved
Layering of reactive chemicals due to agitator not used
Wrong material fed into vessel
Overfilling
Incorrect installation at correct site
TOTAL
% OF KNOWN DIRECT CAUSES
24.5
0.2
2.3
1.4
0.5
0.5
1.5
1.9
32.8%
It can be seen that operations (32.0%), design (29.5%) and maintenance (22.2%) are all large origins of failure, with domino also significant (12.7%). Hazard analysis (37.0%) and human factors review (30.2%) are the major potential recovery mechanisms. 13.5% of failures were not recoverable, and were events of domino, natural or sabotage origin. The checking of the state of the plant was sub-divided into checking that activities such as replacement of equipment had been carried out (task checking) and activities which were part of the vigilance system, eg inspection (routine checking).
Matrix Analysis
The results can also be examined by looking at individual boxes of the underlying cause/failure of preventive mechanism matrix for each direct cause.
Table 4 gives the values of the eight most significant matrix boxes, as a percentage of known origins of failure/recovery mechanism. The columns in Table 4 do not add up to the entries in Table 3 because only the most significant contributions are listed.
158

ICHEME SYMPOSIUM SERIES NO. 124
TABLE 3 - % Contribution of Failures according to underlying cause of Failure and Failure of preventive mechanism (unknown origin, unknown recovery removed)
Natural Causes
Design
Manufacture
Construction
Operations
Maintenance
Sabotage
Domino
TOTAL
NOT RECOVERABLE
0.5
1.0
11.9
13.5
HAZARD STUDY
29.0
0.3
5.4
2.1
0.3
37.0
HUMAN FACTORS
24.53
5.7
30.2
TASK CHECKING
1.8
2.1
3.6
7.5
ROUTINE CHECKING
0.5
10.8
0.5
11.8
TOTAL
0.5
29.5
2.1
32.0
22.2
1.0
12.7
100.0
The table highlights the best strategies for reducing failures:
hazard reviews of designs to identify potential overpressure problems (21.0%)
human factors review of normal operations to identify potential operating errors (18.3%)
human factors review of normal operations which could result in overpressure (4.6%)
human factors review of maintenance activities to identify potential operating errors (4.4%)
routine maintenance for corrosion problems (3.9%)
hazard review of operations to prevent overpressure failures (3.6%)
These six categories alone would theoretically reduce 55.8% of failures. This figure would actually be 64.5% of recoverable failures, since overall 13.5% of incidents were not considered recoverable. Alternatively, referring back to Table 3 it can be seen that hazard review and human factors review would recover 67.2% of failures, equivalent to 77.7% of recoverable failures.
159

ICH
EM
E S
YM
PO
SIU
M S
ER
IES
NO
. 124
160

ICHEME SYMPOSIUM SERIES NO. 124
Comparison of Vessel Failures with Pipework Failures
A summary of the pipework and vessel failures data is given below in Table 5.
It can be seen that the two major direct causes were the same for both pipework and vessels. However, operating error was the dominant direct cause for pipework, followed by overpressure but for vessels overpressure was the major direct cause, followed by operating error.
The major origin of failure (underlying case) for pipework failures was maintenance, compared to operations as the major origin for vessels. The origin of failure is obviously related to the direct cause.
The major recovery failure (preventive mechanism) is obviously related to the direct cause and origin of failure. For pipework, where operating errors of maintenance origin were significant, a human factors review was the most significant recovery failure. For vessels, where overpressure incidents were the greatest direct cause, some form of hazard review (e.g. HAZOP or hazard review of procedures) was the major recovery failure.
Looking at the matrix analysis (individual origin of failure/recovery failure categories) the picture is similar. A hazard review of designs (Des/Haz) is the major cell in the matrix for both pipework and vessels. However, a human factors review of maintenance (Maint/HF) for pipework, and operations (OP/HF) for vessels, are the second largest matrix cells, reflecting the different major origins. Non-recoverable domino effects are more significant for vessels.
Despite some differences between causes of vessel and pipework failures, the general picture presented is very similar. Overpressure and operating error predominate. These two direct causes are often linked. In terms of underlying causes, design and hazard review failures are a clear theme. Maintenance and normal operations failures, both with human factors review failures, also predominate for pipework and vessels respectively.
161

ICHEME SYMPOSIUM SERIES NO. 124
TABLE 5 - Comparison of Pipework and Vessel Failure data showing; main causal contributions as a percentage of known contributions
Human contribution to direct cause of failure
Known direct causes
Major underlying cause of failure
Major recovery failure (preventive mechanism)
Matrix analysis
PIPEWORK VESSELS
41% 32.8%
Operating error (30.9%) Overpressure (45.2%) Overpressure (20.5%) Operating error (24.5%) Corrosion (15.6%) Temperature (11.2%)
Maintenance (38.7%) Operating (32.0%) Design (26.7%) Design (29.5%) Operating (13.7%) Maintenance (22.2%)
Human factors (29.5%) Hazop ' (37.0%) Hazop (25.4%) Human factors (30.2%) Checking (24.4%) NR (13.5%)
Design/Haz Rev (24.5%) Design/Haz Rev (29.0%) Maint/HF (14.5%) OP/HF (24.5%) Maint/Checking (12.7%) Dom/NR (11.9%)
DISCUSSION
Land Planning and RISKAT
As explained in the introduction, HSE is committed to using Quantified Risk Assessment (QRA), in particular the risk assessment tool RISKAT (1) to provide advice to planning authorities about land use around major hazard sites. An important question is how does RISKAT take account of managerial and organisational issues.
The approach used at present is to assume that the installation is managed at least to average standards with monitoring by the regulatory authorities to check this. QRA is then carried out on a "hardware only" basis using generic failure rates from all causes including design errors, operating errors and so forth. Thus human and organisational factors are implicitly included in the generic failure rate data which are then applied in a site-specific way according to details of vessel sizes, pipe sizes and process conditions.
In this approach (1) a representative set of failure cases are listed (for example failure of vessels, leaks from vessels, failures of pipework, leaks from pipework); the failure rates for each case are based on generic failure data and the consequences are calculated using appropriate models for dispersion of toxic gases, radiation from a fireball etc. This enables the risk associated with the installation to be found.
This approach can be contrasted with a very detailed approach in which component failure rates specific to a plant are used with fault-tree analysis to arrive at the probability for each release type. These two approaches are very similar at a conceptual level but it needs to be stressed that the resource requirements for the two methods are quite different.
162

ICHEME SYMPOSIUM SERIES NO. 124
The first approach using generic failure rates is generally appropriate for HSE in the land planning area in which consistent advice can be offered to local authorities within the available resources.
A useful additional approach is starting to evolve in which a "hardware only" QRA of the type carried out using RISKAT is used to calculate risk for a site using generic failure rates. The risk figure is then modified on the basis of a site specific audit of safety management systems. This class of approach is thus called the modification of risk approach. The approach can only be fully validated when the following guestions can be answered:
what are the key indicators, or factors, which relate to, or measure, the guality of the safety management at a plant
how are those factors recorded and scored
what effect does charging these factors have on the risk from a plant i.e. what weights can be attributed to them in a risk analysis.
A contribution to these guestions is provided by the analysis reported in this paper. Thus the generic failure rates used for vessels in RISKAT can be considered to be made up of components from different direct causes e.g. Table 1, 24.5% of the failures are due to operating errors. Perhaps more importantly the generic failure rates can also be considered to be the sum of contributions from the origins of failure and preventive mechanism failures which are at the root of the hardware failures.
Generic failures rates must reflect the direct causes which have given rise to the actual incident.[2] However, the direct causes are symptoms of sociotechnical system failures. These sociotechnical failures are reflected in the underlying causes of origin and recovery failures as defined by the structure of the classification (Fig 1). Therefore, although the human contribution was 41% and 32% of known direct causes of failure for pipework and vessels respectively (with operating error being 31% and 24.5% respectively) this is not a useful way to categorise the various contributions to generic failure rates for the purpose of comparing different plants. The underlying sociotechniccal causes are more valid in this respect. Thus we see from Table 3 that 29% of the generic failure rate for vessels is made up from design errors which are not recovered by HAZOP type studies.
Other aspects of the research which HSE has commissioned are aimed at providing answers to the first two guestions posed above. The aim is to provide an audit system which can measure the guality of safety management at a plant, and to link the results of the audit into QRA procedures via modification of generic values for such items as failure rates.
CONCIUSIONS
This paper has described the causes of loss of containment for 230 reported incidents involving vessel failure. The aim was to better understand the role of organisational and management factors as a determinant of risk. For this reason the failures have been classified by both the direct causes, such as overpressure, and by failures of the underlying sociotechnical system. Ihese underlying failures are both root causes (or origins) of failure such as poor design and failures of mechanisms which have the potential to prevent or recover unsafe situations. The importance of the results is discussed in terms of the use HSE makes of generic failure rates as part of RISKAT, the HSE Risk Assessment Tool.
163

ICHEME SYMPOSIUM SERIES NO. 124
REFERENCES
(1) Hurst N W, Nussey C and Pape R P Development and application of a Risk Assessment Tool (R1SKAT) in the Health and Safety Executive. Chem. Eng. Res. Des. 67, 1989.
(2) Hurst N W, Bellamy L J, Geyer T A W and Astley J A A classification scheme for pipework failures to include human and sociotechnical errors and their contribution to pipework failure frequencies. J. Haz. Mat., 1990.
(3) HSE contract research by Technica 1991. Organisational, Management and Human EActors in Quantified Risk Assessment, Interim Report by L J Bellamy and T A W Geyer, Ed J C Williams.
164

ICHEME SYMPOSIUM SERIES NO. 124
APPENDIX 1 - Sources of data
A variety of data sources were examined including general literature (journals etc) and also databases available in the HSE. These are listed below.
A definition is also given of " Vessel Failure'.
General Literature/Journals
Hydrocarbon Processing
Petroleum Review Oil and Gas Journal loss Prevention Bulletin Plant/operations Progress M and M Protection Consultants, Chicago, "100 Large Losses" 11th Edition Lloyd's List
Databases
MHIDAS (SRD/HSE Major Hazards Incident Data Service) searched for the incident origin "PSVESSEL" (pressurised storage vessel)
MARCODE 1 and 2, the HSE databases of selected investigated accidents and dangerous occurrences searched for wordstem "VESS" in the text description field.
Definition of Vessel Failure
Incidents included in the analysis had to fulfil all the following:
involve the failure of a vessel or associated equipment (eg vessel valve, sight glass, etc). Failures of hoses/couplings were not included.
occur on land based installations using, manufacturing or storing chemicals (including associated loading/unloading facilities).
occur on site.
have led to a release of materials from a vessel with the potential to cause death or injury.
165

ICHEME SYMPOSIUM SERIES NO. 124
APPENDIX 2
BREAKDOWN OF DIRECT1 CAUSES TO A SECONDARY IEVEL
1 . OVERPRESSURE
UrK»ntrolled/unexpected chemical reaction
Explosion/fire
Inadequate vent/pressure relief system
Hydrostatic pressure
Source pressure exceeds vessel pressure
Overfilling
Surge pressure/water hammer
Changed equipment/process allows overpressurising
No/inadequate cooling of vessel
Release of material from safety relief valve/bursting disc/vent/sight glass
Freezing contents cause overpressure
Unknown
TOTAL
CONTRIBUTION
15.25
39.0
10.83
2.0
1.83
3.33
3.0
2.0
0.5
11.25
1.0
7.0
97.0
% OF OVERPRESSURE
15.7
40.2
11.2
2.1
1.9
3.4
3.1
2.1
0.5
11.6
1.0
7.2
100
166

ICHEME SYMPOSIUM SERIES NO. 124
2. OPERATING ERROR
Error in (control) operation
Operating errors due to failed/no communication
Insufficient isolation
Inadequate cleaning of vessel leaves reactive residue
Unknown
TOTAL
CONTRIBUTION
37.41
13.25
1.5
0.5
0
52.66
% OF OPERATOR ERROR
71.0
25.2
2.8
0.9
0
100
3. TEMPERATURE
External fire
High temperature effects
Cold external environment
Unknown
TOTAL
CONTRIBUTION
20.0
2.5
0.5
1.0
24.0
% OF TEMPERATURE
83.3
10.4
2.1
4.2
100
167

ICHEME SYMPOSIUM SERIES NO. 124
4 . DEFECTIVE EOUIFMENT (Cause Unknown)
Valve
Level measuring equipment/gauge
Regulator on cylinder
Seal
Safety interlocks
Glass viewing port
Extraction system
Condenser nipple
Unknown
TOTAL
COOTKIBUTTON
6.33
3.0
1.0
0.5
0.5
1.0
1.5
1.0
0.5
15.33
% DEFECTIVE EQUIFMENT
41.3
19.6
6.5
3.3
3.3
6.5
9.8
6.5
3.3
100
5 . CORROSION
External caustic attack due to repeated overfilling
Stress corrosion
Valve corrosion allows release of vessel contents
External corrosion
Chemical stress
Brittle fracture
Unknown
TOTAL
CONTRIBUTION
0.5
6.0
1.0
1.0
1.0
2.0
2.0
13.5
% DEFECTIVE EQUIPMENT
3.7
44.4
7.4
7.4
7.4
14.8
14.8
100
168

ICHEME SYMPOSIUM SERIES NO. 124
6 . IMPACT
Vehicle impact
Impact of other plant equipment
Vessel hits protruding object/ is dropped while being moved
Missile attack .
Unknown
TOTAL
OOWTRIHTTiaj
5.0
1.0
3.0
1.0
2.0
12.0
% OF IMPACT
41.7
8.3
25.0
8.3
16.7
100
7 . EXTERNAL LOADING
Failure of vessel supports
Earthquake
Bending/dynamic stresses imposed when in use
IDynamite attack
Unknown
TOTAL
QDNTRIBUnON
2.0
1.0
1.5
1.0
0
5.5
% OF EXTERNAL LOADING
36.4
18.2
27.3
18.2
0
100
169

ICHEME SYMPOSIUM SERIES NO. 124
8 . OTHER
Software failure
Formation of product/dirt in valve prevents closure
Uncontrolled chemical reaction
Unknown
TOTAL
CONTRIBUTION
2.0
2.5
1.0
0
5.5
% OF OTHER
36.4
45.4
18.2
0
100
9 . WRONG FXXJIFMEWT/IDCA.TTON
Incorrect installation at correct site
Unknown
TOTAL
CONTRIBUTION
4.0
0
4.0
% OF WRONG
EQUIPMENT/ LOCATION
100
0
100
1 0 . EROSION
Section of broken equipment erodes vessel interior
Unknown
TOTAL
CONTRIBUTION
0.5
0
0.5
% OF EROSION
100
0
100
170
ICHEME SYMPOSIUM SERIES NO. 124
RECOVERY (PREVENTIVE) MECHANISM
ORIGIN OF FAILURE
(BASIC/UNDERLYING CAUSE)
Natural causes Design J*\s S'm *^m Z
• Manufacture/Assembly^* J *^ • ' ** Construction/Installation ••* ' ^
^ - Corrosion
During norma! operation^ M a i n t e n a n c e ^ \ ^ ' ^ " s>'^" ^S' y
Unknown origin^*• J1* ^** S • * V / -^ S B b o t a g e ^ x - C ^ ' 0 ' 0 ' ' V ' ' ^ - - ^
Erosion
External loading
Impact
Overpressure
Vibration
Temperature
Wrong equipment
Operator error
Defective pipe or equipment
Unknown
Other
DIRECT (IMMEDIATE)
CAUSE
Figure 1 Structure of classification scheme showing direct cause, failure and recovery failure
Origin of
171

ICHEME SYMPOSIUM SERIES NO. 124
CO
<U
rs
q g 5 c 5 o c
Vibration Erosion
Wrong eq/loc Other
External load Impact J
Corrosion Temperature I
Operator error Overpressure
'mmmmmmi<mmi< mmwmmm%msm%MMmmmm&.
10 20 30
% Contribution 40 50
Figure 2 % contribution of known direct causes
172
ICHEME SYMPOSIUM SERIES NO. 124
40 n
3 0 -
20 -
10 -
2
NAT DES MANU CONS OP MAINT SAB DOM
Origin of Failure
40- i
30 -
2 0 -
10 -
NR HA2 HF CHEC ROUT
Recovery failure
contribution of origin of failure and recovery failure for vessels
173