Embed Size (px)
Citation preview
C E H T R a iMimmmcmü m s ^ m o b h ä p i ä
NACIONKS l • N ' .. ' A S
Distribution Limited I
URBAN-RURAL PATTERN OP POPULATION DISTRIBUTION IN LATIN AMERICA AND CHANGES IN THIb PATTERN DURING THE LAST FE vi DECADES
fcy
JUAN C. ELIiAGA
Professor in the United Nations Latin American Demographic Centre
Santiago, Chile 1964.
D.2/5 m


1. The degree of urbanization
Latin /cic-rica has undergone r;..pid urbanization during the last three decades. This processj as elsewhere in the world, has involved important sociological changes caused principally by the movenent of considerable masses of the population fron the country and the smaller towns into the big cities.
Although up-to-dcte census figures are only available in the case of twelve countries, it can be said that in I960 the urban population of Latin Anerica constituted less thrn 50 per cent of the total (in accordance with the definition for census purposes of urban population). In view of the tendencies apparent in this process of urbanization, one r/iay expect in the next few decades a continuation of this geographical redistribution of the population and, in consequence, the emergence of new cities and the development of the suburban areas of the great centres of population.
The degree of' urbanization differs significantly from one country to another within the region. In addition, it bears no relation to the density or to the volume of the population. It is probatie th?:t the differences expressed by the census-figures do not always reflect the real situation. Such figures may under-state the case or, on the other hand, give an exaggerated picture, owing to the different definitions of urban population thrt heve been employed or to different meanings attached to the smie theoretical criterion (e.g. the size of the popul-ation centre), depending on the differing conditions of economic and social development within the are. Bearine in mind these inevitable limitations we will consider, for the purposes of comparison, the degree of urbc nization in accordance with the definitions of urban population used for census purposes, end, in addition,

the population-figures of centres with over 20 000 inhabitants. Definitions, for census purposes, of urban population generally include small towns with adminis-trative jurisdiction over minor political areas, or simply towns of over 1 000, 2 000 or 2 500 inha.bita.nts, as the case cv y be. By including only centres of over 20 000 inhabitants in the figures given for urban population, one is able to eliminate from the survey agglornerrtions that fire really serai-rural in character -from the point of view of economic activity- and, in gener l, to facilitate comparison between one country and another. Table 1 denotes the degree of urban-ization rs of 1950, according to the criterion described above, and the figures corresponding to the year I960 in those countries where a census had been held.
Three out of the four countries with the largest populations, i.e. Brazil, Mexico and Colombia (with a combined population, in I960, of about 120 000 000), have an urb'n population of approximately 45-50 per cent of the total. Ten years previously, the urb'n population of these countries was between 36 and 43 per cent. The fourth of these four most highly:populated countries, Argentina,, was the most urbanized of all -with the probable exception of Uruguay, for which there are no census-figures- and it was probably still the.most urbanized country in I960.
Countries that have a relatively small population, but are nevertheless the most urbanized except for Argentina, rrei Chile, Cuba and Venezuela, with urban po ulations constituting, in 1950, 62-.5.n 56.3, fnd 53.8 per cent respectively, of the total population of e-rch country. By. I960 the proportion had risen, in Chile, to 66.5 per cent, and in Venezuela to 62.5 per cent.
The remaining countries show a iower degree or urbanization, prob: bly below 40 per cent in I960, with the exception of Panama and, especially, Peru (where the proportion was close to 50 per cent) ..
If v/e now consider the degree of urbanization in relation to the relative import'nee of the population of nuclei of over 20 000 inhabitants, it can be said that in 1950 only four countries (Argentina., Chile, Cuba and Venezuela.), 'gave evidence of conditions coupar;:bLe to those obtaining in the countries of Western Europe or in the United Stites, that is to say with percentages oiv urban,.population in relation to total population of higher than .30 per cent, and even, in the cases

- 3 -
Table 1
URBAN-NUF.. L GO' . P O S I T I O N Of THE POPULATION OF 18 L a ï I N AMERICAN COUNT;ISS IN 1950 IND I960 (AFPROXIHÀTE DAÏIS)
Country
Tot?l Population (thousands)
1950 I960
Urban papulation (Census definition)
(per cent)
1950 I960
Population living in neclei of over 20 000 inhabitants (per cent)
1950 I960
Eri zil 51 944 70 967 36.2
Mexico 25 791 34 923 42.6
Argentina 15 694 20 009 62.5 Colombia 11 548 D/ 38.0
« /
Peru 6 208 10 364 Chile 5 933 7 340 60.2 Cuba 5 829 y 56.3 Venezuela 5 035 7 524 53.8 Ecuador 3 203 4 581 28.5 Guatemala 2 791 y 25.0 Bolivia 2 704 D/ 33.6 Dominican Republic 2 136 3 014 23.8 El Salvador 1 656 2 511 36.5 Honduras 1 369 1 883 29.0 Paraguay 1 328 1 817 34.6 Nicaragua 1 057 È/ 34.9 Panama 805 1 076 36.0 Cost" Rica 801 1 325 33.5
y
4 5 . 1 ^
50.7
S/
47.1 66
3 5 . 3 ^ d/ d/ 30.5^ 39.02/ S/ 35.4-S/ 41.5
y
34.5-y
18.4 26.4 47.9 22.4 14.2 42.9
36.3 31.6 18.4 11.2 a . 9 12.1 12.9
15.6
S/ 30.4 22.6
29.1^ 33.6
S/ & /
28.4 e/
47.2^ 27.5^ d/
^ /
17.3^ 11.5^ 16.8^ e/
35.0 22.2-
a/ This figure includes th? t part of the population permanently resident in the princip. 1 nucleus, recording to the particular definition of this nucleus in e: ch country (See Appendix 1).
b/ Based on provisional f-nd interim data.
c/ Figures b.rsed on samples (a 1 per cent sample in the case of Chile, and a 5 per cent sample in that of El Salvador).
d/ No census.
e/ No dat/ available, F/ 1940.

of Argentina and Chile, of atove 40 per cent. By I960 the ratio of urban to total population oust have risen considerably, although there are no figures available to support this assortion; es is demonstrated ty the case of Venezuela, which shown a rise from 31 per cent to 40 per cent over ten years. On the other hand, Mexico, Brazil, Peru, Ecuador and probably Colombia show, in I960, a ratio of urban to total population of about 30 per cent.
This means that/ except for four countries. (Argentina, Chile, Venezuela and Cuba), the relatively small proportion of the population that lives in towns of over 20 COO inhabitants, combined with the tendencies towards accelerated urbanization hitherto observed, give grounds for predicting an increasing concentration of the population i'n urban centres of this nature. This process will pic inly be highly significant in countries that, like Brazil, Mexico and Colombia, have relatively large population. In the smaller countries, such as the Central American Republics, Ecuador, Bolivia and Paraguay, urbanization will not, in the near future, cause the emergence of important urbfn centres. In these conditions, as has happened up to now, the city which flready enjoys a predominant position in the country will in-crease this predominance still further.
2. The big cities
In I960, Latin ¿¡'aeriea contained 10 cities of over one million inhabitants. The combined population of these cities is over 25 millions, which constitutes approximately 11 per cent of the total population of the area, ' •
A further ton cities with populations of between 500 and 800 thousand contain, in their turn, a population of nearly 6 millions. Nine of these cities are to be found in the. countries with the biggest populations: Brazil, nexico, Argentina and Colombia.
Finally, mention must be made of a further 20 cities of between 250 and 500 thousand inhabitants, including eight cities that are capitals of their respective countries.

These figures indicate th-'t there are, at present, no less that thirty cities tha.-;, because of the dimensions they have ;lready attained, (the 20 cities which had already reached the half million inhabitrnts in I960 and few approximating that figure), or because of their import nice as political centres, (the eight capital cities to referred to in par-graph above) must be considered as urban nuclei with growth problems now and in the immediate future.
Twenty years ago, around 1940, there were only four cities of over one million inhabit nts, four of from 500 to 950 thousand, fjid eight of from 250 to 499 thousand; this last category included three capit -1 cities.
If the tendencies towards urban concentration observed in the last two decades are maintained, it is prob bLe thot, by 1970, there will be 26 cities of over half a million inhabitants, as compared with 20 today. Hore important, however, th-'n the more number of new big cities in the growth of the population within cities of this size. Table 2 gives an idea of the evolution of 108 nuclei of population that, around 1950, had over 20 000 inhabitrnts, situ: ted in four countries: Brazil, Mexico, Colombia and Venezuela. These nuclei are classified according to the number of inhabitants they cont-ined in, approximately, the following years: 1940, 1950 and I960. The figures for 1970 arc estim tes and are based on the assumption that past rates of growth >¡111 be maint-ined, or, in some cases, diminish.
Of the 108 nuclei under consider-:tion there wore, in 1950, 16 of over 100 000 inhabitants. In I960, there were 63, and by 1970 one ma.y expect there to be 90, I/ifhen wc consider the cities of over half a million inhabitants, a total of 3, in 1940, increases to 13 in I960 and will probably rise to 18 by 1970,

Table 2
DISTRIBUTION ACCORDING TO SIZE, IN 1940, 1950, I960 AMD 1970 • (iiPPROXIMATE Di.T3S), OF 108 NUCLEI OF OVER 20 THOUSAND IN-HABITANTS (IN 1950), SELECTED FROM BRAZIL, MEXICO, COLOMBIA
AND. VENEZÜ3LA
Size (Number ef inhabitants) 1940 1 950 I960 1970 ^
Over 1 000 000 3 3 5 9 500 000 - 999 000 - 2 8 9 250 000 - 499 000 5 9 8 13 100 000 - 249 000 12 19 42 59 .50 000 - 99 000 22 41 39 18 20 000 - 49 000 49 34 6 -
Under 20 000 17
Total 108 108 108 108
a/ Estimate

The four countries to which these figures refer are especially important as being regions where in the 1?st two decades there have emerged numerous important nuclei evincing r- pid growth tendencies and where new centres of population are expected to e:merge in the near future. This was caused not only by the volume of the population (in the ca.ses of Brazil and Mexico) but by the important regional development that took place in these areas. In the majority of the remaining countries the growth has been concentrated in the principal nucleus, as in the cases of Chile, Peru, Cuba, Bolivia and, in general, the countries of Central America..
3. Disparate growth of the urban nuclei
In tight of the fourteen countries listed in Table 3, the average annual r-'te of increase of the population was over 2.9 per cent in the decade 1950-1960. In a further four countries it was bf-.tween 2.5 'nd 2.8 per cent. Only in Argentina w- s there a. relatively small increase -1.7 per cent. From the remaining Latin American countries there are no figures available yet.
Tvith such high r-'tes of incrc so, it is h. rrlly surprising that the population of the urban centres should • Iso have shewn an -xtrf.ordina.ry large growth. Table 3 shows the x: tes of growth of the cities and of the minor nuclei, classified for this purpose according to the number of inhabit.'nts they contained around the year 1950. This method of cl: ssific ti-m ensures that the data are strictly comparable over a. given period of time.
Rapid urban growth is not confined to the principal centres of population, as right be thought. In several countries, and especially during the lest two decades, the cities of over 100 thousand inhabitants and the smaller nuclei of between 20 -~nd 99 thousand inhabitants (excluding, in both cases, the principal nucleus in each country) grew, on an average, the same rate a.s the principal nucleus. This was so in the cases of Brzil, Mexico, Colombia (1938-1951) and Venezuela. In these countries the r-te of growth of the principal nucleus was over 4 per cent during the two decades after 1940, and freouently over 5 per cent. Before 1940 the rate of growth had been slightly smaller, generally spea.king, but still close to, or even exceeding, 4 percent. Similar figures could be quoted for
1/ In Argentina, where there occurred a similar process as reg< rds regional development, the growth of the urban nuclei anpears to have been slower (with the import' nt exepetion of the Gran Buenos Aires district) than in the other four countries mentioned above. This assessment is, however, provisional in character, since the figures subdivided by "loc-lities", or nuclei, from the I960 census, 're not yet available.

the growth of the rem- ining nuclei of .ver 20 thousand inhabit: nts.
In Argentina, and Chile the growth of the principal nucleus vr s also extremely rpicl. This contrasts with the relatively slow growth of the remaining nuclei of over 20 thousand inhabitants, although there were exceptions to this rule. In'both countries, however, the figures available from the last census do not yet permit an accurate evaluation of the changes thrt have occurred in the last decade.
In five of the countries listed in Table 3 ( C o s t - Rica, El Salvador, Honduras, Panama and the Dominican Republic) the ra te of growth of the principal nucleus is also high, close to or exceeding 4 per cent, and particularly high in the Dominican Republic (6.7 per cent). Here we .are speaking, however, of small nuclei, of ap-proximately 100 to 300 thousand inhabitants. In these countries, it would not be worth while to consider the growth cf the other nuclei of over 20 thousand inhabitants., in view of their small number (see Table 3).
Peru and Ecuador manifest siralar ch; ractoristics. The r-te of increase of the nrincip-1 nucleus is sonewh-1 above 5 per cent, and the corresponding figure for other nuclei of over 20 thousand inhabitants is about 4 per cent. In the case of Peru such figures represent an average over 21 year (1940-1961), from which it might be sunrdsed that the r. te cf growth during the deca.de 1950-1960 w-s even higher.
conclusion, it can be said th; t, of the nine Latin American countries with the largest populations, with the exceptions (already noted) of Argentina and Chile, and of Cuba (for lack of information) -that is to say, in Brazil, Mexico, Colombia, Peru, Venezuela, end Ecuador, the population cf the cities of over 20 thousand in-habitants, both in the ca.se <f the principal nucleus and of the other cities of ever 100 thousand inhabitants and of the nuclei of from 20 to 99 thousand inhabitants, registered during the last decade an increase of around 4 per cent or higher. This generalization can also be extended to include the previous decade, at least in several cas^s for which data are available.

Table 3
ÀivRU/A R..TSS -OP INCREASE OF THE TOT il POPULATION, OF THE POPULATION OF THE PRINCIPAL NUCLEUS AND OF THE POPULATION OF CITIES AND i;INOR NUCLEI CLASSIFIED BY NUMBER OF INHABITANTS IN 1950 (APPROXIMATELY), IN FOURTEEN
' LATIN J23RICAN COUNTRIES IN THE LAST FEW DECADES
Country
Intercens?! Period
Dates Du-ration (n)
Annual rates of increase, in percentages I T — • " Summary Other Nuclei Nuclei Rest cities of 20-Prin-
Country cipal nucleus
of- ever 99 000 100 000 inhab. inhab.
of over 20 "000 inhab.
of coun-try
• (12) (36). (50) Br'¿il 1940-50 9.83 2.3 3.9 4.0 4.3 4.0 2.0
1950-60 10.17 3.0 4.3 4.6 > 3 4.6 2.6
(9)- (52) (62)
Mexico 1930-40 9.75 1.8 3.6 d/ d/ • d/ 1940-50 10.25 2.6 5.2 5.1 d/ d/ 1950-60 10.00 3.0 4.6 4.7 4.6 4.7 2.3
(8) (9) Argentina 1914-47 32.92 2.0 2.3 & b / d/ & b/ 1947-60 13.50 I.7- 3.0 0.8-' d/ 1.2^
(5) (22) (28)
Colombia 1930-51 12.83 2.2 5.1 5.6. 4.9 5.2 1.5
(10) ( I D . . . Peru • 1940-61 • 21.00 5.1 c/ 3.6 4.6 . ••• 1.8
(2) (21) (24) Chile 1930-40 10.00 1.6 2.9 0.9 1.5 2.1 1.3
1940-52 11.42 1.4 3.0 1.3 2.4 2.6 0.7 1952-60 8.58 2.5 4.1 È/ d/ d/
(2) (17) (20)
Venezuela 1936-41 4.92 2.7 6.5 3.6 3.7 4.8 2,2 1941-50 9.00 3.0 6.9 7.1 7.0 7.0 1.4 1950-61 10.2.5 3.9 5.4 5.7 6.2 5.8 2.8
(1) (4) (6) Ecuador 1950-62 12.00 2.3 5.4 4.4 3.8 4.8 2.4

- 10 -
Table 3 (cent.)
Annual rates of increase, in percentages i r Intercensal Summary
Period Other Nuclei .Nuclei Rest cities of 20- of over of
Dura.- Prin- of over 99 000 20 000 coun-Country Dates %±on . Country cipal 100 000 inhab. inhab,, try (n) nucleus inhab.
(1) (2) Dominican Rep. 1950-60 10.00 3,4 6.7 «/ 3.8 6.1 3.0
(2) (3) El Salvador 1930-50 20.08 1.3 2.9 2/ 1.5 2.4 1.1
1950-61 10.92 2.7 3.8 0/ 3.4 3.7 2.6
(1) (2) Honduras 1950-61 10.83 2.9 5.6 2/ 8.6 6.4 2.6
(1) Paraguay 1950-62 12.00 2,6 3.2 £/ £/ 3.2 2.5
(1) (2) Panama 1930-40 10.67 2.7 4.3 3.5 4.1 2.2
1940-50 10.25 2.5 3.6 £/ 1.6 3.1 2.2 1950-60 10.00 2.9 4.1 0/ 1.2 3.6 2.5
(1) Costa Rica 1927-50 23.00 2,2 2.9 £/ c/ 2.9 2.1
1950-63 12.83 3.8 3.7 0/ c/ 3.7 3.9
8/ 2(Nn-N°) } where N° and Nn are the population at the beginning and end of the n (i/1 + H°) census-period, and n is the number of years in the census-period.
b/ Population of intermediate ¿cfciinis trative divisions ('Dartidos' or * departamentos') with cities of over 100 thousand inhabitants as assessed in the 1947 census.
c/ In 1950 there was no nucleus in this category. '
d/ No adequate data available. MOTS; Figures in parentheses indicate the number of nuclei in that size-category
in 1950. In all periods the growth of these nuclei were taken into account, irrespective of their size at previous or later census.

- 11 -
4. • Concentration of the population in urban areas
It is frequently stated, as a commonplace, that the countries of Latin ¿nerica possess few importi rit cities (in many cases only one), and also that the principal nucleus is of disproportionately large sizie in relation to the other nuclei of second or third rank. The first assertion still holds true for the majority of these countries, i.e. these with snail populations, but it is no longer applicable to Brazil, which has 31 cities of over 100 thousand inhabitants, while Mexico has 17, c-nd Colombia has 10. Neither, in all probability, has it been a piicable to Argentina for several decides.
Nevort eless, the principal nucleus is still disproportionately large. In 1950, the principal nucleus of Mexico (i.e. the Federal District) contained about twice the combined population of the nine other cities of over 100 'thousand inhabit.- nts, ; n d in Argentina (in 1947) the population of the Gran Buenos Aires district was three times that cf the remaining 8 nuclei of over 100 thousand inhabitants. In I960, comparing the populations of the sane nuclei, the proportions1 in each country were roughly the same. The situation in Venezuela is similar to that in Mexico, and th<-1 in Chile to that in Argentina, but it must be bcrn in mind that, in the cases of Venezuela and Chile, there were only 2 centres of over 100 thousand inhabitants in 1950.
Brazil and Colombia present a somewhat different picture. The population of the principal nucleus is only half the combined population of the remaining nuclei of over 100 thousand inhabitants. In each country, the combined populations of the first and second largest nucleus is approximately eaual to the population of the re-maining cities of over 100 thousand inhabitants.
In the other cuntries, except for Uruguay and Cuba (for which there are no recent census-figures), the fact that besides the principal nucleus there are only one or two cities of any iiport-nce, or in some cases none at all, confers an overwhelming importance on the principal nucleus, a.s in the cases of Panama and Costa Rica and, to a lesser extent, Peru and Paraguay.

- 1 2 -
The import-nee of the principal nucleus in relation to the toti 1 population of the country is an exact measure of the ccncentr-tion of population, and this facilitates comparison in terms of space and time. For this purpose, we define the principal nucleus in a special way, including in this term, in addition to the central city, the contiguous urban area falling within its immediate sphere of influence. In ¿eneral, we have used here the methods of delimitation employed for the census and for other national statistical, compilations, such as the Metropolitan Area of San José (Costa Rica), Gran Santiago, Gran Buenos Aires, etc., delimited as shown in the Appendix.
From the point of view of this survey, the countries with the highest proportion of their population concentrated in the principal nucleus were, round about I960: Argentina (33.8 per cent), Chile (26.3 per cent), Panama (27.3 per cent), Costa Rica (22.2 per cent), Cuba (20--23 per cent) and, naturally, Uruguay. Except for Argentina (20 millions), Chile (7.3 millions) and Cuba, (approx. 7 millions), each of the other countries mentioned ha.ve population of between 1 and 1.5 million.
Following these countries, as regards the proportion of the population concen-trated in the principal nucleus, are: Peru (17 per cent), Venezuela (15 per cent), Mexico (14 per cent), Paraguay (18 per cent). In the remaining countries, the pro-portion of the population concentrated in the principal nucleus is less than 12 per cent. Brazil and Colombia are remarkable for the small proportion of the population represented ty the principal, nucleus.
The relative importance of the population of the principal nucleus has, general-ly speaking, increased continously. In Mexico, Venezuela and Chile this proportion has flmst doubles in the last 30 years. In the other countries the tendency to-wards concentreti:.n in the principal nucleus has been less pronounced, as, for example, in some countries that 20, 30 or more years ago already showed a high degree .of concentration (Costa. Rica, Panama and Argentina).
A more accurate assessment of this process of concentration ma.y be made by measuring the part of the total population increase accounted for by the principal nucleus. As a general rule, the part of the increase accounted for by the principal nucleus is relatively greater than the proportion of the population living in the principal nucleus would lead one to expect. In the last decade, the following

pcreervt*ges of the population increase accounted far by the principal nucleus have been renarkable for their magnitude: Argentina^ 55,5 per gent; Chile, 41.0 per cent; Panari.- , 3 ? ,2 per cent; Peru, 28.7 per cent; kexico, 19.9 per cent; and Venezuela, 19,3 per cent, (See Table 4).
In the rcn-'ining cc un tries listed in Table 4 the proporti m is smaller, but in ¿eneral it bears an analogous relationship to.,the., total increase figure, depending on the relative importance of the principal nucleus as shown by ratios in column 4 of aba,-ve mentioned table. Such ratios constitute a measure of the change in the degree of concentration of the population in the principal nucleus during a specified period of tine. If the r a t i o is equal to 1 there is no change in the. level of concentration if it is higher than 1 the positive excess is indicative of increase in concentration; if it is smaller than l'it shows a decrease. If these values increase (decrease)
1/ thraugh tine its sequence indicates the trend in the level of concentration.—' During the last decade these proportions were: Peru 2,1; Dominican Republic, 2,0; Honduras, 1,9; Argentina, 1,8; Chile 1.7; Mexico, 1,5; El Salvador, Brazil and Panama, 1.4, The pnpprtion was low in Paraguay (l.2) and in Costa Rica (1,0),
Comparing these tendencies in successive periods, it nay be stated that this type of concentration is especially pronounced after 1930, The -roportional rela-tionship noted above rppe?rs to have been especially high between 1930 and 1940 in certain countries, and between 1940 and 1950 in others; e.g., Mexico, 2.1; Venezuela 2.4; Chile, 2.1 The part of the population increase accounted for by the principal nucleus also appears to have been greatest, in certain countries, between 1940 and 1950: e.g. Mexico, 21,1 per cent; Venezuela, 25.0 per cent; Chile, 43.8 per cent; Brazil, 13,9 per cent; Cast-" Rica, 27.4 per cent. In Panama and Argentina the high-est pr-portion was reached in the decade 1950-1960, It nay be concluded from the foregoing that the velocity of the concentration of the population in the principal nuclei has reached, or is reaching, its maximum point in several countries, and that a livdnution of this velocity is to be expected.
1/ The ratio in effect represents the relation between the rote of growth of the population of the principal nucleus and that of the country»

- 14-
Table 4
EELi,.TIOHSHIF IT.Tl-EEN THE POPULATIONS OF THE PRINCIPAL NUCLEUS AND OF THE COUNTRY AS A WHOLE AND THEIR RE' PECTIVE INTER-CENSAl, INCREASE IN THIRTEEN LATIN M-I3RICAN COUNTRIES, IN THE LAST
FEW DECADES
. Inter- Principal nucleus Percentage of increase Ratio of:
y Country-censal period
Population (thousands)
Percentage of
country F
of country absorbed by principal nucleus
Col. 3 to Col, 2
Brazil 1940-1950 1950-1960
(1) d/ 7 1353/
(2) 8,2 9.5
(3) 13.9 13.4
(4) 1.7 1.4
Mexico 1930-1940 1940-1950 1950-1960
1 75& 3 050 4 871
8.2 10.6 13.0 •
17.0 21.1 19.9
2.1 2.0 1.5
Argentina 1914-1947 1947-1960 .
4 479 6 763
27,4 31.3
30.5 55.5
1.1 1.8
Colombia 1938-1951 648 4.8 11.2 2.3
Peru 1940-1961 1 716 13.5 28.7 2.1
Chile 1920-1930 1930-1940 1940-1952 1952-1960
713 952
1 350 . 1 927
15.2 17.9 21,0 24.7
36.0 32.4 43.8 41.0
2.4 1.8 2.1 1.7
Venezuela 1936-194L 1941-1950 1950-1961
325 6a
1 101
7.8 10.6 13.7
18,5 25.0 19.3
2.4 2.4 1.4
Dominican Republic 1950-1960 367 10.7 21.1 2,0 El Salvador 1930-1950
1950-1961 ' 162 248
7.6 9.4
17.3 13.3
2.3 1.4
Honduras 1950-1961 134 6.3 12.1 1.9

Table-'4 (cont.)
Principal nucleus Percentage Intel*- ' ' of increase Ratio of:
Country ^ censal period
Population (thousands)
a/
Percentage of
country b/
of country absorbed by principal nucleus
Col. 3 to Col. 2
(1) (2) (3) (4) Paraguay 1950-1962 305 I6.3 20.0 1.2
Panama I93O-I94O 133 19.8 32.3 1.6 I94O-I95O 193 22.8 33.0 1.4 1950-1960 294 25.9 37.3 1.4
Costa Rica I927-I95O 181 21.3 27.4 1.3 1950-1963 294 22.4 21.6 1.0
a/ In decreasing order by population (as of 1950) b/ Estimated percentage in the middle of the period in question, calculated
by taking the average of the populations of the country and of the principal nucleus at the beginning and end of the period.
c/ For definition, see Appendix 1. The population is assessed as at the end of the period.
d/ Population of the State of Guanabara and of the Municipality of Sao Paulo.

- 16 -
5. Distribution of urban population in nuclei of over 20 000 in relation to the size of such nuclei
Various points of interest nay 'be noted with regard to the distribution of the urban population of a country in relation to the size of the urban nuclei. The demographic and sociological characteristics of the population of the big cities differ from those of the inhabitants of the medium-sized cities (those of from 50 to 200 thousand inhabitants). Similarly, these cities display different characteristics from those of the smaller towns and villages. The economic and social climate, institutions and other aspects of social organization, determine these differences, although other factors contribute to them. In short, the urban population is not an homogeneous entity, although in difening this urban population we have considered only the inhabitants of those areas whose urban character is unquestioned (e.g., nuclei of over 20 thousand inhabitants).
Another aspect of this problem is the following: the local development of modem economic activities generally runs parallel to the multiplication and growth of urban nuclei. The small number of economically independent cities of medium size (50 to 200 000 inhabitants), would seem to indicate a lack of equilibrium between one region and another in a country where the urban population numbers several millions, espe-cially if this situation coincides with the existence of one principal nucleus which ty itself constitutes an appreciable proportion of the total national population.
In order to analyse the distribution of the urban population in relation to the size of the nuclei, it might suffice to consider the number of nuclei, dividing then into categories according to size, provided the number of nuclei were large enough and the number of different categories large enough also. If, however, the number of nuclei is small, then it is neccssary to complement these data with data regarding the respective population of each nucleus. Similarly, if one classifies the nuclei by size into only two or three categories, as in Table 5, it is necessary, to facili-tate comparison, to include data regarding the respective populations, even though the number of the nuclei taken into consideration is large.

- 17 -
Table 5 shows the purcentils distribution of the population that, in I960» lived in nuclei of over 20 thousand inhabitants, including the principal nucleus, the remaining nuclei of over 100 thousand inhabitants, and those of from 20 to 99 thousand inhabitants. Only countries with over 25 nuclei of 20 thousand inhabitants have been included^. The twelve countries excluded from this survey have only a small number of nuclei of this size, and in many cases there is no nucleus of over 100 thousand inhabitants except for the principal nucleus.' In these countries, with one or two exceptions, the principal contains approximately 60 per cent of the urban population, and in two cases it contains 100 per cent. It should be mentioned that this is the case in the least-populated countries, with from one to five million inhabitants.
It will be readily understood that a survey of the distribution of the population is of greater interest and significance in the case of the larger countries. In Brasil (70 millions) and Mexico (35 millions), about one third in accounted for by the nuclei of over 100 thousand inhabitants, excluding the principal nucleus (and, in the case of Brazil, excluding also Rio de Janeiro and Sao Paulo). The situation in Colombia (15 millions) appears to be similar, to judge by the 1951 census figures. In short, in the three countries mentioned tho distribution between the throe sizes of nucleus is fairly even.
In Argentina!, (20 millions), Chile (7 millions) and Peru (10 millions), tho situation is different from that of the other countries, owing to the predominance of the central nucleus. Although ti.or'e are no figures available for I960 in tho cases of Argentina and Chile, it may be assumed on the basis of the previous census, that this central nucleus contains around, or in excess of, 60 per cent of the total population of nuclei of over 20 thousand inhabitants. In Peru, as can be soen from the Table, the proportion is 2 per cent. 3oth in Chile and in Peru one notes a deficiency in the proportion contributed by the "over 100 thousand" category, which is only 13-14 per cent.
1/ The complete figures, as far as they are available, are given in the Appendix.

1 8 -
The situation in Venezuela (7 millions) is somewhat peculiar. The nuclei of from 20 to 99 thousand inhabitants constitute the most important part (43«1 per cent), and those of over 100 thousand the least important part (25.9 per cent, contributed by only 4 nuclei)^.
The analysis of the composition of population in relation to the siza of the nuclei may be improved by the use of a more detailed classification. This is possible provided that the number of nuclei is sufficiently large.. These conditions are found in Brazil (190 nuclei of over 20 thousand inhabitants, including J1 of over 100 thousand) and Mexico (91 nuclei of over 20 thousand inhabitants, including 16 of over 100 thousand). They are also found in Argentina and Colombia ( see Table 5)? but unfortunately there are no sufficiently detailed recent figures from these countries. In Chile, Venezuela, Peru and Cuba,' the small number of nuclei of over 100 thousand inhabitants presents serious disadvantages. In the remaining countries, as has been stated before, there are few nuclei of over 20 thousand inhabitants.
l/ The data given in Table 5 are subject to important limitations which should be born in mind.: The division of the nuclei into 2 categories (20 to 99 thousand, and over 100 thousand inhabitants), although it represents a quantitative criterion, necessarily possesses also a qualitative significance in so far as thw attempt has been made to group populations with common demographic ahd sociological character-istics, quite apart from the mare number of inhabitants. By reason of the points of delimitation between one category and another, which have been selected quite arbitrarily, it is hazardous to draw conclusions for the purposes of comparison between successive census figures (see Appendix 2), in view 0 f the distorting effect of several nuclei being transferred from one category to another during the inter-censal" period. These drawbacks are attenuated or eliminated in the case of a large number of nuclei, for in tfyis case the transfer of nuclei from one category to another has less importance statistically and tends to be self-compensating. Oh the other hand, it is reasonable to expect that in these conditions the nuclei will be better distributed between size-categories. The principal advantages, however, in working with data from a large number of nuclei is that it permits us to employ a more detailed classification.

- 1 9 - -
Graph N° 1 shows trie distribution of population living in nuclei of over 50 thousand inhabitants, approximately, in Brazil and Mexico in i960,
expressed as a function of the number of nuclei^. The values of both variables (population and number of nuclei) are accumulated percentages based on, an arrangement of the nuclei in descending order of size. The concave nature of the curve in relation to the axis X indicates the extent of concentration of the population. Expressing this concentration 'by means of an index figure, which varies on a scale from' O'to I,"one finds similar
2 / values for both countries; O.63 for Brazil and O.65 for. Mexico-'.
The same calculation for the~year 1950»-hased-on the-same nuclei, gives virtually the same results: O.65 for Brazil, and 0.66 for Mexico. Both the similarity of the situations in these two countries and the lack of variation in the figures over such a period of time, are worthy of note. In the other countries where a similar evaluation could be made," it is most probable that the "index of concentration" is even higher, except in the case of Colombia.
l/ The nuclei considered represented in 1950 those of over 20 thousand inhabitants in Mexico and of over 35 thousand in Brazil. The latter figure wa3 chosen to facilitate the identification of identical nuclei in 1950 and i960, in view of the restricted nature of the data available.
2/ This graphical representation is known as t-.e "curve of concentration" X represents the (total) accumulated population of a certain number of nuclei represented by Y. For 'this purpose the nuclei have been arranged in descending order of size. .If the population v?ere evenly distributed (i.e. if all nuclei were of the -same size), the graph would be drawn diagonally from the bottom left-hand corner to the top right-hand-corner. The further it is displaced from this-diagonal towards- the axis of X, the greater is the concentration. -Thus the area contained between -the diagonal and this curve measures the concentration, and is usually expressed as an index figure varying from. 0 (nil concentration) to 1.

- 20 -
Table 5
RELATIVE DISTRIBUTION OF THE POPULATION OF NUCLEI OF OVER 20 THOUSAND INHABITANTS IN RELATION TO THE SIZE OF THE NUCLEUS, IN THE EIGHT LATIN AMERICAN COUNTRIES . ITH THE LARGEST POPULATIONS, IN 1950 AND I960
Country- Year
Population of nuclei of over 20 OOP inhab. Inhab. Per-
cen-
Percentage distribution according to size of nucleus^/
(thousands) Principal nucleus
tage of countries
Other nuclei of over 100 thou-sand inhab.
Nuclei of from 20 to 99 thou-sand inhab.
Brazil 1950 I960
9 20
545 667
18.4 29.1
(2) (2)
47.9^ 34.5£/
(12)30.6 (29)33.5
(36) (159)
a.5 32.0
Mexico 1950 I960
6 11
819 743
26.4 33.6
(1) (1)
44.7 41.5
(10)24.4 (15)30.5
(52) (75)
30.9 28.0
Argentina (c) 1947 7 607 47.9 (1) 58.9 (8)24.1 (36) 17.0
Colombia 1951 2 589 22.4 25.0 (6)41.0 (22) 34.0
Peru 1961 2 948 28.4 (1) 58.2 > (3)14.2 (24) 27.6
Chile (c) 1952 2 544 42.9 (1) 53.1 (3)13.4 (a) 33.5 Cuba 1953 2 115 36.3 (1) 57.6 (1) 7.7 (18) 34.7 Venezuela 1950
1961 1 3 593 549
31.6 47.2
(1) (1)
39.0 31.0
(2)21.4 (4)25.9
(19) (35)
39.6 43.1
a/ Latest available data. Of the minor countries excluded from the survey, Ecuador possesses 13 nuclei of over 20 thousand Inhabitants in 1962, the Dominican Republic ha.d 9 in I960, and the remaining countries had a smaller number,
b/ Figures in parentheses indicate the number of nuclei in the respective category.
c/ In the case of Brazil, two independent centres are considered as 'principal nucleus', Rio de Janeiro (State of Guancbir .) and Sao Paulo (Municipality area).
d/ In these countries census were held in I960, but figures subdivided by nuclei are not yet available.

-21.-
Graph 1
CON COTATION OF THE POPULATION LIVING IN NUCLEI OF OVER 50 THOUSAND INHABITANTS (IN I960) IN RE-LATION TO THE SIZE OF THESE NUCLEI. BRASIL AND
MEXICO
Population (Per cent)

- 22 -
6, Causes and, consequences of urbanization
It would be exceeding the intended scope o f this study to describe and discuss the sociological causes and consequences supposedly related to the process urbanization; these have been the subject of numerous surveys-^. Nor will we attemp to describe the demographic effects of the process, bej ond an assessment of the tendencies of growth and of composition by sex and age. A more profound analysis would involve theoretical problems and problems in connection with the compilation of adequate data, which for the moment must be shelved for lack of time. We will simply point out certain significant facts in connection with the demographic mechanism of the urbanization process, and ccrtain differential characteristics that manifest themselves in the case of the big cities.
The high rate of urbanization that, generally speaking, has been maintained during the last few decades in the countries of Latin America,, and in particular the rapid growth of the biggest cities, must be attributed principally to movements of internal migration. Although it is true that differences from area to area in the natural rate of increase play their part, the exact measurement of these and even the evaluation of their significance are rendered extremely difficult by the absence or unreliability of available data regarding the rural areas and areas of greater or lesser degree of urbanization. One should expect to find an inverse ratio between the Virth rate and the degree of urbanization, and this appears to be confirmed in some countries of the region by the larger number of children born to women living in the rural areas (according to census-figures)^, .
1/ Among the roost interesting international studies, the following may be mentioned: 1. Nation Unies, Rapport sur la situation sociale dans le aonde.
3T/30A/3, New York, 1957» 2. UNESCO, Urbanization in Asia and the Far East; Proceedings of the Joint
Wi/Unesco Seminar, Bangkok 8-18 August 1956. Calcuta, 1957« 3. UNESCO, Urbanization in Latin America Documents of the Seminar on " urbanization problems in Latin America sponsored jointly by ONU, 3CLA, and UNESCO; Santiago, Chile, from 6 to 18 July, 1959. Unesco, 1962
2/ Carmen Miro, The Population of Latin America. United Nations. Demographic Centre (CELADE), I963.

- 338 -
and also an inverse ratio between the death rate and the degree of urbanization. If one considers that the death rate has been reduced to a relatively low lovel and that in -consequence the regional differences within each country have tended to grow smaller, one may conclude that this latter factor has had little effect on the regional differences in natural population increase during the last fev years, at least in certain countries. Consequent-ly, if the natural rate of increase diminishes with increased urbanization, by reason of the drop in the birth-rate, then the effect of the migratory movements is even greater than what . onld be suggested by a simple comparison between increase ratios in the rural areas and in urban nuclei of various sizes.
The cities of over one million inhabitants -with the exception of Gran Buenos Aires (3 per cent)- grew at a rate of over 4 PGr cent during the last decade. This indicates an increment due to migration of between 1,5 per cent and 2.5 per cent annually, varying from one city to another. The capitals of countries with a population of less than one million -most of which in fact have between 20U and 500 thousand inhabitants- showed a similar rate of increase. In general, the cities of over 100 thousand inhabitants, and also those of from 20 to 99 thousand inhabitants (excluding in both cases the principal nucleus), showed an average rate of increase as large as those of the big cities, with the important exceptions of Argentina and Chile. These two countries have three distinguishing characteristics, namely a rate of increase below that of the Latin American average, the highest degree of urbanization, and the greatest concentration of the population in the principal nucleus. This is probably true of Uruguay as well.
The tendencies noted above are not peculiar to recent times. As far as can be established, tl ey manifested themselves with at least as great intensity during the decade 1940-1950. In general terms, one may say that this tendency i characteristic of urban nuclei of over 20 thousand inhabitants, with ;ut attributing to this figure any more significance than that of a mere order of magnitude.

- 24 -
The sources contributing to this remarkable increase by means of migratory movements probably vary from country to country depending on the existing demographic conditions (e.g., .the volume of the national population, the degree of urbanization and the size of the principal nucleus). The results of the 1962 enquiry into immigration in the Gran Santiago district^ iodicated that 2/3 of the immigrants who had arrived during the previous decade came from nuclei of over 5 thousand inhabitants (1952 size), and the same picture emerges if one considers the last two decades^/. The immigrants coming frvm nuclei of over 20 thousand.inhabit-ants constituted 42 per cent in the decade 1952-1962 and 37 per cent in the decade 1942-1951« This comparatively large proportion of immigrants coming from urban nuclei is hardly surprising if one reflects that in Chile, in 1952, 60 per cent of the population already lived in urban areas (as defined for census purposes). We may expect to find a similar situation as regards immigration into the most important cities of Argentina, Brazil, Mexico and Colombia.
In the small and medium-sized towns the immigrants w i l l obviously
include a higher proportion of people coining from rural areas. The moderate
rate of growth of the population of the smaller nuclei i an indication that
these nuclei serve as temporary stopping places for migrants on their way to the big c i t i e s , although this process often takes two generations. In
Colombia, for example, the nuclei of from 1 500 to 4 999 inhabitants grew at
an annual rate of 1.8 per cent in the period 1938-1951 (the natural rate of increase should have been 2.5 per cent). This growth is not, however, a
universal phenomenon, for in Venezuela the nuclei of from 1 000 to 4 999 inhabitants grew at a rata of 4.3 per cent during the period 1941-1950
(the rate of increase uf the nuclei of 20 thousand inhabitants was much
1/ Enquiry carried out by the Latin American Demographic Centre in the City of Santiago, Chile, in 1$62, '
2/ Virtually the same proportions were observed in the case of immigrants who arrived after the age of 15•

- 25 -
higher; 6.8 per cent)—'
The principal conclusion, on the basis of the data available, is that the migratory movements that Swell the population of the big cities, though the immigrants .come from all over the country, are chiefly composed not of country-dwellers but of citizens of other cities and smaller urban centres, including in the latter case a fair proportion of persons born in the country but with the experience of living in urban surroundings. This generalization applies, to an even greater extent, to countries where the degree of urban-ization has led to the formation of a fair number of cities and of smaller urban nuclei. In countries where the rural element predominates in the population, and the urban element consists almost exclusively of the inhabitants of the principal nucleus or of a few relatively important urban centres, the immigrants arriving in tnese centres, if they are numerous, necessarily include a much higher proportion of country-dwellers,.
Consequently, the problem of the development of the large nuclei of population cannot be considered in terms of immigration from rural areas-playing an important part. The low socio-economic level of an appreciable section of the immigrant population points rather to similar conditions obtaining in other nuclei that are less developed in every sense.
The factors that cause these migratory movements are varied, and little is known about them, although there are grounds for affirming that, in very general terms, they are chiefly of an economic nature. In present
l/ Figures for rates of immigration in five Latin American cities, corresponding to the decade 1940-1950» indicate rates of 3 Per cent annually, or in excess of this figure, with one exception. The follow-ing annual rates (in percentages) refer to the male population that was over ten years old at the end of the survey period; Sao Paulo (Brazil) 3.5» Bogota (Colombia), 3«45 Caracas (Venezuela), 3.0; Maracaibo (Venezuela), 5<>31 Rio de Janeiro (Brazil), 1 , 4 . The low rate of growth of Rio de Janeiro could probably be'explained due to the inclusion of the suburban areas which extends beyond the limits of the State of C-uanabara as shown in Appendix 1. The figures for female immigration are about the same, sometimes a little higher or lower. These results provide ample confirmation of the important role of the migratory movements in the remarkable growth of the population of the big cities.

- 26 -
circumstances, when there is sharp contrast between the conditions of economic and social development in one or in a few cities, as the case may be, and the conditions in the rest of the national territory of a Latin American country, a determining factor (in migration) must be the poor economic opportunities offered by the areas outside these priviledged zones. For the rural worker the best opportunities -depending on his capacity and experience- are to be found in the villages and small towns of his region. Workers in manufacturing industries and, in general, manual workers engaged in non-agricultural occupations will usually find or hope to find more stable employment in the big cities. Finally, technicians, office-workers and other "white-collar" groups also see in the big cities better opportunities of finding employment and/or higher remunerations.
It could be estimated that the population living, in i960, in cities of over half a million inhabitants, is increasing by over a million per year, and not less than half of this figure is made up of immigrants^. If one adds to this the cities of from 250 to 5^0 thousand inhabitants,
2/ this increase wovdd oe as high as 1,'3 million per years/ , of which 6OO-7OO thousand would be accounted for by immigrants. This population increase has- meant in the last.few years, and will continue to do so in the near future, a demand for thousand of new houses, public works of an urban nature (streets, water-mains, electrical installations, etc.), schools, urban transport services, addittional sanitary and medical services, and an increase in every kind of public utility. One may ask how far these requirements have been adequately furfilled, or whether, on the contrary, the rapid increase has been responsible for the growth of shanty-towns entirely lacking in urban services and, generally speaking, containing large social groups living in depressed economic and social conditions.
l/ 20 cities with a total of approximately 30 millions inhabitants. 2/ 21 cities with a total of approximately 7 millions inhabitants.

- 2 7 -
Of the various problems arising out of the growth of the big cities, the most urgent, or at least the most immediately striking, is the lack of dwellings and of adequate urban services. To satisfy these needs, large-scale investments are necessary, which most of these new city-dwellers are not in a position to make either directly or through taxation.
A detailed study of the characteristics and conditions of urban life is impossible in view of the lack of adequate information regarding almost all countries of the region, Frequently the data from the census of popul-ation and dwellings refer to the entire country and to its principal administrative divisions, and if they refer to the urban nuclei, for example, the information supplied is in fact very limited. The following data give some idea of the type of information available about accomodation in the cities in several countries in the area.
In the area formed by the Federal District of Mexico, which includes Mexico dity, other urban nuclei and a rural zone (which contains only 5 per cent of the total population of the Federal District), 29 per cent of the houses listed in the i960 census were built of inferior materials (adobe, wood, etc.). 55 per cent had no piped water in the dwelling itself, 21 per cent had piped water in the building though not in the dwelling, and the remaining 24 per cent had no access to piped water at all. Finally, dwellings with drainage or sewerage constituted 73 psr cent of the total.
In the city of Caracas (Venezuela)^, the housing situation was as follows in 1950s
20 per cent of the dwellings were classified as "shacks" (built of flimsy material, generally straw and mud)5 of this total 3/4 were in the zones generally considered urban, i.e. Caracas proper. Only 2/3 of the
1/ For the purposes of the last census (1961), the city or urban nucleus was extended to include Libertador department, except Maracao parish.

- 2 8 -
dwellings.possessed.-a .V»C», while the rest had earth latrines or no sanitary facilities „at.all> .:.••.•.-•••.'• : • •
•In-Panama District (90'per cent urban, including Panama City) in 1950» : l/j of ;the houses' were' built of brick, concrete or similar material, while almost 2/3 were"of wood. 87 per cent possessed a W.C., and the rest earth latrines or nothing.
The lack of üp^to-date statistics, evident in nearly all countries of the area, may'be remedied when recent census-figures are made available, as will probably happen in the course of the next year in several countries..
Another interesting aspect of this.question is the demographic and social differences between the pppulations of the big cities, the smaller urban nuclei and the rural zone. . The people who emigrate to the big cities (and this is true of emigrants in general) have a different composition by sex and age from that of the population as a whole. Generally, more women than men arrive as immigrants in the big cities. This fact, combined with the greater longevity of women, results in some big cities having a masculinity ratio of JO, or even lower (as in the cases of Santiago and Mexico City). In other cases, foreign immigrants (in which group men predominate) hs.ve a compensating'effect., a.s occurred in Caracas (Venezuela), where the numbers of men and women were approximately equal in 1950»
Proportionate^ a higher number of immigrants are in the 15-35 age-group than in the lower or higher age-groups. In Colombia, in the period 1938-1951, the (net) rate of immigration into nuclei of over 20 thousand inhabitants, between the mean ages of 5 and 25» was 4°5 per cent and 4.9 per cent in the. .case of men .and women respectively, while in the 25-45 age-group it was 2.3 per. cent and 2.5 per; cent,- and the rate diminishes even more noticeably in the case of the more advanced age-groups. -Even more pronounced differences are found in 'the- (net) rates of immigration into nuclei of the same size in Venezuela, in the period 1941-1950. Although the effect of a

~ 29 -
constafi't s "t X* OcXIIi o f imuigrants on the age-structure is d i f f i c u l t to assess,
because, among other reasons, t:..e caildren of the immigrants mist be taken
into account, 'nevertheless the result is generally a bulge in the younger
adult age-groups? but i f this stream were interrumpted or seriously diminished,
the consequence, would .be., a .relat ive ageing-of the urban population.
The census-figures permit one to guess at some sociological di f ferences,
of ?/hich we w i l l mention only a few, though they are s igni f icant . The
educational leve l of the big c i t i es is markedly higher than that of the other
areas„ This fact f l ec t ion of the greater educational f a c i l i t i e s , and
tho sociological conditions of the respective populations. A better comparison
could be made by examining the situation in various c i t i es and minor urban
centres, since we know tha.t the rural population has a lower educational l eve l
than the urban population.
A characteristic feature of the big c i t i es is the widespread participation
of women in wage-earning occupations. I t is more common in the urban areas
than in the rural, but i t is most developed in the big c i t i e s . Another
feature is the high proportion of wage earners and the re lat ive importance
of the labour force in certain modern economic ac t i v i t i es which acquire
importance in tho great urban centres, and require ski l led and qual i f ied
employees and/or workmen of a re la t i ve ly high educational standard.
Table 6 shows, merely fur the purposes of i l lustrat ion ( in view of the
limited nature of this survey )•,
a comparison o f certain demographic and
sociological characteristics of the populations of the principal nucleus and
of the country as a whole, in r.iexico and Venezuela.

- 30 -
Table 6
A COMPARISON OF CSRTüIN D3;OGR..rHIC -JiD SOCIjJL CK,J.,~CTERISTICS OF THE POPULATIONS OF THE PRINCIPAL NUCLEUS ÜND OF THE COUNTRY AS A WHOLE IN
ilEZICO (I960) AND VENEZUELA (1950)
Mexi co V ene zuela Characteristic (i960) (1950)
1. Masculinity ratio: Principal nucleus 92 100 Country 99 103
2. Percentage of persons under 15 years of age: Principal nucleus 41 34 Country 44 42
3. Masculinity ratio of population aged 10 to 49 years: Principal nucleus 59 65 Country 5? 60
4. Percentage of illiterates in population ah ed over 15 years: Principal nucleus 14 16 Remaining population of country 38 54
5. Occupation of females in paid employment: Principal nucleus 48^ Remaining population of country
6. Percentage of wage-earners (both sexes) engaged in non-agricultur; 1 activities: c/ d/ Principal nucleus 82^/ 82^/ Remaining population of country 74- '
7. Percentage of professional, technical and office workers, and other white-collar groups (both sexes) engaged in non-agricultural activities: Principal nucleus Remaining population of country l9ä/ ' 9 /

- 3 1 -
Table 6 (notes)
a/ Over 12 ye; rs of ar e.
b/ Over 10 years of age.
c/ In the case of Venezuela, the figures for wage-earners include those persons e cono:-lie ally active in unspecified occupations, the great Majority of whom are seeking employment for the first time.
d/ The proportion of wage-errners engaged in agricultural occupations varies considerably from one country to the other. In Venezuela it was 2k per cent, while in Mexico it was 53 per cent. -.
- 32 -
APPENDIX 1
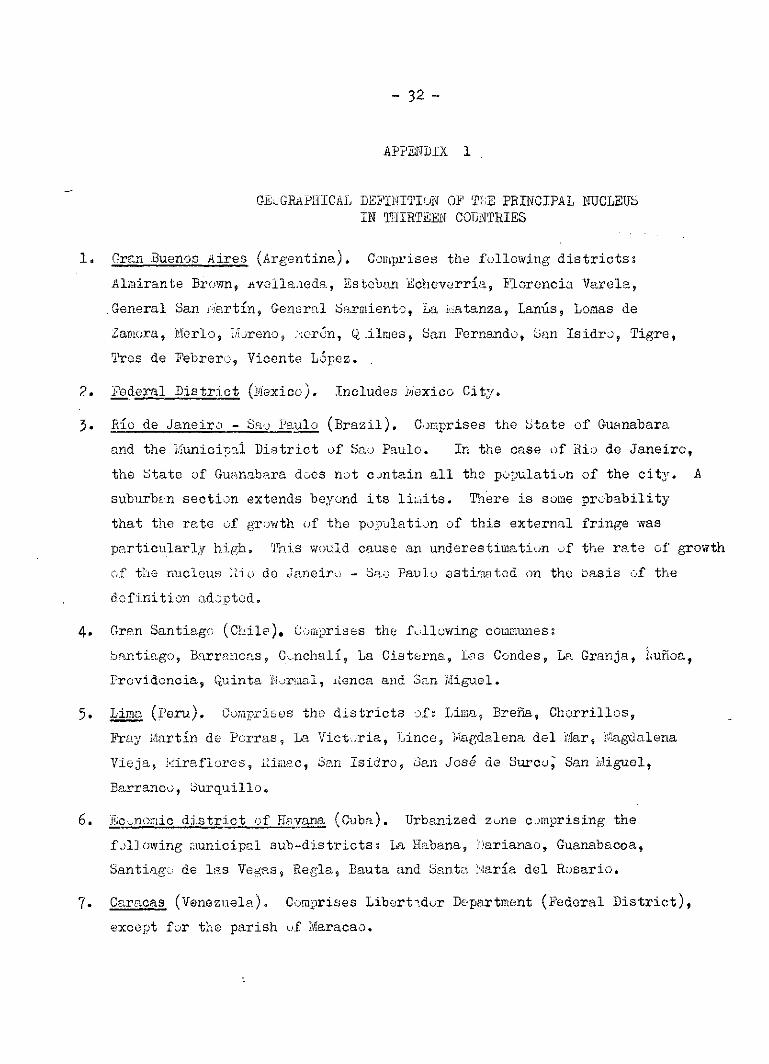
GEOGRAPHICAL DEFINITION OF TRE PRINCIPAL NUCLEUS IN THIRTEEN COUNTRIES
1. Gran Buenos Aires (Argentina), Comprises the following districts?
Almirante Brown, .avellaneda, Esteban Echeverría, Florencia Várela,
General San Martín, General Sarmiente, La ida tanza, Lanús, Lomas de
Zamora, Merlo, Moreno, Morón, Q.ilmes, San Fernando, San Isidro, Tigre,
Tres de Febrero, Vicente López. .
2. Pederal Distr ict (Mexico). Includes Mexico City»
3. Río de Janeiro - Sao Paulo (Braz i l ) . Comprises the State of Guanabara,
and the Municipal District of Sao Paulo. In the case of Rio de Janeiro,
the State of Guanabara does not contain a l l the population of the c i t y . A
suburban section extends beyond i ts l imits. There is some probability
that the rate of growth of the population of this external fringe was
particularly high. This would cause an underestimation of the rate of growth
of the nucleus Ilio de Janeiro - Sao Paulo estimated on the basis of the
def init ion adopted.
4. Gran Santiago (Chi le ) . Comprises the following communes;
Santiago, Barrancas, Conchali, La Cisterna, Las Condes, La Granja., Nuñoa, Providencia, Quinta Normal, Aenca and San Miguel.
5. Lima (Peru), Comprises the distr icts ofs Lima, Breña, Chorrillos,
Kray Martín de Porras, La Victoria, Lince, Magdalena del Mar, Magdalena Vieja, Miraflores, iiimac, San Isidro, San José de Surco^ San Miguel,
Barranco, Surquillo.
6. Economic d is t r i c t of Havana (Cuba). Urbanized z^ne comprising the
following municipal sub-districts s La Habana, í)arianao, Guanabacoa,
Santiago de las Vegas, Regla, Bauta and Santa Maria del Rosario.
7« Caracas (Venezuela). Comprises Libertador Department (Federal D is t r i c t ) ,
except for the parish uf Maracao.

- 33 -
8* Bogotá (Colombia)„ municipal district of Bogota
9» City of Santo Domingo (Dominican Republic)..
10. Asunción (Paraguay). City of Asunción and Petaré.
City of San Salvador (El Salvador).
.12. Panama (Panama). District of Panama.
13» Metropolitan Area of San José (Costa Rica). Comprises the following cantonal districts s Central, Escazú, Desamparados, Goicochea, Alajus-lita, Tibás, Moravia, Mantes de Oca and Curridabat. Certain sub-districts of these are excluded.

- 3 4 -
APPEMDIX 2
RELATIVE DISTRIBUTION OF THE POPULATION OF NUCLEI OF OVER 20 THOUSAND INHABITANTS IN RELATION TO THE SIZE OF THE NUCLEUS, IN THE SIXTEEN LATIN
NERICA COUNTRIES, IN 1950 AND I960 l/
Country
Population of nuclei of over 20 OOP inhab.
Year Inhabi- Percentage tant of (thousands) country
Percentage distribution according" to size of nucleus
Principal nucleus
Other nuclei of over 100 000 inhabitants
Nuclei of fron 20 to 99 thousand inhabitants
Brazil, Mexico Argentina, Co-lombia, Peru, Chile, Cuba and Venezuela (See Table 5)
Ecuador 1950 589 18.4 44.0 (1) 35.6 (4) 20.4 1962 1 259 27.5 40.6 (1) 28.7 (11) 30.7
Bolivia 1950 593 21.9 54.1 - 45.9 Dominican Rep. 195P 258 12.1 70.4 — (2) 29.6
I960 603 20.0 60.8 — (8) 39.2
El Salvador 1950 240 12.9 67.5 — (2) 32.5 1961 434 17.3 57.2 — (5) 42.8
Honduras 1961 217 11.5 61.7 - (2) 38.3 Paraguay 1950 207 15.6 100.0 — —
1962 305 16.8 100.0 — —
P. .nana 1950 245 30.4 78.8 _ (1) 21.2 I960 377 35.0 78.1 — (2) a.9
Costa Rica 1950 181 22.6 100.0 —
1963 294 22.2 100.0 - -
a/ Latest available data. 1
b/ Figures in parentheses indicate the number of nuclei in the respective category.